Cities with the Largest Finnish Community in New Jersey
RELATED REPORTS & OPTIONS
Finnish
New Jersey
Compare Cities
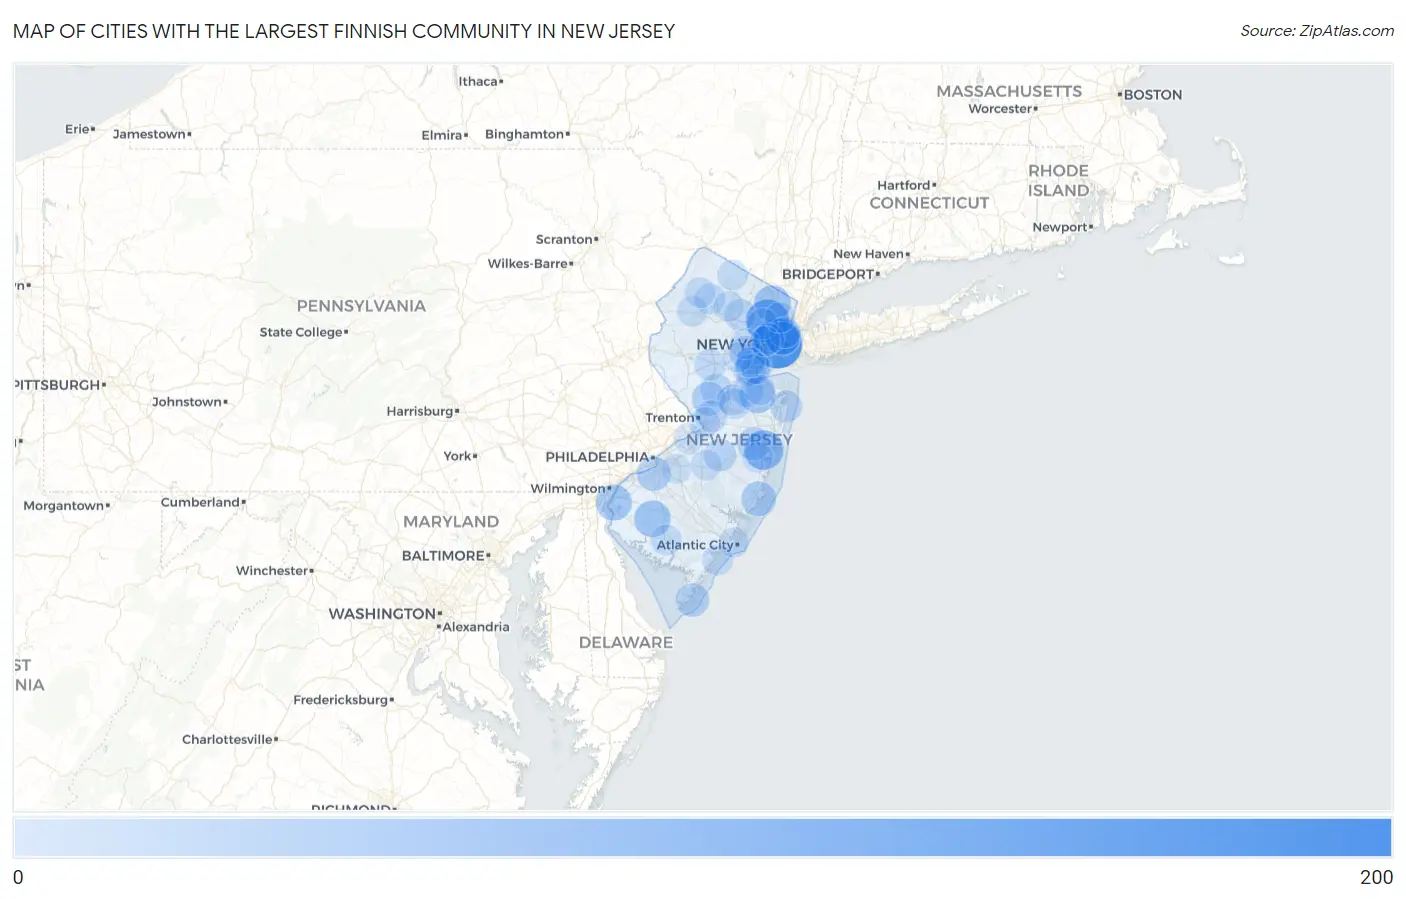
Map of Cities with the Largest Finnish Community in New Jersey
0
200
Cities with the Largest Finnish Community in New Jersey
| City | Finnish | vs State | vs National | |
| 1. | Jersey City | 187 | 4,988(3.75%)#1 | 628,742(0.03%)#510 |
| 2. | Sicklerville | 130 | 4,988(2.61%)#2 | 628,742(0.02%)#750 |
| 3. | Clifton | 129 | 4,988(2.59%)#3 | 628,742(0.02%)#757 |
| 4. | Haddon Heights Borough | 94 | 4,988(1.88%)#4 | 628,742(0.01%)#1,069 |
| 5. | Toms River | 92 | 4,988(1.84%)#5 | 628,742(0.01%)#1,088 |
| 6. | Ridgewood | 67 | 4,988(1.34%)#6 | 628,742(0.01%)#1,459 |
| 7. | Eatontown Borough | 65 | 4,988(1.30%)#7 | 628,742(0.01%)#1,501 |
| 8. | Olivet | 65 | 4,988(1.30%)#8 | 628,742(0.01%)#1,506 |
| 9. | Union City | 64 | 4,988(1.28%)#9 | 628,742(0.01%)#1,508 |
| 10. | Pennsville | 62 | 4,988(1.24%)#10 | 628,742(0.01%)#1,557 |
| 11. | Morganville | 62 | 4,988(1.24%)#11 | 628,742(0.01%)#1,563 |
| 12. | Hasbrouck Heights Borough | 60 | 4,988(1.20%)#12 | 628,742(0.01%)#1,599 |
| 13. | Somerville Borough | 56 | 4,988(1.12%)#13 | 628,742(0.01%)#1,708 |
| 14. | Carlstadt Borough | 55 | 4,988(1.10%)#14 | 628,742(0.01%)#1,737 |
| 15. | New Milford Borough | 51 | 4,988(1.02%)#15 | 628,742(0.01%)#1,840 |
| 16. | Pine Beach Borough | 49 | 4,988(0.98%)#16 | 628,742(0.01%)#1,897 |
| 17. | Beach Haven West | 48 | 4,988(0.96%)#17 | 628,742(0.01%)#1,927 |
| 18. | Woodbridge | 47 | 4,988(0.94%)#18 | 628,742(0.01%)#1,942 |
| 19. | Woodbury | 45 | 4,988(0.90%)#19 | 628,742(0.01%)#2,006 |
| 20. | Princeton | 41 | 4,988(0.82%)#20 | 628,742(0.01%)#2,133 |
| 21. | Hoboken | 39 | 4,988(0.78%)#21 | 628,742(0.01%)#2,206 |
| 22. | Wildwood | 38 | 4,988(0.76%)#22 | 628,742(0.01%)#2,282 |
| 23. | Cresskill Borough | 37 | 4,988(0.74%)#23 | 628,742(0.01%)#2,328 |
| 24. | Rahway | 35 | 4,988(0.70%)#24 | 628,742(0.01%)#2,400 |
| 25. | Cedar Glen West | 35 | 4,988(0.70%)#25 | 628,742(0.01%)#2,435 |
| 26. | Westfield | 34 | 4,988(0.68%)#26 | 628,742(0.01%)#2,454 |
| 27. | Collingswood Borough | 32 | 4,988(0.64%)#27 | 628,742(0.01%)#2,555 |
| 28. | Park Ridge Borough | 32 | 4,988(0.64%)#28 | 628,742(0.01%)#2,564 |
| 29. | Cliffside Park Borough | 30 | 4,988(0.60%)#29 | 628,742(0.00%)#2,646 |
| 30. | Metuchen Borough | 29 | 4,988(0.58%)#30 | 628,742(0.00%)#2,709 |
| 31. | Browns Mills | 29 | 4,988(0.58%)#31 | 628,742(0.00%)#2,716 |
| 32. | Long Branch | 26 | 4,988(0.52%)#32 | 628,742(0.00%)#2,871 |
| 33. | Preakness | 26 | 4,988(0.52%)#33 | 628,742(0.00%)#2,889 |
| 34. | Fords | 26 | 4,988(0.52%)#34 | 628,742(0.00%)#2,896 |
| 35. | East Rocky Hill | 25 | 4,988(0.50%)#35 | 628,742(0.00%)#3,001 |
| 36. | Hopatcong Borough | 24 | 4,988(0.48%)#36 | 628,742(0.00%)#3,024 |
| 37. | Emerson Borough | 24 | 4,988(0.48%)#37 | 628,742(0.00%)#3,033 |
| 38. | Old Bridge | 23 | 4,988(0.46%)#38 | 628,742(0.00%)#3,073 |
| 39. | Oakland Borough | 23 | 4,988(0.46%)#39 | 628,742(0.00%)#3,093 |
| 40. | Manville Borough | 23 | 4,988(0.46%)#40 | 628,742(0.00%)#3,096 |
| 41. | Hamilton Square | 22 | 4,988(0.44%)#41 | 628,742(0.00%)#3,164 |
| 42. | Boonton | 22 | 4,988(0.44%)#42 | 628,742(0.00%)#3,174 |
| 43. | Glen Ridge Borough | 21 | 4,988(0.42%)#43 | 628,742(0.00%)#3,261 |
| 44. | Hawthorne Borough | 20 | 4,988(0.40%)#44 | 628,742(0.00%)#3,309 |
| 45. | Point Pleasant Borough | 20 | 4,988(0.40%)#45 | 628,742(0.00%)#3,312 |
| 46. | Bay Head Borough | 20 | 4,988(0.40%)#46 | 628,742(0.00%)#3,367 |
| 47. | Bradley Gardens | 19 | 4,988(0.38%)#47 | 628,742(0.00%)#3,403 |
| 48. | Ringwood Borough | 19 | 4,988(0.38%)#48 | 628,742(0.00%)#3,408 |
| 49. | Middlesex Borough | 18 | 4,988(0.36%)#49 | 628,742(0.00%)#3,492 |
| 50. | Pompton Lakes Borough | 18 | 4,988(0.36%)#50 | 628,742(0.00%)#3,499 |
| 51. | West New York | 17 | 4,988(0.34%)#51 | 628,742(0.00%)#3,561 |
| 52. | Sayreville Borough | 17 | 4,988(0.34%)#52 | 628,742(0.00%)#3,563 |
| 53. | Millville | 17 | 4,988(0.34%)#53 | 628,742(0.00%)#3,573 |
| 54. | Parsippany | 17 | 4,988(0.34%)#54 | 628,742(0.00%)#3,578 |
| 55. | Westmont | 17 | 4,988(0.34%)#55 | 628,742(0.00%)#3,595 |
| 56. | Maywood Borough | 17 | 4,988(0.34%)#56 | 628,742(0.00%)#3,602 |
| 57. | Lake Mohawk | 17 | 4,988(0.34%)#57 | 628,742(0.00%)#3,606 |
| 58. | Upper Montclair | 16 | 4,988(0.32%)#58 | 628,742(0.00%)#3,705 |
| 59. | Ramsey Borough | 15 | 4,988(0.30%)#59 | 628,742(0.00%)#3,838 |
| 60. | Ocean City | 15 | 4,988(0.30%)#60 | 628,742(0.00%)#3,846 |
| 61. | Westwood Borough | 15 | 4,988(0.30%)#61 | 628,742(0.00%)#3,847 |
| 62. | Rossmoor | 15 | 4,988(0.30%)#62 | 628,742(0.00%)#3,895 |
| 63. | Concordia | 15 | 4,988(0.30%)#63 | 628,742(0.00%)#3,898 |
| 64. | Allamuchy | 15 | 4,988(0.30%)#64 | 628,742(0.00%)#3,944 |
| 65. | Florham Park Borough | 14 | 4,988(0.28%)#65 | 628,742(0.00%)#3,982 |
| 66. | White Horse | 14 | 4,988(0.28%)#66 | 628,742(0.00%)#3,992 |
| 67. | Newton | 14 | 4,988(0.28%)#67 | 628,742(0.00%)#3,999 |
| 68. | Leisuretowne | 14 | 4,988(0.28%)#68 | 628,742(0.00%)#4,036 |
| 69. | Sewaren | 14 | 4,988(0.28%)#69 | 628,742(0.00%)#4,047 |
| 70. | Seaside Park Borough | 14 | 4,988(0.28%)#70 | 628,742(0.00%)#4,059 |
| 71. | Lake Como Borough | 14 | 4,988(0.28%)#71 | 628,742(0.00%)#4,060 |
| 72. | Chester Borough | 14 | 4,988(0.28%)#72 | 628,742(0.00%)#4,064 |
| 73. | Harrison | 13 | 4,988(0.26%)#73 | 628,742(0.00%)#4,106 |
| 74. | Highland Lakes | 13 | 4,988(0.26%)#74 | 628,742(0.00%)#4,151 |
| 75. | Hackensack | 12 | 4,988(0.24%)#75 | 628,742(0.00%)#4,210 |
| 76. | Summit | 12 | 4,988(0.24%)#76 | 628,742(0.00%)#4,223 |
| 77. | Little Ferry Borough | 12 | 4,988(0.24%)#77 | 628,742(0.00%)#4,247 |
| 78. | Matawan Borough | 12 | 4,988(0.24%)#78 | 628,742(0.00%)#4,252 |
| 79. | Haworth Borough | 12 | 4,988(0.24%)#79 | 628,742(0.00%)#4,293 |
| 80. | Sea Bright Borough | 12 | 4,988(0.24%)#80 | 628,742(0.00%)#4,316 |
| 81. | Lake Telemark | 12 | 4,988(0.24%)#81 | 628,742(0.00%)#4,324 |
| 82. | Beachwood Borough | 11 | 4,988(0.22%)#82 | 628,742(0.00%)#4,400 |
| 83. | Manasquan Borough | 11 | 4,988(0.22%)#83 | 628,742(0.00%)#4,437 |
| 84. | Mountain Lakes Borough | 11 | 4,988(0.22%)#84 | 628,742(0.00%)#4,446 |
| 85. | Holiday City South | 11 | 4,988(0.22%)#85 | 628,742(0.00%)#4,448 |
| 86. | Seaville | 11 | 4,988(0.22%)#86 | 628,742(0.00%)#4,485 |
| 87. | Atlantic City | 10 | 4,988(0.20%)#87 | 628,742(0.00%)#4,558 |
| 88. | Bergenfield Borough | 10 | 4,988(0.20%)#88 | 628,742(0.00%)#4,563 |
| 89. | Strathmore | 10 | 4,988(0.20%)#89 | 628,742(0.00%)#4,631 |
| 90. | Old Tappan Borough | 10 | 4,988(0.20%)#90 | 628,742(0.00%)#4,637 |
| 91. | Landing | 10 | 4,988(0.20%)#91 | 628,742(0.00%)#4,647 |
| 92. | Newark | 9 | 4,988(0.18%)#92 | 628,742(0.00%)#4,748 |
| 93. | Plainfield | 9 | 4,988(0.18%)#93 | 628,742(0.00%)#4,751 |
| 94. | Burlington | 9 | 4,988(0.18%)#94 | 628,742(0.00%)#4,801 |
| 95. | Butler Borough | 9 | 4,988(0.18%)#95 | 628,742(0.00%)#4,808 |
| 96. | Ledgewood | 9 | 4,988(0.18%)#96 | 628,742(0.00%)#4,830 |
| 97. | Mendham Borough | 9 | 4,988(0.18%)#97 | 628,742(0.00%)#4,832 |
| 98. | Ogdensburg Borough | 9 | 4,988(0.18%)#98 | 628,742(0.00%)#4,866 |
| 99. | Colonia | 8 | 4,988(0.16%)#99 | 628,742(0.00%)#4,962 |
| 100. | Springdale | 8 | 4,988(0.16%)#100 | 628,742(0.00%)#4,972 |
Common Questions
What are the Top 10 Cities with the Largest Finnish Community in New Jersey?
Top 10 Cities with the Largest Finnish Community in New Jersey are:
#1
187
#2
129
#3
92
#4
67
#5
65
#6
64
#7
62
#8
62
#9
48
#10
47
What city has the Largest Finnish Community in New Jersey?
Jersey City has the Largest Finnish Community in New Jersey with 187.
What is the Total Finnish Population in the State of New Jersey?
Total Finnish Population in New Jersey is 4,988.
What is the Total Finnish Population in the United States?
Total Finnish Population in the United States is 628,742.