Cities with the Highest Percentage of Population with a Degree in Social Sciences in New Jersey
RELATED REPORTS & OPTIONS
Social Sciences
New Jersey
Compare Cities
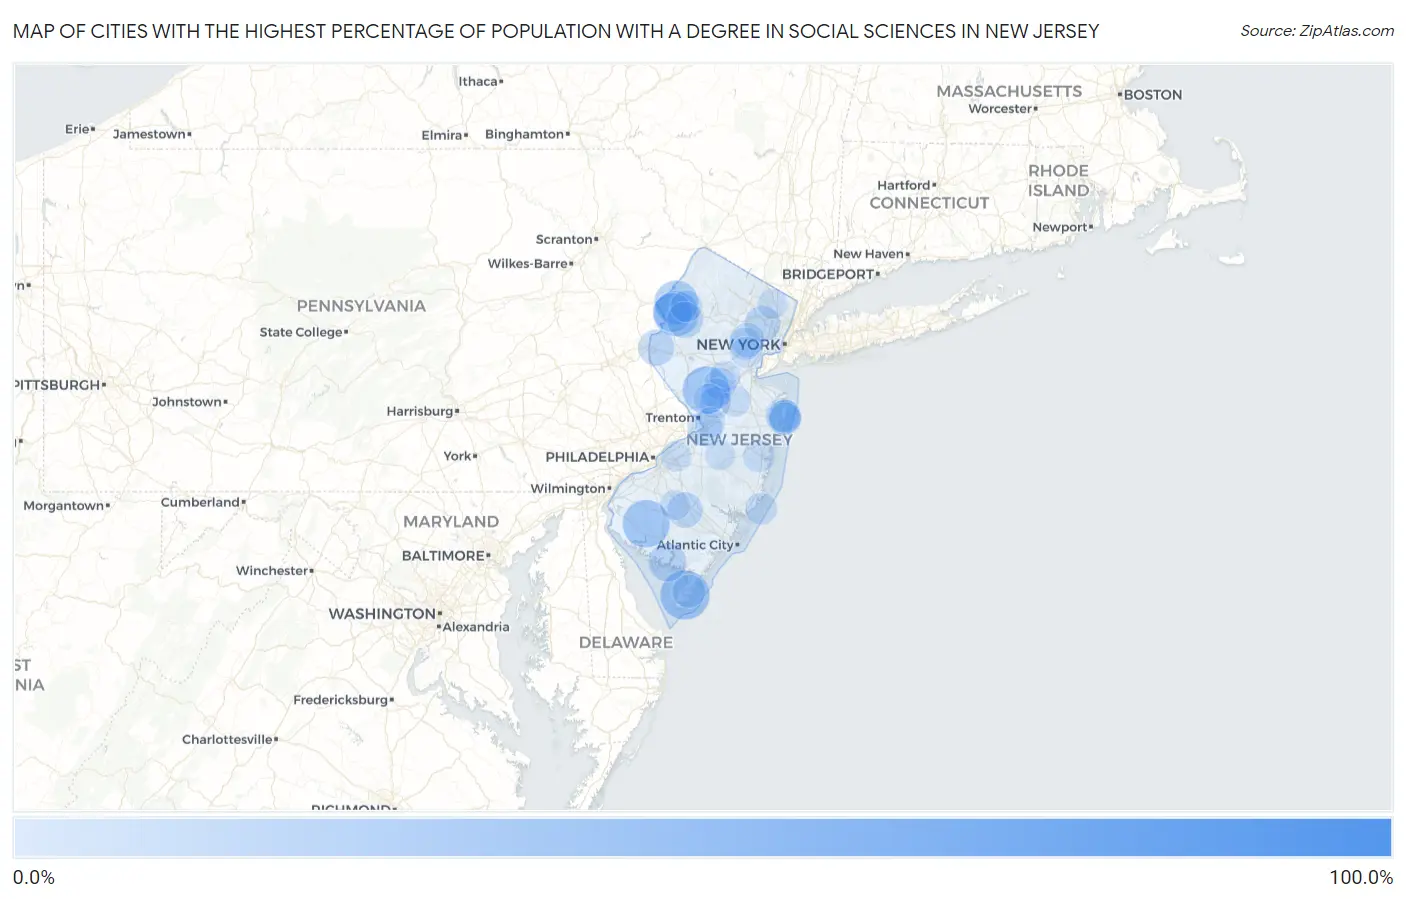
Map of Cities with the Highest Percentage of Population with a Degree in Social Sciences in New Jersey
0.0%
100.0%
Cities with the Highest Percentage of Population with a Degree in Social Sciences in New Jersey
| City | % Graduates | vs State | vs National | |
| 1. | Montclair State University | 82.1% | 8.6%(+73.5)#1 | 8.1%(+74.0)#68 |
| 2. | Lamington | 50.0% | 8.6%(+41.4)#2 | 8.1%(+41.9)#185 |
| 3. | Gandys Beach | 42.9% | 8.6%(+34.3)#3 | 8.1%(+34.8)#272 |
| 4. | Arrowhead Lake | 41.7% | 8.6%(+33.1)#4 | 8.1%(+33.6)#283 |
| 5. | Leesburg | 37.9% | 8.6%(+29.4)#5 | 8.1%(+29.9)#347 |
| 6. | Rio Grande | 35.8% | 8.6%(+27.3)#6 | 8.1%(+27.8)#386 |
| 7. | Seabrook Farms | 33.3% | 8.6%(+24.8)#7 | 8.1%(+25.3)#424 |
| 8. | Blawenburg | 33.3% | 8.6%(+24.8)#8 | 8.1%(+25.3)#447 |
| 9. | Hope | 30.8% | 8.6%(+22.2)#9 | 8.1%(+22.7)#507 |
| 10. | Blairstown | 29.2% | 8.6%(+20.6)#10 | 8.1%(+21.1)#577 |
| 11. | New Vernon | 27.8% | 8.6%(+19.2)#11 | 8.1%(+19.7)#643 |
| 12. | Washington Crossing | 24.4% | 8.6%(+15.9)#12 | 8.1%(+16.4)#864 |
| 13. | The College Of New Jersey | 24.1% | 8.6%(+15.5)#13 | 8.1%(+16.0)#885 |
| 14. | Hewitt | 24.0% | 8.6%(+15.4)#14 | 8.1%(+15.9)#891 |
| 15. | Encore At Monroe | 24.0% | 8.6%(+15.4)#15 | 8.1%(+15.9)#896 |
| 16. | Harrisonville | 23.4% | 8.6%(+14.9)#16 | 8.1%(+15.4)#932 |
| 17. | Stonebridge | 23.4% | 8.6%(+14.8)#17 | 8.1%(+15.3)#933 |
| 18. | Mount Hermon | 23.3% | 8.6%(+14.7)#18 | 8.1%(+15.2)#942 |
| 19. | Port Norris | 22.2% | 8.6%(+13.7)#19 | 8.1%(+14.2)#1,031 |
| 20. | Cologne | 21.4% | 8.6%(+12.8)#20 | 8.1%(+13.3)#1,139 |
| 21. | Pleasantdale | 20.3% | 8.6%(+11.8)#21 | 8.1%(+12.3)#1,260 |
| 22. | Vienna | 20.3% | 8.6%(+11.7)#22 | 8.1%(+12.2)#1,268 |
| 23. | Tavistock Borough | 20.0% | 8.6%(+11.4)#23 | 8.1%(+11.9)#1,346 |
| 24. | Upper Montclair | 19.9% | 8.6%(+11.3)#24 | 8.1%(+11.8)#1,355 |
| 25. | Greenwich | 19.8% | 8.6%(+11.3)#25 | 8.1%(+11.8)#1,358 |
| 26. | Landing | 19.3% | 8.6%(+10.8)#26 | 8.1%(+11.2)#1,427 |
| 27. | Collings Lakes | 19.3% | 8.6%(+10.7)#27 | 8.1%(+11.2)#1,433 |
| 28. | Bordentown | 18.9% | 8.6%(+10.3)#28 | 8.1%(+10.8)#1,494 |
| 29. | Mount Tabor | 18.9% | 8.6%(+10.3)#29 | 8.1%(+10.8)#1,499 |
| 30. | Woodbine Borough | 18.8% | 8.6%(+10.2)#30 | 8.1%(+10.7)#1,503 |
| 31. | Keasbey | 18.7% | 8.6%(+10.1)#31 | 8.1%(+10.6)#1,528 |
| 32. | Llewellyn Park | 18.5% | 8.6%(+9.98)#32 | 8.1%(+10.5)#1,556 |
| 33. | Deal Borough | 18.1% | 8.6%(+9.54)#33 | 8.1%(+10.0)#1,647 |
| 34. | Dividing Creek | 17.9% | 8.6%(+9.29)#34 | 8.1%(+9.79)#1,671 |
| 35. | Shrewsbury Borough | 17.8% | 8.6%(+9.27)#35 | 8.1%(+9.76)#1,681 |
| 36. | Short Hills | 17.6% | 8.6%(+9.04)#36 | 8.1%(+9.53)#1,722 |
| 37. | The Ponds | 17.4% | 8.6%(+8.87)#37 | 8.1%(+9.37)#1,753 |
| 38. | Asbury Park | 17.3% | 8.6%(+8.71)#38 | 8.1%(+9.20)#1,786 |
| 39. | Wanamassa | 16.9% | 8.6%(+8.32)#39 | 8.1%(+8.81)#1,875 |
| 40. | Stirling | 16.8% | 8.6%(+8.21)#40 | 8.1%(+8.71)#1,891 |
| 41. | Folsom Borough | 16.7% | 8.6%(+8.14)#41 | 8.1%(+8.64)#1,906 |
| 42. | Burleigh | 16.4% | 8.6%(+7.87)#42 | 8.1%(+8.37)#2,001 |
| 43. | Glen Ridge Borough | 16.4% | 8.6%(+7.86)#43 | 8.1%(+8.36)#2,002 |
| 44. | Dumont Borough | 16.2% | 8.6%(+7.66)#44 | 8.1%(+8.15)#2,040 |
| 45. | Flemington Borough | 16.1% | 8.6%(+7.58)#45 | 8.1%(+8.07)#2,065 |
| 46. | Loch Arbour | 16.1% | 8.6%(+7.54)#46 | 8.1%(+8.03)#2,083 |
| 47. | Sea Girt Borough | 16.1% | 8.6%(+7.50)#47 | 8.1%(+7.99)#2,091 |
| 48. | Fanwood Borough | 16.0% | 8.6%(+7.44)#48 | 8.1%(+7.93)#2,103 |
| 49. | Stockton Borough | 15.7% | 8.6%(+7.10)#49 | 8.1%(+7.60)#2,192 |
| 50. | Alpine Borough | 15.6% | 8.6%(+7.08)#50 | 8.1%(+7.57)#2,197 |
| 51. | Silver Ridge | 15.4% | 8.6%(+6.87)#51 | 8.1%(+7.36)#2,255 |
| 52. | Ocean Grove | 15.4% | 8.6%(+6.82)#52 | 8.1%(+7.31)#2,266 |
| 53. | Summit | 15.3% | 8.6%(+6.77)#53 | 8.1%(+7.26)#2,300 |
| 54. | Fair Haven Borough | 15.2% | 8.6%(+6.66)#54 | 8.1%(+7.15)#2,335 |
| 55. | Bernardsville Borough | 15.0% | 8.6%(+6.48)#55 | 8.1%(+6.98)#2,381 |
| 56. | Pleasant Plains | 14.9% | 8.6%(+6.35)#56 | 8.1%(+6.85)#2,427 |
| 57. | North Beach Haven | 14.9% | 8.6%(+6.34)#57 | 8.1%(+6.84)#2,432 |
| 58. | Johnsonburg | 14.7% | 8.6%(+6.12)#58 | 8.1%(+6.61)#2,502 |
| 59. | Princeton Junction | 14.6% | 8.6%(+6.04)#59 | 8.1%(+6.54)#2,531 |
| 60. | Pines Lake | 14.5% | 8.6%(+5.95)#60 | 8.1%(+6.44)#2,559 |
| 61. | Westfield | 14.5% | 8.6%(+5.89)#61 | 8.1%(+6.39)#2,574 |
| 62. | Lebanon Borough | 14.5% | 8.6%(+5.89)#62 | 8.1%(+6.38)#2,578 |
| 63. | Longport Borough | 14.4% | 8.6%(+5.83)#63 | 8.1%(+6.33)#2,597 |
| 64. | Basking Ridge | 14.3% | 8.6%(+5.77)#64 | 8.1%(+6.26)#2,611 |
| 65. | Rocky Hill Borough | 14.3% | 8.6%(+5.72)#65 | 8.1%(+6.21)#2,634 |
| 66. | Marshallville | 14.3% | 8.6%(+5.72)#66 | 8.1%(+6.21)#2,653 |
| 67. | Wildwood Crest Borough | 14.2% | 8.6%(+5.63)#67 | 8.1%(+6.13)#2,694 |
| 68. | Monmouth Beach Borough | 14.1% | 8.6%(+5.55)#68 | 8.1%(+6.04)#2,720 |
| 69. | Macopin | 14.1% | 8.6%(+5.52)#69 | 8.1%(+6.02)#2,731 |
| 70. | Whittingham | 14.1% | 8.6%(+5.50)#70 | 8.1%(+5.99)#2,739 |
| 71. | Rumson Borough | 14.0% | 8.6%(+5.44)#71 | 8.1%(+5.93)#2,762 |
| 72. | Layton | 13.9% | 8.6%(+5.37)#72 | 8.1%(+5.87)#2,787 |
| 73. | Ho Ho Kus Borough | 13.9% | 8.6%(+5.35)#73 | 8.1%(+5.84)#2,796 |
| 74. | Silver Lake Cdp Essex County | 13.9% | 8.6%(+5.35)#74 | 8.1%(+5.84)#2,797 |
| 75. | Middlebush | 13.8% | 8.6%(+5.27)#75 | 8.1%(+5.76)#2,828 |
| 76. | Cape May Point Borough | 13.8% | 8.6%(+5.26)#76 | 8.1%(+5.75)#2,831 |
| 77. | Mantoloking Borough | 13.8% | 8.6%(+5.25)#77 | 8.1%(+5.74)#2,833 |
| 78. | Kingston | 13.8% | 8.6%(+5.20)#78 | 8.1%(+5.69)#2,861 |
| 79. | Haworth Borough | 13.8% | 8.6%(+5.19)#79 | 8.1%(+5.68)#2,864 |
| 80. | Interlaken Borough | 13.7% | 8.6%(+5.13)#80 | 8.1%(+5.62)#2,887 |
| 81. | Crosswicks | 13.6% | 8.6%(+5.06)#81 | 8.1%(+5.55)#2,925 |
| 82. | Haddonfield Borough | 13.6% | 8.6%(+5.06)#82 | 8.1%(+5.55)#2,926 |
| 83. | Moorestown Lenola | 13.5% | 8.6%(+4.96)#83 | 8.1%(+5.45)#2,964 |
| 84. | South Seaville | 13.5% | 8.6%(+4.93)#84 | 8.1%(+5.43)#2,976 |
| 85. | North Caldwell Borough | 13.5% | 8.6%(+4.92)#85 | 8.1%(+5.41)#2,983 |
| 86. | Milltown Borough | 13.3% | 8.6%(+4.74)#86 | 8.1%(+5.23)#3,089 |
| 87. | Ridgewood | 13.3% | 8.6%(+4.69)#87 | 8.1%(+5.19)#3,104 |
| 88. | Madison Borough | 13.2% | 8.6%(+4.68)#88 | 8.1%(+5.18)#3,114 |
| 89. | Princeton | 13.2% | 8.6%(+4.64)#89 | 8.1%(+5.13)#3,133 |
| 90. | Neshanic | 13.2% | 8.6%(+4.63)#90 | 8.1%(+5.12)#3,141 |
| 91. | Helmetta Borough | 13.2% | 8.6%(+4.61)#91 | 8.1%(+5.10)#3,152 |
| 92. | Yardville | 13.1% | 8.6%(+4.56)#92 | 8.1%(+5.05)#3,178 |
| 93. | Cranford | 13.1% | 8.6%(+4.51)#93 | 8.1%(+5.00)#3,195 |
| 94. | Browns Mills | 13.1% | 8.6%(+4.49)#94 | 8.1%(+4.98)#3,200 |
| 95. | Chatham Borough | 13.0% | 8.6%(+4.47)#95 | 8.1%(+4.97)#3,228 |
| 96. | Regency At Monroe | 13.0% | 8.6%(+4.47)#96 | 8.1%(+4.96)#3,231 |
| 97. | Lake Hopatcong | 13.0% | 8.6%(+4.41)#97 | 8.1%(+4.90)#3,253 |
| 98. | Manasquan Borough | 13.0% | 8.6%(+4.41)#98 | 8.1%(+4.90)#3,257 |
| 99. | Stanhope Borough | 12.9% | 8.6%(+4.36)#99 | 8.1%(+4.85)#3,286 |
| 100. | Victory Lakes | 12.9% | 8.6%(+4.36)#100 | 8.1%(+4.85)#3,287 |
Common Questions
What are the Top 10 Cities with the Highest Percentage of Population with a Degree in Social Sciences in New Jersey?
Top 10 Cities with the Highest Percentage of Population with a Degree in Social Sciences in New Jersey are:
#1
35.8%
#2
33.3%
#3
33.3%
#4
30.8%
#5
29.2%
#6
23.3%
#7
22.2%
#8
20.3%
#9
19.9%
#10
19.8%
What city has the Highest Percentage of Population with a Degree in Social Sciences in New Jersey?
Rio Grande has the Highest Percentage of Population with a Degree in Social Sciences in New Jersey with 35.8%.
What is the Percentage of Population with a Degree in Social Sciences in the State of New Jersey?
Percentage of Population with a Degree in Social Sciences in New Jersey is 8.6%.
What is the Percentage of Population with a Degree in Social Sciences in the United States?
Percentage of Population with a Degree in Social Sciences in the United States is 8.1%.