Jersey City, NJ
Jersey City Map
Jersey City Overview
287,899
TOTAL POPULATION
145,921
MALE POPULATION
141,978
FEMALE POPULATION
102.78
MALES / 100 FEMALES
97.30
FEMALES / 100 MALES
34.6
MEDIAN AGE
3.1
AVG FAMILY SIZE
2.4
AVG HOUSEHOLD SIZE
$54,582
PER CAPITA INCOME
$102,072
AVG FAMILY INCOME
$91,151
AVG HOUSEHOLD INCOME
23.3%
WAGE / INCOME GAP [ % ]
76.7¢/ $1
WAGE / INCOME GAP [ $ ]
$11,124
FAMILY INCOME DEFICIT
0.51
INEQUALITY / GINI INDEX
163,618
LABOR FORCE [ PEOPLE ]
69.8%
PERCENT IN LABOR FORCE
5.8%
UNEMPLOYMENT RATE
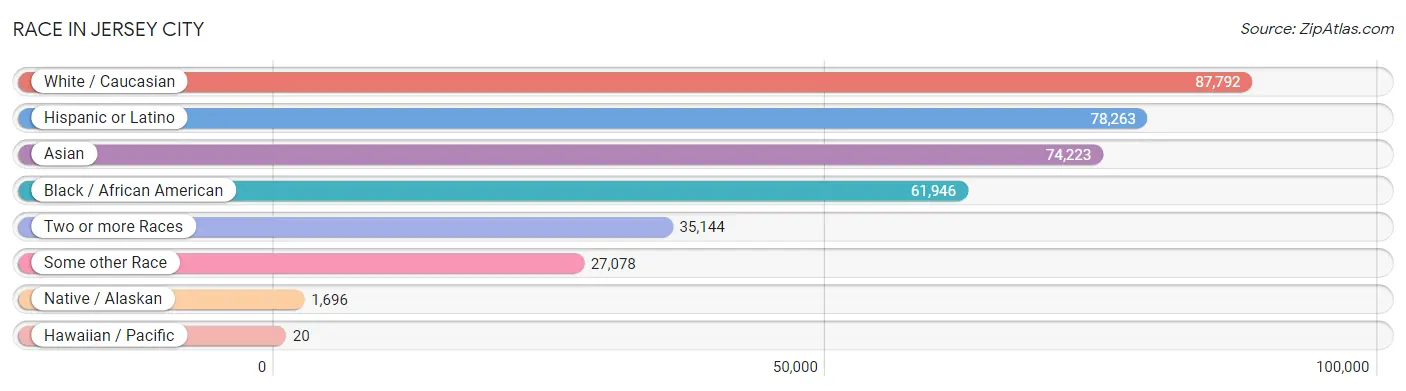
Race in Jersey City
The most populous races in Jersey City are White / Caucasian (87,792 | 30.5%), Hispanic or Latino (78,263 | 27.2%), and Asian (74,223 | 25.8%).
| Race | # Population | % Population |
| Asian | 74,223 | 25.8% |
| Black / African American | 61,946 | 21.5% |
| Hawaiian / Pacific | 20 | 0.0% |
| Hispanic or Latino | 78,263 | 27.2% |
| Native / Alaskan | 1,696 | 0.6% |
| White / Caucasian | 87,792 | 30.5% |
| Two or more Races | 35,144 | 12.2% |
| Some other Race | 27,078 | 9.4% |
| Total | 287,899 | 100.0% |
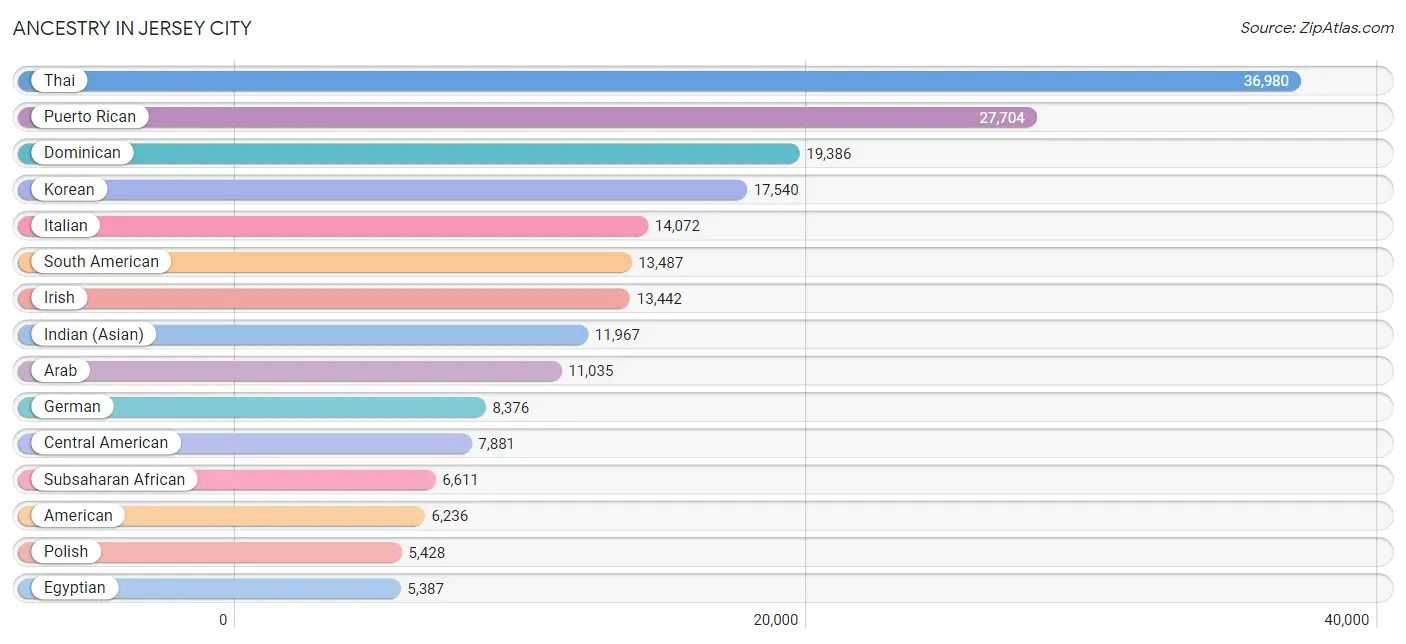
Ancestry in Jersey City
The most populous ancestries reported in Jersey City are Thai (36,980 | 12.8%), Puerto Rican (27,704 | 9.6%), Dominican (19,386 | 6.7%), Korean (17,540 | 6.1%), and Italian (14,072 | 4.9%), together accounting for 40.2% of all Jersey City residents.
| Ancestry | # Population | % Population |
| Afghan | 36 | 0.0% |
| African | 2,338 | 0.8% |
| Albanian | 183 | 0.1% |
| Alsatian | 24 | 0.0% |
| American | 6,236 | 2.2% |
| Apache | 86 | 0.0% |
| Arab | 11,035 | 3.8% |
| Argentinean | 1,223 | 0.4% |
| Armenian | 136 | 0.1% |
| Australian | 248 | 0.1% |
| Austrian | 418 | 0.2% |
| Bahamian | 77 | 0.0% |
| Barbadian | 188 | 0.1% |
| Basque | 52 | 0.0% |
| Belgian | 60 | 0.0% |
| Bermudan | 55 | 0.0% |
| Bhutanese | 1,639 | 0.6% |
| Blackfeet | 99 | 0.0% |
| Bolivian | 435 | 0.2% |
| Brazilian | 829 | 0.3% |
| British | 724 | 0.3% |
| British West Indian | 599 | 0.2% |
| Bulgarian | 289 | 0.1% |
| Burmese | 2,857 | 1.0% |
| Canadian | 603 | 0.2% |
| Central American | 7,881 | 2.7% |
| Central American Indian | 918 | 0.3% |
| Cherokee | 350 | 0.1% |
| Chilean | 1,033 | 0.4% |
| Chippewa | 28 | 0.0% |
| Choctaw | 9 | 0.0% |
| Colombian | 2,960 | 1.0% |
| Costa Rican | 323 | 0.1% |
| Croatian | 154 | 0.1% |
| Cuban | 2,417 | 0.8% |
| Cypriot | 19 | 0.0% |
| Czech | 166 | 0.1% |
| Czechoslovakian | 31 | 0.0% |
| Danish | 344 | 0.1% |
| Delaware | 93 | 0.0% |
| Dominican | 19,386 | 6.7% |
| Dutch | 616 | 0.2% |
| Dutch West Indian | 15 | 0.0% |
| Eastern European | 636 | 0.2% |
| Ecuadorian | 5,285 | 1.8% |
| Egyptian | 5,387 | 1.9% |
| English | 4,510 | 1.6% |
| Estonian | 12 | 0.0% |
| Ethiopian | 233 | 0.1% |
| European | 1,078 | 0.4% |
| Filipino | 666 | 0.2% |
| Finnish | 187 | 0.1% |
| French | 1,810 | 0.6% |
| French American Indian | 18 | 0.0% |
| French Canadian | 278 | 0.1% |
| German | 8,376 | 2.9% |
| Ghanaian | 714 | 0.3% |
| Greek | 1,076 | 0.4% |
| Guamanian / Chamorro | 38 | 0.0% |
| Guatemalan | 2,296 | 0.8% |
| Guyanese | 4,022 | 1.4% |
| Haitian | 1,532 | 0.5% |
| Honduran | 2,445 | 0.9% |
| Hungarian | 846 | 0.3% |
| Icelander | 19 | 0.0% |
| Indian (Asian) | 11,967 | 4.2% |
| Indonesian | 14 | 0.0% |
| Inupiat | 1 | 0.0% |
| Iranian | 337 | 0.1% |
| Irish | 13,442 | 4.7% |
| Iroquois | 30 | 0.0% |
| Israeli | 143 | 0.1% |
| Italian | 14,072 | 4.9% |
| Jamaican | 2,825 | 1.0% |
| Japanese | 71 | 0.0% |
| Jordanian | 10 | 0.0% |
| Kenyan | 1,223 | 0.4% |
| Korean | 17,540 | 6.1% |
| Laotian | 114 | 0.0% |
| Latvian | 67 | 0.0% |
| Lebanese | 612 | 0.2% |
| Liberian | 138 | 0.1% |
| Lithuanian | 345 | 0.1% |
| Luxembourger | 11 | 0.0% |
| Macedonian | 31 | 0.0% |
| Maltese | 29 | 0.0% |
| Mexican | 4,471 | 1.5% |
| Mexican American Indian | 317 | 0.1% |
| Mongolian | 61 | 0.0% |
| Moroccan | 1,882 | 0.6% |
| Native Hawaiian | 34 | 0.0% |
| New Zealander | 5 | 0.0% |
| Nicaraguan | 276 | 0.1% |
| Nigerian | 1,113 | 0.4% |
| Northern European | 66 | 0.0% |
| Norwegian | 499 | 0.2% |
| Okinawan | 62 | 0.0% |
| Pakistani | 350 | 0.1% |
| Palestinian | 172 | 0.1% |
| Panamanian | 666 | 0.2% |
| Paraguayan | 11 | 0.0% |
| Peruvian | 1,145 | 0.4% |
| Pima | 11 | 0.0% |
| Polish | 5,428 | 1.9% |
| Portuguese | 751 | 0.3% |
| Puerto Rican | 27,704 | 9.6% |
| Romanian | 655 | 0.2% |
| Russian | 2,926 | 1.0% |
| Salvadoran | 1,875 | 0.6% |
| Scandinavian | 153 | 0.1% |
| Scotch-Irish | 385 | 0.1% |
| Scottish | 836 | 0.3% |
| Senegalese | 71 | 0.0% |
| Serbian | 59 | 0.0% |
| Sierra Leonean | 43 | 0.0% |
| Sioux | 38 | 0.0% |
| Slavic | 98 | 0.0% |
| Slovak | 226 | 0.1% |
| Slovene | 37 | 0.0% |
| South African | 66 | 0.0% |
| South American | 13,487 | 4.7% |
| South American Indian | 236 | 0.1% |
| Soviet Union | 7 | 0.0% |
| Spaniard | 483 | 0.2% |
| Spanish | 263 | 0.1% |
| Spanish American Indian | 227 | 0.1% |
| Sri Lankan | 2,123 | 0.7% |
| Subsaharan African | 6,611 | 2.3% |
| Sudanese | 59 | 0.0% |
| Swedish | 596 | 0.2% |
| Swiss | 170 | 0.1% |
| Syrian | 60 | 0.0% |
| Thai | 36,980 | 12.8% |
| Tohono O'Odham | 9 | 0.0% |
| Trinidadian and Tobagonian | 1,746 | 0.6% |
| Turkish | 323 | 0.1% |
| U.S. Virgin Islander | 73 | 0.0% |
| Ugandan | 21 | 0.0% |
| Ukrainian | 1,442 | 0.5% |
| Uruguayan | 176 | 0.1% |
| Venezuelan | 1,033 | 0.4% |
| Vietnamese | 427 | 0.2% |
| Welsh | 181 | 0.1% |
| West Indian | 618 | 0.2% |
| Yugoslavian | 41 | 0.0% |
| Zimbabwean | 42 | 0.0% | View All 146 Rows |
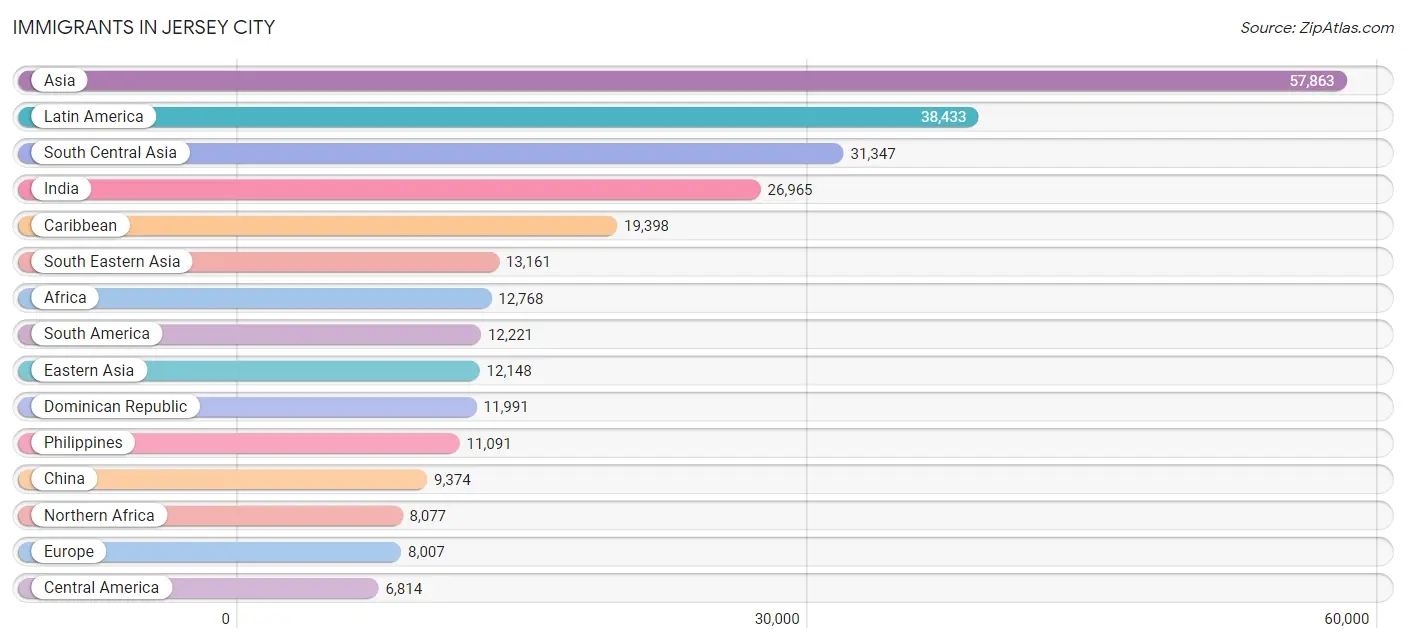
Immigrants in Jersey City
The most numerous immigrant groups reported in Jersey City came from Asia (57,863 | 20.1%), Latin America (38,433 | 13.4%), South Central Asia (31,347 | 10.9%), India (26,965 | 9.4%), and Caribbean (19,398 | 6.7%), together accounting for 60.5% of all Jersey City residents.
| Immigration Origin | # Population | % Population |
| Africa | 12,768 | 4.4% |
| Albania | 64 | 0.0% |
| Argentina | 611 | 0.2% |
| Asia | 57,863 | 20.1% |
| Australia | 286 | 0.1% |
| Austria | 30 | 0.0% |
| Bahamas | 7 | 0.0% |
| Bangladesh | 470 | 0.2% |
| Barbados | 96 | 0.0% |
| Belarus | 171 | 0.1% |
| Belize | 73 | 0.0% |
| Bolivia | 265 | 0.1% |
| Bosnia and Herzegovina | 19 | 0.0% |
| Brazil | 830 | 0.3% |
| Bulgaria | 215 | 0.1% |
| Cambodia | 35 | 0.0% |
| Cameroon | 199 | 0.1% |
| Canada | 1,141 | 0.4% |
| Caribbean | 19,398 | 6.7% |
| Central America | 6,814 | 2.4% |
| Chile | 692 | 0.2% |
| China | 9,374 | 3.3% |
| Colombia | 1,828 | 0.6% |
| Congo | 9 | 0.0% |
| Costa Rica | 93 | 0.0% |
| Croatia | 54 | 0.0% |
| Cuba | 1,671 | 0.6% |
| Czechoslovakia | 30 | 0.0% |
| Denmark | 65 | 0.0% |
| Dominica | 212 | 0.1% |
| Dominican Republic | 11,991 | 4.2% |
| Eastern Africa | 1,672 | 0.6% |
| Eastern Asia | 12,148 | 4.2% |
| Eastern Europe | 3,591 | 1.3% |
| Ecuador | 2,922 | 1.0% |
| Egypt | 5,610 | 1.9% |
| El Salvador | 1,147 | 0.4% |
| England | 288 | 0.1% |
| Ethiopia | 151 | 0.1% |
| Europe | 8,007 | 2.8% |
| France | 728 | 0.3% |
| Germany | 461 | 0.2% |
| Ghana | 790 | 0.3% |
| Greece | 153 | 0.1% |
| Guatemala | 1,350 | 0.5% |
| Guyana | 3,194 | 1.1% |
| Haiti | 1,374 | 0.5% |
| Honduras | 2,217 | 0.8% |
| Hong Kong | 666 | 0.2% |
| Hungary | 147 | 0.1% |
| India | 26,965 | 9.4% |
| Indonesia | 55 | 0.0% |
| Iran | 258 | 0.1% |
| Ireland | 446 | 0.2% |
| Israel | 161 | 0.1% |
| Italy | 791 | 0.3% |
| Jamaica | 1,736 | 0.6% |
| Japan | 806 | 0.3% |
| Jordan | 49 | 0.0% |
| Kazakhstan | 70 | 0.0% |
| Kenya | 1,299 | 0.4% |
| Korea | 1,968 | 0.7% |
| Laos | 55 | 0.0% |
| Latin America | 38,433 | 13.4% |
| Latvia | 16 | 0.0% |
| Lebanon | 222 | 0.1% |
| Liberia | 138 | 0.1% |
| Lithuania | 19 | 0.0% |
| Malaysia | 67 | 0.0% |
| Mexico | 1,345 | 0.5% |
| Middle Africa | 416 | 0.1% |
| Moldova | 15 | 0.0% |
| Morocco | 1,617 | 0.6% |
| Nepal | 424 | 0.2% |
| Netherlands | 134 | 0.1% |
| Nicaragua | 105 | 0.0% |
| Nigeria | 740 | 0.3% |
| North Macedonia | 40 | 0.0% |
| Northern Africa | 8,077 | 2.8% |
| Northern Europe | 1,724 | 0.6% |
| Oceania | 315 | 0.1% |
| Pakistan | 2,985 | 1.0% |
| Panama | 484 | 0.2% |
| Peru | 779 | 0.3% |
| Philippines | 11,091 | 3.8% |
| Poland | 914 | 0.3% |
| Portugal | 85 | 0.0% |
| Romania | 216 | 0.1% |
| Russia | 725 | 0.3% |
| Saudi Arabia | 132 | 0.1% |
| Scotland | 8 | 0.0% |
| Senegal | 285 | 0.1% |
| Serbia | 41 | 0.0% |
| Sierra Leone | 40 | 0.0% |
| Singapore | 147 | 0.1% |
| South Africa | 145 | 0.1% |
| South America | 12,221 | 4.2% |
| South Central Asia | 31,347 | 10.9% |
| South Eastern Asia | 13,161 | 4.6% |
| Southern Europe | 1,251 | 0.4% |
| Spain | 222 | 0.1% |
| Sri Lanka | 18 | 0.0% |
| St. Vincent and the Grenadines | 44 | 0.0% |
| Sudan | 11 | 0.0% |
| Sweden | 18 | 0.0% |
| Switzerland | 88 | 0.0% |
| Syria | 62 | 0.0% |
| Taiwan | 684 | 0.2% |
| Thailand | 122 | 0.0% |
| Trinidad and Tobago | 1,586 | 0.5% |
| Turkey | 207 | 0.1% |
| Uganda | 68 | 0.0% |
| Ukraine | 821 | 0.3% |
| Uruguay | 42 | 0.0% |
| Uzbekistan | 15 | 0.0% |
| Venezuela | 797 | 0.3% |
| Vietnam | 1,575 | 0.5% |
| West Indies | 20 | 0.0% |
| Western Africa | 2,369 | 0.8% |
| Western Asia | 1,121 | 0.4% |
| Western Europe | 1,441 | 0.5% |
| Yemen | 46 | 0.0% |
| Zaire | 7 | 0.0% |
| Zimbabwe | 34 | 0.0% | View All 124 Rows |
Sex and Age in Jersey City
Sex and Age in Jersey City
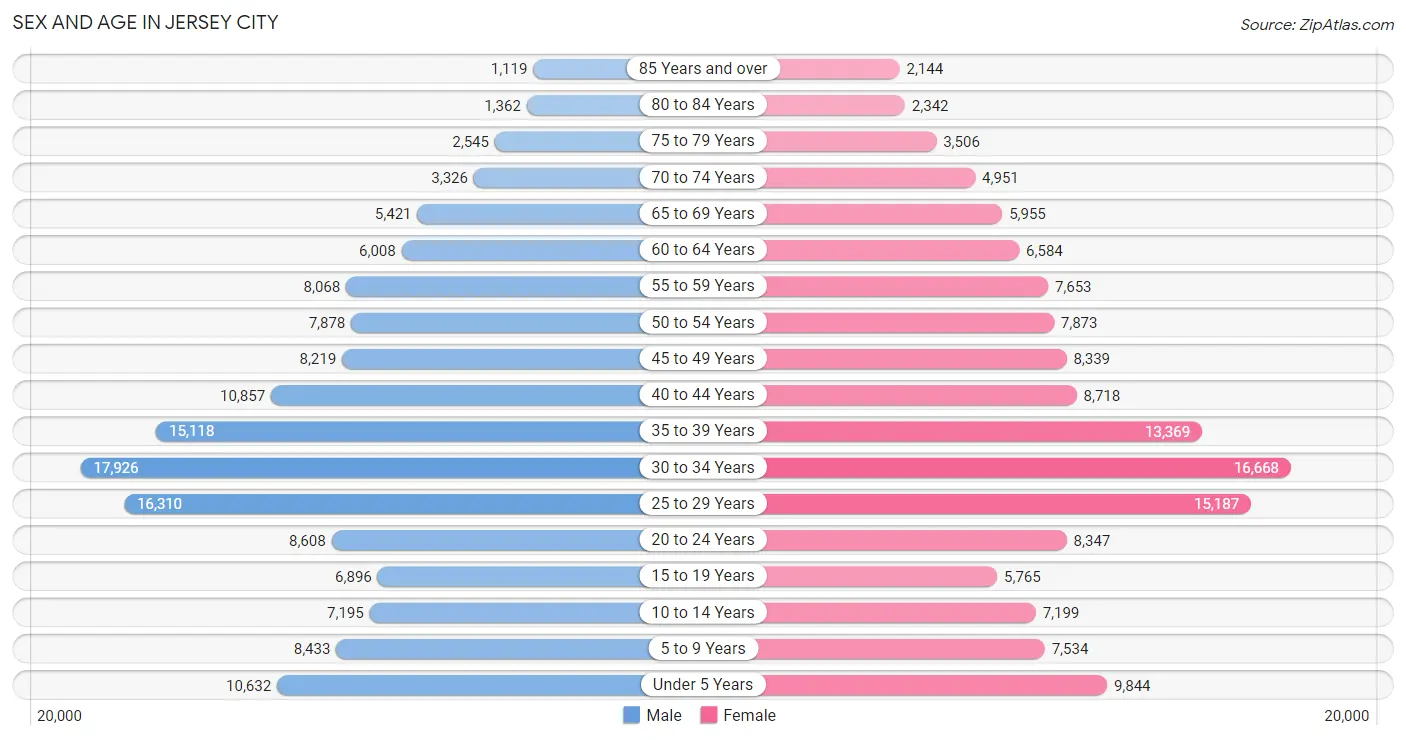
The most populous age groups in Jersey City are 30 to 34 Years (17,926 | 12.3%) for men and 30 to 34 Years (16,668 | 11.7%) for women.
| Age Bracket | Male | Female |
| Under 5 Years | 10,632 (7.3%) | 9,844 (6.9%) |
| 5 to 9 Years | 8,433 (5.8%) | 7,534 (5.3%) |
| 10 to 14 Years | 7,195 (4.9%) | 7,199 (5.1%) |
| 15 to 19 Years | 6,896 (4.7%) | 5,765 (4.1%) |
| 20 to 24 Years | 8,608 (5.9%) | 8,347 (5.9%) |
| 25 to 29 Years | 16,310 (11.2%) | 15,187 (10.7%) |
| 30 to 34 Years | 17,926 (12.3%) | 16,668 (11.7%) |
| 35 to 39 Years | 15,118 (10.4%) | 13,369 (9.4%) |
| 40 to 44 Years | 10,857 (7.4%) | 8,718 (6.1%) |
| 45 to 49 Years | 8,219 (5.6%) | 8,339 (5.9%) |
| 50 to 54 Years | 7,878 (5.4%) | 7,873 (5.6%) |
| 55 to 59 Years | 8,068 (5.5%) | 7,653 (5.4%) |
| 60 to 64 Years | 6,008 (4.1%) | 6,584 (4.6%) |
| 65 to 69 Years | 5,421 (3.7%) | 5,955 (4.2%) |
| 70 to 74 Years | 3,326 (2.3%) | 4,951 (3.5%) |
| 75 to 79 Years | 2,545 (1.7%) | 3,506 (2.5%) |
| 80 to 84 Years | 1,362 (0.9%) | 2,342 (1.7%) |
| 85 Years and over | 1,119 (0.8%) | 2,144 (1.5%) |
| Total | 145,921 (100.0%) | 141,978 (100.0%) |
Families and Households in Jersey City
Median Family Size in Jersey City
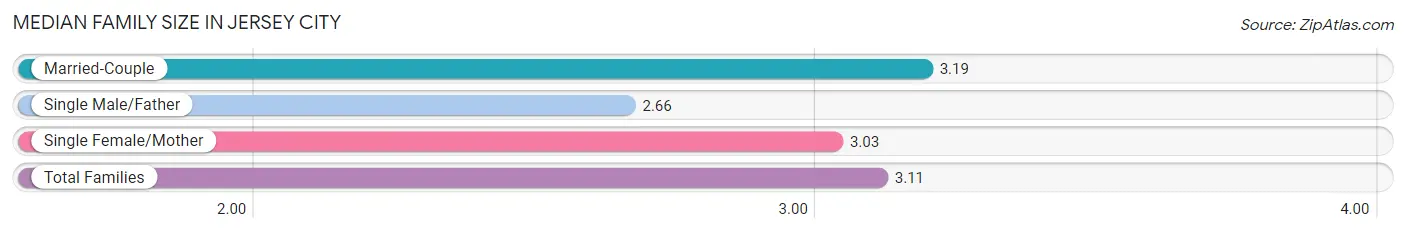
The median family size in Jersey City is 3.11 persons per family, with married-couple families (45,751 | 67.7%) accounting for the largest median family size of 3.19 persons per family. On the other hand, single male/father families (5,522 | 8.2%) represent the smallest median family size with 2.66 persons per family.
| Family Type | # Families | Family Size |
| Married-Couple | 45,751 (67.7%) | 3.19 |
| Single Male/Father | 5,522 (8.2%) | 2.66 |
| Single Female/Mother | 16,338 (24.2%) | 3.03 |
| Total Families | 67,611 (100.0%) | 3.11 |
Median Household Size in Jersey City
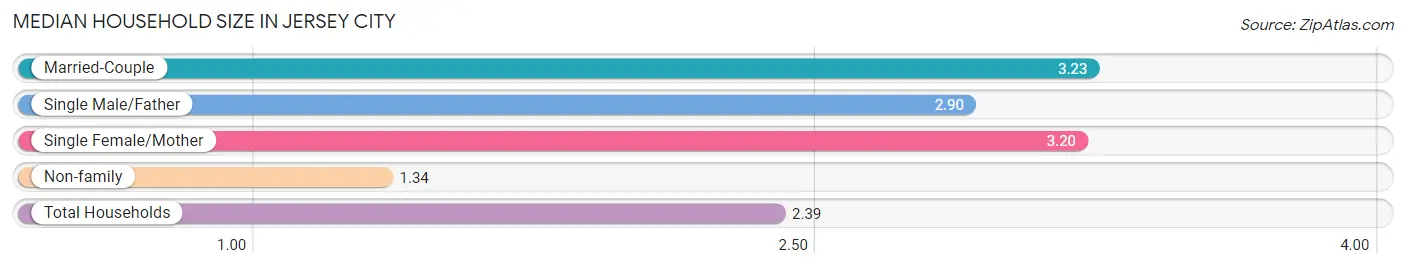
The median household size in Jersey City is 2.39 persons per household, with married-couple households (45,751 | 38.4%) accounting for the largest median household size of 3.23 persons per household. non-family households (51,667 | 43.3%) represent the smallest median household size with 1.34 persons per household.
| Household Type | # Households | Household Size |
| Married-Couple | 45,751 (38.4%) | 3.23 |
| Single Male/Father | 5,522 (4.6%) | 2.90 |
| Single Female/Mother | 16,338 (13.7%) | 3.20 |
| Non-family | 51,667 (43.3%) | 1.34 |
| Total Households | 119,278 (100.0%) | 2.39 |
Household Size by Marriage Status in Jersey City
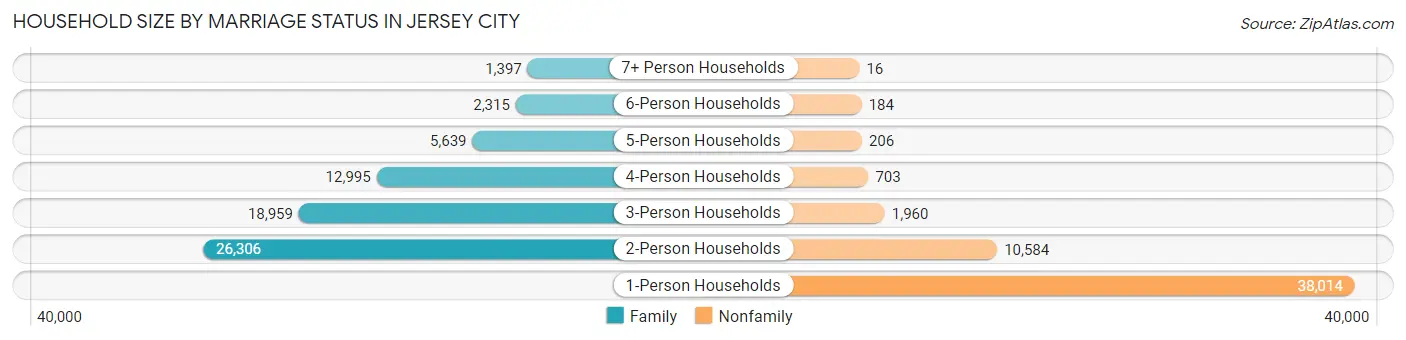
Out of a total of 119,278 households in Jersey City, 67,611 (56.7%) are family households, while 51,667 (43.3%) are nonfamily households. The most numerous type of family households are 2-person households, comprising 26,306, and the most common type of nonfamily households are 1-person households, comprising 38,014.
| Household Size | Family Households | Nonfamily Households |
| 1-Person Households | - | 38,014 (31.9%) |
| 2-Person Households | 26,306 (22.1%) | 10,584 (8.9%) |
| 3-Person Households | 18,959 (15.9%) | 1,960 (1.6%) |
| 4-Person Households | 12,995 (10.9%) | 703 (0.6%) |
| 5-Person Households | 5,639 (4.7%) | 206 (0.2%) |
| 6-Person Households | 2,315 (1.9%) | 184 (0.2%) |
| 7+ Person Households | 1,397 (1.2%) | 16 (0.0%) |
| Total | 67,611 (56.7%) | 51,667 (43.3%) |
Female Fertility in Jersey City
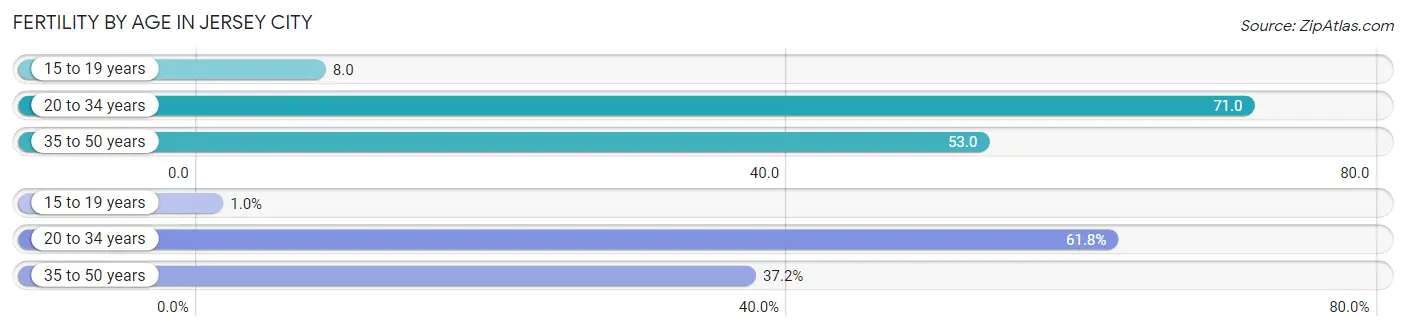
Fertility by Age in Jersey City
Average fertility rate in Jersey City is 59.0 births per 1,000 women. Women in the age bracket of 20 to 34 years have the highest fertility rate with 71.0 births per 1,000 women. Women in the age bracket of 20 to 34 years acount for 61.8% of all women with births.
| Age Bracket | Women with Births | Births / 1,000 Women |
| 15 to 19 years | 48 (1.0%) | 8.0 |
| 20 to 34 years | 2,842 (61.8%) | 71.0 |
| 35 to 50 years | 1,712 (37.2%) | 53.0 |
| Total | 4,602 (100.0%) | 59.0 |
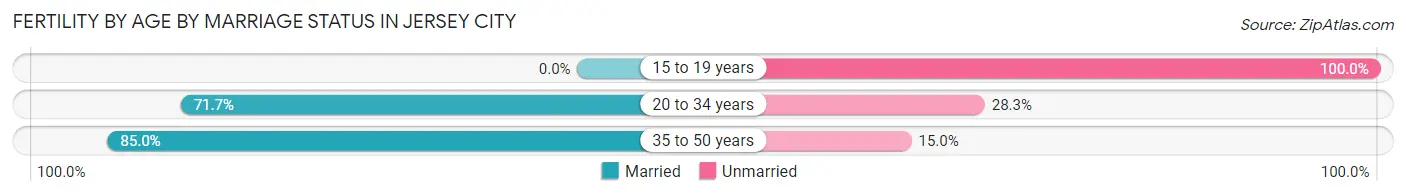
Fertility by Age by Marriage Status in Jersey City
75.9% of women with births (4,602) in Jersey City are married. The highest percentage of unmarried women with births falls into 15 to 19 years age bracket with 100.0% of them unmarried at the time of birth, while the lowest percentage of unmarried women with births belong to 35 to 50 years age bracket with 15.0% of them unmarried.
| Age Bracket | Married | Unmarried |
| 15 to 19 years | 0 (0.0%) | 48 (100.0%) |
| 20 to 34 years | 2,038 (71.7%) | 804 (28.3%) |
| 35 to 50 years | 1,455 (85.0%) | 257 (15.0%) |
| Total | 3,493 (75.9%) | 1,109 (24.1%) |
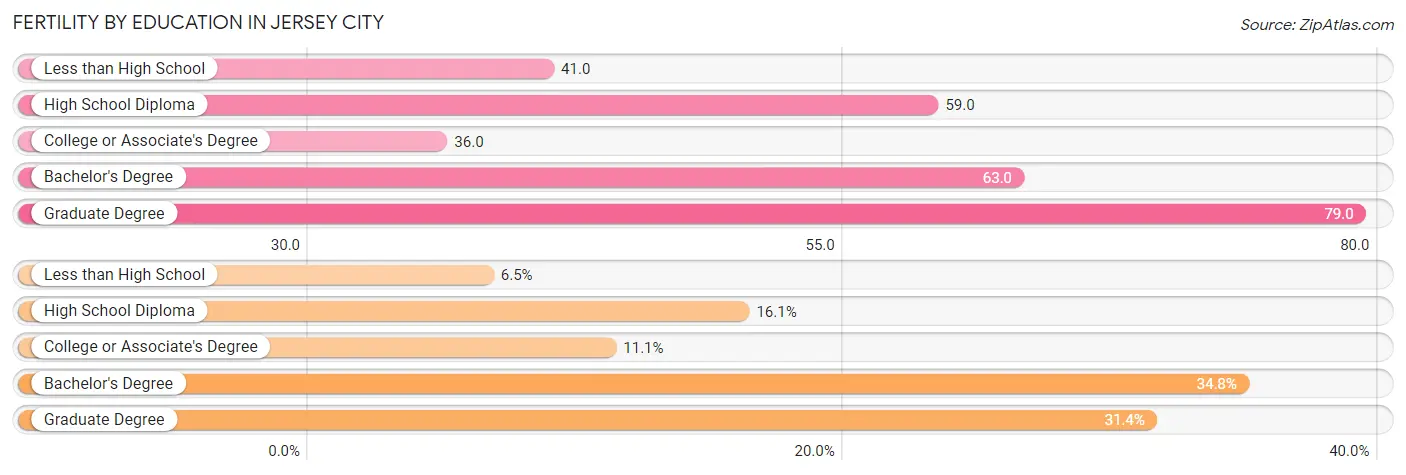
Fertility by Education in Jersey City
Average fertility rate in Jersey City is 59.0 births per 1,000 women. Women with the education attainment of graduate degree have the highest fertility rate of 79.0 births per 1,000 women, while women with the education attainment of college or associate's degree have the lowest fertility at 36.0 births per 1,000 women. Women with the education attainment of bachelor's degree represent 34.8% of all women with births.
| Educational Attainment | Women with Births | Births / 1,000 Women |
| Less than High School | 301 (6.5%) | 41.0 |
| High School Diploma | 742 (16.1%) | 59.0 |
| College or Associate's Degree | 512 (11.1%) | 36.0 |
| Bachelor's Degree | 1,603 (34.8%) | 63.0 |
| Graduate Degree | 1,444 (31.4%) | 79.0 |
| Total | 4,602 (100.0%) | 59.0 |
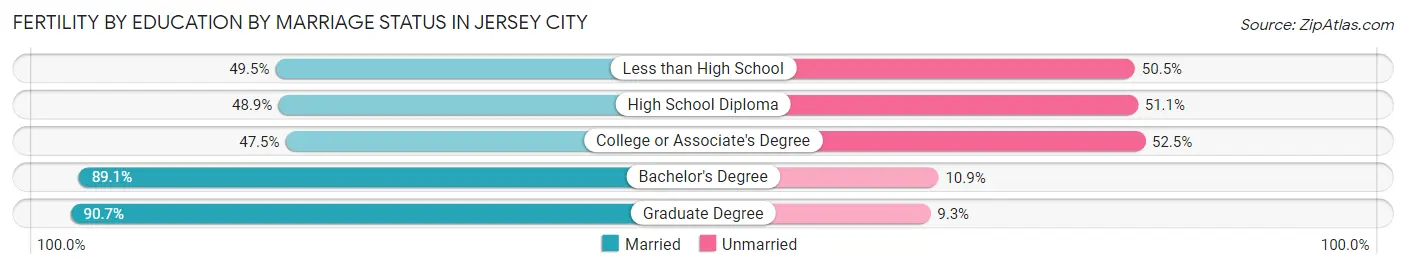
Fertility by Education by Marriage Status in Jersey City
24.1% of women with births in Jersey City are unmarried. Women with the educational attainment of graduate degree are most likely to be married with 90.7% of them married at childbirth, while women with the educational attainment of college or associate's degree are least likely to be married with 52.5% of them unmarried at childbirth.
| Educational Attainment | Married | Unmarried |
| Less than High School | 149 (49.5%) | 152 (50.5%) |
| High School Diploma | 363 (48.9%) | 379 (51.1%) |
| College or Associate's Degree | 243 (47.5%) | 269 (52.5%) |
| Bachelor's Degree | 1,428 (89.1%) | 175 (10.9%) |
| Graduate Degree | 1,310 (90.7%) | 134 (9.3%) |
| Total | 3,493 (75.9%) | 1,109 (24.1%) |
Income in Jersey City
Income Overview in Jersey City
Per Capita Income in Jersey City is $54,582, while median incomes of families and households are $102,072 and $91,151 respectively.
| Characteristic | Number | Measure |
| Per Capita Income | 287,899 | $54,582 |
| Median Family Income | 67,611 | $102,072 |
| Mean Family Income | 67,611 | $146,050 |
| Median Household Income | 119,278 | $91,151 |
| Mean Household Income | 119,278 | $132,092 |
| Income Deficit | 67,611 | $11,124 |
| Wage / Income Gap (%) | 287,899 | 23.29% |
| Wage / Income Gap ($) | 287,899 | 76.71¢ per $1 |
| Gini / Inequality Index | 287,899 | 0.51 |
Earnings by Sex in Jersey City
Average Earnings in Jersey City are $60,872, $68,284 for men and $52,383 for women, a difference of 23.3%.
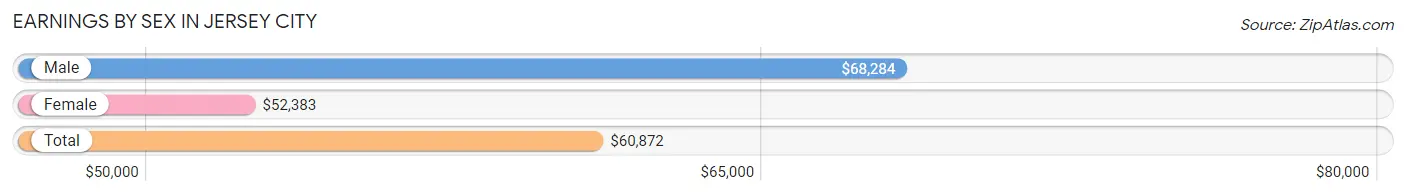
| Sex | Number | Average Earnings |
| Male | 92,484 (55.7%) | $68,284 |
| Female | 73,672 (44.3%) | $52,383 |
| Total | 166,156 (100.0%) | $60,872 |
Earnings by Sex by Income Bracket in Jersey City
The most common earnings brackets in Jersey City are $100,000+ for men (31,337 | 33.9%) and $100,000+ for women (17,281 | 23.5%).
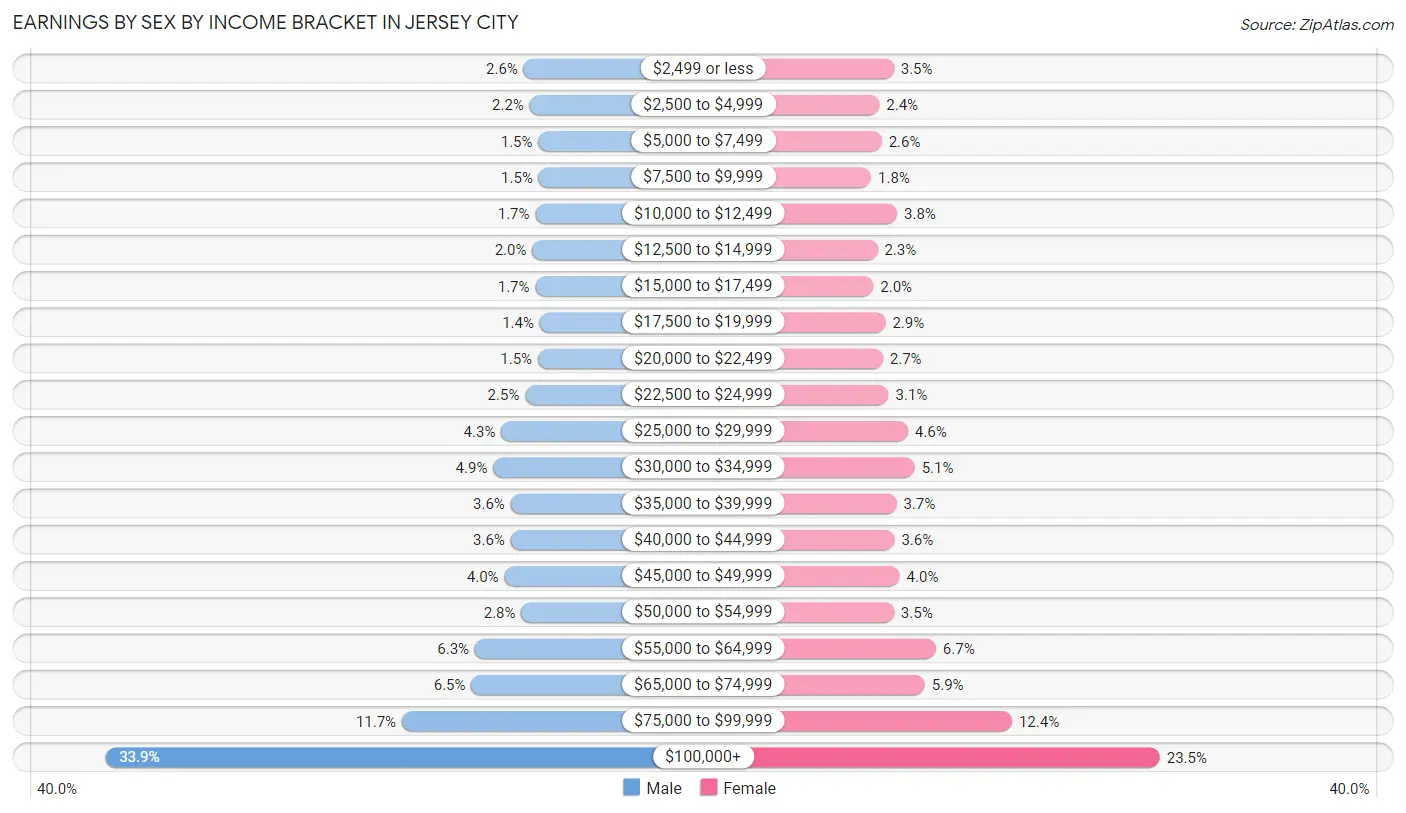
| Income | Male | Female |
| $2,499 or less | 2,409 (2.6%) | 2,595 (3.5%) |
| $2,500 to $4,999 | 1,990 (2.1%) | 1,794 (2.4%) |
| $5,000 to $7,499 | 1,388 (1.5%) | 1,933 (2.6%) |
| $7,500 to $9,999 | 1,359 (1.5%) | 1,341 (1.8%) |
| $10,000 to $12,499 | 1,588 (1.7%) | 2,780 (3.8%) |
| $12,500 to $14,999 | 1,806 (1.9%) | 1,694 (2.3%) |
| $15,000 to $17,499 | 1,593 (1.7%) | 1,464 (2.0%) |
| $17,500 to $19,999 | 1,282 (1.4%) | 2,137 (2.9%) |
| $20,000 to $22,499 | 1,415 (1.5%) | 1,992 (2.7%) |
| $22,500 to $24,999 | 2,293 (2.5%) | 2,307 (3.1%) |
| $25,000 to $29,999 | 3,960 (4.3%) | 3,376 (4.6%) |
| $30,000 to $34,999 | 4,516 (4.9%) | 3,750 (5.1%) |
| $35,000 to $39,999 | 3,298 (3.6%) | 2,743 (3.7%) |
| $40,000 to $44,999 | 3,305 (3.6%) | 2,627 (3.6%) |
| $45,000 to $49,999 | 3,734 (4.0%) | 2,918 (4.0%) |
| $50,000 to $54,999 | 2,563 (2.8%) | 2,597 (3.5%) |
| $55,000 to $64,999 | 5,779 (6.2%) | 4,918 (6.7%) |
| $65,000 to $74,999 | 6,026 (6.5%) | 4,308 (5.9%) |
| $75,000 to $99,999 | 10,843 (11.7%) | 9,117 (12.4%) |
| $100,000+ | 31,337 (33.9%) | 17,281 (23.5%) |
| Total | 92,484 (100.0%) | 73,672 (100.0%) |
Earnings by Sex by Educational Attainment in Jersey City
Average earnings in Jersey City are $73,023 for men and $58,334 for women, a difference of 20.1%. Men with an educational attainment of graduate degree enjoy the highest average annual earnings of $121,060, while those with less than high school education earn the least with $33,856. Women with an educational attainment of graduate degree earn the most with the average annual earnings of $95,417, while those with less than high school education have the smallest earnings of $21,834.
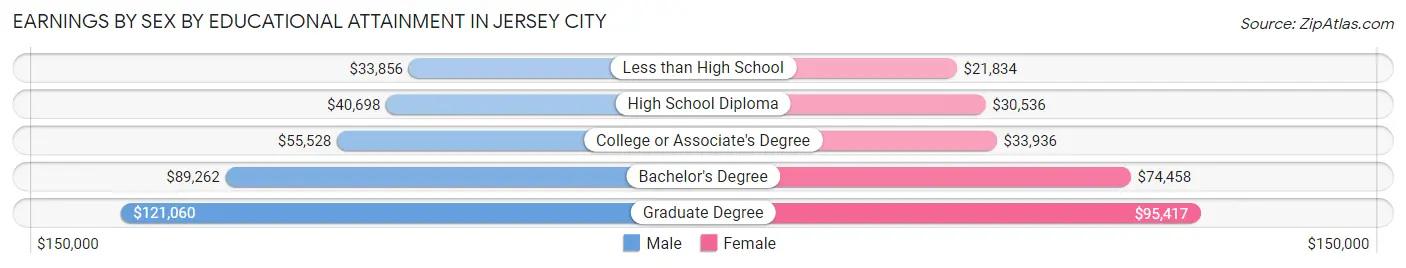
| Educational Attainment | Male Income | Female Income |
| Less than High School | $33,856 | $21,834 |
| High School Diploma | $40,698 | $30,536 |
| College or Associate's Degree | $55,528 | $33,936 |
| Bachelor's Degree | $89,262 | $74,458 |
| Graduate Degree | $121,060 | $95,417 |
| Total | $73,023 | $58,334 |
Family Income in Jersey City
Family Income Brackets in Jersey City
According to the Jersey City family income data, there are 15,551 families falling into the $200,000+ income range, which is the most common income bracket and makes up 23.0% of all families. Conversely, the $10,000 to $14,999 income bracket is the least frequent group with only 1,825 families (2.7%) belonging to this category.
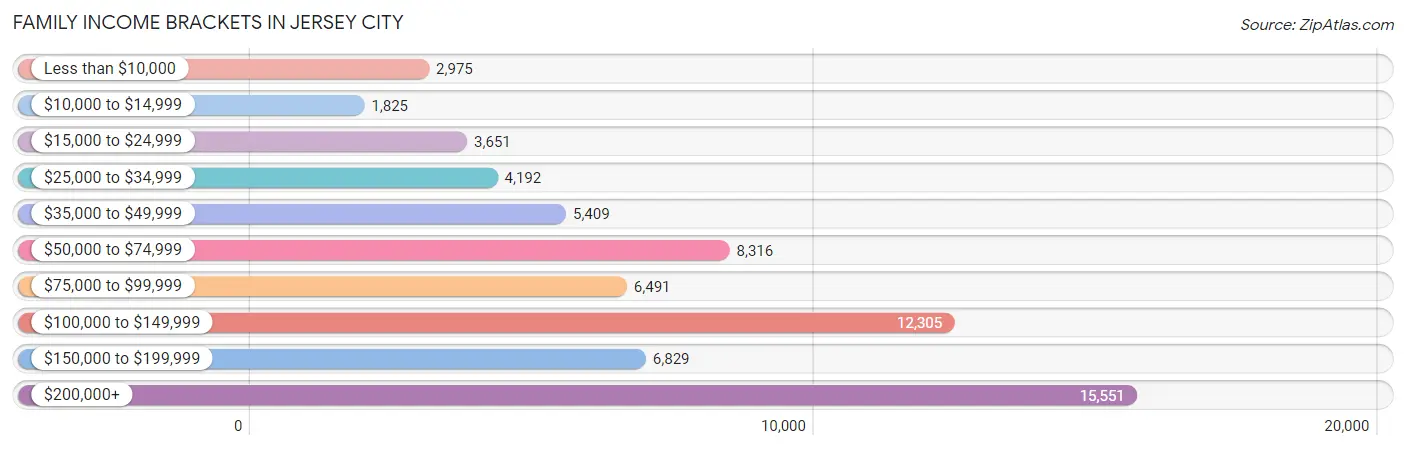
| Income Bracket | # Families | % Families |
| Less than $10,000 | 2,975 | 4.4% |
| $10,000 to $14,999 | 1,825 | 2.7% |
| $15,000 to $24,999 | 3,651 | 5.4% |
| $25,000 to $34,999 | 4,192 | 6.2% |
| $35,000 to $49,999 | 5,409 | 8.0% |
| $50,000 to $74,999 | 8,316 | 12.3% |
| $75,000 to $99,999 | 6,491 | 9.6% |
| $100,000 to $149,999 | 12,305 | 18.2% |
| $150,000 to $199,999 | 6,829 | 10.1% |
| $200,000+ | 15,551 | 23.0% |
Family Income by Famaliy Size in Jersey City
4-person families (12,593 | 18.6%) account for the highest median family income in Jersey City with $117,807 per family, while 2-person families (28,720 | 42.5%) have the highest median income of $46,991 per family member.
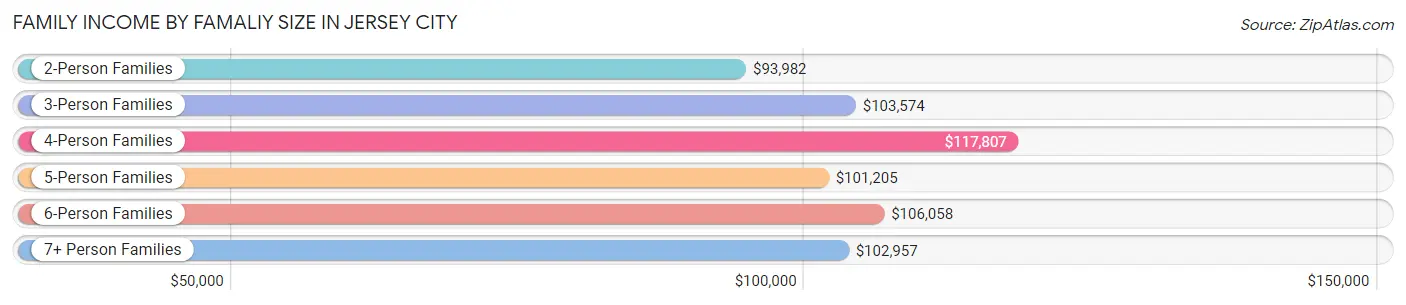
| Income Bracket | # Families | Median Income |
| 2-Person Families | 28,720 (42.5%) | $93,982 |
| 3-Person Families | 17,931 (26.5%) | $103,574 |
| 4-Person Families | 12,593 (18.6%) | $117,807 |
| 5-Person Families | 5,207 (7.7%) | $101,205 |
| 6-Person Families | 2,061 (3.0%) | $106,058 |
| 7+ Person Families | 1,099 (1.6%) | $102,957 |
| Total | 67,611 (100.0%) | $102,072 |
Family Income by Number of Earners in Jersey City
The median family income in Jersey City is $102,072, with families comprising 3+ earners (7,824) having the highest median family income of $149,406, while families with no earners (6,280) have the lowest median family income of $19,621, accounting for 11.6% and 9.3% of families, respectively.
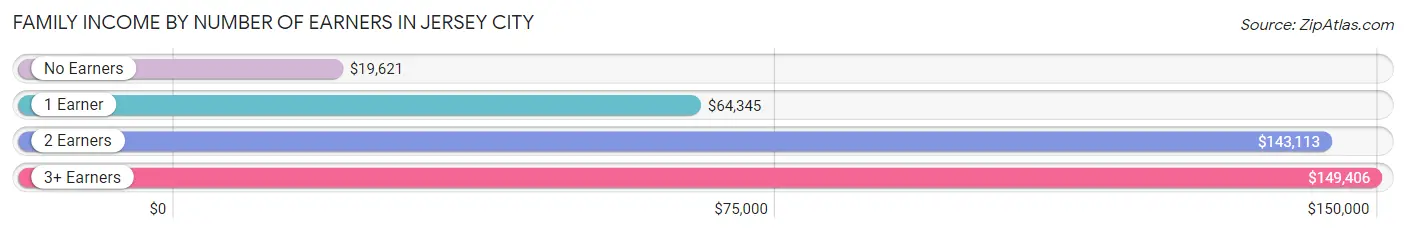
| Number of Earners | # Families | Median Income |
| No Earners | 6,280 (9.3%) | $19,621 |
| 1 Earner | 23,059 (34.1%) | $64,345 |
| 2 Earners | 30,448 (45.0%) | $143,113 |
| 3+ Earners | 7,824 (11.6%) | $149,406 |
| Total | 67,611 (100.0%) | $102,072 |
Household Income in Jersey City
Household Income Brackets in Jersey City
With 24,094 households falling in the category, the $200,000+ income range is the most frequent in Jersey City, accounting for 20.2% of all households. In contrast, only 5,964 households (5.0%) fall into the $10,000 to $14,999 income bracket, making it the least populous group.
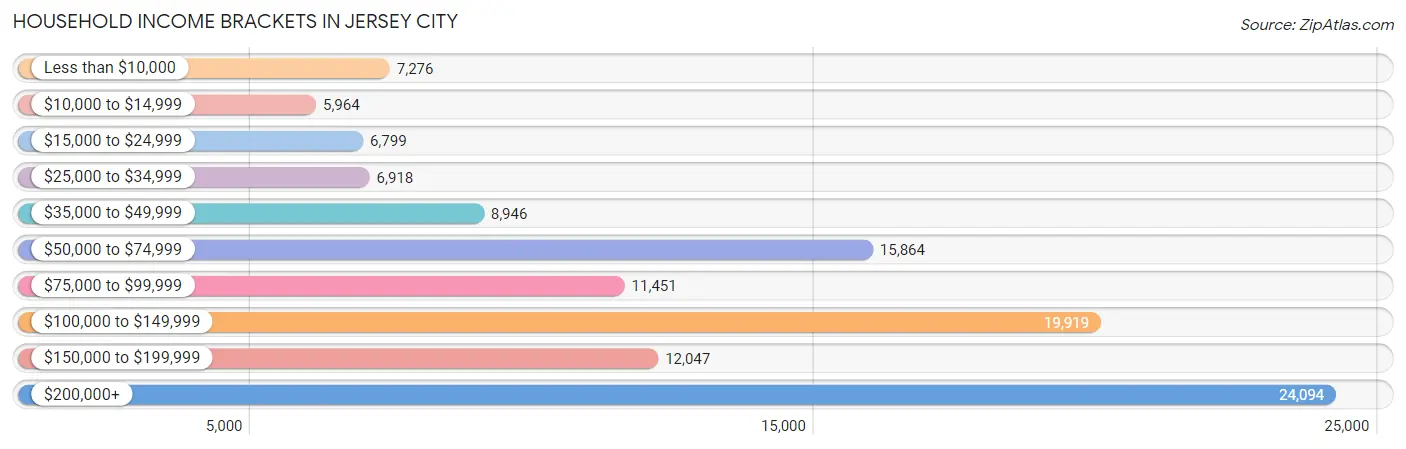
| Income Bracket | # Households | % Households |
| Less than $10,000 | 7,276 | 6.1% |
| $10,000 to $14,999 | 5,964 | 5.0% |
| $15,000 to $24,999 | 6,799 | 5.7% |
| $25,000 to $34,999 | 6,918 | 5.8% |
| $35,000 to $49,999 | 8,946 | 7.5% |
| $50,000 to $74,999 | 15,864 | 13.3% |
| $75,000 to $99,999 | 11,451 | 9.6% |
| $100,000 to $149,999 | 19,919 | 16.7% |
| $150,000 to $199,999 | 12,047 | 10.1% |
| $200,000+ | 24,094 | 20.2% |
Household Income by Householder Age in Jersey City
The median household income in Jersey City is $91,151, with the highest median household income of $124,399 found in the 25 to 44 years age bracket for the primary householder. A total of 59,096 households (49.5%) fall into this category. Meanwhile, the 65+ years age bracket for the primary householder has the lowest median household income of $39,717, with 20,431 households (17.1%) in this group.
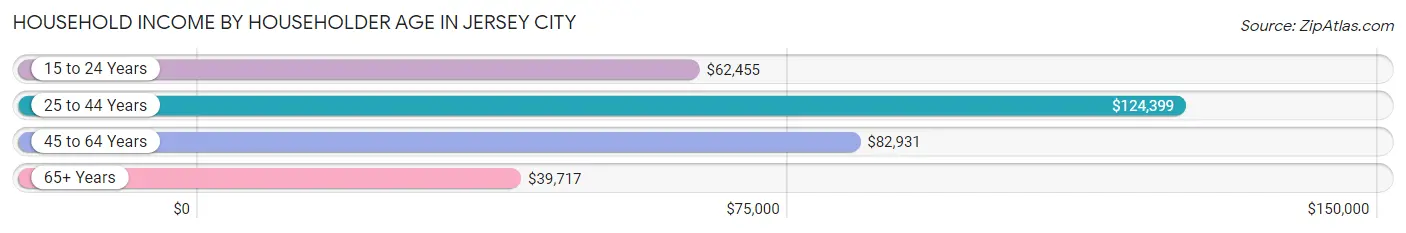
| Income Bracket | # Households | Median Income |
| 15 to 24 Years | 3,640 (3.0%) | $62,455 |
| 25 to 44 Years | 59,096 (49.5%) | $124,399 |
| 45 to 64 Years | 36,111 (30.3%) | $82,931 |
| 65+ Years | 20,431 (17.1%) | $39,717 |
| Total | 119,278 (100.0%) | $91,151 |
Poverty in Jersey City
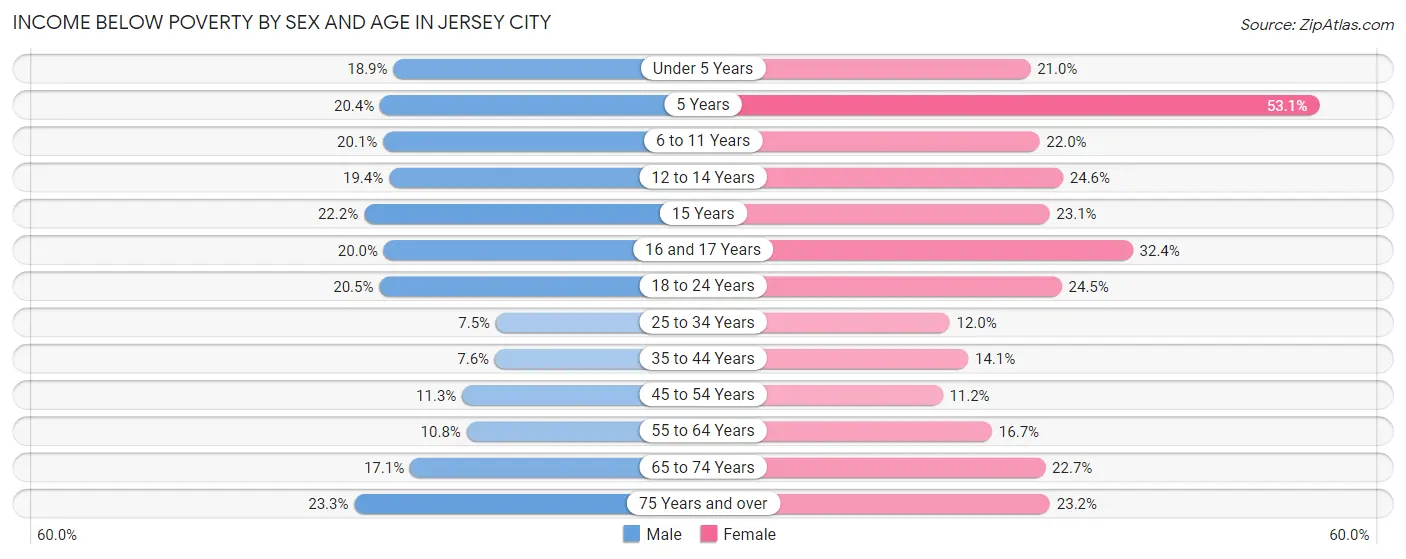
Income Below Poverty by Sex and Age in Jersey City
With 12.9% poverty level for males and 17.5% for females among the residents of Jersey City, 75 year old and over males and 5 year old females are the most vulnerable to poverty, with 1,144 males (23.3%) and 686 females (53.1%) in their respective age groups living below the poverty level.
| Age Bracket | Male | Female |
| Under 5 Years | 1,983 (18.9%) | 2,004 (21.0%) |
| 5 Years | 339 (20.4%) | 686 (53.1%) |
| 6 to 11 Years | 1,968 (20.1%) | 1,941 (22.0%) |
| 12 to 14 Years | 747 (19.4%) | 1,094 (24.6%) |
| 15 Years | 258 (22.2%) | 344 (23.1%) |
| 16 and 17 Years | 584 (20.0%) | 653 (32.4%) |
| 18 to 24 Years | 2,242 (20.5%) | 2,473 (24.5%) |
| 25 to 34 Years | 2,571 (7.5%) | 3,823 (12.0%) |
| 35 to 44 Years | 1,978 (7.6%) | 3,106 (14.1%) |
| 45 to 54 Years | 1,807 (11.3%) | 1,816 (11.2%) |
| 55 to 64 Years | 1,509 (10.8%) | 2,371 (16.7%) |
| 65 to 74 Years | 1,481 (17.1%) | 2,451 (22.7%) |
| 75 Years and over | 1,144 (23.3%) | 1,761 (23.2%) |
| Total | 18,611 (12.9%) | 24,523 (17.5%) |
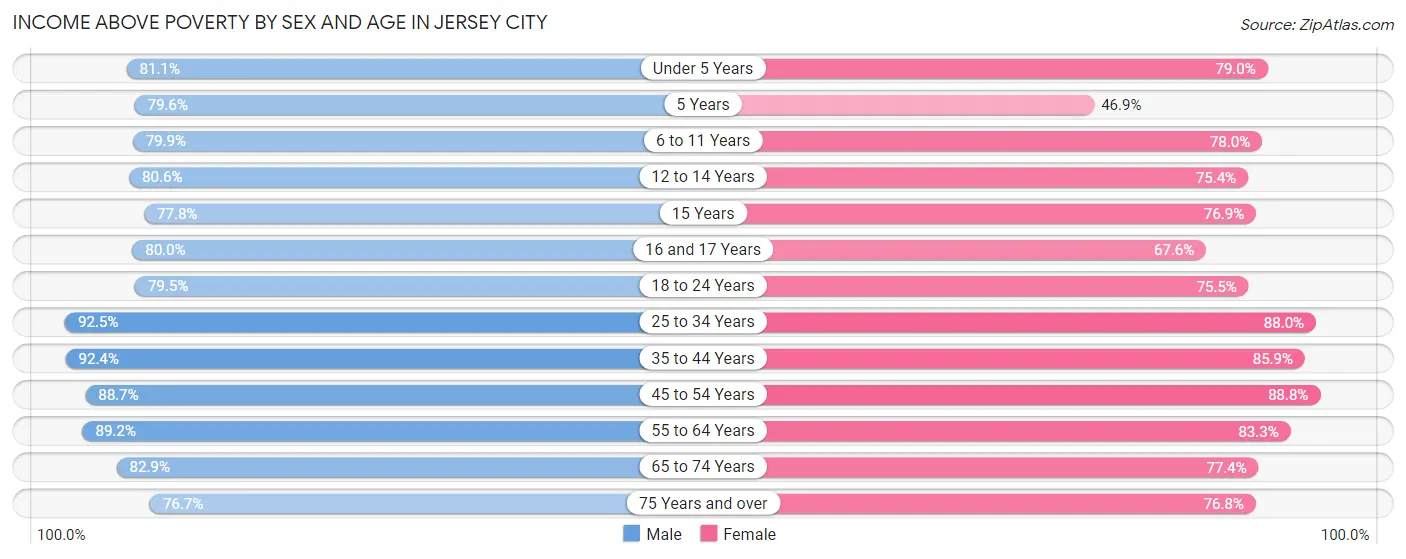
Income Above Poverty by Sex and Age in Jersey City
According to the poverty statistics in Jersey City, males aged 25 to 34 years and females aged 45 to 54 years are the age groups that are most secure financially, with 92.5% of males and 88.8% of females in these age groups living above the poverty line.
| Age Bracket | Male | Female |
| Under 5 Years | 8,491 (81.1%) | 7,547 (79.0%) |
| 5 Years | 1,322 (79.6%) | 605 (46.9%) |
| 6 to 11 Years | 7,837 (79.9%) | 6,879 (78.0%) |
| 12 to 14 Years | 3,102 (80.6%) | 3,349 (75.4%) |
| 15 Years | 904 (77.8%) | 1,144 (76.9%) |
| 16 and 17 Years | 2,337 (80.0%) | 1,363 (67.6%) |
| 18 to 24 Years | 8,696 (79.5%) | 7,631 (75.5%) |
| 25 to 34 Years | 31,665 (92.5%) | 28,032 (88.0%) |
| 35 to 44 Years | 23,992 (92.4%) | 18,981 (85.9%) |
| 45 to 54 Years | 14,221 (88.7%) | 14,389 (88.8%) |
| 55 to 64 Years | 12,498 (89.2%) | 11,810 (83.3%) |
| 65 to 74 Years | 7,190 (82.9%) | 8,371 (77.3%) |
| 75 Years and over | 3,770 (76.7%) | 5,839 (76.8%) |
| Total | 126,025 (87.1%) | 115,940 (82.5%) |
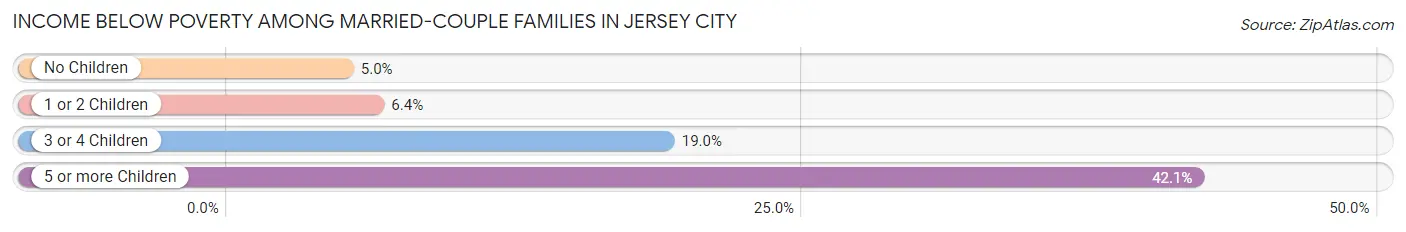
Income Below Poverty Among Married-Couple Families in Jersey City
The poverty statistics for married-couple families in Jersey City show that 6.6% or 3,015 of the total 45,751 families live below the poverty line. Families with 5 or more children have the highest poverty rate of 42.0%, comprising of 74 families. On the other hand, families with no children have the lowest poverty rate of 5.0%, which includes 1,229 families.
| Children | Above Poverty | Below Poverty |
| No Children | 23,148 (95.0%) | 1,229 (5.0%) |
| 1 or 2 Children | 17,173 (93.6%) | 1,169 (6.4%) |
| 3 or 4 Children | 2,313 (81.0%) | 543 (19.0%) |
| 5 or more Children | 102 (58.0%) | 74 (42.0%) |
| Total | 42,736 (93.4%) | 3,015 (6.6%) |
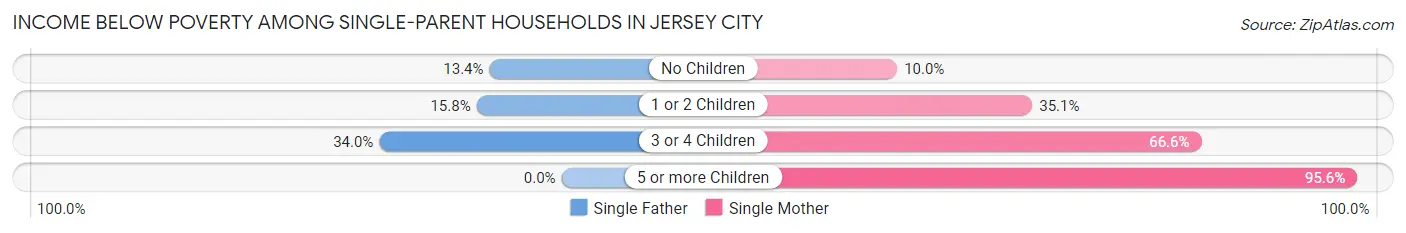
Income Below Poverty Among Single-Parent Households in Jersey City
According to the poverty data in Jersey City, 15.1% or 836 single-father households and 26.1% or 4,260 single-mother households are living below the poverty line. Among single-father households, those with 3 or 4 children have the highest poverty rate, with 92 households (34.0%) experiencing poverty. Likewise, among single-mother households, those with 5 or more children have the highest poverty rate, with 153 households (95.6%) falling below the poverty line.
| Children | Single Father | Single Mother |
| No Children | 488 (13.4%) | 745 (10.0%) |
| 1 or 2 Children | 256 (15.8%) | 2,716 (35.1%) |
| 3 or 4 Children | 92 (34.0%) | 646 (66.6%) |
| 5 or more Children | 0 (0.0%) | 153 (95.6%) |
| Total | 836 (15.1%) | 4,260 (26.1%) |
Income Below Poverty Among Married-Couple vs Single-Parent Households in Jersey City
The poverty data for Jersey City shows that 3,015 of the married-couple family households (6.6%) and 5,096 of the single-parent households (23.3%) are living below the poverty level. Within the married-couple family households, those with 5 or more children have the highest poverty rate, with 74 households (42.0%) falling below the poverty line. Among the single-parent households, those with 5 or more children have the highest poverty rate, with 153 household (95.6%) living below poverty.
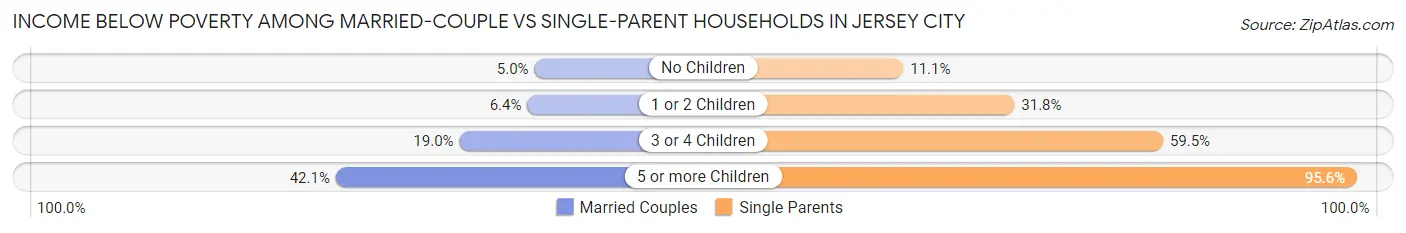
| Children | Married-Couple Families | Single-Parent Households |
| No Children | 1,229 (5.0%) | 1,233 (11.1%) |
| 1 or 2 Children | 1,169 (6.4%) | 2,972 (31.8%) |
| 3 or 4 Children | 543 (19.0%) | 738 (59.5%) |
| 5 or more Children | 74 (42.0%) | 153 (95.6%) |
| Total | 3,015 (6.6%) | 5,096 (23.3%) |
Employment Characteristics in Jersey City
Employment by Class of Employer in Jersey City
Among the 151,313 employed individuals in Jersey City, private company employees (114,264 | 75.5%), not-for-profit organizations (9,950 | 6.6%), and local government employees (8,728 | 5.8%) make up the most common classes of employment.
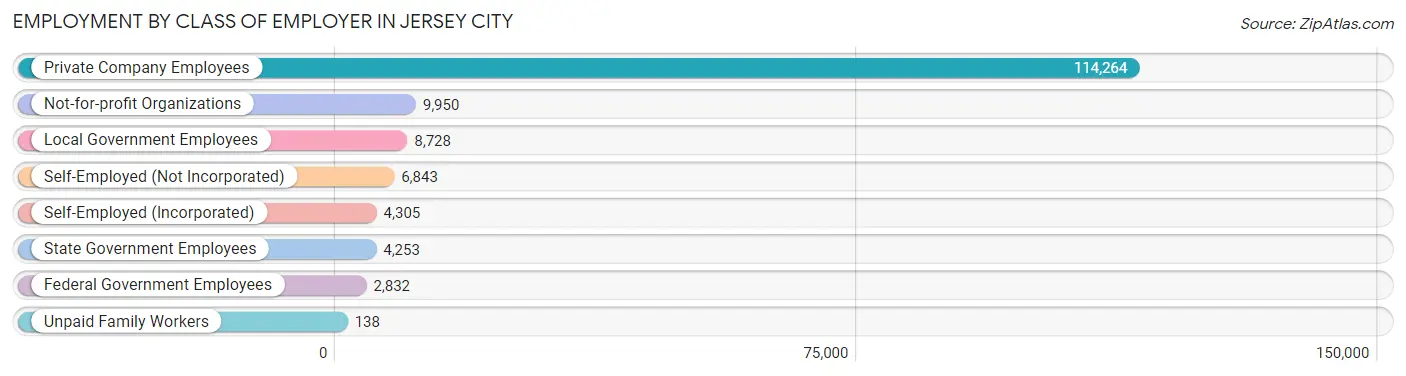
| Employer Class | # Employees | % Employees |
| Private Company Employees | 114,264 | 75.5% |
| Self-Employed (Incorporated) | 4,305 | 2.9% |
| Self-Employed (Not Incorporated) | 6,843 | 4.5% |
| Not-for-profit Organizations | 9,950 | 6.6% |
| Local Government Employees | 8,728 | 5.8% |
| State Government Employees | 4,253 | 2.8% |
| Federal Government Employees | 2,832 | 1.9% |
| Unpaid Family Workers | 138 | 0.1% |
| Total | 151,313 | 100.0% |
Employment Status by Age in Jersey City
According to the labor force statistics for Jersey City, out of the total population over 16 years of age (234,410), 69.8% or 163,618 individuals are in the labor force, with 5.8% or 9,490 of them unemployed. The age group with the highest labor force participation rate is 30 to 34 years, with 87.5% or 30,270 individuals in the labor force. Within the labor force, the 16 to 19 years age range has the highest percentage of unemployed individuals, with 15.5% or 298 of them being unemployed.
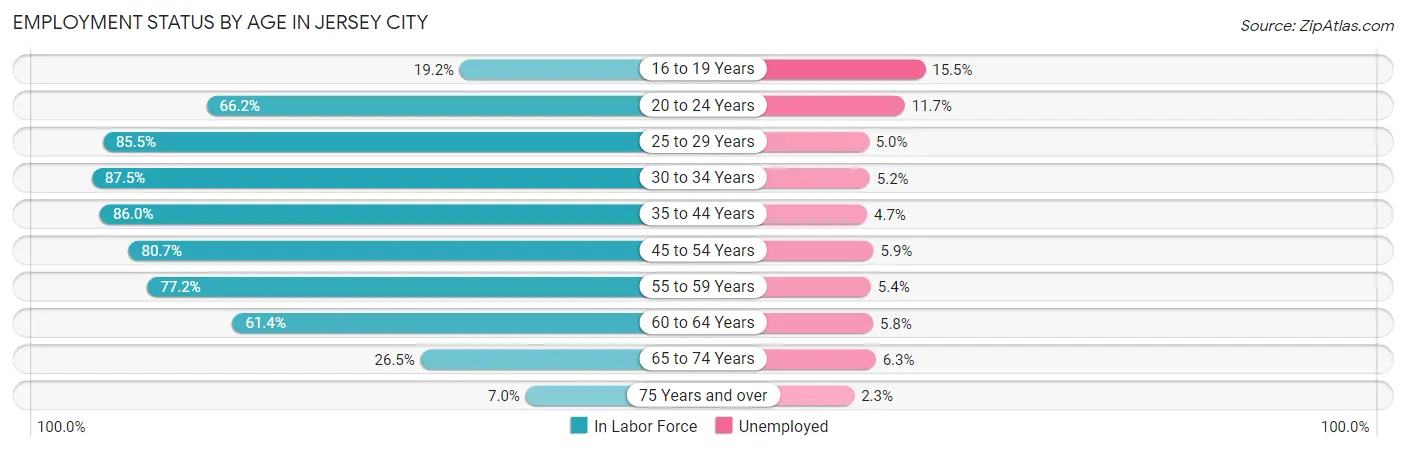
| Age Bracket | In Labor Force | Unemployed |
| 16 to 19 Years | 1,922 (19.2%) | 298 (15.5%) |
| 20 to 24 Years | 11,224 (66.2%) | 1,313 (11.7%) |
| 25 to 29 Years | 26,930 (85.5%) | 1,346 (5.0%) |
| 30 to 34 Years | 30,270 (87.5%) | 1,574 (5.2%) |
| 35 to 44 Years | 41,333 (86.0%) | 1,943 (4.7%) |
| 45 to 54 Years | 26,073 (80.7%) | 1,538 (5.9%) |
| 55 to 59 Years | 12,137 (77.2%) | 655 (5.4%) |
| 60 to 64 Years | 7,731 (61.4%) | 448 (5.8%) |
| 65 to 74 Years | 5,208 (26.5%) | 328 (6.3%) |
| 75 Years and over | 911 (7.0%) | 21 (2.3%) |
| Total | 163,618 (69.8%) | 9,490 (5.8%) |
Employment Status by Educational Attainment in Jersey City
According to labor force statistics for Jersey City, 82.7% of individuals (144,539) out of the total population between 25 and 64 years of age (174,775) are in the labor force, with 5.2% or 7,516 of them being unemployed. The group with the highest labor force participation rate are those with the educational attainment of bachelor's degree or higher, with 89.3% or 87,994 individuals in the labor force. Within the labor force, individuals with high school diploma education have the highest percentage of unemployment, with 8.6% or 2,135 of them being unemployed.
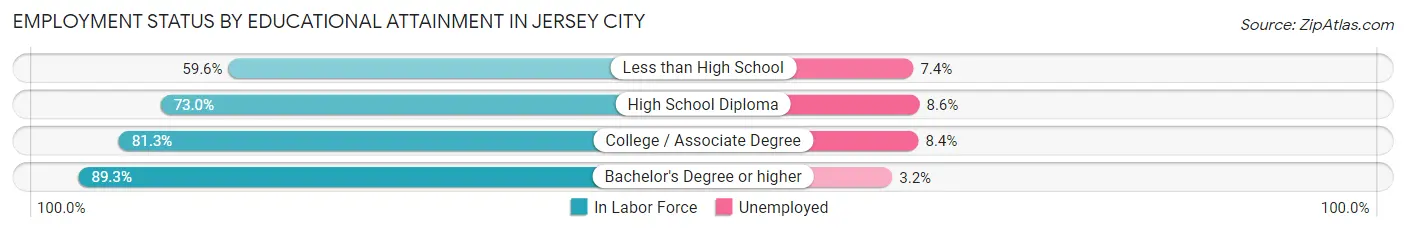
| Educational Attainment | In Labor Force | Unemployed |
| Less than High School | 7,487 (59.6%) | 930 (7.4%) |
| High School Diploma | 24,820 (73.0%) | 2,924 (8.6%) |
| College / Associate Degree | 24,126 (81.3%) | 2,493 (8.4%) |
| Bachelor's Degree or higher | 87,994 (89.3%) | 3,153 (3.2%) |
| Total | 144,539 (82.7%) | 9,088 (5.2%) |
Employment Occupations by Sex in Jersey City
Management, Business, Science and Arts Occupations
The most common Management, Business, Science and Arts occupations in Jersey City are Computers, Engineering & Science (20,918 | 13.6%), Community & Social Service (20,554 | 13.3%), Management (18,924 | 12.3%), Business & Financial (16,507 | 10.7%), and Computers & Mathematics (15,272 | 9.9%).

Management, Business, Science and Arts Occupations by Sex
Within the Management, Business, Science and Arts occupations in Jersey City, the most male-oriented occupations are Architecture & Engineering (81.3%), Computers & Mathematics (76.3%), and Computers, Engineering & Science (75.7%), while the most female-oriented occupations are Education, Arts & Media (72.0%), Health Diagnosing & Treating (66.3%), and Health Technologists (66.1%).
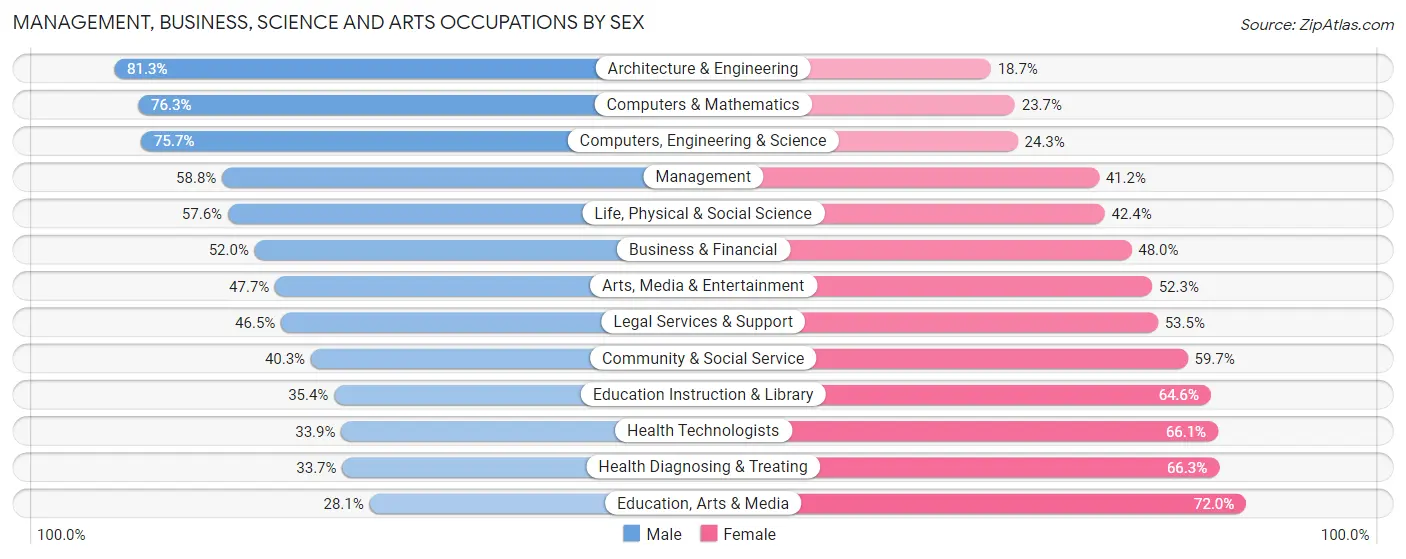
| Occupation | Male | Female |
| Management | 11,125 (58.8%) | 7,799 (41.2%) |
| Business & Financial | 8,582 (52.0%) | 7,925 (48.0%) |
| Computers, Engineering & Science | 15,837 (75.7%) | 5,081 (24.3%) |
| Computers & Mathematics | 11,652 (76.3%) | 3,620 (23.7%) |
| Architecture & Engineering | 3,199 (81.3%) | 735 (18.7%) |
| Life, Physical & Social Science | 986 (57.6%) | 726 (42.4%) |
| Community & Social Service | 8,278 (40.3%) | 12,276 (59.7%) |
| Education, Arts & Media | 587 (28.1%) | 1,506 (72.0%) |
| Legal Services & Support | 1,545 (46.5%) | 1,779 (53.5%) |
| Education Instruction & Library | 3,102 (35.4%) | 5,657 (64.6%) |
| Arts, Media & Entertainment | 3,044 (47.7%) | 3,334 (52.3%) |
| Health Diagnosing & Treating | 2,240 (33.7%) | 4,404 (66.3%) |
| Health Technologists | 1,567 (33.9%) | 3,052 (66.1%) |
| Total (Category) | 46,062 (55.1%) | 37,485 (44.9%) |
| Total (Overall) | 86,429 (56.0%) | 67,781 (44.0%) |
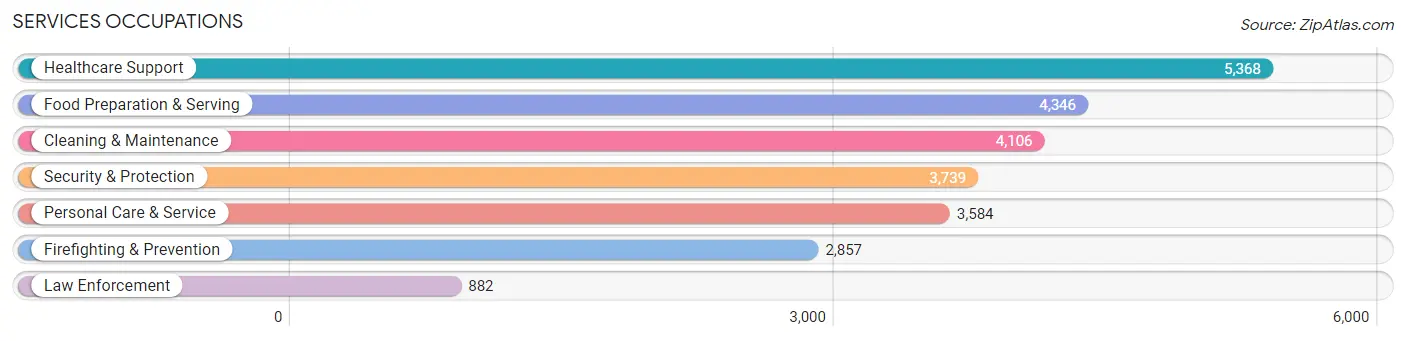
Services Occupations
The most common Services occupations in Jersey City are Healthcare Support (5,368 | 3.5%), Food Preparation & Serving (4,346 | 2.8%), Cleaning & Maintenance (4,106 | 2.7%), Security & Protection (3,739 | 2.4%), and Personal Care & Service (3,584 | 2.3%).
Services Occupations by Sex
Within the Services occupations in Jersey City, the most male-oriented occupations are Firefighting & Prevention (70.9%), Security & Protection (68.9%), and Law Enforcement (62.4%), while the most female-oriented occupations are Healthcare Support (87.3%), Personal Care & Service (68.9%), and Cleaning & Maintenance (51.4%).
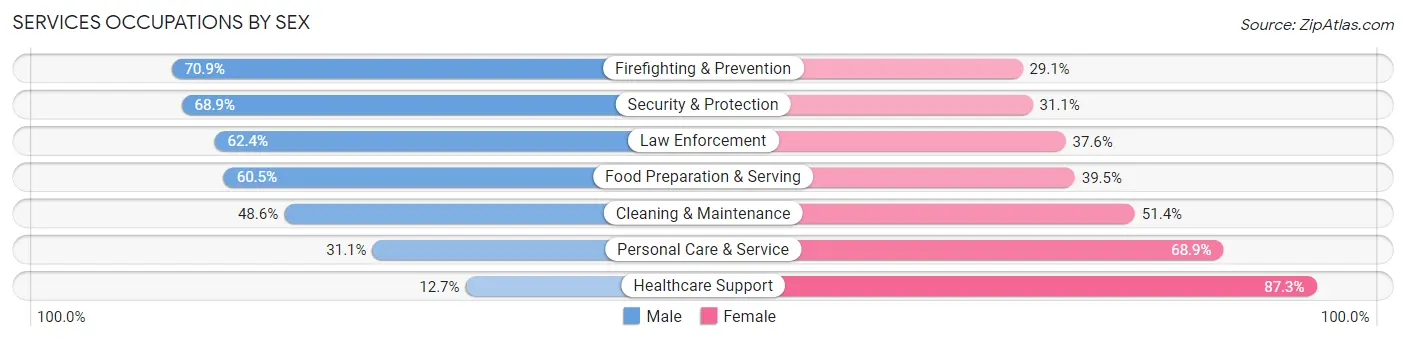
| Occupation | Male | Female |
| Healthcare Support | 683 (12.7%) | 4,685 (87.3%) |
| Security & Protection | 2,576 (68.9%) | 1,163 (31.1%) |
| Firefighting & Prevention | 2,026 (70.9%) | 831 (29.1%) |
| Law Enforcement | 550 (62.4%) | 332 (37.6%) |
| Food Preparation & Serving | 2,631 (60.5%) | 1,715 (39.5%) |
| Cleaning & Maintenance | 1,997 (48.6%) | 2,109 (51.4%) |
| Personal Care & Service | 1,116 (31.1%) | 2,468 (68.9%) |
| Total (Category) | 9,003 (42.6%) | 12,140 (57.4%) |
| Total (Overall) | 86,429 (56.0%) | 67,781 (44.0%) |
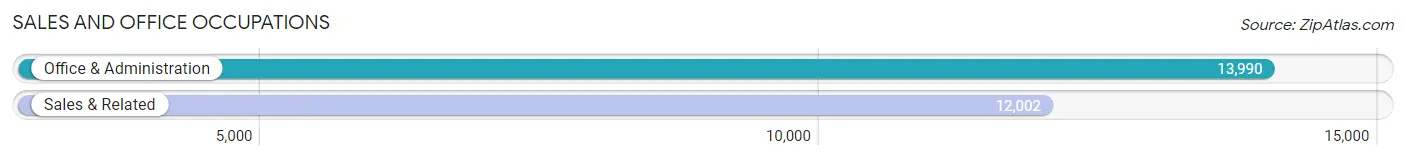
Sales and Office Occupations
The most common Sales and Office occupations in Jersey City are Office & Administration (13,990 | 9.1%), and Sales & Related (12,002 | 7.8%).
Sales and Office Occupations by Sex
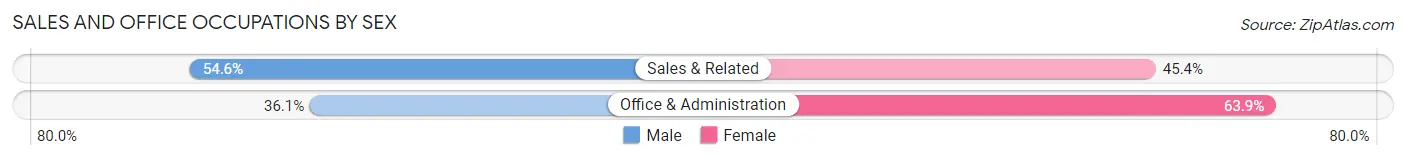
| Occupation | Male | Female |
| Sales & Related | 6,549 (54.6%) | 5,453 (45.4%) |
| Office & Administration | 5,048 (36.1%) | 8,942 (63.9%) |
| Total (Category) | 11,597 (44.6%) | 14,395 (55.4%) |
| Total (Overall) | 86,429 (56.0%) | 67,781 (44.0%) |
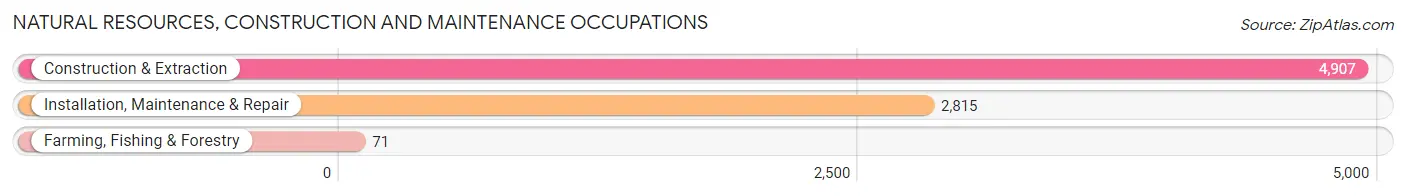
Natural Resources, Construction and Maintenance Occupations
The most common Natural Resources, Construction and Maintenance occupations in Jersey City are Construction & Extraction (4,907 | 3.2%), Installation, Maintenance & Repair (2,815 | 1.8%), and Farming, Fishing & Forestry (71 | 0.1%).
Natural Resources, Construction and Maintenance Occupations by Sex
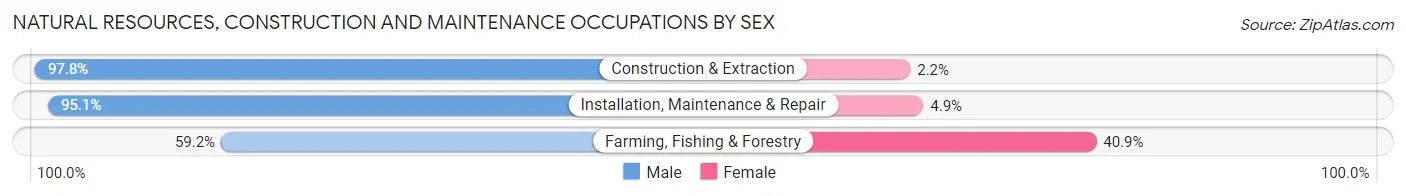
| Occupation | Male | Female |
| Farming, Fishing & Forestry | 42 (59.2%) | 29 (40.8%) |
| Construction & Extraction | 4,801 (97.8%) | 106 (2.2%) |
| Installation, Maintenance & Repair | 2,678 (95.1%) | 137 (4.9%) |
| Total (Category) | 7,521 (96.5%) | 272 (3.5%) |
| Total (Overall) | 86,429 (56.0%) | 67,781 (44.0%) |
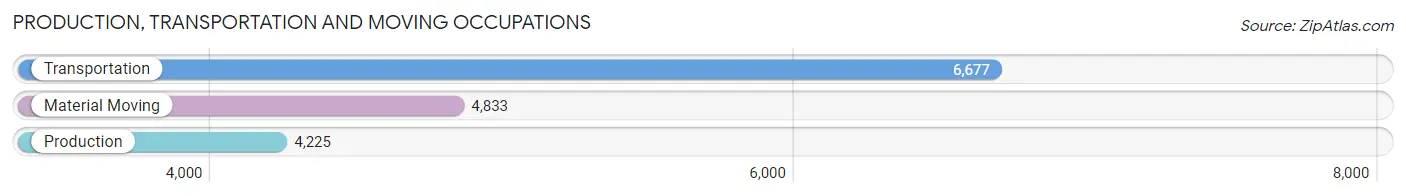
Production, Transportation and Moving Occupations
The most common Production, Transportation and Moving occupations in Jersey City are Transportation (6,677 | 4.3%), Material Moving (4,833 | 3.1%), and Production (4,225 | 2.7%).
Production, Transportation and Moving Occupations by Sex
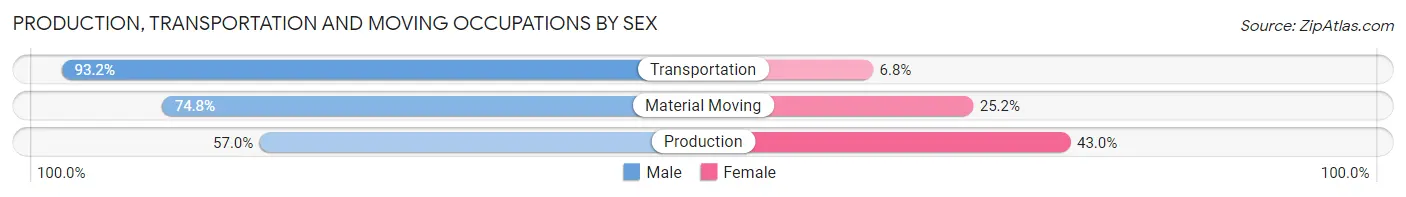
| Occupation | Male | Female |
| Production | 2,407 (57.0%) | 1,818 (43.0%) |
| Transportation | 6,223 (93.2%) | 454 (6.8%) |
| Material Moving | 3,616 (74.8%) | 1,217 (25.2%) |
| Total (Category) | 12,246 (77.8%) | 3,489 (22.2%) |
| Total (Overall) | 86,429 (56.0%) | 67,781 (44.0%) |
Employment Industries by Sex in Jersey City
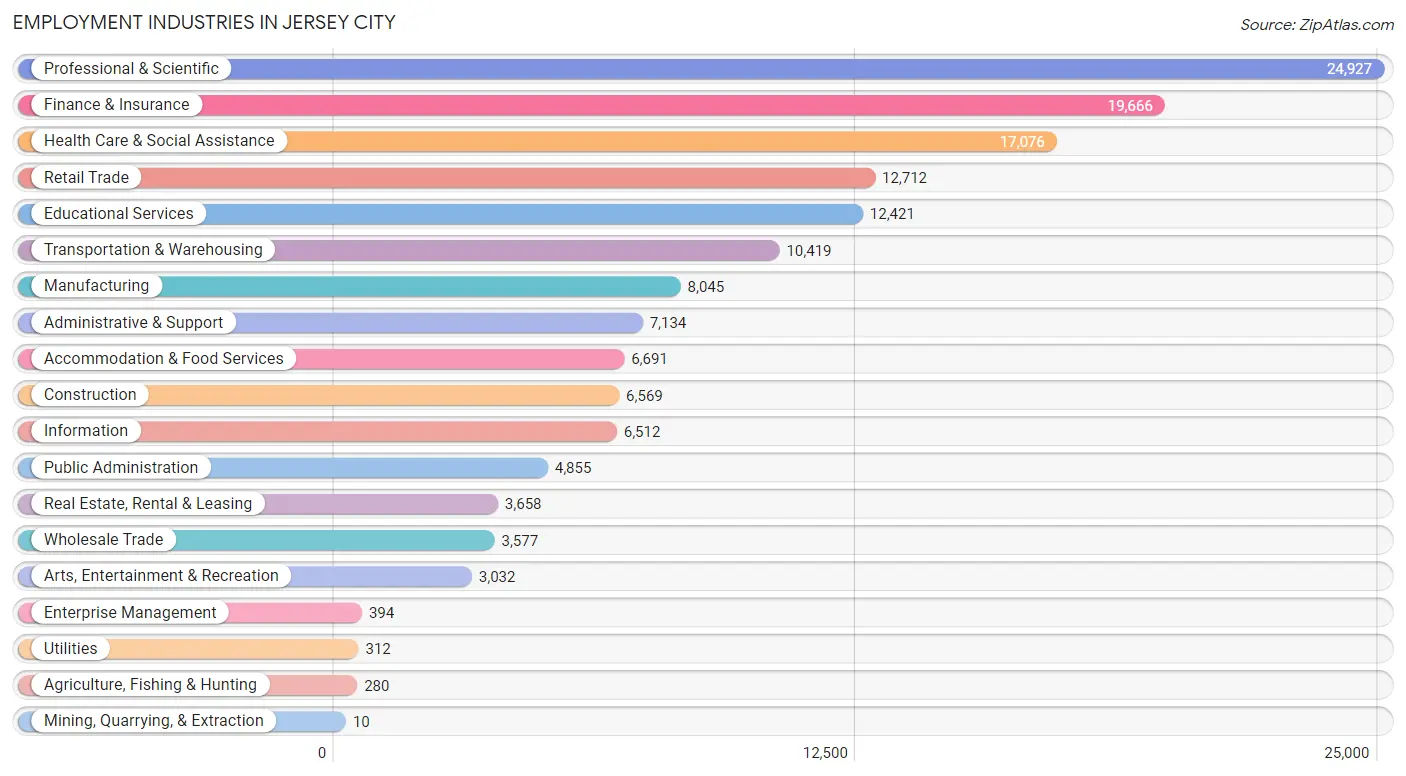
Employment Industries in Jersey City
The major employment industries in Jersey City include Professional & Scientific (24,927 | 16.2%), Finance & Insurance (19,666 | 12.8%), Health Care & Social Assistance (17,076 | 11.1%), Retail Trade (12,712 | 8.2%), and Educational Services (12,421 | 8.1%).
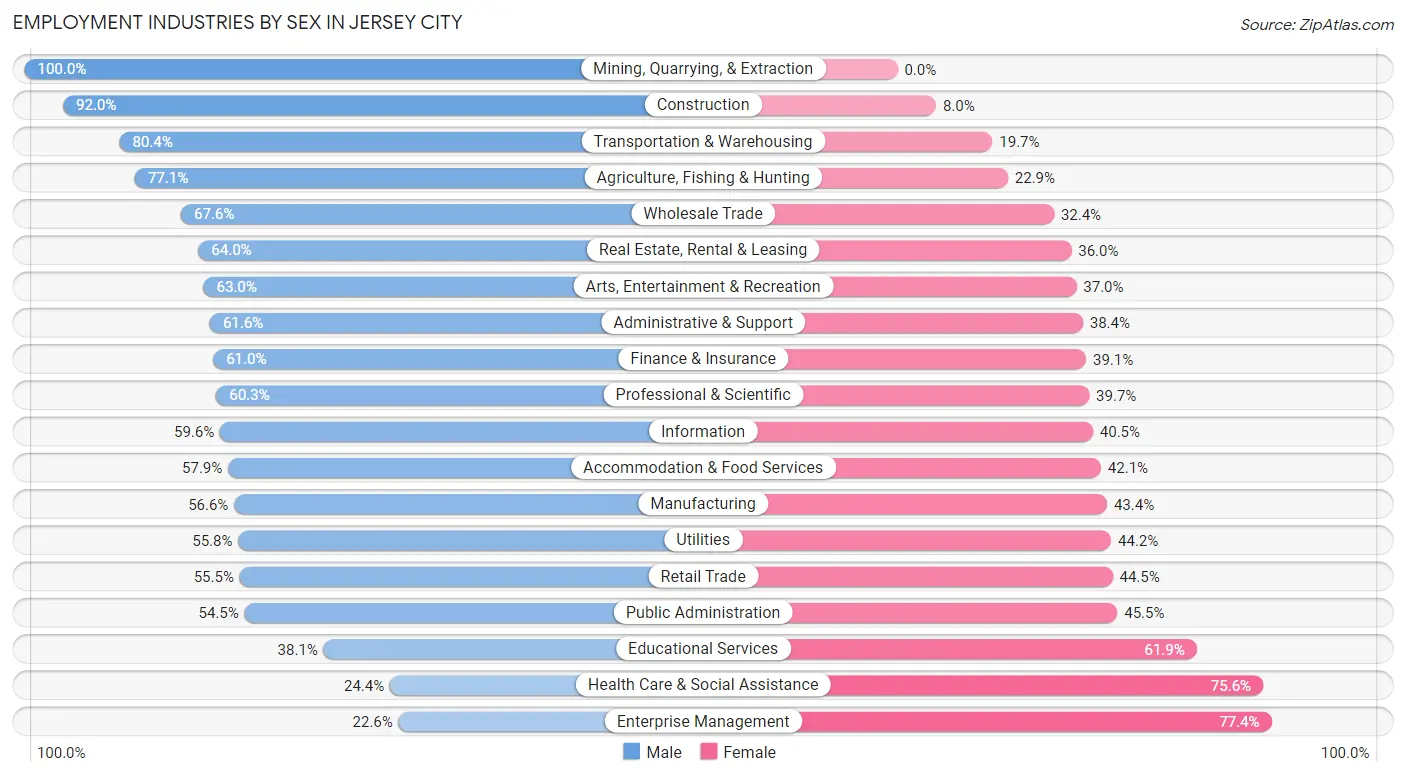
Employment Industries by Sex in Jersey City
The Jersey City industries that see more men than women are Mining, Quarrying, & Extraction (100.0%), Construction (92.0%), and Transportation & Warehousing (80.3%), whereas the industries that tend to have a higher number of women are Enterprise Management (77.4%), Health Care & Social Assistance (75.6%), and Educational Services (61.9%).
| Industry | Male | Female |
| Agriculture, Fishing & Hunting | 216 (77.1%) | 64 (22.9%) |
| Mining, Quarrying, & Extraction | 10 (100.0%) | 0 (0.0%) |
| Construction | 6,045 (92.0%) | 524 (8.0%) |
| Manufacturing | 4,555 (56.6%) | 3,490 (43.4%) |
| Wholesale Trade | 2,418 (67.6%) | 1,159 (32.4%) |
| Retail Trade | 7,051 (55.5%) | 5,661 (44.5%) |
| Transportation & Warehousing | 8,372 (80.3%) | 2,047 (19.7%) |
| Utilities | 174 (55.8%) | 138 (44.2%) |
| Information | 3,878 (59.6%) | 2,634 (40.5%) |
| Finance & Insurance | 11,987 (61.0%) | 7,679 (39.1%) |
| Real Estate, Rental & Leasing | 2,342 (64.0%) | 1,316 (36.0%) |
| Professional & Scientific | 15,034 (60.3%) | 9,893 (39.7%) |
| Enterprise Management | 89 (22.6%) | 305 (77.4%) |
| Administrative & Support | 4,397 (61.6%) | 2,737 (38.4%) |
| Educational Services | 4,732 (38.1%) | 7,689 (61.9%) |
| Health Care & Social Assistance | 4,159 (24.4%) | 12,917 (75.6%) |
| Arts, Entertainment & Recreation | 1,909 (63.0%) | 1,123 (37.0%) |
| Accommodation & Food Services | 3,873 (57.9%) | 2,818 (42.1%) |
| Public Administration | 2,645 (54.5%) | 2,210 (45.5%) |
| Total | 86,429 (56.0%) | 67,781 (44.0%) |
Education in Jersey City
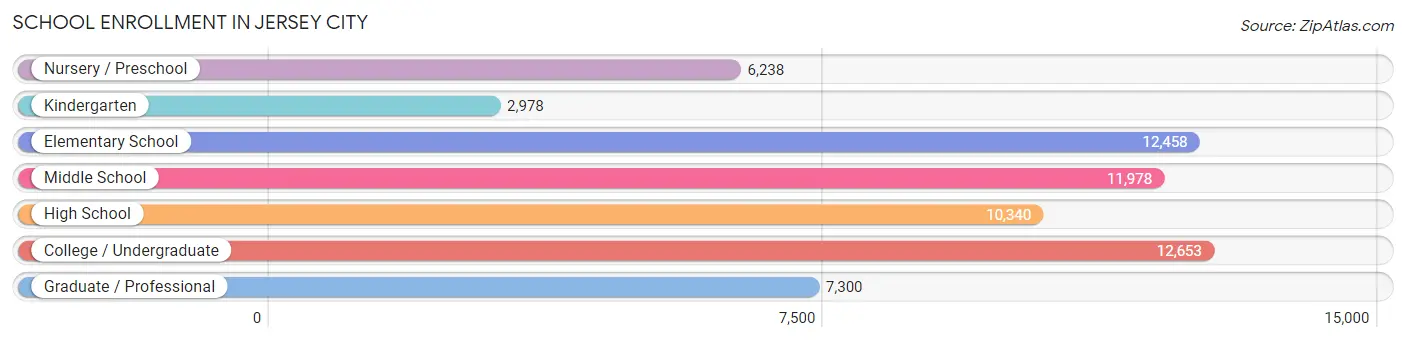
School Enrollment in Jersey City
The most common levels of schooling among the 63,945 students in Jersey City are college / undergraduate (12,653 | 19.8%), elementary school (12,458 | 19.5%), and middle school (11,978 | 18.7%).
| School Level | # Students | % Students |
| Nursery / Preschool | 6,238 | 9.8% |
| Kindergarten | 2,978 | 4.7% |
| Elementary School | 12,458 | 19.5% |
| Middle School | 11,978 | 18.7% |
| High School | 10,340 | 16.2% |
| College / Undergraduate | 12,653 | 19.8% |
| Graduate / Professional | 7,300 | 11.4% |
| Total | 63,945 | 100.0% |
School Enrollment by Age by Funding Source in Jersey City
Out of a total of 63,945 students who are enrolled in schools in Jersey City, 13,748 (21.5%) attend a private institution, while the remaining 50,197 (78.5%) are enrolled in public schools. The age group of 35 years and over has the highest likelihood of being enrolled in private schools, with 1,599 (46.7% in the age bracket) enrolled. Conversely, the age group of 10 to 14 year olds has the lowest likelihood of being enrolled in a private school, with 12,742 (89.1% in the age bracket) attending a public institution.
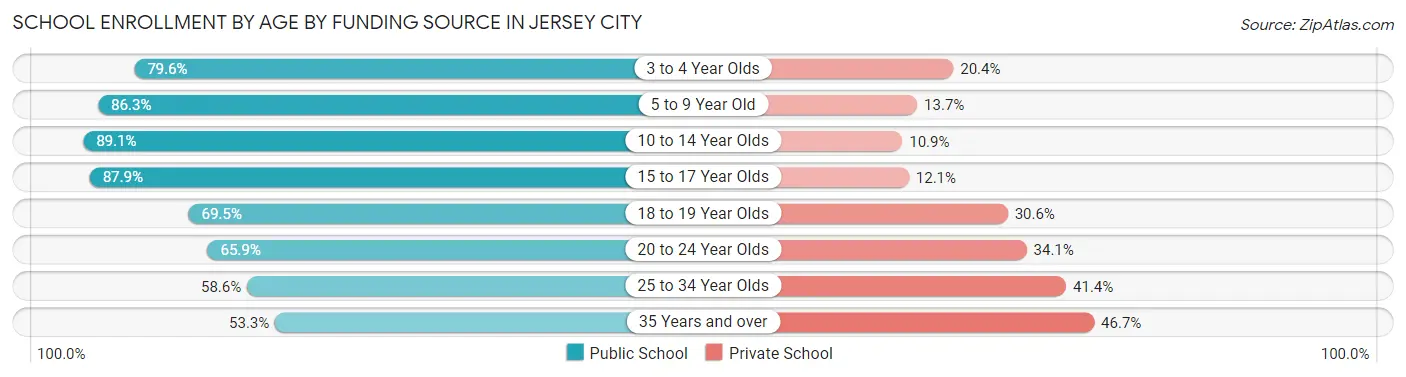
| Age Bracket | Public School | Private School |
| 3 to 4 Year Olds | 4,652 (79.6%) | 1,194 (20.4%) |
| 5 to 9 Year Old | 12,947 (86.3%) | 2,053 (13.7%) |
| 10 to 14 Year Olds | 12,742 (89.1%) | 1,562 (10.9%) |
| 15 to 17 Year Olds | 6,490 (87.9%) | 897 (12.1%) |
| 18 to 19 Year Olds | 2,801 (69.5%) | 1,232 (30.5%) |
| 20 to 24 Year Olds | 4,993 (65.9%) | 2,581 (34.1%) |
| 25 to 34 Year Olds | 3,733 (58.6%) | 2,641 (41.4%) |
| 35 Years and over | 1,828 (53.3%) | 1,599 (46.7%) |
| Total | 50,197 (78.5%) | 13,748 (21.5%) |
Educational Attainment by Field of Study in Jersey City
Business (24,628 | 21.0%), engineering (14,500 | 12.4%), computers & mathematics (12,796 | 10.9%), social sciences (11,212 | 9.6%), and science & technology (9,034 | 7.7%) are the most common fields of study among 117,305 individuals in Jersey City who have obtained a bachelor's degree or higher.
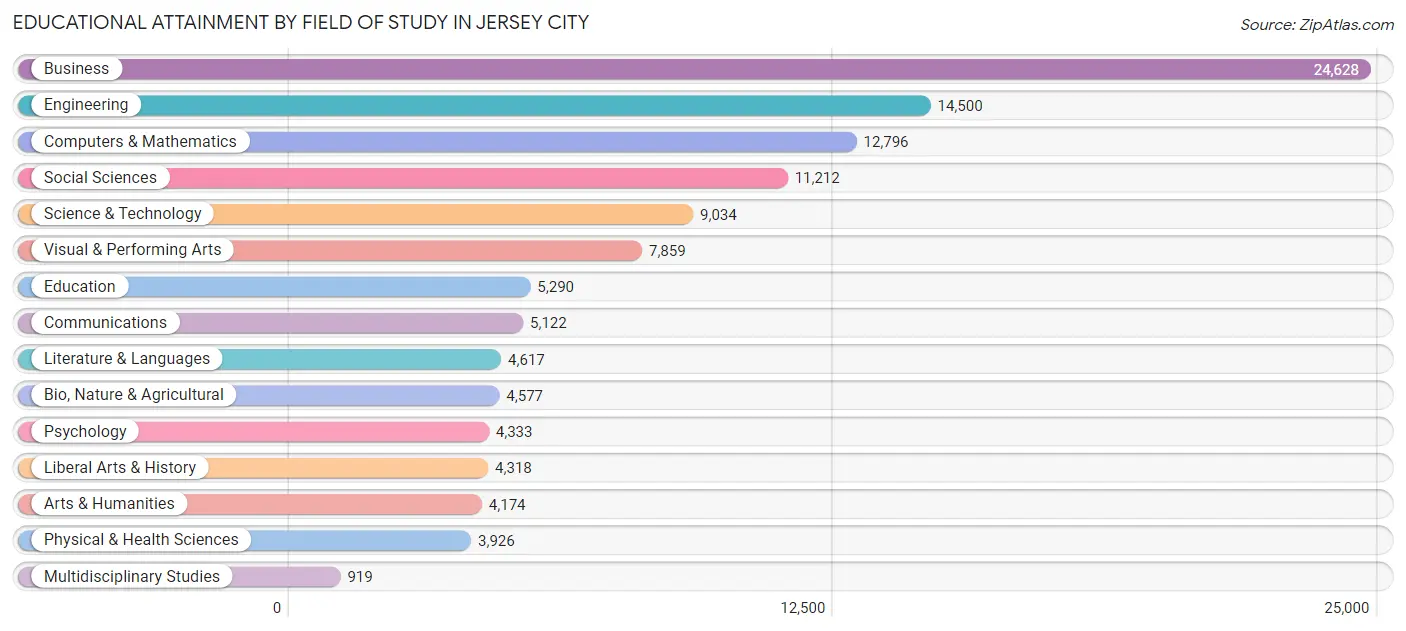
| Field of Study | # Graduates | % Graduates |
| Computers & Mathematics | 12,796 | 10.9% |
| Bio, Nature & Agricultural | 4,577 | 3.9% |
| Physical & Health Sciences | 3,926 | 3.4% |
| Psychology | 4,333 | 3.7% |
| Social Sciences | 11,212 | 9.6% |
| Engineering | 14,500 | 12.4% |
| Multidisciplinary Studies | 919 | 0.8% |
| Science & Technology | 9,034 | 7.7% |
| Business | 24,628 | 21.0% |
| Education | 5,290 | 4.5% |
| Literature & Languages | 4,617 | 3.9% |
| Liberal Arts & History | 4,318 | 3.7% |
| Visual & Performing Arts | 7,859 | 6.7% |
| Communications | 5,122 | 4.4% |
| Arts & Humanities | 4,174 | 3.6% |
| Total | 117,305 | 100.0% |
Transportation & Commute in Jersey City
Vehicle Availability by Sex in Jersey City
The most prevalent vehicle ownership categories in Jersey City are males with 1 vehicle (36,455, accounting for 43.0%) and females with 1 vehicle (30,166, making up 55.1%).
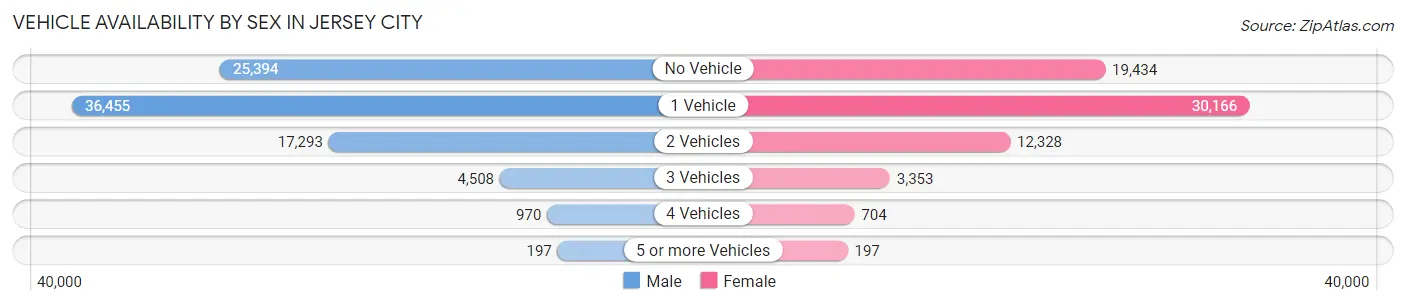
| Vehicles Available | Male | Female |
| No Vehicle | 25,394 (29.9%) | 19,434 (29.4%) |
| 1 Vehicle | 36,455 (43.0%) | 30,166 (45.6%) |
| 2 Vehicles | 17,293 (20.4%) | 12,328 (18.6%) |
| 3 Vehicles | 4,508 (5.3%) | 3,353 (5.1%) |
| 4 Vehicles | 970 (1.1%) | 704 (1.1%) |
| 5 or more Vehicles | 197 (0.2%) | 197 (0.3%) |
| Total | 84,817 (100.0%) | 66,182 (100.0%) |
Commute Time in Jersey City
The most frequently occuring commute durations in Jersey City are 45 to 59 minutes (22,870 commuters, 18.6%), 30 to 34 minutes (20,825 commuters, 16.9%), and 60 to 89 minutes (16,713 commuters, 13.6%).
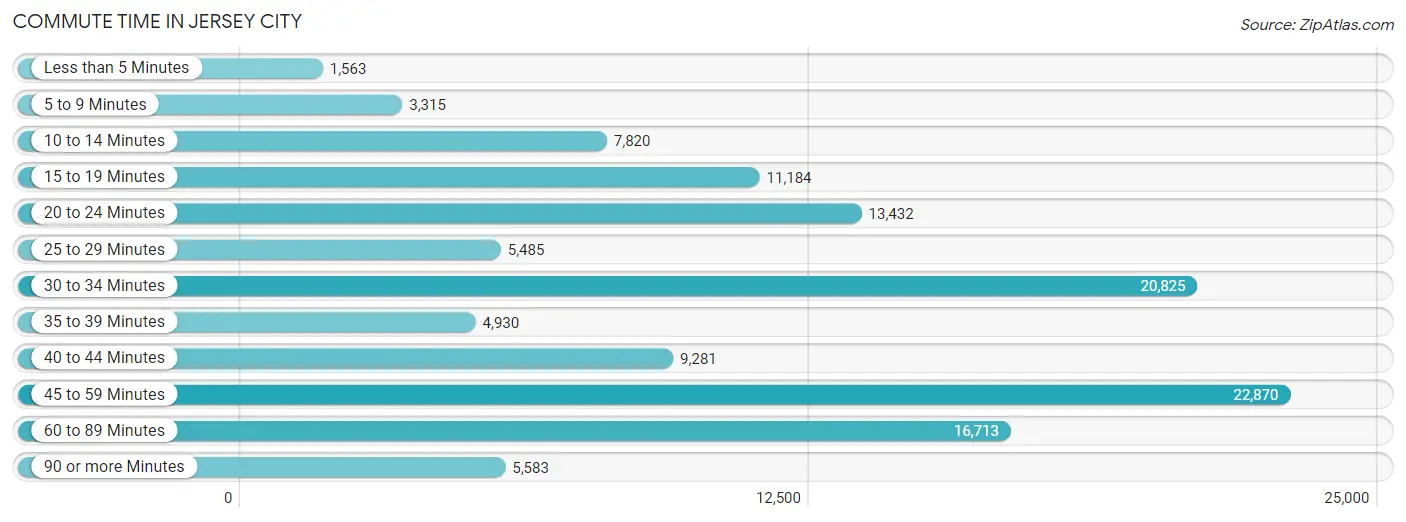
| Commute Time | # Commuters | % Commuters |
| Less than 5 Minutes | 1,563 | 1.3% |
| 5 to 9 Minutes | 3,315 | 2.7% |
| 10 to 14 Minutes | 7,820 | 6.4% |
| 15 to 19 Minutes | 11,184 | 9.1% |
| 20 to 24 Minutes | 13,432 | 10.9% |
| 25 to 29 Minutes | 5,485 | 4.5% |
| 30 to 34 Minutes | 20,825 | 16.9% |
| 35 to 39 Minutes | 4,930 | 4.0% |
| 40 to 44 Minutes | 9,281 | 7.5% |
| 45 to 59 Minutes | 22,870 | 18.6% |
| 60 to 89 Minutes | 16,713 | 13.6% |
| 90 or more Minutes | 5,583 | 4.5% |
Commute Time by Sex in Jersey City
The most common commute times in Jersey City are 45 to 59 minutes (13,787 commuters, 19.8%) for males and 45 to 59 minutes (9,083 commuters, 17.0%) for females.
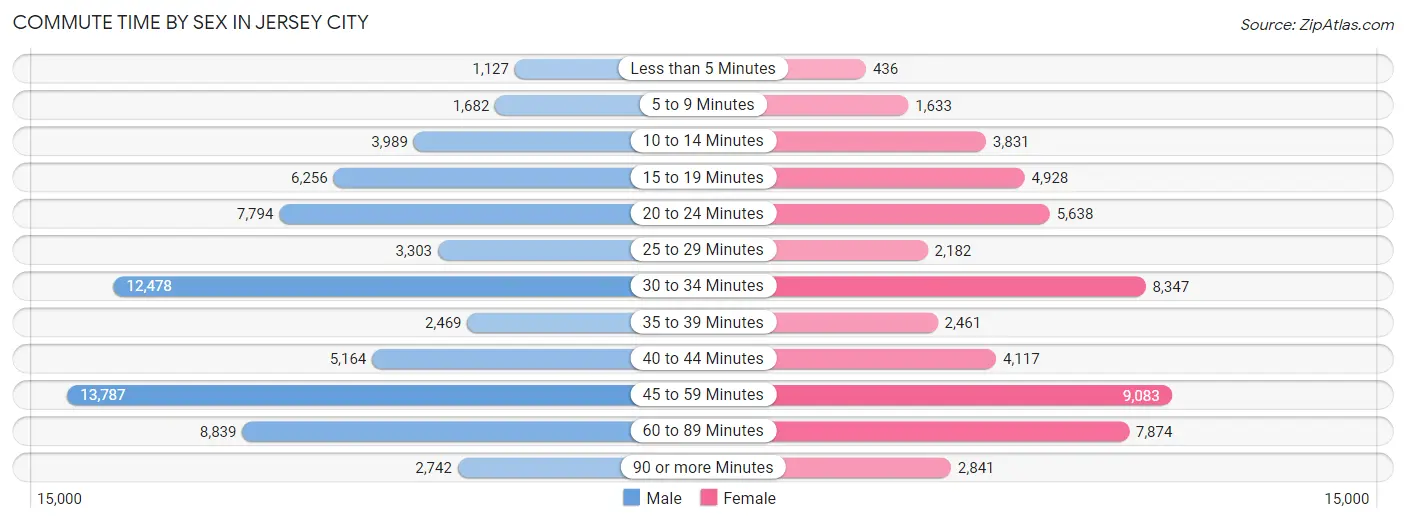
| Commute Time | Male | Female |
| Less than 5 Minutes | 1,127 (1.6%) | 436 (0.8%) |
| 5 to 9 Minutes | 1,682 (2.4%) | 1,633 (3.1%) |
| 10 to 14 Minutes | 3,989 (5.7%) | 3,831 (7.2%) |
| 15 to 19 Minutes | 6,256 (9.0%) | 4,928 (9.2%) |
| 20 to 24 Minutes | 7,794 (11.2%) | 5,638 (10.6%) |
| 25 to 29 Minutes | 3,303 (4.7%) | 2,182 (4.1%) |
| 30 to 34 Minutes | 12,478 (17.9%) | 8,347 (15.6%) |
| 35 to 39 Minutes | 2,469 (3.5%) | 2,461 (4.6%) |
| 40 to 44 Minutes | 5,164 (7.4%) | 4,117 (7.7%) |
| 45 to 59 Minutes | 13,787 (19.8%) | 9,083 (17.0%) |
| 60 to 89 Minutes | 8,839 (12.7%) | 7,874 (14.7%) |
| 90 or more Minutes | 2,742 (3.9%) | 2,841 (5.3%) |
Time of Departure to Work by Sex in Jersey City
The most frequent times of departure to work in Jersey City are 8:00 AM to 8:29 AM (15,570, 22.4%) for males and 8:00 AM to 8:29 AM (12,899, 24.2%) for females.
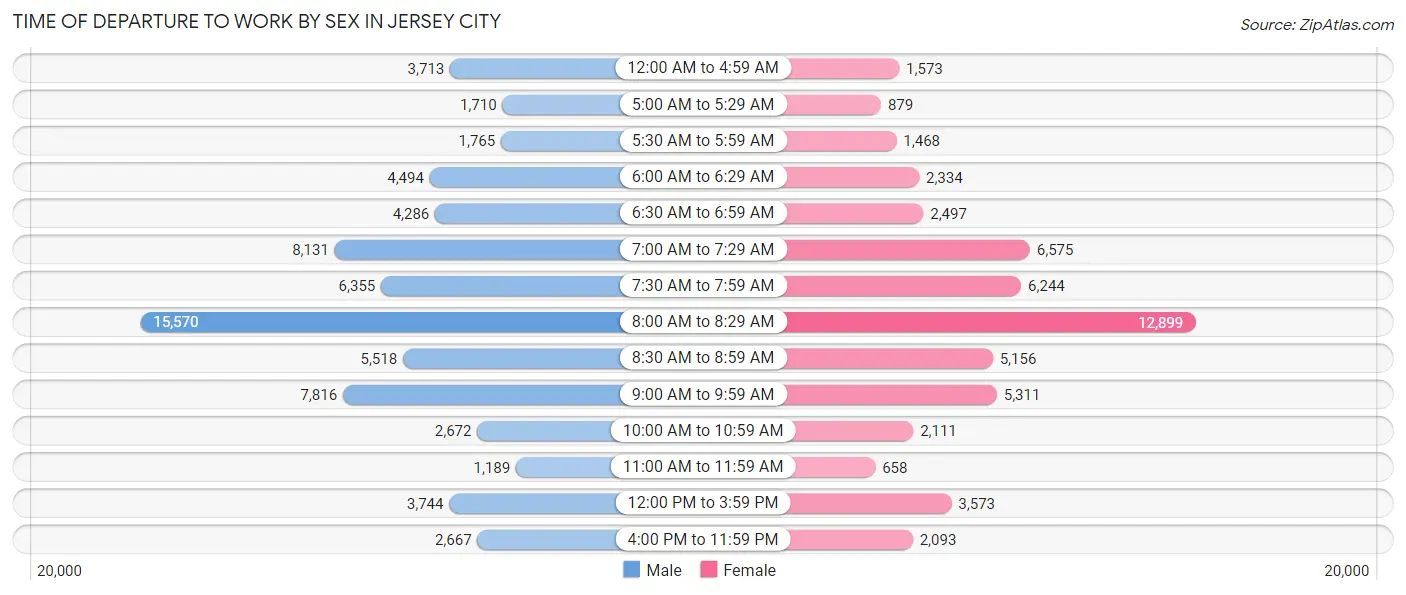
| Time of Departure | Male | Female |
| 12:00 AM to 4:59 AM | 3,713 (5.3%) | 1,573 (2.9%) |
| 5:00 AM to 5:29 AM | 1,710 (2.5%) | 879 (1.7%) |
| 5:30 AM to 5:59 AM | 1,765 (2.5%) | 1,468 (2.8%) |
| 6:00 AM to 6:29 AM | 4,494 (6.5%) | 2,334 (4.4%) |
| 6:30 AM to 6:59 AM | 4,286 (6.2%) | 2,497 (4.7%) |
| 7:00 AM to 7:29 AM | 8,131 (11.7%) | 6,575 (12.3%) |
| 7:30 AM to 7:59 AM | 6,355 (9.1%) | 6,244 (11.7%) |
| 8:00 AM to 8:29 AM | 15,570 (22.4%) | 12,899 (24.2%) |
| 8:30 AM to 8:59 AM | 5,518 (7.9%) | 5,156 (9.7%) |
| 9:00 AM to 9:59 AM | 7,816 (11.2%) | 5,311 (10.0%) |
| 10:00 AM to 10:59 AM | 2,672 (3.8%) | 2,111 (4.0%) |
| 11:00 AM to 11:59 AM | 1,189 (1.7%) | 658 (1.2%) |
| 12:00 PM to 3:59 PM | 3,744 (5.4%) | 3,573 (6.7%) |
| 4:00 PM to 11:59 PM | 2,667 (3.8%) | 2,093 (3.9%) |
| Total | 69,630 (100.0%) | 53,371 (100.0%) |
Housing Occupancy in Jersey City
Occupancy by Ownership in Jersey City
Of the total 119,278 dwellings in Jersey City, owner-occupied units account for 34,882 (29.2%), while renter-occupied units make up 84,396 (70.8%).
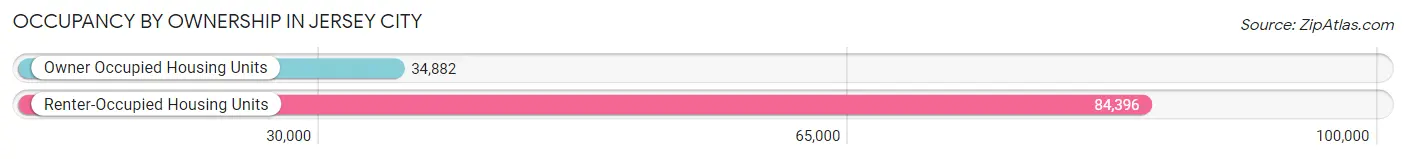
| Occupancy | # Housing Units | % Housing Units |
| Owner Occupied Housing Units | 34,882 | 29.2% |
| Renter-Occupied Housing Units | 84,396 | 70.8% |
| Total Occupied Housing Units | 119,278 | 100.0% |
Occupancy by Household Size in Jersey City
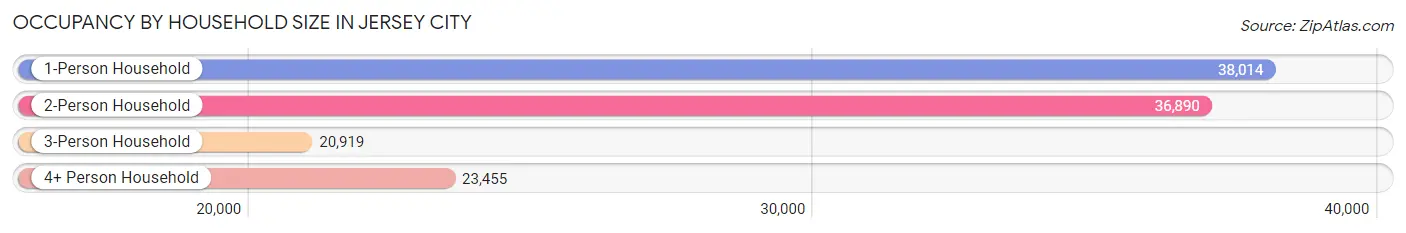
| Household Size | # Housing Units | % Housing Units |
| 1-Person Household | 38,014 | 31.9% |
| 2-Person Household | 36,890 | 30.9% |
| 3-Person Household | 20,919 | 17.5% |
| 4+ Person Household | 23,455 | 19.7% |
| Total Housing Units | 119,278 | 100.0% |
Occupancy by Ownership by Household Size in Jersey City
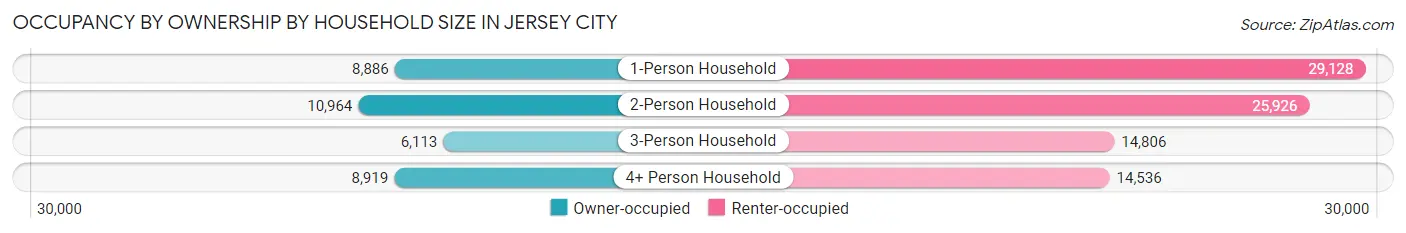
| Household Size | Owner-occupied | Renter-occupied |
| 1-Person Household | 8,886 (23.4%) | 29,128 (76.6%) |
| 2-Person Household | 10,964 (29.7%) | 25,926 (70.3%) |
| 3-Person Household | 6,113 (29.2%) | 14,806 (70.8%) |
| 4+ Person Household | 8,919 (38.0%) | 14,536 (62.0%) |
| Total Housing Units | 34,882 (29.2%) | 84,396 (70.8%) |
Occupancy by Educational Attainment in Jersey City
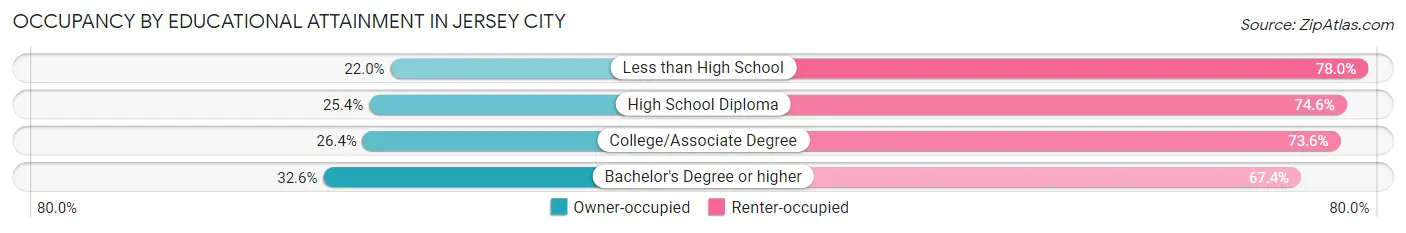
| Household Size | Owner-occupied | Renter-occupied |
| Less than High School | 2,316 (22.0%) | 8,219 (78.0%) |
| High School Diploma | 5,651 (25.4%) | 16,611 (74.6%) |
| College/Associate Degree | 5,491 (26.4%) | 15,325 (73.6%) |
| Bachelor's Degree or higher | 21,424 (32.6%) | 44,241 (67.4%) |
Occupancy by Age of Householder in Jersey City
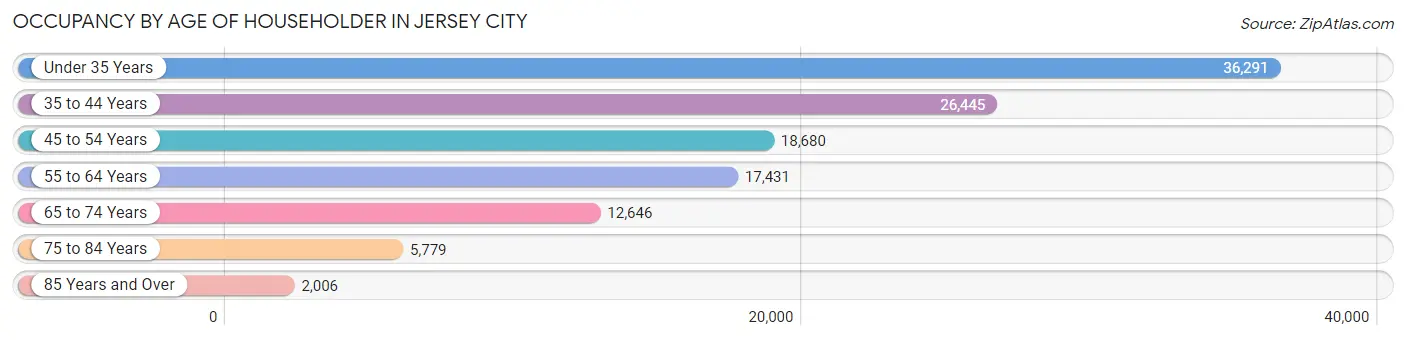
| Age Bracket | # Households | % Households |
| Under 35 Years | 36,291 | 30.4% |
| 35 to 44 Years | 26,445 | 22.2% |
| 45 to 54 Years | 18,680 | 15.7% |
| 55 to 64 Years | 17,431 | 14.6% |
| 65 to 74 Years | 12,646 | 10.6% |
| 75 to 84 Years | 5,779 | 4.8% |
| 85 Years and Over | 2,006 | 1.7% |
| Total | 119,278 | 100.0% |
Housing Finances in Jersey City
Median Income by Occupancy in Jersey City
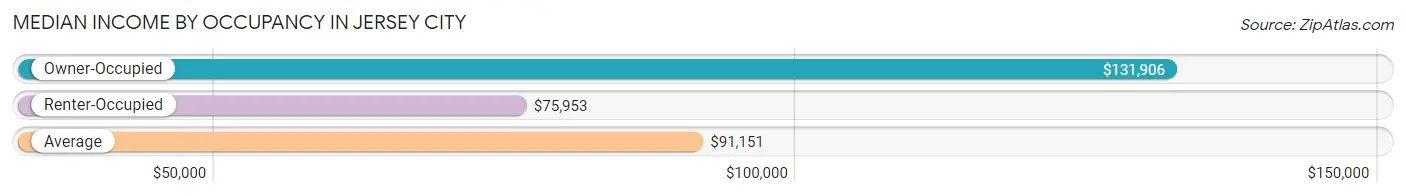
| Occupancy Type | # Households | Median Income |
| Owner-Occupied | 34,882 (29.2%) | $131,906 |
| Renter-Occupied | 84,396 (70.8%) | $75,953 |
| Average | 119,278 (100.0%) | $91,151 |
Occupancy by Householder Income Bracket in Jersey City
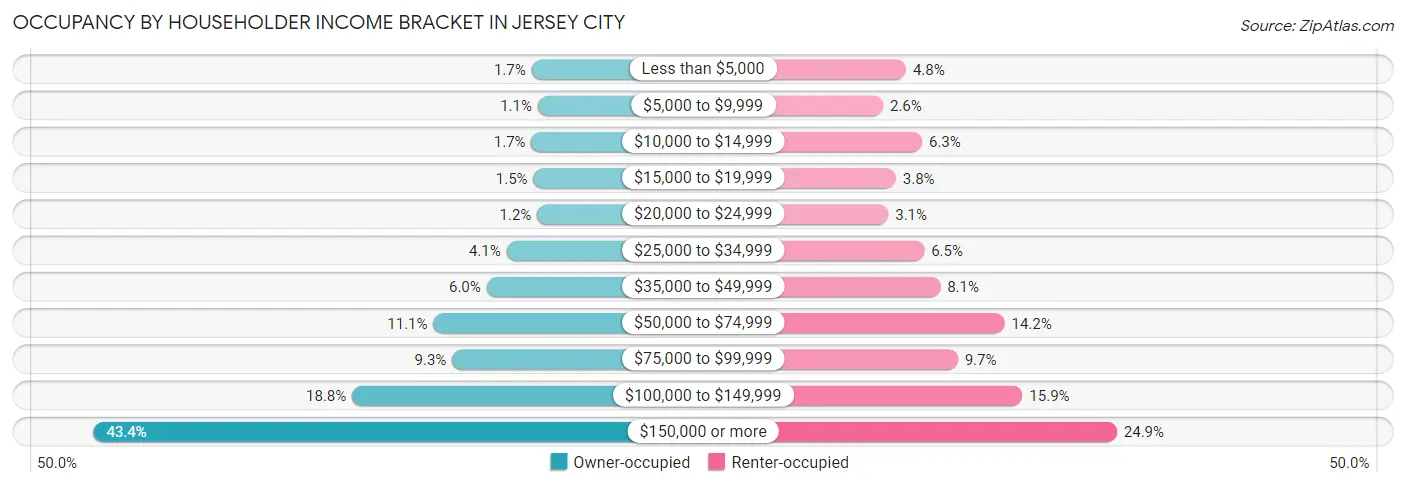
| Income Bracket | Owner-occupied | Renter-occupied |
| Less than $5,000 | 601 (1.7%) | 4,053 (4.8%) |
| $5,000 to $9,999 | 391 (1.1%) | 2,215 (2.6%) |
| $10,000 to $14,999 | 603 (1.7%) | 5,342 (6.3%) |
| $15,000 to $19,999 | 536 (1.5%) | 3,238 (3.8%) |
| $20,000 to $24,999 | 412 (1.2%) | 2,634 (3.1%) |
| $25,000 to $34,999 | 1,431 (4.1%) | 5,520 (6.5%) |
| $35,000 to $49,999 | 2,093 (6.0%) | 6,799 (8.1%) |
| $50,000 to $74,999 | 3,861 (11.1%) | 11,973 (14.2%) |
| $75,000 to $99,999 | 3,238 (9.3%) | 8,211 (9.7%) |
| $100,000 to $149,999 | 6,562 (18.8%) | 13,407 (15.9%) |
| $150,000 or more | 15,154 (43.4%) | 21,004 (24.9%) |
| Total | 34,882 (100.0%) | 84,396 (100.0%) |
Monthly Housing Cost Tiers in Jersey City
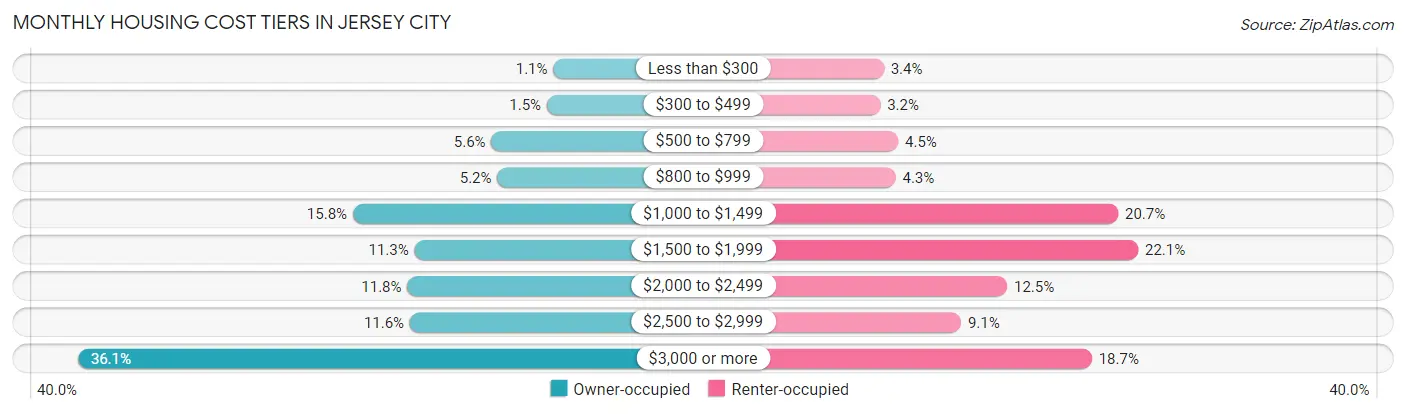
| Monthly Cost | Owner-occupied | Renter-occupied |
| Less than $300 | 369 (1.1%) | 2,882 (3.4%) |
| $300 to $499 | 535 (1.5%) | 2,656 (3.2%) |
| $500 to $799 | 1,959 (5.6%) | 3,772 (4.5%) |
| $800 to $999 | 1,808 (5.2%) | 3,612 (4.3%) |
| $1,000 to $1,499 | 5,519 (15.8%) | 17,448 (20.7%) |
| $1,500 to $1,999 | 3,934 (11.3%) | 18,687 (22.1%) |
| $2,000 to $2,499 | 4,121 (11.8%) | 10,541 (12.5%) |
| $2,500 to $2,999 | 4,053 (11.6%) | 7,684 (9.1%) |
| $3,000 or more | 12,584 (36.1%) | 15,809 (18.7%) |
| Total | 34,882 (100.0%) | 84,396 (100.0%) |
Physical Housing Characteristics in Jersey City
Housing Structures in Jersey City
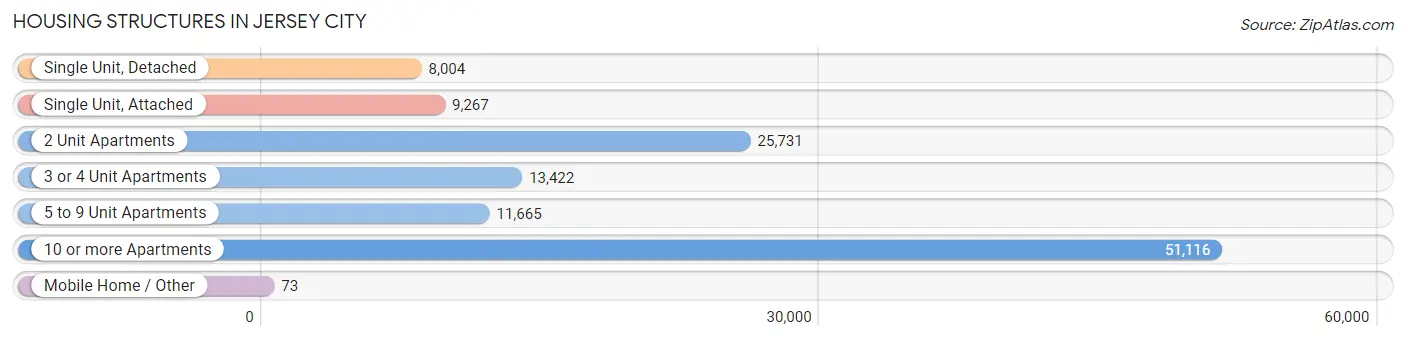
| Structure Type | # Housing Units | % Housing Units |
| Single Unit, Detached | 8,004 | 6.7% |
| Single Unit, Attached | 9,267 | 7.8% |
| 2 Unit Apartments | 25,731 | 21.6% |
| 3 or 4 Unit Apartments | 13,422 | 11.3% |
| 5 to 9 Unit Apartments | 11,665 | 9.8% |
| 10 or more Apartments | 51,116 | 42.8% |
| Mobile Home / Other | 73 | 0.1% |
| Total | 119,278 | 100.0% |
Housing Structures by Occupancy in Jersey City
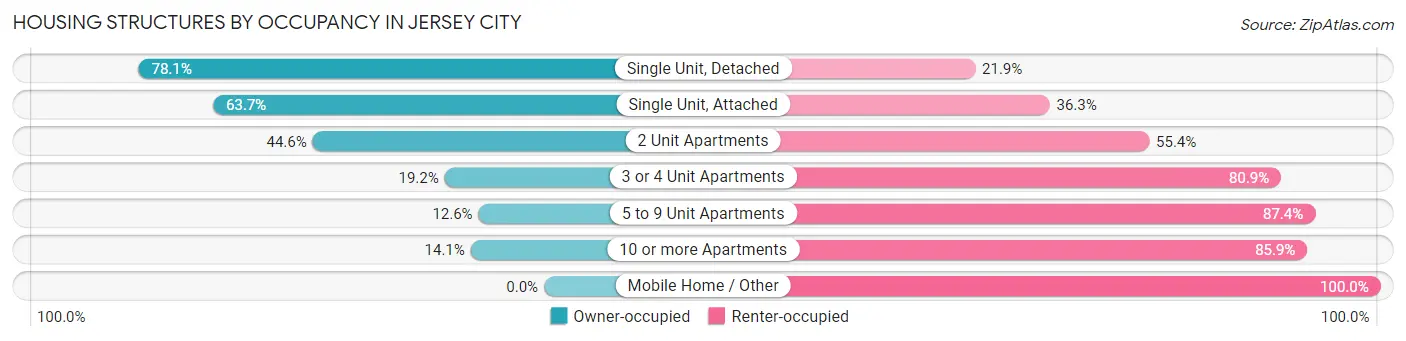
| Structure Type | Owner-occupied | Renter-occupied |
| Single Unit, Detached | 6,248 (78.1%) | 1,756 (21.9%) |
| Single Unit, Attached | 5,906 (63.7%) | 3,361 (36.3%) |
| 2 Unit Apartments | 11,465 (44.6%) | 14,266 (55.4%) |
| 3 or 4 Unit Apartments | 2,570 (19.2%) | 10,852 (80.8%) |
| 5 to 9 Unit Apartments | 1,472 (12.6%) | 10,193 (87.4%) |
| 10 or more Apartments | 7,221 (14.1%) | 43,895 (85.9%) |
| Mobile Home / Other | 0 (0.0%) | 73 (100.0%) |
| Total | 34,882 (29.2%) | 84,396 (70.8%) |
Housing Structures by Number of Rooms in Jersey City
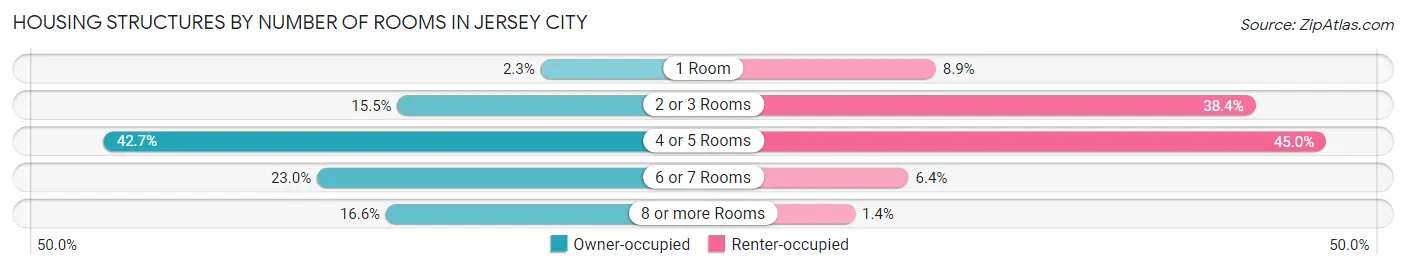
| Number of Rooms | Owner-occupied | Renter-occupied |
| 1 Room | 795 (2.3%) | 7,485 (8.9%) |
| 2 or 3 Rooms | 5,412 (15.5%) | 32,436 (38.4%) |
| 4 or 5 Rooms | 14,884 (42.7%) | 37,933 (45.0%) |
| 6 or 7 Rooms | 8,009 (23.0%) | 5,361 (6.4%) |
| 8 or more Rooms | 5,782 (16.6%) | 1,181 (1.4%) |
| Total | 34,882 (100.0%) | 84,396 (100.0%) |
Housing Structure by Heating Type in Jersey City
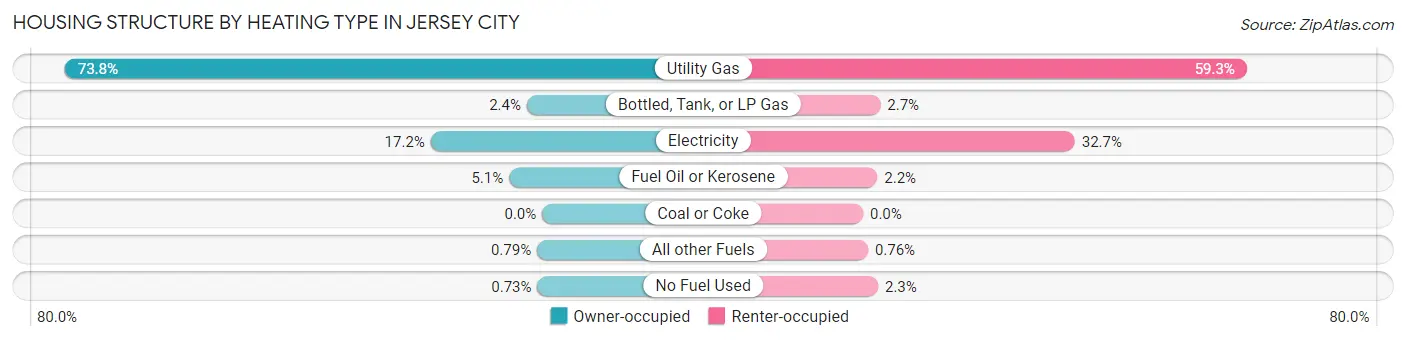
| Heating Type | Owner-occupied | Renter-occupied |
| Utility Gas | 25,736 (73.8%) | 50,049 (59.3%) |
| Bottled, Tank, or LP Gas | 824 (2.4%) | 2,250 (2.7%) |
| Electricity | 6,011 (17.2%) | 27,627 (32.7%) |
| Fuel Oil or Kerosene | 1,783 (5.1%) | 1,867 (2.2%) |
| Coal or Coke | 0 (0.0%) | 0 (0.0%) |
| All other Fuels | 274 (0.8%) | 643 (0.8%) |
| No Fuel Used | 254 (0.7%) | 1,960 (2.3%) |
| Total | 34,882 (100.0%) | 84,396 (100.0%) |
Household Vehicle Usage in Jersey City
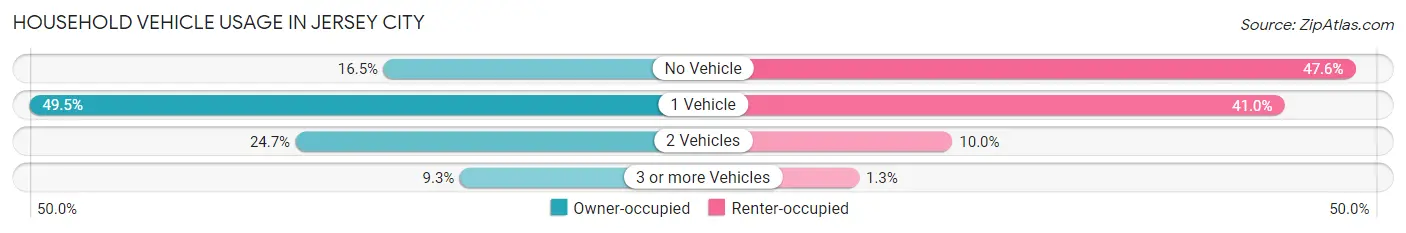
| Vehicles per Household | Owner-occupied | Renter-occupied |
| No Vehicle | 5,740 (16.5%) | 40,205 (47.6%) |
| 1 Vehicle | 17,279 (49.5%) | 34,611 (41.0%) |
| 2 Vehicles | 8,605 (24.7%) | 8,463 (10.0%) |
| 3 or more Vehicles | 3,258 (9.3%) | 1,117 (1.3%) |
| Total | 34,882 (100.0%) | 84,396 (100.0%) |
Real Estate & Mortgages in Jersey City
Real Estate and Mortgage Overview in Jersey City
| Characteristic | Without Mortgage | With Mortgage |
| Housing Units | 10,312 | 24,570 |
| Median Property Value | $447,600 | $532,600 |
| Median Household Income | $99,847 | $12,293 |
| Monthly Housing Costs | $1,083 | $12,411 |
| Real Estate Taxes | $7,353 | $412 |
Property Value by Mortgage Status in Jersey City
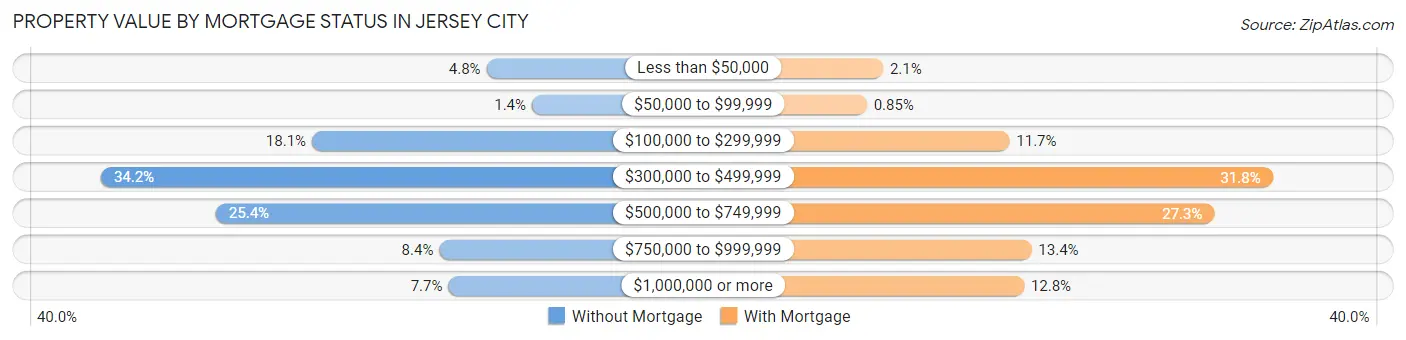
| Property Value | Without Mortgage | With Mortgage |
| Less than $50,000 | 496 (4.8%) | 513 (2.1%) |
| $50,000 to $99,999 | 139 (1.3%) | 210 (0.9%) |
| $100,000 to $299,999 | 1,868 (18.1%) | 2,880 (11.7%) |
| $300,000 to $499,999 | 3,525 (34.2%) | 7,806 (31.8%) |
| $500,000 to $749,999 | 2,621 (25.4%) | 6,715 (27.3%) |
| $750,000 to $999,999 | 867 (8.4%) | 3,293 (13.4%) |
| $1,000,000 or more | 796 (7.7%) | 3,153 (12.8%) |
| Total | 10,312 (100.0%) | 24,570 (100.0%) |
Household Income by Mortgage Status in Jersey City
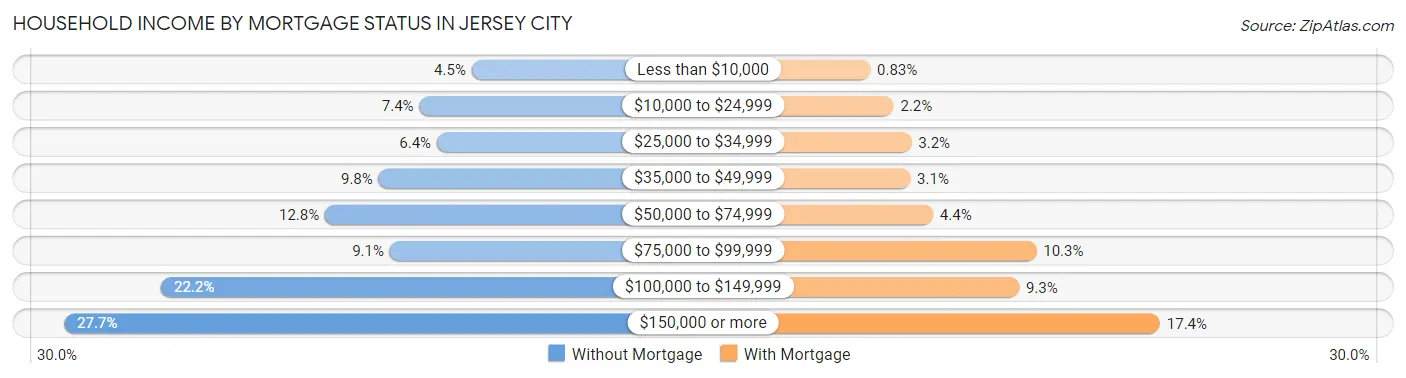
| Household Income | Without Mortgage | With Mortgage |
| Less than $10,000 | 459 (4.4%) | 203 (0.8%) |
| $10,000 to $24,999 | 767 (7.4%) | 533 (2.2%) |
| $25,000 to $34,999 | 664 (6.4%) | 784 (3.2%) |
| $35,000 to $49,999 | 1,007 (9.8%) | 767 (3.1%) |
| $50,000 to $74,999 | 1,323 (12.8%) | 1,086 (4.4%) |
| $75,000 to $99,999 | 942 (9.1%) | 2,538 (10.3%) |
| $100,000 to $149,999 | 2,289 (22.2%) | 2,296 (9.3%) |
| $150,000 or more | 2,861 (27.7%) | 4,273 (17.4%) |
| Total | 10,312 (100.0%) | 24,570 (100.0%) |
Property Value to Household Income Ratio in Jersey City
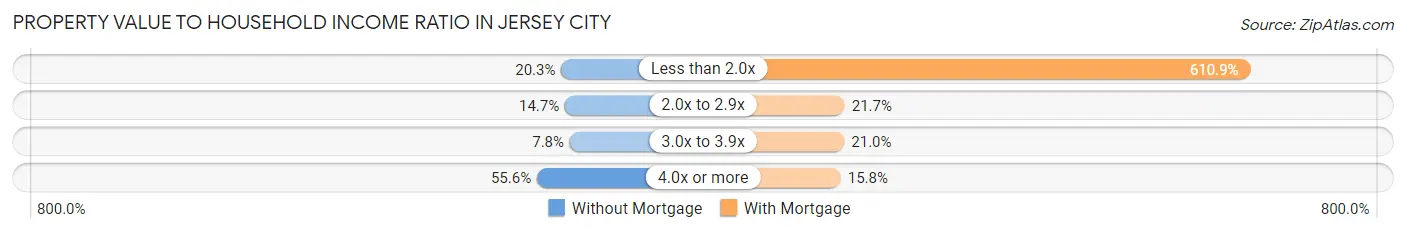
| Value-to-Income Ratio | Without Mortgage | With Mortgage |
| Less than 2.0x | 2,091 (20.3%) | 150,109 (610.9%) |
| 2.0x to 2.9x | 1,519 (14.7%) | 5,325 (21.7%) |
| 3.0x to 3.9x | 803 (7.8%) | 5,155 (21.0%) |
| 4.0x or more | 5,732 (55.6%) | 3,885 (15.8%) |
| Total | 10,312 (100.0%) | 24,570 (100.0%) |
Real Estate Taxes by Mortgage Status in Jersey City
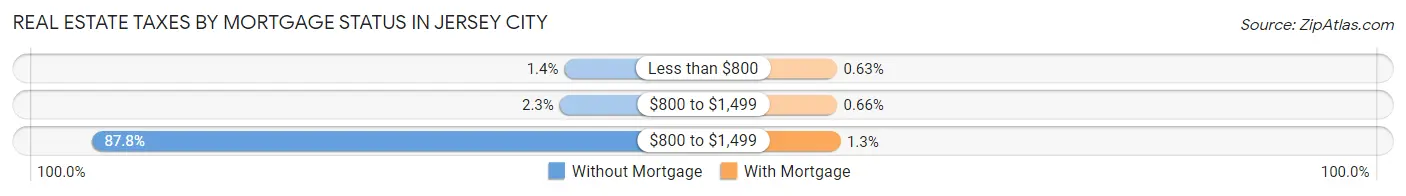
| Property Taxes | Without Mortgage | With Mortgage |
| Less than $800 | 147 (1.4%) | 154 (0.6%) |
| $800 to $1,499 | 235 (2.3%) | 163 (0.7%) |
| $800 to $1,499 | 9,052 (87.8%) | 310 (1.3%) |
| Total | 10,312 (100.0%) | 24,570 (100.0%) |
Health & Disability in Jersey City
Health Insurance Coverage by Age in Jersey City
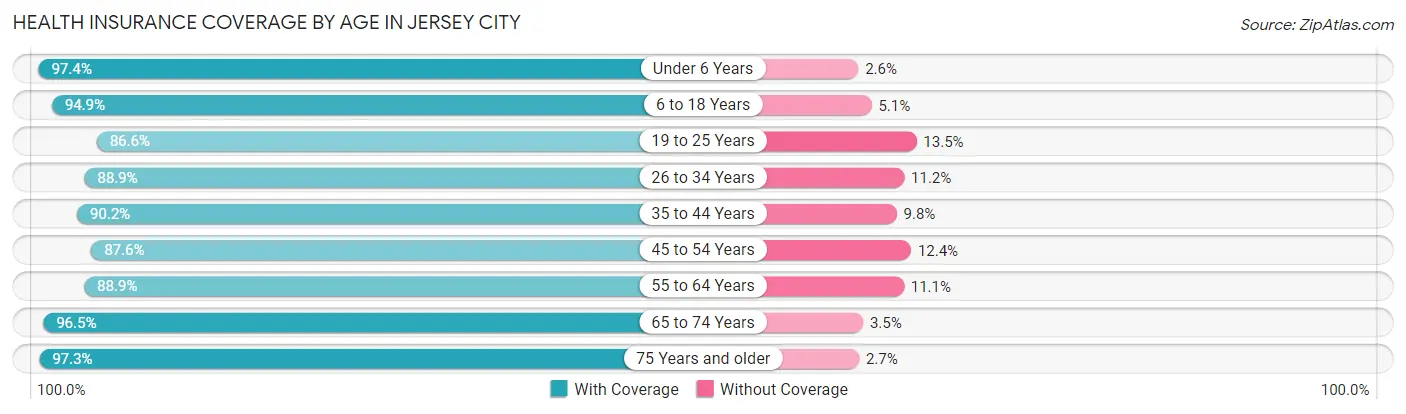
| Age Bracket | With Coverage | Without Coverage |
| Under 6 Years | 22,851 (97.4%) | 609 (2.6%) |
| 6 to 18 Years | 35,773 (94.9%) | 1,912 (5.1%) |
| 19 to 25 Years | 21,591 (86.6%) | 3,356 (13.5%) |
| 26 to 34 Years | 53,645 (88.8%) | 6,734 (11.2%) |
| 35 to 44 Years | 43,334 (90.2%) | 4,685 (9.8%) |
| 45 to 54 Years | 28,225 (87.6%) | 4,008 (12.4%) |
| 55 to 64 Years | 25,062 (88.9%) | 3,126 (11.1%) |
| 65 to 74 Years | 18,815 (96.5%) | 678 (3.5%) |
| 75 Years and older | 12,172 (97.3%) | 342 (2.7%) |
| Total | 261,468 (91.1%) | 25,450 (8.9%) |
Health Insurance Coverage by Citizenship Status in Jersey City
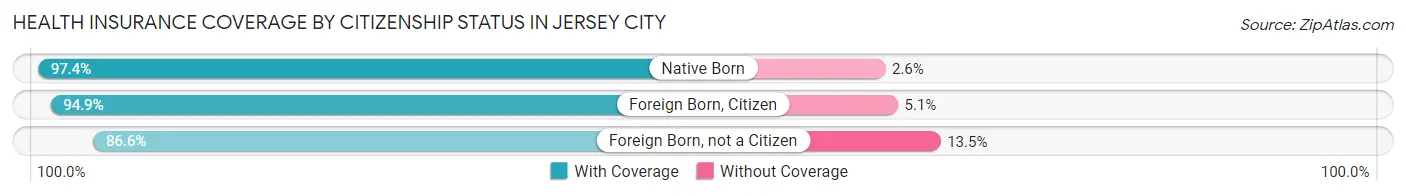
| Citizenship Status | With Coverage | Without Coverage |
| Native Born | 22,851 (97.4%) | 609 (2.6%) |
| Foreign Born, Citizen | 35,773 (94.9%) | 1,912 (5.1%) |
| Foreign Born, not a Citizen | 21,591 (86.6%) | 3,356 (13.5%) |
Health Insurance Coverage by Household Income in Jersey City
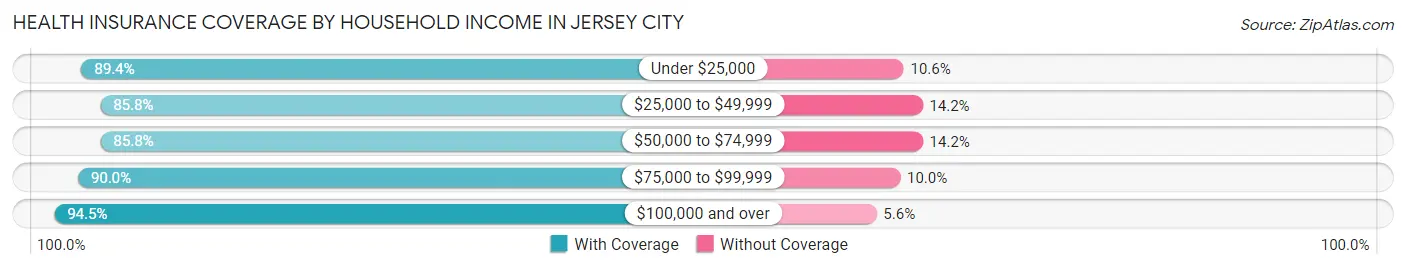
| Household Income | With Coverage | Without Coverage |
| Under $25,000 | 32,880 (89.4%) | 3,915 (10.6%) |
| $25,000 to $49,999 | 31,913 (85.8%) | 5,267 (14.2%) |
| $50,000 to $74,999 | 31,815 (85.8%) | 5,270 (14.2%) |
| $75,000 to $99,999 | 23,219 (90.0%) | 2,574 (10.0%) |
| $100,000 and over | 140,211 (94.5%) | 8,241 (5.6%) |
Public vs Private Health Insurance Coverage by Age in Jersey City
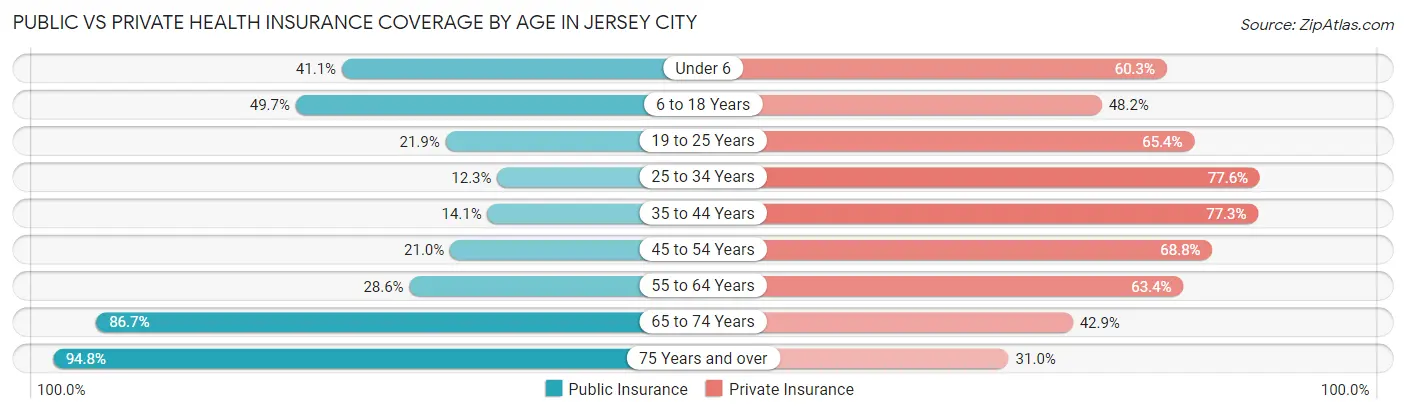
| Age Bracket | Public Insurance | Private Insurance |
| Under 6 | 9,642 (41.1%) | 14,151 (60.3%) |
| 6 to 18 Years | 18,718 (49.7%) | 18,178 (48.2%) |
| 19 to 25 Years | 5,455 (21.9%) | 16,324 (65.4%) |
| 25 to 34 Years | 7,396 (12.2%) | 46,861 (77.6%) |
| 35 to 44 Years | 6,755 (14.1%) | 37,120 (77.3%) |
| 45 to 54 Years | 6,776 (21.0%) | 22,169 (68.8%) |
| 55 to 64 Years | 8,053 (28.6%) | 17,871 (63.4%) |
| 65 to 74 Years | 16,901 (86.7%) | 8,354 (42.9%) |
| 75 Years and over | 11,861 (94.8%) | 3,875 (31.0%) |
| Total | 91,557 (31.9%) | 184,903 (64.4%) |
Disability Status by Sex by Age in Jersey City
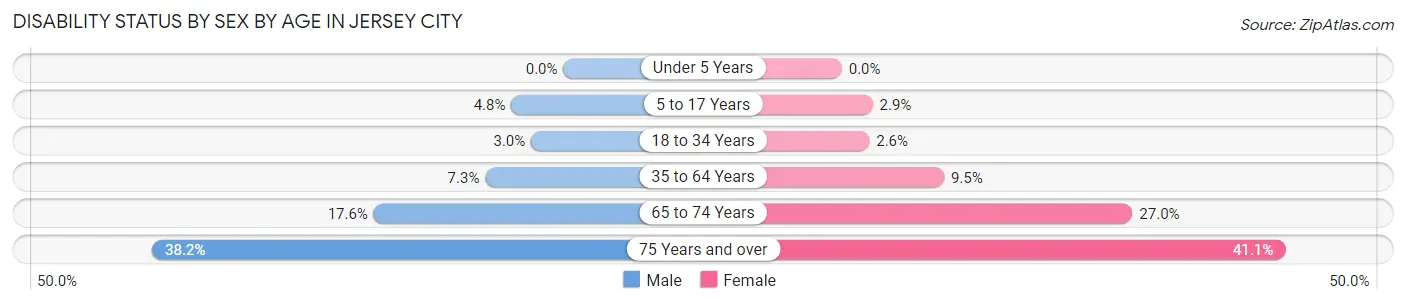
| Age Bracket | Male | Female |
| Under 5 Years | 0 (0.0%) | 0 (0.0%) |
| 5 to 17 Years | 952 (4.8%) | 521 (2.9%) |
| 18 to 34 Years | 1,363 (3.0%) | 1,084 (2.5%) |
| 35 to 64 Years | 4,060 (7.2%) | 4,970 (9.5%) |
| 65 to 74 Years | 1,526 (17.6%) | 2,919 (27.0%) |
| 75 Years and over | 1,875 (38.2%) | 3,126 (41.1%) |
Disability Class by Sex by Age in Jersey City
Disability Class: Hearing Difficulty
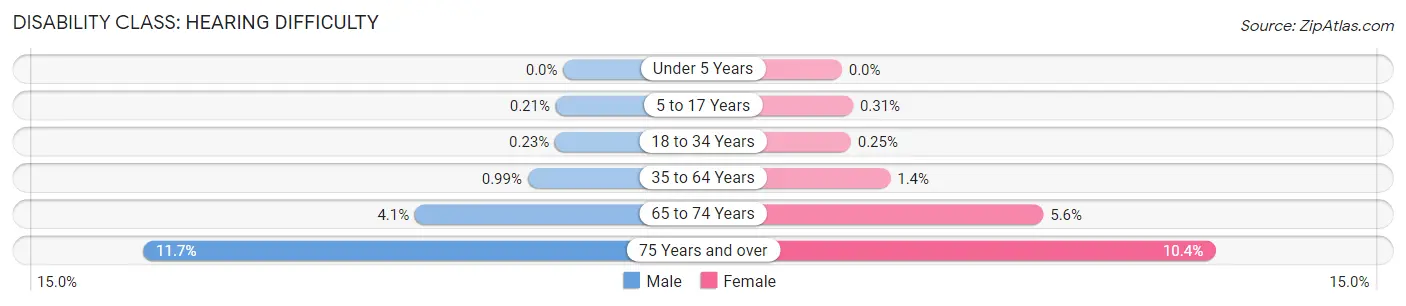
| Age Bracket | Male | Female |
| Under 5 Years | 0 (0.0%) | 0 (0.0%) |
| 5 to 17 Years | 42 (0.2%) | 56 (0.3%) |
| 18 to 34 Years | 107 (0.2%) | 105 (0.3%) |
| 35 to 64 Years | 554 (1.0%) | 707 (1.3%) |
| 65 to 74 Years | 358 (4.1%) | 607 (5.6%) |
| 75 Years and over | 575 (11.7%) | 790 (10.4%) |
Disability Class: Vision Difficulty
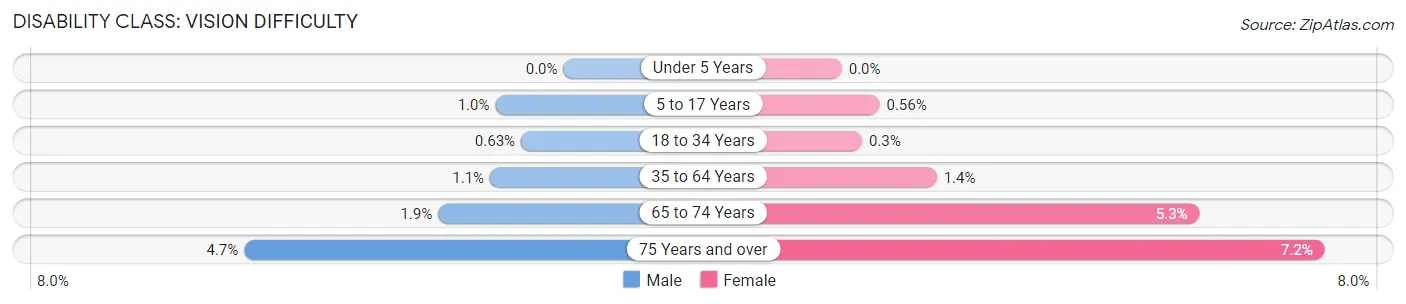
| Age Bracket | Male | Female |
| Under 5 Years | 0 (0.0%) | 0 (0.0%) |
| 5 to 17 Years | 200 (1.0%) | 102 (0.6%) |
| 18 to 34 Years | 285 (0.6%) | 126 (0.3%) |
| 35 to 64 Years | 613 (1.1%) | 739 (1.4%) |
| 65 to 74 Years | 161 (1.9%) | 575 (5.3%) |
| 75 Years and over | 233 (4.7%) | 545 (7.2%) |
Disability Class: Cognitive Difficulty
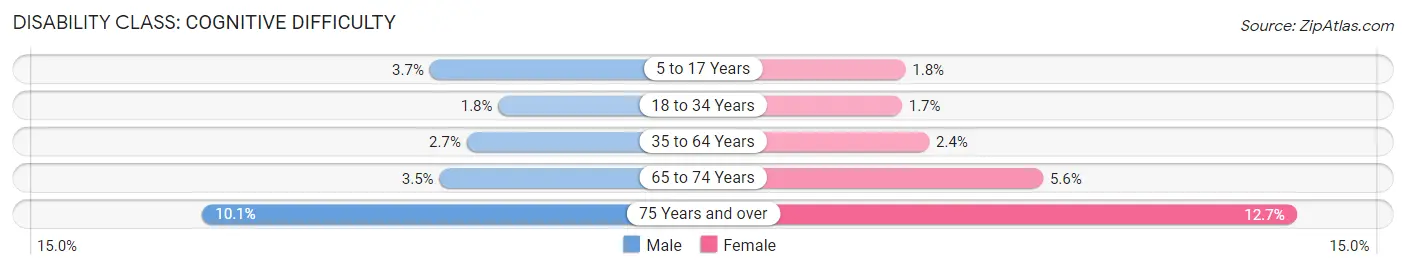
| Age Bracket | Male | Female |
| 5 to 17 Years | 734 (3.7%) | 323 (1.8%) |
| 18 to 34 Years | 825 (1.8%) | 707 (1.7%) |
| 35 to 64 Years | 1,506 (2.7%) | 1,275 (2.4%) |
| 65 to 74 Years | 299 (3.5%) | 606 (5.6%) |
| 75 Years and over | 494 (10.1%) | 962 (12.7%) |
Disability Class: Ambulatory Difficulty
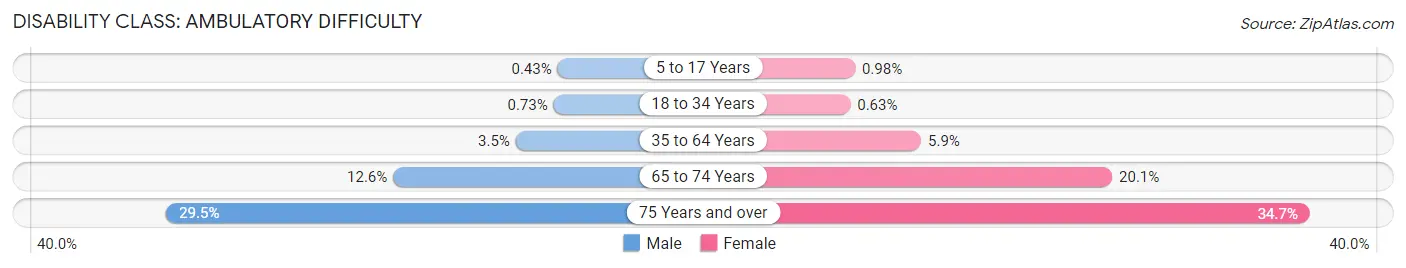
| Age Bracket | Male | Female |
| 5 to 17 Years | 84 (0.4%) | 179 (1.0%) |
| 18 to 34 Years | 335 (0.7%) | 266 (0.6%) |
| 35 to 64 Years | 1,980 (3.5%) | 3,086 (5.9%) |
| 65 to 74 Years | 1,096 (12.6%) | 2,172 (20.1%) |
| 75 Years and over | 1,449 (29.5%) | 2,640 (34.7%) |
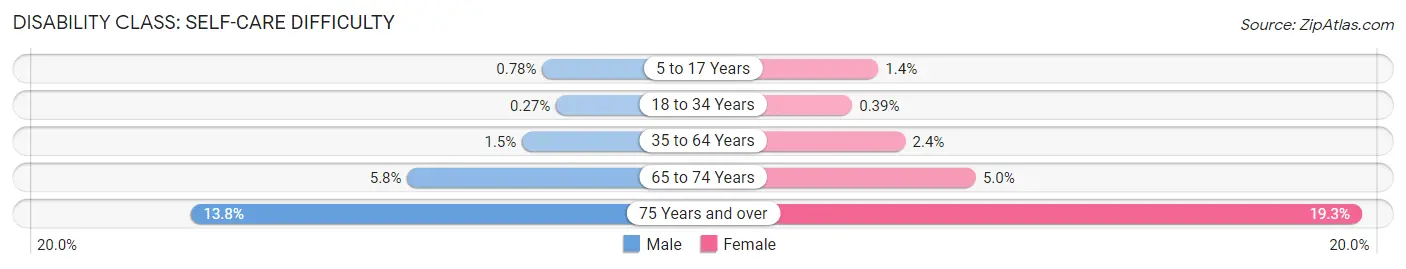
Disability Class: Self-Care Difficulty
| Age Bracket | Male | Female |
| 5 to 17 Years | 153 (0.8%) | 249 (1.4%) |
| 18 to 34 Years | 123 (0.3%) | 164 (0.4%) |
| 35 to 64 Years | 859 (1.5%) | 1,241 (2.4%) |
| 65 to 74 Years | 502 (5.8%) | 539 (5.0%) |
| 75 Years and over | 680 (13.8%) | 1,467 (19.3%) |
Technology Access in Jersey City
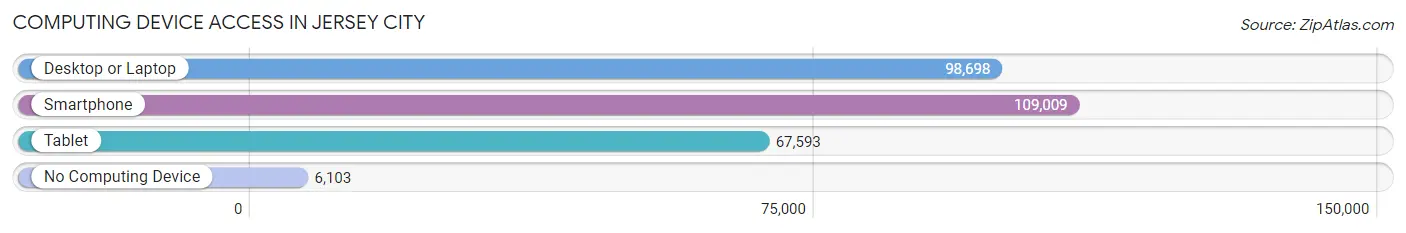
Computing Device Access in Jersey City
| Device Type | # Households | % Households |
| Desktop or Laptop | 98,698 | 82.8% |
| Smartphone | 109,009 | 91.4% |
| Tablet | 67,593 | 56.7% |
| No Computing Device | 6,103 | 5.1% |
| Total | 119,278 | 100.0% |
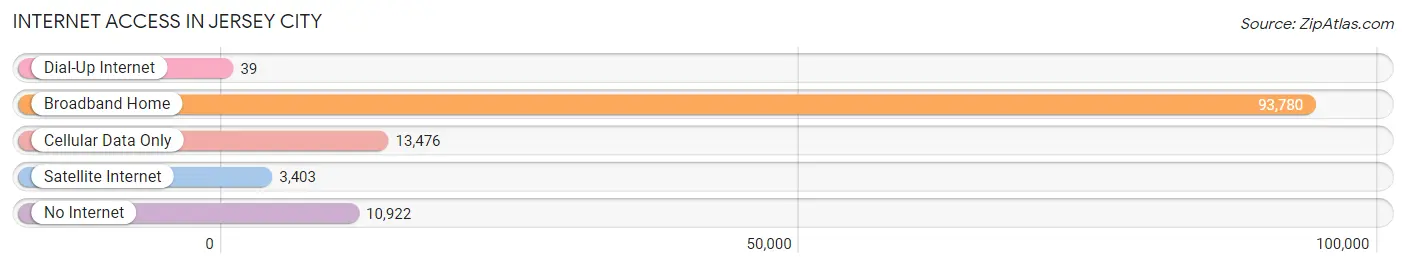
Internet Access in Jersey City
| Internet Type | # Households | % Households |
| Dial-Up Internet | 39 | 0.0% |
| Broadband Home | 93,780 | 78.6% |
| Cellular Data Only | 13,476 | 11.3% |
| Satellite Internet | 3,403 | 2.9% |
| No Internet | 10,922 | 9.2% |
| Total | 119,278 | 100.0% |
Jersey City Summary
Jersey City is the second-most populous city in the U.S. state of New Jersey, after Newark. It is the seat of Hudson County as well as the county's largest city. As of 2019, the Census Bureau's Population Estimates Program calculated that Jersey City's population was 265,549, with the largest population increase of any municipality in New Jersey since 2010, an increase of about 9.4% from the 2010 United States Census, when the city's population was at 247,597.
History
The area that is now Jersey City was inhabited by the Lenape, a collection of tribes (later called Delaware Indian). In 1609, Henry Hudson, seeking an alternate route to East Asia, anchored his small vessel Halve Maen (English: Half Moon) at Sandy Hook, Harsimus Cove and Weehawken Cove, and elsewhere along what was later named the North River. After spending nine days surveying the area and meeting its inhabitants, he sailed as far north as Albany. By 1621, the Dutch West India Company was organized to manage this new territory and in June 1623, New Netherland became a Dutch province, with headquarters in New Amsterdam.
Geography
Jersey City is located on the west bank of the Hudson River, opposite Manhattan Island, and is part of the New York metropolitan area. It is bordered by Bayonne to the south, Hoboken to the north, and Kearny to the west. The city is divided into five wards, which are further divided into neighborhoods. The city is located on the Newark Bay, a natural harbor that is home to the Port of New York and New Jersey.
Economy
Jersey City is a major economic center in the New York metropolitan area. It is home to the world headquarters of several major financial institutions, including Goldman Sachs, JP Morgan Chase, and Merrill Lynch. The city is also home to a number of corporate headquarters, including Verizon, Panasonic, and Prudential Financial.
The city is also a major transportation hub, with the Port of New York and New Jersey, the largest port on the East Coast, located in Jersey City. The city is also served by the Hudson-Bergen Light Rail, the PATH rapid transit system, and the New Jersey Turnpike.
Demographics
As of the 2010 United States Census, Jersey City had a population of 247,597, making it the second-most populous city in New Jersey. The population was spread out, with 33.2% under the age of 18, 10.9% from 18 to 24, 33.5% from 25 to 44, 19.3% from 45 to 64, and 3.1% who were 65 years of age or older. The median age was 31.7 years.
The racial makeup of the city was 44.2% White, 32.2% African American, 0.7% Native American, 8.2% Asian, 0.1% Pacific Islander, 9.8% from other races, and 4.8% from two or more races. Hispanic or Latino of any race were 25.3% of the population.
The median income for a household in the city was $47,831, and the median income for a family was $54,033. Males had a median income of $41,919 versus $37,819 for females. The per capita income for the city was $27,812. About 15.2% of families and 17.5% of the population were below the poverty line, including 25.7% of those under age 18 and 18.1% of those age 65 or over.
Conclusion
Jersey City is a major economic center in the New York metropolitan area, home to the world headquarters of several major financial institutions, and a major transportation hub. It is the second-most populous city in the U.S. state of New Jersey, with a population of 247,597 as of the 2010 United States Census. The city is diverse, with 44.2% White, 32.2% African American, 8.2% Asian, and 25.3% Hispanic or Latino of any race. The median income for a household in the city was $47,831, and the median income for a family was $54,033. Jersey City is a vibrant and diverse city with a rich history and a bright future.
Common Questions
What is the Total Population of Jersey City?
Total Population of Jersey City is 287,899.
What is the Total Male Population of Jersey City?
Total Male Population of Jersey City is 145,921.
What is the Total Female Population of Jersey City?
Total Female Population of Jersey City is 141,978.
What is the Ratio of Males per 100 Females in Jersey City?
There are 102.78 Males per 100 Females in Jersey City.
What is the Ratio of Females per 100 Males in Jersey City?
There are 97.30 Females per 100 Males in Jersey City.
What is the Median Population Age in Jersey City?
Median Population Age in Jersey City is 34.6 Years.
What is the Average Family Size in Jersey City
Average Family Size in Jersey City is 3.1 People.
What is the Average Household Size in Jersey City
Average Household Size in Jersey City is 2.4 People.
What is Per Capita Income in Jersey City?
Per Capita income in Jersey City is $54,582.
What is the Median Family Income in Jersey City?
Median Family Income in Jersey City is $102,072.
What is the Median Household income in Jersey City?
Median Household Income in Jersey City is $91,151.
What is Income or Wage Gap in Jersey City?
Income or Wage Gap in Jersey City is 23.3%.
Women in Jersey City earn 76.7 cents for every dollar earned by a man.
What is Family Income Deficit in Jersey City?
Family Income Deficit in Jersey City is $11,124.
Families that are below poverty line in Jersey City earn $11,124 less on average than the poverty threshold level.
What is Inequality or Gini Index in Jersey City?
Inequality or Gini Index in Jersey City is 0.51.
How Large is the Labor Force in Jersey City?
There are 163,618 People in the Labor Forcein in Jersey City.
What is the Percentage of People in the Labor Force in Jersey City?
69.8% of People are in the Labor Force in Jersey City.
What is the Unemployment Rate in Jersey City?
Unemployment Rate in Jersey City is 5.8%.