Cities with the Most Immigrants from Scotland in New Jersey
RELATED REPORTS & OPTIONS
Scotland
New Jersey
Compare Cities
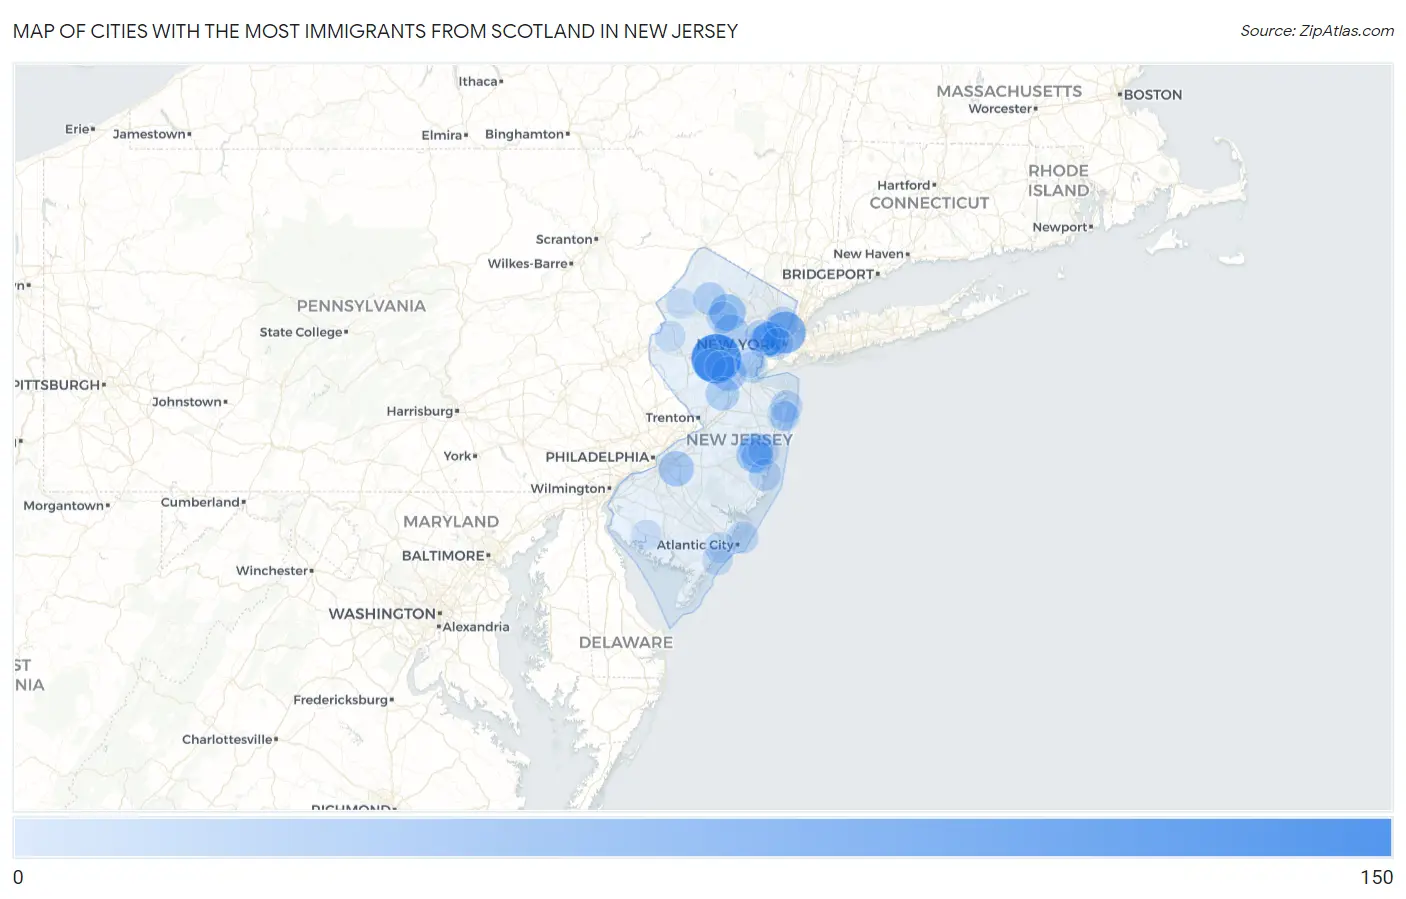
Map of Cities with the Most Immigrants from Scotland in New Jersey
0
150
Cities with the Most Immigrants from Scotland in New Jersey
| City | Scotland | vs State | vs National | |
| 1. | Green Knoll | 107 | 2,470(4.33%)#1 | 57,530(0.19%)#47 |
| 2. | Hopatcong Borough | 81 | 2,470(3.28%)#2 | 57,530(0.14%)#79 |
| 3. | Highland Park Borough | 65 | 2,470(2.63%)#3 | 57,530(0.11%)#114 |
| 4. | Guttenberg | 63 | 2,470(2.55%)#4 | 57,530(0.11%)#123 |
| 5. | Stirling | 59 | 2,470(2.39%)#5 | 57,530(0.10%)#141 |
| 6. | Paramus Borough | 55 | 2,470(2.23%)#6 | 57,530(0.10%)#157 |
| 7. | Point Pleasant Borough | 51 | 2,470(2.06%)#7 | 57,530(0.09%)#183 |
| 8. | Pompton Plains | 39 | 2,470(1.58%)#8 | 57,530(0.07%)#267 |
| 9. | Union Beach Borough | 37 | 2,470(1.50%)#9 | 57,530(0.06%)#286 |
| 10. | White Meadow Lake | 35 | 2,470(1.42%)#10 | 57,530(0.06%)#301 |
| 11. | Kearny | 32 | 2,470(1.30%)#11 | 57,530(0.06%)#330 |
| 12. | Bergenfield Borough | 32 | 2,470(1.30%)#12 | 57,530(0.06%)#333 |
| 13. | Wanaque Borough | 29 | 2,470(1.17%)#13 | 57,530(0.05%)#378 |
| 14. | Springdale | 28 | 2,470(1.13%)#14 | 57,530(0.05%)#390 |
| 15. | Somerset | 26 | 2,470(1.05%)#15 | 57,530(0.05%)#430 |
| 16. | Holiday City Berkeley | 26 | 2,470(1.05%)#16 | 57,530(0.05%)#433 |
| 17. | Flanders | 24 | 2,470(0.97%)#17 | 57,530(0.04%)#462 |
| 18. | Pine Lake Park | 22 | 2,470(0.89%)#18 | 57,530(0.04%)#510 |
| 19. | Morristown | 21 | 2,470(0.85%)#19 | 57,530(0.04%)#534 |
| 20. | Harrison | 20 | 2,470(0.81%)#20 | 57,530(0.03%)#559 |
| 21. | North Caldwell Borough | 20 | 2,470(0.81%)#21 | 57,530(0.03%)#570 |
| 22. | Monmouth Junction | 19 | 2,470(0.77%)#22 | 57,530(0.03%)#602 |
| 23. | Newark | 18 | 2,470(0.73%)#23 | 57,530(0.03%)#611 |
| 24. | Waldwick Borough | 18 | 2,470(0.73%)#24 | 57,530(0.03%)#645 |
| 25. | Lake Mohawk | 17 | 2,470(0.69%)#25 | 57,530(0.03%)#683 |
| 26. | Mckee | 17 | 2,470(0.69%)#26 | 57,530(0.03%)#685 |
| 27. | East Orange | 15 | 2,470(0.61%)#27 | 57,530(0.03%)#735 |
| 28. | Ledgewood | 14 | 2,470(0.57%)#28 | 57,530(0.02%)#803 |
| 29. | Hasbrouck Heights Borough | 13 | 2,470(0.53%)#29 | 57,530(0.02%)#847 |
| 30. | Holiday City South | 13 | 2,470(0.53%)#30 | 57,530(0.02%)#867 |
| 31. | Long Branch | 12 | 2,470(0.49%)#31 | 57,530(0.02%)#892 |
| 32. | Rutherford Borough | 11 | 2,470(0.45%)#32 | 57,530(0.02%)#961 |
| 33. | Dover | 10 | 2,470(0.40%)#33 | 57,530(0.02%)#1,034 |
| 34. | Ridgefield Park | 10 | 2,470(0.40%)#34 | 57,530(0.02%)#1,043 |
| 35. | East Rutherford Borough | 10 | 2,470(0.40%)#35 | 57,530(0.02%)#1,051 |
| 36. | Brigantine | 10 | 2,470(0.40%)#36 | 57,530(0.02%)#1,057 |
| 37. | Forked River | 10 | 2,470(0.40%)#37 | 57,530(0.02%)#1,063 |
| 38. | Bradley Gardens | 9 | 2,470(0.36%)#38 | 57,530(0.02%)#1,117 |
| 39. | Rumson Borough | 9 | 2,470(0.36%)#39 | 57,530(0.02%)#1,130 |
| 40. | Buena Borough | 9 | 2,470(0.36%)#40 | 57,530(0.02%)#1,139 |
| 41. | Beesleys Point | 9 | 2,470(0.36%)#41 | 57,530(0.02%)#1,152 |
| 42. | Jersey City | 8 | 2,470(0.32%)#42 | 57,530(0.01%)#1,156 |
| 43. | Fair Lawn Borough | 8 | 2,470(0.32%)#43 | 57,530(0.01%)#1,182 |
| 44. | Lindenwold Borough | 8 | 2,470(0.32%)#44 | 57,530(0.01%)#1,192 |
| 45. | Woodbridge | 8 | 2,470(0.32%)#45 | 57,530(0.01%)#1,195 |
| 46. | Red Bank Borough | 8 | 2,470(0.32%)#46 | 57,530(0.01%)#1,203 |
| 47. | Maywood Borough | 8 | 2,470(0.32%)#47 | 57,530(0.01%)#1,210 |
| 48. | Raritan Borough | 8 | 2,470(0.32%)#48 | 57,530(0.01%)#1,216 |
| 49. | Watsessing | 8 | 2,470(0.32%)#49 | 57,530(0.01%)#1,218 |
| 50. | Toms River | 7 | 2,470(0.28%)#50 | 57,530(0.01%)#1,241 |
| 51. | Pitman Borough | 6 | 2,470(0.24%)#51 | 57,530(0.01%)#1,352 |
| 52. | Linwood | 6 | 2,470(0.24%)#52 | 57,530(0.01%)#1,355 |
| 53. | Troy Hills | 6 | 2,470(0.24%)#53 | 57,530(0.01%)#1,358 |
| 54. | Wanamassa | 6 | 2,470(0.24%)#54 | 57,530(0.01%)#1,360 |
| 55. | Menlo Park Terrace | 5 | 2,470(0.20%)#55 | 57,530(0.01%)#1,421 |
| 56. | Lavallette Borough | 5 | 2,470(0.20%)#56 | 57,530(0.01%)#1,427 |
| 57. | Metuchen Borough | 4 | 2,470(0.16%)#57 | 57,530(0.01%)#1,458 |
| 58. | Brass Castle | 4 | 2,470(0.16%)#58 | 57,530(0.01%)#1,480 |
| 59. | Surf City Borough | 4 | 2,470(0.16%)#59 | 57,530(0.01%)#1,483 |
| 60. | Newport | 4 | 2,470(0.16%)#60 | 57,530(0.01%)#1,496 |
| 61. | Colonia | 3 | 2,470(0.12%)#61 | 57,530(0.01%)#1,507 |
| 62. | Ocean City | 3 | 2,470(0.12%)#62 | 57,530(0.01%)#1,512 |
| 63. | Chatham Borough | 3 | 2,470(0.12%)#63 | 57,530(0.01%)#1,515 |
| 64. | Atco | 3 | 2,470(0.12%)#64 | 57,530(0.01%)#1,516 |
| 65. | Chester Borough | 3 | 2,470(0.12%)#65 | 57,530(0.01%)#1,536 |
| 66. | Bridgeton | 2 | 2,470(0.08%)#66 | 57,530(0.00%)#1,576 |
| 67. | Finderne | 2 | 2,470(0.08%)#67 | 57,530(0.00%)#1,582 |
| 68. | Marksboro | 2 | 2,470(0.08%)#68 | 57,530(0.00%)#1,616 |
| 69. | Avalon Borough | 1 | 2,470(0.04%)#69 | 57,530(0.00%)#1,624 |
| 70. | Loch Arbour | 1 | 2,470(0.04%)#70 | 57,530(0.00%)#1,639 |
Common Questions
What are the Top 10 Cities with the Most Immigrants from Scotland in New Jersey?
Top 10 Cities with the Most Immigrants from Scotland in New Jersey are:
#1
107
#2
63
#3
35
#4
32
#5
28
#6
26
#7
26
#8
22
#9
21
#10
20
What city has the Most Immigrants from Scotland in New Jersey?
Green Knoll has the Most Immigrants from Scotland in New Jersey with 107.
What is the Total Immigrants from Scotland in the State of New Jersey?
Total Immigrants from Scotland in New Jersey is 2,470.
What is the Total Immigrants from Scotland in the United States?
Total Immigrants from Scotland in the United States is 57,530.