Cities with the Largest European Community in New Jersey
RELATED REPORTS & OPTIONS
European
New Jersey
Compare Cities
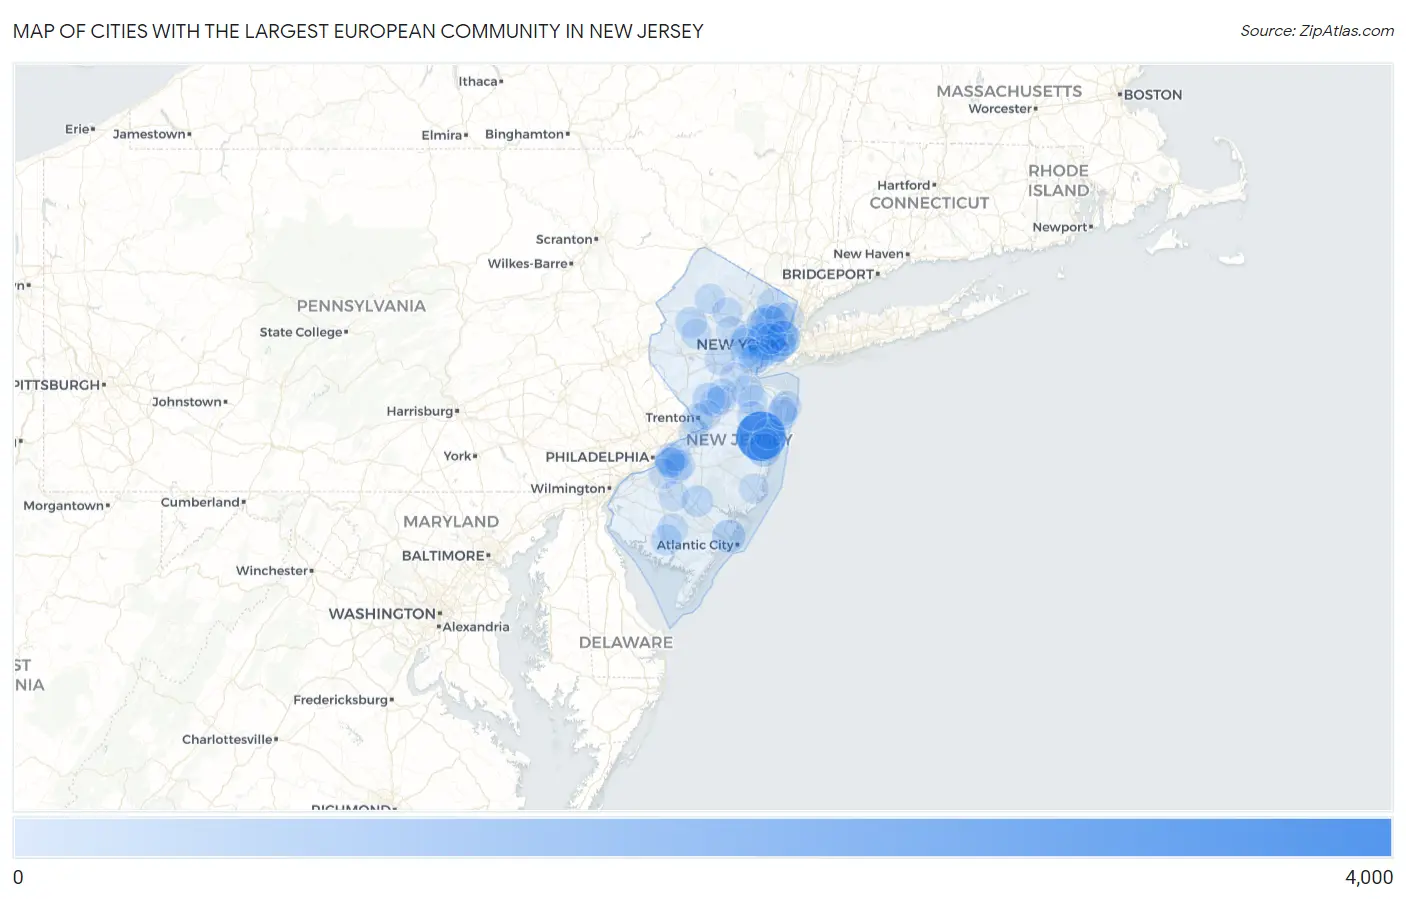
Map of Cities with the Largest European Community in New Jersey
0
4,000
Cities with the Largest European Community in New Jersey
| City | European | vs State | vs National | |
| 1. | Lakewood | 3,392 | 78,537(4.32%)#1 | 5,543,537(0.06%)#151 |
| 2. | Newark | 1,249 | 78,537(1.59%)#2 | 5,543,537(0.02%)#586 |
| 3. | Jersey City | 1,078 | 78,537(1.37%)#3 | 5,543,537(0.02%)#701 |
| 4. | Hoboken | 1,046 | 78,537(1.33%)#4 | 5,543,537(0.02%)#728 |
| 5. | Toms River | 729 | 78,537(0.93%)#5 | 5,543,537(0.01%)#1,088 |
| 6. | Clifton | 702 | 78,537(0.89%)#6 | 5,543,537(0.01%)#1,132 |
| 7. | Absecon | 643 | 78,537(0.82%)#7 | 5,543,537(0.01%)#1,220 |
| 8. | Sayreville Borough | 556 | 78,537(0.71%)#8 | 5,543,537(0.01%)#1,430 |
| 9. | Princeton | 484 | 78,537(0.62%)#9 | 5,543,537(0.01%)#1,662 |
| 10. | Passaic | 483 | 78,537(0.61%)#10 | 5,543,537(0.01%)#1,665 |
| 11. | Short Hills | 428 | 78,537(0.54%)#11 | 5,543,537(0.01%)#1,865 |
| 12. | Upper Montclair | 418 | 78,537(0.53%)#12 | 5,543,537(0.01%)#1,917 |
| 13. | Fort Lee Borough | 390 | 78,537(0.50%)#13 | 5,543,537(0.01%)#2,034 |
| 14. | Ramsey Borough | 379 | 78,537(0.48%)#14 | 5,543,537(0.01%)#2,093 |
| 15. | Hammonton | 355 | 78,537(0.45%)#15 | 5,543,537(0.01%)#2,205 |
| 16. | Ridgewood | 354 | 78,537(0.45%)#16 | 5,543,537(0.01%)#2,209 |
| 17. | Bayonne | 346 | 78,537(0.44%)#17 | 5,543,537(0.01%)#2,243 |
| 18. | Summit | 346 | 78,537(0.44%)#18 | 5,543,537(0.01%)#2,246 |
| 19. | Hackettstown | 328 | 78,537(0.42%)#19 | 5,543,537(0.01%)#2,373 |
| 20. | Old Bridge | 324 | 78,537(0.41%)#20 | 5,543,537(0.01%)#2,391 |
| 21. | Linden | 310 | 78,537(0.39%)#21 | 5,543,537(0.01%)#2,472 |
| 22. | Elizabeth | 308 | 78,537(0.39%)#22 | 5,543,537(0.01%)#2,486 |
| 23. | Cherry Hill Mall | 308 | 78,537(0.39%)#23 | 5,543,537(0.01%)#2,493 |
| 24. | Manasquan Borough | 306 | 78,537(0.39%)#24 | 5,543,537(0.01%)#2,512 |
| 25. | Trenton | 294 | 78,537(0.37%)#25 | 5,543,537(0.01%)#2,604 |
| 26. | Westfield | 285 | 78,537(0.36%)#26 | 5,543,537(0.01%)#2,660 |
| 27. | Millville | 284 | 78,537(0.36%)#27 | 5,543,537(0.01%)#2,667 |
| 28. | Midland Park Borough | 282 | 78,537(0.36%)#28 | 5,543,537(0.01%)#2,681 |
| 29. | Ringwood Borough | 281 | 78,537(0.36%)#29 | 5,543,537(0.01%)#2,690 |
| 30. | Vineland | 278 | 78,537(0.35%)#30 | 5,543,537(0.01%)#2,717 |
| 31. | Newfoundland | 278 | 78,537(0.35%)#31 | 5,543,537(0.01%)#2,726 |
| 32. | Ramtown | 277 | 78,537(0.35%)#32 | 5,543,537(0.00%)#2,733 |
| 33. | Haddonfield Borough | 275 | 78,537(0.35%)#33 | 5,543,537(0.00%)#2,750 |
| 34. | Union City | 270 | 78,537(0.34%)#34 | 5,543,537(0.00%)#2,781 |
| 35. | Bargaintown | 270 | 78,537(0.34%)#35 | 5,543,537(0.00%)#2,788 |
| 36. | Springdale | 258 | 78,537(0.33%)#36 | 5,543,537(0.00%)#2,907 |
| 37. | Martinsville | 258 | 78,537(0.33%)#37 | 5,543,537(0.00%)#2,909 |
| 38. | Kingston Estates | 255 | 78,537(0.32%)#38 | 5,543,537(0.00%)#2,939 |
| 39. | Collingswood Borough | 252 | 78,537(0.32%)#39 | 5,543,537(0.00%)#2,966 |
| 40. | Towaco | 252 | 78,537(0.32%)#40 | 5,543,537(0.00%)#2,972 |
| 41. | Franklin Lakes Borough | 249 | 78,537(0.32%)#41 | 5,543,537(0.00%)#3,005 |
| 42. | Leisure Village | 249 | 78,537(0.32%)#42 | 5,543,537(0.00%)#3,009 |
| 43. | Fair Lawn Borough | 248 | 78,537(0.32%)#43 | 5,543,537(0.00%)#3,017 |
| 44. | Long Branch | 248 | 78,537(0.32%)#44 | 5,543,537(0.00%)#3,018 |
| 45. | Englewood | 244 | 78,537(0.31%)#45 | 5,543,537(0.00%)#3,056 |
| 46. | Tenafly Borough | 244 | 78,537(0.31%)#46 | 5,543,537(0.00%)#3,059 |
| 47. | Kinnelon Borough | 237 | 78,537(0.30%)#47 | 5,543,537(0.00%)#3,123 |
| 48. | Florence | 228 | 78,537(0.29%)#48 | 5,543,537(0.00%)#3,226 |
| 49. | Sicklerville | 227 | 78,537(0.29%)#49 | 5,543,537(0.00%)#3,227 |
| 50. | Roselle Borough | 226 | 78,537(0.29%)#50 | 5,543,537(0.00%)#3,237 |
| 51. | Mendham Borough | 226 | 78,537(0.29%)#51 | 5,543,537(0.00%)#3,245 |
| 52. | Robertsville | 222 | 78,537(0.28%)#52 | 5,543,537(0.00%)#3,271 |
| 53. | New Milford Borough | 218 | 78,537(0.28%)#53 | 5,543,537(0.00%)#3,319 |
| 54. | Rahway | 215 | 78,537(0.27%)#54 | 5,543,537(0.00%)#3,349 |
| 55. | Madison Borough | 211 | 78,537(0.27%)#55 | 5,543,537(0.00%)#3,397 |
| 56. | Lake Mohawk | 206 | 78,537(0.26%)#56 | 5,543,537(0.00%)#3,442 |
| 57. | Marlton | 204 | 78,537(0.26%)#57 | 5,543,537(0.00%)#3,470 |
| 58. | Kearny | 203 | 78,537(0.26%)#58 | 5,543,537(0.00%)#3,477 |
| 59. | Wanamassa | 201 | 78,537(0.26%)#59 | 5,543,537(0.00%)#3,513 |
| 60. | West Freehold | 200 | 78,537(0.25%)#60 | 5,543,537(0.00%)#3,516 |
| 61. | Ocean Acres | 195 | 78,537(0.25%)#61 | 5,543,537(0.00%)#3,580 |
| 62. | New Providence Borough | 194 | 78,537(0.25%)#62 | 5,543,537(0.00%)#3,602 |
| 63. | Williamstown | 193 | 78,537(0.25%)#63 | 5,543,537(0.00%)#3,617 |
| 64. | North Caldwell Borough | 192 | 78,537(0.24%)#64 | 5,543,537(0.00%)#3,640 |
| 65. | Glendora | 189 | 78,537(0.24%)#65 | 5,543,537(0.00%)#3,692 |
| 66. | Glassboro Borough | 187 | 78,537(0.24%)#66 | 5,543,537(0.00%)#3,713 |
| 67. | White Meadow Lake | 184 | 78,537(0.23%)#67 | 5,543,537(0.00%)#3,768 |
| 68. | Marmora | 183 | 78,537(0.23%)#68 | 5,543,537(0.00%)#3,792 |
| 69. | Tinton Falls Borough | 182 | 78,537(0.23%)#69 | 5,543,537(0.00%)#3,794 |
| 70. | Point Pleasant Borough | 178 | 78,537(0.23%)#70 | 5,543,537(0.00%)#3,855 |
| 71. | Oradell Borough | 176 | 78,537(0.22%)#71 | 5,543,537(0.00%)#3,892 |
| 72. | New Brunswick | 174 | 78,537(0.22%)#72 | 5,543,537(0.00%)#3,914 |
| 73. | Princeton Junction | 173 | 78,537(0.22%)#73 | 5,543,537(0.00%)#3,949 |
| 74. | Hillsborough | 172 | 78,537(0.22%)#74 | 5,543,537(0.00%)#3,950 |
| 75. | Westmont | 168 | 78,537(0.21%)#75 | 5,543,537(0.00%)#4,010 |
| 76. | Hillsdale Borough | 166 | 78,537(0.21%)#76 | 5,543,537(0.00%)#4,043 |
| 77. | Watchung Borough | 166 | 78,537(0.21%)#77 | 5,543,537(0.00%)#4,047 |
| 78. | Monmouth Junction | 162 | 78,537(0.21%)#78 | 5,543,537(0.00%)#4,109 |
| 79. | Chatham Borough | 161 | 78,537(0.20%)#79 | 5,543,537(0.00%)#4,125 |
| 80. | Morristown | 158 | 78,537(0.20%)#80 | 5,543,537(0.00%)#4,179 |
| 81. | Highland Park Borough | 156 | 78,537(0.20%)#81 | 5,543,537(0.00%)#4,203 |
| 82. | Hawthorne Borough | 155 | 78,537(0.20%)#82 | 5,543,537(0.00%)#4,215 |
| 83. | Long Valley | 154 | 78,537(0.20%)#83 | 5,543,537(0.00%)#4,263 |
| 84. | Hackensack | 152 | 78,537(0.19%)#84 | 5,543,537(0.00%)#4,285 |
| 85. | Moorestown Lenola | 152 | 78,537(0.19%)#85 | 5,543,537(0.00%)#4,290 |
| 86. | Park Ridge Borough | 151 | 78,537(0.19%)#86 | 5,543,537(0.00%)#4,311 |
| 87. | Ellisburg | 151 | 78,537(0.19%)#87 | 5,543,537(0.00%)#4,314 |
| 88. | North Arlington Borough | 149 | 78,537(0.19%)#88 | 5,543,537(0.00%)#4,342 |
| 89. | Westwood Borough | 149 | 78,537(0.19%)#89 | 5,543,537(0.00%)#4,345 |
| 90. | Cedar Knolls | 149 | 78,537(0.19%)#90 | 5,543,537(0.00%)#4,356 |
| 91. | Oakland Borough | 145 | 78,537(0.18%)#91 | 5,543,537(0.00%)#4,428 |
| 92. | Riverton Borough | 145 | 78,537(0.18%)#92 | 5,543,537(0.00%)#4,441 |
| 93. | Runnemede Borough | 143 | 78,537(0.18%)#93 | 5,543,537(0.00%)#4,477 |
| 94. | Mercerville | 138 | 78,537(0.18%)#94 | 5,543,537(0.00%)#4,582 |
| 95. | Fanwood Borough | 135 | 78,537(0.17%)#95 | 5,543,537(0.00%)#4,661 |
| 96. | Gibbsboro Borough | 129 | 78,537(0.16%)#96 | 5,543,537(0.00%)#4,815 |
| 97. | Florham Park Borough | 126 | 78,537(0.16%)#97 | 5,543,537(0.00%)#4,869 |
| 98. | Upper Saddle River Borough | 126 | 78,537(0.16%)#98 | 5,543,537(0.00%)#4,874 |
| 99. | Oakhurst | 125 | 78,537(0.16%)#99 | 5,543,537(0.00%)#4,906 |
| 100. | Princeton Meadows | 124 | 78,537(0.16%)#100 | 5,543,537(0.00%)#4,917 |
Common Questions
What are the Top 10 Cities with the Largest European Community in New Jersey?
Top 10 Cities with the Largest European Community in New Jersey are:
#1
3,392
#2
1,249
#3
1,078
#4
1,046
#5
729
#6
702
#7
643
#8
484
#9
483
#10
428
What city has the Largest European Community in New Jersey?
Lakewood has the Largest European Community in New Jersey with 3,392.
What is the Total European Population in the State of New Jersey?
Total European Population in New Jersey is 78,537.
What is the Total European Population in the United States?
Total European Population in the United States is 5,543,537.