Hasbrouck Heights borough, NJ
Hasbrouck Heights borough Overview
12,080
TOTAL POPULATION
6,133
MALE POPULATION
5,947
FEMALE POPULATION
103.13
MALES / 100 FEMALES
96.97
FEMALES / 100 MALES
43.4
MEDIAN AGE
3.4
AVG FAMILY SIZE
2.8
AVG HOUSEHOLD SIZE
$49,758
PER CAPITA INCOME
$134,806
AVG FAMILY INCOME
$114,219
AVG HOUSEHOLD INCOME
19.0%
WAGE / INCOME GAP [ % ]
81.0¢/ $1
WAGE / INCOME GAP [ $ ]
0.43
INEQUALITY / GINI INDEX
6,951
LABOR FORCE [ PEOPLE ]
70.0%
PERCENT IN LABOR FORCE
6.2%
UNEMPLOYMENT RATE
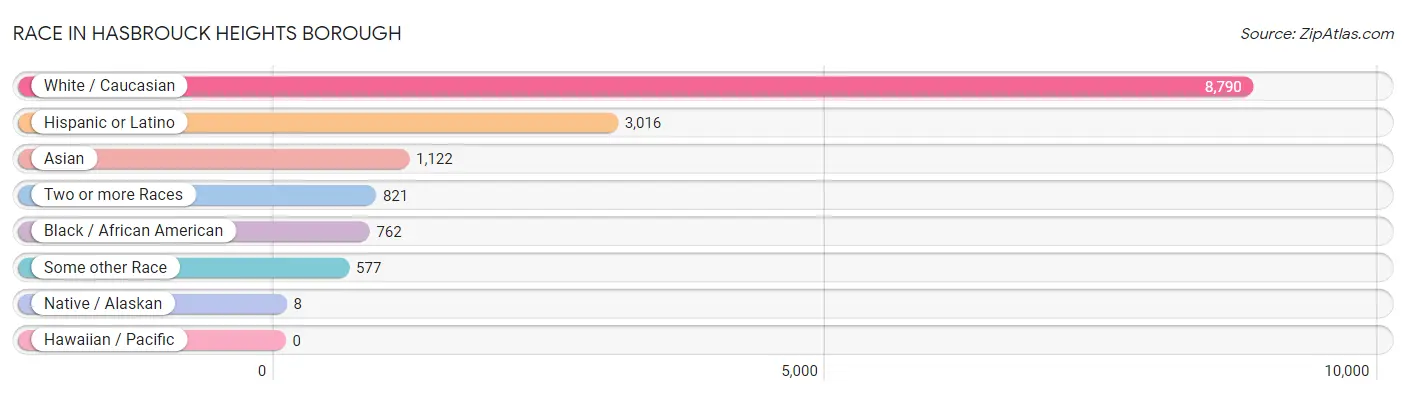
Race in Hasbrouck Heights borough
The most populous races in Hasbrouck Heights borough are White / Caucasian (8,790 | 72.8%), Hispanic or Latino (3,016 | 25.0%), and Asian (1,122 | 9.3%).
| Race | # Population | % Population |
| Asian | 1,122 | 9.3% |
| Black / African American | 762 | 6.3% |
| Hawaiian / Pacific | 0 | 0.0% |
| Hispanic or Latino | 3,016 | 25.0% |
| Native / Alaskan | 8 | 0.1% |
| White / Caucasian | 8,790 | 72.8% |
| Two or more Races | 821 | 6.8% |
| Some other Race | 577 | 4.8% |
| Total | 12,080 | 100.0% |
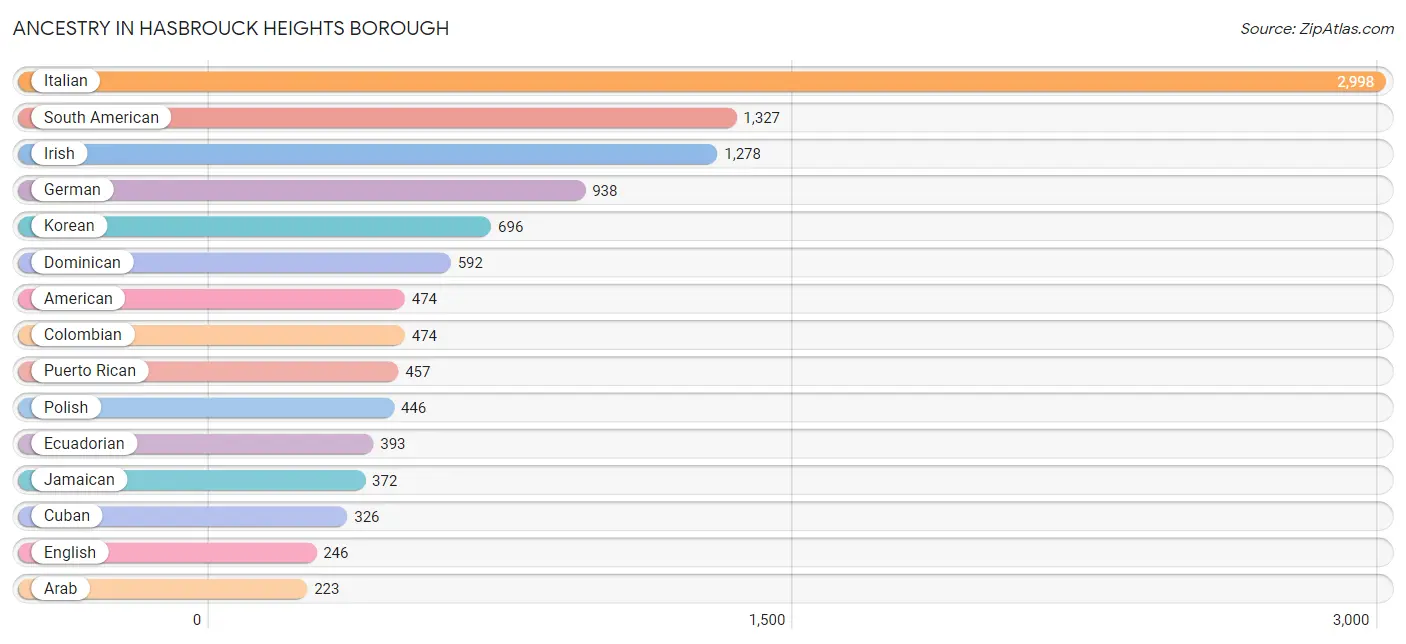
Ancestry in Hasbrouck Heights borough
The most populous ancestries reported in Hasbrouck Heights borough are Italian (2,998 | 24.8%), South American (1,327 | 11.0%), Irish (1,278 | 10.6%), German (938 | 7.8%), and Korean (696 | 5.8%), together accounting for 59.9% of all Hasbrouck Heights borough residents.
| Ancestry | # Population | % Population |
| African | 28 | 0.2% |
| American | 474 | 3.9% |
| Arab | 223 | 1.8% |
| Armenian | 172 | 1.4% |
| Bhutanese | 10 | 0.1% |
| Bolivian | 95 | 0.8% |
| Burmese | 44 | 0.4% |
| Canadian | 58 | 0.5% |
| Central American | 86 | 0.7% |
| Central American Indian | 37 | 0.3% |
| Cherokee | 70 | 0.6% |
| Chilean | 64 | 0.5% |
| Colombian | 474 | 3.9% |
| Cuban | 326 | 2.7% |
| Czech | 124 | 1.0% |
| Dominican | 592 | 4.9% |
| Dutch | 108 | 0.9% |
| Eastern European | 49 | 0.4% |
| Ecuadorian | 393 | 3.3% |
| Egyptian | 54 | 0.4% |
| English | 246 | 2.0% |
| European | 56 | 0.5% |
| Finnish | 60 | 0.5% |
| French | 177 | 1.5% |
| French Canadian | 48 | 0.4% |
| German | 938 | 7.8% |
| Greek | 41 | 0.3% |
| Honduran | 54 | 0.4% |
| Hungarian | 54 | 0.4% |
| Indian (Asian) | 190 | 1.6% |
| Irish | 1,278 | 10.6% |
| Italian | 2,998 | 24.8% |
| Jamaican | 372 | 3.1% |
| Jordanian | 93 | 0.8% |
| Korean | 696 | 5.8% |
| Laotian | 129 | 1.1% |
| Latvian | 25 | 0.2% |
| Lebanese | 53 | 0.4% |
| Norwegian | 37 | 0.3% |
| Peruvian | 166 | 1.4% |
| Polish | 446 | 3.7% |
| Portuguese | 126 | 1.0% |
| Puerto Rican | 457 | 3.8% |
| Russian | 95 | 0.8% |
| Salvadoran | 32 | 0.3% |
| Scandinavian | 15 | 0.1% |
| Scotch-Irish | 59 | 0.5% |
| Scottish | 64 | 0.5% |
| Slavic | 16 | 0.1% |
| Slovak | 38 | 0.3% |
| South American | 1,327 | 11.0% |
| Spaniard | 82 | 0.7% |
| Sri Lankan | 115 | 0.9% |
| Subsaharan African | 28 | 0.2% |
| Swedish | 48 | 0.4% |
| Swiss | 16 | 0.1% |
| Thai | 95 | 0.8% |
| Ukrainian | 105 | 0.9% |
| Venezuelan | 135 | 1.1% |
| Welsh | 76 | 0.6% | View All 60 Rows |
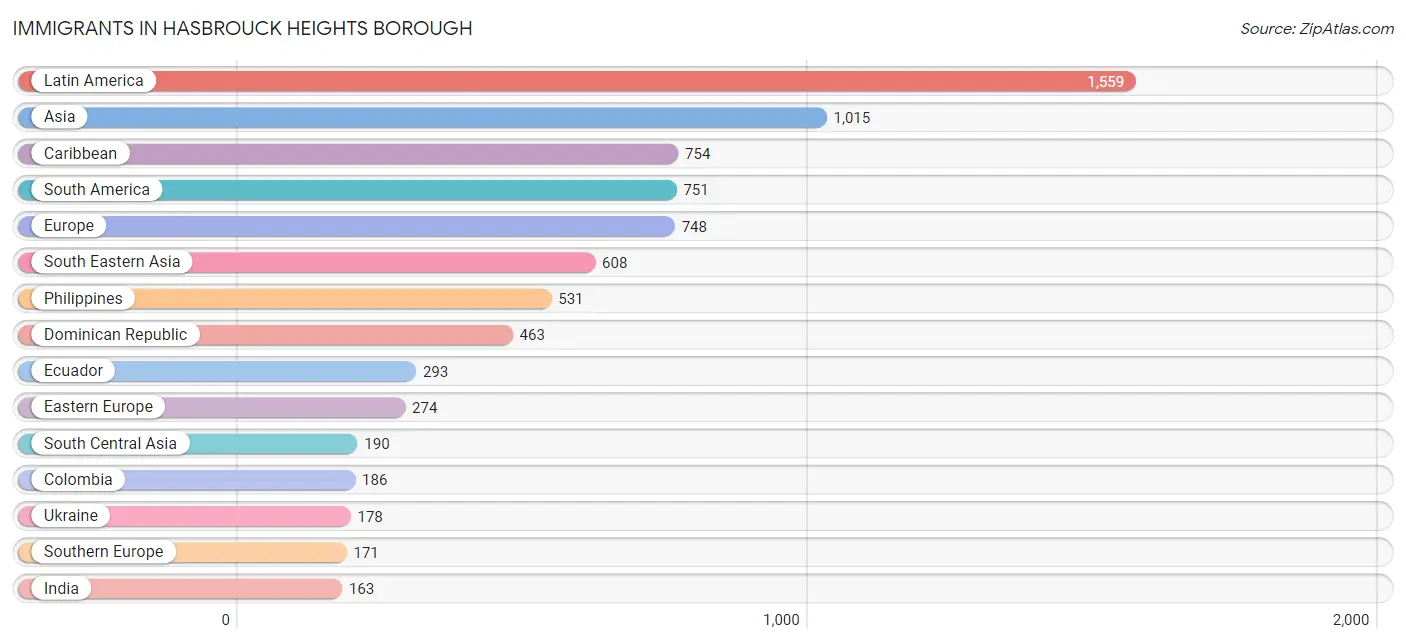
Immigrants in Hasbrouck Heights borough
The most numerous immigrant groups reported in Hasbrouck Heights borough came from Latin America (1,559 | 12.9%), Asia (1,015 | 8.4%), Caribbean (754 | 6.2%), South America (751 | 6.2%), and Europe (748 | 6.2%), together accounting for 40.0% of all Hasbrouck Heights borough residents.
| Immigration Origin | # Population | % Population |
| Africa | 72 | 0.6% |
| Asia | 1,015 | 8.4% |
| Bolivia | 95 | 0.8% |
| Canada | 21 | 0.2% |
| Caribbean | 754 | 6.2% |
| Central America | 54 | 0.4% |
| Chile | 44 | 0.4% |
| China | 33 | 0.3% |
| Colombia | 186 | 1.5% |
| Cuba | 128 | 1.1% |
| Czechoslovakia | 62 | 0.5% |
| Dominican Republic | 463 | 3.8% |
| Eastern Africa | 28 | 0.2% |
| Eastern Asia | 68 | 0.6% |
| Eastern Europe | 274 | 2.3% |
| Ecuador | 293 | 2.4% |
| Egypt | 44 | 0.4% |
| England | 18 | 0.2% |
| Europe | 748 | 6.2% |
| Germany | 155 | 1.3% |
| Honduras | 54 | 0.4% |
| Hong Kong | 33 | 0.3% |
| India | 163 | 1.3% |
| Indonesia | 17 | 0.1% |
| Ireland | 34 | 0.3% |
| Italy | 125 | 1.0% |
| Jamaica | 163 | 1.3% |
| Japan | 10 | 0.1% |
| Jordan | 61 | 0.5% |
| Kenya | 28 | 0.2% |
| Korea | 25 | 0.2% |
| Kuwait | 32 | 0.3% |
| Latin America | 1,559 | 12.9% |
| Latvia | 12 | 0.1% |
| Lebanon | 35 | 0.3% |
| Moldova | 8 | 0.1% |
| Nepal | 27 | 0.2% |
| Northern Africa | 44 | 0.4% |
| Northern Europe | 148 | 1.2% |
| Peru | 16 | 0.1% |
| Philippines | 531 | 4.4% |
| Poland | 6 | 0.1% |
| Portugal | 19 | 0.2% |
| Russia | 8 | 0.1% |
| Scotland | 13 | 0.1% |
| South America | 751 | 6.2% |
| South Central Asia | 190 | 1.6% |
| South Eastern Asia | 608 | 5.0% |
| Southern Europe | 171 | 1.4% |
| Spain | 27 | 0.2% |
| Turkey | 21 | 0.2% |
| Ukraine | 178 | 1.5% |
| Venezuela | 117 | 1.0% |
| Vietnam | 60 | 0.5% |
| Western Asia | 149 | 1.2% |
| Western Europe | 155 | 1.3% | View All 56 Rows |
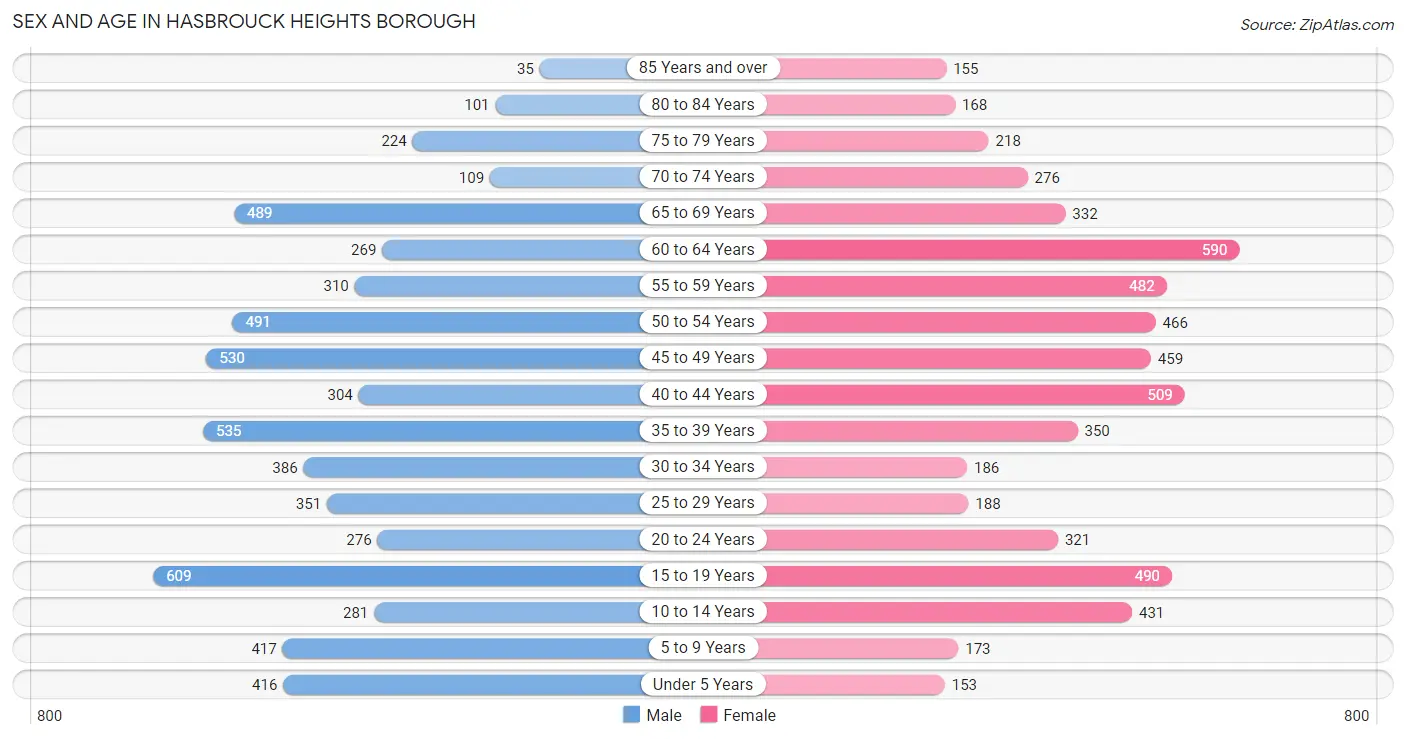
Sex and Age in Hasbrouck Heights borough
Sex and Age in Hasbrouck Heights borough
The most populous age groups in Hasbrouck Heights borough are 15 to 19 Years (609 | 9.9%) for men and 60 to 64 Years (590 | 9.9%) for women.
| Age Bracket | Male | Female |
| Under 5 Years | 416 (6.8%) | 153 (2.6%) |
| 5 to 9 Years | 417 (6.8%) | 173 (2.9%) |
| 10 to 14 Years | 281 (4.6%) | 431 (7.2%) |
| 15 to 19 Years | 609 (9.9%) | 490 (8.2%) |
| 20 to 24 Years | 276 (4.5%) | 321 (5.4%) |
| 25 to 29 Years | 351 (5.7%) | 188 (3.2%) |
| 30 to 34 Years | 386 (6.3%) | 186 (3.1%) |
| 35 to 39 Years | 535 (8.7%) | 350 (5.9%) |
| 40 to 44 Years | 304 (5.0%) | 509 (8.6%) |
| 45 to 49 Years | 530 (8.6%) | 459 (7.7%) |
| 50 to 54 Years | 491 (8.0%) | 466 (7.8%) |
| 55 to 59 Years | 310 (5.1%) | 482 (8.1%) |
| 60 to 64 Years | 269 (4.4%) | 590 (9.9%) |
| 65 to 69 Years | 489 (8.0%) | 332 (5.6%) |
| 70 to 74 Years | 109 (1.8%) | 276 (4.6%) |
| 75 to 79 Years | 224 (3.6%) | 218 (3.7%) |
| 80 to 84 Years | 101 (1.7%) | 168 (2.8%) |
| 85 Years and over | 35 (0.6%) | 155 (2.6%) |
| Total | 6,133 (100.0%) | 5,947 (100.0%) |
Families and Households in Hasbrouck Heights borough
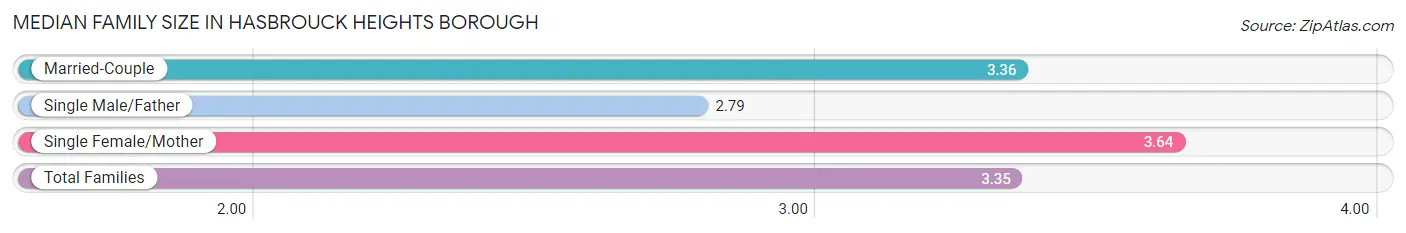
Median Family Size in Hasbrouck Heights borough
The median family size in Hasbrouck Heights borough is 3.35 persons per family, with single female/mother families (472 | 15.4%) accounting for the largest median family size of 3.64 persons per family. On the other hand, single male/father families (282 | 9.2%) represent the smallest median family size with 2.79 persons per family.
| Family Type | # Families | Family Size |
| Married-Couple | 2,305 (75.3%) | 3.36 |
| Single Male/Father | 282 (9.2%) | 2.79 |
| Single Female/Mother | 472 (15.4%) | 3.64 |
| Total Families | 3,059 (100.0%) | 3.35 |
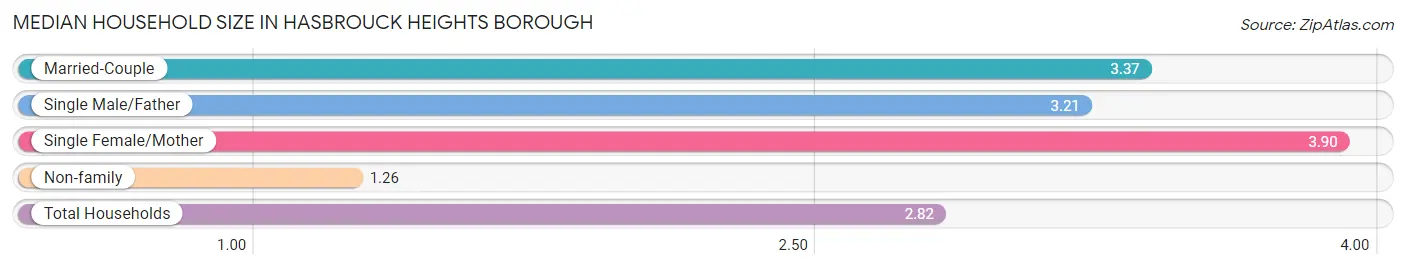
Median Household Size in Hasbrouck Heights borough
The median household size in Hasbrouck Heights borough is 2.82 persons per household, with single female/mother households (472 | 11.0%) accounting for the largest median household size of 3.9 persons per household. non-family households (1,224 | 28.6%) represent the smallest median household size with 1.26 persons per household.
| Household Type | # Households | Household Size |
| Married-Couple | 2,305 (53.8%) | 3.37 |
| Single Male/Father | 282 (6.6%) | 3.21 |
| Single Female/Mother | 472 (11.0%) | 3.90 |
| Non-family | 1,224 (28.6%) | 1.26 |
| Total Households | 4,283 (100.0%) | 2.82 |
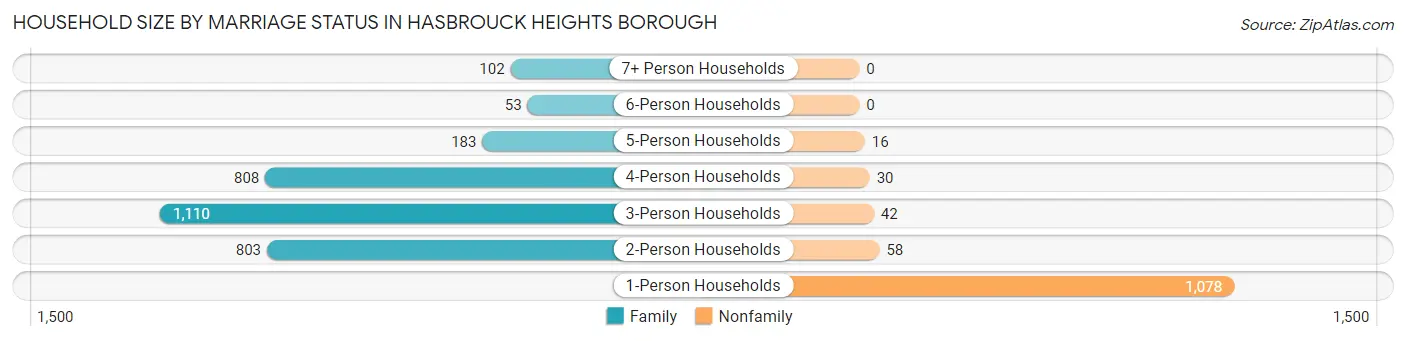
Household Size by Marriage Status in Hasbrouck Heights borough
Out of a total of 4,283 households in Hasbrouck Heights borough, 3,059 (71.4%) are family households, while 1,224 (28.6%) are nonfamily households. The most numerous type of family households are 3-person households, comprising 1,110, and the most common type of nonfamily households are 1-person households, comprising 1,078.
| Household Size | Family Households | Nonfamily Households |
| 1-Person Households | - | 1,078 (25.2%) |
| 2-Person Households | 803 (18.8%) | 58 (1.3%) |
| 3-Person Households | 1,110 (25.9%) | 42 (1.0%) |
| 4-Person Households | 808 (18.9%) | 30 (0.7%) |
| 5-Person Households | 183 (4.3%) | 16 (0.4%) |
| 6-Person Households | 53 (1.2%) | 0 (0.0%) |
| 7+ Person Households | 102 (2.4%) | 0 (0.0%) |
| Total | 3,059 (71.4%) | 1,224 (28.6%) |
Female Fertility in Hasbrouck Heights borough
Fertility by Age in Hasbrouck Heights borough
Average fertility rate in Hasbrouck Heights borough is 38.0 births per 1,000 women. Women in the age bracket of 20 to 34 years have the highest fertility rate with 144.0 births per 1,000 women. Women in the age bracket of 20 to 34 years acount for 100.0% of all women with births.

| Age Bracket | Women with Births | Births / 1,000 Women |
| 15 to 19 years | 0 (0.0%) | 0.0 |
| 20 to 34 years | 100 (100.0%) | 144.0 |
| 35 to 50 years | 0 (0.0%) | 0.0 |
| Total | 100 (100.0%) | 38.0 |
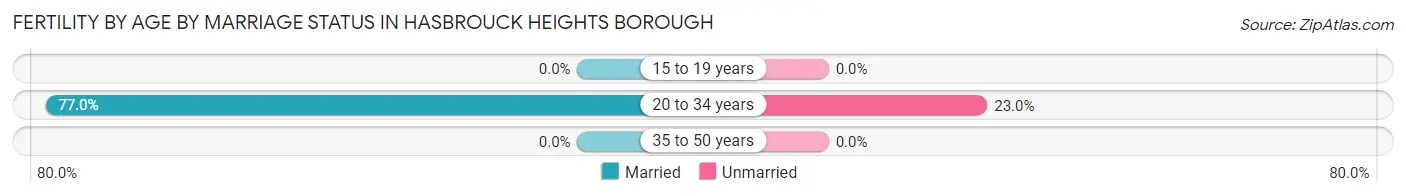
Fertility by Age by Marriage Status in Hasbrouck Heights borough
77.0% of women with births (100) in Hasbrouck Heights borough are married. The highest percentage of unmarried women with births falls into 20 to 34 years age bracket with 23.0% of them unmarried at the time of birth, while the lowest percentage of unmarried women with births belong to 20 to 34 years age bracket with 23.0% of them unmarried.
| Age Bracket | Married | Unmarried |
| 15 to 19 years | 0 (0.0%) | 0 (0.0%) |
| 20 to 34 years | 77 (77.0%) | 23 (23.0%) |
| 35 to 50 years | 0 (0.0%) | 0 (0.0%) |
| Total | 77 (77.0%) | 23 (23.0%) |
Fertility by Education in Hasbrouck Heights borough
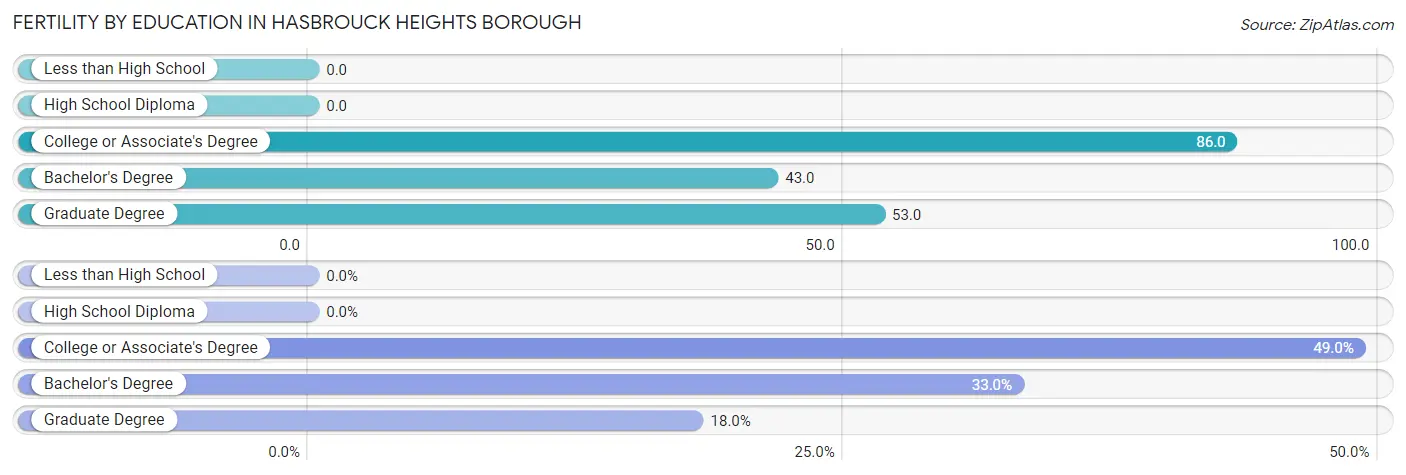
| Educational Attainment | Women with Births | Births / 1,000 Women |
| Less than High School | 0 (0.0%) | 0.0 |
| High School Diploma | 0 (0.0%) | 0.0 |
| College or Associate's Degree | 49 (49.0%) | 86.0 |
| Bachelor's Degree | 33 (33.0%) | 43.0 |
| Graduate Degree | 18 (18.0%) | 53.0 |
| Total | 100 (100.0%) | 38.0 |
Fertility by Education by Marriage Status in Hasbrouck Heights borough
23.0% of women with births in Hasbrouck Heights borough are unmarried. Women with the educational attainment of bachelor's degree are most likely to be married with 100.0% of them married at childbirth, while women with the educational attainment of college or associate's degree are least likely to be married with 46.9% of them unmarried at childbirth.
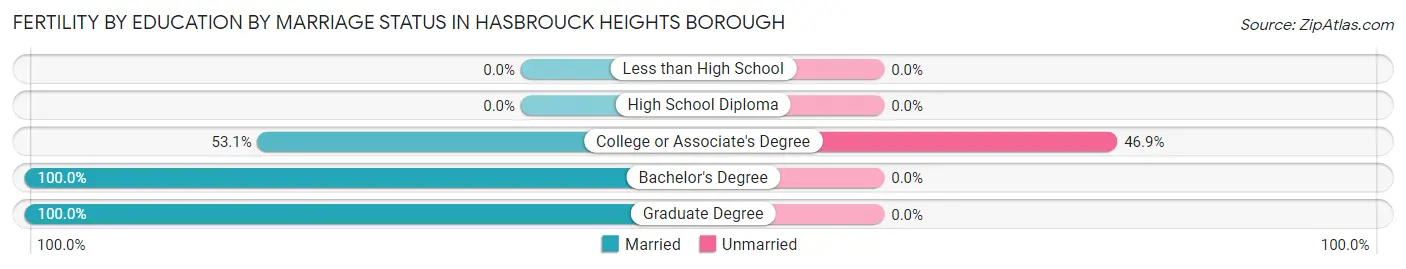
| Educational Attainment | Married | Unmarried |
| Less than High School | 0 (0.0%) | 0 (0.0%) |
| High School Diploma | 0 (0.0%) | 0 (0.0%) |
| College or Associate's Degree | 26 (53.1%) | 23 (46.9%) |
| Bachelor's Degree | 33 (100.0%) | 0 (0.0%) |
| Graduate Degree | 18 (100.0%) | 0 (0.0%) |
| Total | 77 (77.0%) | 23 (23.0%) |
Income in Hasbrouck Heights borough
Income Overview in Hasbrouck Heights borough
Per Capita Income in Hasbrouck Heights borough is $49,758, while median incomes of families and households are $134,806 and $114,219 respectively.
| Characteristic | Number | Measure |
| Per Capita Income | 12,080 | $49,758 |
| Median Family Income | 3,059 | $134,806 |
| Mean Family Income | 3,059 | $160,277 |
| Median Household Income | 4,283 | $114,219 |
| Mean Household Income | 4,283 | $138,438 |
| Income Deficit | 3,059 | $0 |
| Wage / Income Gap (%) | 12,080 | 19.01% |
| Wage / Income Gap ($) | 12,080 | 80.99¢ per $1 |
| Gini / Inequality Index | 12,080 | 0.43 |
Earnings by Sex in Hasbrouck Heights borough
Average Earnings in Hasbrouck Heights borough are $55,797, $61,380 for men and $49,714 for women, a difference of 19.0%.
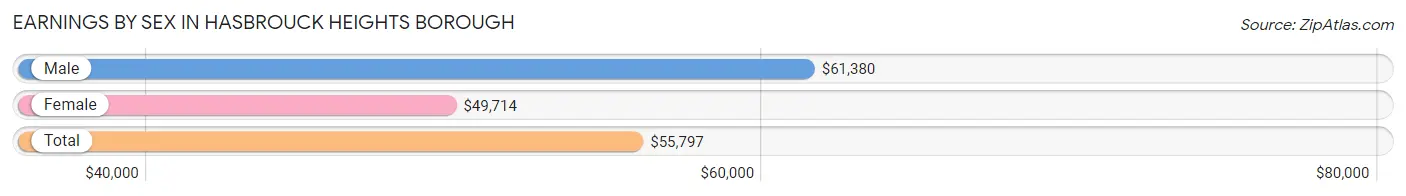
| Sex | Number | Average Earnings |
| Male | 3,691 (53.4%) | $61,380 |
| Female | 3,226 (46.6%) | $49,714 |
| Total | 6,917 (100.0%) | $55,797 |
Earnings by Sex by Income Bracket in Hasbrouck Heights borough
The most common earnings brackets in Hasbrouck Heights borough are $100,000+ for men (1,156 | 31.3%) and $75,000 to $99,999 for women (587 | 18.2%).
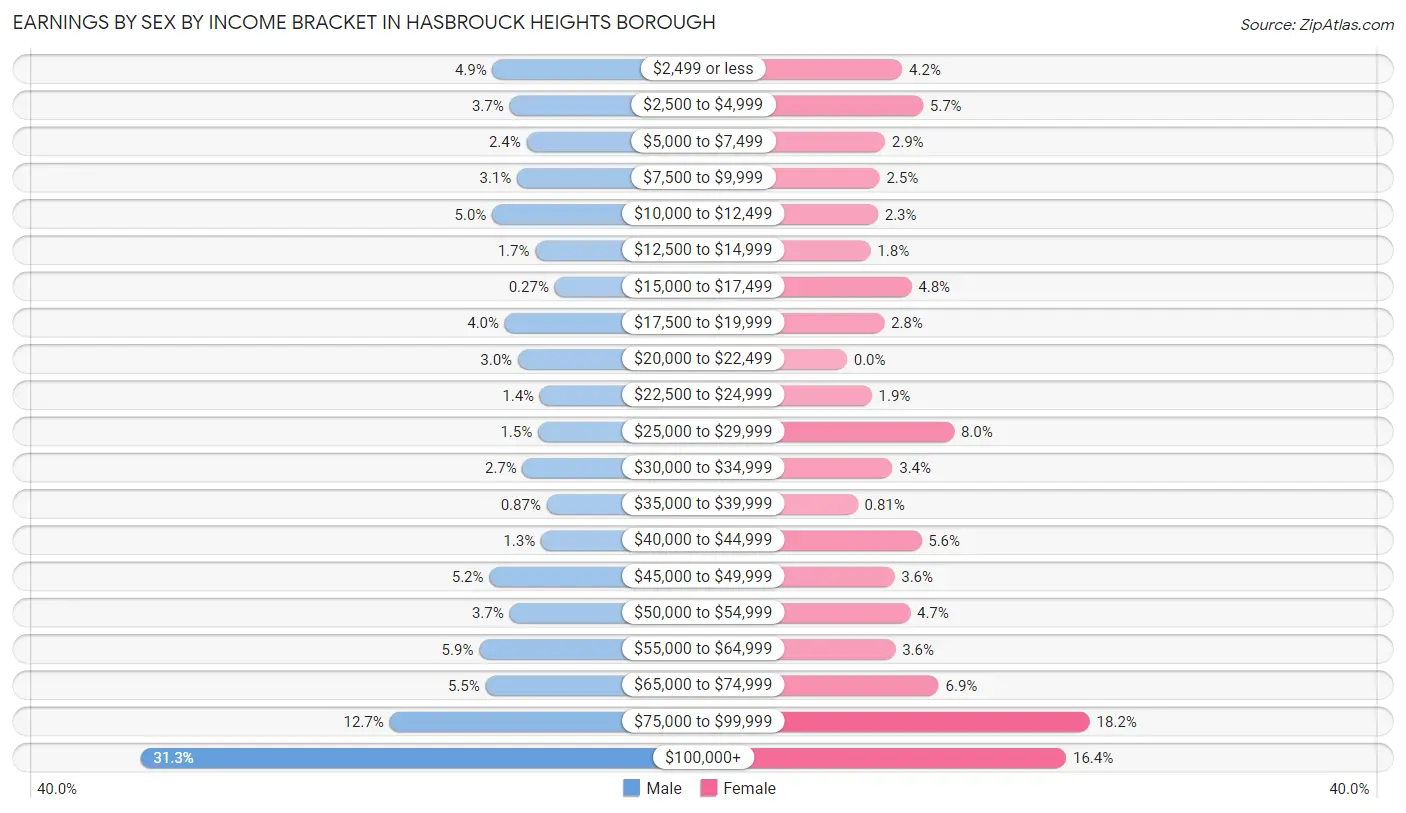
| Income | Male | Female |
| $2,499 or less | 182 (4.9%) | 134 (4.2%) |
| $2,500 to $4,999 | 135 (3.7%) | 184 (5.7%) |
| $5,000 to $7,499 | 88 (2.4%) | 92 (2.9%) |
| $7,500 to $9,999 | 114 (3.1%) | 79 (2.5%) |
| $10,000 to $12,499 | 183 (5.0%) | 75 (2.3%) |
| $12,500 to $14,999 | 64 (1.7%) | 57 (1.8%) |
| $15,000 to $17,499 | 10 (0.3%) | 156 (4.8%) |
| $17,500 to $19,999 | 148 (4.0%) | 90 (2.8%) |
| $20,000 to $22,499 | 112 (3.0%) | 0 (0.0%) |
| $22,500 to $24,999 | 51 (1.4%) | 60 (1.9%) |
| $25,000 to $29,999 | 56 (1.5%) | 259 (8.0%) |
| $30,000 to $34,999 | 99 (2.7%) | 110 (3.4%) |
| $35,000 to $39,999 | 32 (0.9%) | 26 (0.8%) |
| $40,000 to $44,999 | 48 (1.3%) | 180 (5.6%) |
| $45,000 to $49,999 | 191 (5.2%) | 115 (3.6%) |
| $50,000 to $54,999 | 135 (3.7%) | 153 (4.7%) |
| $55,000 to $64,999 | 219 (5.9%) | 117 (3.6%) |
| $65,000 to $74,999 | 201 (5.4%) | 222 (6.9%) |
| $75,000 to $99,999 | 467 (12.7%) | 587 (18.2%) |
| $100,000+ | 1,156 (31.3%) | 530 (16.4%) |
| Total | 3,691 (100.0%) | 3,226 (100.0%) |
Earnings by Sex by Educational Attainment in Hasbrouck Heights borough
Average earnings in Hasbrouck Heights borough are $74,896 for men and $53,026 for women, a difference of 29.2%. Men with an educational attainment of graduate degree enjoy the highest average annual earnings of $101,696, while those with high school diploma education earn the least with $55,339. Women with an educational attainment of graduate degree earn the most with the average annual earnings of $113,036, while those with college or associate's degree education have the smallest earnings of $40,139.
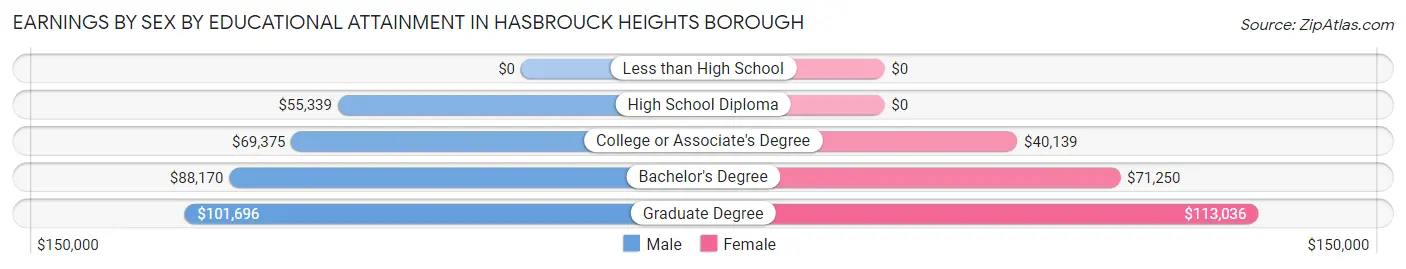
| Educational Attainment | Male Income | Female Income |
| Less than High School | - | - |
| High School Diploma | $55,339 | $0 |
| College or Associate's Degree | $69,375 | $40,139 |
| Bachelor's Degree | $88,170 | $71,250 |
| Graduate Degree | $101,696 | $113,036 |
| Total | $74,896 | $53,026 |
Family Income in Hasbrouck Heights borough
Family Income Brackets in Hasbrouck Heights borough
According to the Hasbrouck Heights borough family income data, there are 866 families falling into the $200,000+ income range, which is the most common income bracket and makes up 28.3% of all families. Conversely, the $15,000 to $24,999 income bracket is the least frequent group with only 28 families (0.9%) belonging to this category.
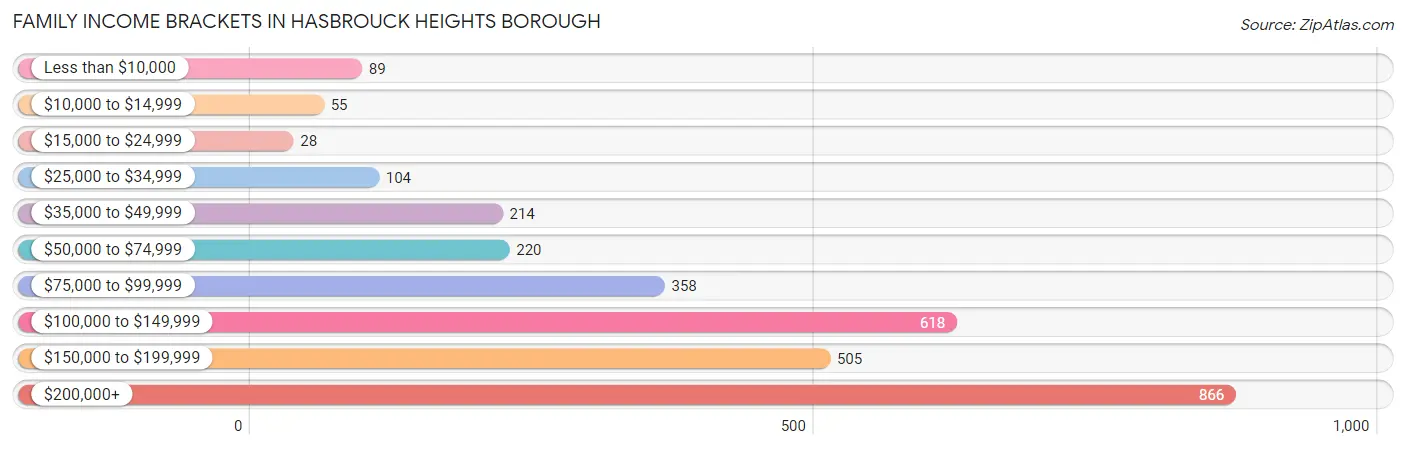
| Income Bracket | # Families | % Families |
| Less than $10,000 | 89 | 2.9% |
| $10,000 to $14,999 | 55 | 1.8% |
| $15,000 to $24,999 | 28 | 0.9% |
| $25,000 to $34,999 | 104 | 3.4% |
| $35,000 to $49,999 | 214 | 7.0% |
| $50,000 to $74,999 | 220 | 7.2% |
| $75,000 to $99,999 | 358 | 11.7% |
| $100,000 to $149,999 | 618 | 20.2% |
| $150,000 to $199,999 | 505 | 16.5% |
| $200,000+ | 866 | 28.3% |
Family Income by Famaliy Size in Hasbrouck Heights borough
7+ person families (87 | 2.8%) account for the highest median family income in Hasbrouck Heights borough with $219,375 per family, while 2-person families (914 | 29.9%) have the highest median income of $54,278 per family member.
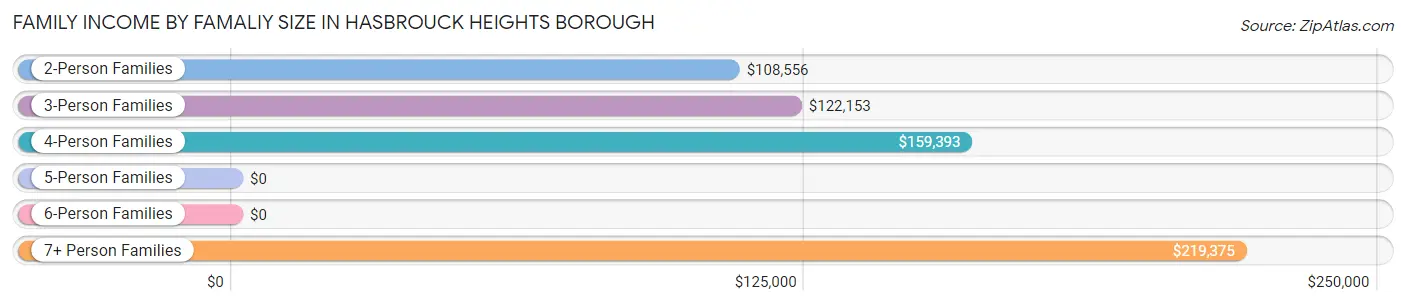
| Income Bracket | # Families | Median Income |
| 2-Person Families | 914 (29.9%) | $108,556 |
| 3-Person Families | 1,066 (34.8%) | $122,153 |
| 4-Person Families | 769 (25.1%) | $159,393 |
| 5-Person Families | 192 (6.3%) | $0 |
| 6-Person Families | 31 (1.0%) | $0 |
| 7+ Person Families | 87 (2.8%) | $219,375 |
| Total | 3,059 (100.0%) | $134,806 |
Family Income by Number of Earners in Hasbrouck Heights borough
The median family income in Hasbrouck Heights borough is $134,806, with families comprising 3+ earners (542) having the highest median family income of $221,875, while families with no earners (211) have the lowest median family income of $81,518, accounting for 17.7% and 6.9% of families, respectively.
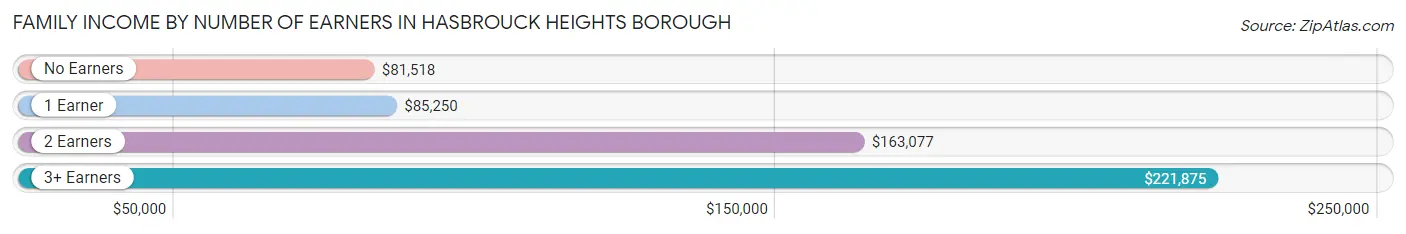
| Number of Earners | # Families | Median Income |
| No Earners | 211 (6.9%) | $81,518 |
| 1 Earner | 756 (24.7%) | $85,250 |
| 2 Earners | 1,550 (50.7%) | $163,077 |
| 3+ Earners | 542 (17.7%) | $221,875 |
| Total | 3,059 (100.0%) | $134,806 |
Household Income in Hasbrouck Heights borough
Household Income Brackets in Hasbrouck Heights borough
With 959 households falling in the category, the $200,000+ income range is the most frequent in Hasbrouck Heights borough, accounting for 22.4% of all households. In contrast, only 90 households (2.1%) fall into the less than $10,000 income bracket, making it the least populous group.
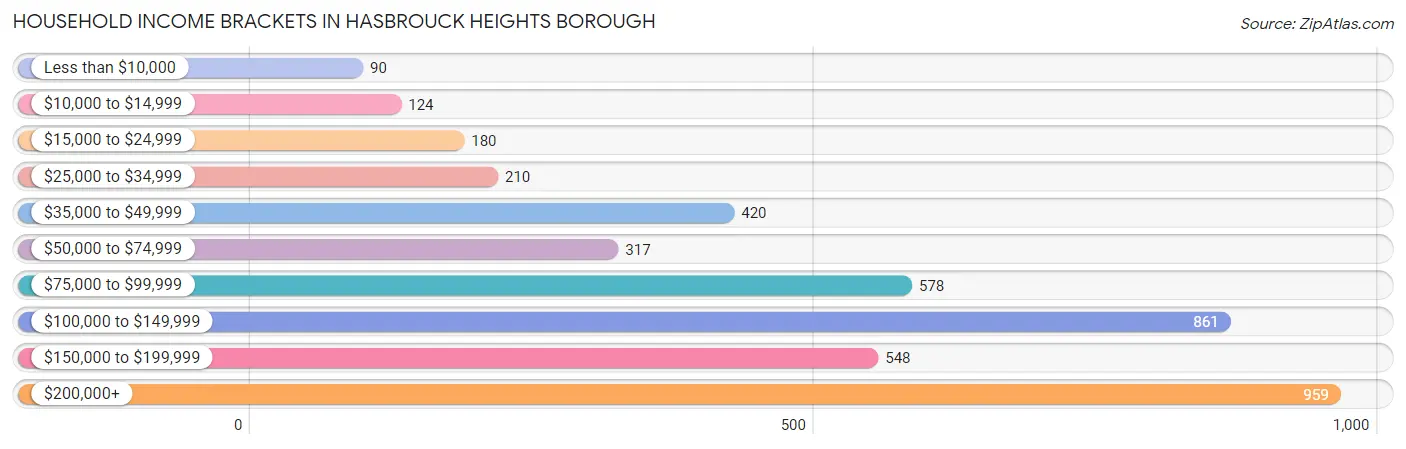
| Income Bracket | # Households | % Households |
| Less than $10,000 | 90 | 2.1% |
| $10,000 to $14,999 | 124 | 2.9% |
| $15,000 to $24,999 | 180 | 4.2% |
| $25,000 to $34,999 | 210 | 4.9% |
| $35,000 to $49,999 | 420 | 9.8% |
| $50,000 to $74,999 | 317 | 7.4% |
| $75,000 to $99,999 | 578 | 13.5% |
| $100,000 to $149,999 | 861 | 20.1% |
| $150,000 to $199,999 | 548 | 12.8% |
| $200,000+ | 959 | 22.4% |
Household Income by Householder Age in Hasbrouck Heights borough
The median household income in Hasbrouck Heights borough is $114,219, with the highest median household income of $122,092 found in the 25 to 44 years age bracket for the primary householder. A total of 903 households (21.1%) fall into this category. Meanwhile, the 15 to 24 years age bracket for the primary householder has the lowest median household income of $0, with 76 households (1.8%) in this group.
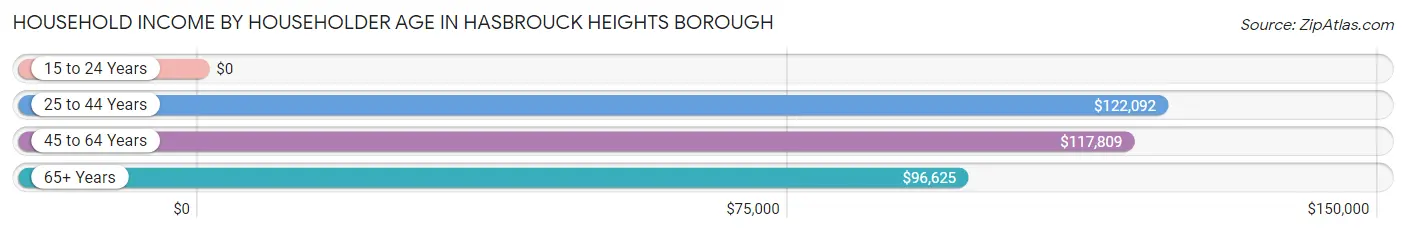
| Income Bracket | # Households | Median Income |
| 15 to 24 Years | 76 (1.8%) | $0 |
| 25 to 44 Years | 903 (21.1%) | $122,092 |
| 45 to 64 Years | 1,931 (45.1%) | $117,809 |
| 65+ Years | 1,373 (32.1%) | $96,625 |
| Total | 4,283 (100.0%) | $114,219 |
Poverty in Hasbrouck Heights borough
Income Below Poverty by Sex and Age in Hasbrouck Heights borough
With 9.3% poverty level for males and 9.1% for females among the residents of Hasbrouck Heights borough, 16 and 17 year old males and 15 year old females are the most vulnerable to poverty, with 111 males (43.4%) and 33 females (22.2%) in their respective age groups living below the poverty level.
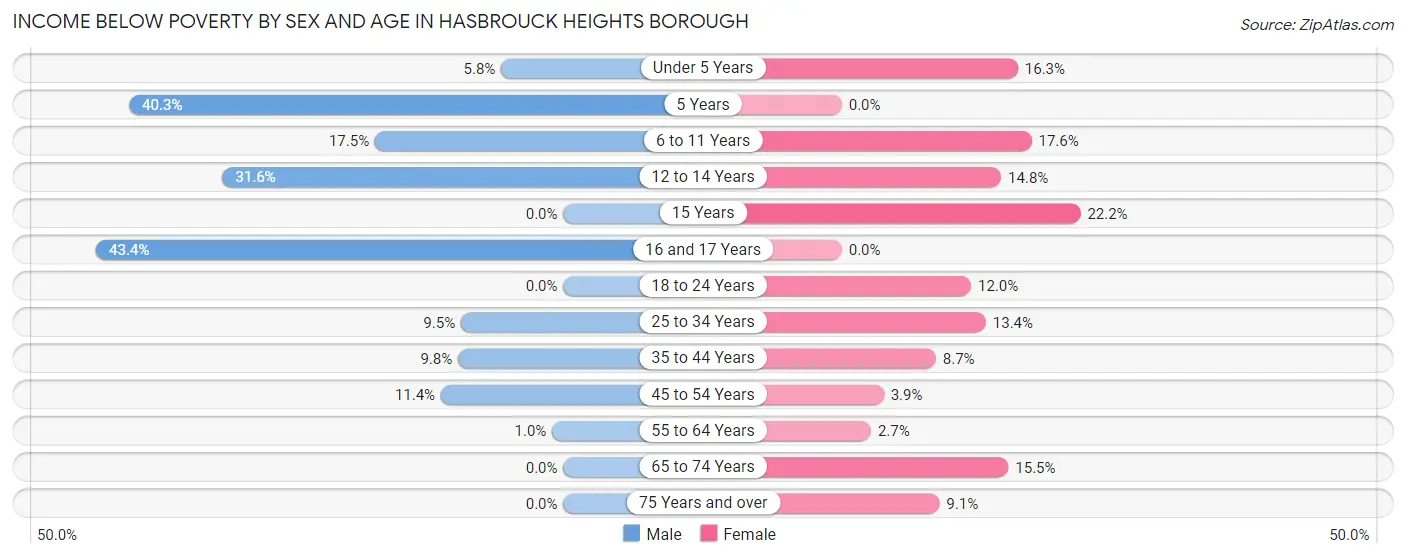
| Age Bracket | Male | Female |
| Under 5 Years | 24 (5.8%) | 25 (16.3%) |
| 5 Years | 27 (40.3%) | 0 (0.0%) |
| 6 to 11 Years | 75 (17.5%) | 50 (17.6%) |
| 12 to 14 Years | 56 (31.6%) | 46 (14.8%) |
| 15 Years | 0 (0.0%) | 33 (22.2%) |
| 16 and 17 Years | 111 (43.4%) | 0 (0.0%) |
| 18 to 24 Years | 0 (0.0%) | 57 (12.0%) |
| 25 to 34 Years | 70 (9.5%) | 50 (13.4%) |
| 35 to 44 Years | 82 (9.8%) | 75 (8.7%) |
| 45 to 54 Years | 116 (11.4%) | 36 (3.9%) |
| 55 to 64 Years | 6 (1.0%) | 29 (2.7%) |
| 65 to 74 Years | 0 (0.0%) | 94 (15.5%) |
| 75 Years and over | 0 (0.0%) | 49 (9.1%) |
| Total | 567 (9.3%) | 544 (9.1%) |
Income Above Poverty by Sex and Age in Hasbrouck Heights borough
According to the poverty statistics in Hasbrouck Heights borough, males aged 15 years and females aged 5 years are the age groups that are most secure financially, with 100.0% of males and 100.0% of females in these age groups living above the poverty line.
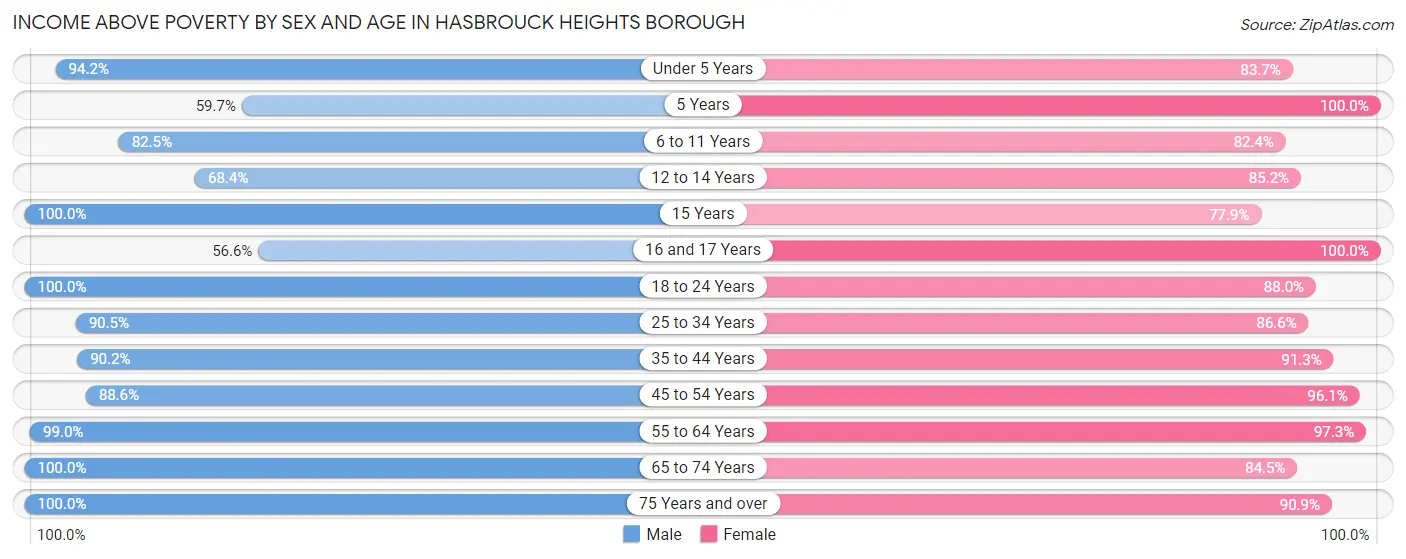
| Age Bracket | Male | Female |
| Under 5 Years | 392 (94.2%) | 128 (83.7%) |
| 5 Years | 40 (59.7%) | 9 (100.0%) |
| 6 to 11 Years | 354 (82.5%) | 234 (82.4%) |
| 12 to 14 Years | 121 (68.4%) | 265 (85.2%) |
| 15 Years | 130 (100.0%) | 116 (77.8%) |
| 16 and 17 Years | 145 (56.6%) | 187 (100.0%) |
| 18 to 24 Years | 499 (100.0%) | 418 (88.0%) |
| 25 to 34 Years | 667 (90.5%) | 324 (86.6%) |
| 35 to 44 Years | 757 (90.2%) | 784 (91.3%) |
| 45 to 54 Years | 905 (88.6%) | 889 (96.1%) |
| 55 to 64 Years | 573 (99.0%) | 1,043 (97.3%) |
| 65 to 74 Years | 598 (100.0%) | 514 (84.5%) |
| 75 Years and over | 360 (100.0%) | 492 (90.9%) |
| Total | 5,541 (90.7%) | 5,403 (90.8%) |
Income Below Poverty Among Married-Couple Families in Hasbrouck Heights borough
The poverty statistics for married-couple families in Hasbrouck Heights borough show that 4.6% or 105 of the total 2,305 families live below the poverty line. Families with 3 or 4 children have the highest poverty rate of 59.5%, comprising of 75 families. On the other hand, families with no children have the lowest poverty rate of 0.0%, which includes 0 families.
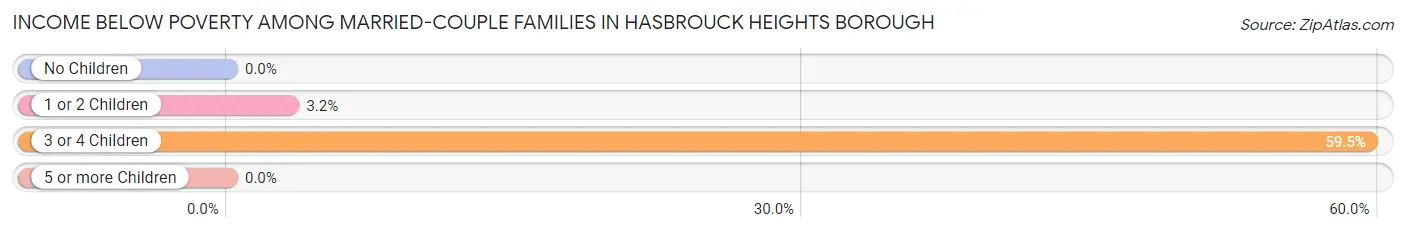
| Children | Above Poverty | Below Poverty |
| No Children | 1,245 (100.0%) | 0 (0.0%) |
| 1 or 2 Children | 904 (96.8%) | 30 (3.2%) |
| 3 or 4 Children | 51 (40.5%) | 75 (59.5%) |
| 5 or more Children | 0 (0.0%) | 0 (0.0%) |
| Total | 2,200 (95.4%) | 105 (4.6%) |
Income Below Poverty Among Single-Parent Households in Hasbrouck Heights borough
According to the poverty data in Hasbrouck Heights borough, 14.5% or 41 single-father households and 8.1% or 38 single-mother households are living below the poverty line. Among single-father households, those with 1 or 2 children have the highest poverty rate, with 41 households (56.2%) experiencing poverty. Likewise, among single-mother households, those with no children have the highest poverty rate, with 15 households (17.9%) falling below the poverty line.
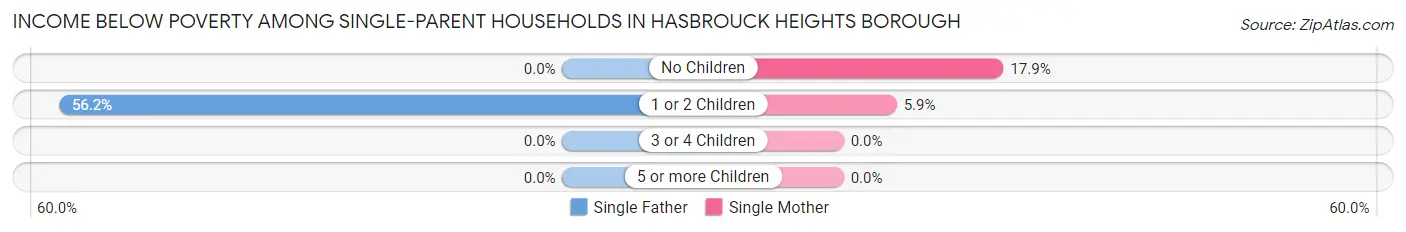
| Children | Single Father | Single Mother |
| No Children | 0 (0.0%) | 15 (17.9%) |
| 1 or 2 Children | 41 (56.2%) | 23 (5.9%) |
| 3 or 4 Children | 0 (0.0%) | 0 (0.0%) |
| 5 or more Children | 0 (0.0%) | 0 (0.0%) |
| Total | 41 (14.5%) | 38 (8.1%) |
Income Below Poverty Among Married-Couple vs Single-Parent Households in Hasbrouck Heights borough
The poverty data for Hasbrouck Heights borough shows that 105 of the married-couple family households (4.6%) and 79 of the single-parent households (10.5%) are living below the poverty level. Within the married-couple family households, those with 3 or 4 children have the highest poverty rate, with 75 households (59.5%) falling below the poverty line. Among the single-parent households, those with 1 or 2 children have the highest poverty rate, with 64 household (13.9%) living below poverty.
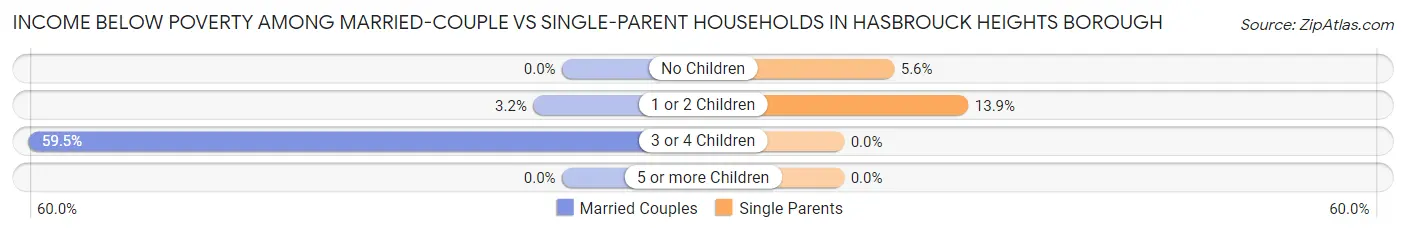
| Children | Married-Couple Families | Single-Parent Households |
| No Children | 0 (0.0%) | 15 (5.6%) |
| 1 or 2 Children | 30 (3.2%) | 64 (13.9%) |
| 3 or 4 Children | 75 (59.5%) | 0 (0.0%) |
| 5 or more Children | 0 (0.0%) | 0 (0.0%) |
| Total | 105 (4.6%) | 79 (10.5%) |
Employment Characteristics in Hasbrouck Heights borough
Employment by Class of Employer in Hasbrouck Heights borough
Among the 6,313 employed individuals in Hasbrouck Heights borough, private company employees (4,419 | 70.0%), local government employees (583 | 9.2%), and not-for-profit organizations (474 | 7.5%) make up the most common classes of employment.
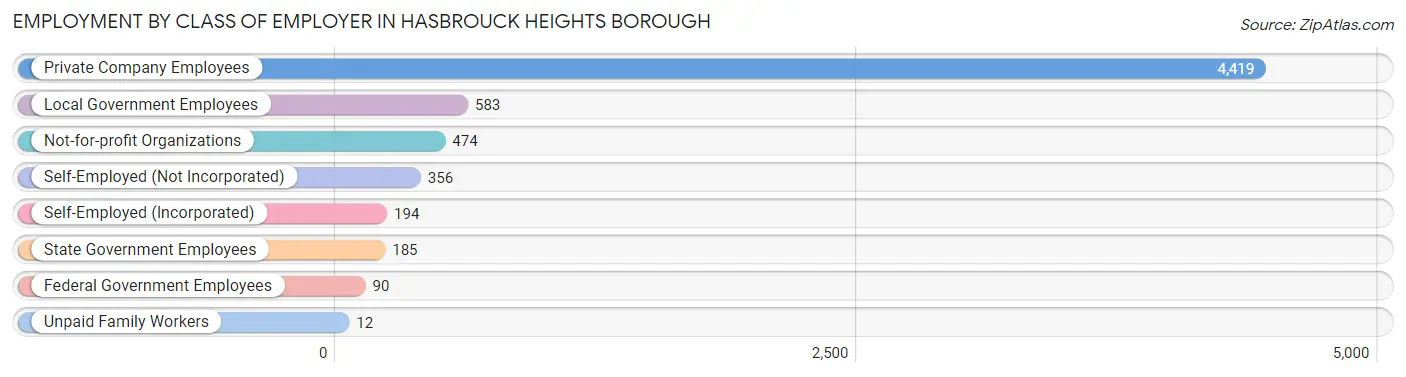
| Employer Class | # Employees | % Employees |
| Private Company Employees | 4,419 | 70.0% |
| Self-Employed (Incorporated) | 194 | 3.1% |
| Self-Employed (Not Incorporated) | 356 | 5.6% |
| Not-for-profit Organizations | 474 | 7.5% |
| Local Government Employees | 583 | 9.2% |
| State Government Employees | 185 | 2.9% |
| Federal Government Employees | 90 | 1.4% |
| Unpaid Family Workers | 12 | 0.2% |
| Total | 6,313 | 100.0% |
Employment Status by Age in Hasbrouck Heights borough
According to the labor force statistics for Hasbrouck Heights borough, out of the total population over 16 years of age (9,930), 70.0% or 6,951 individuals are in the labor force, with 6.2% or 431 of them unemployed. The age group with the highest labor force participation rate is 30 to 34 years, with 95.8% or 548 individuals in the labor force. Within the labor force, the 16 to 19 years age range has the highest percentage of unemployed individuals, with 16.6% or 63 of them being unemployed.
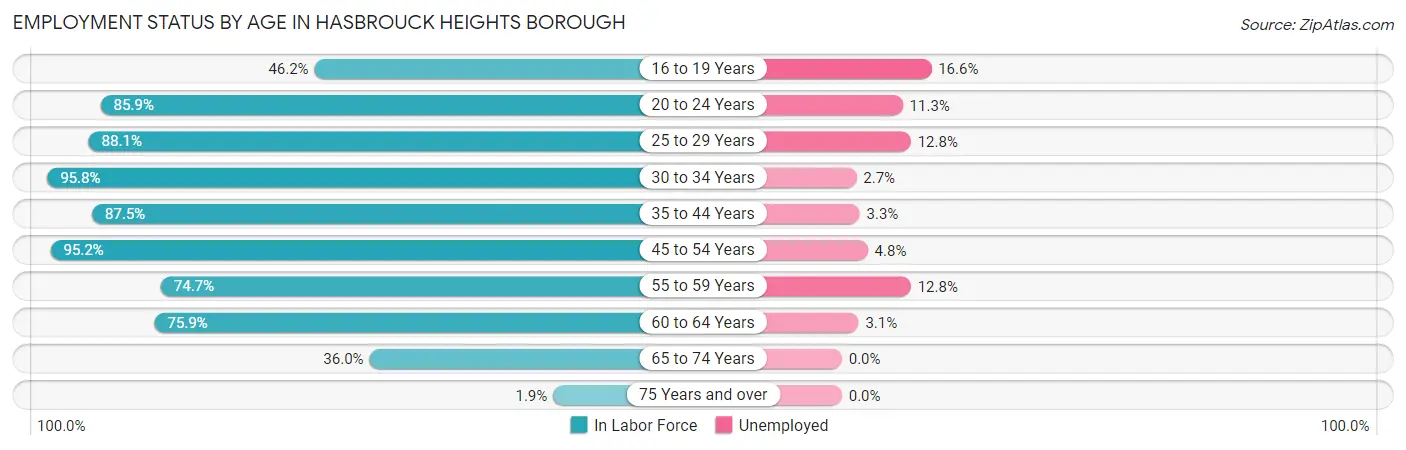
| Age Bracket | In Labor Force | Unemployed |
| 16 to 19 Years | 379 (46.2%) | 63 (16.6%) |
| 20 to 24 Years | 513 (85.9%) | 58 (11.3%) |
| 25 to 29 Years | 475 (88.1%) | 61 (12.8%) |
| 30 to 34 Years | 548 (95.8%) | 15 (2.7%) |
| 35 to 44 Years | 1,486 (87.5%) | 49 (3.3%) |
| 45 to 54 Years | 1,853 (95.2%) | 89 (4.8%) |
| 55 to 59 Years | 592 (74.7%) | 76 (12.8%) |
| 60 to 64 Years | 652 (75.9%) | 20 (3.1%) |
| 65 to 74 Years | 434 (36.0%) | 0 (0.0%) |
| 75 Years and over | 17 (1.9%) | 0 (0.0%) |
| Total | 6,951 (70.0%) | 431 (6.2%) |
Employment Status by Educational Attainment in Hasbrouck Heights borough
According to labor force statistics for Hasbrouck Heights borough, 87.5% of individuals (5,605) out of the total population between 25 and 64 years of age (6,406) are in the labor force, with 5.5% or 308 of them being unemployed. The group with the highest labor force participation rate are those with the educational attainment of bachelor's degree or higher, with 89.7% or 2,635 individuals in the labor force. Within the labor force, individuals with less than high school education have the highest percentage of unemployment, with 10.1% or 20 of them being unemployed.
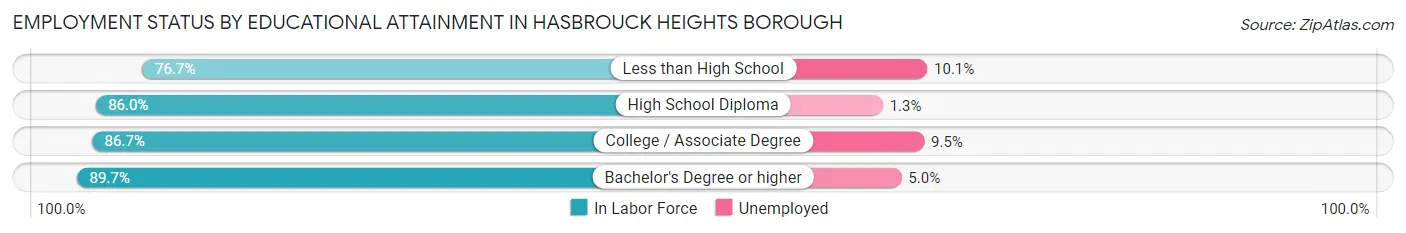
| Educational Attainment | In Labor Force | Unemployed |
| Less than High School | 198 (76.7%) | 26 (10.1%) |
| High School Diploma | 1,291 (86.0%) | 20 (1.3%) |
| College / Associate Degree | 1,482 (86.7%) | 162 (9.5%) |
| Bachelor's Degree or higher | 2,635 (89.7%) | 147 (5.0%) |
| Total | 5,605 (87.5%) | 352 (5.5%) |
Employment Occupations by Sex in Hasbrouck Heights borough
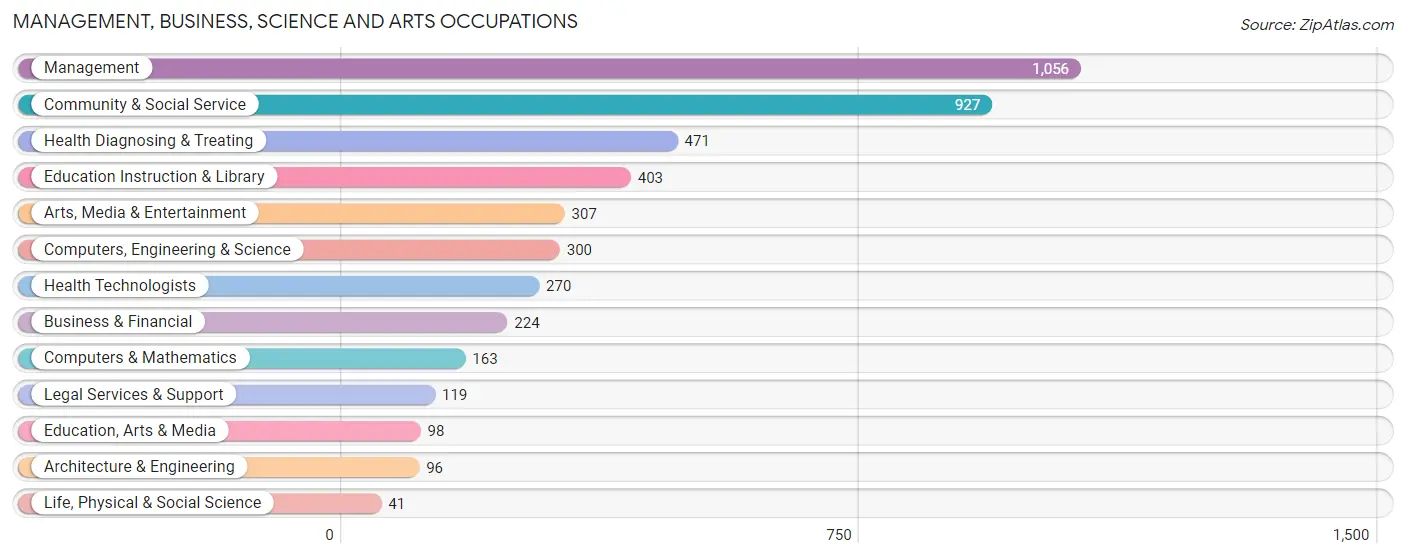
Management, Business, Science and Arts Occupations
The most common Management, Business, Science and Arts occupations in Hasbrouck Heights borough are Management (1,056 | 16.2%), Community & Social Service (927 | 14.2%), Health Diagnosing & Treating (471 | 7.2%), Education Instruction & Library (403 | 6.2%), and Arts, Media & Entertainment (307 | 4.7%).
Management, Business, Science and Arts Occupations by Sex
Within the Management, Business, Science and Arts occupations in Hasbrouck Heights borough, the most male-oriented occupations are Architecture & Engineering (100.0%), Life, Physical & Social Science (100.0%), and Computers, Engineering & Science (92.0%), while the most female-oriented occupations are Education Instruction & Library (75.2%), Education, Arts & Media (66.3%), and Health Diagnosing & Treating (63.7%).
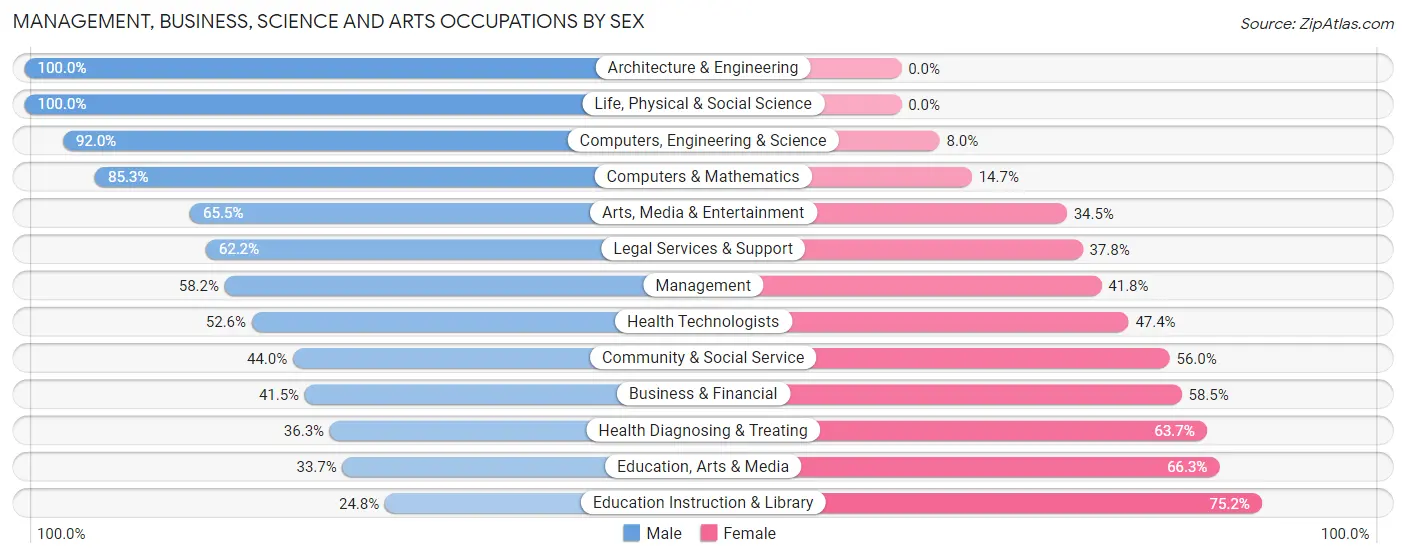
| Occupation | Male | Female |
| Management | 615 (58.2%) | 441 (41.8%) |
| Business & Financial | 93 (41.5%) | 131 (58.5%) |
| Computers, Engineering & Science | 276 (92.0%) | 24 (8.0%) |
| Computers & Mathematics | 139 (85.3%) | 24 (14.7%) |
| Architecture & Engineering | 96 (100.0%) | 0 (0.0%) |
| Life, Physical & Social Science | 41 (100.0%) | 0 (0.0%) |
| Community & Social Service | 408 (44.0%) | 519 (56.0%) |
| Education, Arts & Media | 33 (33.7%) | 65 (66.3%) |
| Legal Services & Support | 74 (62.2%) | 45 (37.8%) |
| Education Instruction & Library | 100 (24.8%) | 303 (75.2%) |
| Arts, Media & Entertainment | 201 (65.5%) | 106 (34.5%) |
| Health Diagnosing & Treating | 171 (36.3%) | 300 (63.7%) |
| Health Technologists | 142 (52.6%) | 128 (47.4%) |
| Total (Category) | 1,563 (52.5%) | 1,415 (47.5%) |
| Total (Overall) | 3,427 (52.6%) | 3,090 (47.4%) |
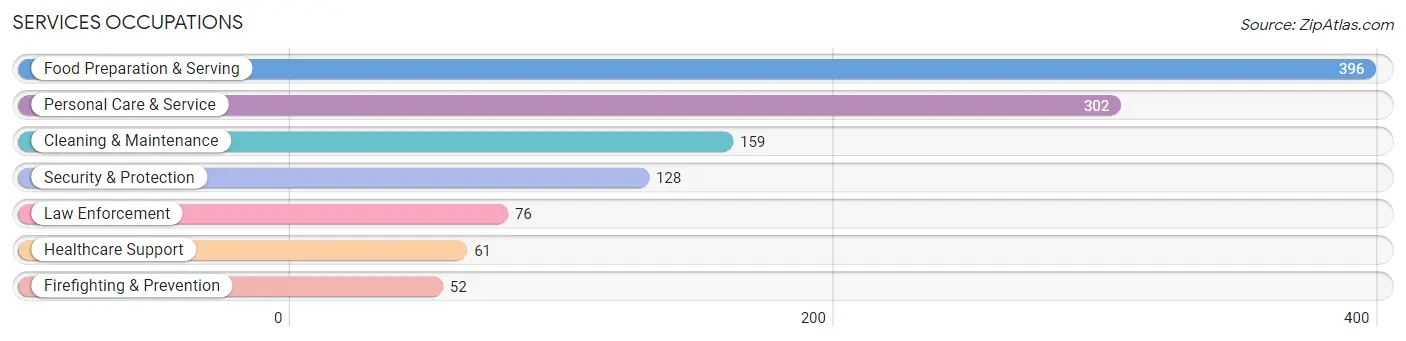
Services Occupations
The most common Services occupations in Hasbrouck Heights borough are Food Preparation & Serving (396 | 6.1%), Personal Care & Service (302 | 4.6%), Cleaning & Maintenance (159 | 2.4%), Security & Protection (128 | 2.0%), and Law Enforcement (76 | 1.2%).
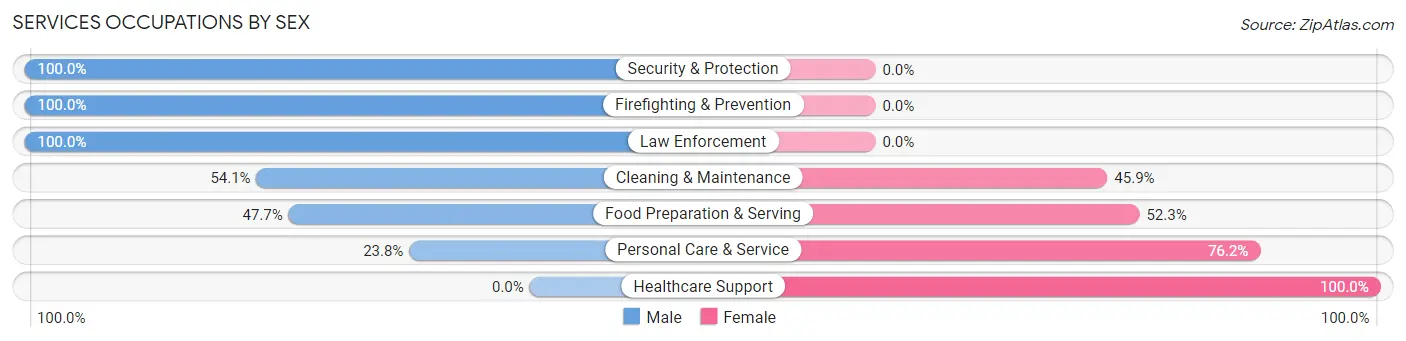
Services Occupations by Sex
Within the Services occupations in Hasbrouck Heights borough, the most male-oriented occupations are Security & Protection (100.0%), Firefighting & Prevention (100.0%), and Law Enforcement (100.0%), while the most female-oriented occupations are Healthcare Support (100.0%), Personal Care & Service (76.2%), and Food Preparation & Serving (52.3%).
| Occupation | Male | Female |
| Healthcare Support | 0 (0.0%) | 61 (100.0%) |
| Security & Protection | 128 (100.0%) | 0 (0.0%) |
| Firefighting & Prevention | 52 (100.0%) | 0 (0.0%) |
| Law Enforcement | 76 (100.0%) | 0 (0.0%) |
| Food Preparation & Serving | 189 (47.7%) | 207 (52.3%) |
| Cleaning & Maintenance | 86 (54.1%) | 73 (45.9%) |
| Personal Care & Service | 72 (23.8%) | 230 (76.2%) |
| Total (Category) | 475 (45.4%) | 571 (54.6%) |
| Total (Overall) | 3,427 (52.6%) | 3,090 (47.4%) |
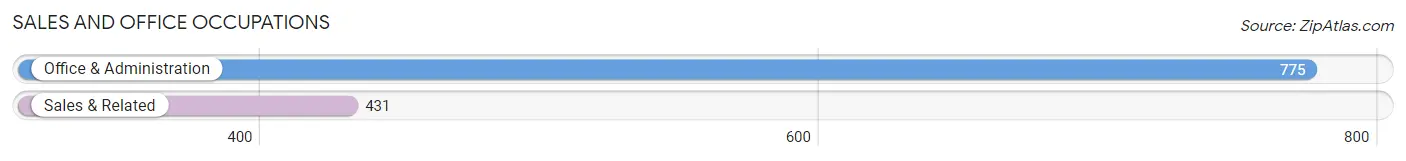
Sales and Office Occupations
The most common Sales and Office occupations in Hasbrouck Heights borough are Office & Administration (775 | 11.9%), and Sales & Related (431 | 6.6%).
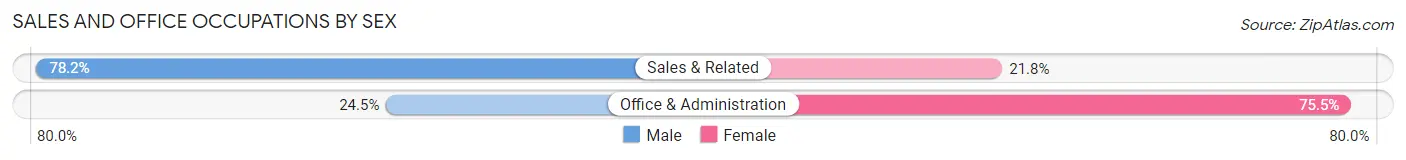
Sales and Office Occupations by Sex
| Occupation | Male | Female |
| Sales & Related | 337 (78.2%) | 94 (21.8%) |
| Office & Administration | 190 (24.5%) | 585 (75.5%) |
| Total (Category) | 527 (43.7%) | 679 (56.3%) |
| Total (Overall) | 3,427 (52.6%) | 3,090 (47.4%) |
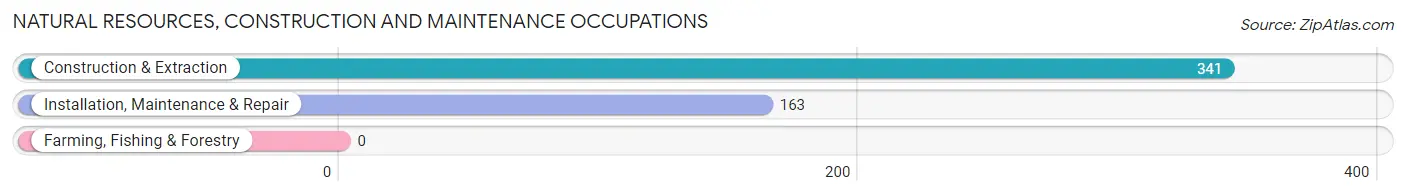
Natural Resources, Construction and Maintenance Occupations
The most common Natural Resources, Construction and Maintenance occupations in Hasbrouck Heights borough are Construction & Extraction (341 | 5.2%), and Installation, Maintenance & Repair (163 | 2.5%).
Natural Resources, Construction and Maintenance Occupations by Sex
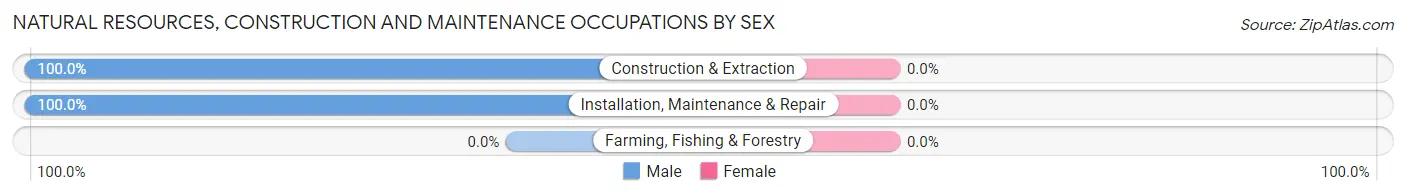
| Occupation | Male | Female |
| Farming, Fishing & Forestry | 0 (0.0%) | 0 (0.0%) |
| Construction & Extraction | 341 (100.0%) | 0 (0.0%) |
| Installation, Maintenance & Repair | 163 (100.0%) | 0 (0.0%) |
| Total (Category) | 504 (100.0%) | 0 (0.0%) |
| Total (Overall) | 3,427 (52.6%) | 3,090 (47.4%) |
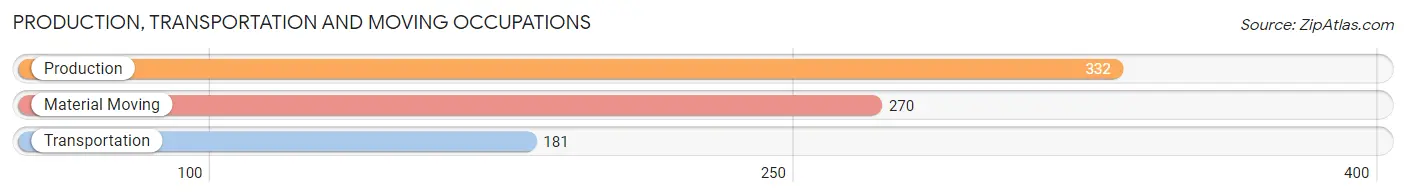
Production, Transportation and Moving Occupations
The most common Production, Transportation and Moving occupations in Hasbrouck Heights borough are Production (332 | 5.1%), Material Moving (270 | 4.1%), and Transportation (181 | 2.8%).
Production, Transportation and Moving Occupations by Sex
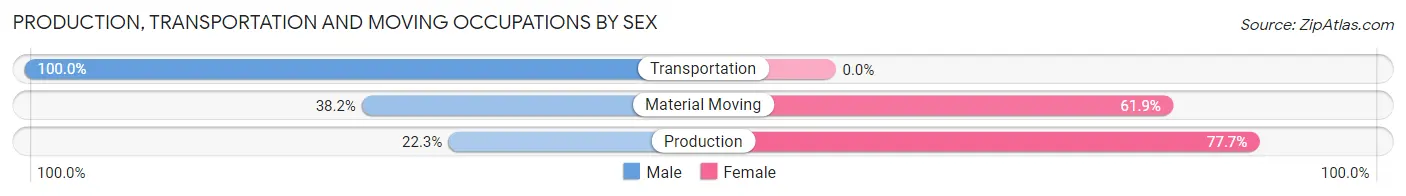
| Occupation | Male | Female |
| Production | 74 (22.3%) | 258 (77.7%) |
| Transportation | 181 (100.0%) | 0 (0.0%) |
| Material Moving | 103 (38.2%) | 167 (61.9%) |
| Total (Category) | 358 (45.7%) | 425 (54.3%) |
| Total (Overall) | 3,427 (52.6%) | 3,090 (47.4%) |
Employment Industries by Sex in Hasbrouck Heights borough
Employment Industries in Hasbrouck Heights borough
The major employment industries in Hasbrouck Heights borough include Health Care & Social Assistance (1,049 | 16.1%), Retail Trade (659 | 10.1%), Manufacturing (589 | 9.0%), Accommodation & Food Services (499 | 7.7%), and Finance & Insurance (490 | 7.5%).

Employment Industries by Sex in Hasbrouck Heights borough
The Hasbrouck Heights borough industries that see more men than women are Agriculture, Fishing & Hunting (100.0%), Transportation & Warehousing (100.0%), and Utilities (100.0%), whereas the industries that tend to have a higher number of women are Health Care & Social Assistance (80.4%), Educational Services (74.0%), and Information (72.3%).
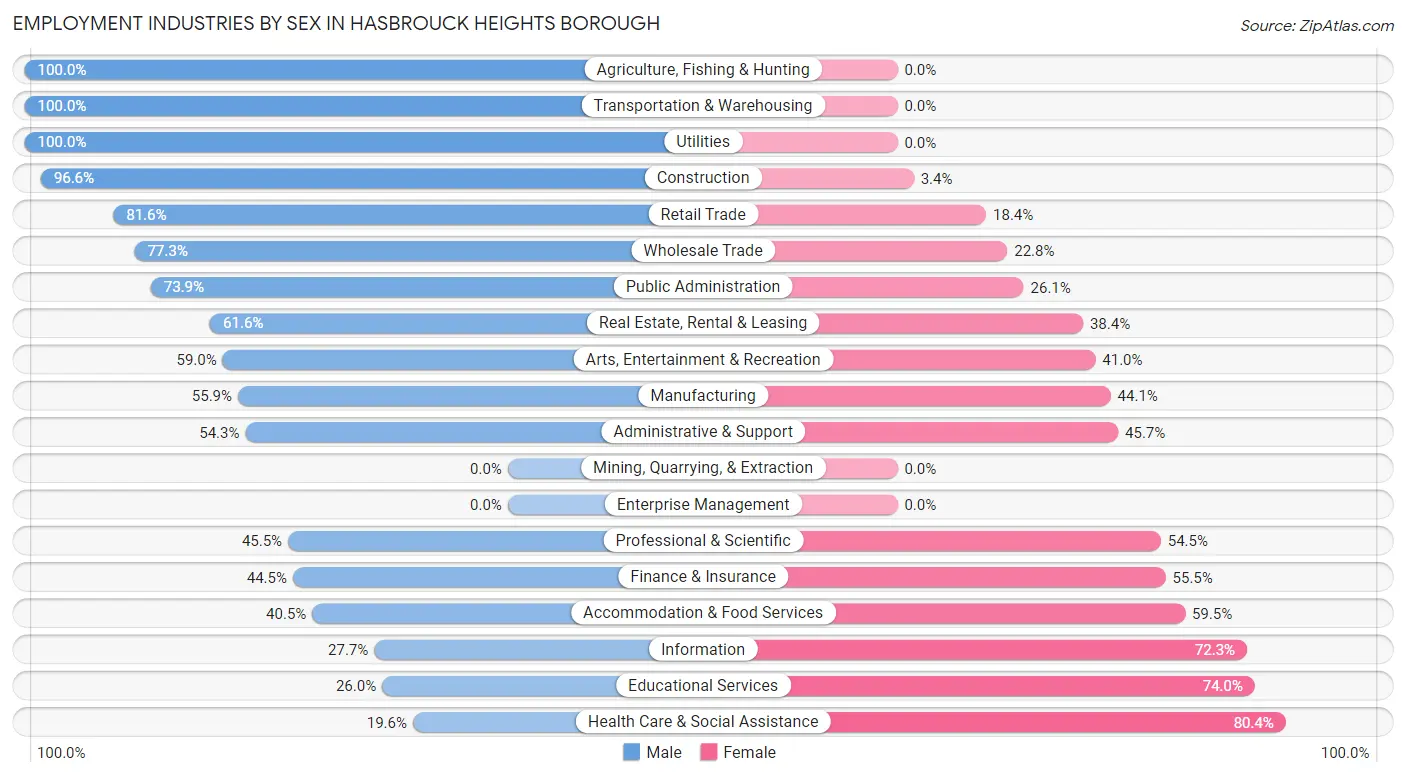
| Industry | Male | Female |
| Agriculture, Fishing & Hunting | 9 (100.0%) | 0 (0.0%) |
| Mining, Quarrying, & Extraction | 0 (0.0%) | 0 (0.0%) |
| Construction | 344 (96.6%) | 12 (3.4%) |
| Manufacturing | 329 (55.9%) | 260 (44.1%) |
| Wholesale Trade | 180 (77.2%) | 53 (22.8%) |
| Retail Trade | 538 (81.6%) | 121 (18.4%) |
| Transportation & Warehousing | 305 (100.0%) | 0 (0.0%) |
| Utilities | 48 (100.0%) | 0 (0.0%) |
| Information | 52 (27.7%) | 136 (72.3%) |
| Finance & Insurance | 218 (44.5%) | 272 (55.5%) |
| Real Estate, Rental & Leasing | 170 (61.6%) | 106 (38.4%) |
| Professional & Scientific | 207 (45.5%) | 248 (54.5%) |
| Enterprise Management | 0 (0.0%) | 0 (0.0%) |
| Administrative & Support | 88 (54.3%) | 74 (45.7%) |
| Educational Services | 120 (26.0%) | 341 (74.0%) |
| Health Care & Social Assistance | 206 (19.6%) | 843 (80.4%) |
| Arts, Entertainment & Recreation | 183 (59.0%) | 127 (41.0%) |
| Accommodation & Food Services | 202 (40.5%) | 297 (59.5%) |
| Public Administration | 181 (73.9%) | 64 (26.1%) |
| Total | 3,427 (52.6%) | 3,090 (47.4%) |
Education in Hasbrouck Heights borough
School Enrollment in Hasbrouck Heights borough
The most common levels of schooling among the 2,869 students in Hasbrouck Heights borough are high school (894 | 31.2%), middle school (630 | 22.0%), and elementary school (517 | 18.0%).
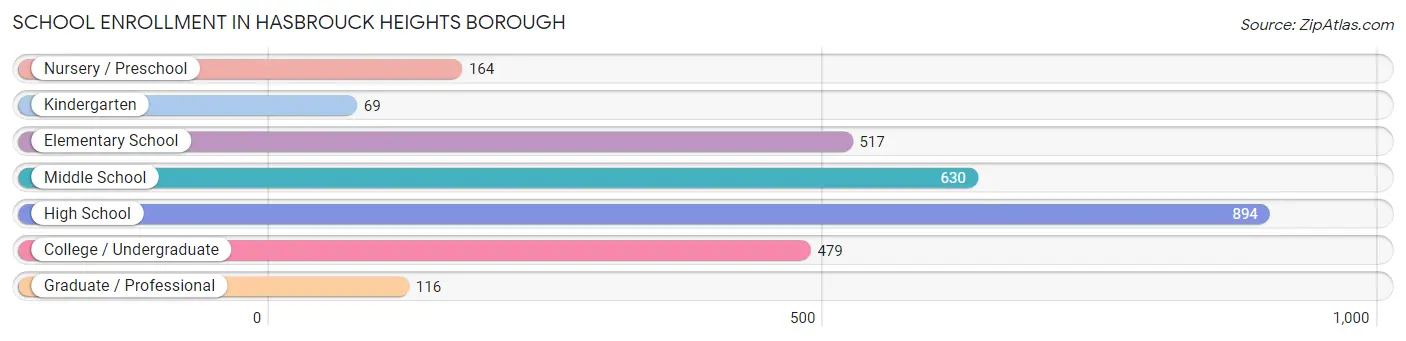
| School Level | # Students | % Students |
| Nursery / Preschool | 164 | 5.7% |
| Kindergarten | 69 | 2.4% |
| Elementary School | 517 | 18.0% |
| Middle School | 630 | 22.0% |
| High School | 894 | 31.2% |
| College / Undergraduate | 479 | 16.7% |
| Graduate / Professional | 116 | 4.0% |
| Total | 2,869 | 100.0% |
School Enrollment by Age by Funding Source in Hasbrouck Heights borough
Out of a total of 2,869 students who are enrolled in schools in Hasbrouck Heights borough, 287 (10.0%) attend a private institution, while the remaining 2,582 (90.0%) are enrolled in public schools. The age group of 25 to 34 year olds has the highest likelihood of being enrolled in private schools, with 71 (77.2% in the age bracket) enrolled. Conversely, the age group of 5 to 9 year old has the lowest likelihood of being enrolled in a private school, with 533 (100.0% in the age bracket) attending a public institution.
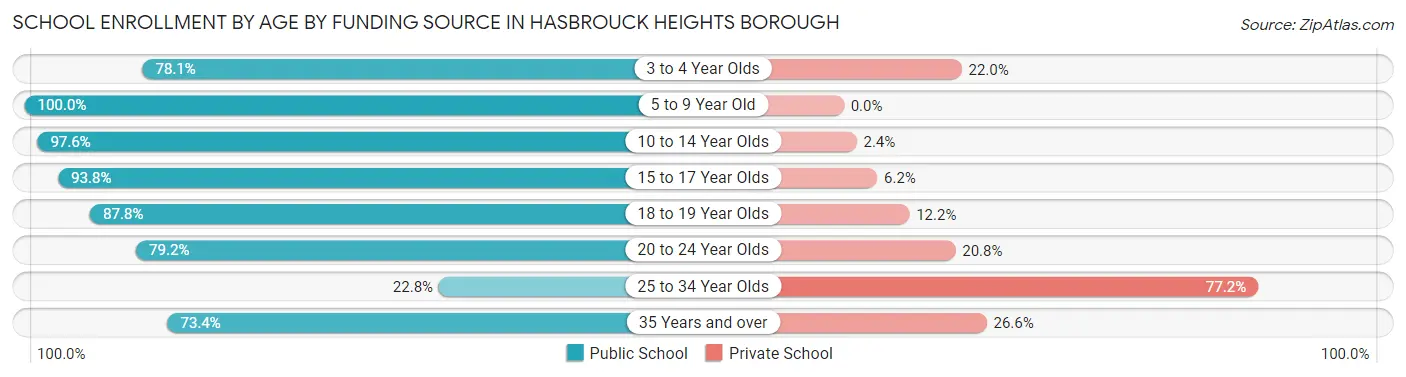
| Age Bracket | Public School | Private School |
| 3 to 4 Year Olds | 128 (78.0%) | 36 (22.0%) |
| 5 to 9 Year Old | 533 (100.0%) | 0 (0.0%) |
| 10 to 14 Year Olds | 691 (97.6%) | 17 (2.4%) |
| 15 to 17 Year Olds | 677 (93.8%) | 45 (6.2%) |
| 18 to 19 Year Olds | 230 (87.8%) | 32 (12.2%) |
| 20 to 24 Year Olds | 221 (79.2%) | 58 (20.8%) |
| 25 to 34 Year Olds | 21 (22.8%) | 71 (77.2%) |
| 35 Years and over | 80 (73.4%) | 29 (26.6%) |
| Total | 2,582 (90.0%) | 287 (10.0%) |
Educational Attainment by Field of Study in Hasbrouck Heights borough
Business (789 | 20.7%), education (522 | 13.7%), science & technology (434 | 11.4%), psychology (336 | 8.8%), and engineering (333 | 8.7%) are the most common fields of study among 3,811 individuals in Hasbrouck Heights borough who have obtained a bachelor's degree or higher.
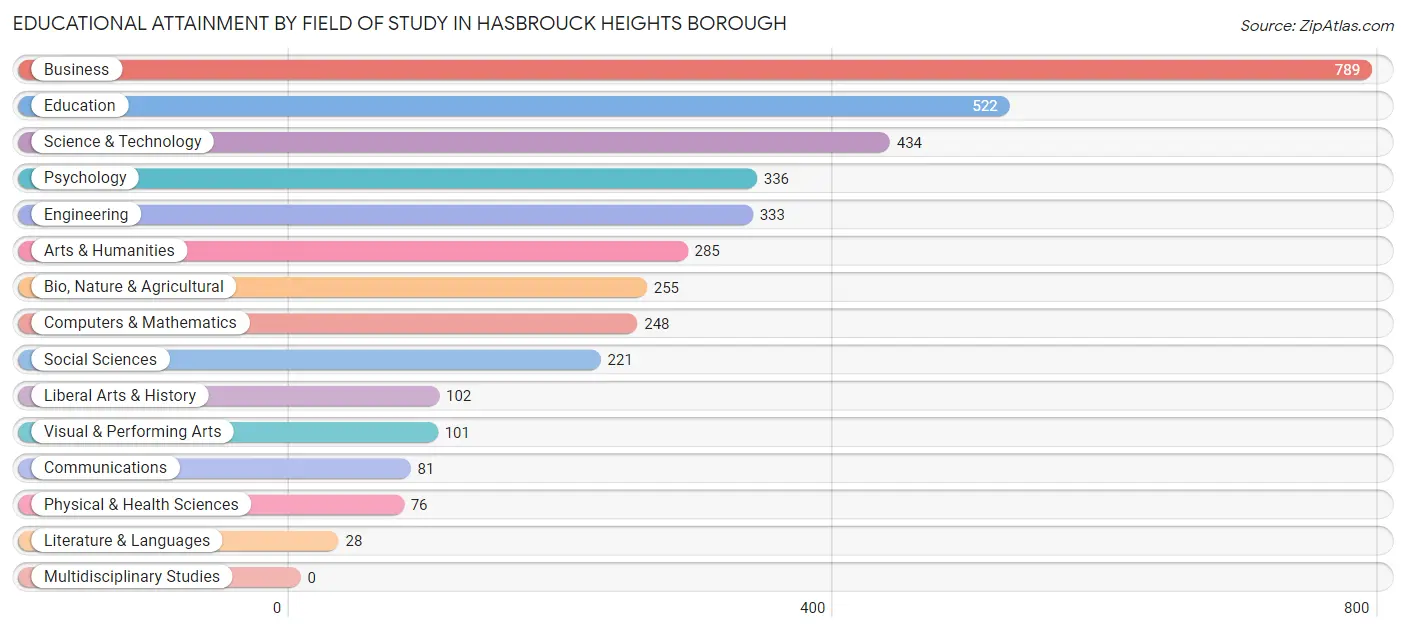
| Field of Study | # Graduates | % Graduates |
| Computers & Mathematics | 248 | 6.5% |
| Bio, Nature & Agricultural | 255 | 6.7% |
| Physical & Health Sciences | 76 | 2.0% |
| Psychology | 336 | 8.8% |
| Social Sciences | 221 | 5.8% |
| Engineering | 333 | 8.7% |
| Multidisciplinary Studies | 0 | 0.0% |
| Science & Technology | 434 | 11.4% |
| Business | 789 | 20.7% |
| Education | 522 | 13.7% |
| Literature & Languages | 28 | 0.7% |
| Liberal Arts & History | 102 | 2.7% |
| Visual & Performing Arts | 101 | 2.6% |
| Communications | 81 | 2.1% |
| Arts & Humanities | 285 | 7.5% |
| Total | 3,811 | 100.0% |
Transportation & Commute in Hasbrouck Heights borough
Vehicle Availability by Sex in Hasbrouck Heights borough
The most prevalent vehicle ownership categories in Hasbrouck Heights borough are males with 2 vehicles (1,408, accounting for 42.5%) and females with 2 vehicles (1,118, making up 46.9%).
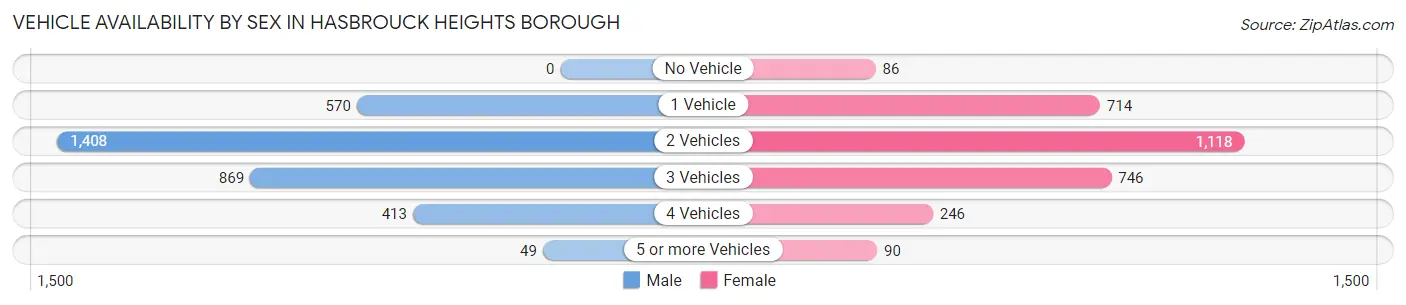
| Vehicles Available | Male | Female |
| No Vehicle | 0 (0.0%) | 86 (2.9%) |
| 1 Vehicle | 570 (17.2%) | 714 (23.8%) |
| 2 Vehicles | 1,408 (42.5%) | 1,118 (37.3%) |
| 3 Vehicles | 869 (26.3%) | 746 (24.9%) |
| 4 Vehicles | 413 (12.5%) | 246 (8.2%) |
| 5 or more Vehicles | 49 (1.5%) | 90 (3.0%) |
| Total | 3,309 (100.0%) | 3,000 (100.0%) |
Commute Time in Hasbrouck Heights borough
The most frequently occuring commute durations in Hasbrouck Heights borough are 10 to 14 minutes (1,023 commuters, 17.9%), 15 to 19 minutes (853 commuters, 14.9%), and 45 to 59 minutes (675 commuters, 11.8%).
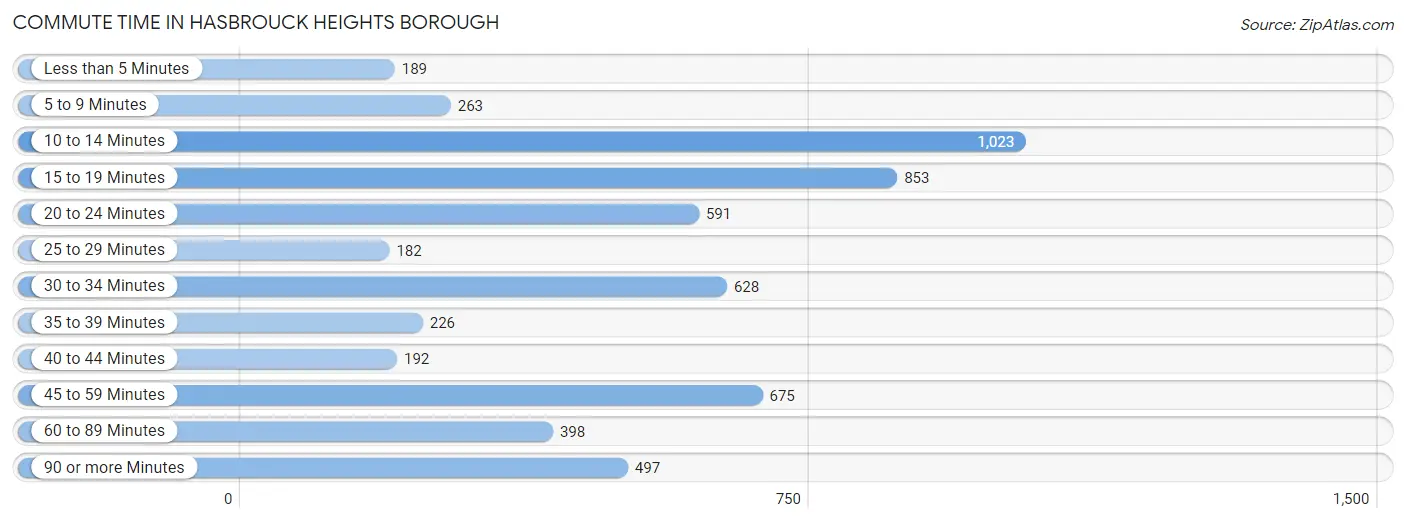
| Commute Time | # Commuters | % Commuters |
| Less than 5 Minutes | 189 | 3.3% |
| 5 to 9 Minutes | 263 | 4.6% |
| 10 to 14 Minutes | 1,023 | 17.9% |
| 15 to 19 Minutes | 853 | 14.9% |
| 20 to 24 Minutes | 591 | 10.3% |
| 25 to 29 Minutes | 182 | 3.2% |
| 30 to 34 Minutes | 628 | 11.0% |
| 35 to 39 Minutes | 226 | 4.0% |
| 40 to 44 Minutes | 192 | 3.4% |
| 45 to 59 Minutes | 675 | 11.8% |
| 60 to 89 Minutes | 398 | 7.0% |
| 90 or more Minutes | 497 | 8.7% |
Commute Time by Sex in Hasbrouck Heights borough
The most common commute times in Hasbrouck Heights borough are 15 to 19 minutes (565 commuters, 18.5%) for males and 10 to 14 minutes (606 commuters, 22.7%) for females.
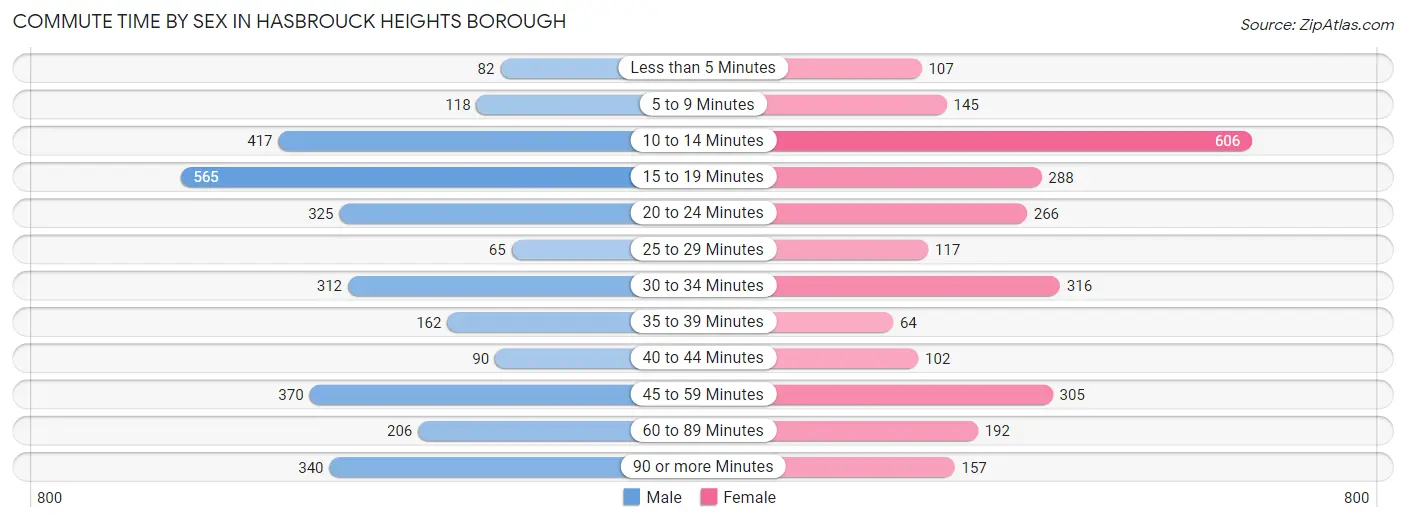
| Commute Time | Male | Female |
| Less than 5 Minutes | 82 (2.7%) | 107 (4.0%) |
| 5 to 9 Minutes | 118 (3.9%) | 145 (5.4%) |
| 10 to 14 Minutes | 417 (13.7%) | 606 (22.7%) |
| 15 to 19 Minutes | 565 (18.5%) | 288 (10.8%) |
| 20 to 24 Minutes | 325 (10.6%) | 266 (10.0%) |
| 25 to 29 Minutes | 65 (2.1%) | 117 (4.4%) |
| 30 to 34 Minutes | 312 (10.2%) | 316 (11.9%) |
| 35 to 39 Minutes | 162 (5.3%) | 64 (2.4%) |
| 40 to 44 Minutes | 90 (2.9%) | 102 (3.8%) |
| 45 to 59 Minutes | 370 (12.1%) | 305 (11.4%) |
| 60 to 89 Minutes | 206 (6.8%) | 192 (7.2%) |
| 90 or more Minutes | 340 (11.1%) | 157 (5.9%) |
Time of Departure to Work by Sex in Hasbrouck Heights borough
The most frequent times of departure to work in Hasbrouck Heights borough are 6:00 AM to 6:29 AM (564, 18.5%) for males and 7:00 AM to 7:29 AM (492, 18.5%) for females.
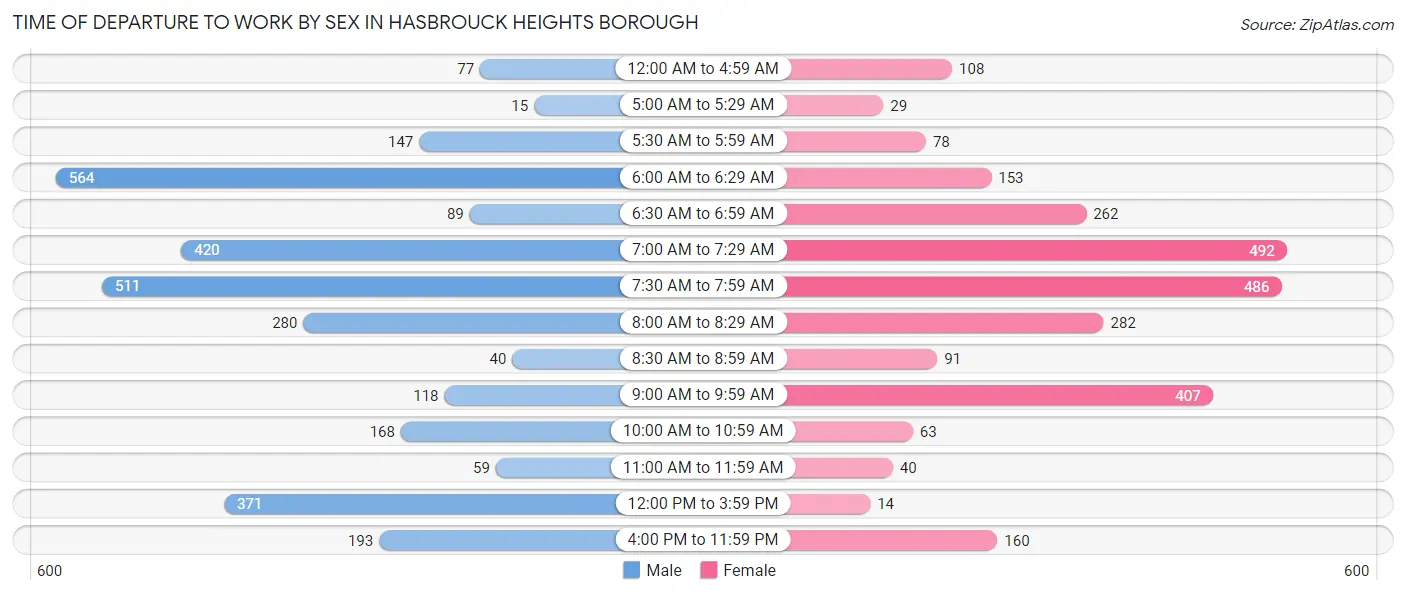
| Time of Departure | Male | Female |
| 12:00 AM to 4:59 AM | 77 (2.5%) | 108 (4.1%) |
| 5:00 AM to 5:29 AM | 15 (0.5%) | 29 (1.1%) |
| 5:30 AM to 5:59 AM | 147 (4.8%) | 78 (2.9%) |
| 6:00 AM to 6:29 AM | 564 (18.5%) | 153 (5.7%) |
| 6:30 AM to 6:59 AM | 89 (2.9%) | 262 (9.8%) |
| 7:00 AM to 7:29 AM | 420 (13.8%) | 492 (18.5%) |
| 7:30 AM to 7:59 AM | 511 (16.7%) | 486 (18.2%) |
| 8:00 AM to 8:29 AM | 280 (9.2%) | 282 (10.6%) |
| 8:30 AM to 8:59 AM | 40 (1.3%) | 91 (3.4%) |
| 9:00 AM to 9:59 AM | 118 (3.9%) | 407 (15.3%) |
| 10:00 AM to 10:59 AM | 168 (5.5%) | 63 (2.4%) |
| 11:00 AM to 11:59 AM | 59 (1.9%) | 40 (1.5%) |
| 12:00 PM to 3:59 PM | 371 (12.2%) | 14 (0.5%) |
| 4:00 PM to 11:59 PM | 193 (6.3%) | 160 (6.0%) |
| Total | 3,052 (100.0%) | 2,665 (100.0%) |
Housing Occupancy in Hasbrouck Heights borough
Occupancy by Ownership in Hasbrouck Heights borough
Of the total 4,283 dwellings in Hasbrouck Heights borough, owner-occupied units account for 3,049 (71.2%), while renter-occupied units make up 1,234 (28.8%).
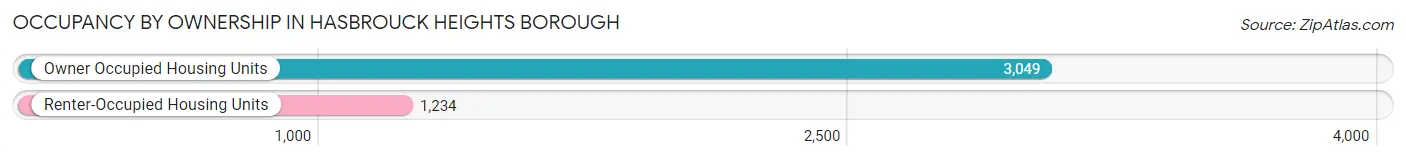
| Occupancy | # Housing Units | % Housing Units |
| Owner Occupied Housing Units | 3,049 | 71.2% |
| Renter-Occupied Housing Units | 1,234 | 28.8% |
| Total Occupied Housing Units | 4,283 | 100.0% |
Occupancy by Household Size in Hasbrouck Heights borough
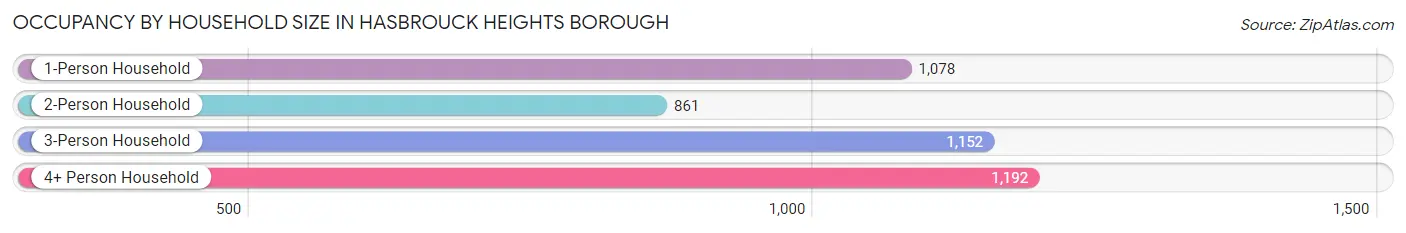
| Household Size | # Housing Units | % Housing Units |
| 1-Person Household | 1,078 | 25.2% |
| 2-Person Household | 861 | 20.1% |
| 3-Person Household | 1,152 | 26.9% |
| 4+ Person Household | 1,192 | 27.8% |
| Total Housing Units | 4,283 | 100.0% |
Occupancy by Ownership by Household Size in Hasbrouck Heights borough
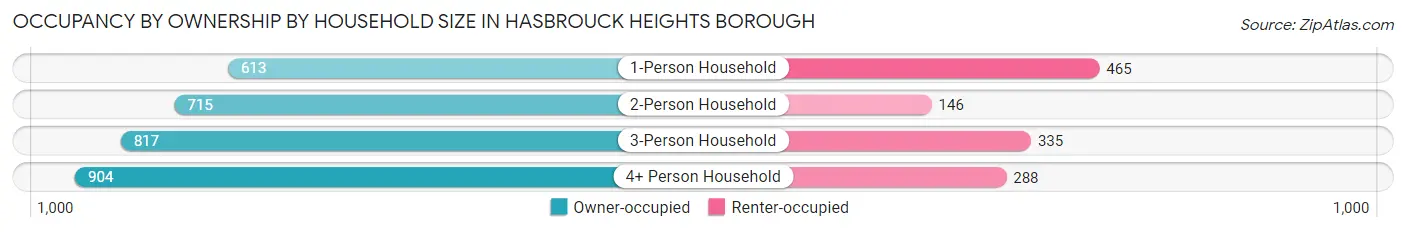
| Household Size | Owner-occupied | Renter-occupied |
| 1-Person Household | 613 (56.9%) | 465 (43.1%) |
| 2-Person Household | 715 (83.0%) | 146 (17.0%) |
| 3-Person Household | 817 (70.9%) | 335 (29.1%) |
| 4+ Person Household | 904 (75.8%) | 288 (24.2%) |
| Total Housing Units | 3,049 (71.2%) | 1,234 (28.8%) |
Occupancy by Educational Attainment in Hasbrouck Heights borough
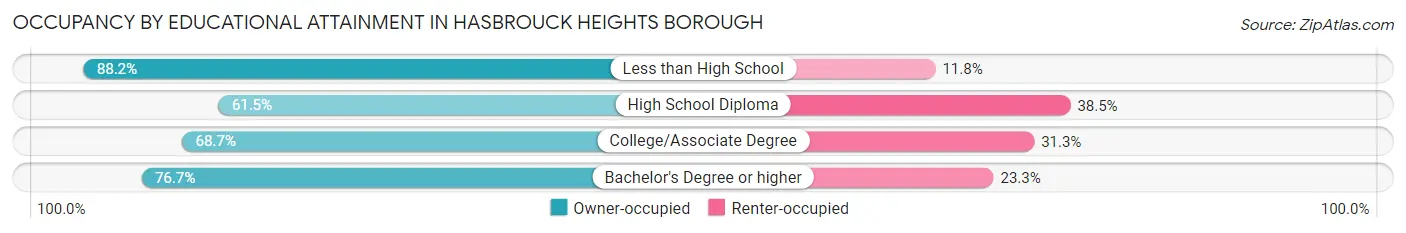
| Household Size | Owner-occupied | Renter-occupied |
| Less than High School | 165 (88.2%) | 22 (11.8%) |
| High School Diploma | 723 (61.5%) | 453 (38.5%) |
| College/Associate Degree | 675 (68.7%) | 308 (31.3%) |
| Bachelor's Degree or higher | 1,486 (76.7%) | 451 (23.3%) |
Occupancy by Age of Householder in Hasbrouck Heights borough
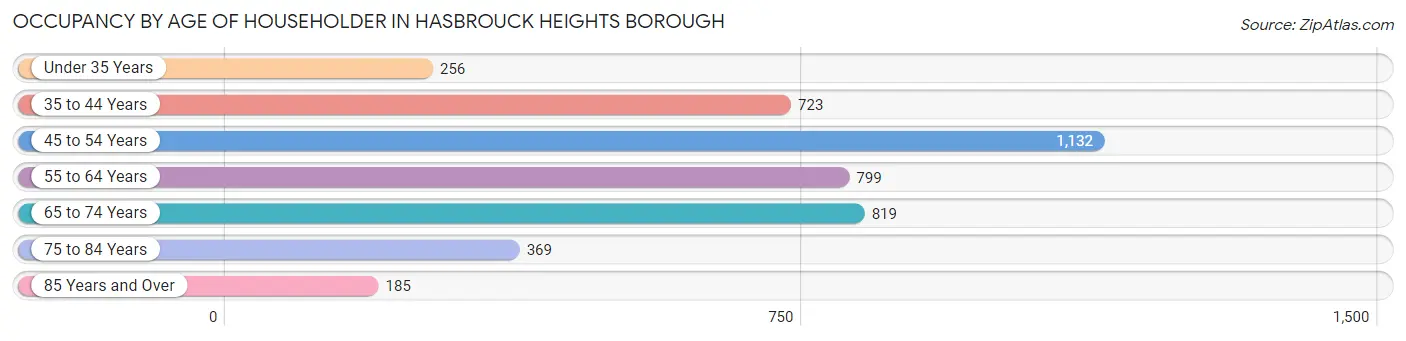
| Age Bracket | # Households | % Households |
| Under 35 Years | 256 | 6.0% |
| 35 to 44 Years | 723 | 16.9% |
| 45 to 54 Years | 1,132 | 26.4% |
| 55 to 64 Years | 799 | 18.7% |
| 65 to 74 Years | 819 | 19.1% |
| 75 to 84 Years | 369 | 8.6% |
| 85 Years and Over | 185 | 4.3% |
| Total | 4,283 | 100.0% |
Housing Finances in Hasbrouck Heights borough
Median Income by Occupancy in Hasbrouck Heights borough
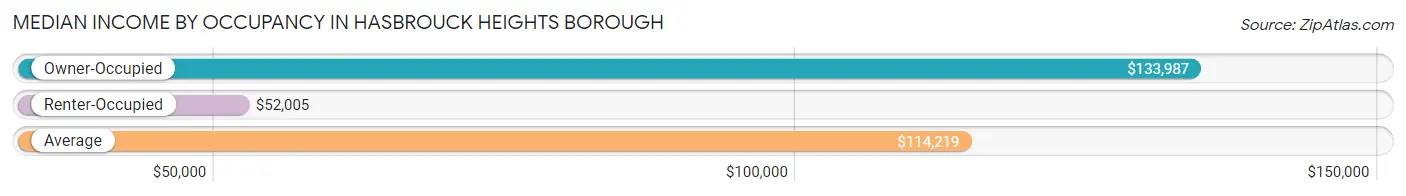
| Occupancy Type | # Households | Median Income |
| Owner-Occupied | 3,049 (71.2%) | $133,987 |
| Renter-Occupied | 1,234 (28.8%) | $52,005 |
| Average | 4,283 (100.0%) | $114,219 |
Occupancy by Householder Income Bracket in Hasbrouck Heights borough
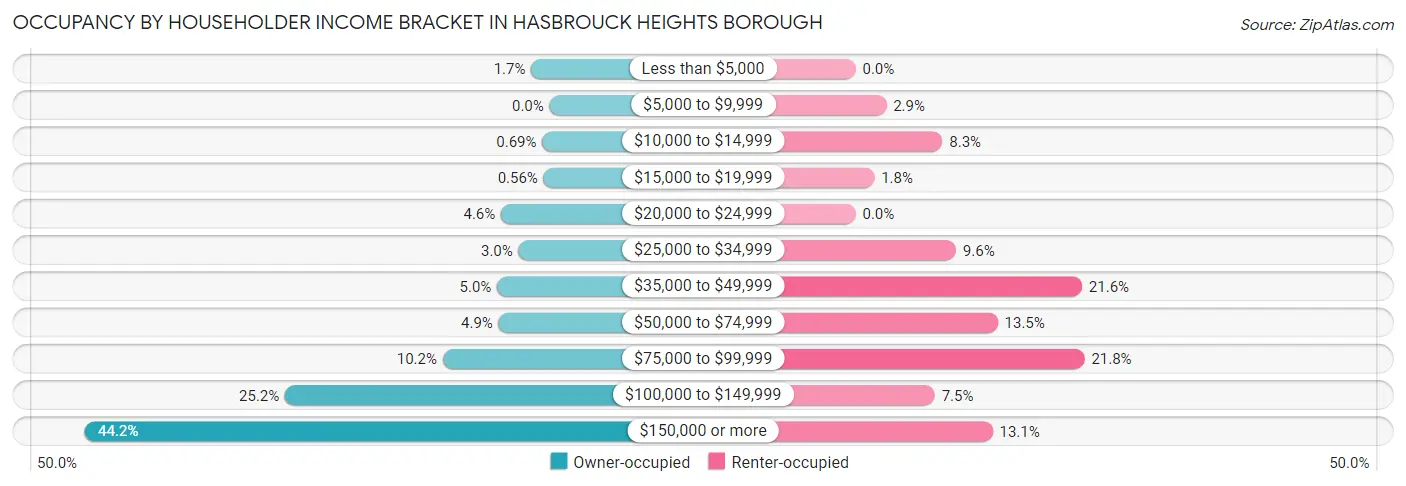
| Income Bracket | Owner-occupied | Renter-occupied |
| Less than $5,000 | 53 (1.7%) | 0 (0.0%) |
| $5,000 to $9,999 | 0 (0.0%) | 36 (2.9%) |
| $10,000 to $14,999 | 21 (0.7%) | 102 (8.3%) |
| $15,000 to $19,999 | 17 (0.6%) | 22 (1.8%) |
| $20,000 to $24,999 | 141 (4.6%) | 0 (0.0%) |
| $25,000 to $34,999 | 90 (2.9%) | 118 (9.6%) |
| $35,000 to $49,999 | 152 (5.0%) | 266 (21.6%) |
| $50,000 to $74,999 | 148 (4.9%) | 167 (13.5%) |
| $75,000 to $99,999 | 310 (10.2%) | 269 (21.8%) |
| $100,000 to $149,999 | 768 (25.2%) | 93 (7.5%) |
| $150,000 or more | 1,349 (44.2%) | 161 (13.1%) |
| Total | 3,049 (100.0%) | 1,234 (100.0%) |
Monthly Housing Cost Tiers in Hasbrouck Heights borough
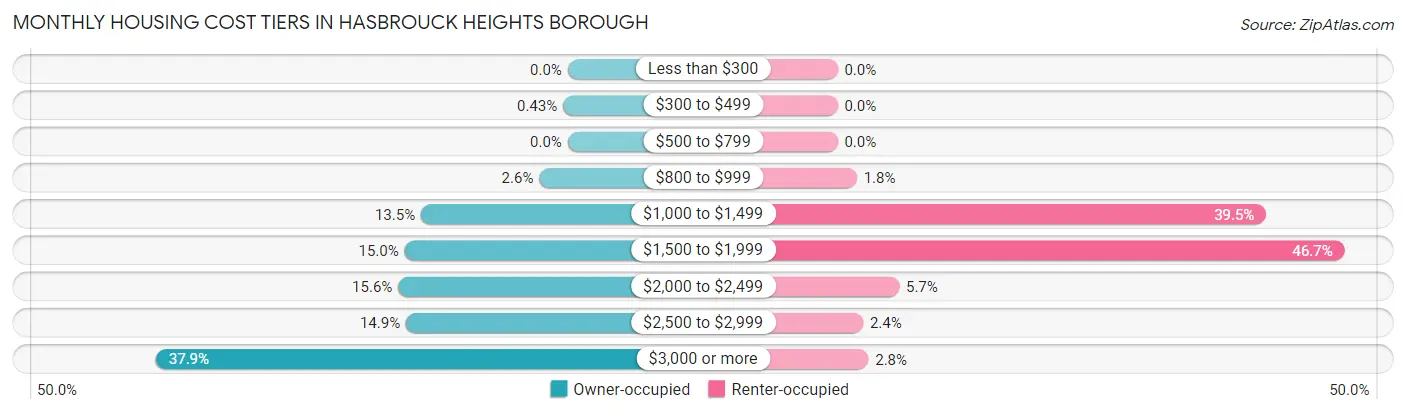
| Monthly Cost | Owner-occupied | Renter-occupied |
| Less than $300 | 0 (0.0%) | 0 (0.0%) |
| $300 to $499 | 13 (0.4%) | 0 (0.0%) |
| $500 to $799 | 0 (0.0%) | 0 (0.0%) |
| $800 to $999 | 80 (2.6%) | 22 (1.8%) |
| $1,000 to $1,499 | 412 (13.5%) | 487 (39.5%) |
| $1,500 to $1,999 | 458 (15.0%) | 576 (46.7%) |
| $2,000 to $2,499 | 476 (15.6%) | 70 (5.7%) |
| $2,500 to $2,999 | 454 (14.9%) | 29 (2.4%) |
| $3,000 or more | 1,156 (37.9%) | 35 (2.8%) |
| Total | 3,049 (100.0%) | 1,234 (100.0%) |
Physical Housing Characteristics in Hasbrouck Heights borough
Housing Structures in Hasbrouck Heights borough
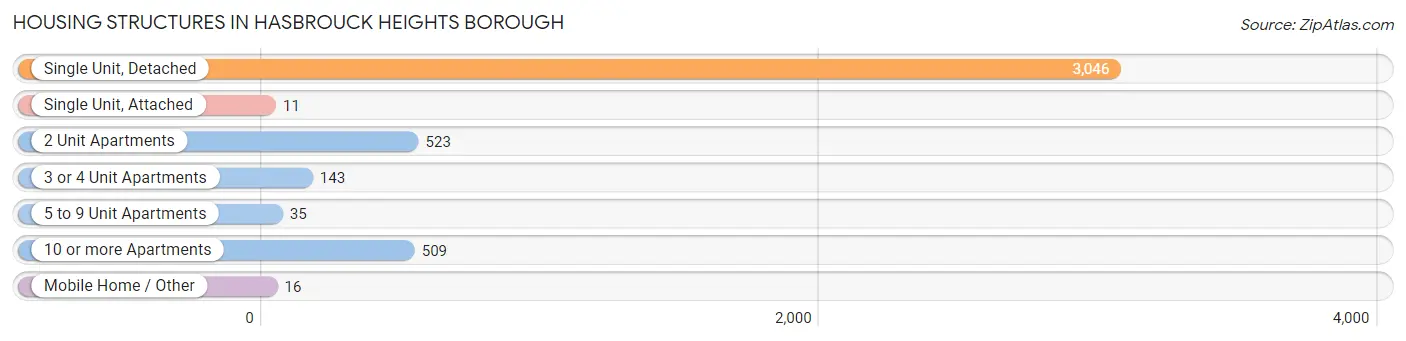
| Structure Type | # Housing Units | % Housing Units |
| Single Unit, Detached | 3,046 | 71.1% |
| Single Unit, Attached | 11 | 0.3% |
| 2 Unit Apartments | 523 | 12.2% |
| 3 or 4 Unit Apartments | 143 | 3.3% |
| 5 to 9 Unit Apartments | 35 | 0.8% |
| 10 or more Apartments | 509 | 11.9% |
| Mobile Home / Other | 16 | 0.4% |
| Total | 4,283 | 100.0% |
Housing Structures by Occupancy in Hasbrouck Heights borough
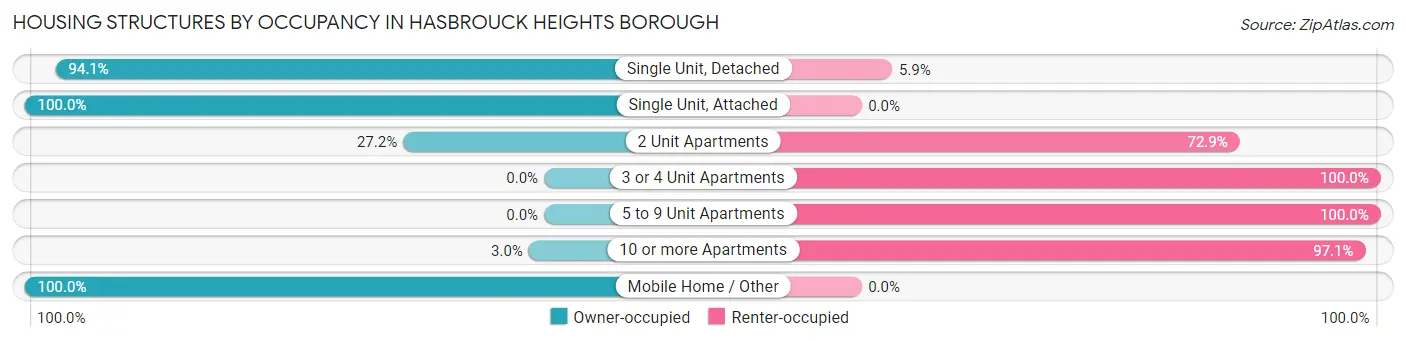
| Structure Type | Owner-occupied | Renter-occupied |
| Single Unit, Detached | 2,865 (94.1%) | 181 (5.9%) |
| Single Unit, Attached | 11 (100.0%) | 0 (0.0%) |
| 2 Unit Apartments | 142 (27.2%) | 381 (72.9%) |
| 3 or 4 Unit Apartments | 0 (0.0%) | 143 (100.0%) |
| 5 to 9 Unit Apartments | 0 (0.0%) | 35 (100.0%) |
| 10 or more Apartments | 15 (2.9%) | 494 (97.1%) |
| Mobile Home / Other | 16 (100.0%) | 0 (0.0%) |
| Total | 3,049 (71.2%) | 1,234 (28.8%) |
Housing Structures by Number of Rooms in Hasbrouck Heights borough
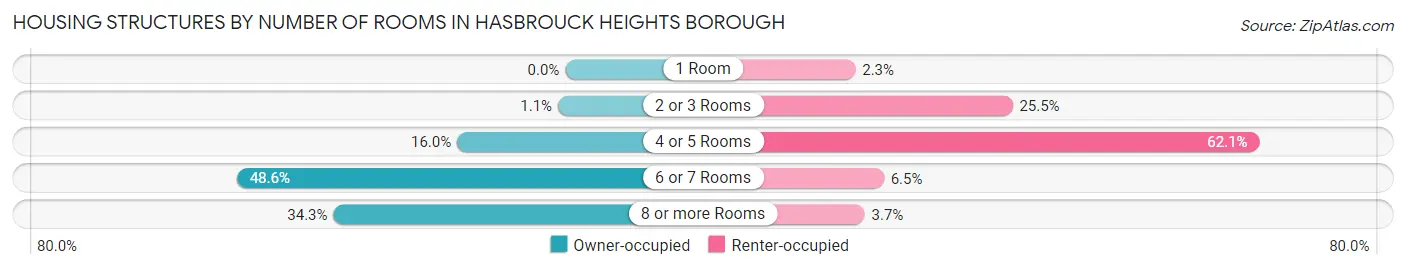
| Number of Rooms | Owner-occupied | Renter-occupied |
| 1 Room | 0 (0.0%) | 28 (2.3%) |
| 2 or 3 Rooms | 33 (1.1%) | 315 (25.5%) |
| 4 or 5 Rooms | 488 (16.0%) | 766 (62.1%) |
| 6 or 7 Rooms | 1,482 (48.6%) | 80 (6.5%) |
| 8 or more Rooms | 1,046 (34.3%) | 45 (3.6%) |
| Total | 3,049 (100.0%) | 1,234 (100.0%) |
Housing Structure by Heating Type in Hasbrouck Heights borough
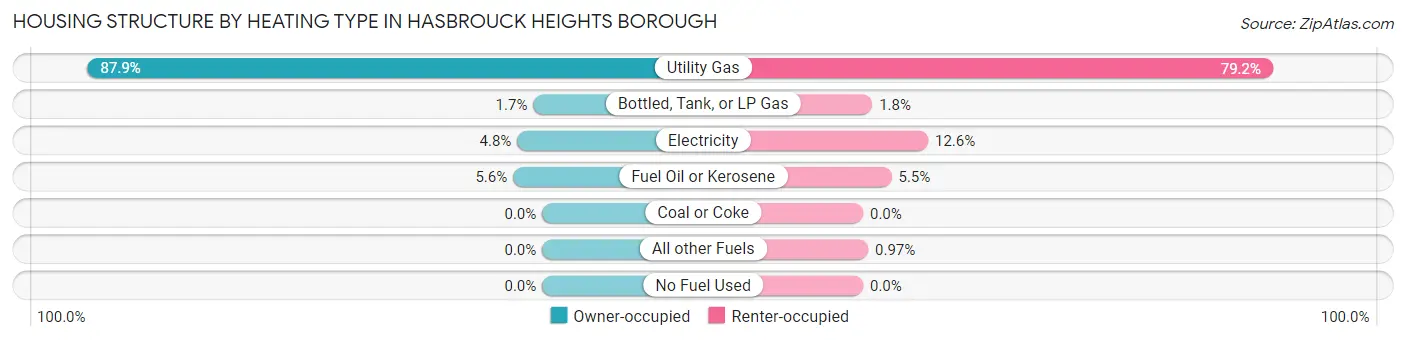
| Heating Type | Owner-occupied | Renter-occupied |
| Utility Gas | 2,679 (87.9%) | 977 (79.2%) |
| Bottled, Tank, or LP Gas | 52 (1.7%) | 22 (1.8%) |
| Electricity | 147 (4.8%) | 155 (12.6%) |
| Fuel Oil or Kerosene | 171 (5.6%) | 68 (5.5%) |
| Coal or Coke | 0 (0.0%) | 0 (0.0%) |
| All other Fuels | 0 (0.0%) | 12 (1.0%) |
| No Fuel Used | 0 (0.0%) | 0 (0.0%) |
| Total | 3,049 (100.0%) | 1,234 (100.0%) |
Household Vehicle Usage in Hasbrouck Heights borough
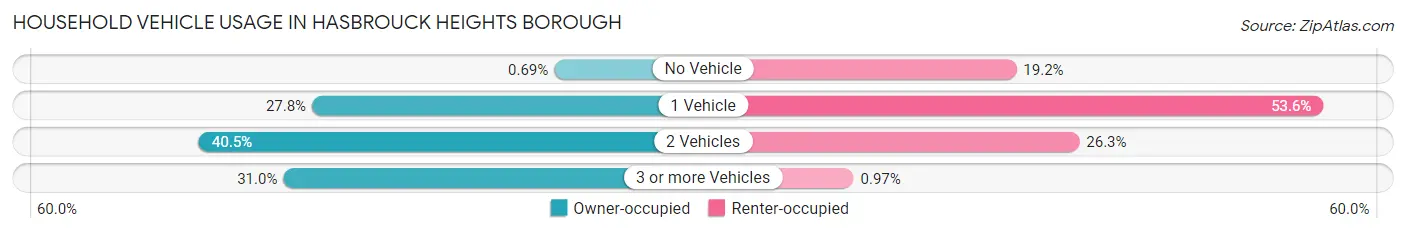
| Vehicles per Household | Owner-occupied | Renter-occupied |
| No Vehicle | 21 (0.7%) | 237 (19.2%) |
| 1 Vehicle | 848 (27.8%) | 661 (53.6%) |
| 2 Vehicles | 1,234 (40.5%) | 324 (26.3%) |
| 3 or more Vehicles | 946 (31.0%) | 12 (1.0%) |
| Total | 3,049 (100.0%) | 1,234 (100.0%) |
Real Estate & Mortgages in Hasbrouck Heights borough
Real Estate and Mortgage Overview in Hasbrouck Heights borough
| Characteristic | Without Mortgage | With Mortgage |
| Housing Units | 983 | 2,066 |
| Median Property Value | $477,100 | $492,700 |
| Median Household Income | $93,672 | $1,079 |
| Monthly Housing Costs | $1,501 | $1,156 |
| Real Estate Taxes | $10,001 | $75 |
Property Value by Mortgage Status in Hasbrouck Heights borough
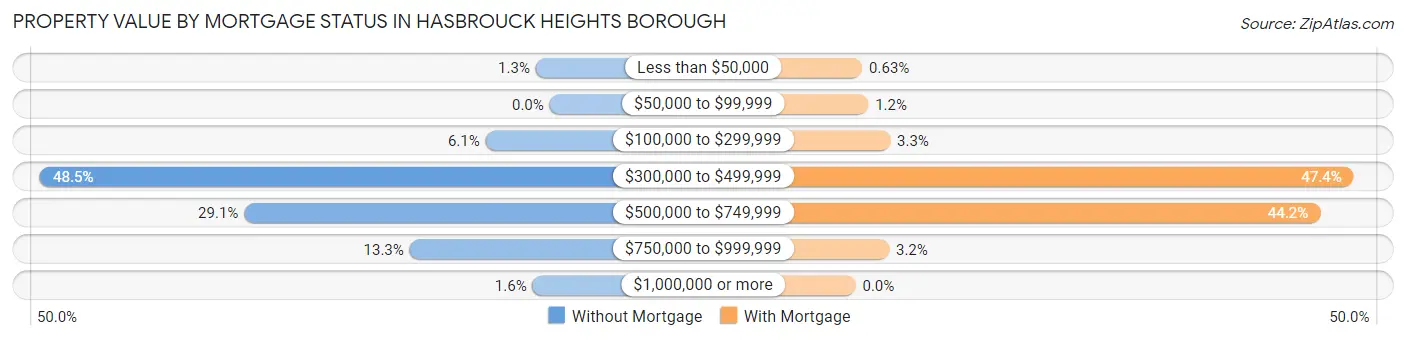
| Property Value | Without Mortgage | With Mortgage |
| Less than $50,000 | 13 (1.3%) | 13 (0.6%) |
| $50,000 to $99,999 | 0 (0.0%) | 25 (1.2%) |
| $100,000 to $299,999 | 60 (6.1%) | 68 (3.3%) |
| $300,000 to $499,999 | 477 (48.5%) | 980 (47.4%) |
| $500,000 to $749,999 | 286 (29.1%) | 914 (44.2%) |
| $750,000 to $999,999 | 131 (13.3%) | 66 (3.2%) |
| $1,000,000 or more | 16 (1.6%) | 0 (0.0%) |
| Total | 983 (100.0%) | 2,066 (100.0%) |
Household Income by Mortgage Status in Hasbrouck Heights borough
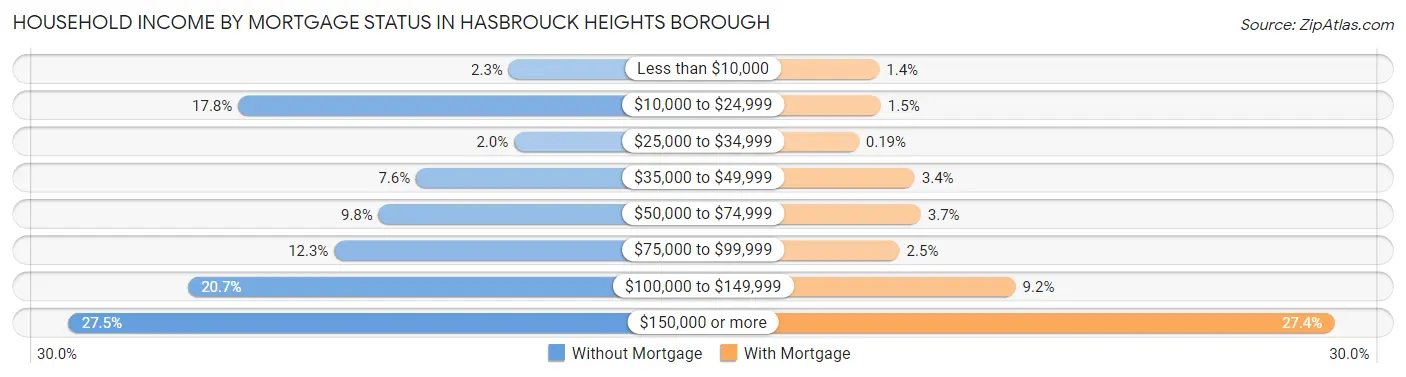
| Household Income | Without Mortgage | With Mortgage |
| Less than $10,000 | 23 (2.3%) | 28 (1.4%) |
| $10,000 to $24,999 | 175 (17.8%) | 30 (1.5%) |
| $25,000 to $34,999 | 20 (2.0%) | 4 (0.2%) |
| $35,000 to $49,999 | 75 (7.6%) | 70 (3.4%) |
| $50,000 to $74,999 | 96 (9.8%) | 77 (3.7%) |
| $75,000 to $99,999 | 121 (12.3%) | 52 (2.5%) |
| $100,000 to $149,999 | 203 (20.6%) | 189 (9.1%) |
| $150,000 or more | 270 (27.5%) | 565 (27.4%) |
| Total | 983 (100.0%) | 2,066 (100.0%) |
Property Value to Household Income Ratio in Hasbrouck Heights borough
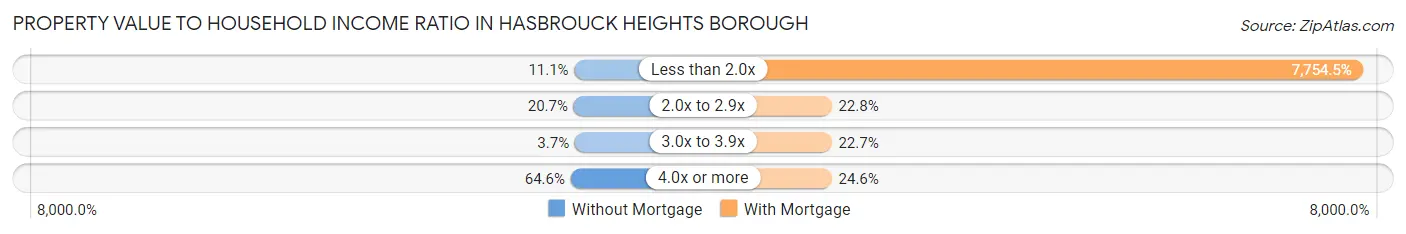
| Value-to-Income Ratio | Without Mortgage | With Mortgage |
| Less than 2.0x | 109 (11.1%) | 160,208 (7,754.5%) |
| 2.0x to 2.9x | 203 (20.6%) | 471 (22.8%) |
| 3.0x to 3.9x | 36 (3.7%) | 469 (22.7%) |
| 4.0x or more | 635 (64.6%) | 509 (24.6%) |
| Total | 983 (100.0%) | 2,066 (100.0%) |
Real Estate Taxes by Mortgage Status in Hasbrouck Heights borough

| Property Taxes | Without Mortgage | With Mortgage |
| Less than $800 | 0 (0.0%) | 0 (0.0%) |
| $800 to $1,499 | 13 (1.3%) | 18 (0.9%) |
| $800 to $1,499 | 954 (97.1%) | 0 (0.0%) |
| Total | 983 (100.0%) | 2,066 (100.0%) |
Health & Disability in Hasbrouck Heights borough
Health Insurance Coverage by Age in Hasbrouck Heights borough
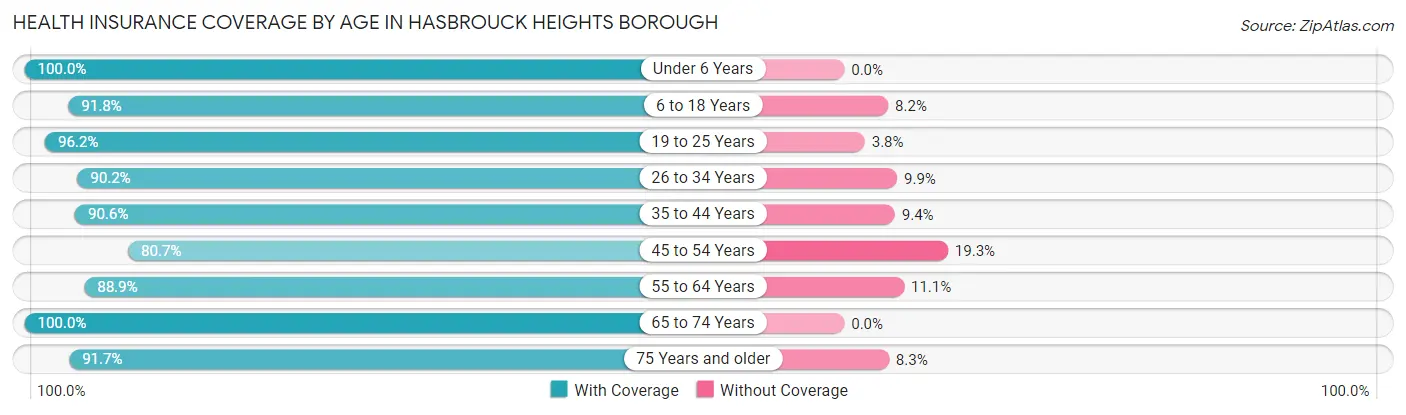
| Age Bracket | With Coverage | Without Coverage |
| Under 6 Years | 645 (100.0%) | 0 (0.0%) |
| 6 to 18 Years | 1,999 (91.8%) | 178 (8.2%) |
| 19 to 25 Years | 906 (96.2%) | 36 (3.8%) |
| 26 to 34 Years | 824 (90.1%) | 90 (9.9%) |
| 35 to 44 Years | 1,538 (90.6%) | 160 (9.4%) |
| 45 to 54 Years | 1,570 (80.7%) | 376 (19.3%) |
| 55 to 64 Years | 1,467 (88.9%) | 184 (11.1%) |
| 65 to 74 Years | 1,206 (100.0%) | 0 (0.0%) |
| 75 Years and older | 826 (91.7%) | 75 (8.3%) |
| Total | 10,981 (90.9%) | 1,099 (9.1%) |
Health Insurance Coverage by Citizenship Status in Hasbrouck Heights borough
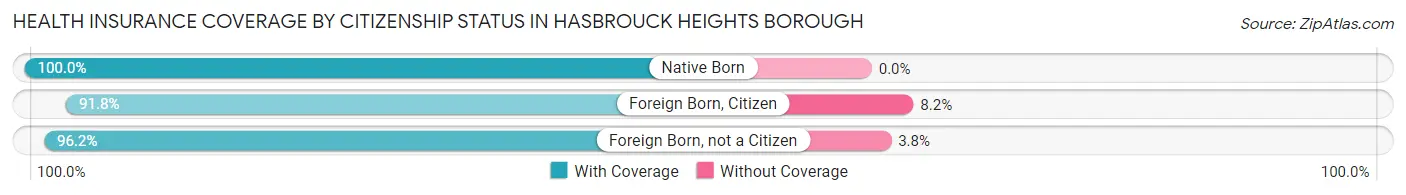
| Citizenship Status | With Coverage | Without Coverage |
| Native Born | 645 (100.0%) | 0 (0.0%) |
| Foreign Born, Citizen | 1,999 (91.8%) | 178 (8.2%) |
| Foreign Born, not a Citizen | 906 (96.2%) | 36 (3.8%) |
Health Insurance Coverage by Household Income in Hasbrouck Heights borough
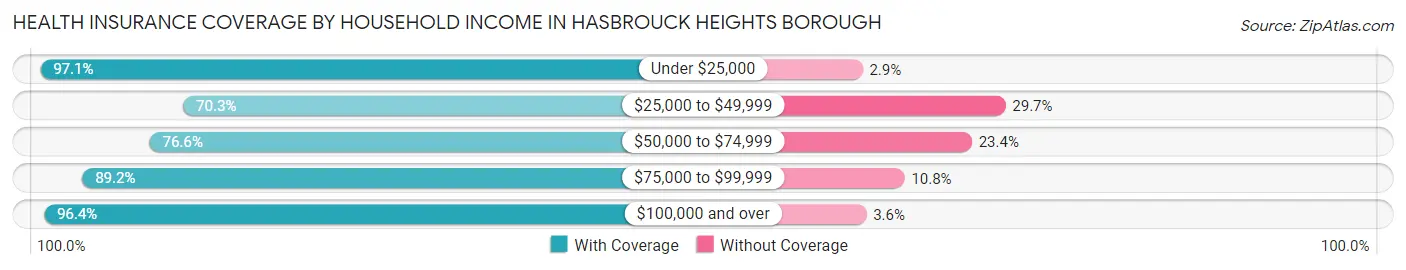
| Household Income | With Coverage | Without Coverage |
| Under $25,000 | 728 (97.1%) | 22 (2.9%) |
| $25,000 to $49,999 | 1,053 (70.3%) | 445 (29.7%) |
| $50,000 to $74,999 | 710 (76.6%) | 217 (23.4%) |
| $75,000 to $99,999 | 1,148 (89.2%) | 139 (10.8%) |
| $100,000 and over | 7,322 (96.4%) | 276 (3.6%) |
Public vs Private Health Insurance Coverage by Age in Hasbrouck Heights borough
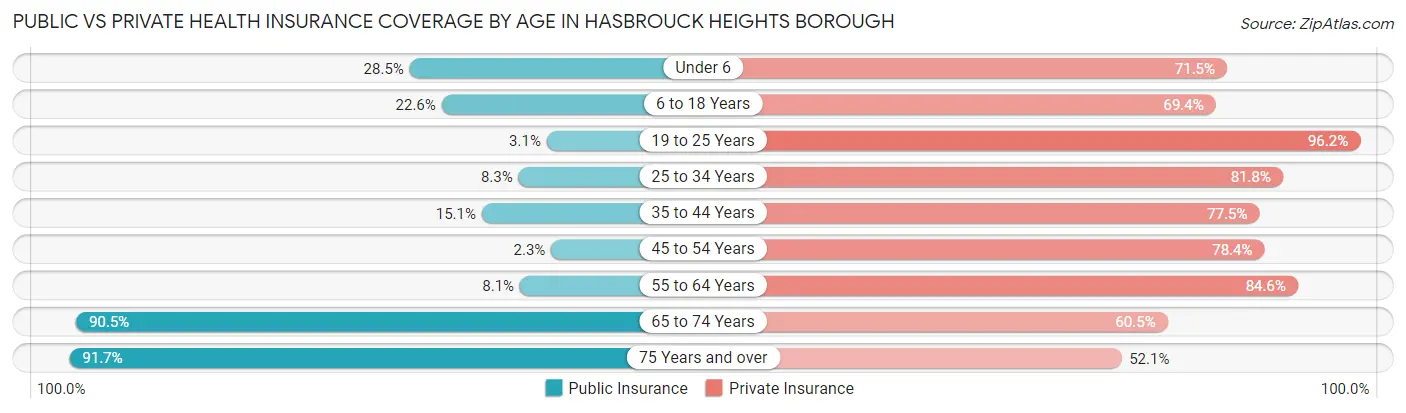
| Age Bracket | Public Insurance | Private Insurance |
| Under 6 | 184 (28.5%) | 461 (71.5%) |
| 6 to 18 Years | 492 (22.6%) | 1,510 (69.4%) |
| 19 to 25 Years | 29 (3.1%) | 906 (96.2%) |
| 25 to 34 Years | 76 (8.3%) | 748 (81.8%) |
| 35 to 44 Years | 257 (15.1%) | 1,316 (77.5%) |
| 45 to 54 Years | 44 (2.3%) | 1,526 (78.4%) |
| 55 to 64 Years | 133 (8.1%) | 1,397 (84.6%) |
| 65 to 74 Years | 1,091 (90.5%) | 729 (60.5%) |
| 75 Years and over | 826 (91.7%) | 469 (52.0%) |
| Total | 3,132 (25.9%) | 9,062 (75.0%) |
Disability Status by Sex by Age in Hasbrouck Heights borough
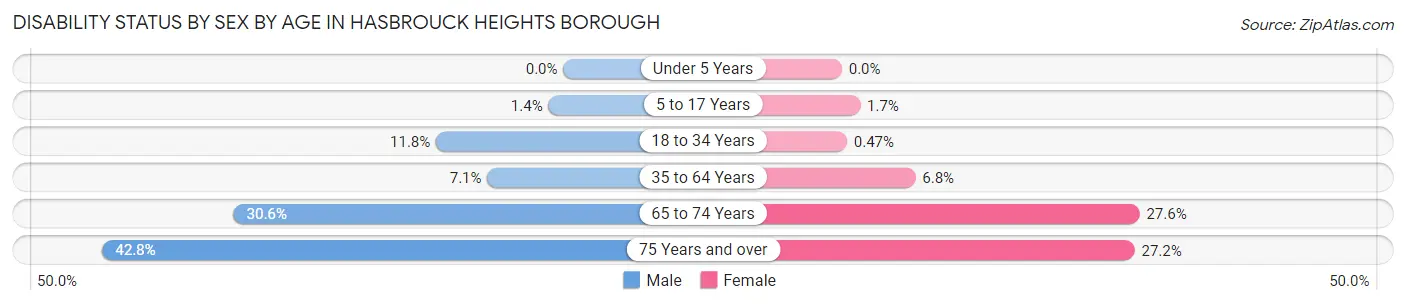
| Age Bracket | Male | Female |
| Under 5 Years | 0 (0.0%) | 0 (0.0%) |
| 5 to 17 Years | 15 (1.4%) | 16 (1.7%) |
| 18 to 34 Years | 146 (11.8%) | 4 (0.5%) |
| 35 to 64 Years | 172 (7.0%) | 195 (6.8%) |
| 65 to 74 Years | 183 (30.6%) | 168 (27.6%) |
| 75 Years and over | 154 (42.8%) | 147 (27.2%) |
Disability Class by Sex by Age in Hasbrouck Heights borough
Disability Class: Hearing Difficulty
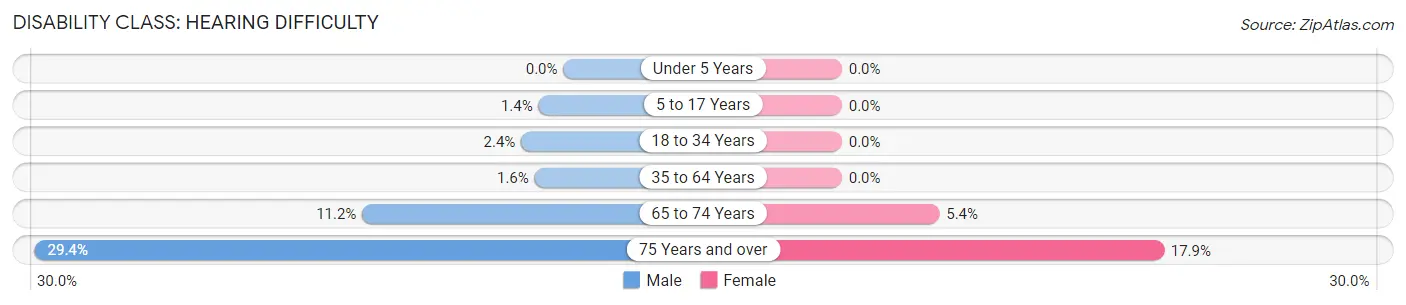
| Age Bracket | Male | Female |
| Under 5 Years | 0 (0.0%) | 0 (0.0%) |
| 5 to 17 Years | 15 (1.4%) | 0 (0.0%) |
| 18 to 34 Years | 29 (2.4%) | 0 (0.0%) |
| 35 to 64 Years | 39 (1.6%) | 0 (0.0%) |
| 65 to 74 Years | 67 (11.2%) | 33 (5.4%) |
| 75 Years and over | 106 (29.4%) | 97 (17.9%) |
Disability Class: Vision Difficulty
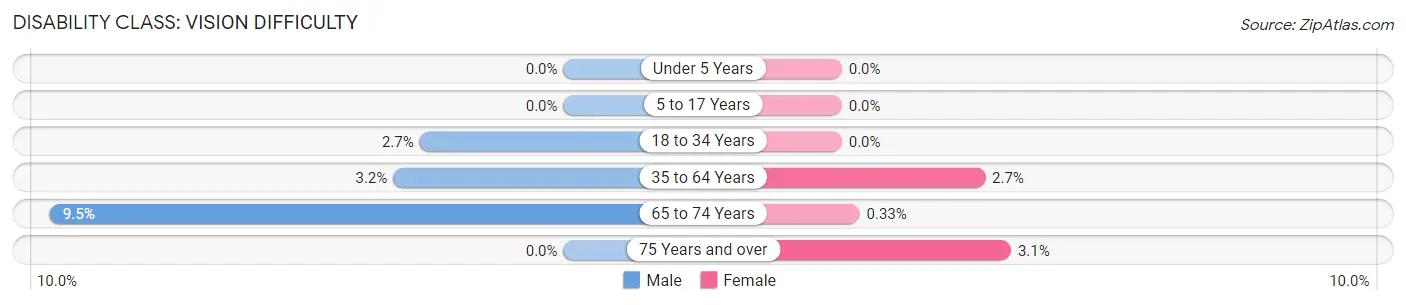
| Age Bracket | Male | Female |
| Under 5 Years | 0 (0.0%) | 0 (0.0%) |
| 5 to 17 Years | 0 (0.0%) | 0 (0.0%) |
| 18 to 34 Years | 33 (2.7%) | 0 (0.0%) |
| 35 to 64 Years | 77 (3.2%) | 76 (2.7%) |
| 65 to 74 Years | 57 (9.5%) | 2 (0.3%) |
| 75 Years and over | 0 (0.0%) | 17 (3.1%) |
Disability Class: Cognitive Difficulty
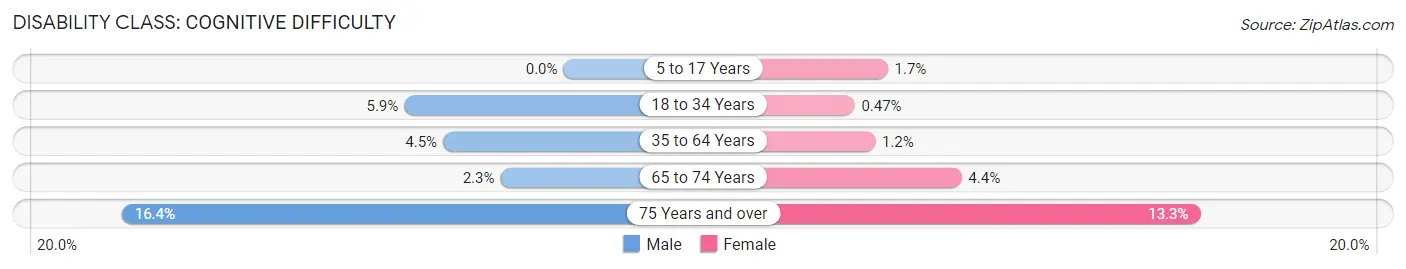
| Age Bracket | Male | Female |
| 5 to 17 Years | 0 (0.0%) | 16 (1.7%) |
| 18 to 34 Years | 73 (5.9%) | 4 (0.5%) |
| 35 to 64 Years | 109 (4.5%) | 35 (1.2%) |
| 65 to 74 Years | 14 (2.3%) | 27 (4.4%) |
| 75 Years and over | 59 (16.4%) | 72 (13.3%) |
Disability Class: Ambulatory Difficulty
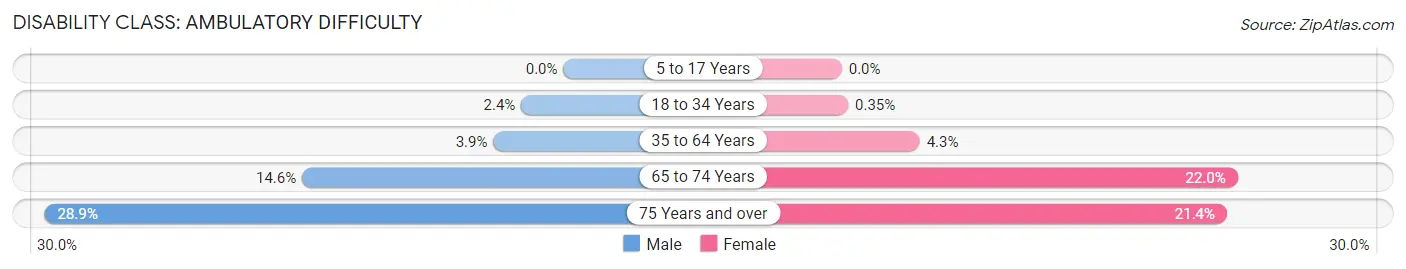
| Age Bracket | Male | Female |
| 5 to 17 Years | 0 (0.0%) | 0 (0.0%) |
| 18 to 34 Years | 29 (2.4%) | 3 (0.4%) |
| 35 to 64 Years | 95 (3.9%) | 124 (4.3%) |
| 65 to 74 Years | 87 (14.5%) | 134 (22.0%) |
| 75 Years and over | 104 (28.9%) | 116 (21.4%) |
Disability Class: Self-Care Difficulty
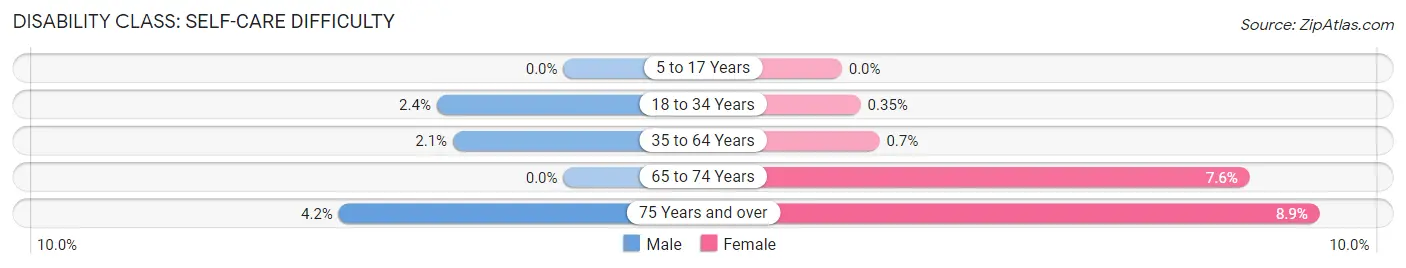
| Age Bracket | Male | Female |
| 5 to 17 Years | 0 (0.0%) | 0 (0.0%) |
| 18 to 34 Years | 29 (2.4%) | 3 (0.4%) |
| 35 to 64 Years | 50 (2.1%) | 20 (0.7%) |
| 65 to 74 Years | 0 (0.0%) | 46 (7.6%) |
| 75 Years and over | 15 (4.2%) | 48 (8.9%) |
Technology Access in Hasbrouck Heights borough
Computing Device Access in Hasbrouck Heights borough
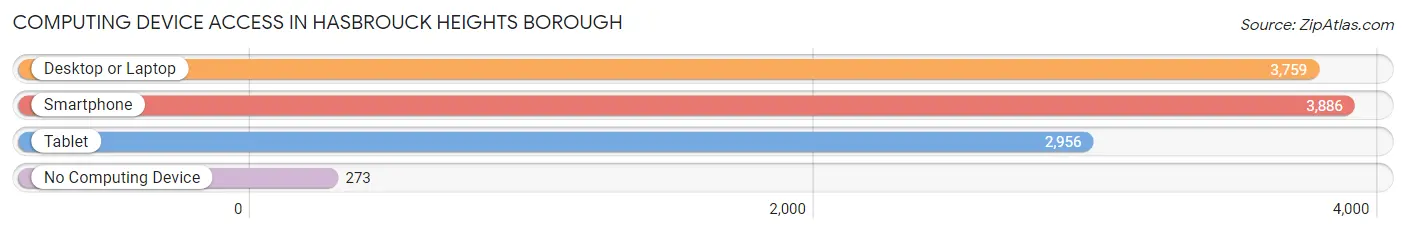
| Device Type | # Households | % Households |
| Desktop or Laptop | 3,759 | 87.8% |
| Smartphone | 3,886 | 90.7% |
| Tablet | 2,956 | 69.0% |
| No Computing Device | 273 | 6.4% |
| Total | 4,283 | 100.0% |
Internet Access in Hasbrouck Heights borough

| Internet Type | # Households | % Households |
| Dial-Up Internet | 16 | 0.4% |
| Broadband Home | 3,597 | 84.0% |
| Cellular Data Only | 240 | 5.6% |
| Satellite Internet | 14 | 0.3% |
| No Internet | 414 | 9.7% |
| Total | 4,283 | 100.0% |
Hasbrouck Heights borough Summary
Hasbrouck Heights is a borough in Bergen County, New Jersey, United States. As of the 2010 United States Census, the borough's population was 11,842, reflecting an increase of 478 (+4.2%) from the 11,364 counted in the 2000 Census, which had in turn increased by 1,219 (+12.0%) from the 10,145 counted in the 1990 Census.
History
The area that is now Hasbrouck Heights was originally part of Lodi Township, which was formed on February 23, 1770, from portions of New Barbadoes Township. On March 20, 1894, the area was incorporated as the Borough of Hasbrouck Heights, based on the results of a referendum held on April 3, 1894. The borough was named for the Hasbrouck family, early settlers of the area.
Geography
Hasbrouck Heights is located at 40 51 25 North 74 04 45 West 40 856944 74 079167
According to the United States Census Bureau, the borough has a total area of 1.9 square miles (4.9 km2), all of it land.
Demographics
As of the 2010 United States Census, there were 11,842 people, 4,717 households, and 3,093.8 families residing in the borough. The population density was 6,213.2 per square mile (2,400.2/km2). There were 4,919 housing units at an average density of 2,567.3 per square mile (991.2/km2). The racial makeup of the borough was 79.17% (9,400) White, 1.45% (172) Black or African American, 0.09% (11) Native American, 14.90% (1,769) Asian, 0.02% (2) Pacific Islander, 2.45% (292) from other races, and 2.02% (241) from two or more races. Hispanic or Latino of any race were 8.90% (1,062) of the population.
Economy
Hasbrouck Heights is home to a variety of businesses, including retail stores, restaurants, and professional services. The borough is also home to several corporate headquarters, including the headquarters of the global pharmaceutical company, Merck & Co.
The borough is served by the Teterboro Airport, which is located just outside the borough limits. The airport is a major hub for corporate and private aviation, and is the busiest general aviation airport in the United States.
The borough is also home to the Meadowlands Sports Complex, which includes MetLife Stadium, home of the NFL's New York Giants and New York Jets, and the Meadowlands Racetrack, home of the Hambletonian Stakes, the world's most prestigious harness race.
Conclusion
Hasbrouck Heights is a borough in Bergen County, New Jersey, United States. As of the 2010 United States Census, the borough's population was 11,842. The borough is home to a variety of businesses, including retail stores, restaurants, and professional services. The borough is also home to several corporate headquarters, including the headquarters of the global pharmaceutical company, Merck & Co. The borough is served by the Teterboro Airport, which is located just outside the borough limits, and is home to the Meadowlands Sports Complex, which includes MetLife Stadium, home of the NFL's New York Giants and New York Jets, and the Meadowlands Racetrack, home of the Hambletonian Stakes, the world's most prestigious harness race. Hasbrouck Heights is a vibrant community with a rich history and a bright future.
Common Questions
What is the Total Population of Hasbrouck Heights borough?
Total Population of Hasbrouck Heights borough is 12,080.
What is the Total Male Population of Hasbrouck Heights borough?
Total Male Population of Hasbrouck Heights borough is 6,133.
What is the Total Female Population of Hasbrouck Heights borough?
Total Female Population of Hasbrouck Heights borough is 5,947.
What is the Ratio of Males per 100 Females in Hasbrouck Heights borough?
There are 103.13 Males per 100 Females in Hasbrouck Heights borough.
What is the Ratio of Females per 100 Males in Hasbrouck Heights borough?
There are 96.97 Females per 100 Males in Hasbrouck Heights borough.
What is the Median Population Age in Hasbrouck Heights borough?
Median Population Age in Hasbrouck Heights borough is 43.4 Years.
What is the Average Family Size in Hasbrouck Heights borough
Average Family Size in Hasbrouck Heights borough is 3.4 People.
What is the Average Household Size in Hasbrouck Heights borough
Average Household Size in Hasbrouck Heights borough is 2.8 People.
What is Per Capita Income in Hasbrouck Heights borough?
Per Capita income in Hasbrouck Heights borough is $49,758.
What is the Median Family Income in Hasbrouck Heights borough?
Median Family Income in Hasbrouck Heights borough is $134,806.
What is the Median Household income in Hasbrouck Heights borough?
Median Household Income in Hasbrouck Heights borough is $114,219.
What is Income or Wage Gap in Hasbrouck Heights borough?
Income or Wage Gap in Hasbrouck Heights borough is 19.0%.
Women in Hasbrouck Heights borough earn 81.0 cents for every dollar earned by a man.
What is Inequality or Gini Index in Hasbrouck Heights borough?
Inequality or Gini Index in Hasbrouck Heights borough is 0.43.
How Large is the Labor Force in Hasbrouck Heights borough?
There are 6,951 People in the Labor Forcein in Hasbrouck Heights borough.
What is the Percentage of People in the Labor Force in Hasbrouck Heights borough?
70.0% of People are in the Labor Force in Hasbrouck Heights borough.
What is the Unemployment Rate in Hasbrouck Heights borough?
Unemployment Rate in Hasbrouck Heights borough is 6.2%.