Elizabeth, NJ
Elizabeth Map
Elizabeth Overview
135,665
TOTAL POPULATION
68,101
MALE POPULATION
67,564
FEMALE POPULATION
100.79
MALES / 100 FEMALES
99.21
FEMALES / 100 MALES
35.7
MEDIAN AGE
3.4
AVG FAMILY SIZE
3.0
AVG HOUSEHOLD SIZE
$26,633
PER CAPITA INCOME
$63,566
AVG FAMILY INCOME
$59,939
AVG HOUSEHOLD INCOME
25.5%
WAGE / INCOME GAP [ % ]
74.5¢/ $1
WAGE / INCOME GAP [ $ ]
$10,633
FAMILY INCOME DEFICIT
0.43
INEQUALITY / GINI INDEX
69,359
LABOR FORCE [ PEOPLE ]
66.1%
PERCENT IN LABOR FORCE
5.9%
UNEMPLOYMENT RATE
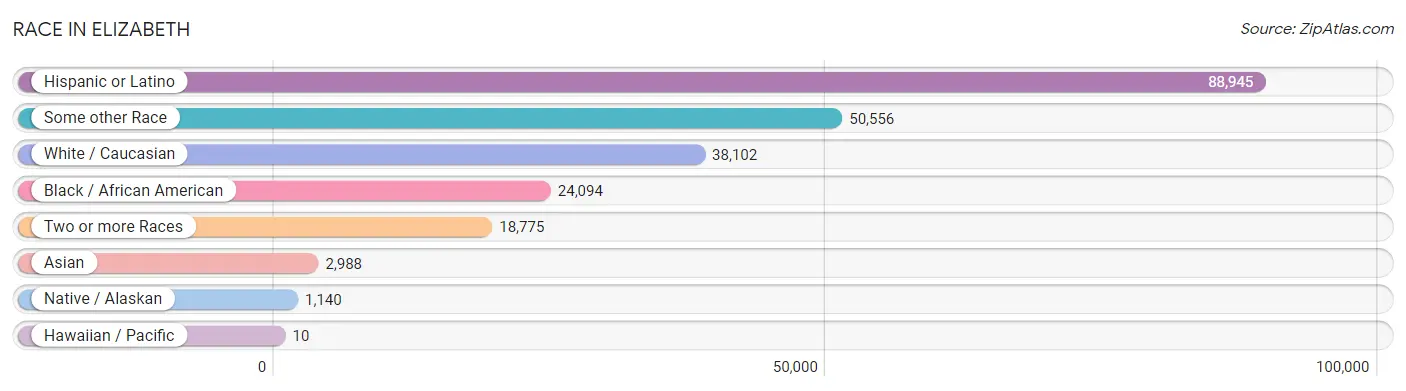
Race in Elizabeth
The most populous races in Elizabeth are Hispanic or Latino (88,945 | 65.6%), Some other Race (50,556 | 37.3%), and White / Caucasian (38,102 | 28.1%).
| Race | # Population | % Population |
| Asian | 2,988 | 2.2% |
| Black / African American | 24,094 | 17.8% |
| Hawaiian / Pacific | 10 | 0.0% |
| Hispanic or Latino | 88,945 | 65.6% |
| Native / Alaskan | 1,140 | 0.8% |
| White / Caucasian | 38,102 | 28.1% |
| Two or more Races | 18,775 | 13.8% |
| Some other Race | 50,556 | 37.3% |
| Total | 135,665 | 100.0% |
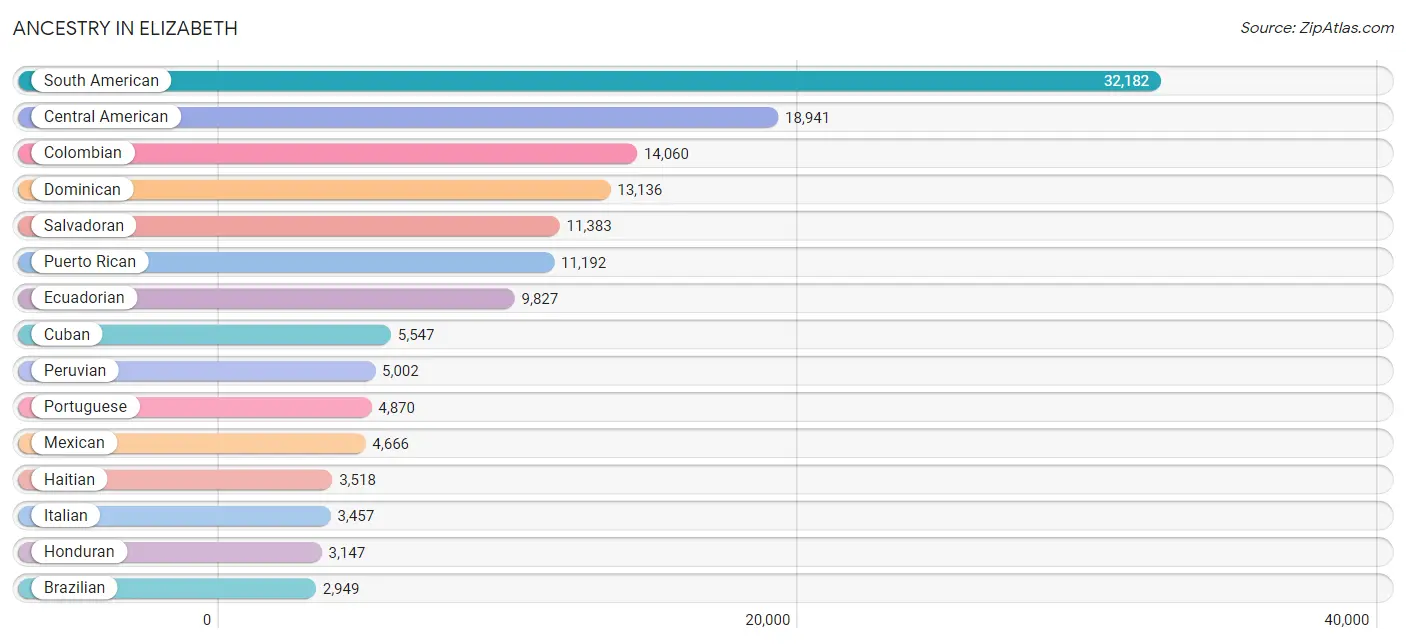
Ancestry in Elizabeth
The most populous ancestries reported in Elizabeth are South American (32,182 | 23.7%), Central American (18,941 | 14.0%), Colombian (14,060 | 10.4%), Dominican (13,136 | 9.7%), and Salvadoran (11,383 | 8.4%), together accounting for 66.1% of all Elizabeth residents.
| Ancestry | # Population | % Population |
| Afghan | 131 | 0.1% |
| African | 609 | 0.4% |
| Albanian | 110 | 0.1% |
| American | 2,116 | 1.6% |
| Arab | 1,394 | 1.0% |
| Argentinean | 396 | 0.3% |
| Armenian | 106 | 0.1% |
| Austrian | 60 | 0.0% |
| Bahamian | 41 | 0.0% |
| Barbadian | 410 | 0.3% |
| Basque | 26 | 0.0% |
| Bhutanese | 85 | 0.1% |
| Blackfeet | 20 | 0.0% |
| Bolivian | 31 | 0.0% |
| Brazilian | 2,949 | 2.2% |
| British | 17 | 0.0% |
| British West Indian | 44 | 0.0% |
| Burmese | 128 | 0.1% |
| Carpatho Rusyn | 15 | 0.0% |
| Celtic | 11 | 0.0% |
| Central American | 18,941 | 14.0% |
| Central American Indian | 615 | 0.4% |
| Cherokee | 151 | 0.1% |
| Chilean | 260 | 0.2% |
| Colombian | 14,060 | 10.4% |
| Costa Rican | 845 | 0.6% |
| Cree | 9 | 0.0% |
| Cuban | 5,547 | 4.1% |
| Cypriot | 54 | 0.0% |
| Czech | 15 | 0.0% |
| Czechoslovakian | 25 | 0.0% |
| Danish | 28 | 0.0% |
| Dominican | 13,136 | 9.7% |
| Dutch | 96 | 0.1% |
| Eastern European | 80 | 0.1% |
| Ecuadorian | 9,827 | 7.2% |
| Egyptian | 612 | 0.4% |
| English | 282 | 0.2% |
| Estonian | 12 | 0.0% |
| European | 308 | 0.2% |
| French | 137 | 0.1% |
| French Canadian | 10 | 0.0% |
| German | 1,033 | 0.8% |
| Ghanaian | 604 | 0.4% |
| Greek | 126 | 0.1% |
| Guamanian / Chamorro | 10 | 0.0% |
| Guatemalan | 2,395 | 1.8% |
| Guyanese | 415 | 0.3% |
| Haitian | 3,518 | 2.6% |
| Honduran | 3,147 | 2.3% |
| Hungarian | 161 | 0.1% |
| Indian (Asian) | 322 | 0.2% |
| Iranian | 37 | 0.0% |
| Irish | 1,548 | 1.1% |
| Iroquois | 41 | 0.0% |
| Israeli | 1 | 0.0% |
| Italian | 3,457 | 2.5% |
| Jamaican | 1,201 | 0.9% |
| Jordanian | 129 | 0.1% |
| Kenyan | 9 | 0.0% |
| Korean | 804 | 0.6% |
| Laotian | 4 | 0.0% |
| Lithuanian | 122 | 0.1% |
| Mexican | 4,666 | 3.4% |
| Mexican American Indian | 192 | 0.1% |
| Moroccan | 67 | 0.1% |
| Navajo | 40 | 0.0% |
| Nicaraguan | 938 | 0.7% |
| Nigerian | 263 | 0.2% |
| Norwegian | 34 | 0.0% |
| Palestinian | 66 | 0.1% |
| Panamanian | 233 | 0.2% |
| Paraguayan | 19 | 0.0% |
| Peruvian | 5,002 | 3.7% |
| Polish | 1,342 | 1.0% |
| Portuguese | 4,870 | 3.6% |
| Puerto Rican | 11,192 | 8.3% |
| Romanian | 143 | 0.1% |
| Russian | 251 | 0.2% |
| Salvadoran | 11,383 | 8.4% |
| Scotch-Irish | 9 | 0.0% |
| Scottish | 45 | 0.0% |
| Seminole | 8 | 0.0% |
| Senegalese | 18 | 0.0% |
| Slovak | 169 | 0.1% |
| South American | 32,182 | 23.7% |
| South American Indian | 71 | 0.1% |
| Spaniard | 362 | 0.3% |
| Spanish | 64 | 0.1% |
| Sri Lankan | 47 | 0.0% |
| Subsaharan African | 2,220 | 1.6% |
| Sudanese | 39 | 0.0% |
| Swedish | 38 | 0.0% |
| Syrian | 394 | 0.3% |
| Thai | 1,504 | 1.1% |
| Trinidadian and Tobagonian | 276 | 0.2% |
| Turkish | 134 | 0.1% |
| Ugandan | 2 | 0.0% |
| Ukrainian | 140 | 0.1% |
| Uruguayan | 1,695 | 1.3% |
| Venezuelan | 892 | 0.7% |
| Vietnamese | 68 | 0.1% |
| Welsh | 67 | 0.1% |
| West Indian | 127 | 0.1% | View All 104 Rows |
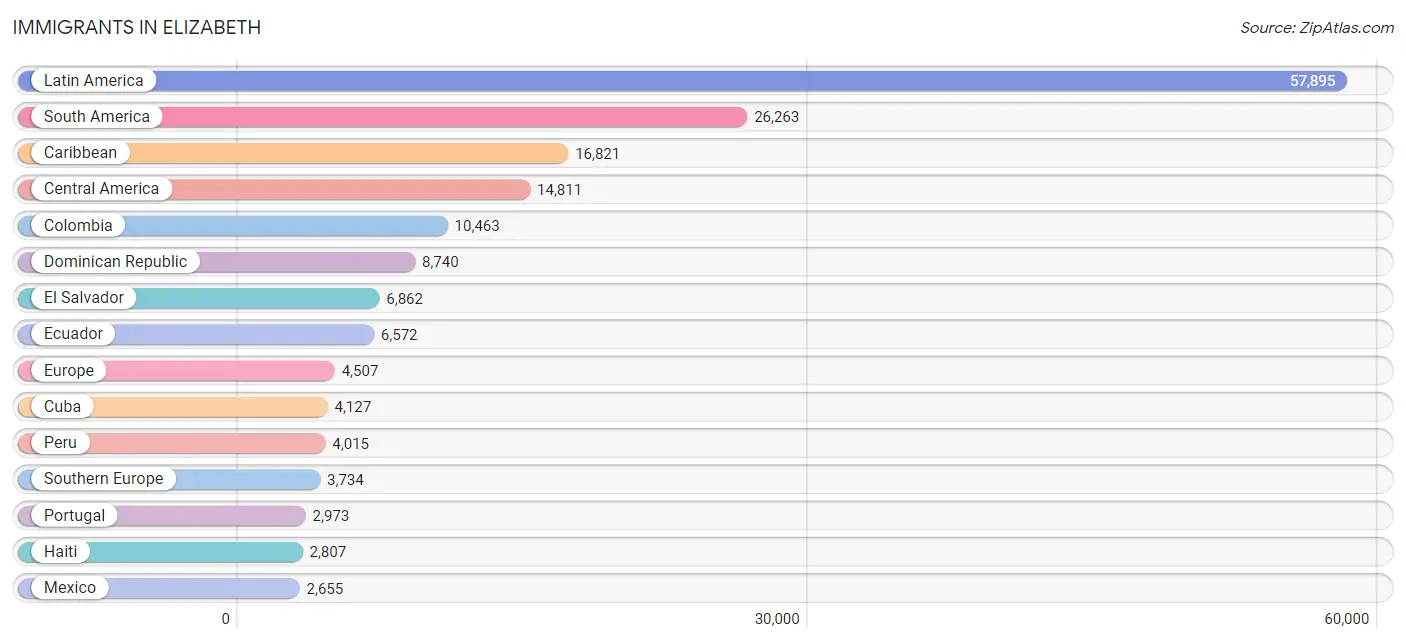
Immigrants in Elizabeth
The most numerous immigrant groups reported in Elizabeth came from Latin America (57,895 | 42.7%), South America (26,263 | 19.4%), Caribbean (16,821 | 12.4%), Central America (14,811 | 10.9%), and Colombia (10,463 | 7.7%), together accounting for 93.1% of all Elizabeth residents.
| Immigration Origin | # Population | % Population |
| Afghanistan | 167 | 0.1% |
| Africa | 2,285 | 1.7% |
| Albania | 30 | 0.0% |
| Argentina | 387 | 0.3% |
| Asia | 1,990 | 1.5% |
| Australia | 20 | 0.0% |
| Azores | 136 | 0.1% |
| Bangladesh | 142 | 0.1% |
| Barbados | 138 | 0.1% |
| Belarus | 15 | 0.0% |
| Belgium | 13 | 0.0% |
| Brazil | 2,521 | 1.9% |
| Canada | 104 | 0.1% |
| Caribbean | 16,821 | 12.4% |
| Central America | 14,811 | 10.9% |
| Chile | 130 | 0.1% |
| China | 37 | 0.0% |
| Colombia | 10,463 | 7.7% |
| Congo | 6 | 0.0% |
| Costa Rica | 822 | 0.6% |
| Cuba | 4,127 | 3.0% |
| Czechoslovakia | 23 | 0.0% |
| Dominican Republic | 8,740 | 6.4% |
| Eastern Africa | 101 | 0.1% |
| Eastern Asia | 97 | 0.1% |
| Eastern Europe | 596 | 0.4% |
| Ecuador | 6,572 | 4.8% |
| Egypt | 442 | 0.3% |
| El Salvador | 6,862 | 5.1% |
| England | 32 | 0.0% |
| Europe | 4,507 | 3.3% |
| France | 5 | 0.0% |
| Germany | 76 | 0.1% |
| Ghana | 438 | 0.3% |
| Greece | 46 | 0.0% |
| Grenada | 18 | 0.0% |
| Guatemala | 1,364 | 1.0% |
| Guyana | 300 | 0.2% |
| Haiti | 2,807 | 2.1% |
| Honduras | 2,364 | 1.7% |
| Hungary | 41 | 0.0% |
| India | 521 | 0.4% |
| Indonesia | 4 | 0.0% |
| Iran | 10 | 0.0% |
| Ireland | 31 | 0.0% |
| Israel | 56 | 0.0% |
| Italy | 394 | 0.3% |
| Jamaica | 685 | 0.5% |
| Japan | 9 | 0.0% |
| Kenya | 18 | 0.0% |
| Korea | 51 | 0.0% |
| Latin America | 57,895 | 42.7% |
| Lebanon | 39 | 0.0% |
| Mexico | 2,655 | 2.0% |
| Middle Africa | 241 | 0.2% |
| Moldova | 2 | 0.0% |
| Morocco | 25 | 0.0% |
| Netherlands | 14 | 0.0% |
| Nicaragua | 523 | 0.4% |
| Nigeria | 227 | 0.2% |
| Northern Africa | 629 | 0.5% |
| Northern Europe | 69 | 0.1% |
| Oceania | 20 | 0.0% |
| Pakistan | 138 | 0.1% |
| Panama | 202 | 0.2% |
| Peru | 4,015 | 3.0% |
| Philippines | 205 | 0.2% |
| Poland | 356 | 0.3% |
| Portugal | 2,973 | 2.2% |
| Romania | 35 | 0.0% |
| Russia | 54 | 0.0% |
| Senegal | 18 | 0.0% |
| South Africa | 54 | 0.0% |
| South America | 26,263 | 19.4% |
| South Central Asia | 1,085 | 0.8% |
| South Eastern Asia | 210 | 0.2% |
| Southern Europe | 3,734 | 2.8% |
| Spain | 321 | 0.2% |
| Sri Lanka | 92 | 0.1% |
| St. Vincent and the Grenadines | 49 | 0.0% |
| Sudan | 87 | 0.1% |
| Syria | 290 | 0.2% |
| Taiwan | 1 | 0.0% |
| Trinidad and Tobago | 221 | 0.2% |
| Turkey | 159 | 0.1% |
| Uganda | 2 | 0.0% |
| Ukraine | 23 | 0.0% |
| Uruguay | 1,140 | 0.8% |
| Uzbekistan | 15 | 0.0% |
| Venezuela | 725 | 0.5% |
| Vietnam | 1 | 0.0% |
| Western Africa | 953 | 0.7% |
| Western Asia | 577 | 0.4% |
| Western Europe | 108 | 0.1% |
| Zaire | 157 | 0.1% | View All 95 Rows |
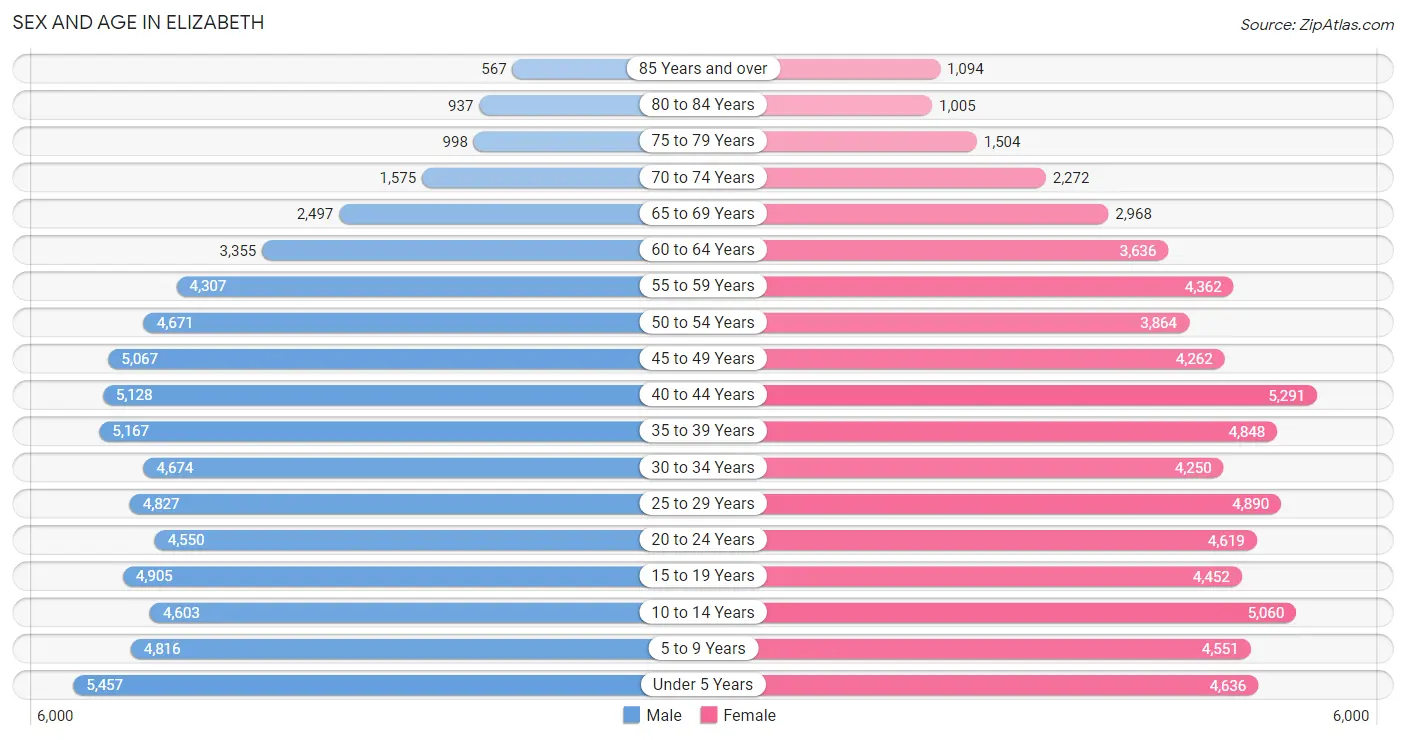
Sex and Age in Elizabeth
Sex and Age in Elizabeth
The most populous age groups in Elizabeth are Under 5 Years (5,457 | 8.0%) for men and 40 to 44 Years (5,291 | 7.8%) for women.
| Age Bracket | Male | Female |
| Under 5 Years | 5,457 (8.0%) | 4,636 (6.9%) |
| 5 to 9 Years | 4,816 (7.1%) | 4,551 (6.7%) |
| 10 to 14 Years | 4,603 (6.8%) | 5,060 (7.5%) |
| 15 to 19 Years | 4,905 (7.2%) | 4,452 (6.6%) |
| 20 to 24 Years | 4,550 (6.7%) | 4,619 (6.8%) |
| 25 to 29 Years | 4,827 (7.1%) | 4,890 (7.2%) |
| 30 to 34 Years | 4,674 (6.9%) | 4,250 (6.3%) |
| 35 to 39 Years | 5,167 (7.6%) | 4,848 (7.2%) |
| 40 to 44 Years | 5,128 (7.5%) | 5,291 (7.8%) |
| 45 to 49 Years | 5,067 (7.4%) | 4,262 (6.3%) |
| 50 to 54 Years | 4,671 (6.9%) | 3,864 (5.7%) |
| 55 to 59 Years | 4,307 (6.3%) | 4,362 (6.5%) |
| 60 to 64 Years | 3,355 (4.9%) | 3,636 (5.4%) |
| 65 to 69 Years | 2,497 (3.7%) | 2,968 (4.4%) |
| 70 to 74 Years | 1,575 (2.3%) | 2,272 (3.4%) |
| 75 to 79 Years | 998 (1.5%) | 1,504 (2.2%) |
| 80 to 84 Years | 937 (1.4%) | 1,005 (1.5%) |
| 85 Years and over | 567 (0.8%) | 1,094 (1.6%) |
| Total | 68,101 (100.0%) | 67,564 (100.0%) |
Families and Households in Elizabeth
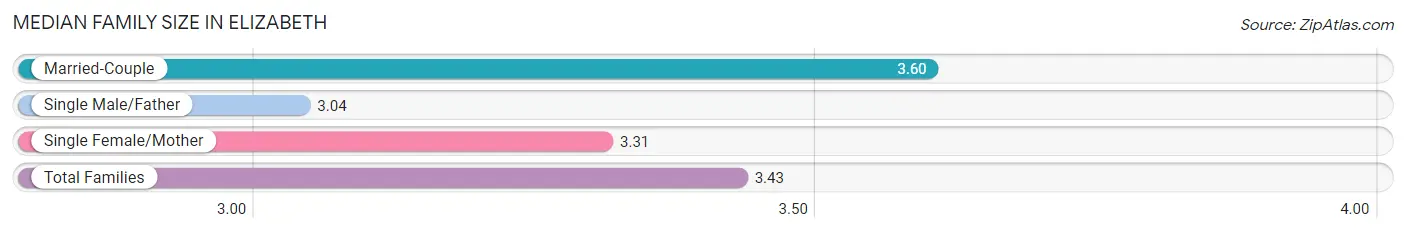
Median Family Size in Elizabeth
The median family size in Elizabeth is 3.43 persons per family, with married-couple families (17,843 | 55.5%) accounting for the largest median family size of 3.6 persons per family. On the other hand, single male/father families (4,927 | 15.3%) represent the smallest median family size with 3.04 persons per family.
| Family Type | # Families | Family Size |
| Married-Couple | 17,843 (55.5%) | 3.60 |
| Single Male/Father | 4,927 (15.3%) | 3.04 |
| Single Female/Mother | 9,397 (29.2%) | 3.31 |
| Total Families | 32,167 (100.0%) | 3.43 |
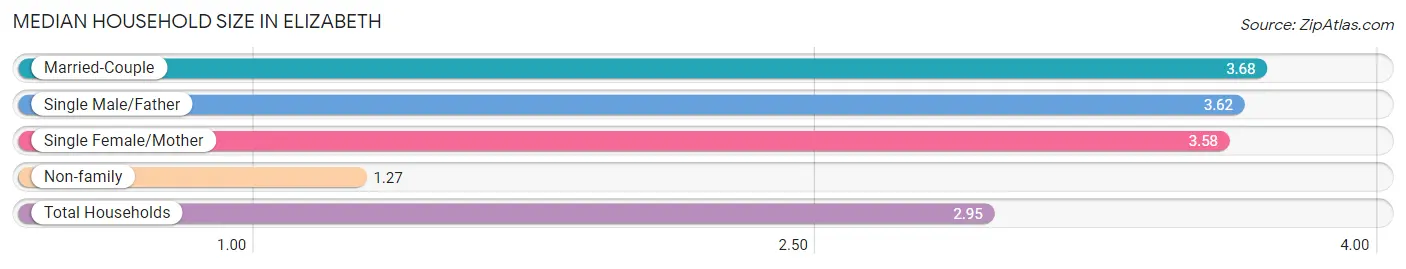
Median Household Size in Elizabeth
The median household size in Elizabeth is 2.95 persons per household, with married-couple households (17,843 | 39.2%) accounting for the largest median household size of 3.68 persons per household. non-family households (13,321 | 29.3%) represent the smallest median household size with 1.27 persons per household.
| Household Type | # Households | Household Size |
| Married-Couple | 17,843 (39.2%) | 3.68 |
| Single Male/Father | 4,927 (10.8%) | 3.62 |
| Single Female/Mother | 9,397 (20.7%) | 3.58 |
| Non-family | 13,321 (29.3%) | 1.27 |
| Total Households | 45,488 (100.0%) | 2.95 |
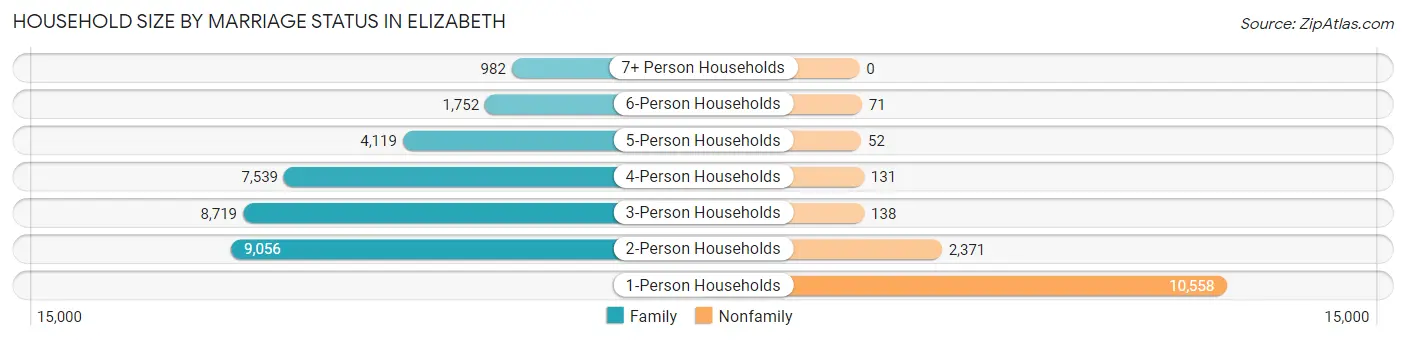
Household Size by Marriage Status in Elizabeth
Out of a total of 45,488 households in Elizabeth, 32,167 (70.7%) are family households, while 13,321 (29.3%) are nonfamily households. The most numerous type of family households are 2-person households, comprising 9,056, and the most common type of nonfamily households are 1-person households, comprising 10,558.
| Household Size | Family Households | Nonfamily Households |
| 1-Person Households | - | 10,558 (23.2%) |
| 2-Person Households | 9,056 (19.9%) | 2,371 (5.2%) |
| 3-Person Households | 8,719 (19.2%) | 138 (0.3%) |
| 4-Person Households | 7,539 (16.6%) | 131 (0.3%) |
| 5-Person Households | 4,119 (9.1%) | 52 (0.1%) |
| 6-Person Households | 1,752 (3.8%) | 71 (0.2%) |
| 7+ Person Households | 982 (2.2%) | 0 (0.0%) |
| Total | 32,167 (70.7%) | 13,321 (29.3%) |
Female Fertility in Elizabeth
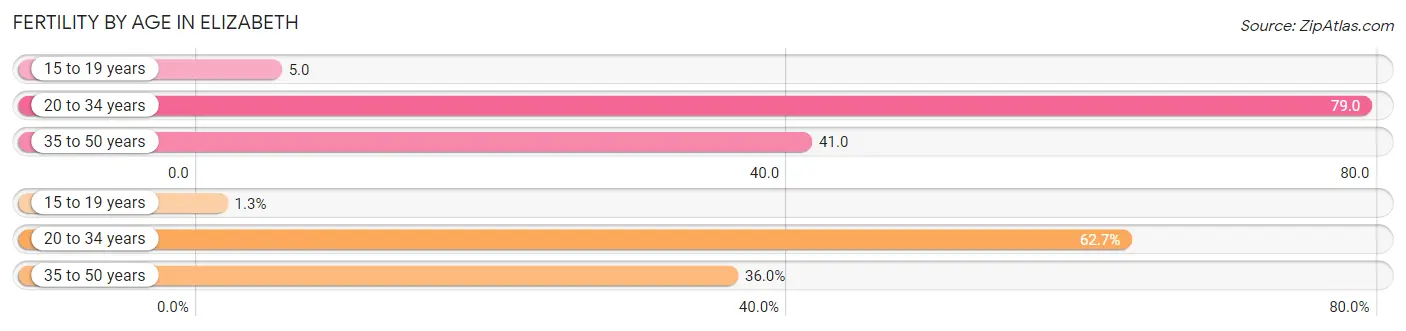
Fertility by Age in Elizabeth
Average fertility rate in Elizabeth is 52.0 births per 1,000 women. Women in the age bracket of 20 to 34 years have the highest fertility rate with 79.0 births per 1,000 women. Women in the age bracket of 20 to 34 years acount for 62.7% of all women with births.
| Age Bracket | Women with Births | Births / 1,000 Women |
| 15 to 19 years | 23 (1.3%) | 5.0 |
| 20 to 34 years | 1,088 (62.7%) | 79.0 |
| 35 to 50 years | 624 (36.0%) | 41.0 |
| Total | 1,735 (100.0%) | 52.0 |
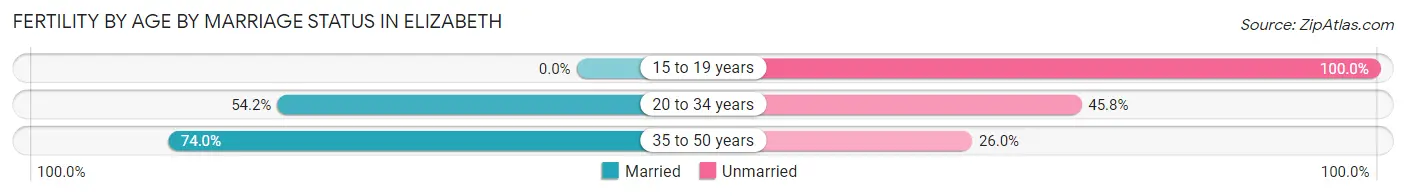
Fertility by Age by Marriage Status in Elizabeth
60.6% of women with births (1,735) in Elizabeth are married. The highest percentage of unmarried women with births falls into 15 to 19 years age bracket with 100.0% of them unmarried at the time of birth, while the lowest percentage of unmarried women with births belong to 35 to 50 years age bracket with 26.0% of them unmarried.
| Age Bracket | Married | Unmarried |
| 15 to 19 years | 0 (0.0%) | 23 (100.0%) |
| 20 to 34 years | 590 (54.2%) | 498 (45.8%) |
| 35 to 50 years | 462 (74.0%) | 162 (26.0%) |
| Total | 1,051 (60.6%) | 684 (39.4%) |
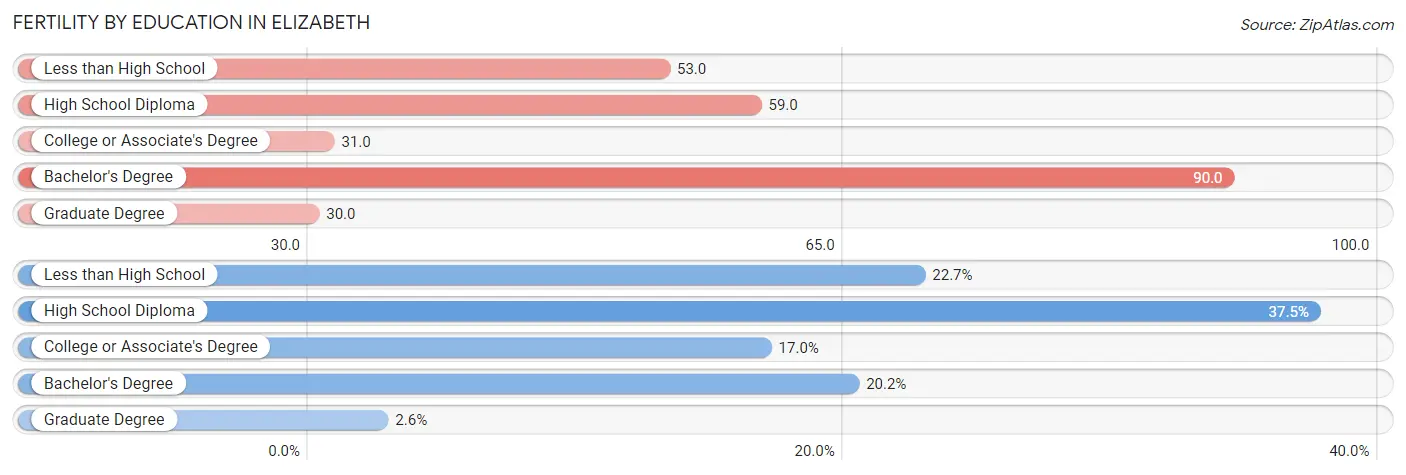
Fertility by Education in Elizabeth
Average fertility rate in Elizabeth is 52.0 births per 1,000 women. Women with the education attainment of bachelor's degree have the highest fertility rate of 90.0 births per 1,000 women, while women with the education attainment of graduate degree have the lowest fertility at 30.0 births per 1,000 women. Women with the education attainment of high school diploma represent 37.5% of all women with births.
| Educational Attainment | Women with Births | Births / 1,000 Women |
| Less than High School | 394 (22.7%) | 53.0 |
| High School Diploma | 651 (37.5%) | 59.0 |
| College or Associate's Degree | 294 (17.0%) | 31.0 |
| Bachelor's Degree | 351 (20.2%) | 90.0 |
| Graduate Degree | 45 (2.6%) | 30.0 |
| Total | 1,735 (100.0%) | 52.0 |
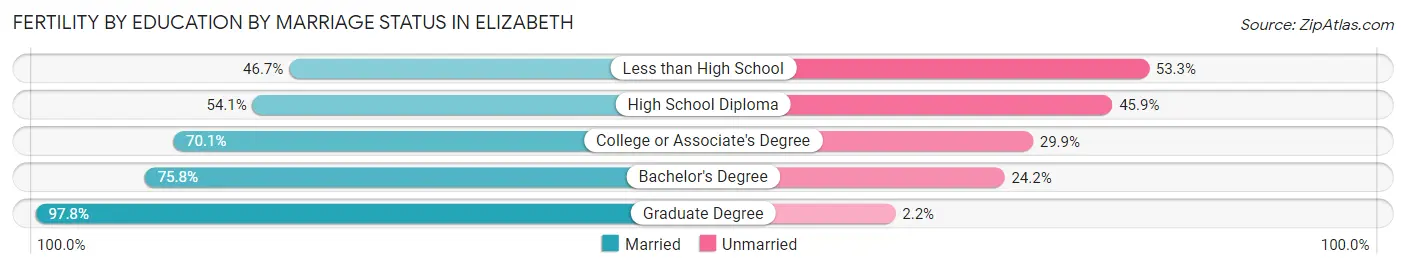
Fertility by Education by Marriage Status in Elizabeth
39.4% of women with births in Elizabeth are unmarried. Women with the educational attainment of graduate degree are most likely to be married with 97.8% of them married at childbirth, while women with the educational attainment of less than high school are least likely to be married with 53.3% of them unmarried at childbirth.
| Educational Attainment | Married | Unmarried |
| Less than High School | 184 (46.7%) | 210 (53.3%) |
| High School Diploma | 352 (54.1%) | 299 (45.9%) |
| College or Associate's Degree | 206 (70.1%) | 88 (29.9%) |
| Bachelor's Degree | 266 (75.8%) | 85 (24.2%) |
| Graduate Degree | 44 (97.8%) | 1 (2.2%) |
| Total | 1,051 (60.6%) | 684 (39.4%) |
Income in Elizabeth
Income Overview in Elizabeth
Per Capita Income in Elizabeth is $26,633, while median incomes of families and households are $63,566 and $59,939 respectively.
| Characteristic | Number | Measure |
| Per Capita Income | 135,665 | $26,633 |
| Median Family Income | 32,167 | $63,566 |
| Mean Family Income | 32,167 | $81,886 |
| Median Household Income | 45,488 | $59,939 |
| Mean Household Income | 45,488 | $76,875 |
| Income Deficit | 32,167 | $10,633 |
| Wage / Income Gap (%) | 135,665 | 25.49% |
| Wage / Income Gap ($) | 135,665 | 74.51¢ per $1 |
| Gini / Inequality Index | 135,665 | 0.43 |
Earnings by Sex in Elizabeth
Average Earnings in Elizabeth are $35,284, $39,885 for men and $29,719 for women, a difference of 25.5%.
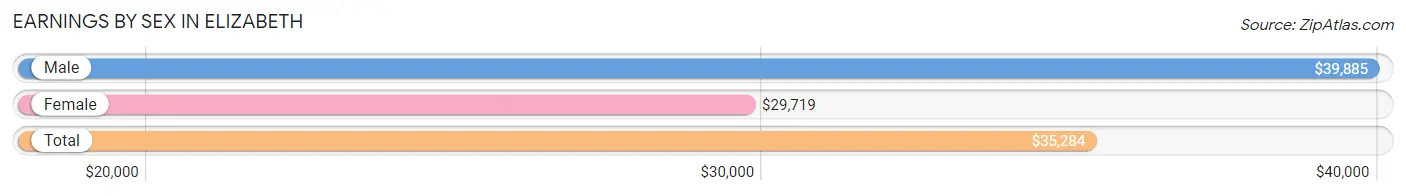
| Sex | Number | Average Earnings |
| Male | 38,881 (55.6%) | $39,885 |
| Female | 31,032 (44.4%) | $29,719 |
| Total | 69,913 (100.0%) | $35,284 |
Earnings by Sex by Income Bracket in Elizabeth
The most common earnings brackets in Elizabeth are $75,000 to $99,999 for men (3,576 | 9.2%) and $25,000 to $29,999 for women (2,981 | 9.6%).
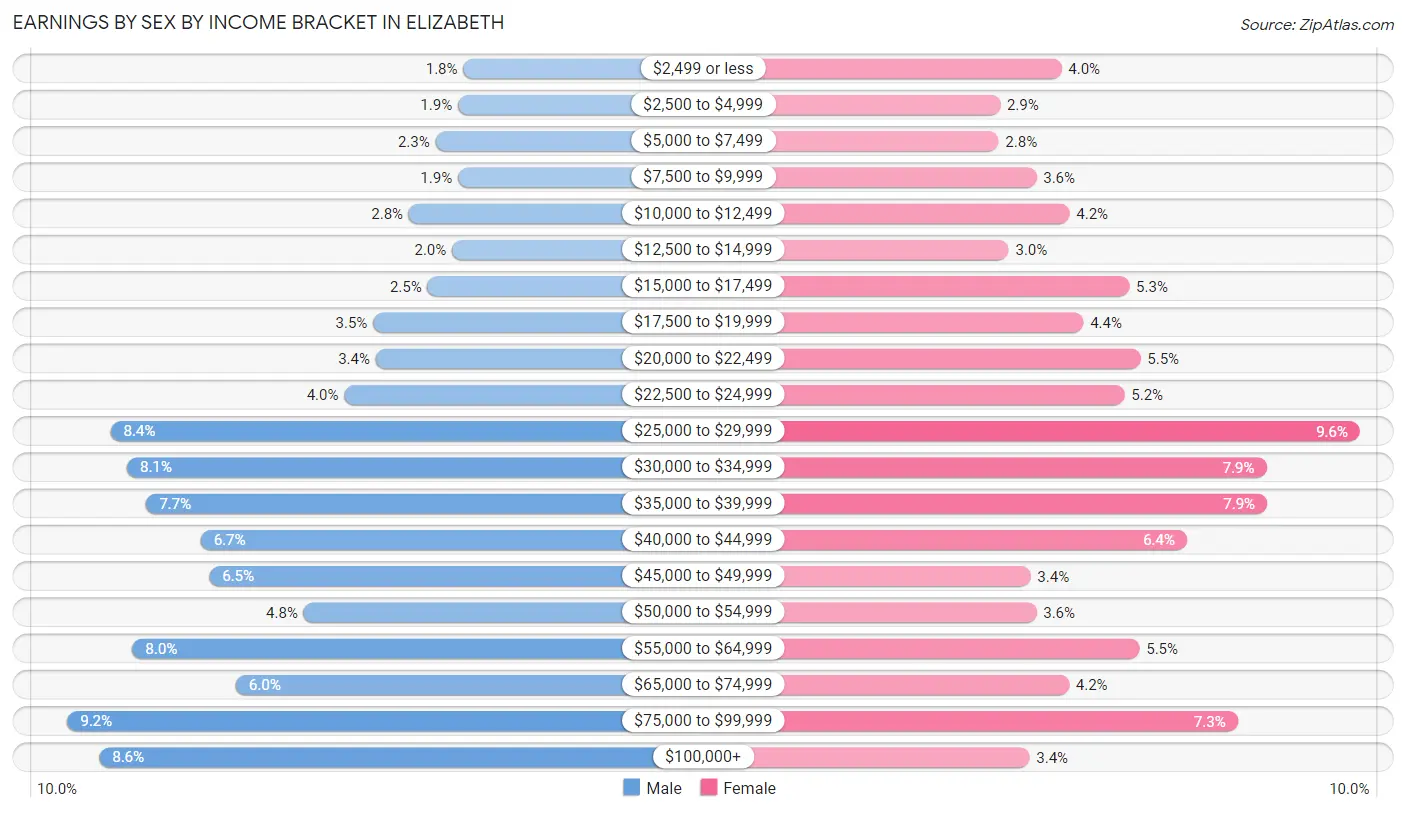
| Income | Male | Female |
| $2,499 or less | 691 (1.8%) | 1,246 (4.0%) |
| $2,500 to $4,999 | 732 (1.9%) | 891 (2.9%) |
| $5,000 to $7,499 | 893 (2.3%) | 881 (2.8%) |
| $7,500 to $9,999 | 732 (1.9%) | 1,102 (3.5%) |
| $10,000 to $12,499 | 1,090 (2.8%) | 1,294 (4.2%) |
| $12,500 to $14,999 | 772 (2.0%) | 939 (3.0%) |
| $15,000 to $17,499 | 953 (2.5%) | 1,641 (5.3%) |
| $17,500 to $19,999 | 1,349 (3.5%) | 1,376 (4.4%) |
| $20,000 to $22,499 | 1,329 (3.4%) | 1,708 (5.5%) |
| $22,500 to $24,999 | 1,559 (4.0%) | 1,613 (5.2%) |
| $25,000 to $29,999 | 3,263 (8.4%) | 2,981 (9.6%) |
| $30,000 to $34,999 | 3,141 (8.1%) | 2,440 (7.9%) |
| $35,000 to $39,999 | 3,003 (7.7%) | 2,443 (7.9%) |
| $40,000 to $44,999 | 2,605 (6.7%) | 1,978 (6.4%) |
| $45,000 to $49,999 | 2,544 (6.5%) | 1,069 (3.4%) |
| $50,000 to $54,999 | 1,854 (4.8%) | 1,103 (3.5%) |
| $55,000 to $64,999 | 3,102 (8.0%) | 1,702 (5.5%) |
| $65,000 to $74,999 | 2,348 (6.0%) | 1,290 (4.2%) |
| $75,000 to $99,999 | 3,576 (9.2%) | 2,273 (7.3%) |
| $100,000+ | 3,345 (8.6%) | 1,062 (3.4%) |
| Total | 38,881 (100.0%) | 31,032 (100.0%) |
Earnings by Sex by Educational Attainment in Elizabeth
Average earnings in Elizabeth are $42,523 for men and $33,050 for women, a difference of 22.3%. Men with an educational attainment of graduate degree enjoy the highest average annual earnings of $63,475, while those with less than high school education earn the least with $38,668. Women with an educational attainment of graduate degree earn the most with the average annual earnings of $76,071, while those with less than high school education have the smallest earnings of $23,304.
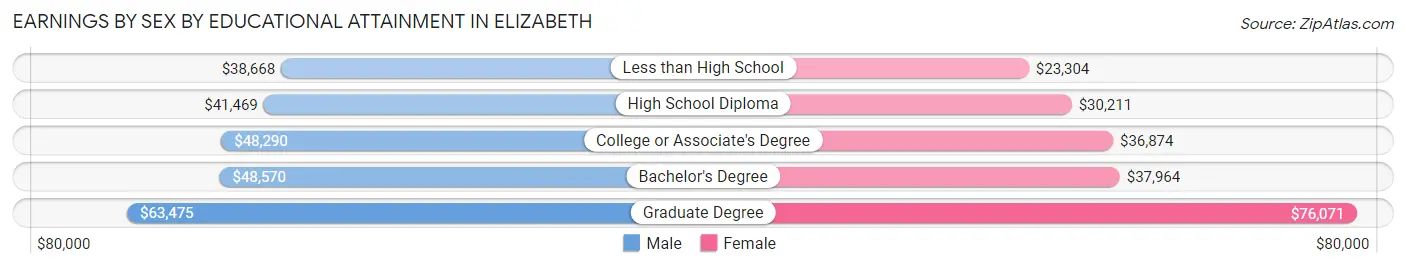
| Educational Attainment | Male Income | Female Income |
| Less than High School | $38,668 | $23,304 |
| High School Diploma | $41,469 | $30,211 |
| College or Associate's Degree | $48,290 | $36,874 |
| Bachelor's Degree | $48,570 | $37,964 |
| Graduate Degree | $63,475 | $76,071 |
| Total | $42,523 | $33,050 |
Family Income in Elizabeth
Family Income Brackets in Elizabeth
According to the Elizabeth family income data, there are 6,305 families falling into the $50,000 to $74,999 income range, which is the most common income bracket and makes up 19.6% of all families. Conversely, the $10,000 to $14,999 income bracket is the least frequent group with only 965 families (3.0%) belonging to this category.
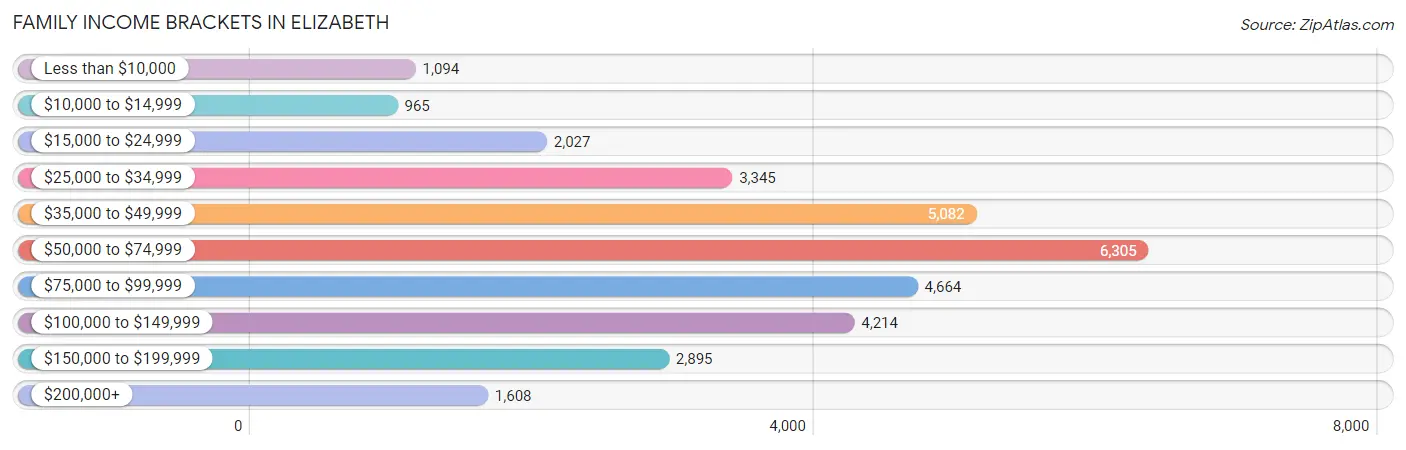
| Income Bracket | # Families | % Families |
| Less than $10,000 | 1,094 | 3.4% |
| $10,000 to $14,999 | 965 | 3.0% |
| $15,000 to $24,999 | 2,027 | 6.3% |
| $25,000 to $34,999 | 3,345 | 10.4% |
| $35,000 to $49,999 | 5,082 | 15.8% |
| $50,000 to $74,999 | 6,305 | 19.6% |
| $75,000 to $99,999 | 4,664 | 14.5% |
| $100,000 to $149,999 | 4,214 | 13.1% |
| $150,000 to $199,999 | 2,895 | 9.0% |
| $200,000+ | 1,608 | 5.0% |
Family Income by Famaliy Size in Elizabeth
7+ person families (770 | 2.4%) account for the highest median family income in Elizabeth with $124,914 per family, while 2-person families (11,188 | 34.8%) have the highest median income of $26,430 per family member.
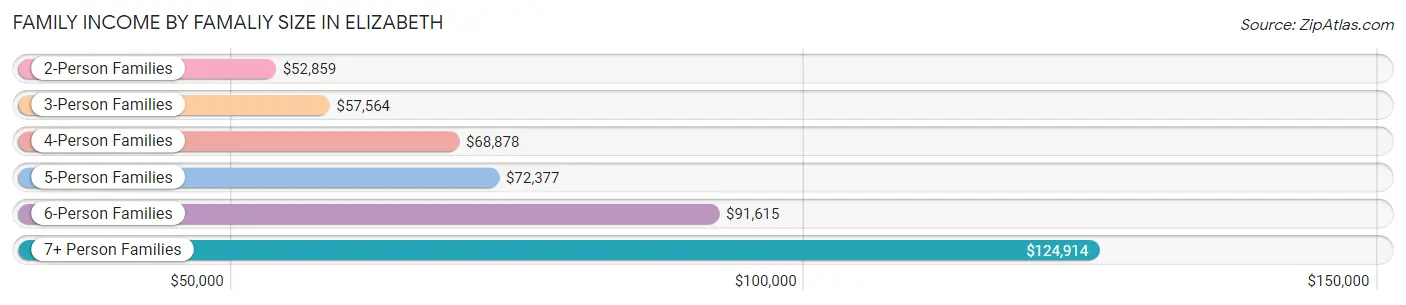
| Income Bracket | # Families | Median Income |
| 2-Person Families | 11,188 (34.8%) | $52,859 |
| 3-Person Families | 8,492 (26.4%) | $57,564 |
| 4-Person Families | 6,827 (21.2%) | $68,878 |
| 5-Person Families | 3,358 (10.4%) | $72,377 |
| 6-Person Families | 1,532 (4.8%) | $91,615 |
| 7+ Person Families | 770 (2.4%) | $124,914 |
| Total | 32,167 (100.0%) | $63,566 |
Family Income by Number of Earners in Elizabeth
The median family income in Elizabeth is $63,566, with families comprising 3+ earners (4,469) having the highest median family income of $124,814, while families with no earners (3,212) have the lowest median family income of $28,249, accounting for 13.9% and 10.0% of families, respectively.
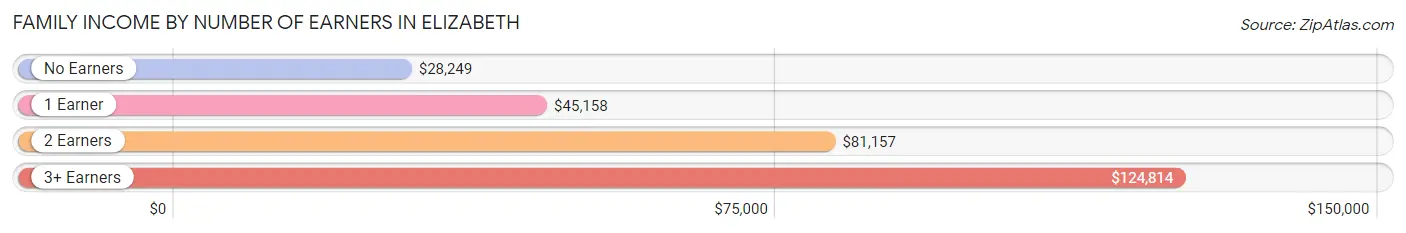
| Number of Earners | # Families | Median Income |
| No Earners | 3,212 (10.0%) | $28,249 |
| 1 Earner | 11,682 (36.3%) | $45,158 |
| 2 Earners | 12,804 (39.8%) | $81,157 |
| 3+ Earners | 4,469 (13.9%) | $124,814 |
| Total | 32,167 (100.0%) | $63,566 |
Household Income in Elizabeth
Household Income Brackets in Elizabeth
With 8,188 households falling in the category, the $50,000 to $74,999 income range is the most frequent in Elizabeth, accounting for 18.0% of all households. In contrast, only 2,092 households (4.6%) fall into the $200,000+ income bracket, making it the least populous group.
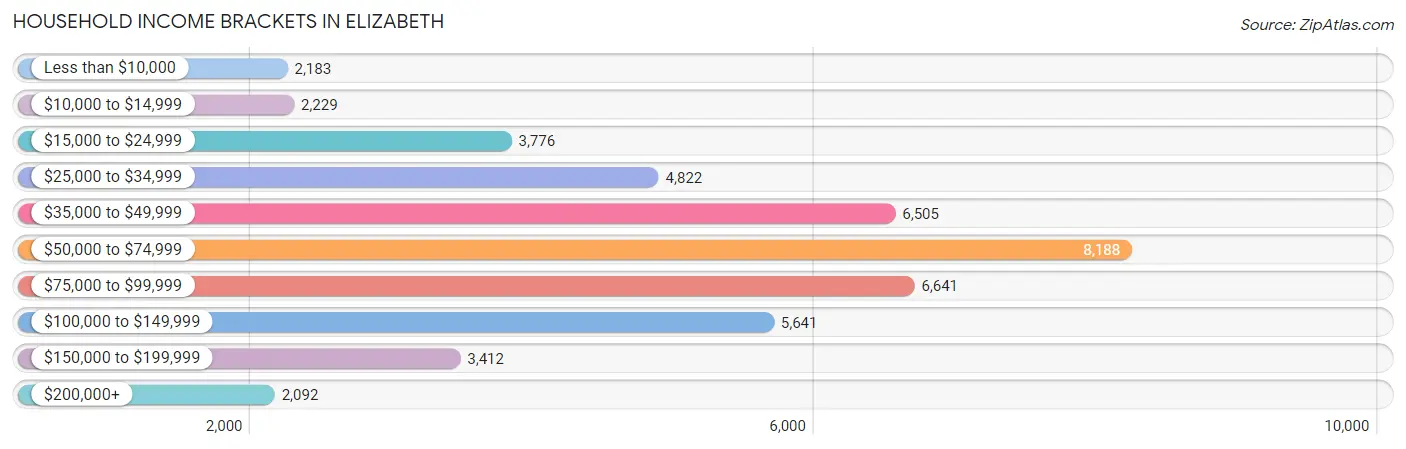
| Income Bracket | # Households | % Households |
| Less than $10,000 | 2,183 | 4.8% |
| $10,000 to $14,999 | 2,229 | 4.9% |
| $15,000 to $24,999 | 3,776 | 8.3% |
| $25,000 to $34,999 | 4,822 | 10.6% |
| $35,000 to $49,999 | 6,505 | 14.3% |
| $50,000 to $74,999 | 8,188 | 18.0% |
| $75,000 to $99,999 | 6,641 | 14.6% |
| $100,000 to $149,999 | 5,641 | 12.4% |
| $150,000 to $199,999 | 3,412 | 7.5% |
| $200,000+ | 2,092 | 4.6% |
Household Income by Householder Age in Elizabeth
The median household income in Elizabeth is $59,939, with the highest median household income of $66,293 found in the 45 to 64 years age bracket for the primary householder. A total of 18,413 households (40.5%) fall into this category. Meanwhile, the 65+ years age bracket for the primary householder has the lowest median household income of $38,826, with 8,907 households (19.6%) in this group.
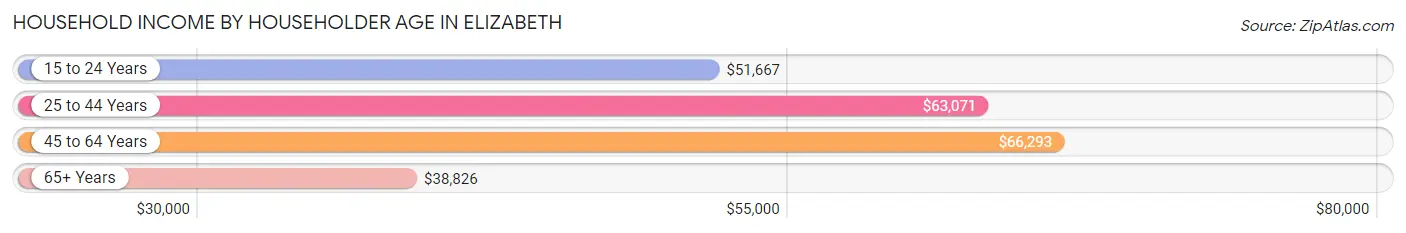
| Income Bracket | # Households | Median Income |
| 15 to 24 Years | 1,262 (2.8%) | $51,667 |
| 25 to 44 Years | 16,906 (37.2%) | $63,071 |
| 45 to 64 Years | 18,413 (40.5%) | $66,293 |
| 65+ Years | 8,907 (19.6%) | $38,826 |
| Total | 45,488 (100.0%) | $59,939 |
Poverty in Elizabeth
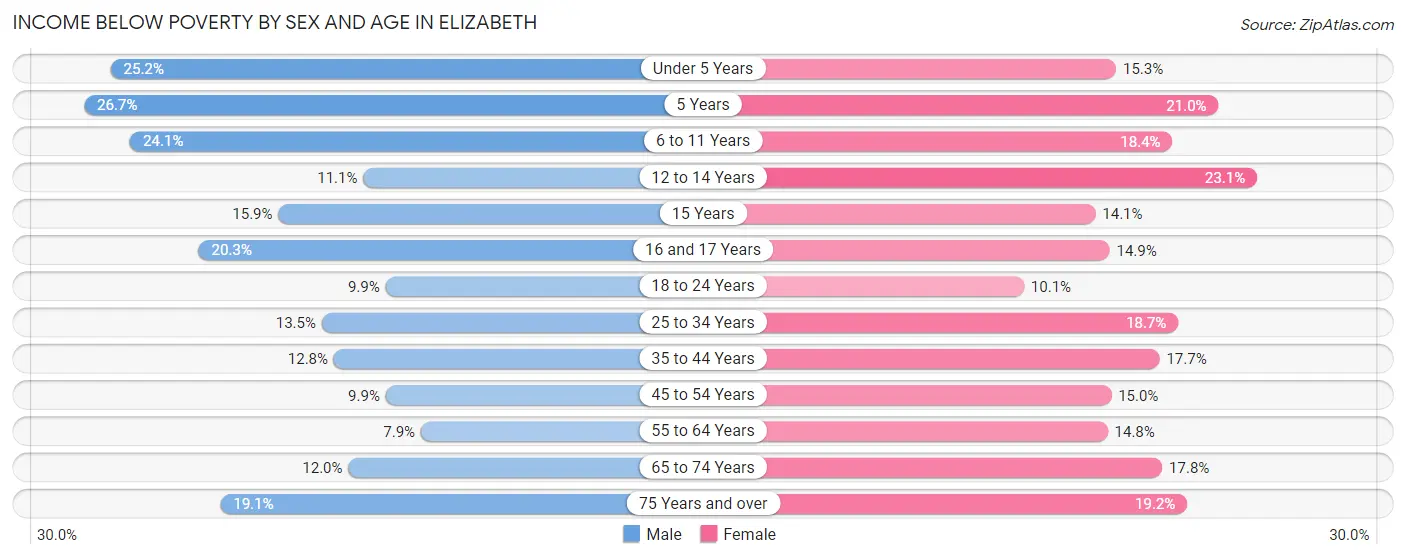
Income Below Poverty by Sex and Age in Elizabeth
With 14.1% poverty level for males and 16.6% for females among the residents of Elizabeth, 5 year old males and 12 to 14 year old females are the most vulnerable to poverty, with 312 males (26.7%) and 678 females (23.1%) in their respective age groups living below the poverty level.
| Age Bracket | Male | Female |
| Under 5 Years | 1,353 (25.2%) | 703 (15.3%) |
| 5 Years | 312 (26.7%) | 182 (21.0%) |
| 6 to 11 Years | 1,269 (24.1%) | 1,053 (18.4%) |
| 12 to 14 Years | 303 (11.1%) | 678 (23.1%) |
| 15 Years | 116 (15.9%) | 124 (14.1%) |
| 16 and 17 Years | 410 (20.3%) | 246 (14.9%) |
| 18 to 24 Years | 656 (9.9%) | 663 (10.1%) |
| 25 to 34 Years | 1,258 (13.5%) | 1,709 (18.7%) |
| 35 to 44 Years | 1,303 (12.8%) | 1,791 (17.7%) |
| 45 to 54 Years | 955 (9.9%) | 1,215 (15.0%) |
| 55 to 64 Years | 599 (7.9%) | 1,179 (14.8%) |
| 65 to 74 Years | 480 (12.0%) | 929 (17.8%) |
| 75 Years and over | 461 (19.1%) | 651 (19.2%) |
| Total | 9,475 (14.1%) | 11,123 (16.6%) |
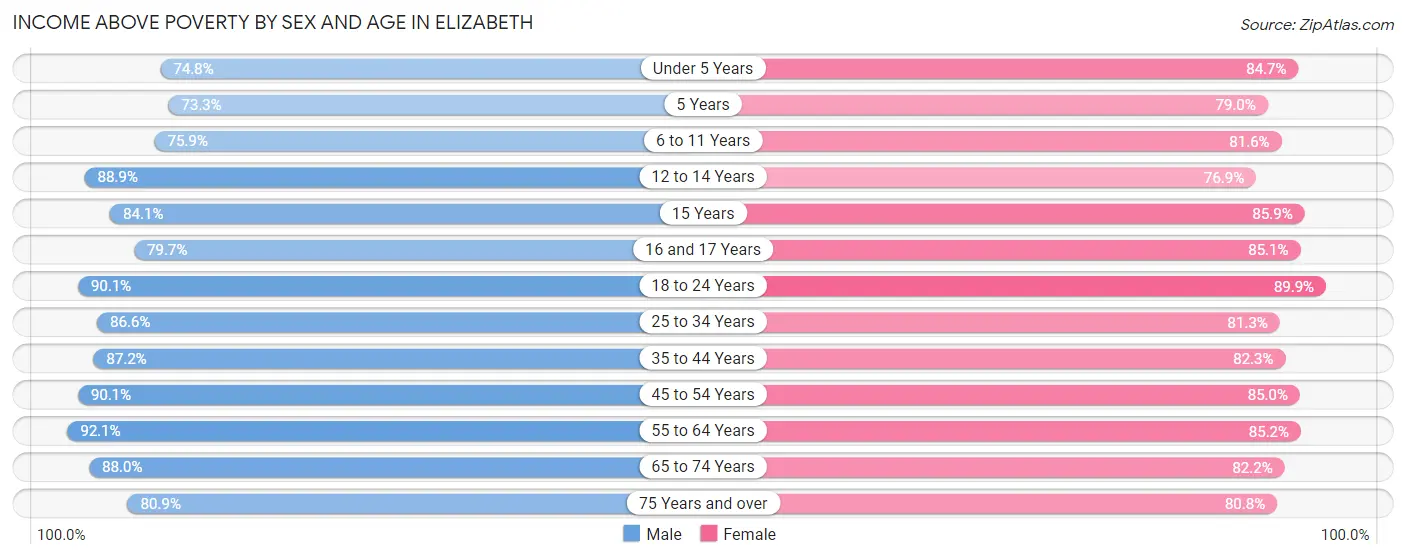
Income Above Poverty by Sex and Age in Elizabeth
According to the poverty statistics in Elizabeth, males aged 55 to 64 years and females aged 18 to 24 years are the age groups that are most secure financially, with 92.1% of males and 89.9% of females in these age groups living above the poverty line.
| Age Bracket | Male | Female |
| Under 5 Years | 4,014 (74.8%) | 3,901 (84.7%) |
| 5 Years | 857 (73.3%) | 686 (79.0%) |
| 6 to 11 Years | 3,991 (75.9%) | 4,666 (81.6%) |
| 12 to 14 Years | 2,417 (88.9%) | 2,254 (76.9%) |
| 15 Years | 615 (84.1%) | 754 (85.9%) |
| 16 and 17 Years | 1,609 (79.7%) | 1,404 (85.1%) |
| 18 to 24 Years | 5,968 (90.1%) | 5,875 (89.9%) |
| 25 to 34 Years | 8,097 (86.6%) | 7,417 (81.3%) |
| 35 to 44 Years | 8,892 (87.2%) | 8,331 (82.3%) |
| 45 to 54 Years | 8,698 (90.1%) | 6,887 (85.0%) |
| 55 to 64 Years | 6,955 (92.1%) | 6,786 (85.2%) |
| 65 to 74 Years | 3,530 (88.0%) | 4,278 (82.2%) |
| 75 Years and over | 1,953 (80.9%) | 2,734 (80.8%) |
| Total | 57,596 (85.9%) | 55,973 (83.4%) |
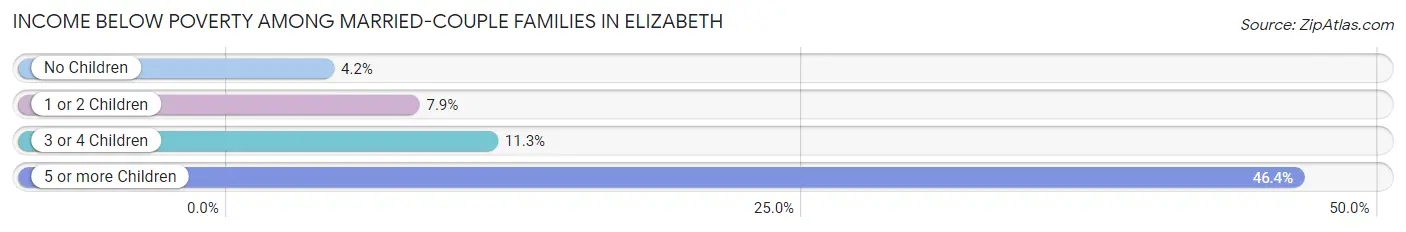
Income Below Poverty Among Married-Couple Families in Elizabeth
The poverty statistics for married-couple families in Elizabeth show that 6.8% or 1,207 of the total 17,843 families live below the poverty line. Families with 5 or more children have the highest poverty rate of 46.4%, comprising of 65 families. On the other hand, families with no children have the lowest poverty rate of 4.2%, which includes 357 families.
| Children | Above Poverty | Below Poverty |
| No Children | 8,185 (95.8%) | 357 (4.2%) |
| 1 or 2 Children | 6,776 (92.1%) | 581 (7.9%) |
| 3 or 4 Children | 1,600 (88.7%) | 204 (11.3%) |
| 5 or more Children | 75 (53.6%) | 65 (46.4%) |
| Total | 16,636 (93.2%) | 1,207 (6.8%) |
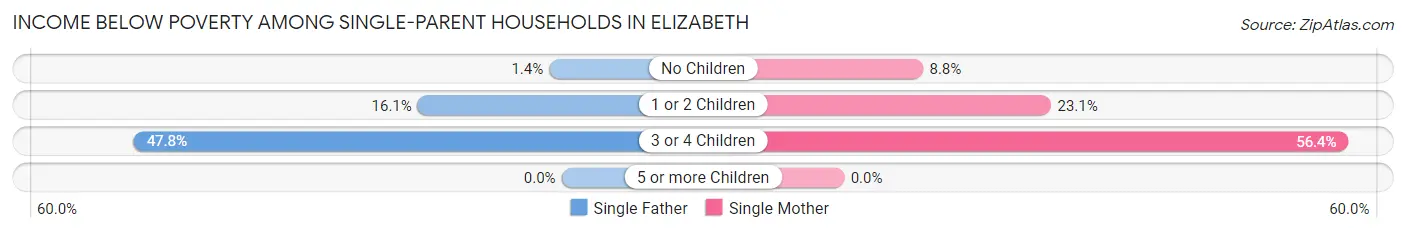
Income Below Poverty Among Single-Parent Households in Elizabeth
According to the poverty data in Elizabeth, 13.8% or 681 single-father households and 20.7% or 1,942 single-mother households are living below the poverty line. Among single-father households, those with 3 or 4 children have the highest poverty rate, with 228 households (47.8%) experiencing poverty. Likewise, among single-mother households, those with 3 or 4 children have the highest poverty rate, with 490 households (56.4%) falling below the poverty line.
| Children | Single Father | Single Mother |
| No Children | 24 (1.4%) | 320 (8.8%) |
| 1 or 2 Children | 429 (16.1%) | 1,132 (23.1%) |
| 3 or 4 Children | 228 (47.8%) | 490 (56.4%) |
| 5 or more Children | 0 (0.0%) | 0 (0.0%) |
| Total | 681 (13.8%) | 1,942 (20.7%) |
Income Below Poverty Among Married-Couple vs Single-Parent Households in Elizabeth
The poverty data for Elizabeth shows that 1,207 of the married-couple family households (6.8%) and 2,623 of the single-parent households (18.3%) are living below the poverty level. Within the married-couple family households, those with 5 or more children have the highest poverty rate, with 65 households (46.4%) falling below the poverty line. Among the single-parent households, those with 3 or 4 children have the highest poverty rate, with 718 household (53.3%) living below poverty.
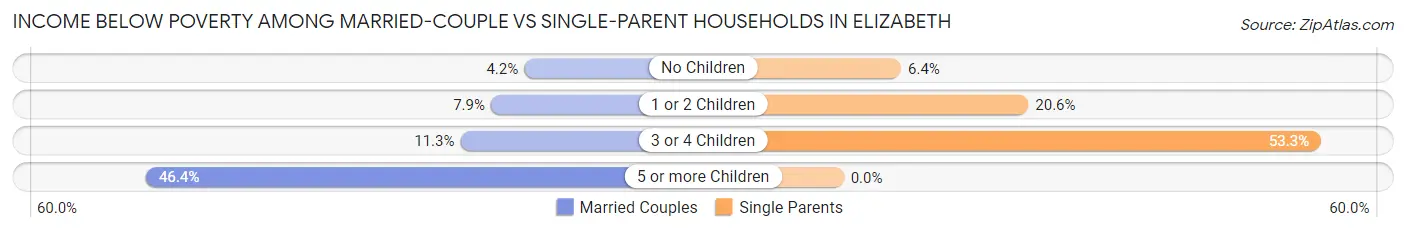
| Children | Married-Couple Families | Single-Parent Households |
| No Children | 357 (4.2%) | 344 (6.4%) |
| 1 or 2 Children | 581 (7.9%) | 1,561 (20.6%) |
| 3 or 4 Children | 204 (11.3%) | 718 (53.3%) |
| 5 or more Children | 65 (46.4%) | 0 (0.0%) |
| Total | 1,207 (6.8%) | 2,623 (18.3%) |
Employment Characteristics in Elizabeth
Employment by Class of Employer in Elizabeth
Among the 62,888 employed individuals in Elizabeth, private company employees (49,109 | 78.1%), local government employees (3,315 | 5.3%), and self-employed (not incorporated) (3,132 | 5.0%) make up the most common classes of employment.
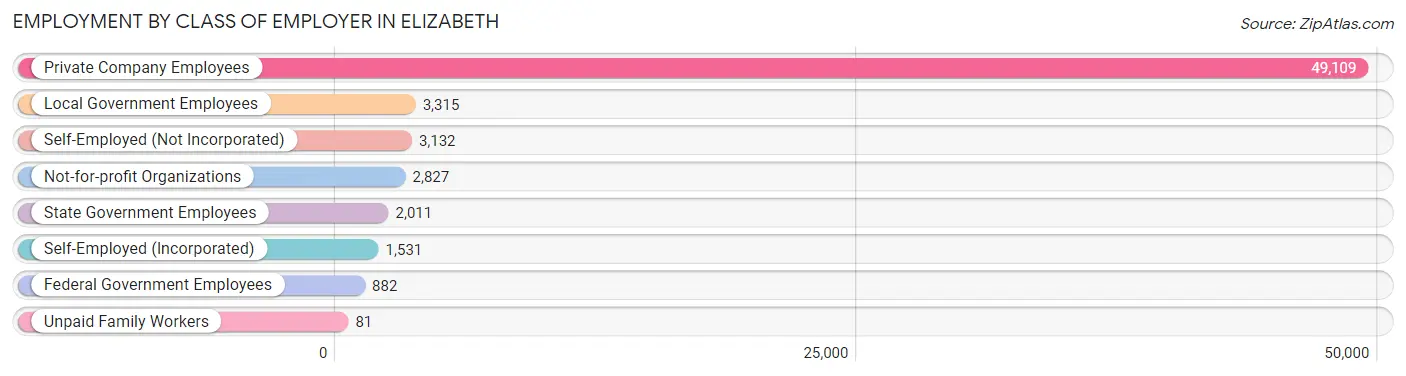
| Employer Class | # Employees | % Employees |
| Private Company Employees | 49,109 | 78.1% |
| Self-Employed (Incorporated) | 1,531 | 2.4% |
| Self-Employed (Not Incorporated) | 3,132 | 5.0% |
| Not-for-profit Organizations | 2,827 | 4.5% |
| Local Government Employees | 3,315 | 5.3% |
| State Government Employees | 2,011 | 3.2% |
| Federal Government Employees | 882 | 1.4% |
| Unpaid Family Workers | 81 | 0.1% |
| Total | 62,888 | 100.0% |
Employment Status by Age in Elizabeth
According to the labor force statistics for Elizabeth, out of the total population over 16 years of age (104,930), 66.1% or 69,359 individuals are in the labor force, with 5.9% or 4,092 of them unemployed. The age group with the highest labor force participation rate is 35 to 44 years, with 83.5% or 17,062 individuals in the labor force. Within the labor force, the 16 to 19 years age range has the highest percentage of unemployed individuals, with 18.5% or 362 of them being unemployed.
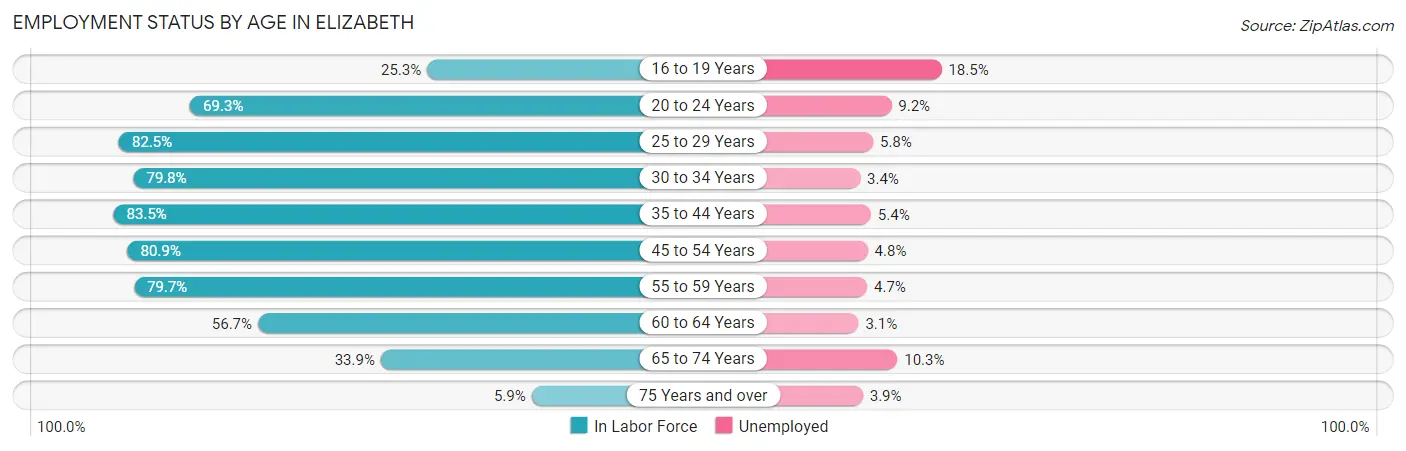
| Age Bracket | In Labor Force | Unemployed |
| 16 to 19 Years | 1,959 (25.3%) | 362 (18.5%) |
| 20 to 24 Years | 6,354 (69.3%) | 585 (9.2%) |
| 25 to 29 Years | 8,017 (82.5%) | 465 (5.8%) |
| 30 to 34 Years | 7,121 (79.8%) | 242 (3.4%) |
| 35 to 44 Years | 17,062 (83.5%) | 921 (5.4%) |
| 45 to 54 Years | 14,452 (80.9%) | 694 (4.8%) |
| 55 to 59 Years | 6,909 (79.7%) | 325 (4.7%) |
| 60 to 64 Years | 3,964 (56.7%) | 123 (3.1%) |
| 65 to 74 Years | 3,157 (33.9%) | 325 (10.3%) |
| 75 Years and over | 360 (5.9%) | 14 (3.9%) |
| Total | 69,359 (66.1%) | 4,092 (5.9%) |
Employment Status by Educational Attainment in Elizabeth
According to labor force statistics for Elizabeth, 79.2% of individuals (57,498) out of the total population between 25 and 64 years of age (72,599) are in the labor force, with 4.8% or 2,760 of them being unemployed. The group with the highest labor force participation rate are those with the educational attainment of bachelor's degree or higher, with 90.3% or 9,655 individuals in the labor force. Within the labor force, individuals with college / associate degree education have the highest percentage of unemployment, with 7.8% or 1,113 of them being unemployed.
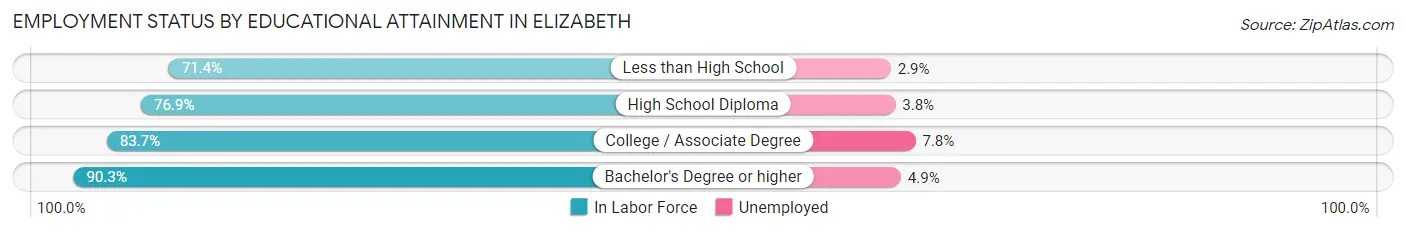
| Educational Attainment | In Labor Force | Unemployed |
| Less than High School | 11,699 (71.4%) | 475 (2.9%) |
| High School Diploma | 21,897 (76.9%) | 1,082 (3.8%) |
| College / Associate Degree | 14,269 (83.7%) | 1,330 (7.8%) |
| Bachelor's Degree or higher | 9,655 (90.3%) | 524 (4.9%) |
| Total | 57,498 (79.2%) | 3,485 (4.8%) |
Employment Occupations by Sex in Elizabeth
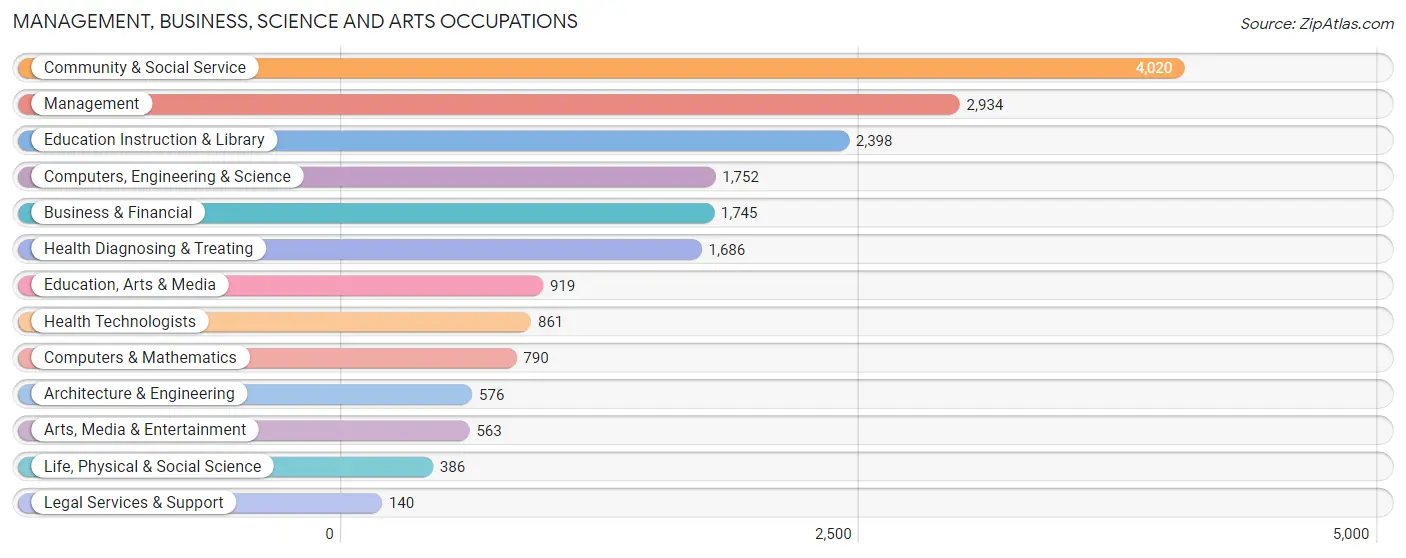
Management, Business, Science and Arts Occupations
The most common Management, Business, Science and Arts occupations in Elizabeth are Community & Social Service (4,020 | 6.2%), Management (2,934 | 4.5%), Education Instruction & Library (2,398 | 3.7%), Computers, Engineering & Science (1,752 | 2.7%), and Business & Financial (1,745 | 2.7%).
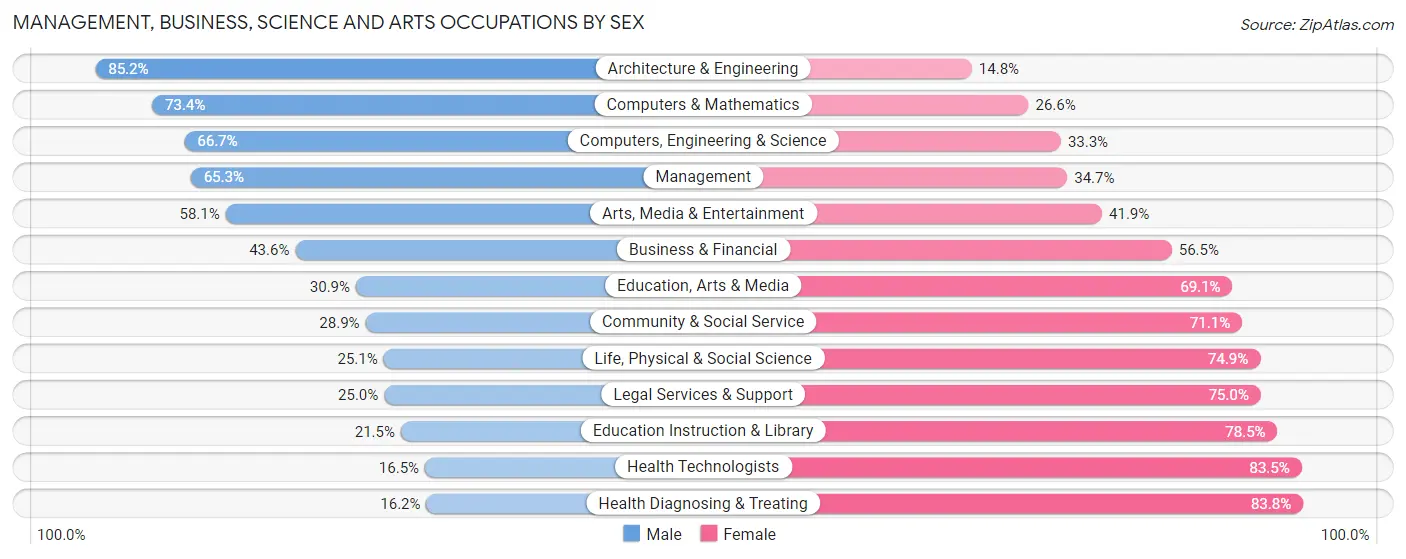
Management, Business, Science and Arts Occupations by Sex
Within the Management, Business, Science and Arts occupations in Elizabeth, the most male-oriented occupations are Architecture & Engineering (85.2%), Computers & Mathematics (73.4%), and Computers, Engineering & Science (66.7%), while the most female-oriented occupations are Health Diagnosing & Treating (83.8%), Health Technologists (83.5%), and Education Instruction & Library (78.5%).
| Occupation | Male | Female |
| Management | 1,917 (65.3%) | 1,017 (34.7%) |
| Business & Financial | 760 (43.5%) | 985 (56.5%) |
| Computers, Engineering & Science | 1,168 (66.7%) | 584 (33.3%) |
| Computers & Mathematics | 580 (73.4%) | 210 (26.6%) |
| Architecture & Engineering | 491 (85.2%) | 85 (14.8%) |
| Life, Physical & Social Science | 97 (25.1%) | 289 (74.9%) |
| Community & Social Service | 1,162 (28.9%) | 2,858 (71.1%) |
| Education, Arts & Media | 284 (30.9%) | 635 (69.1%) |
| Legal Services & Support | 35 (25.0%) | 105 (75.0%) |
| Education Instruction & Library | 516 (21.5%) | 1,882 (78.5%) |
| Arts, Media & Entertainment | 327 (58.1%) | 236 (41.9%) |
| Health Diagnosing & Treating | 273 (16.2%) | 1,413 (83.8%) |
| Health Technologists | 142 (16.5%) | 719 (83.5%) |
| Total (Category) | 5,280 (43.5%) | 6,857 (56.5%) |
| Total (Overall) | 36,797 (56.4%) | 28,486 (43.6%) |
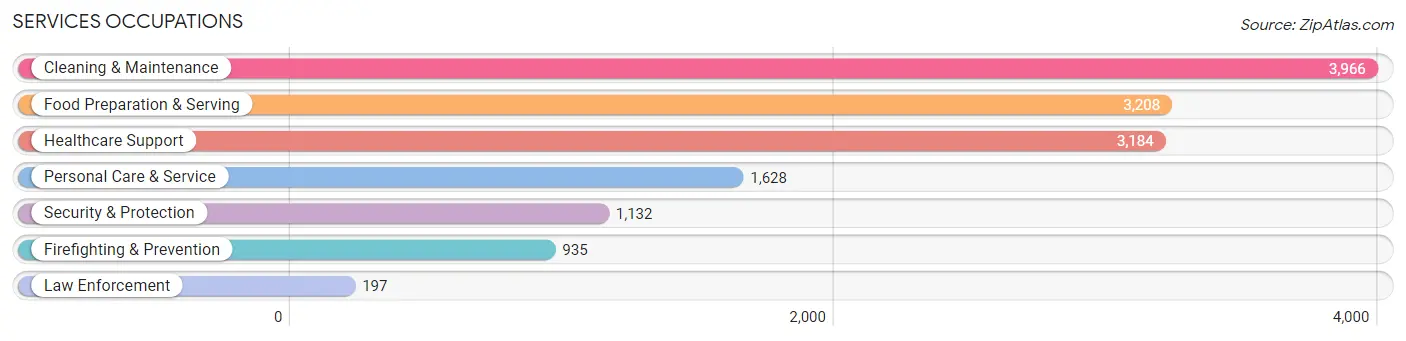
Services Occupations
The most common Services occupations in Elizabeth are Cleaning & Maintenance (3,966 | 6.1%), Food Preparation & Serving (3,208 | 4.9%), Healthcare Support (3,184 | 4.9%), Personal Care & Service (1,628 | 2.5%), and Security & Protection (1,132 | 1.7%).
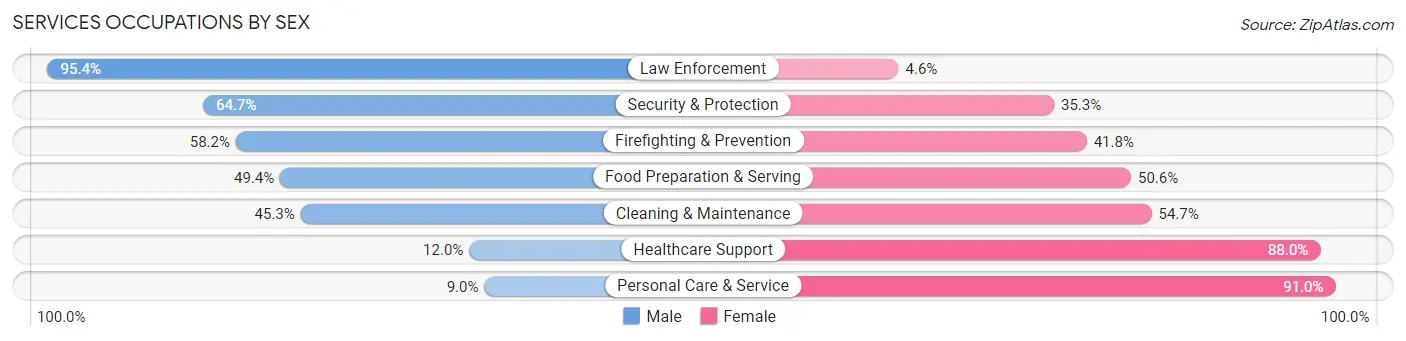
Services Occupations by Sex
Within the Services occupations in Elizabeth, the most male-oriented occupations are Law Enforcement (95.4%), Security & Protection (64.7%), and Firefighting & Prevention (58.2%), while the most female-oriented occupations are Personal Care & Service (91.0%), Healthcare Support (88.0%), and Cleaning & Maintenance (54.7%).
| Occupation | Male | Female |
| Healthcare Support | 381 (12.0%) | 2,803 (88.0%) |
| Security & Protection | 732 (64.7%) | 400 (35.3%) |
| Firefighting & Prevention | 544 (58.2%) | 391 (41.8%) |
| Law Enforcement | 188 (95.4%) | 9 (4.6%) |
| Food Preparation & Serving | 1,585 (49.4%) | 1,623 (50.6%) |
| Cleaning & Maintenance | 1,798 (45.3%) | 2,168 (54.7%) |
| Personal Care & Service | 146 (9.0%) | 1,482 (91.0%) |
| Total (Category) | 4,642 (35.4%) | 8,476 (64.6%) |
| Total (Overall) | 36,797 (56.4%) | 28,486 (43.6%) |
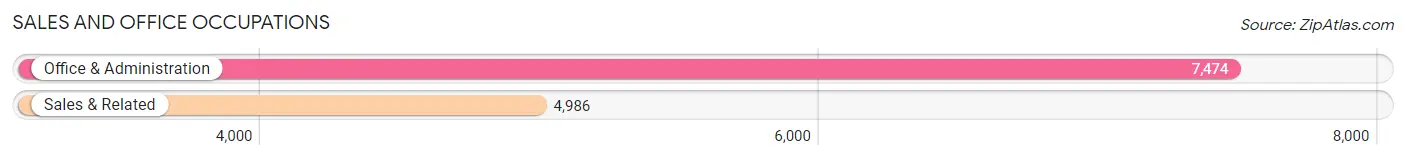
Sales and Office Occupations
The most common Sales and Office occupations in Elizabeth are Office & Administration (7,474 | 11.5%), and Sales & Related (4,986 | 7.6%).
Sales and Office Occupations by Sex
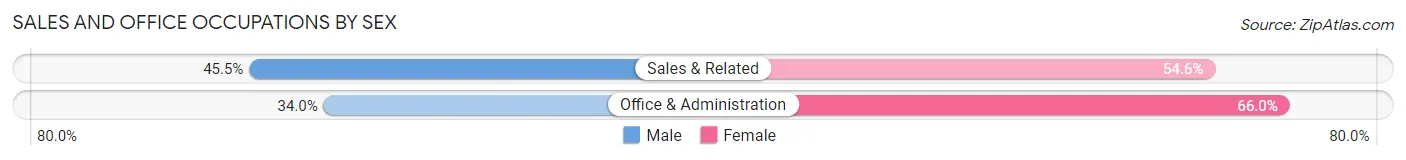
| Occupation | Male | Female |
| Sales & Related | 2,266 (45.5%) | 2,720 (54.5%) |
| Office & Administration | 2,542 (34.0%) | 4,932 (66.0%) |
| Total (Category) | 4,808 (38.6%) | 7,652 (61.4%) |
| Total (Overall) | 36,797 (56.4%) | 28,486 (43.6%) |
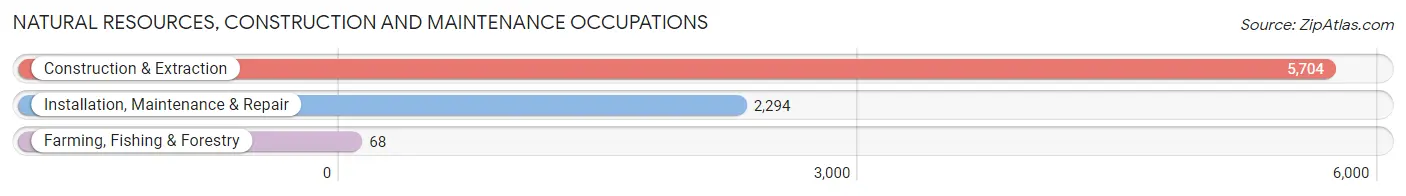
Natural Resources, Construction and Maintenance Occupations
The most common Natural Resources, Construction and Maintenance occupations in Elizabeth are Construction & Extraction (5,704 | 8.7%), Installation, Maintenance & Repair (2,294 | 3.5%), and Farming, Fishing & Forestry (68 | 0.1%).
Natural Resources, Construction and Maintenance Occupations by Sex
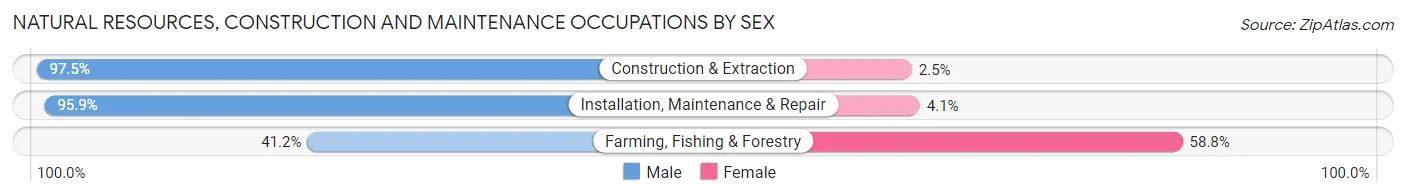
| Occupation | Male | Female |
| Farming, Fishing & Forestry | 28 (41.2%) | 40 (58.8%) |
| Construction & Extraction | 5,562 (97.5%) | 142 (2.5%) |
| Installation, Maintenance & Repair | 2,199 (95.9%) | 95 (4.1%) |
| Total (Category) | 7,789 (96.6%) | 277 (3.4%) |
| Total (Overall) | 36,797 (56.4%) | 28,486 (43.6%) |
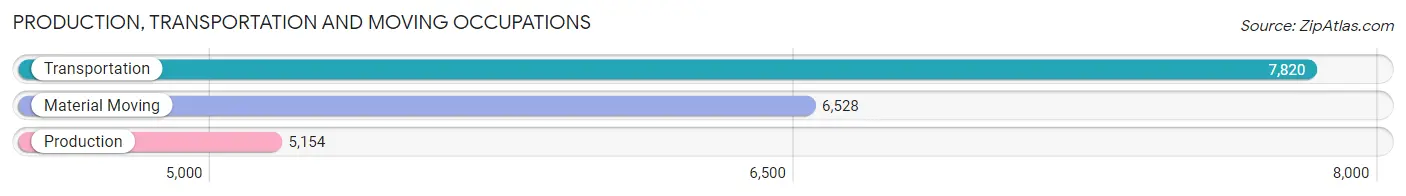
Production, Transportation and Moving Occupations
The most common Production, Transportation and Moving occupations in Elizabeth are Transportation (7,820 | 12.0%), Material Moving (6,528 | 10.0%), and Production (5,154 | 7.9%).
Production, Transportation and Moving Occupations by Sex
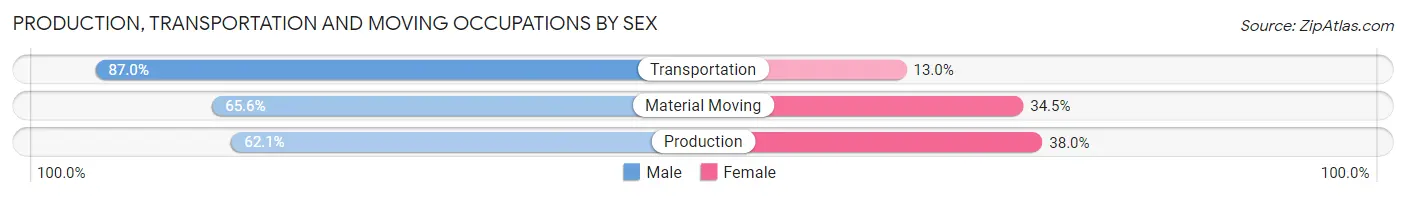
| Occupation | Male | Female |
| Production | 3,198 (62.1%) | 1,956 (38.0%) |
| Transportation | 6,801 (87.0%) | 1,019 (13.0%) |
| Material Moving | 4,279 (65.5%) | 2,249 (34.4%) |
| Total (Category) | 14,278 (73.2%) | 5,224 (26.8%) |
| Total (Overall) | 36,797 (56.4%) | 28,486 (43.6%) |
Employment Industries by Sex in Elizabeth
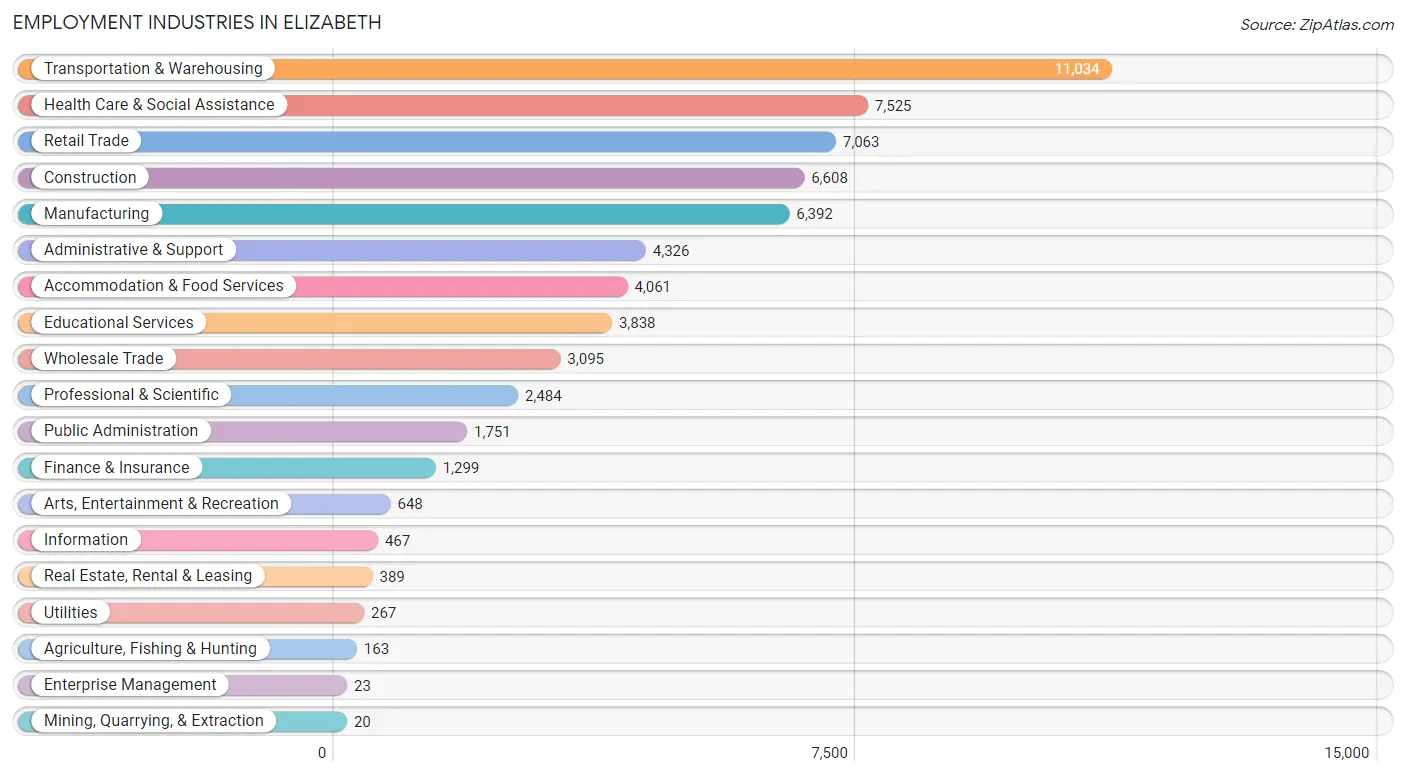
Employment Industries in Elizabeth
The major employment industries in Elizabeth include Transportation & Warehousing (11,034 | 16.9%), Health Care & Social Assistance (7,525 | 11.5%), Retail Trade (7,063 | 10.8%), Construction (6,608 | 10.1%), and Manufacturing (6,392 | 9.8%).
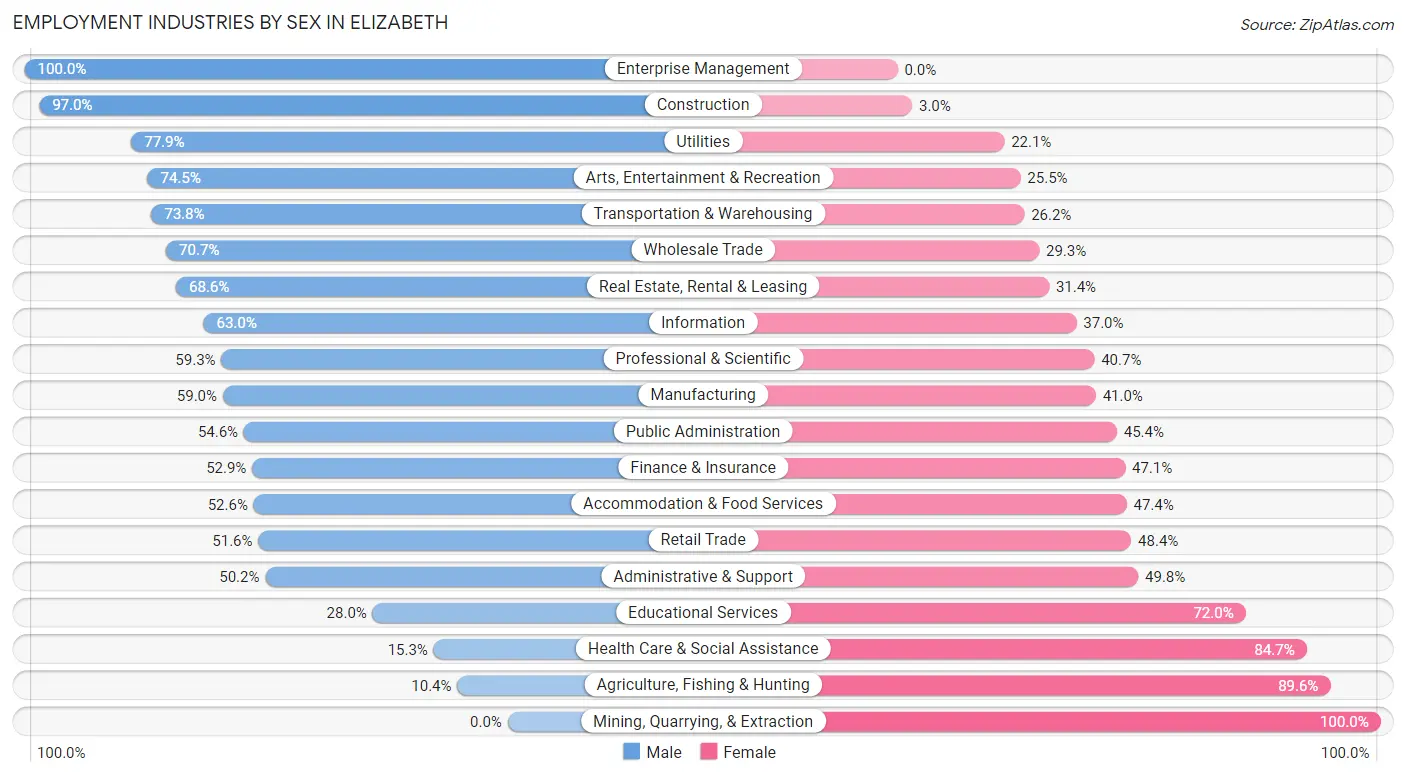
Employment Industries by Sex in Elizabeth
The Elizabeth industries that see more men than women are Enterprise Management (100.0%), Construction (97.0%), and Utilities (77.9%), whereas the industries that tend to have a higher number of women are Mining, Quarrying, & Extraction (100.0%), Agriculture, Fishing & Hunting (89.6%), and Health Care & Social Assistance (84.7%).
| Industry | Male | Female |
| Agriculture, Fishing & Hunting | 17 (10.4%) | 146 (89.6%) |
| Mining, Quarrying, & Extraction | 0 (0.0%) | 20 (100.0%) |
| Construction | 6,408 (97.0%) | 200 (3.0%) |
| Manufacturing | 3,769 (59.0%) | 2,623 (41.0%) |
| Wholesale Trade | 2,188 (70.7%) | 907 (29.3%) |
| Retail Trade | 3,646 (51.6%) | 3,417 (48.4%) |
| Transportation & Warehousing | 8,139 (73.8%) | 2,895 (26.2%) |
| Utilities | 208 (77.9%) | 59 (22.1%) |
| Information | 294 (63.0%) | 173 (37.0%) |
| Finance & Insurance | 687 (52.9%) | 612 (47.1%) |
| Real Estate, Rental & Leasing | 267 (68.6%) | 122 (31.4%) |
| Professional & Scientific | 1,472 (59.3%) | 1,012 (40.7%) |
| Enterprise Management | 23 (100.0%) | 0 (0.0%) |
| Administrative & Support | 2,171 (50.2%) | 2,155 (49.8%) |
| Educational Services | 1,073 (28.0%) | 2,765 (72.0%) |
| Health Care & Social Assistance | 1,153 (15.3%) | 6,372 (84.7%) |
| Arts, Entertainment & Recreation | 483 (74.5%) | 165 (25.5%) |
| Accommodation & Food Services | 2,135 (52.6%) | 1,926 (47.4%) |
| Public Administration | 956 (54.6%) | 795 (45.4%) |
| Total | 36,797 (56.4%) | 28,486 (43.6%) |
Education in Elizabeth
School Enrollment in Elizabeth
The most common levels of schooling among the 34,687 students in Elizabeth are middle school (7,945 | 22.9%), high school (6,891 | 19.9%), and elementary school (6,840 | 19.7%).
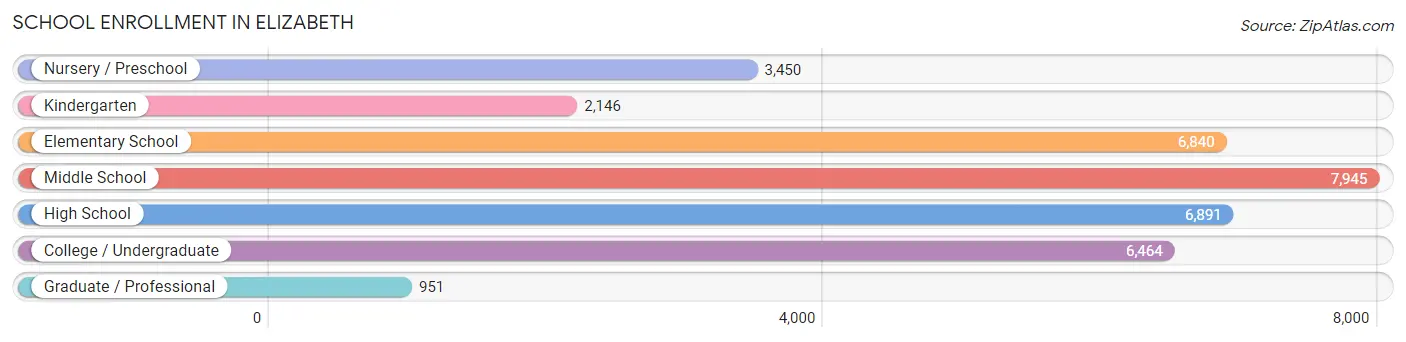
| School Level | # Students | % Students |
| Nursery / Preschool | 3,450 | 10.0% |
| Kindergarten | 2,146 | 6.2% |
| Elementary School | 6,840 | 19.7% |
| Middle School | 7,945 | 22.9% |
| High School | 6,891 | 19.9% |
| College / Undergraduate | 6,464 | 18.6% |
| Graduate / Professional | 951 | 2.7% |
| Total | 34,687 | 100.0% |
School Enrollment by Age by Funding Source in Elizabeth
Out of a total of 34,687 students who are enrolled in schools in Elizabeth, 2,810 (8.1%) attend a private institution, while the remaining 31,877 (91.9%) are enrolled in public schools. The age group of 35 years and over has the highest likelihood of being enrolled in private schools, with 567 (46.9% in the age bracket) enrolled. Conversely, the age group of 10 to 14 year olds has the lowest likelihood of being enrolled in a private school, with 8,968 (98.0% in the age bracket) attending a public institution.
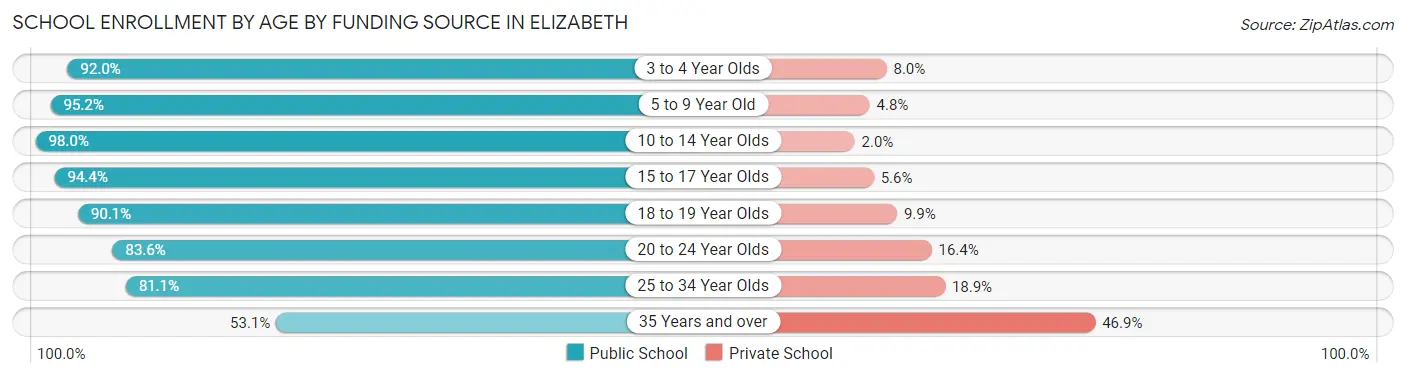
| Age Bracket | Public School | Private School |
| 3 to 4 Year Olds | 2,778 (92.0%) | 241 (8.0%) |
| 5 to 9 Year Old | 8,450 (95.2%) | 429 (4.8%) |
| 10 to 14 Year Olds | 8,968 (98.0%) | 186 (2.0%) |
| 15 to 17 Year Olds | 4,579 (94.4%) | 271 (5.6%) |
| 18 to 19 Year Olds | 2,412 (90.1%) | 266 (9.9%) |
| 20 to 24 Year Olds | 2,730 (83.6%) | 534 (16.4%) |
| 25 to 34 Year Olds | 1,325 (81.1%) | 308 (18.9%) |
| 35 Years and over | 643 (53.1%) | 567 (46.9%) |
| Total | 31,877 (91.9%) | 2,810 (8.1%) |
Educational Attainment by Field of Study in Elizabeth
Business (3,375 | 25.5%), education (1,430 | 10.8%), engineering (1,218 | 9.2%), science & technology (1,155 | 8.7%), and social sciences (891 | 6.7%) are the most common fields of study among 13,228 individuals in Elizabeth who have obtained a bachelor's degree or higher.
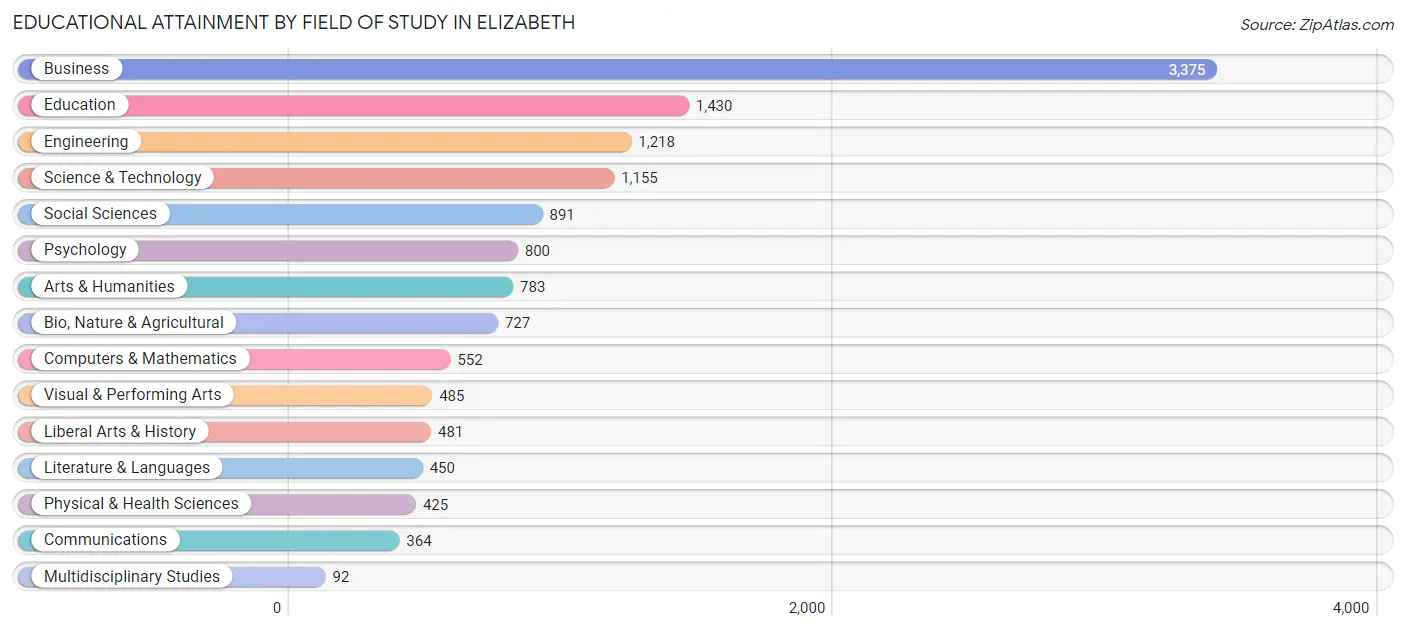
| Field of Study | # Graduates | % Graduates |
| Computers & Mathematics | 552 | 4.2% |
| Bio, Nature & Agricultural | 727 | 5.5% |
| Physical & Health Sciences | 425 | 3.2% |
| Psychology | 800 | 6.0% |
| Social Sciences | 891 | 6.7% |
| Engineering | 1,218 | 9.2% |
| Multidisciplinary Studies | 92 | 0.7% |
| Science & Technology | 1,155 | 8.7% |
| Business | 3,375 | 25.5% |
| Education | 1,430 | 10.8% |
| Literature & Languages | 450 | 3.4% |
| Liberal Arts & History | 481 | 3.6% |
| Visual & Performing Arts | 485 | 3.7% |
| Communications | 364 | 2.8% |
| Arts & Humanities | 783 | 5.9% |
| Total | 13,228 | 100.0% |
Transportation & Commute in Elizabeth
Vehicle Availability by Sex in Elizabeth
The most prevalent vehicle ownership categories in Elizabeth are males with 2 vehicles (12,380, accounting for 34.8%) and females with 2 vehicles (9,138, making up 45.5%).
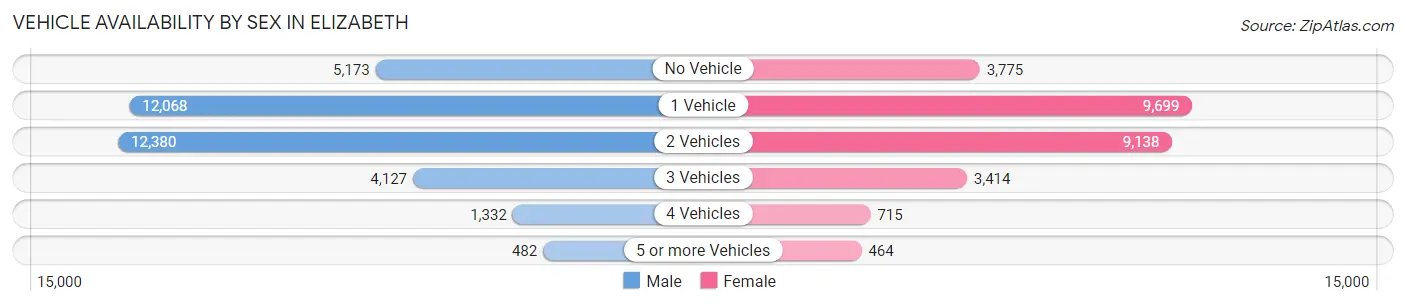
| Vehicles Available | Male | Female |
| No Vehicle | 5,173 (14.5%) | 3,775 (13.9%) |
| 1 Vehicle | 12,068 (33.9%) | 9,699 (35.6%) |
| 2 Vehicles | 12,380 (34.8%) | 9,138 (33.6%) |
| 3 Vehicles | 4,127 (11.6%) | 3,414 (12.6%) |
| 4 Vehicles | 1,332 (3.7%) | 715 (2.6%) |
| 5 or more Vehicles | 482 (1.4%) | 464 (1.7%) |
| Total | 35,562 (100.0%) | 27,205 (100.0%) |
Commute Time in Elizabeth
The most frequently occuring commute durations in Elizabeth are 10 to 14 minutes (10,961 commuters, 18.3%), 15 to 19 minutes (9,827 commuters, 16.4%), and 20 to 24 minutes (8,218 commuters, 13.7%).
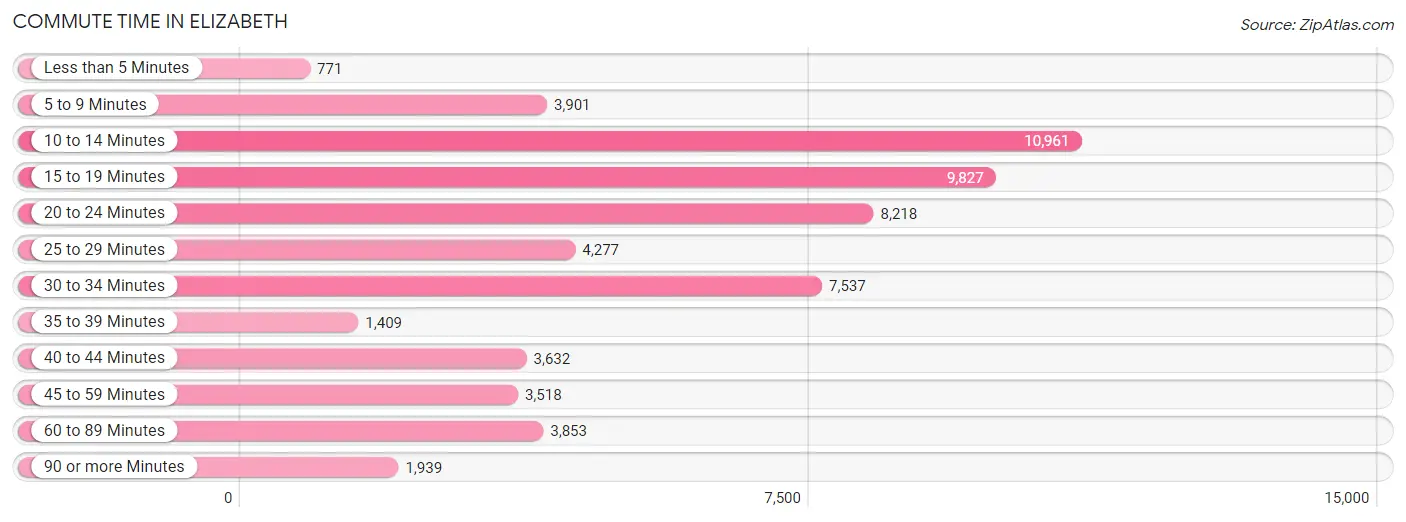
| Commute Time | # Commuters | % Commuters |
| Less than 5 Minutes | 771 | 1.3% |
| 5 to 9 Minutes | 3,901 | 6.5% |
| 10 to 14 Minutes | 10,961 | 18.3% |
| 15 to 19 Minutes | 9,827 | 16.4% |
| 20 to 24 Minutes | 8,218 | 13.7% |
| 25 to 29 Minutes | 4,277 | 7.1% |
| 30 to 34 Minutes | 7,537 | 12.6% |
| 35 to 39 Minutes | 1,409 | 2.4% |
| 40 to 44 Minutes | 3,632 | 6.1% |
| 45 to 59 Minutes | 3,518 | 5.9% |
| 60 to 89 Minutes | 3,853 | 6.4% |
| 90 or more Minutes | 1,939 | 3.2% |
Commute Time by Sex in Elizabeth
The most common commute times in Elizabeth are 10 to 14 minutes (5,923 commuters, 17.3%) for males and 10 to 14 minutes (5,038 commuters, 19.7%) for females.
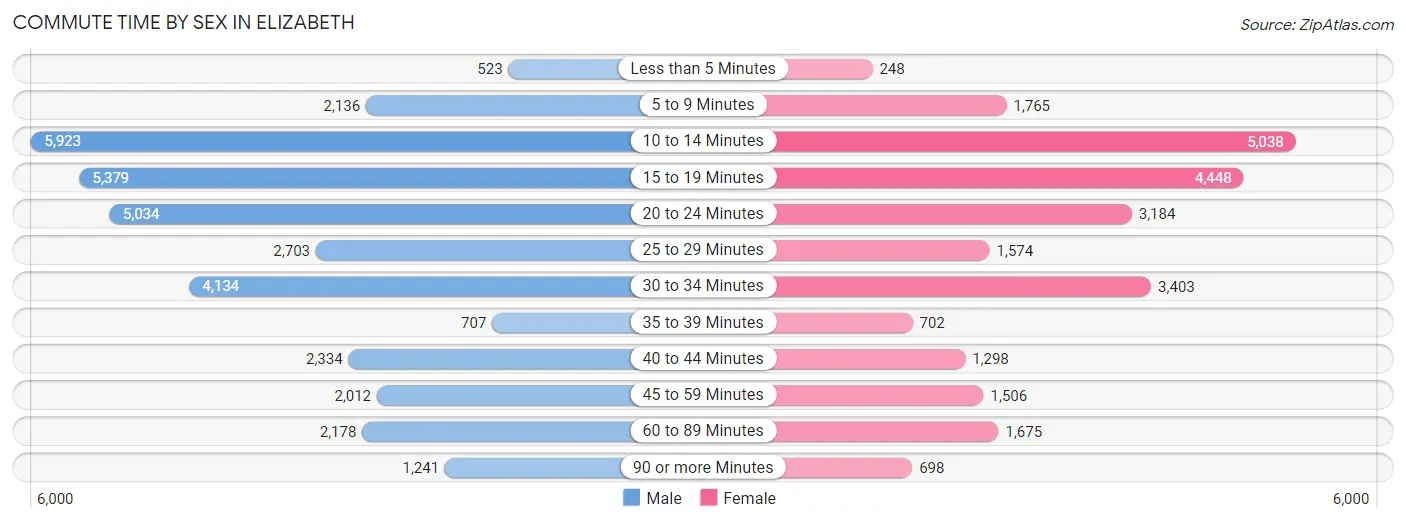
| Commute Time | Male | Female |
| Less than 5 Minutes | 523 (1.5%) | 248 (1.0%) |
| 5 to 9 Minutes | 2,136 (6.2%) | 1,765 (6.9%) |
| 10 to 14 Minutes | 5,923 (17.3%) | 5,038 (19.7%) |
| 15 to 19 Minutes | 5,379 (15.7%) | 4,448 (17.4%) |
| 20 to 24 Minutes | 5,034 (14.7%) | 3,184 (12.5%) |
| 25 to 29 Minutes | 2,703 (7.9%) | 1,574 (6.2%) |
| 30 to 34 Minutes | 4,134 (12.0%) | 3,403 (13.3%) |
| 35 to 39 Minutes | 707 (2.1%) | 702 (2.8%) |
| 40 to 44 Minutes | 2,334 (6.8%) | 1,298 (5.1%) |
| 45 to 59 Minutes | 2,012 (5.9%) | 1,506 (5.9%) |
| 60 to 89 Minutes | 2,178 (6.4%) | 1,675 (6.6%) |
| 90 or more Minutes | 1,241 (3.6%) | 698 (2.7%) |
Time of Departure to Work by Sex in Elizabeth
The most frequent times of departure to work in Elizabeth are 6:00 AM to 6:29 AM (6,191, 18.0%) for males and 7:00 AM to 7:29 AM (4,075, 16.0%) for females.
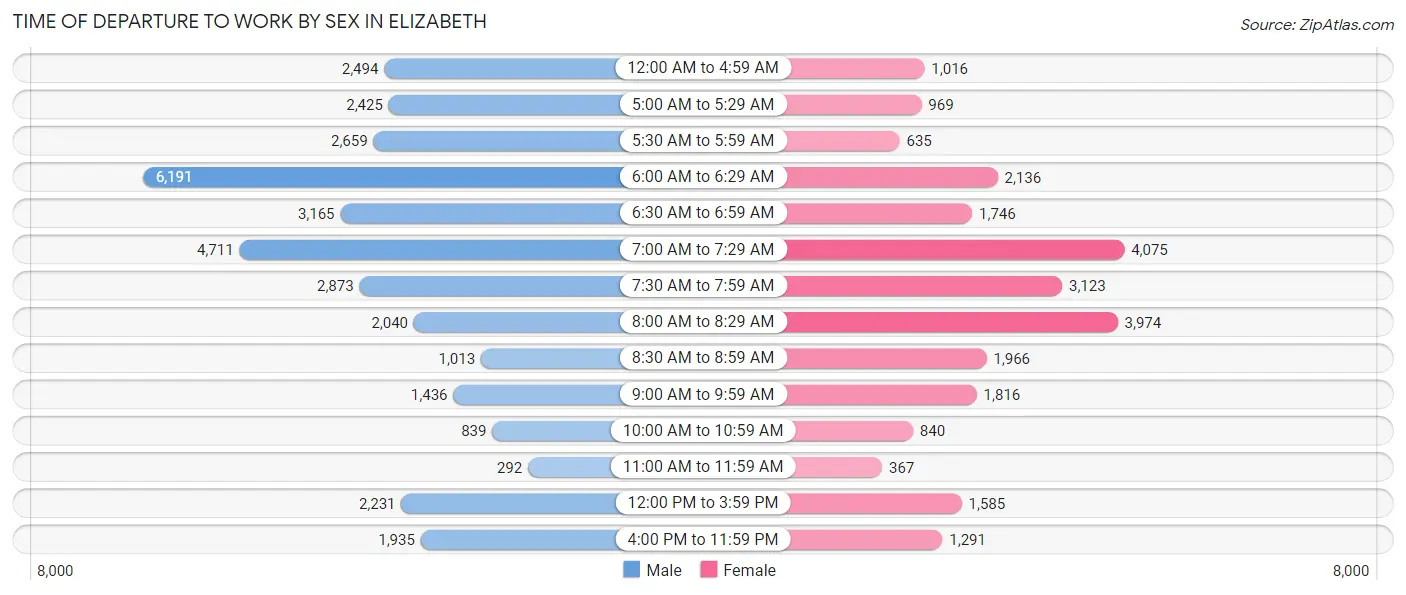
| Time of Departure | Male | Female |
| 12:00 AM to 4:59 AM | 2,494 (7.3%) | 1,016 (4.0%) |
| 5:00 AM to 5:29 AM | 2,425 (7.1%) | 969 (3.8%) |
| 5:30 AM to 5:59 AM | 2,659 (7.7%) | 635 (2.5%) |
| 6:00 AM to 6:29 AM | 6,191 (18.0%) | 2,136 (8.4%) |
| 6:30 AM to 6:59 AM | 3,165 (9.2%) | 1,746 (6.8%) |
| 7:00 AM to 7:29 AM | 4,711 (13.7%) | 4,075 (16.0%) |
| 7:30 AM to 7:59 AM | 2,873 (8.4%) | 3,123 (12.2%) |
| 8:00 AM to 8:29 AM | 2,040 (5.9%) | 3,974 (15.6%) |
| 8:30 AM to 8:59 AM | 1,013 (2.9%) | 1,966 (7.7%) |
| 9:00 AM to 9:59 AM | 1,436 (4.2%) | 1,816 (7.1%) |
| 10:00 AM to 10:59 AM | 839 (2.5%) | 840 (3.3%) |
| 11:00 AM to 11:59 AM | 292 (0.9%) | 367 (1.4%) |
| 12:00 PM to 3:59 PM | 2,231 (6.5%) | 1,585 (6.2%) |
| 4:00 PM to 11:59 PM | 1,935 (5.6%) | 1,291 (5.1%) |
| Total | 34,304 (100.0%) | 25,539 (100.0%) |
Housing Occupancy in Elizabeth
Occupancy by Ownership in Elizabeth
Of the total 45,488 dwellings in Elizabeth, owner-occupied units account for 11,439 (25.2%), while renter-occupied units make up 34,049 (74.9%).
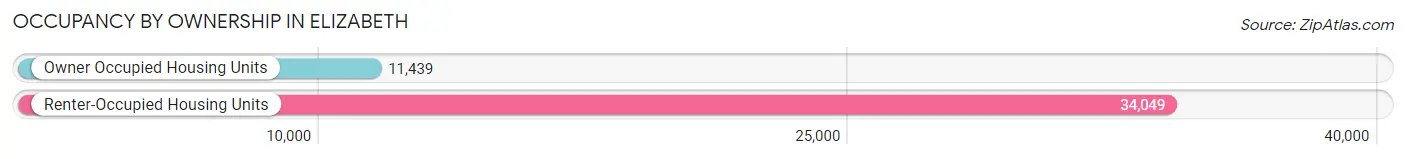
| Occupancy | # Housing Units | % Housing Units |
| Owner Occupied Housing Units | 11,439 | 25.2% |
| Renter-Occupied Housing Units | 34,049 | 74.9% |
| Total Occupied Housing Units | 45,488 | 100.0% |
Occupancy by Household Size in Elizabeth
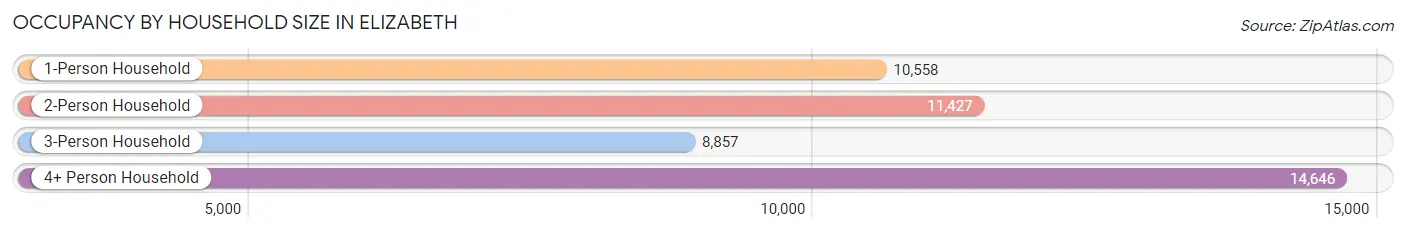
| Household Size | # Housing Units | % Housing Units |
| 1-Person Household | 10,558 | 23.2% |
| 2-Person Household | 11,427 | 25.1% |
| 3-Person Household | 8,857 | 19.5% |
| 4+ Person Household | 14,646 | 32.2% |
| Total Housing Units | 45,488 | 100.0% |
Occupancy by Ownership by Household Size in Elizabeth
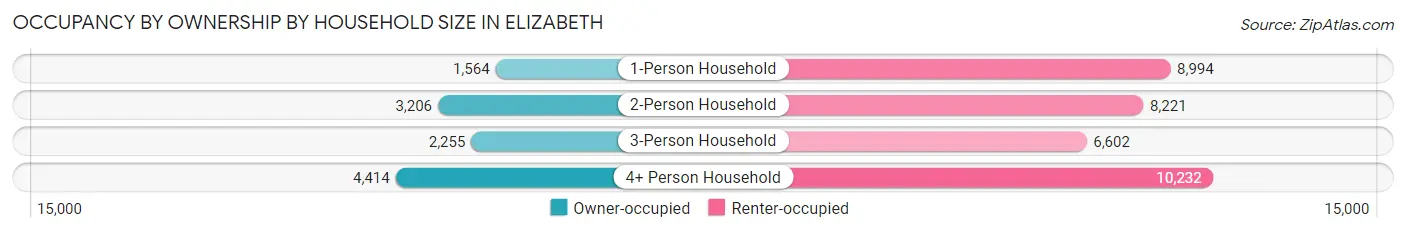
| Household Size | Owner-occupied | Renter-occupied |
| 1-Person Household | 1,564 (14.8%) | 8,994 (85.2%) |
| 2-Person Household | 3,206 (28.1%) | 8,221 (71.9%) |
| 3-Person Household | 2,255 (25.5%) | 6,602 (74.5%) |
| 4+ Person Household | 4,414 (30.1%) | 10,232 (69.9%) |
| Total Housing Units | 11,439 (25.2%) | 34,049 (74.9%) |
Occupancy by Educational Attainment in Elizabeth
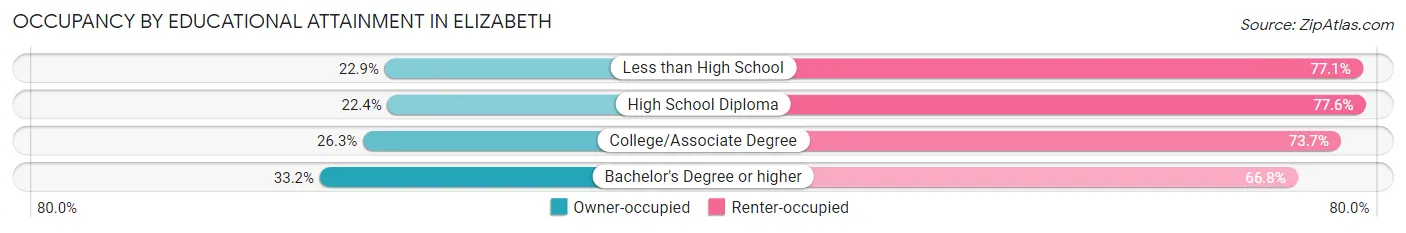
| Household Size | Owner-occupied | Renter-occupied |
| Less than High School | 2,414 (22.9%) | 8,140 (77.1%) |
| High School Diploma | 3,779 (22.4%) | 13,070 (77.6%) |
| College/Associate Degree | 2,880 (26.3%) | 8,072 (73.7%) |
| Bachelor's Degree or higher | 2,366 (33.2%) | 4,767 (66.8%) |
Occupancy by Age of Householder in Elizabeth
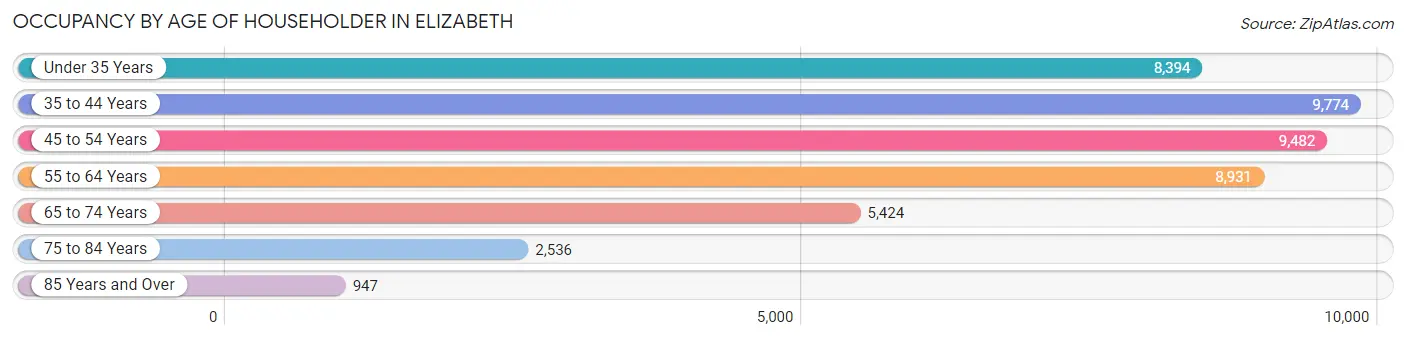
| Age Bracket | # Households | % Households |
| Under 35 Years | 8,394 | 18.4% |
| 35 to 44 Years | 9,774 | 21.5% |
| 45 to 54 Years | 9,482 | 20.8% |
| 55 to 64 Years | 8,931 | 19.6% |
| 65 to 74 Years | 5,424 | 11.9% |
| 75 to 84 Years | 2,536 | 5.6% |
| 85 Years and Over | 947 | 2.1% |
| Total | 45,488 | 100.0% |
Housing Finances in Elizabeth
Median Income by Occupancy in Elizabeth
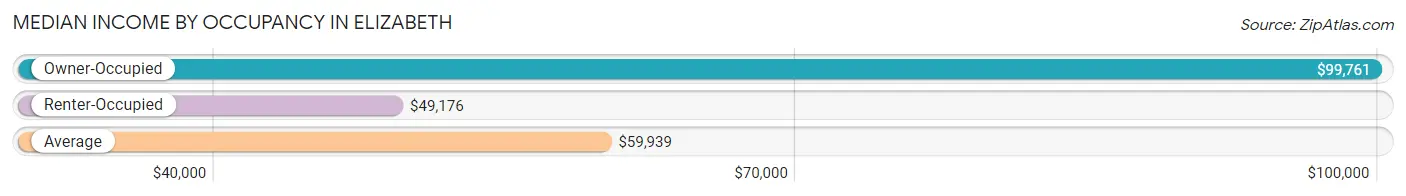
| Occupancy Type | # Households | Median Income |
| Owner-Occupied | 11,439 (25.2%) | $99,761 |
| Renter-Occupied | 34,049 (74.9%) | $49,176 |
| Average | 45,488 (100.0%) | $59,939 |
Occupancy by Householder Income Bracket in Elizabeth
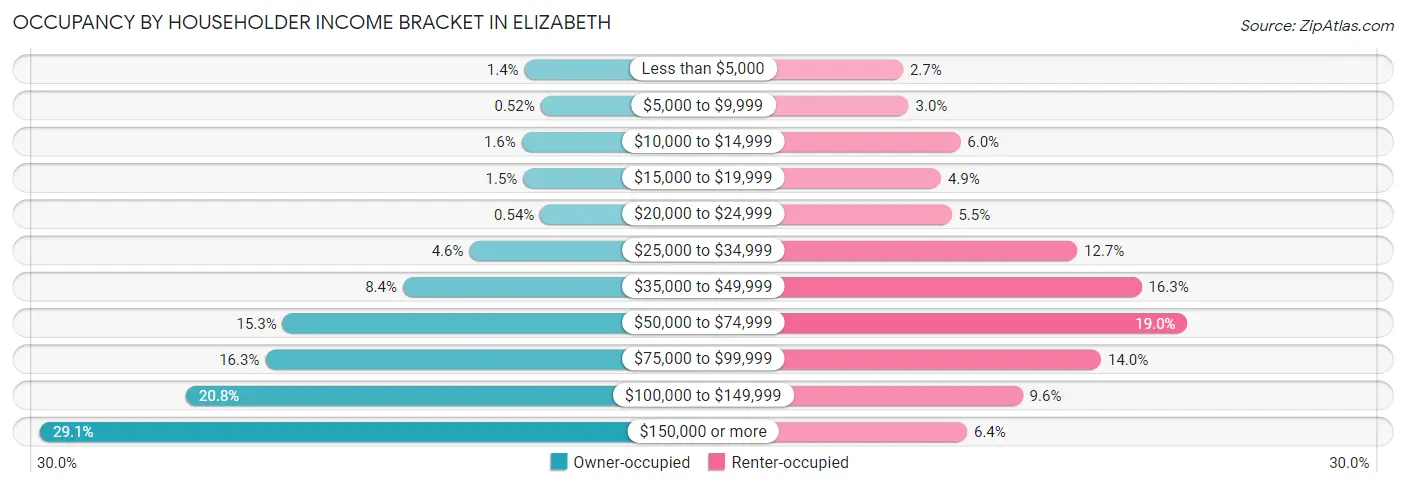
| Income Bracket | Owner-occupied | Renter-occupied |
| Less than $5,000 | 165 (1.4%) | 923 (2.7%) |
| $5,000 to $9,999 | 59 (0.5%) | 1,031 (3.0%) |
| $10,000 to $14,999 | 183 (1.6%) | 2,040 (6.0%) |
| $15,000 to $19,999 | 173 (1.5%) | 1,663 (4.9%) |
| $20,000 to $24,999 | 62 (0.5%) | 1,867 (5.5%) |
| $25,000 to $34,999 | 525 (4.6%) | 4,311 (12.7%) |
| $35,000 to $49,999 | 960 (8.4%) | 5,563 (16.3%) |
| $50,000 to $74,999 | 1,746 (15.3%) | 6,455 (19.0%) |
| $75,000 to $99,999 | 1,859 (16.3%) | 4,776 (14.0%) |
| $100,000 to $149,999 | 2,377 (20.8%) | 3,251 (9.6%) |
| $150,000 or more | 3,330 (29.1%) | 2,169 (6.4%) |
| Total | 11,439 (100.0%) | 34,049 (100.0%) |
Monthly Housing Cost Tiers in Elizabeth
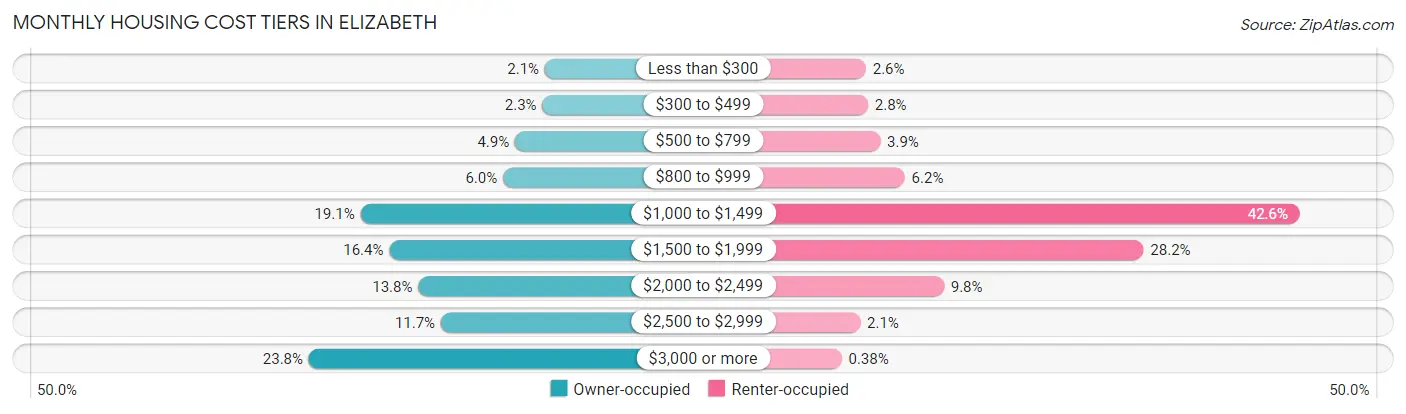
| Monthly Cost | Owner-occupied | Renter-occupied |
| Less than $300 | 240 (2.1%) | 888 (2.6%) |
| $300 to $499 | 267 (2.3%) | 955 (2.8%) |
| $500 to $799 | 555 (4.9%) | 1,338 (3.9%) |
| $800 to $999 | 681 (5.9%) | 2,109 (6.2%) |
| $1,000 to $1,499 | 2,182 (19.1%) | 14,490 (42.6%) |
| $1,500 to $1,999 | 1,879 (16.4%) | 9,593 (28.2%) |
| $2,000 to $2,499 | 1,574 (13.8%) | 3,333 (9.8%) |
| $2,500 to $2,999 | 1,335 (11.7%) | 711 (2.1%) |
| $3,000 or more | 2,726 (23.8%) | 129 (0.4%) |
| Total | 11,439 (100.0%) | 34,049 (100.0%) |
Physical Housing Characteristics in Elizabeth
Housing Structures in Elizabeth
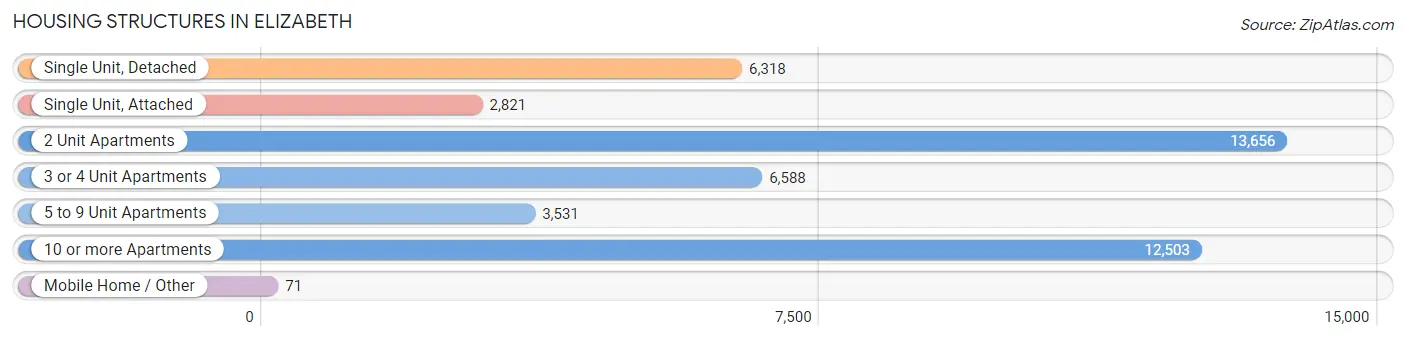
| Structure Type | # Housing Units | % Housing Units |
| Single Unit, Detached | 6,318 | 13.9% |
| Single Unit, Attached | 2,821 | 6.2% |
| 2 Unit Apartments | 13,656 | 30.0% |
| 3 or 4 Unit Apartments | 6,588 | 14.5% |
| 5 to 9 Unit Apartments | 3,531 | 7.8% |
| 10 or more Apartments | 12,503 | 27.5% |
| Mobile Home / Other | 71 | 0.2% |
| Total | 45,488 | 100.0% |
Housing Structures by Occupancy in Elizabeth
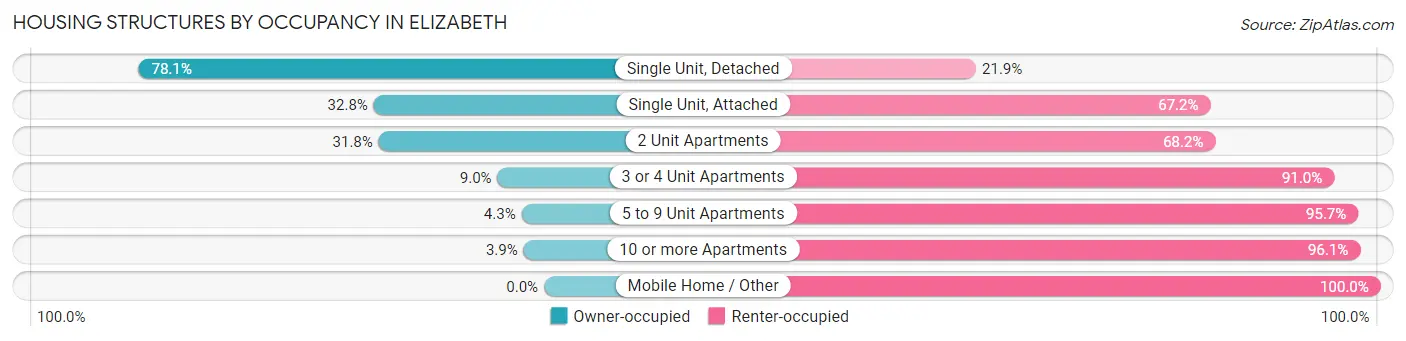
| Structure Type | Owner-occupied | Renter-occupied |
| Single Unit, Detached | 4,932 (78.1%) | 1,386 (21.9%) |
| Single Unit, Attached | 925 (32.8%) | 1,896 (67.2%) |
| 2 Unit Apartments | 4,348 (31.8%) | 9,308 (68.2%) |
| 3 or 4 Unit Apartments | 590 (9.0%) | 5,998 (91.0%) |
| 5 to 9 Unit Apartments | 153 (4.3%) | 3,378 (95.7%) |
| 10 or more Apartments | 491 (3.9%) | 12,012 (96.1%) |
| Mobile Home / Other | 0 (0.0%) | 71 (100.0%) |
| Total | 11,439 (25.2%) | 34,049 (74.9%) |
Housing Structures by Number of Rooms in Elizabeth
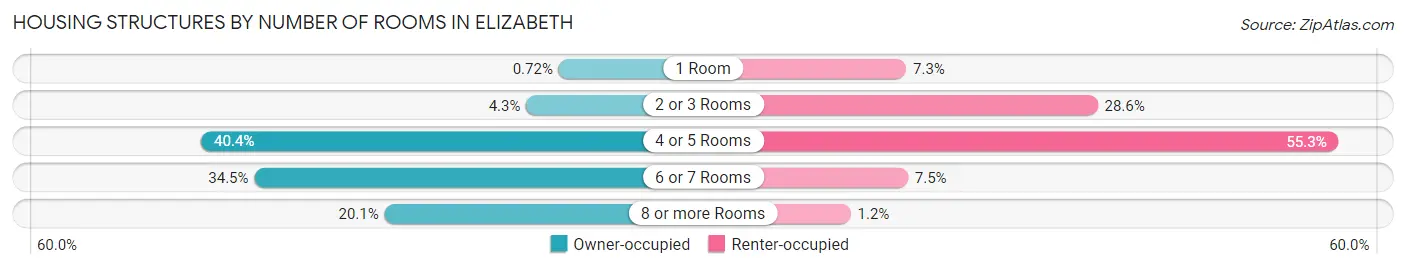
| Number of Rooms | Owner-occupied | Renter-occupied |
| 1 Room | 82 (0.7%) | 2,500 (7.3%) |
| 2 or 3 Rooms | 494 (4.3%) | 9,736 (28.6%) |
| 4 or 5 Rooms | 4,622 (40.4%) | 18,841 (55.3%) |
| 6 or 7 Rooms | 3,947 (34.5%) | 2,567 (7.5%) |
| 8 or more Rooms | 2,294 (20.1%) | 405 (1.2%) |
| Total | 11,439 (100.0%) | 34,049 (100.0%) |
Housing Structure by Heating Type in Elizabeth
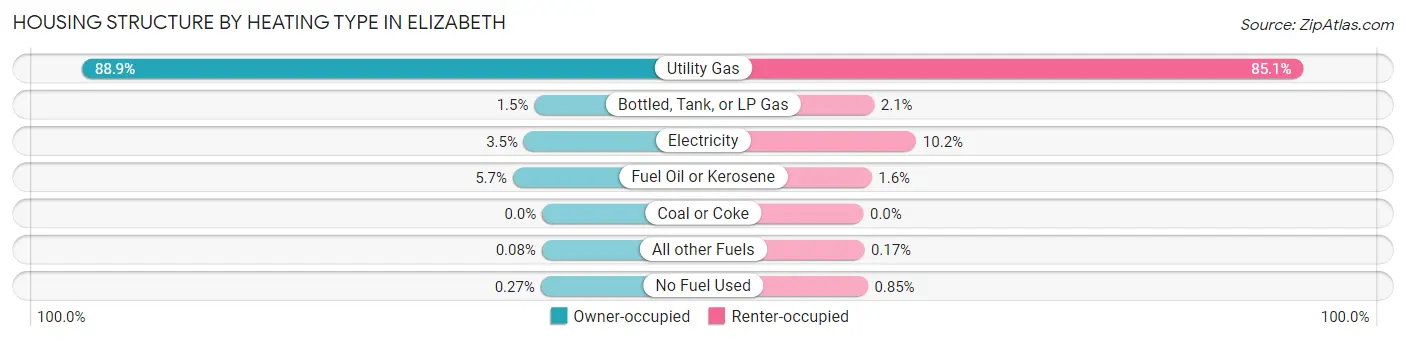
| Heating Type | Owner-occupied | Renter-occupied |
| Utility Gas | 10,173 (88.9%) | 28,961 (85.1%) |
| Bottled, Tank, or LP Gas | 173 (1.5%) | 713 (2.1%) |
| Electricity | 405 (3.5%) | 3,478 (10.2%) |
| Fuel Oil or Kerosene | 648 (5.7%) | 548 (1.6%) |
| Coal or Coke | 0 (0.0%) | 0 (0.0%) |
| All other Fuels | 9 (0.1%) | 59 (0.2%) |
| No Fuel Used | 31 (0.3%) | 290 (0.9%) |
| Total | 11,439 (100.0%) | 34,049 (100.0%) |
Household Vehicle Usage in Elizabeth
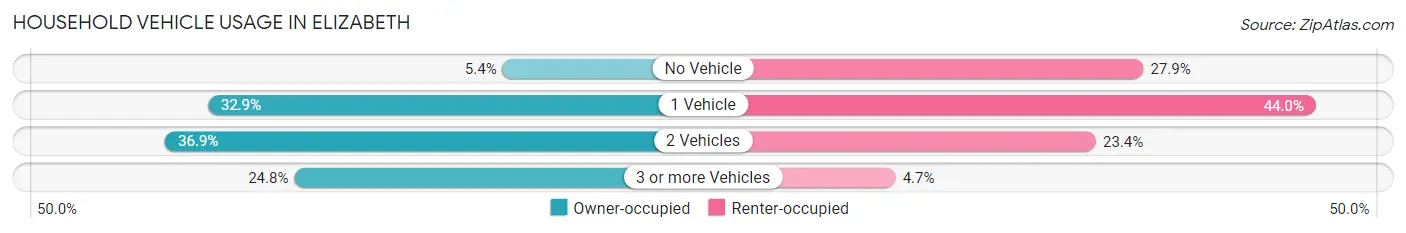
| Vehicles per Household | Owner-occupied | Renter-occupied |
| No Vehicle | 617 (5.4%) | 9,489 (27.9%) |
| 1 Vehicle | 3,763 (32.9%) | 14,966 (44.0%) |
| 2 Vehicles | 4,219 (36.9%) | 7,981 (23.4%) |
| 3 or more Vehicles | 2,840 (24.8%) | 1,613 (4.7%) |
| Total | 11,439 (100.0%) | 34,049 (100.0%) |
Real Estate & Mortgages in Elizabeth
Real Estate and Mortgage Overview in Elizabeth
| Characteristic | Without Mortgage | With Mortgage |
| Housing Units | 4,785 | 6,654 |
| Median Property Value | $334,800 | $375,100 |
| Median Household Income | $84,278 | $2,082 |
| Monthly Housing Costs | $1,300 | $2,726 |
| Real Estate Taxes | $10,001 | $199 |
Property Value by Mortgage Status in Elizabeth
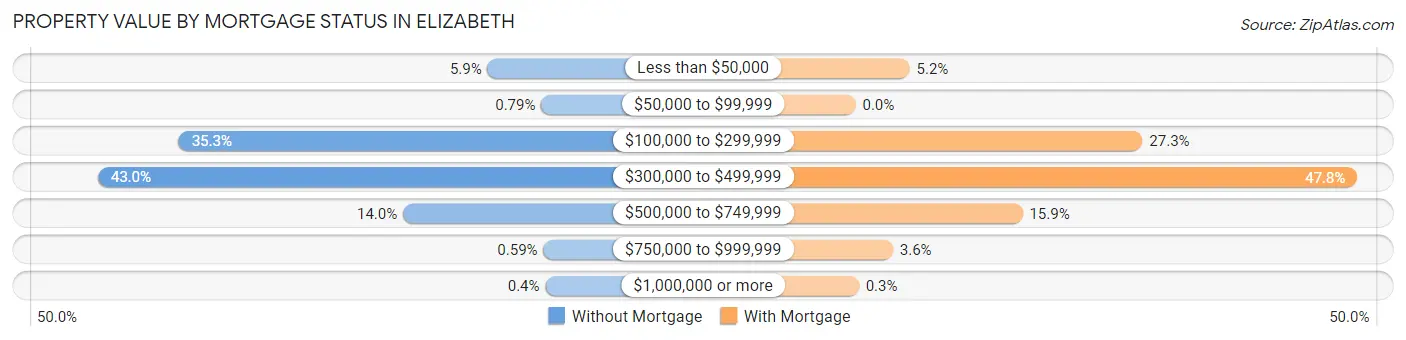
| Property Value | Without Mortgage | With Mortgage |
| Less than $50,000 | 283 (5.9%) | 343 (5.1%) |
| $50,000 to $99,999 | 38 (0.8%) | 0 (0.0%) |
| $100,000 to $299,999 | 1,690 (35.3%) | 1,818 (27.3%) |
| $300,000 to $499,999 | 2,059 (43.0%) | 3,179 (47.8%) |
| $500,000 to $749,999 | 668 (14.0%) | 1,058 (15.9%) |
| $750,000 to $999,999 | 28 (0.6%) | 236 (3.5%) |
| $1,000,000 or more | 19 (0.4%) | 20 (0.3%) |
| Total | 4,785 (100.0%) | 6,654 (100.0%) |
Household Income by Mortgage Status in Elizabeth
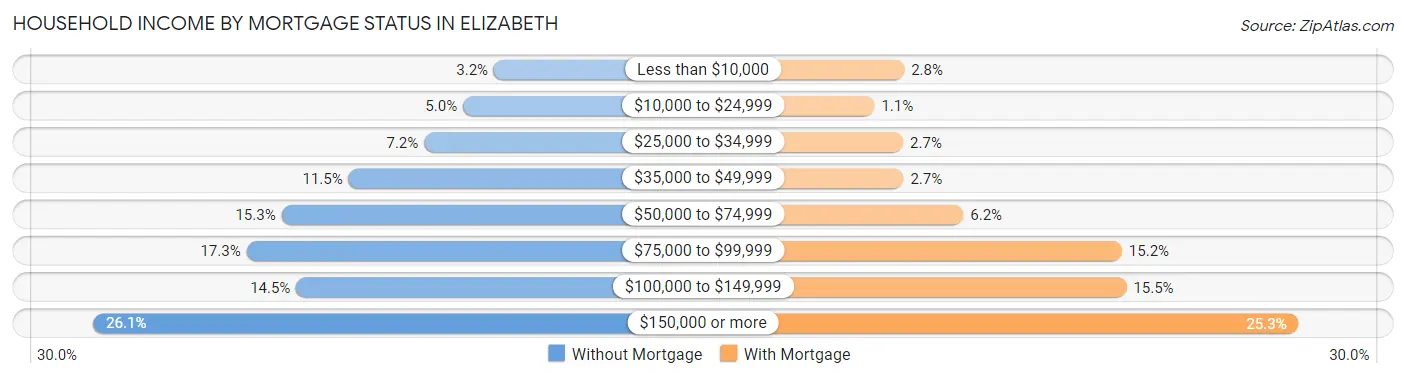
| Household Income | Without Mortgage | With Mortgage |
| Less than $10,000 | 152 (3.2%) | 185 (2.8%) |
| $10,000 to $24,999 | 237 (5.0%) | 72 (1.1%) |
| $25,000 to $34,999 | 343 (7.2%) | 181 (2.7%) |
| $35,000 to $49,999 | 550 (11.5%) | 182 (2.7%) |
| $50,000 to $74,999 | 733 (15.3%) | 410 (6.2%) |
| $75,000 to $99,999 | 829 (17.3%) | 1,013 (15.2%) |
| $100,000 to $149,999 | 693 (14.5%) | 1,030 (15.5%) |
| $150,000 or more | 1,248 (26.1%) | 1,684 (25.3%) |
| Total | 4,785 (100.0%) | 6,654 (100.0%) |
Property Value to Household Income Ratio in Elizabeth
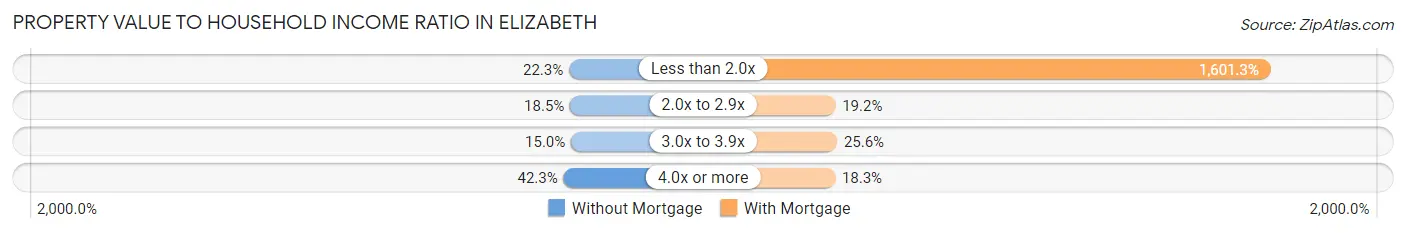
| Value-to-Income Ratio | Without Mortgage | With Mortgage |
| Less than 2.0x | 1,068 (22.3%) | 106,548 (1,601.3%) |
| 2.0x to 2.9x | 883 (18.4%) | 1,280 (19.2%) |
| 3.0x to 3.9x | 716 (15.0%) | 1,701 (25.6%) |
| 4.0x or more | 2,024 (42.3%) | 1,217 (18.3%) |
| Total | 4,785 (100.0%) | 6,654 (100.0%) |
Real Estate Taxes by Mortgage Status in Elizabeth
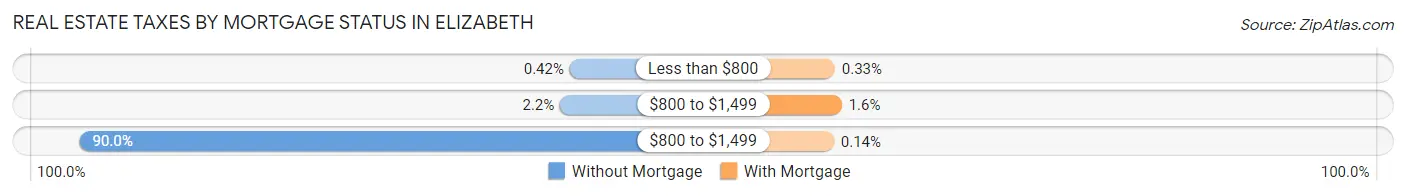
| Property Taxes | Without Mortgage | With Mortgage |
| Less than $800 | 20 (0.4%) | 22 (0.3%) |
| $800 to $1,499 | 105 (2.2%) | 106 (1.6%) |
| $800 to $1,499 | 4,305 (90.0%) | 9 (0.1%) |
| Total | 4,785 (100.0%) | 6,654 (100.0%) |
Health & Disability in Elizabeth
Health Insurance Coverage by Age in Elizabeth
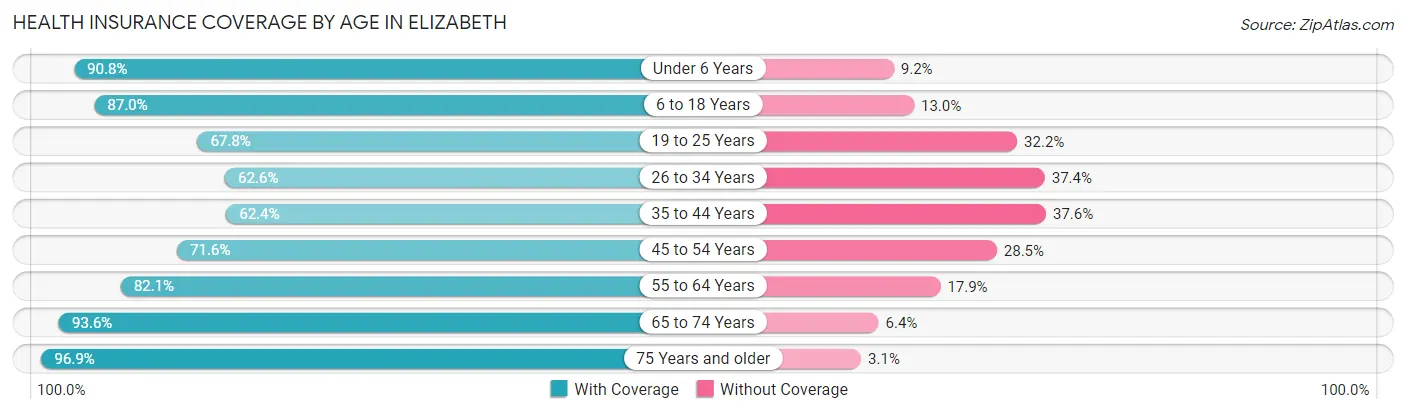
| Age Bracket | With Coverage | Without Coverage |
| Under 6 Years | 11,007 (90.8%) | 1,121 (9.2%) |
| 6 to 18 Years | 21,123 (87.0%) | 3,159 (13.0%) |
| 19 to 25 Years | 8,951 (67.8%) | 4,259 (32.2%) |
| 26 to 34 Years | 10,275 (62.6%) | 6,136 (37.4%) |
| 35 to 44 Years | 12,674 (62.4%) | 7,643 (37.6%) |
| 45 to 54 Years | 12,703 (71.6%) | 5,052 (28.4%) |
| 55 to 64 Years | 12,736 (82.1%) | 2,783 (17.9%) |
| 65 to 74 Years | 8,627 (93.6%) | 590 (6.4%) |
| 75 Years and older | 5,617 (96.9%) | 182 (3.1%) |
| Total | 103,713 (77.0%) | 30,925 (23.0%) |
Health Insurance Coverage by Citizenship Status in Elizabeth
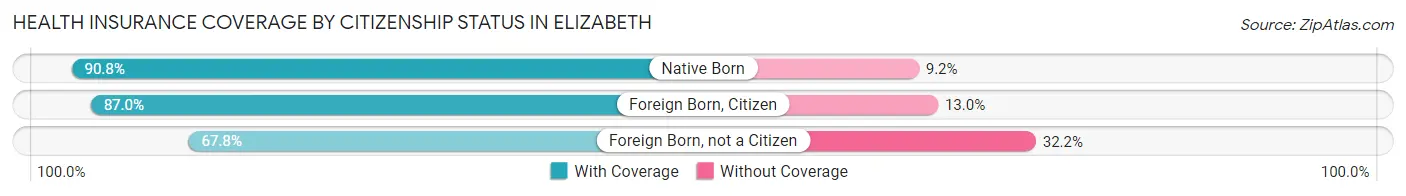
| Citizenship Status | With Coverage | Without Coverage |
| Native Born | 11,007 (90.8%) | 1,121 (9.2%) |
| Foreign Born, Citizen | 21,123 (87.0%) | 3,159 (13.0%) |
| Foreign Born, not a Citizen | 8,951 (67.8%) | 4,259 (32.2%) |
Health Insurance Coverage by Household Income in Elizabeth
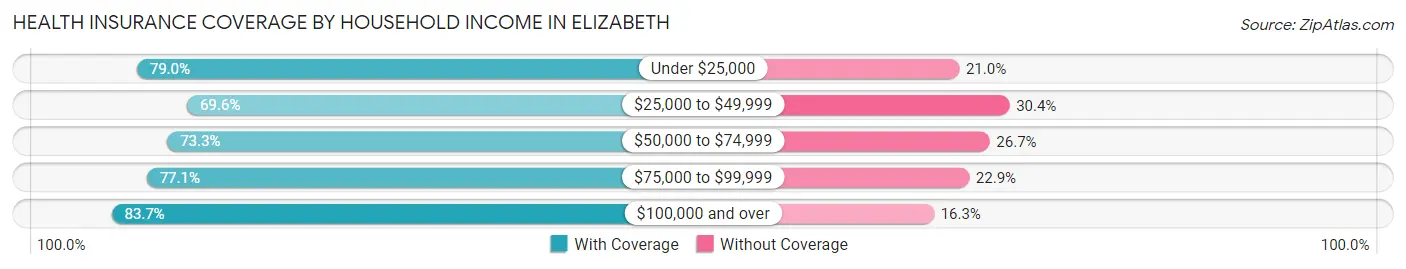
| Household Income | With Coverage | Without Coverage |
| Under $25,000 | 12,768 (79.0%) | 3,398 (21.0%) |
| $25,000 to $49,999 | 20,123 (69.6%) | 8,801 (30.4%) |
| $50,000 to $74,999 | 19,053 (73.3%) | 6,949 (26.7%) |
| $75,000 to $99,999 | 16,499 (77.1%) | 4,896 (22.9%) |
| $100,000 and over | 34,845 (83.7%) | 6,774 (16.3%) |
Public vs Private Health Insurance Coverage by Age in Elizabeth
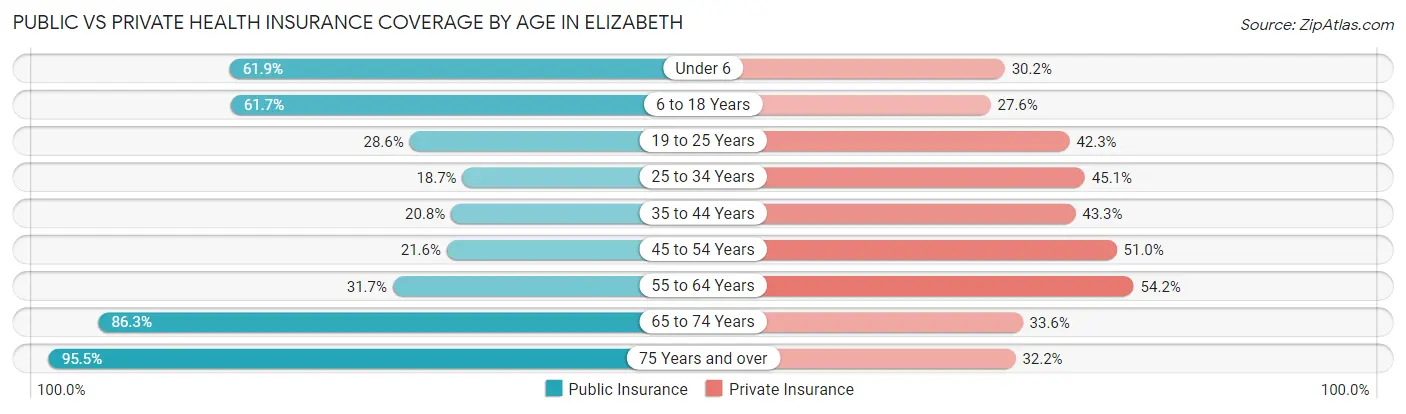
| Age Bracket | Public Insurance | Private Insurance |
| Under 6 | 7,510 (61.9%) | 3,667 (30.2%) |
| 6 to 18 Years | 14,988 (61.7%) | 6,707 (27.6%) |
| 19 to 25 Years | 3,772 (28.5%) | 5,582 (42.3%) |
| 25 to 34 Years | 3,073 (18.7%) | 7,404 (45.1%) |
| 35 to 44 Years | 4,232 (20.8%) | 8,805 (43.3%) |
| 45 to 54 Years | 3,840 (21.6%) | 9,057 (51.0%) |
| 55 to 64 Years | 4,914 (31.7%) | 8,407 (54.2%) |
| 65 to 74 Years | 7,952 (86.3%) | 3,093 (33.6%) |
| 75 Years and over | 5,538 (95.5%) | 1,869 (32.2%) |
| Total | 55,819 (41.5%) | 54,591 (40.6%) |
Disability Status by Sex by Age in Elizabeth
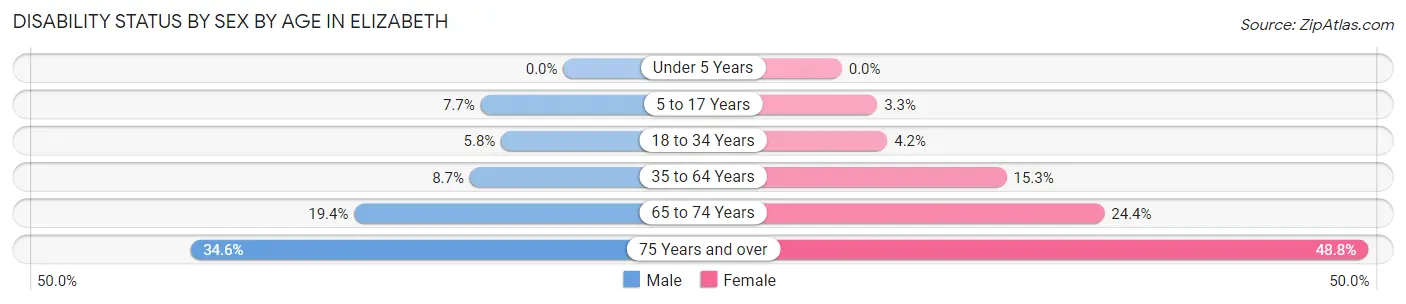
| Age Bracket | Male | Female |
| Under 5 Years | 0 (0.0%) | 0 (0.0%) |
| 5 to 17 Years | 935 (7.7%) | 399 (3.3%) |
| 18 to 34 Years | 921 (5.8%) | 661 (4.2%) |
| 35 to 64 Years | 2,379 (8.7%) | 4,004 (15.3%) |
| 65 to 74 Years | 778 (19.4%) | 1,269 (24.4%) |
| 75 Years and over | 836 (34.6%) | 1,653 (48.8%) |
Disability Class by Sex by Age in Elizabeth
Disability Class: Hearing Difficulty
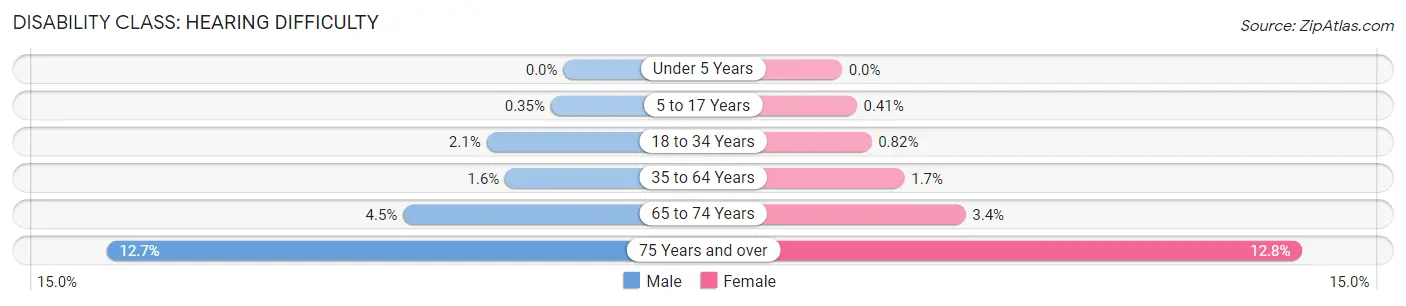
| Age Bracket | Male | Female |
| Under 5 Years | 0 (0.0%) | 0 (0.0%) |
| 5 to 17 Years | 42 (0.4%) | 50 (0.4%) |
| 18 to 34 Years | 342 (2.1%) | 129 (0.8%) |
| 35 to 64 Years | 443 (1.6%) | 456 (1.7%) |
| 65 to 74 Years | 179 (4.5%) | 179 (3.4%) |
| 75 Years and over | 307 (12.7%) | 434 (12.8%) |
Disability Class: Vision Difficulty
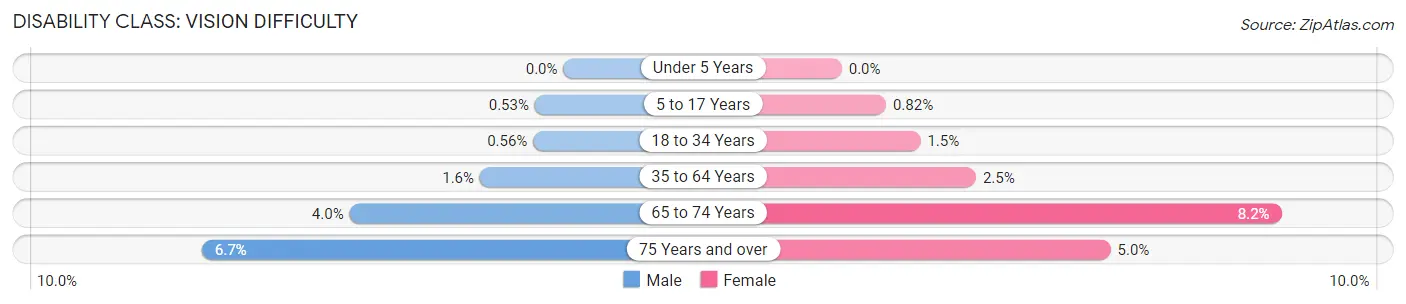
| Age Bracket | Male | Female |
| Under 5 Years | 0 (0.0%) | 0 (0.0%) |
| 5 to 17 Years | 65 (0.5%) | 99 (0.8%) |
| 18 to 34 Years | 89 (0.6%) | 229 (1.5%) |
| 35 to 64 Years | 426 (1.5%) | 652 (2.5%) |
| 65 to 74 Years | 159 (4.0%) | 425 (8.2%) |
| 75 Years and over | 162 (6.7%) | 169 (5.0%) |
Disability Class: Cognitive Difficulty
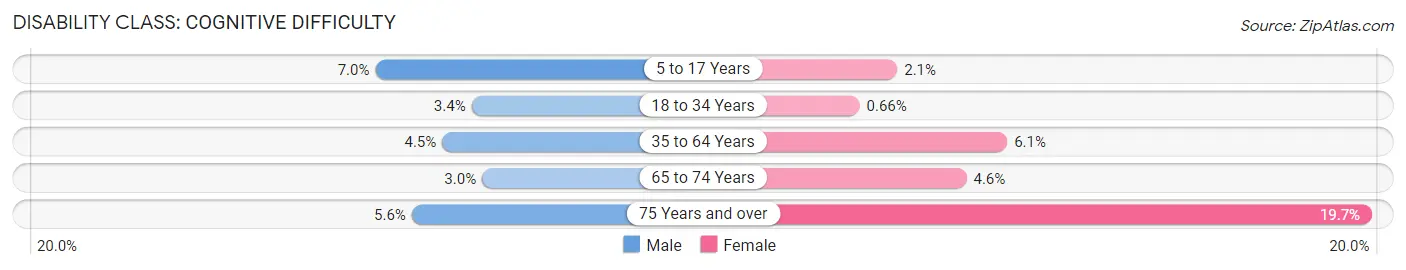
| Age Bracket | Male | Female |
| 5 to 17 Years | 849 (7.0%) | 250 (2.1%) |
| 18 to 34 Years | 544 (3.4%) | 103 (0.7%) |
| 35 to 64 Years | 1,234 (4.5%) | 1,608 (6.1%) |
| 65 to 74 Years | 121 (3.0%) | 241 (4.6%) |
| 75 Years and over | 136 (5.6%) | 666 (19.7%) |
Disability Class: Ambulatory Difficulty
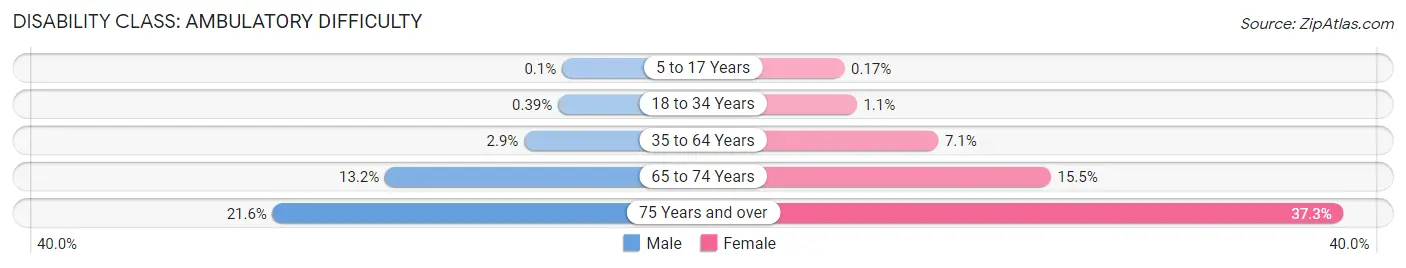
| Age Bracket | Male | Female |
| 5 to 17 Years | 12 (0.1%) | 21 (0.2%) |
| 18 to 34 Years | 62 (0.4%) | 170 (1.1%) |
| 35 to 64 Years | 797 (2.9%) | 1,870 (7.1%) |
| 65 to 74 Years | 531 (13.2%) | 807 (15.5%) |
| 75 Years and over | 521 (21.6%) | 1,261 (37.2%) |
Disability Class: Self-Care Difficulty
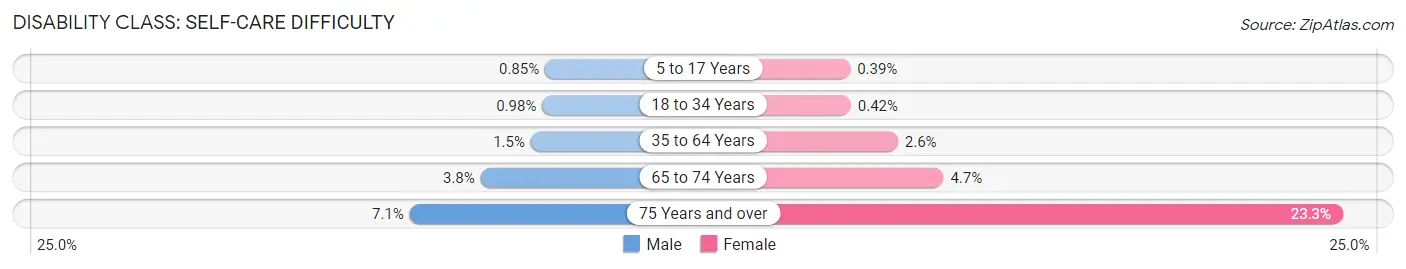
| Age Bracket | Male | Female |
| 5 to 17 Years | 104 (0.9%) | 47 (0.4%) |
| 18 to 34 Years | 157 (1.0%) | 66 (0.4%) |
| 35 to 64 Years | 414 (1.5%) | 681 (2.6%) |
| 65 to 74 Years | 154 (3.8%) | 246 (4.7%) |
| 75 Years and over | 172 (7.1%) | 787 (23.3%) |
Technology Access in Elizabeth
Computing Device Access in Elizabeth
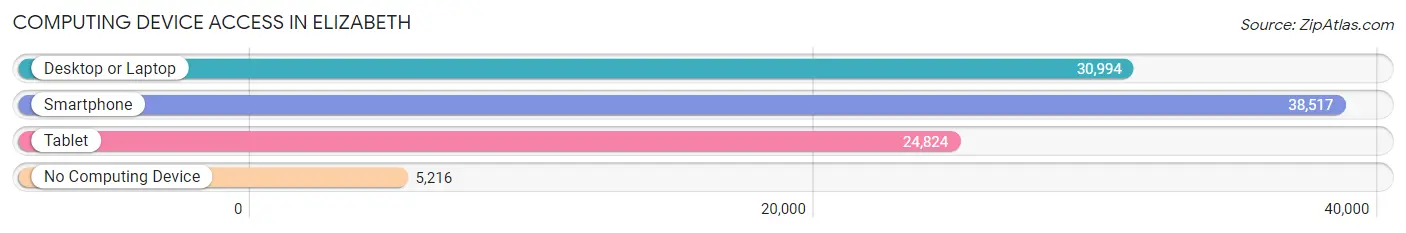
| Device Type | # Households | % Households |
| Desktop or Laptop | 30,994 | 68.1% |
| Smartphone | 38,517 | 84.7% |
| Tablet | 24,824 | 54.6% |
| No Computing Device | 5,216 | 11.5% |
| Total | 45,488 | 100.0% |
Internet Access in Elizabeth
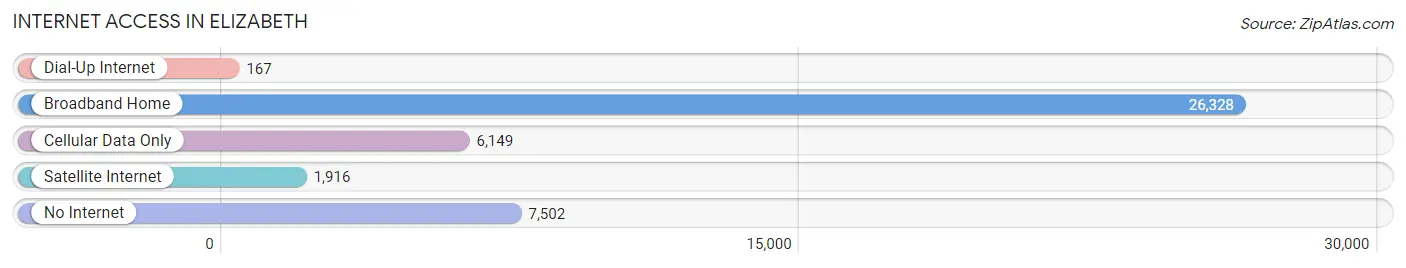
| Internet Type | # Households | % Households |
| Dial-Up Internet | 167 | 0.4% |
| Broadband Home | 26,328 | 57.9% |
| Cellular Data Only | 6,149 | 13.5% |
| Satellite Internet | 1,916 | 4.2% |
| No Internet | 7,502 | 16.5% |
| Total | 45,488 | 100.0% |
Elizabeth Summary
Elizabeth, NJ is a city located in Union County, New Jersey. It is the fourth largest city in the state and the largest city in Union County. The city is situated on the Arthur Kill and the Newark Bay, and is bordered by Newark to the east, Linden to the south, and Hillside to the west. Elizabeth is a major port of entry for immigrants to the United States, and has a long and rich history.
History
Elizabeth was first settled in 1664 by English settlers, who named the area after Elizabeth, the wife of Sir George Carteret, one of the original proprietors of the colony of New Jersey. The city was incorporated in 1855, and was an important port of entry for immigrants to the United States. During the 19th century, Elizabeth was a major industrial center, with a number of factories and shipyards. The city was also a major transportation hub, with the Central Railroad of New Jersey and the Lehigh Valley Railroad both having major terminals in Elizabeth.
Geography
Elizabeth is located in Union County, New Jersey, and is bordered by Newark to the east, Linden to the south, and Hillside to the west. The city is situated on the Arthur Kill and the Newark Bay, and is part of the New York metropolitan area. The city has a total area of 8.2 square miles, of which 7.9 square miles is land and 0.3 square miles is water.
Economy
Elizabeth has a diverse economy, with a number of major employers in the city. The largest employer is the Port Authority of New York and New Jersey, which operates the Port Newark-Elizabeth Marine Terminal. Other major employers include the Elizabethtown Gas Company, the Elizabeth Public Schools, and the Elizabeth Board of Education. The city also has a number of retail and service businesses, as well as a number of manufacturing companies.
Demographics
As of the 2010 census, Elizabeth had a population of 124,969. The racial makeup of the city was 57.2% White, 24.3% African American, 0.4% Native American, 5.2% Asian, 0.1% Pacific Islander, 10.2% from other races, and 2.7% from two or more races. Hispanic or Latino of any race were 33.2% of the population. The median household income in Elizabeth was $41,919, and the median family income was $50,817. The per capita income in Elizabeth was $20,945.
Elizabeth is a diverse city, with a large immigrant population. The city is home to a large number of immigrants from Latin America, Asia, and the Caribbean. The city also has a large African American population, and a growing Hispanic population. Elizabeth is also home to a large number of Orthodox Jews, and is the home of the largest Orthodox Jewish community in the United States.
Common Questions
What is the Total Population of Elizabeth?
Total Population of Elizabeth is 135,665.
What is the Total Male Population of Elizabeth?
Total Male Population of Elizabeth is 68,101.
What is the Total Female Population of Elizabeth?
Total Female Population of Elizabeth is 67,564.
What is the Ratio of Males per 100 Females in Elizabeth?
There are 100.79 Males per 100 Females in Elizabeth.
What is the Ratio of Females per 100 Males in Elizabeth?
There are 99.21 Females per 100 Males in Elizabeth.
What is the Median Population Age in Elizabeth?
Median Population Age in Elizabeth is 35.7 Years.
What is the Average Family Size in Elizabeth
Average Family Size in Elizabeth is 3.4 People.
What is the Average Household Size in Elizabeth
Average Household Size in Elizabeth is 3.0 People.
What is Per Capita Income in Elizabeth?
Per Capita income in Elizabeth is $26,633.
What is the Median Family Income in Elizabeth?
Median Family Income in Elizabeth is $63,566.
What is the Median Household income in Elizabeth?
Median Household Income in Elizabeth is $59,939.
What is Income or Wage Gap in Elizabeth?
Income or Wage Gap in Elizabeth is 25.5%.
Women in Elizabeth earn 74.5 cents for every dollar earned by a man.
What is Family Income Deficit in Elizabeth?
Family Income Deficit in Elizabeth is $10,633.
Families that are below poverty line in Elizabeth earn $10,633 less on average than the poverty threshold level.
What is Inequality or Gini Index in Elizabeth?
Inequality or Gini Index in Elizabeth is 0.43.
How Large is the Labor Force in Elizabeth?
There are 69,359 People in the Labor Forcein in Elizabeth.
What is the Percentage of People in the Labor Force in Elizabeth?
66.1% of People are in the Labor Force in Elizabeth.
What is the Unemployment Rate in Elizabeth?
Unemployment Rate in Elizabeth is 5.9%.