Old Bridge, NJ
Old Bridge Map
Old Bridge Overview
28,094
TOTAL POPULATION
13,651
MALE POPULATION
14,443
FEMALE POPULATION
94.52
MALES / 100 FEMALES
105.80
FEMALES / 100 MALES
43.2
MEDIAN AGE
3.2
AVG FAMILY SIZE
2.7
AVG HOUSEHOLD SIZE
$49,513
PER CAPITA INCOME
$130,878
AVG FAMILY INCOME
$104,712
AVG HOUSEHOLD INCOME
35.1%
WAGE / INCOME GAP [ % ]
64.9¢/ $1
WAGE / INCOME GAP [ $ ]
0.41
INEQUALITY / GINI INDEX
15,922
LABOR FORCE [ PEOPLE ]
67.6%
PERCENT IN LABOR FORCE
6.9%
UNEMPLOYMENT RATE
Old Bridge Zip Codes
Old Bridge Area Codes
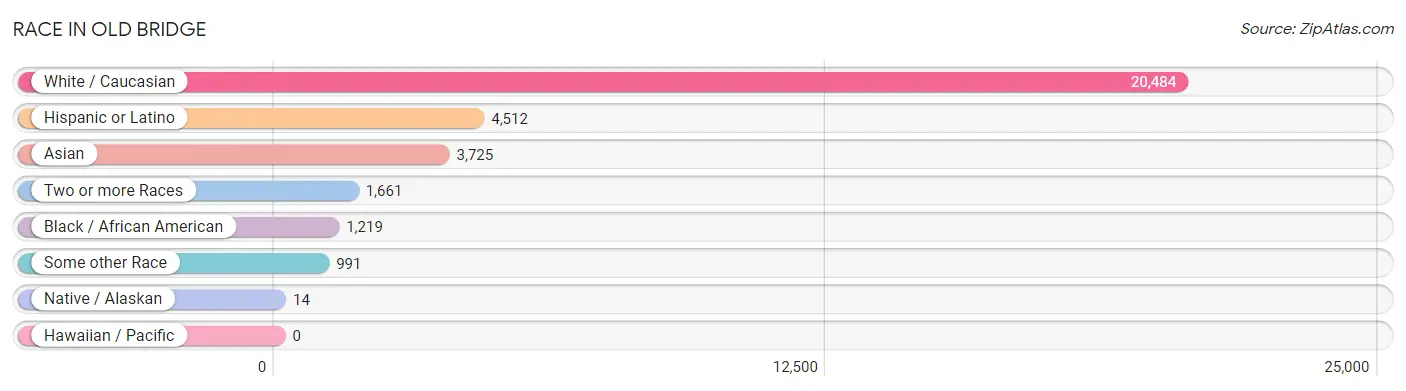
Race in Old Bridge
The most populous races in Old Bridge are White / Caucasian (20,484 | 72.9%), Hispanic or Latino (4,512 | 16.1%), and Asian (3,725 | 13.3%).
| Race | # Population | % Population |
| Asian | 3,725 | 13.3% |
| Black / African American | 1,219 | 4.3% |
| Hawaiian / Pacific | 0 | 0.0% |
| Hispanic or Latino | 4,512 | 16.1% |
| Native / Alaskan | 14 | 0.1% |
| White / Caucasian | 20,484 | 72.9% |
| Two or more Races | 1,661 | 5.9% |
| Some other Race | 991 | 3.5% |
| Total | 28,094 | 100.0% |
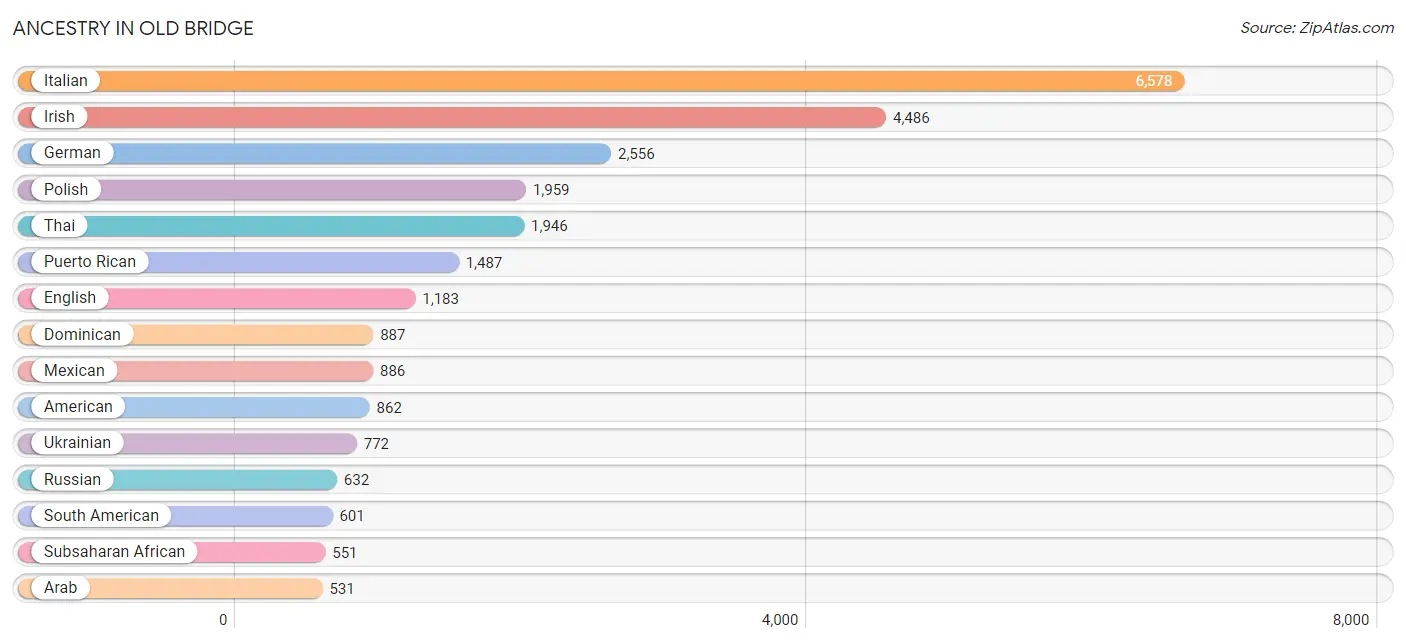
Ancestry in Old Bridge
The most populous ancestries reported in Old Bridge are Italian (6,578 | 23.4%), Irish (4,486 | 16.0%), German (2,556 | 9.1%), Polish (1,959 | 7.0%), and Thai (1,946 | 6.9%), together accounting for 62.4% of all Old Bridge residents.
| Ancestry | # Population | % Population |
| African | 310 | 1.1% |
| Albanian | 99 | 0.4% |
| American | 862 | 3.1% |
| Arab | 531 | 1.9% |
| Argentinean | 53 | 0.2% |
| Austrian | 84 | 0.3% |
| Bhutanese | 121 | 0.4% |
| Blackfeet | 16 | 0.1% |
| Brazilian | 10 | 0.0% |
| British | 39 | 0.1% |
| British West Indian | 12 | 0.0% |
| Burmese | 272 | 1.0% |
| Cambodian | 11 | 0.0% |
| Canadian | 52 | 0.2% |
| Central American | 162 | 0.6% |
| Central American Indian | 24 | 0.1% |
| Cherokee | 22 | 0.1% |
| Chilean | 41 | 0.2% |
| Colombian | 230 | 0.8% |
| Costa Rican | 38 | 0.1% |
| Cuban | 205 | 0.7% |
| Czech | 117 | 0.4% |
| Czechoslovakian | 20 | 0.1% |
| Danish | 120 | 0.4% |
| Dominican | 887 | 3.2% |
| Dutch | 42 | 0.2% |
| Eastern European | 15 | 0.1% |
| Ecuadorian | 185 | 0.7% |
| Egyptian | 365 | 1.3% |
| English | 1,183 | 4.2% |
| Estonian | 29 | 0.1% |
| European | 324 | 1.1% |
| Finnish | 23 | 0.1% |
| French | 75 | 0.3% |
| French Canadian | 59 | 0.2% |
| German | 2,556 | 9.1% |
| Greek | 331 | 1.2% |
| Guatemalan | 38 | 0.1% |
| Guyanese | 236 | 0.8% |
| Honduran | 4 | 0.0% |
| Hungarian | 197 | 0.7% |
| Indian (Asian) | 525 | 1.9% |
| Indonesian | 42 | 0.2% |
| Irish | 4,486 | 16.0% |
| Israeli | 19 | 0.1% |
| Italian | 6,578 | 23.4% |
| Jamaican | 96 | 0.3% |
| Kenyan | 25 | 0.1% |
| Korean | 385 | 1.4% |
| Lebanese | 9 | 0.0% |
| Lithuanian | 87 | 0.3% |
| Macedonian | 14 | 0.1% |
| Mexican | 886 | 3.2% |
| Mexican American Indian | 7 | 0.0% |
| Nigerian | 216 | 0.8% |
| Northern European | 10 | 0.0% |
| Norwegian | 178 | 0.6% |
| Pakistani | 79 | 0.3% |
| Palestinian | 37 | 0.1% |
| Pennsylvania German | 12 | 0.0% |
| Peruvian | 87 | 0.3% |
| Polish | 1,959 | 7.0% |
| Portuguese | 269 | 1.0% |
| Puerto Rican | 1,487 | 5.3% |
| Romanian | 113 | 0.4% |
| Russian | 632 | 2.2% |
| Salvadoran | 82 | 0.3% |
| Scotch-Irish | 245 | 0.9% |
| Scottish | 196 | 0.7% |
| Slavic | 21 | 0.1% |
| Slovak | 152 | 0.5% |
| South American | 601 | 2.1% |
| Spaniard | 72 | 0.3% |
| Spanish | 173 | 0.6% |
| Sri Lankan | 134 | 0.5% |
| Subsaharan African | 551 | 2.0% |
| Swedish | 131 | 0.5% |
| Swiss | 10 | 0.0% |
| Syrian | 56 | 0.2% |
| Thai | 1,946 | 6.9% |
| Trinidadian and Tobagonian | 44 | 0.2% |
| Turkish | 28 | 0.1% |
| Ukrainian | 772 | 2.8% |
| Venezuelan | 4 | 0.0% |
| Vietnamese | 19 | 0.1% |
| Welsh | 13 | 0.1% | View All 86 Rows |
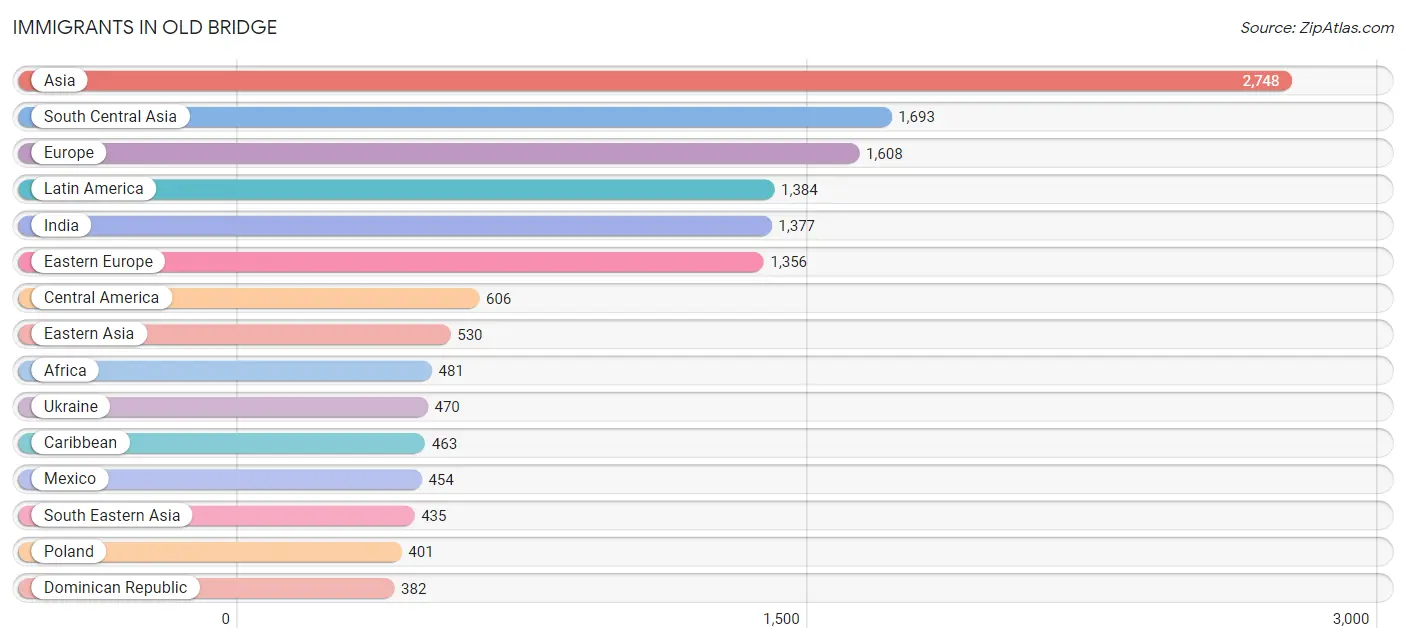
Immigrants in Old Bridge
The most numerous immigrant groups reported in Old Bridge came from Asia (2,748 | 9.8%), South Central Asia (1,693 | 6.0%), Europe (1,608 | 5.7%), Latin America (1,384 | 4.9%), and India (1,377 | 4.9%), together accounting for 31.4% of all Old Bridge residents.
| Immigration Origin | # Population | % Population |
| Africa | 481 | 1.7% |
| Albania | 14 | 0.1% |
| Argentina | 19 | 0.1% |
| Asia | 2,748 | 9.8% |
| Australia | 59 | 0.2% |
| Austria | 10 | 0.0% |
| Bangladesh | 66 | 0.2% |
| Belarus | 36 | 0.1% |
| Canada | 104 | 0.4% |
| Caribbean | 463 | 1.7% |
| Central America | 606 | 2.2% |
| Chile | 9 | 0.0% |
| China | 267 | 0.9% |
| Colombia | 48 | 0.2% |
| Costa Rica | 56 | 0.2% |
| Cuba | 35 | 0.1% |
| Czechoslovakia | 18 | 0.1% |
| Dominican Republic | 382 | 1.4% |
| Eastern Africa | 25 | 0.1% |
| Eastern Asia | 530 | 1.9% |
| Eastern Europe | 1,356 | 4.8% |
| Ecuador | 95 | 0.3% |
| Egypt | 227 | 0.8% |
| El Salvador | 45 | 0.2% |
| England | 24 | 0.1% |
| Europe | 1,608 | 5.7% |
| Germany | 11 | 0.0% |
| Ghana | 33 | 0.1% |
| Guatemala | 38 | 0.1% |
| Guyana | 111 | 0.4% |
| Honduras | 4 | 0.0% |
| Hong Kong | 102 | 0.4% |
| India | 1,377 | 4.9% |
| Ireland | 30 | 0.1% |
| Israel | 26 | 0.1% |
| Italy | 79 | 0.3% |
| Jamaica | 26 | 0.1% |
| Japan | 28 | 0.1% |
| Kazakhstan | 27 | 0.1% |
| Kenya | 25 | 0.1% |
| Korea | 235 | 0.8% |
| Latin America | 1,384 | 4.9% |
| Latvia | 11 | 0.0% |
| Mexico | 454 | 1.6% |
| Moldova | 119 | 0.4% |
| Nicaragua | 9 | 0.0% |
| North Macedonia | 27 | 0.1% |
| Northern Africa | 247 | 0.9% |
| Northern Europe | 77 | 0.3% |
| Oceania | 59 | 0.2% |
| Pakistan | 153 | 0.5% |
| Peru | 20 | 0.1% |
| Philippines | 181 | 0.6% |
| Poland | 401 | 1.4% |
| Portugal | 66 | 0.2% |
| Romania | 8 | 0.0% |
| Russia | 252 | 0.9% |
| Sierra Leone | 176 | 0.6% |
| Singapore | 34 | 0.1% |
| South America | 315 | 1.1% |
| South Central Asia | 1,693 | 6.0% |
| South Eastern Asia | 435 | 1.5% |
| Southern Europe | 145 | 0.5% |
| Switzerland | 9 | 0.0% |
| Syria | 13 | 0.1% |
| Thailand | 53 | 0.2% |
| Trinidad and Tobago | 20 | 0.1% |
| Ukraine | 470 | 1.7% |
| Uzbekistan | 43 | 0.2% |
| Venezuela | 13 | 0.1% |
| Vietnam | 140 | 0.5% |
| Western Africa | 209 | 0.7% |
| Western Asia | 90 | 0.3% |
| Western Europe | 30 | 0.1% | View All 74 Rows |
Sex and Age in Old Bridge
Sex and Age in Old Bridge
The most populous age groups in Old Bridge are 55 to 59 Years (1,206 | 8.8%) for men and 55 to 59 Years (1,161 | 8.0%) for women.
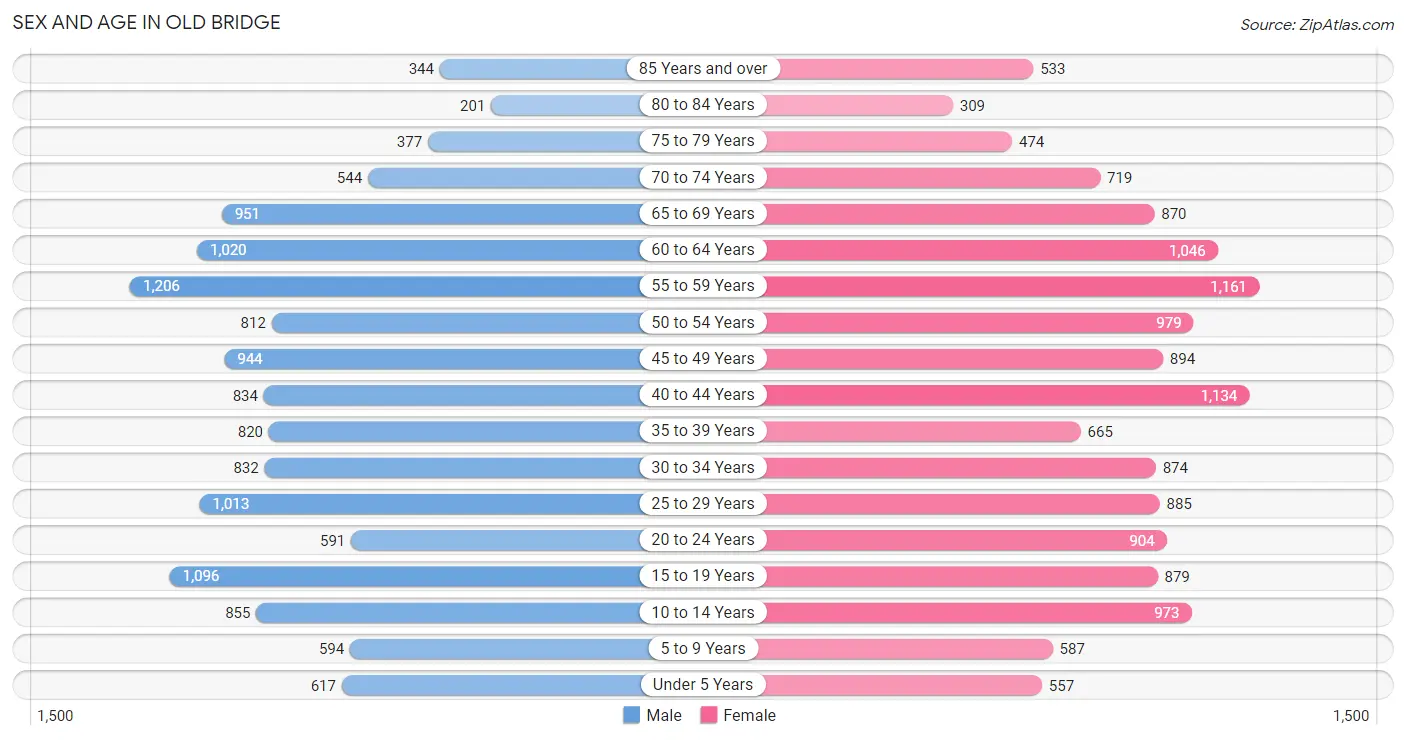
| Age Bracket | Male | Female |
| Under 5 Years | 617 (4.5%) | 557 (3.9%) |
| 5 to 9 Years | 594 (4.3%) | 587 (4.1%) |
| 10 to 14 Years | 855 (6.3%) | 973 (6.7%) |
| 15 to 19 Years | 1,096 (8.0%) | 879 (6.1%) |
| 20 to 24 Years | 591 (4.3%) | 904 (6.3%) |
| 25 to 29 Years | 1,013 (7.4%) | 885 (6.1%) |
| 30 to 34 Years | 832 (6.1%) | 874 (6.0%) |
| 35 to 39 Years | 820 (6.0%) | 665 (4.6%) |
| 40 to 44 Years | 834 (6.1%) | 1,134 (7.9%) |
| 45 to 49 Years | 944 (6.9%) | 894 (6.2%) |
| 50 to 54 Years | 812 (5.9%) | 979 (6.8%) |
| 55 to 59 Years | 1,206 (8.8%) | 1,161 (8.0%) |
| 60 to 64 Years | 1,020 (7.5%) | 1,046 (7.2%) |
| 65 to 69 Years | 951 (7.0%) | 870 (6.0%) |
| 70 to 74 Years | 544 (4.0%) | 719 (5.0%) |
| 75 to 79 Years | 377 (2.8%) | 474 (3.3%) |
| 80 to 84 Years | 201 (1.5%) | 309 (2.1%) |
| 85 Years and over | 344 (2.5%) | 533 (3.7%) |
| Total | 13,651 (100.0%) | 14,443 (100.0%) |
Families and Households in Old Bridge
Median Family Size in Old Bridge
The median family size in Old Bridge is 3.22 persons per family, with married-couple families (6,261 | 84.1%) accounting for the largest median family size of 3.26 persons per family. On the other hand, single male/father families (348 | 4.7%) represent the smallest median family size with 2.69 persons per family.
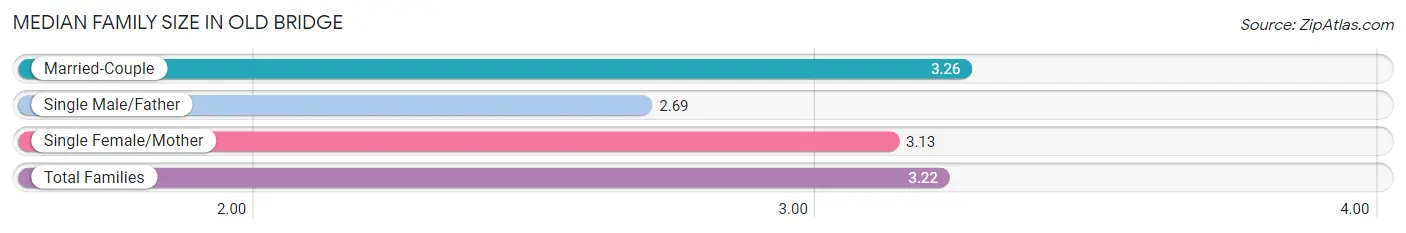
| Family Type | # Families | Family Size |
| Married-Couple | 6,261 (84.1%) | 3.26 |
| Single Male/Father | 348 (4.7%) | 2.69 |
| Single Female/Mother | 835 (11.2%) | 3.13 |
| Total Families | 7,444 (100.0%) | 3.22 |
Median Household Size in Old Bridge
The median household size in Old Bridge is 2.67 persons per household, with married-couple households (6,261 | 59.8%) accounting for the largest median household size of 3.31 persons per household. non-family households (3,025 | 28.9%) represent the smallest median household size with 1.13 persons per household.
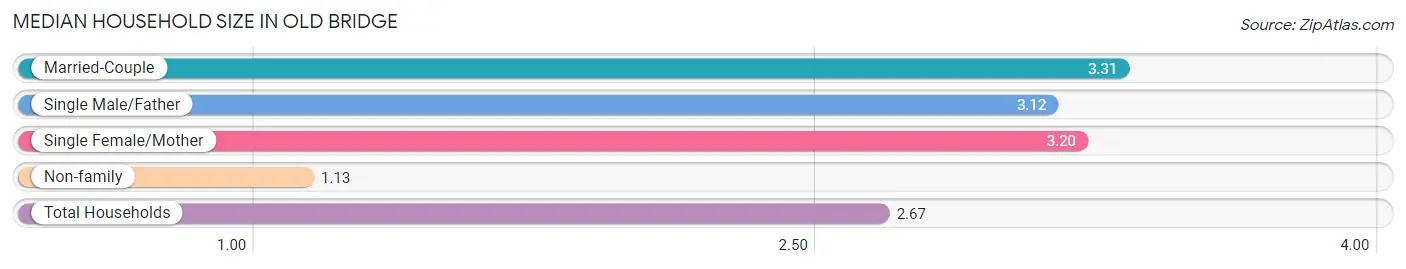
| Household Type | # Households | Household Size |
| Married-Couple | 6,261 (59.8%) | 3.31 |
| Single Male/Father | 348 (3.3%) | 3.12 |
| Single Female/Mother | 835 (8.0%) | 3.20 |
| Non-family | 3,025 (28.9%) | 1.13 |
| Total Households | 10,469 (100.0%) | 2.67 |
Household Size by Marriage Status in Old Bridge
Out of a total of 10,469 households in Old Bridge, 7,444 (71.1%) are family households, while 3,025 (28.9%) are nonfamily households. The most numerous type of family households are 2-person households, comprising 2,606, and the most common type of nonfamily households are 1-person households, comprising 2,672.
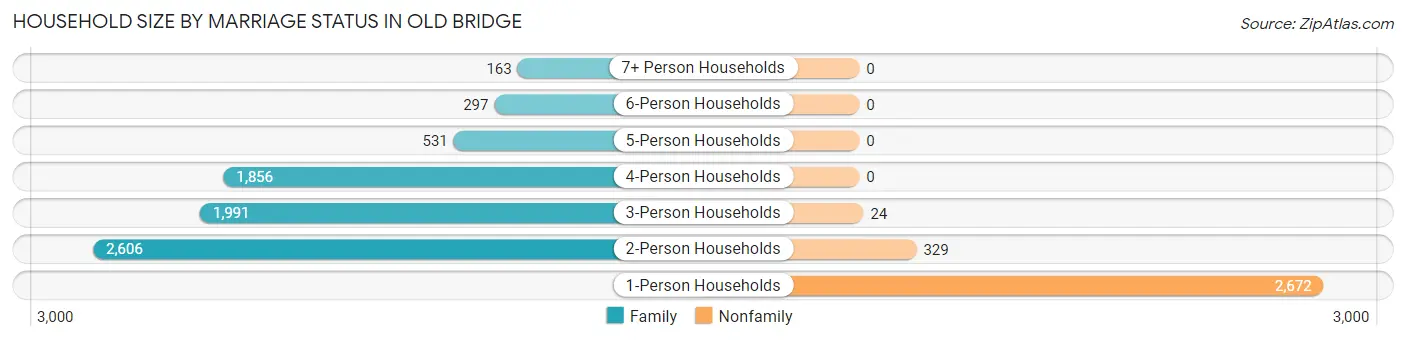
| Household Size | Family Households | Nonfamily Households |
| 1-Person Households | - | 2,672 (25.5%) |
| 2-Person Households | 2,606 (24.9%) | 329 (3.1%) |
| 3-Person Households | 1,991 (19.0%) | 24 (0.2%) |
| 4-Person Households | 1,856 (17.7%) | 0 (0.0%) |
| 5-Person Households | 531 (5.1%) | 0 (0.0%) |
| 6-Person Households | 297 (2.8%) | 0 (0.0%) |
| 7+ Person Households | 163 (1.6%) | 0 (0.0%) |
| Total | 7,444 (71.1%) | 3,025 (28.9%) |
Female Fertility in Old Bridge
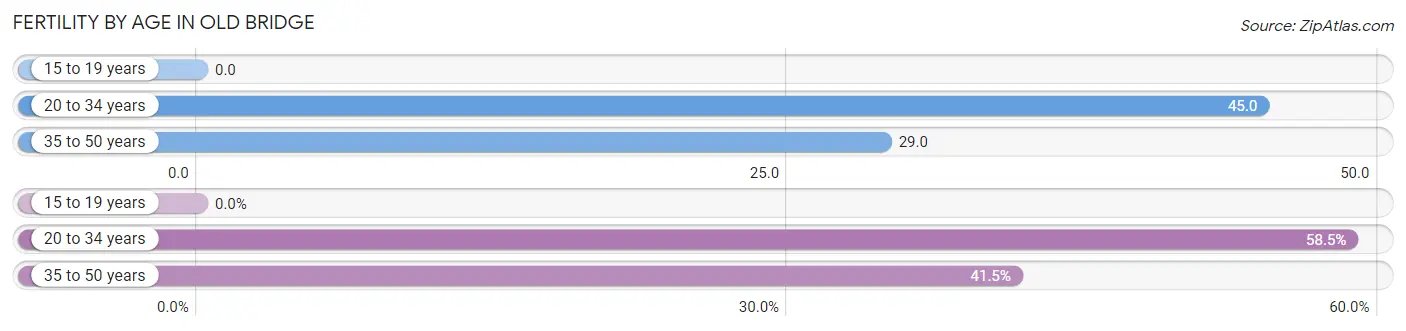
Fertility by Age in Old Bridge
Average fertility rate in Old Bridge is 31.0 births per 1,000 women. Women in the age bracket of 20 to 34 years have the highest fertility rate with 45.0 births per 1,000 women. Women in the age bracket of 20 to 34 years acount for 58.5% of all women with births.
| Age Bracket | Women with Births | Births / 1,000 Women |
| 15 to 19 years | 0 (0.0%) | 0.0 |
| 20 to 34 years | 120 (58.5%) | 45.0 |
| 35 to 50 years | 85 (41.5%) | 29.0 |
| Total | 205 (100.0%) | 31.0 |
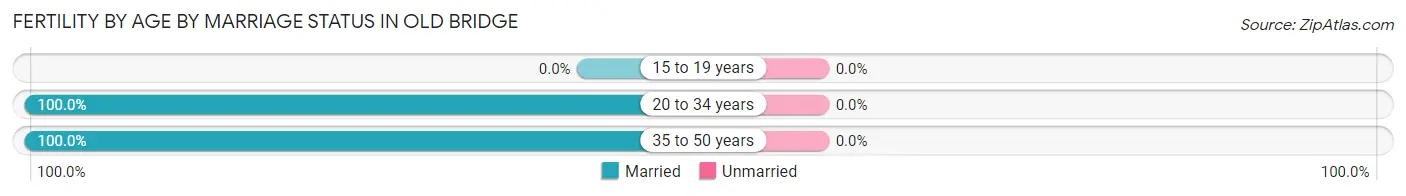
Fertility by Age by Marriage Status in Old Bridge
| Age Bracket | Married | Unmarried |
| 15 to 19 years | 0 (0.0%) | 0 (0.0%) |
| 20 to 34 years | 120 (100.0%) | 0 (0.0%) |
| 35 to 50 years | 85 (100.0%) | 0 (0.0%) |
| Total | 205 (100.0%) | 0 (0.0%) |
Fertility by Education in Old Bridge
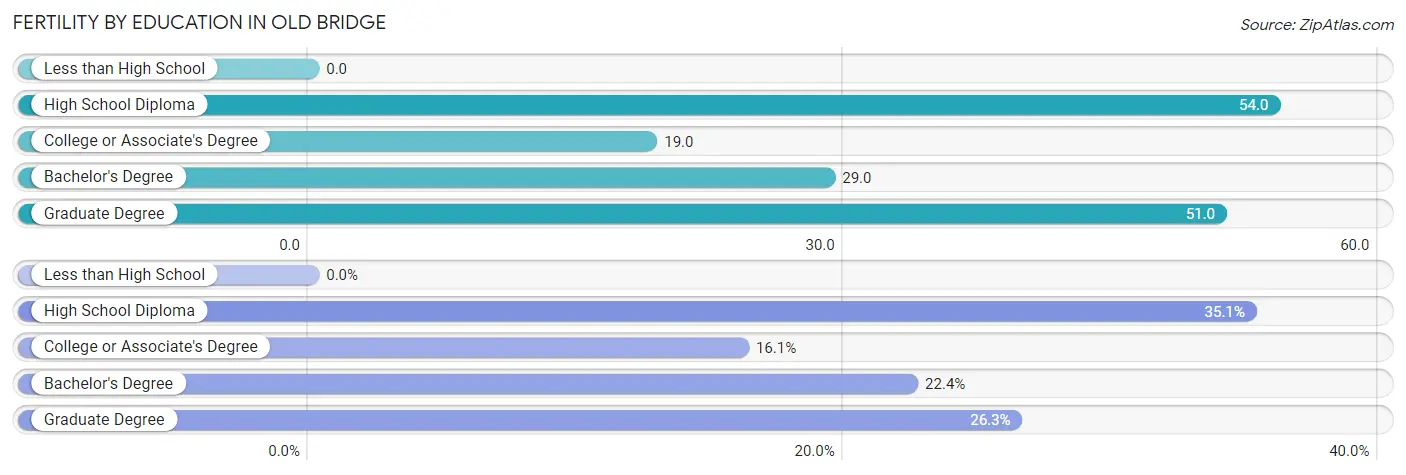
| Educational Attainment | Women with Births | Births / 1,000 Women |
| Less than High School | 0 (0.0%) | 0.0 |
| High School Diploma | 72 (35.1%) | 54.0 |
| College or Associate's Degree | 33 (16.1%) | 19.0 |
| Bachelor's Degree | 46 (22.4%) | 29.0 |
| Graduate Degree | 54 (26.3%) | 51.0 |
| Total | 205 (100.0%) | 31.0 |
Fertility by Education by Marriage Status in Old Bridge
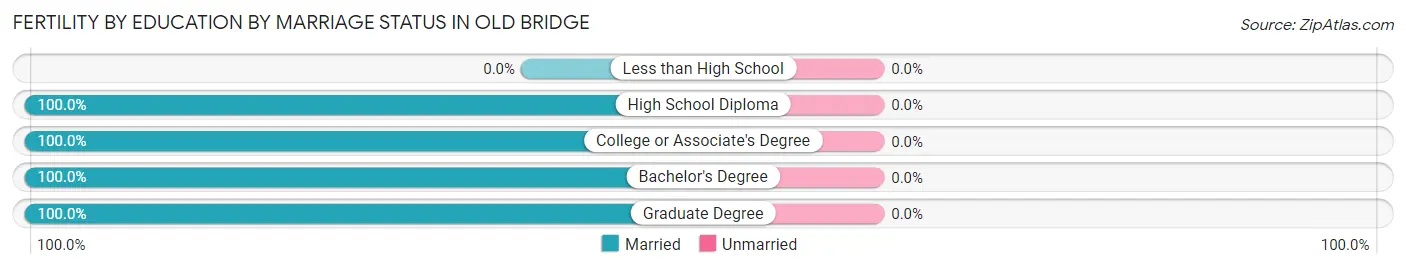
| Educational Attainment | Married | Unmarried |
| Less than High School | 0 (0.0%) | 0 (0.0%) |
| High School Diploma | 72 (100.0%) | 0 (0.0%) |
| College or Associate's Degree | 33 (100.0%) | 0 (0.0%) |
| Bachelor's Degree | 46 (100.0%) | 0 (0.0%) |
| Graduate Degree | 54 (100.0%) | 0 (0.0%) |
| Total | 205 (100.0%) | 0 (0.0%) |
Income in Old Bridge
Income Overview in Old Bridge
Per Capita Income in Old Bridge is $49,513, while median incomes of families and households are $130,878 and $104,712 respectively.
| Characteristic | Number | Measure |
| Per Capita Income | 28,094 | $49,513 |
| Median Family Income | 7,444 | $130,878 |
| Mean Family Income | 7,444 | $151,950 |
| Median Household Income | 10,469 | $104,712 |
| Mean Household Income | 10,469 | $129,754 |
| Income Deficit | 7,444 | $0 |
| Wage / Income Gap (%) | 28,094 | 35.10% |
| Wage / Income Gap ($) | 28,094 | 64.90¢ per $1 |
| Gini / Inequality Index | 28,094 | 0.41 |
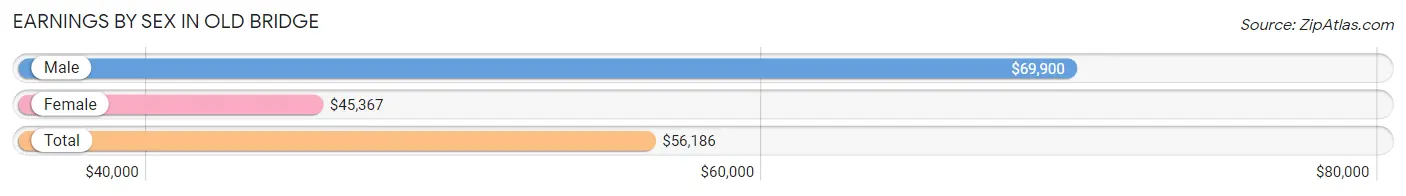
Earnings by Sex in Old Bridge
Average Earnings in Old Bridge are $56,186, $69,900 for men and $45,367 for women, a difference of 35.1%.
| Sex | Number | Average Earnings |
| Male | 8,051 (51.0%) | $69,900 |
| Female | 7,743 (49.0%) | $45,367 |
| Total | 15,794 (100.0%) | $56,186 |
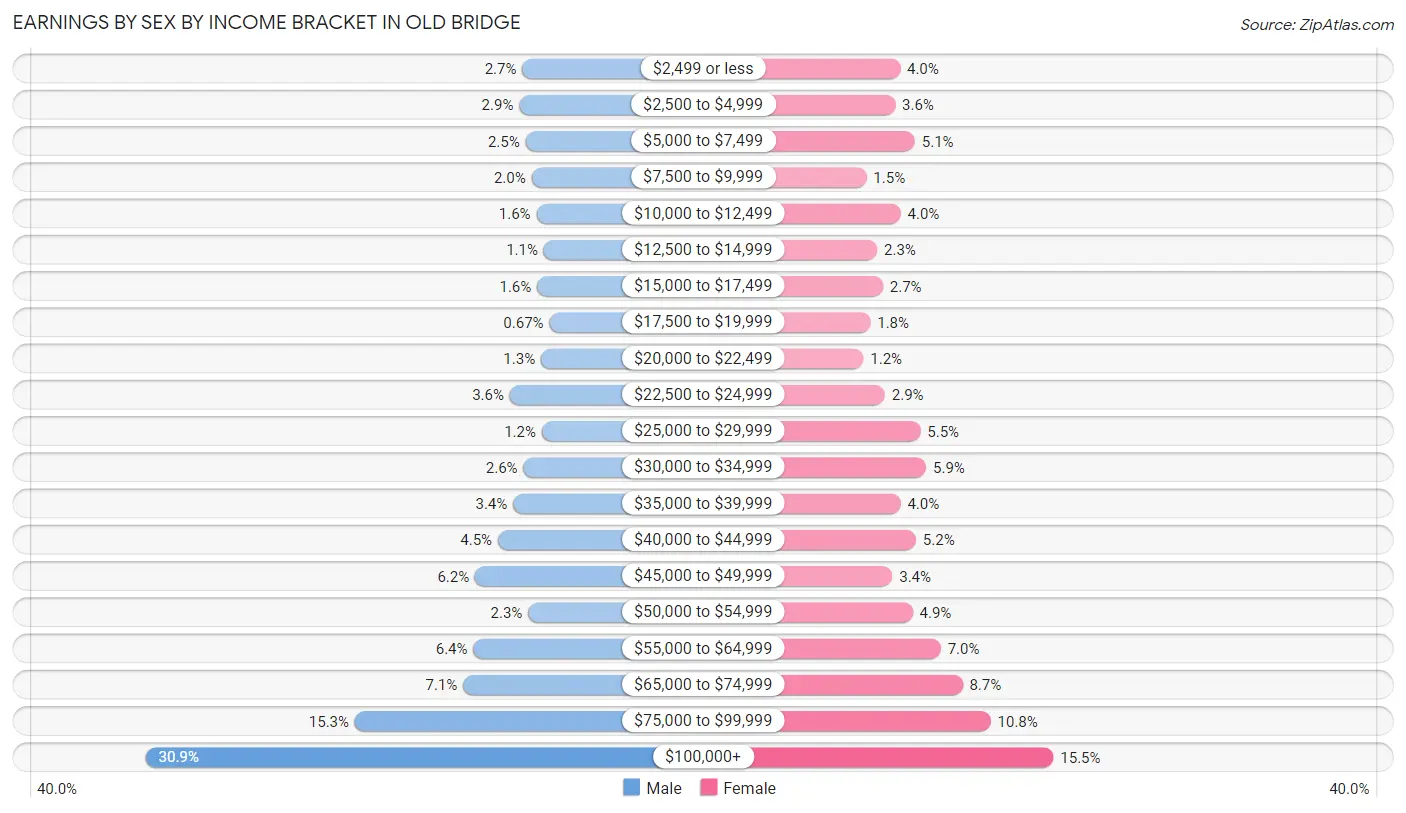
Earnings by Sex by Income Bracket in Old Bridge
The most common earnings brackets in Old Bridge are $100,000+ for men (2,490 | 30.9%) and $100,000+ for women (1,199 | 15.5%).
| Income | Male | Female |
| $2,499 or less | 217 (2.7%) | 309 (4.0%) |
| $2,500 to $4,999 | 236 (2.9%) | 280 (3.6%) |
| $5,000 to $7,499 | 198 (2.5%) | 395 (5.1%) |
| $7,500 to $9,999 | 162 (2.0%) | 114 (1.5%) |
| $10,000 to $12,499 | 132 (1.6%) | 312 (4.0%) |
| $12,500 to $14,999 | 88 (1.1%) | 176 (2.3%) |
| $15,000 to $17,499 | 128 (1.6%) | 209 (2.7%) |
| $17,500 to $19,999 | 54 (0.7%) | 136 (1.8%) |
| $20,000 to $22,499 | 105 (1.3%) | 96 (1.2%) |
| $22,500 to $24,999 | 293 (3.6%) | 221 (2.9%) |
| $25,000 to $29,999 | 100 (1.2%) | 427 (5.5%) |
| $30,000 to $34,999 | 211 (2.6%) | 460 (5.9%) |
| $35,000 to $39,999 | 273 (3.4%) | 311 (4.0%) |
| $40,000 to $44,999 | 365 (4.5%) | 401 (5.2%) |
| $45,000 to $49,999 | 502 (6.2%) | 264 (3.4%) |
| $50,000 to $54,999 | 182 (2.3%) | 382 (4.9%) |
| $55,000 to $64,999 | 513 (6.4%) | 545 (7.0%) |
| $65,000 to $74,999 | 574 (7.1%) | 671 (8.7%) |
| $75,000 to $99,999 | 1,228 (15.2%) | 835 (10.8%) |
| $100,000+ | 2,490 (30.9%) | 1,199 (15.5%) |
| Total | 8,051 (100.0%) | 7,743 (100.0%) |
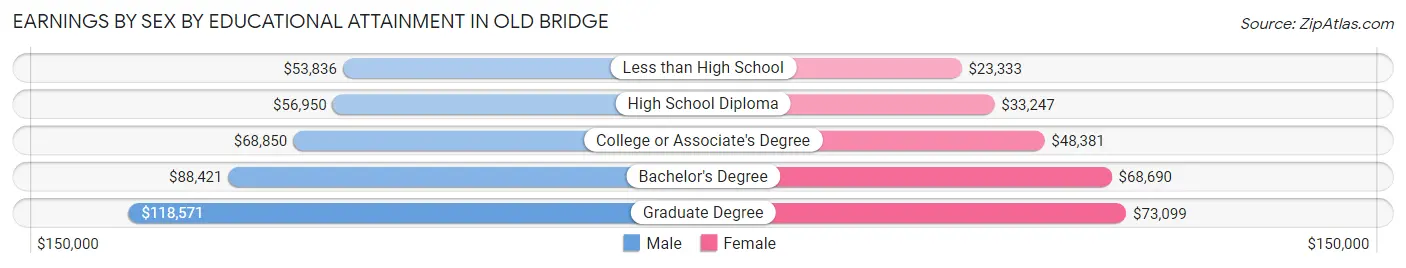
Earnings by Sex by Educational Attainment in Old Bridge
Average earnings in Old Bridge are $75,946 for men and $52,209 for women, a difference of 31.3%. Men with an educational attainment of graduate degree enjoy the highest average annual earnings of $118,571, while those with less than high school education earn the least with $53,836. Women with an educational attainment of graduate degree earn the most with the average annual earnings of $73,099, while those with less than high school education have the smallest earnings of $23,333.
| Educational Attainment | Male Income | Female Income |
| Less than High School | $53,836 | $23,333 |
| High School Diploma | $56,950 | $33,247 |
| College or Associate's Degree | $68,850 | $48,381 |
| Bachelor's Degree | $88,421 | $68,690 |
| Graduate Degree | $118,571 | $73,099 |
| Total | $75,946 | $52,209 |
Family Income in Old Bridge
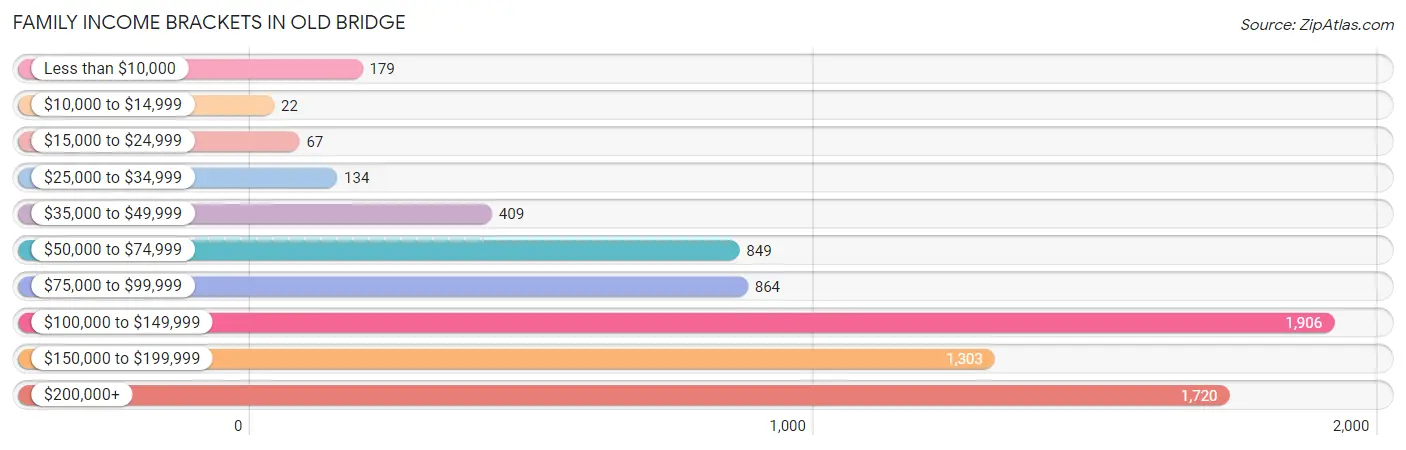
Family Income Brackets in Old Bridge
According to the Old Bridge family income data, there are 1,906 families falling into the $100,000 to $149,999 income range, which is the most common income bracket and makes up 25.6% of all families. Conversely, the $10,000 to $14,999 income bracket is the least frequent group with only 22 families (0.3%) belonging to this category.
| Income Bracket | # Families | % Families |
| Less than $10,000 | 179 | 2.4% |
| $10,000 to $14,999 | 22 | 0.3% |
| $15,000 to $24,999 | 67 | 0.9% |
| $25,000 to $34,999 | 134 | 1.8% |
| $35,000 to $49,999 | 409 | 5.5% |
| $50,000 to $74,999 | 849 | 11.4% |
| $75,000 to $99,999 | 864 | 11.6% |
| $100,000 to $149,999 | 1,906 | 25.6% |
| $150,000 to $199,999 | 1,303 | 17.5% |
| $200,000+ | 1,720 | 23.1% |
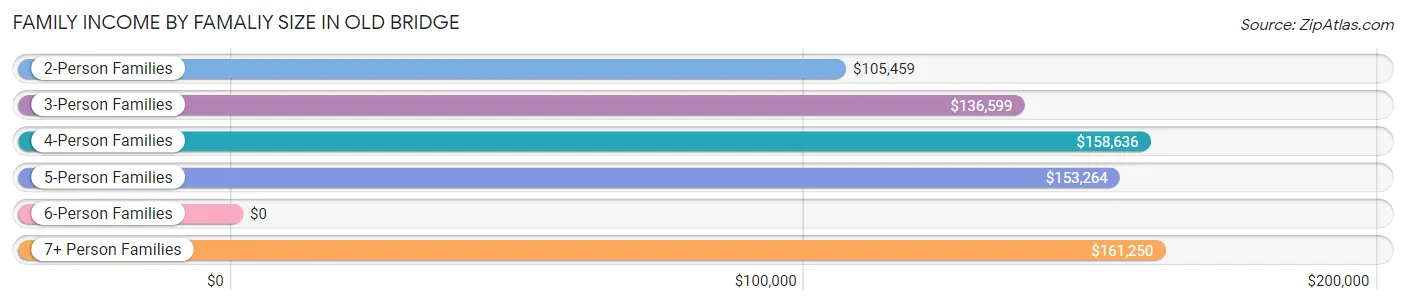
Family Income by Famaliy Size in Old Bridge
7+ person families (98 | 1.3%) account for the highest median family income in Old Bridge with $161,250 per family, while 2-person families (2,767 | 37.2%) have the highest median income of $52,730 per family member.
| Income Bracket | # Families | Median Income |
| 2-Person Families | 2,767 (37.2%) | $105,459 |
| 3-Person Families | 1,959 (26.3%) | $136,599 |
| 4-Person Families | 1,760 (23.6%) | $158,636 |
| 5-Person Families | 543 (7.3%) | $153,264 |
| 6-Person Families | 317 (4.3%) | $0 |
| 7+ Person Families | 98 (1.3%) | $161,250 |
| Total | 7,444 (100.0%) | $130,878 |
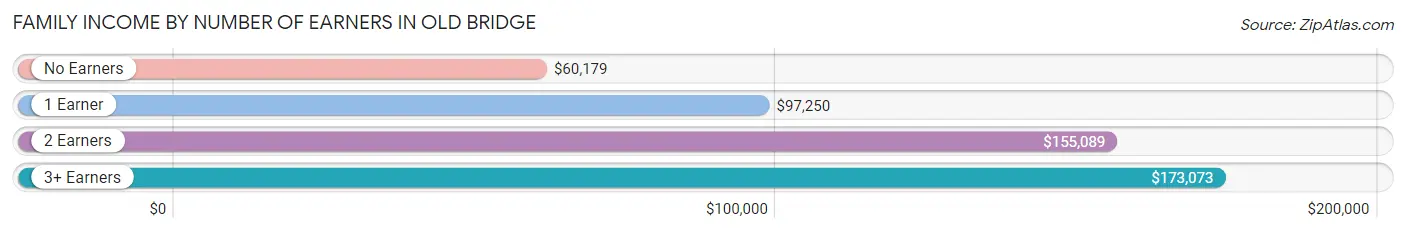
Family Income by Number of Earners in Old Bridge
The median family income in Old Bridge is $130,878, with families comprising 3+ earners (1,457) having the highest median family income of $173,073, while families with no earners (839) have the lowest median family income of $60,179, accounting for 19.6% and 11.3% of families, respectively.
| Number of Earners | # Families | Median Income |
| No Earners | 839 (11.3%) | $60,179 |
| 1 Earner | 2,024 (27.2%) | $97,250 |
| 2 Earners | 3,124 (42.0%) | $155,089 |
| 3+ Earners | 1,457 (19.6%) | $173,073 |
| Total | 7,444 (100.0%) | $130,878 |
Household Income in Old Bridge
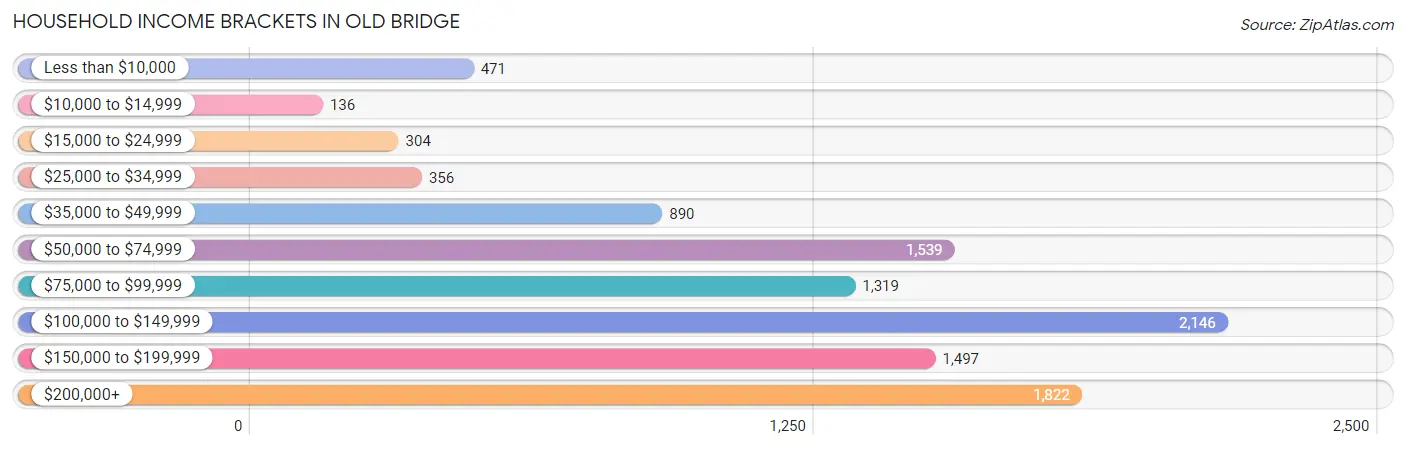
Household Income Brackets in Old Bridge
With 2,146 households falling in the category, the $100,000 to $149,999 income range is the most frequent in Old Bridge, accounting for 20.5% of all households. In contrast, only 136 households (1.3%) fall into the $10,000 to $14,999 income bracket, making it the least populous group.
| Income Bracket | # Households | % Households |
| Less than $10,000 | 471 | 4.5% |
| $10,000 to $14,999 | 136 | 1.3% |
| $15,000 to $24,999 | 304 | 2.9% |
| $25,000 to $34,999 | 356 | 3.4% |
| $35,000 to $49,999 | 890 | 8.5% |
| $50,000 to $74,999 | 1,539 | 14.7% |
| $75,000 to $99,999 | 1,319 | 12.6% |
| $100,000 to $149,999 | 2,146 | 20.5% |
| $150,000 to $199,999 | 1,497 | 14.3% |
| $200,000+ | 1,822 | 17.4% |
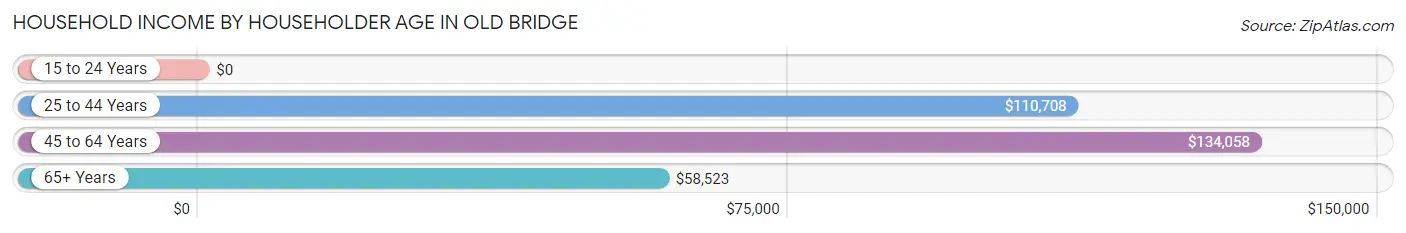
Household Income by Householder Age in Old Bridge
The median household income in Old Bridge is $104,712, with the highest median household income of $134,058 found in the 45 to 64 years age bracket for the primary householder. A total of 4,392 households (41.9%) fall into this category. Meanwhile, the 15 to 24 years age bracket for the primary householder has the lowest median household income of $0, with 62 households (0.6%) in this group.
| Income Bracket | # Households | Median Income |
| 15 to 24 Years | 62 (0.6%) | $0 |
| 25 to 44 Years | 3,005 (28.7%) | $110,708 |
| 45 to 64 Years | 4,392 (41.9%) | $134,058 |
| 65+ Years | 3,010 (28.7%) | $58,523 |
| Total | 10,469 (100.0%) | $104,712 |
Poverty in Old Bridge
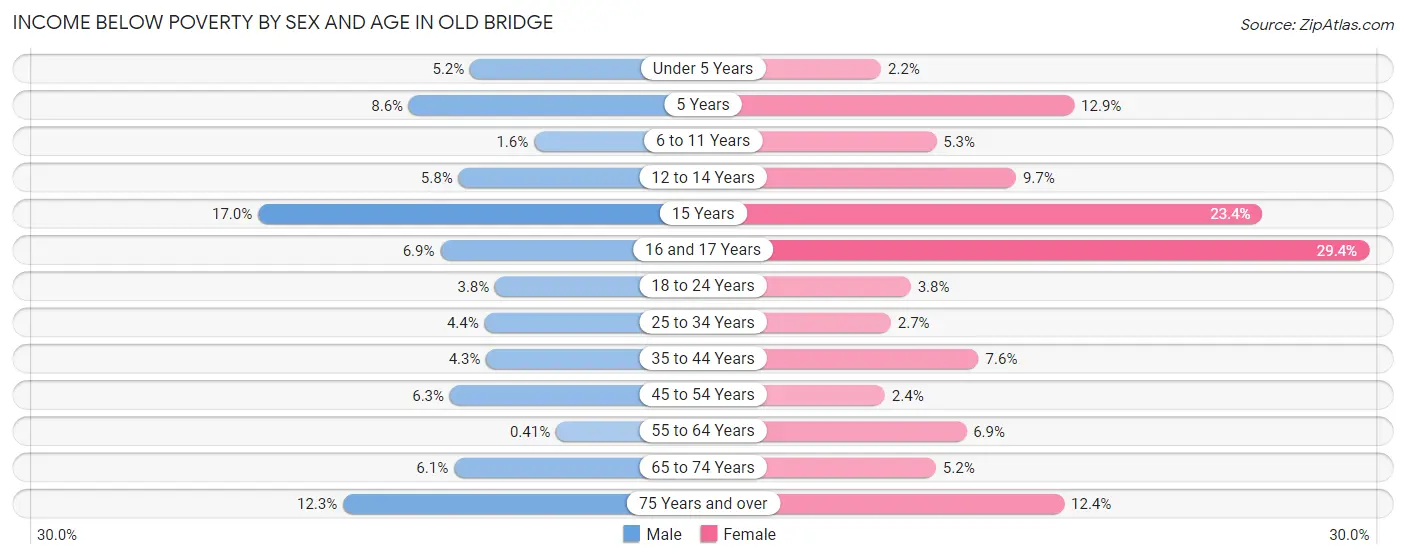
Income Below Poverty by Sex and Age in Old Bridge
With 4.9% poverty level for males and 6.6% for females among the residents of Old Bridge, 15 year old males and 16 and 17 year old females are the most vulnerable to poverty, with 34 males (17.0%) and 118 females (29.3%) in their respective age groups living below the poverty level.
| Age Bracket | Male | Female |
| Under 5 Years | 32 (5.2%) | 11 (2.2%) |
| 5 Years | 8 (8.6%) | 11 (12.9%) |
| 6 to 11 Years | 12 (1.6%) | 44 (5.3%) |
| 12 to 14 Years | 34 (5.8%) | 58 (9.7%) |
| 15 Years | 34 (17.0%) | 37 (23.4%) |
| 16 and 17 Years | 37 (6.9%) | 118 (29.3%) |
| 18 to 24 Years | 36 (3.8%) | 47 (3.8%) |
| 25 to 34 Years | 81 (4.4%) | 48 (2.7%) |
| 35 to 44 Years | 71 (4.3%) | 137 (7.6%) |
| 45 to 54 Years | 111 (6.3%) | 45 (2.4%) |
| 55 to 64 Years | 9 (0.4%) | 153 (6.9%) |
| 65 to 74 Years | 90 (6.1%) | 83 (5.2%) |
| 75 Years and over | 111 (12.3%) | 150 (12.4%) |
| Total | 666 (4.9%) | 942 (6.6%) |
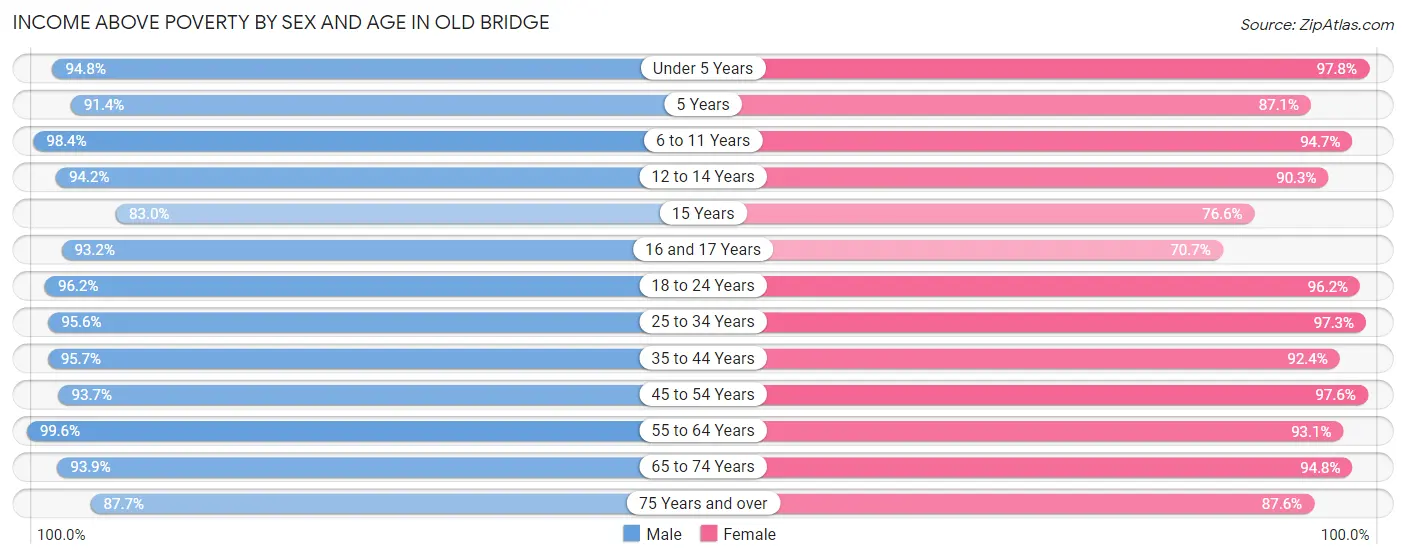
Income Above Poverty by Sex and Age in Old Bridge
According to the poverty statistics in Old Bridge, males aged 55 to 64 years and females aged under 5 years are the age groups that are most secure financially, with 99.6% of males and 97.8% of females in these age groups living above the poverty line.
| Age Bracket | Male | Female |
| Under 5 Years | 585 (94.8%) | 491 (97.8%) |
| 5 Years | 85 (91.4%) | 74 (87.1%) |
| 6 to 11 Years | 726 (98.4%) | 793 (94.7%) |
| 12 to 14 Years | 548 (94.2%) | 540 (90.3%) |
| 15 Years | 166 (83.0%) | 121 (76.6%) |
| 16 and 17 Years | 503 (93.1%) | 284 (70.7%) |
| 18 to 24 Years | 911 (96.2%) | 1,176 (96.2%) |
| 25 to 34 Years | 1,764 (95.6%) | 1,711 (97.3%) |
| 35 to 44 Years | 1,583 (95.7%) | 1,662 (92.4%) |
| 45 to 54 Years | 1,645 (93.7%) | 1,828 (97.6%) |
| 55 to 64 Years | 2,212 (99.6%) | 2,054 (93.1%) |
| 65 to 74 Years | 1,389 (93.9%) | 1,502 (94.8%) |
| 75 Years and over | 794 (87.7%) | 1,062 (87.6%) |
| Total | 12,911 (95.1%) | 13,298 (93.4%) |
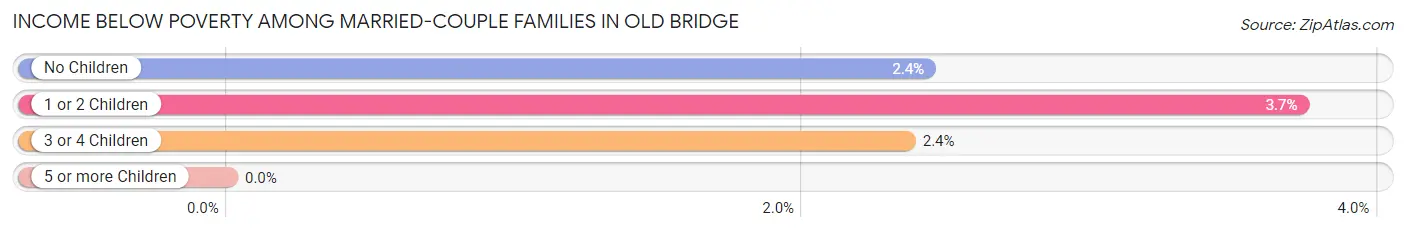
Income Below Poverty Among Married-Couple Families in Old Bridge
The poverty statistics for married-couple families in Old Bridge show that 2.9% or 179 of the total 6,261 families live below the poverty line. Families with 1 or 2 children have the highest poverty rate of 3.7%, comprising of 78 families. On the other hand, families with 5 or more children have the lowest poverty rate of 0.0%, which includes 0 families.
| Children | Above Poverty | Below Poverty |
| No Children | 3,647 (97.6%) | 91 (2.4%) |
| 1 or 2 Children | 2,012 (96.3%) | 78 (3.7%) |
| 3 or 4 Children | 414 (97.6%) | 10 (2.4%) |
| 5 or more Children | 9 (100.0%) | 0 (0.0%) |
| Total | 6,082 (97.1%) | 179 (2.9%) |
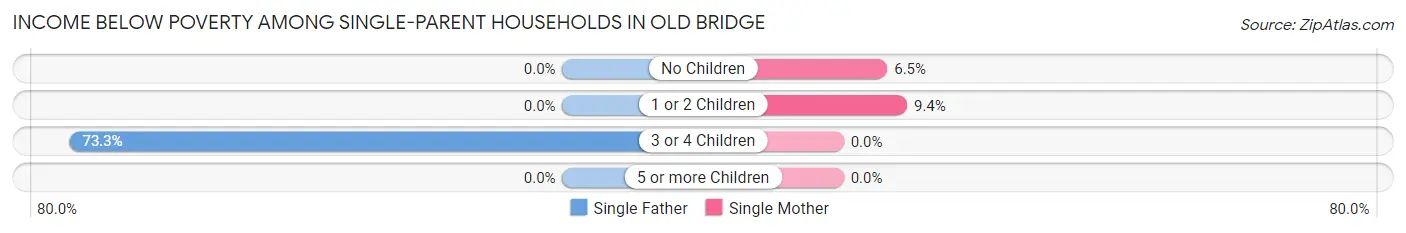
Income Below Poverty Among Single-Parent Households in Old Bridge
According to the poverty data in Old Bridge, 9.5% or 33 single-father households and 7.8% or 65 single-mother households are living below the poverty line. Among single-father households, those with 3 or 4 children have the highest poverty rate, with 33 households (73.3%) experiencing poverty. Likewise, among single-mother households, those with 1 or 2 children have the highest poverty rate, with 39 households (9.4%) falling below the poverty line.
| Children | Single Father | Single Mother |
| No Children | 0 (0.0%) | 26 (6.5%) |
| 1 or 2 Children | 0 (0.0%) | 39 (9.4%) |
| 3 or 4 Children | 33 (73.3%) | 0 (0.0%) |
| 5 or more Children | 0 (0.0%) | 0 (0.0%) |
| Total | 33 (9.5%) | 65 (7.8%) |
Income Below Poverty Among Married-Couple vs Single-Parent Households in Old Bridge
The poverty data for Old Bridge shows that 179 of the married-couple family households (2.9%) and 98 of the single-parent households (8.3%) are living below the poverty level. Within the married-couple family households, those with 1 or 2 children have the highest poverty rate, with 78 households (3.7%) falling below the poverty line. Among the single-parent households, those with 3 or 4 children have the highest poverty rate, with 33 household (49.2%) living below poverty.
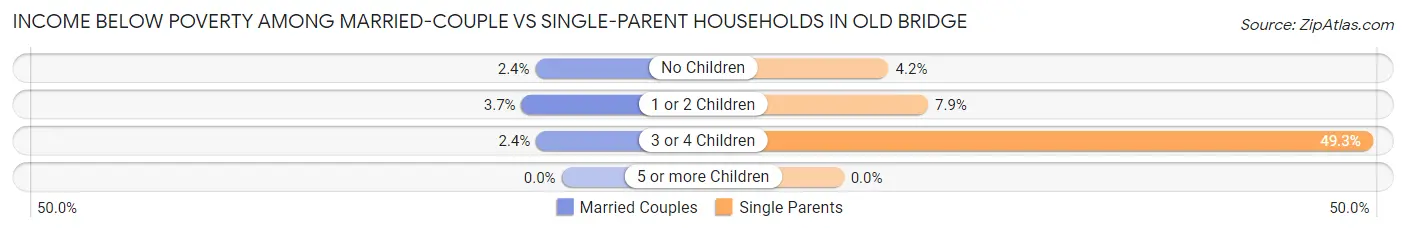
| Children | Married-Couple Families | Single-Parent Households |
| No Children | 91 (2.4%) | 26 (4.2%) |
| 1 or 2 Children | 78 (3.7%) | 39 (7.9%) |
| 3 or 4 Children | 10 (2.4%) | 33 (49.2%) |
| 5 or more Children | 0 (0.0%) | 0 (0.0%) |
| Total | 179 (2.9%) | 98 (8.3%) |
Employment Characteristics in Old Bridge
Employment by Class of Employer in Old Bridge
Among the 14,301 employed individuals in Old Bridge, private company employees (9,625 | 67.3%), local government employees (1,569 | 11.0%), and not-for-profit organizations (1,247 | 8.7%) make up the most common classes of employment.
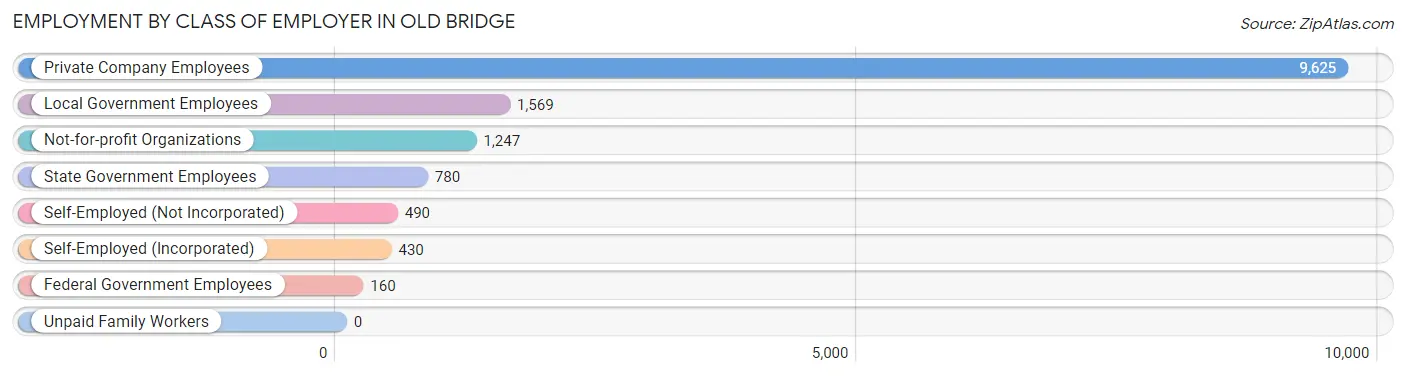
| Employer Class | # Employees | % Employees |
| Private Company Employees | 9,625 | 67.3% |
| Self-Employed (Incorporated) | 430 | 3.0% |
| Self-Employed (Not Incorporated) | 490 | 3.4% |
| Not-for-profit Organizations | 1,247 | 8.7% |
| Local Government Employees | 1,569 | 11.0% |
| State Government Employees | 780 | 5.4% |
| Federal Government Employees | 160 | 1.1% |
| Unpaid Family Workers | 0 | 0.0% |
| Total | 14,301 | 100.0% |
Employment Status by Age in Old Bridge
According to the labor force statistics for Old Bridge, out of the total population over 16 years of age (23,553), 67.6% or 15,922 individuals are in the labor force, with 6.9% or 1,099 of them unemployed. The age group with the highest labor force participation rate is 25 to 29 years, with 95.5% or 1,813 individuals in the labor force. Within the labor force, the 16 to 19 years age range has the highest percentage of unemployed individuals, with 34.8% or 184 of them being unemployed.
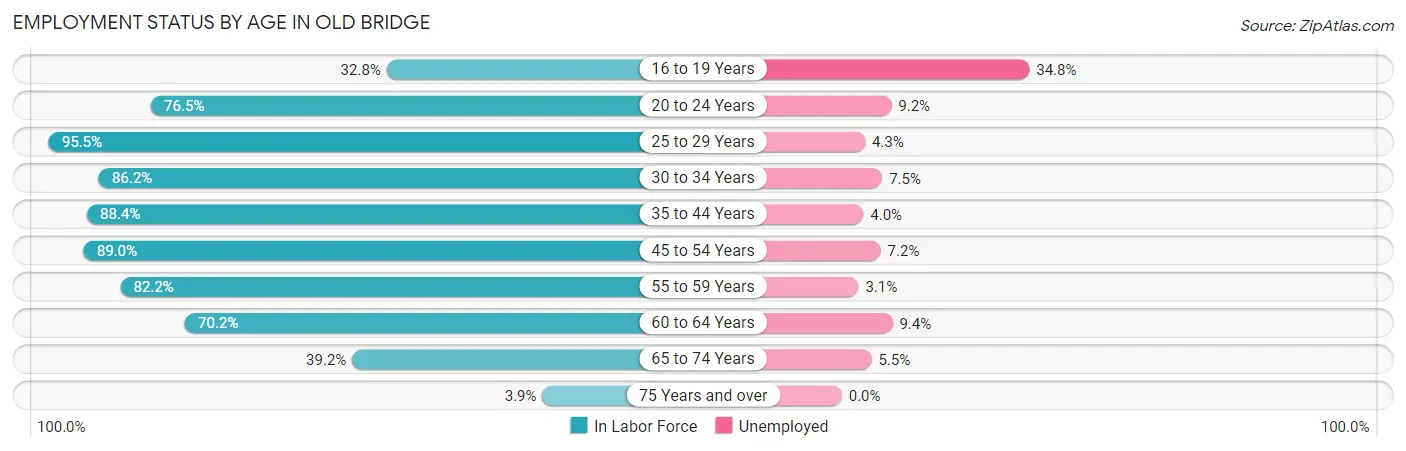
| Age Bracket | In Labor Force | Unemployed |
| 16 to 19 Years | 530 (32.8%) | 184 (34.8%) |
| 20 to 24 Years | 1,144 (76.5%) | 105 (9.2%) |
| 25 to 29 Years | 1,813 (95.5%) | 78 (4.3%) |
| 30 to 34 Years | 1,471 (86.2%) | 110 (7.5%) |
| 35 to 44 Years | 3,052 (88.4%) | 122 (4.0%) |
| 45 to 54 Years | 3,230 (89.0%) | 233 (7.2%) |
| 55 to 59 Years | 1,946 (82.2%) | 60 (3.1%) |
| 60 to 64 Years | 1,450 (70.2%) | 136 (9.4%) |
| 65 to 74 Years | 1,209 (39.2%) | 66 (5.5%) |
| 75 Years and over | 87 (3.9%) | 0 (0.0%) |
| Total | 15,922 (67.6%) | 1,099 (6.9%) |
Employment Status by Educational Attainment in Old Bridge
According to labor force statistics for Old Bridge, 85.7% of individuals (12,957) out of the total population between 25 and 64 years of age (15,119) are in the labor force, with 5.7% or 739 of them being unemployed. The group with the highest labor force participation rate are those with the educational attainment of bachelor's degree or higher, with 91.8% or 5,721 individuals in the labor force. Within the labor force, individuals with less than high school education have the highest percentage of unemployment, with 11.9% or 59 of them being unemployed.
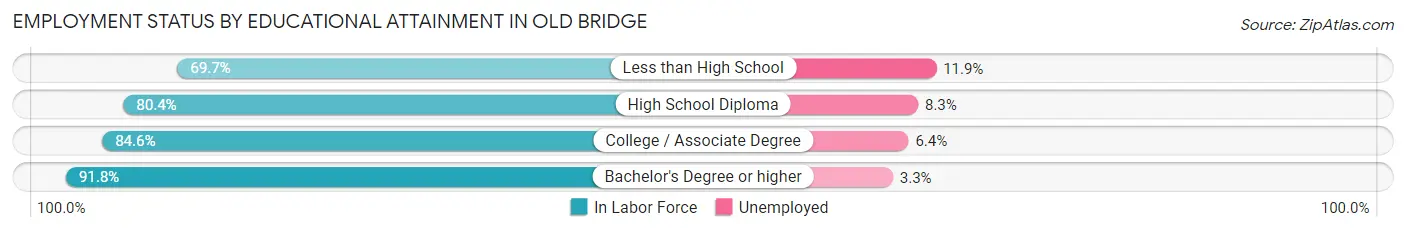
| Educational Attainment | In Labor Force | Unemployed |
| Less than High School | 494 (69.7%) | 84 (11.9%) |
| High School Diploma | 3,389 (80.4%) | 350 (8.3%) |
| College / Associate Degree | 3,353 (84.6%) | 254 (6.4%) |
| Bachelor's Degree or higher | 5,721 (91.8%) | 206 (3.3%) |
| Total | 12,957 (85.7%) | 862 (5.7%) |
Employment Occupations by Sex in Old Bridge
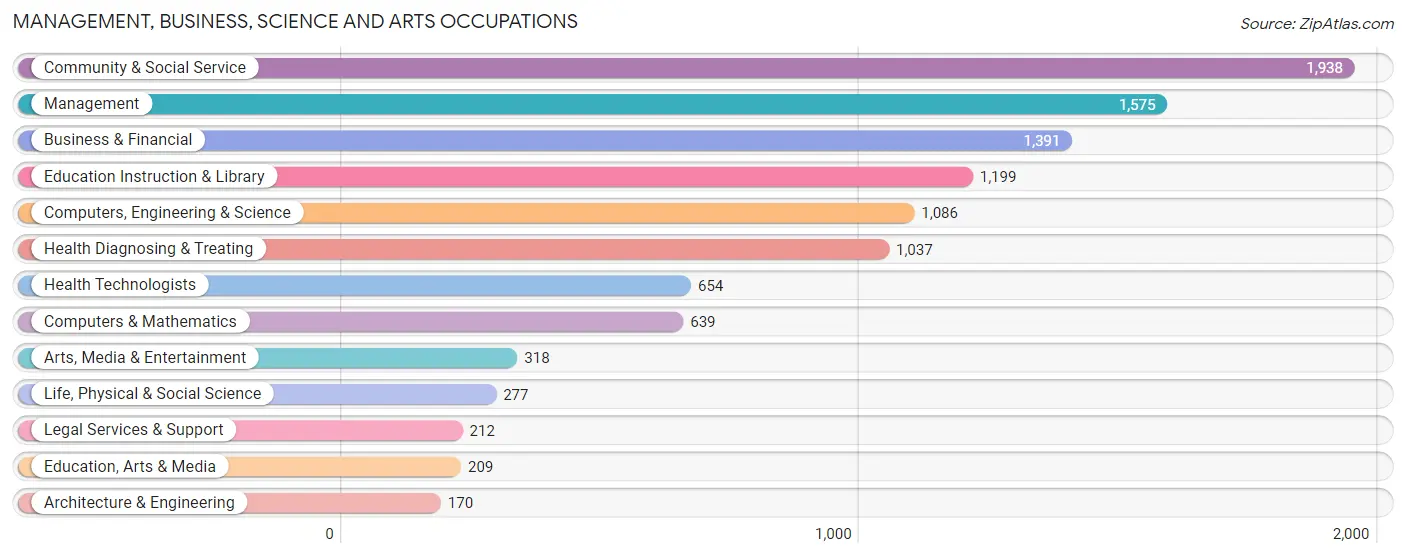
Management, Business, Science and Arts Occupations
The most common Management, Business, Science and Arts occupations in Old Bridge are Community & Social Service (1,938 | 13.1%), Management (1,575 | 10.6%), Business & Financial (1,391 | 9.4%), Education Instruction & Library (1,199 | 8.1%), and Computers, Engineering & Science (1,086 | 7.3%).
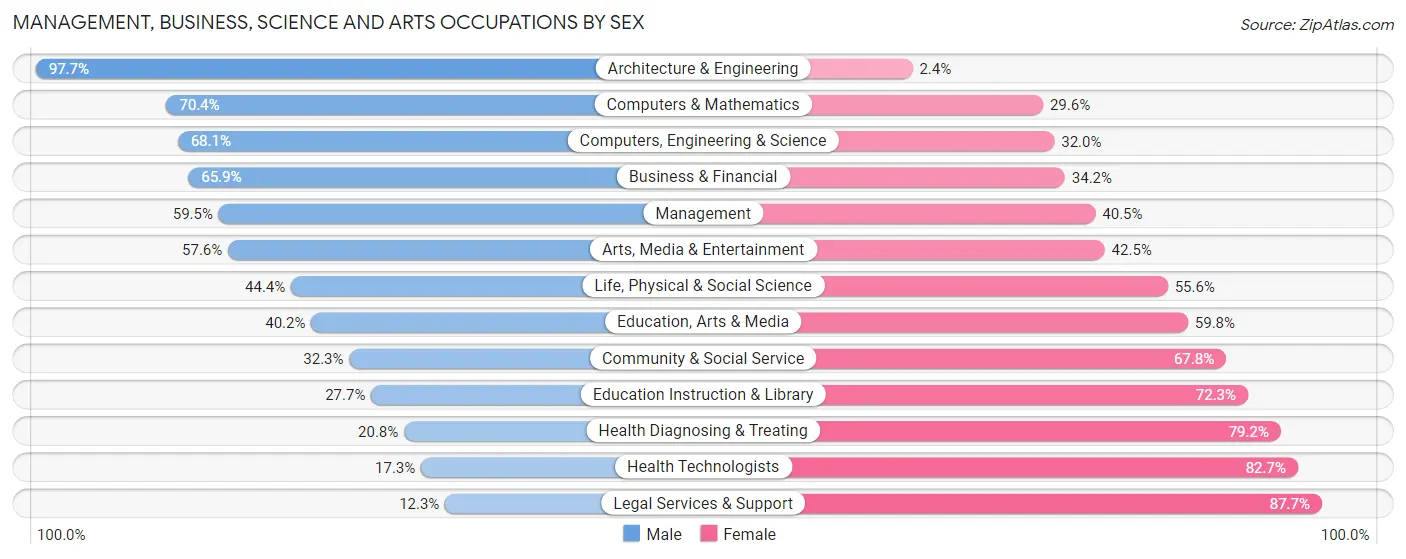
Management, Business, Science and Arts Occupations by Sex
Within the Management, Business, Science and Arts occupations in Old Bridge, the most male-oriented occupations are Architecture & Engineering (97.7%), Computers & Mathematics (70.4%), and Computers, Engineering & Science (68.0%), while the most female-oriented occupations are Legal Services & Support (87.7%), Health Technologists (82.7%), and Health Diagnosing & Treating (79.2%).
| Occupation | Male | Female |
| Management | 937 (59.5%) | 638 (40.5%) |
| Business & Financial | 916 (65.8%) | 475 (34.2%) |
| Computers, Engineering & Science | 739 (68.0%) | 347 (32.0%) |
| Computers & Mathematics | 450 (70.4%) | 189 (29.6%) |
| Architecture & Engineering | 166 (97.7%) | 4 (2.4%) |
| Life, Physical & Social Science | 123 (44.4%) | 154 (55.6%) |
| Community & Social Service | 625 (32.3%) | 1,313 (67.7%) |
| Education, Arts & Media | 84 (40.2%) | 125 (59.8%) |
| Legal Services & Support | 26 (12.3%) | 186 (87.7%) |
| Education Instruction & Library | 332 (27.7%) | 867 (72.3%) |
| Arts, Media & Entertainment | 183 (57.6%) | 135 (42.4%) |
| Health Diagnosing & Treating | 216 (20.8%) | 821 (79.2%) |
| Health Technologists | 113 (17.3%) | 541 (82.7%) |
| Total (Category) | 3,433 (48.8%) | 3,594 (51.1%) |
| Total (Overall) | 7,599 (51.3%) | 7,210 (48.7%) |
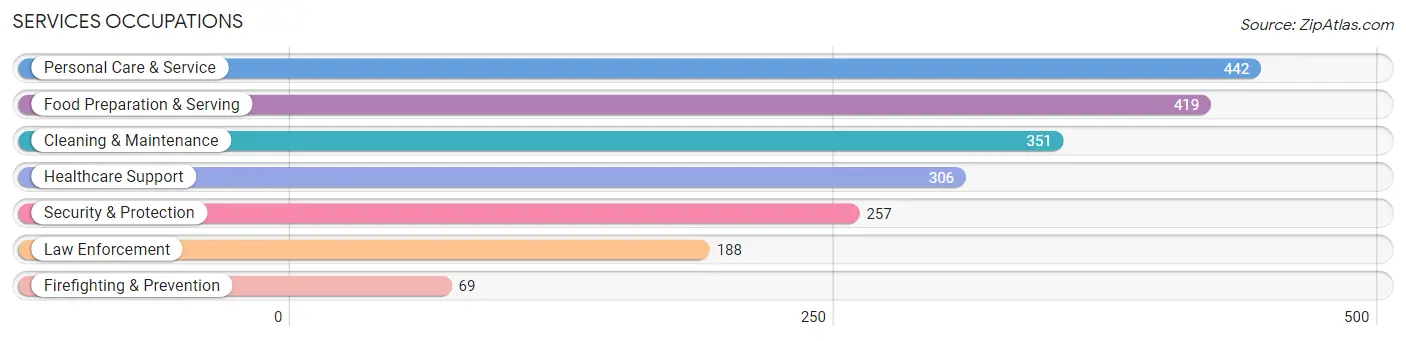
Services Occupations
The most common Services occupations in Old Bridge are Personal Care & Service (442 | 3.0%), Food Preparation & Serving (419 | 2.8%), Cleaning & Maintenance (351 | 2.4%), Healthcare Support (306 | 2.1%), and Security & Protection (257 | 1.7%).
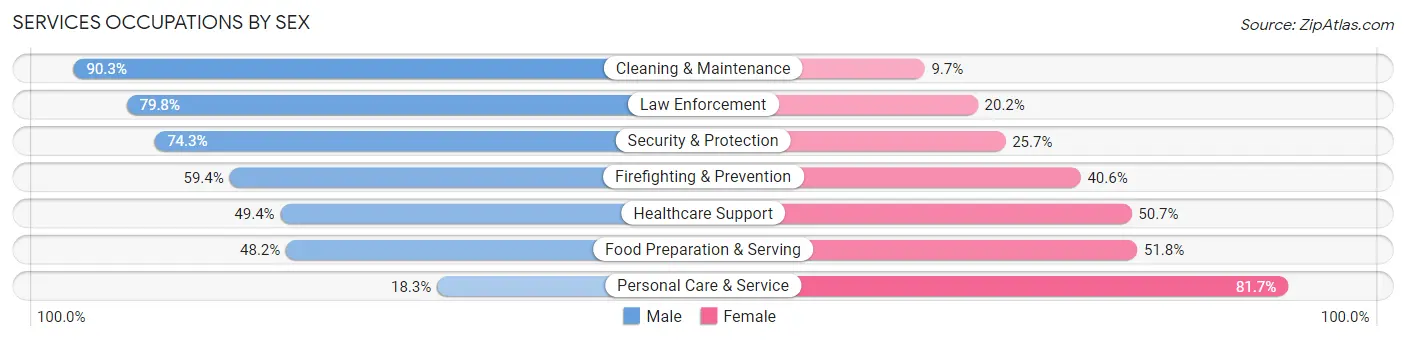
Services Occupations by Sex
Within the Services occupations in Old Bridge, the most male-oriented occupations are Cleaning & Maintenance (90.3%), Law Enforcement (79.8%), and Security & Protection (74.3%), while the most female-oriented occupations are Personal Care & Service (81.7%), Food Preparation & Serving (51.8%), and Healthcare Support (50.6%).
| Occupation | Male | Female |
| Healthcare Support | 151 (49.3%) | 155 (50.6%) |
| Security & Protection | 191 (74.3%) | 66 (25.7%) |
| Firefighting & Prevention | 41 (59.4%) | 28 (40.6%) |
| Law Enforcement | 150 (79.8%) | 38 (20.2%) |
| Food Preparation & Serving | 202 (48.2%) | 217 (51.8%) |
| Cleaning & Maintenance | 317 (90.3%) | 34 (9.7%) |
| Personal Care & Service | 81 (18.3%) | 361 (81.7%) |
| Total (Category) | 942 (53.1%) | 833 (46.9%) |
| Total (Overall) | 7,599 (51.3%) | 7,210 (48.7%) |
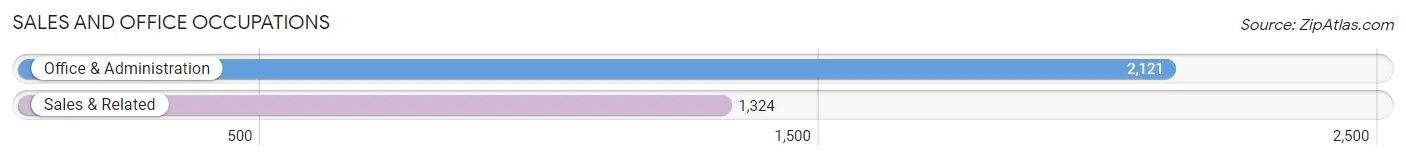
Sales and Office Occupations
The most common Sales and Office occupations in Old Bridge are Office & Administration (2,121 | 14.3%), and Sales & Related (1,324 | 8.9%).
Sales and Office Occupations by Sex
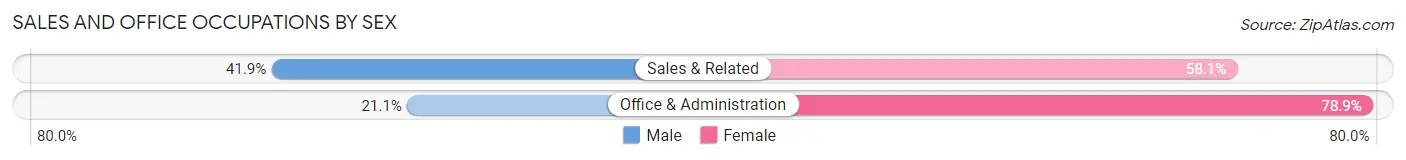
| Occupation | Male | Female |
| Sales & Related | 555 (41.9%) | 769 (58.1%) |
| Office & Administration | 447 (21.1%) | 1,674 (78.9%) |
| Total (Category) | 1,002 (29.1%) | 2,443 (70.9%) |
| Total (Overall) | 7,599 (51.3%) | 7,210 (48.7%) |
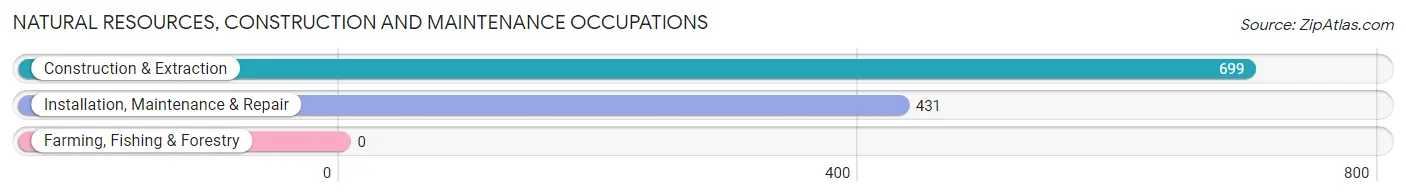
Natural Resources, Construction and Maintenance Occupations
The most common Natural Resources, Construction and Maintenance occupations in Old Bridge are Construction & Extraction (699 | 4.7%), and Installation, Maintenance & Repair (431 | 2.9%).
Natural Resources, Construction and Maintenance Occupations by Sex
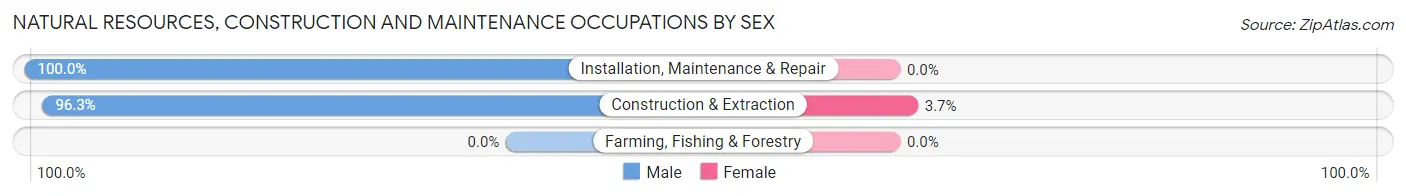
| Occupation | Male | Female |
| Farming, Fishing & Forestry | 0 (0.0%) | 0 (0.0%) |
| Construction & Extraction | 673 (96.3%) | 26 (3.7%) |
| Installation, Maintenance & Repair | 431 (100.0%) | 0 (0.0%) |
| Total (Category) | 1,104 (97.7%) | 26 (2.3%) |
| Total (Overall) | 7,599 (51.3%) | 7,210 (48.7%) |
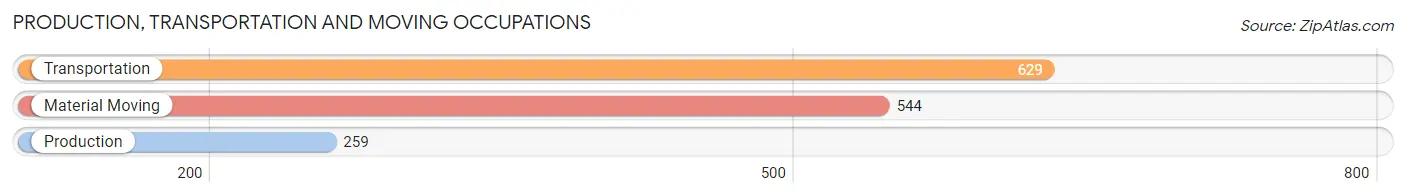
Production, Transportation and Moving Occupations
The most common Production, Transportation and Moving occupations in Old Bridge are Transportation (629 | 4.3%), Material Moving (544 | 3.7%), and Production (259 | 1.8%).
Production, Transportation and Moving Occupations by Sex
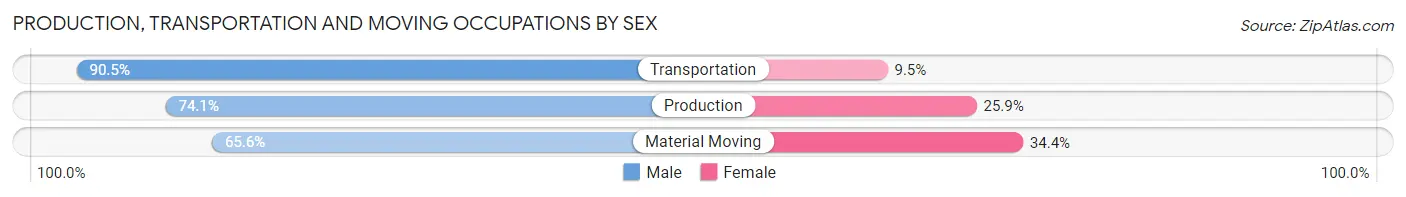
| Occupation | Male | Female |
| Production | 192 (74.1%) | 67 (25.9%) |
| Transportation | 569 (90.5%) | 60 (9.5%) |
| Material Moving | 357 (65.6%) | 187 (34.4%) |
| Total (Category) | 1,118 (78.1%) | 314 (21.9%) |
| Total (Overall) | 7,599 (51.3%) | 7,210 (48.7%) |
Employment Industries by Sex in Old Bridge
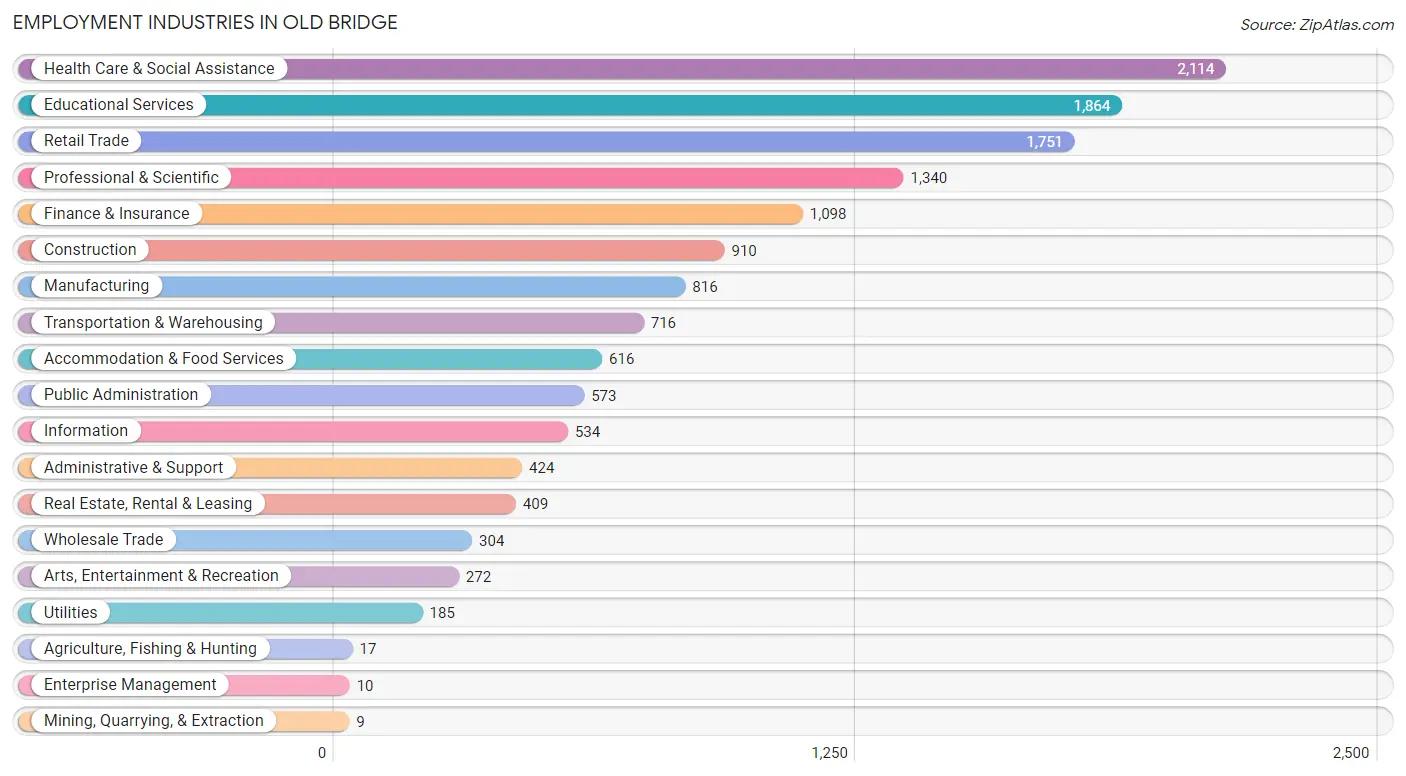
Employment Industries in Old Bridge
The major employment industries in Old Bridge include Health Care & Social Assistance (2,114 | 14.3%), Educational Services (1,864 | 12.6%), Retail Trade (1,751 | 11.8%), Professional & Scientific (1,340 | 9.0%), and Finance & Insurance (1,098 | 7.4%).
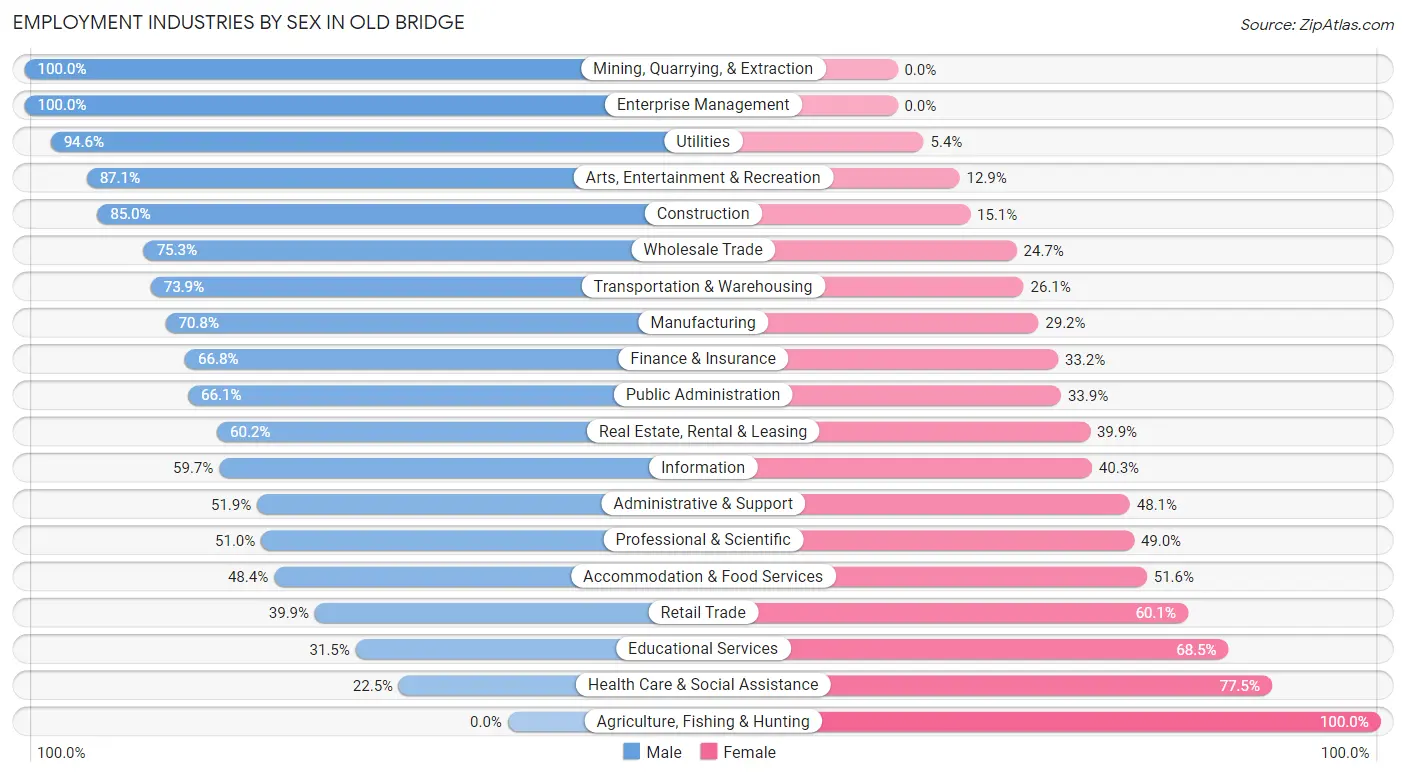
Employment Industries by Sex in Old Bridge
The Old Bridge industries that see more men than women are Mining, Quarrying, & Extraction (100.0%), Enterprise Management (100.0%), and Utilities (94.6%), whereas the industries that tend to have a higher number of women are Agriculture, Fishing & Hunting (100.0%), Health Care & Social Assistance (77.5%), and Educational Services (68.5%).
| Industry | Male | Female |
| Agriculture, Fishing & Hunting | 0 (0.0%) | 17 (100.0%) |
| Mining, Quarrying, & Extraction | 9 (100.0%) | 0 (0.0%) |
| Construction | 773 (85.0%) | 137 (15.0%) |
| Manufacturing | 578 (70.8%) | 238 (29.2%) |
| Wholesale Trade | 229 (75.3%) | 75 (24.7%) |
| Retail Trade | 699 (39.9%) | 1,052 (60.1%) |
| Transportation & Warehousing | 529 (73.9%) | 187 (26.1%) |
| Utilities | 175 (94.6%) | 10 (5.4%) |
| Information | 319 (59.7%) | 215 (40.3%) |
| Finance & Insurance | 733 (66.8%) | 365 (33.2%) |
| Real Estate, Rental & Leasing | 246 (60.2%) | 163 (39.9%) |
| Professional & Scientific | 684 (51.0%) | 656 (49.0%) |
| Enterprise Management | 10 (100.0%) | 0 (0.0%) |
| Administrative & Support | 220 (51.9%) | 204 (48.1%) |
| Educational Services | 587 (31.5%) | 1,277 (68.5%) |
| Health Care & Social Assistance | 476 (22.5%) | 1,638 (77.5%) |
| Arts, Entertainment & Recreation | 237 (87.1%) | 35 (12.9%) |
| Accommodation & Food Services | 298 (48.4%) | 318 (51.6%) |
| Public Administration | 379 (66.1%) | 194 (33.9%) |
| Total | 7,599 (51.3%) | 7,210 (48.7%) |
Education in Old Bridge
School Enrollment in Old Bridge
The most common levels of schooling among the 6,634 students in Old Bridge are college / undergraduate (1,669 | 25.2%), high school (1,565 | 23.6%), and middle school (1,438 | 21.7%).
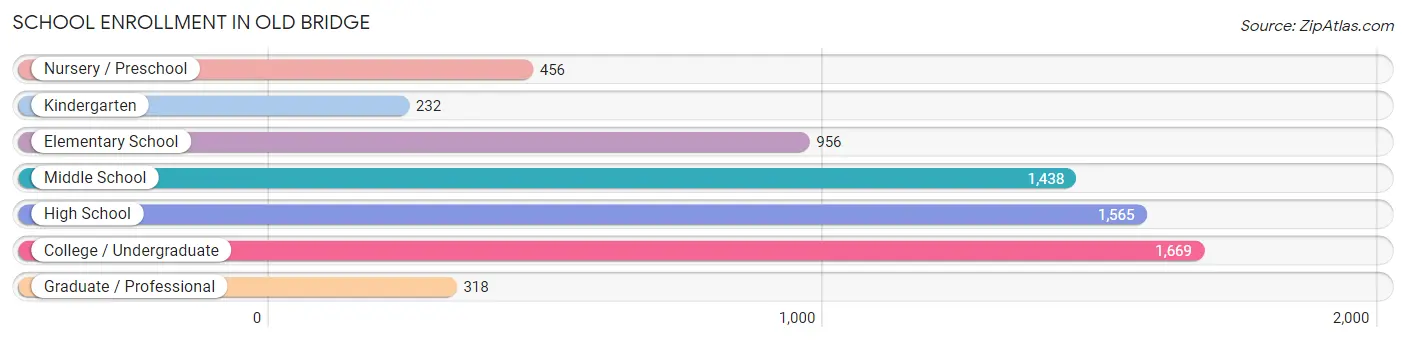
| School Level | # Students | % Students |
| Nursery / Preschool | 456 | 6.9% |
| Kindergarten | 232 | 3.5% |
| Elementary School | 956 | 14.4% |
| Middle School | 1,438 | 21.7% |
| High School | 1,565 | 23.6% |
| College / Undergraduate | 1,669 | 25.2% |
| Graduate / Professional | 318 | 4.8% |
| Total | 6,634 | 100.0% |
School Enrollment by Age by Funding Source in Old Bridge
Out of a total of 6,634 students who are enrolled in schools in Old Bridge, 1,161 (17.5%) attend a private institution, while the remaining 5,473 (82.5%) are enrolled in public schools. The age group of 3 to 4 year olds has the highest likelihood of being enrolled in private schools, with 233 (52.0% in the age bracket) enrolled. Conversely, the age group of 10 to 14 year olds has the lowest likelihood of being enrolled in a private school, with 1,713 (96.3% in the age bracket) attending a public institution.
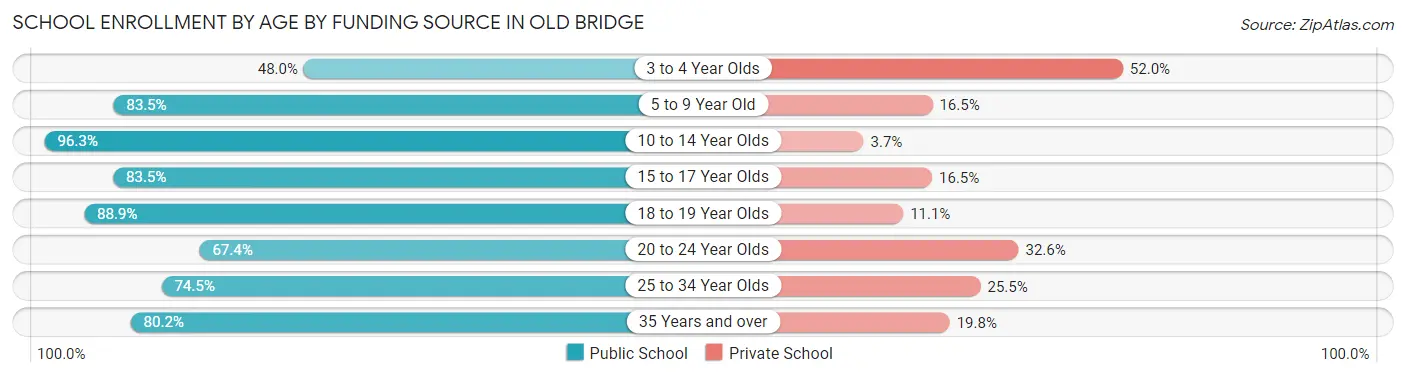
| Age Bracket | Public School | Private School |
| 3 to 4 Year Olds | 215 (48.0%) | 233 (52.0%) |
| 5 to 9 Year Old | 858 (83.5%) | 170 (16.5%) |
| 10 to 14 Year Olds | 1,713 (96.3%) | 66 (3.7%) |
| 15 to 17 Year Olds | 1,055 (83.5%) | 208 (16.5%) |
| 18 to 19 Year Olds | 553 (88.9%) | 69 (11.1%) |
| 20 to 24 Year Olds | 509 (67.4%) | 246 (32.6%) |
| 25 to 34 Year Olds | 298 (74.5%) | 102 (25.5%) |
| 35 Years and over | 272 (80.2%) | 67 (19.8%) |
| Total | 5,473 (82.5%) | 1,161 (17.5%) |
Educational Attainment by Field of Study in Old Bridge
Business (2,047 | 24.6%), education (1,083 | 13.0%), science & technology (835 | 10.0%), engineering (663 | 8.0%), and social sciences (527 | 6.3%) are the most common fields of study among 8,329 individuals in Old Bridge who have obtained a bachelor's degree or higher.
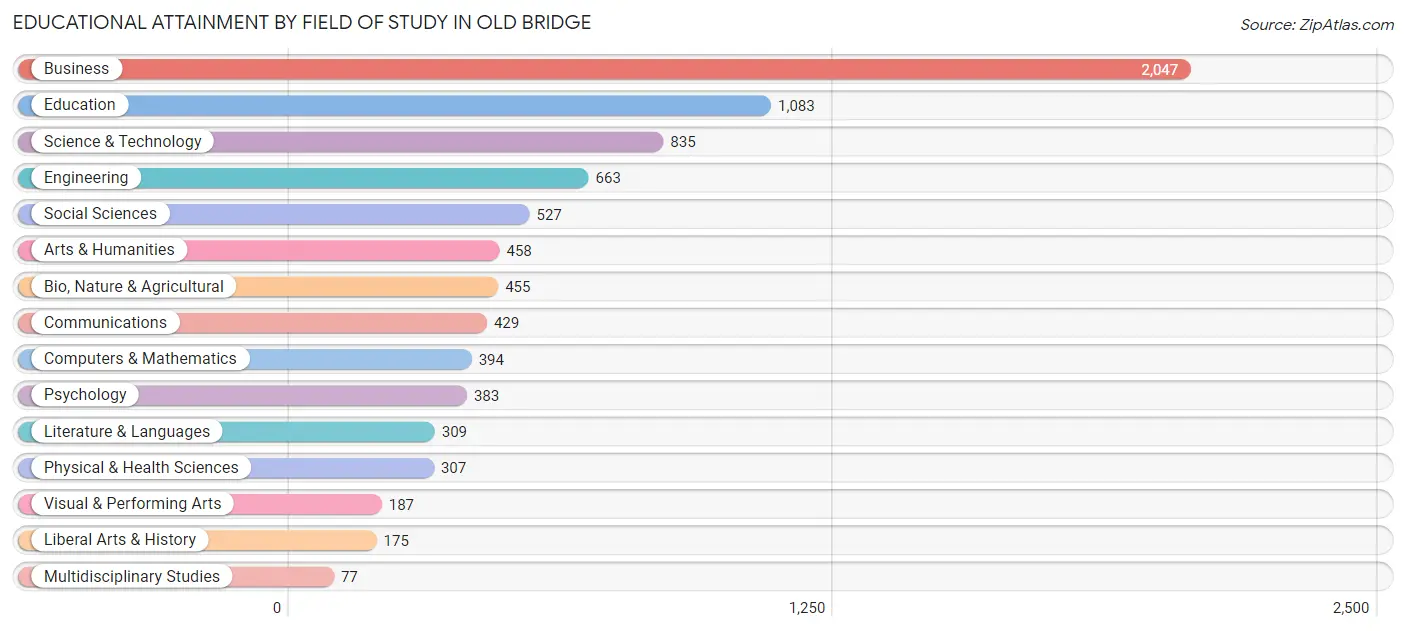
| Field of Study | # Graduates | % Graduates |
| Computers & Mathematics | 394 | 4.7% |
| Bio, Nature & Agricultural | 455 | 5.5% |
| Physical & Health Sciences | 307 | 3.7% |
| Psychology | 383 | 4.6% |
| Social Sciences | 527 | 6.3% |
| Engineering | 663 | 8.0% |
| Multidisciplinary Studies | 77 | 0.9% |
| Science & Technology | 835 | 10.0% |
| Business | 2,047 | 24.6% |
| Education | 1,083 | 13.0% |
| Literature & Languages | 309 | 3.7% |
| Liberal Arts & History | 175 | 2.1% |
| Visual & Performing Arts | 187 | 2.2% |
| Communications | 429 | 5.1% |
| Arts & Humanities | 458 | 5.5% |
| Total | 8,329 | 100.0% |
Transportation & Commute in Old Bridge
Vehicle Availability by Sex in Old Bridge
The most prevalent vehicle ownership categories in Old Bridge are males with 2 vehicles (2,876, accounting for 39.6%) and females with 2 vehicles (2,786, making up 40.9%).
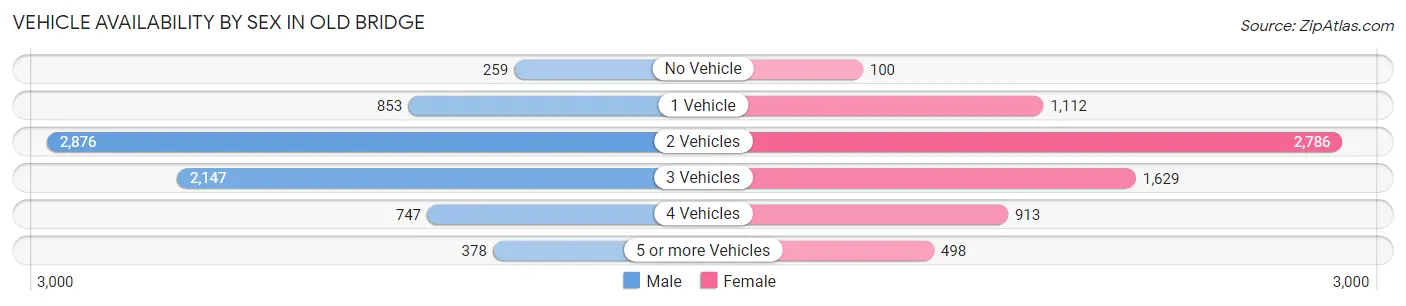
| Vehicles Available | Male | Female |
| No Vehicle | 259 (3.6%) | 100 (1.4%) |
| 1 Vehicle | 853 (11.7%) | 1,112 (15.8%) |
| 2 Vehicles | 2,876 (39.6%) | 2,786 (39.6%) |
| 3 Vehicles | 2,147 (29.6%) | 1,629 (23.2%) |
| 4 Vehicles | 747 (10.3%) | 913 (13.0%) |
| 5 or more Vehicles | 378 (5.2%) | 498 (7.1%) |
| Total | 7,260 (100.0%) | 7,038 (100.0%) |
Commute Time in Old Bridge
The most frequently occuring commute durations in Old Bridge are 30 to 34 minutes (1,709 commuters, 13.3%), 60 to 89 minutes (1,667 commuters, 13.0%), and 45 to 59 minutes (1,564 commuters, 12.2%).
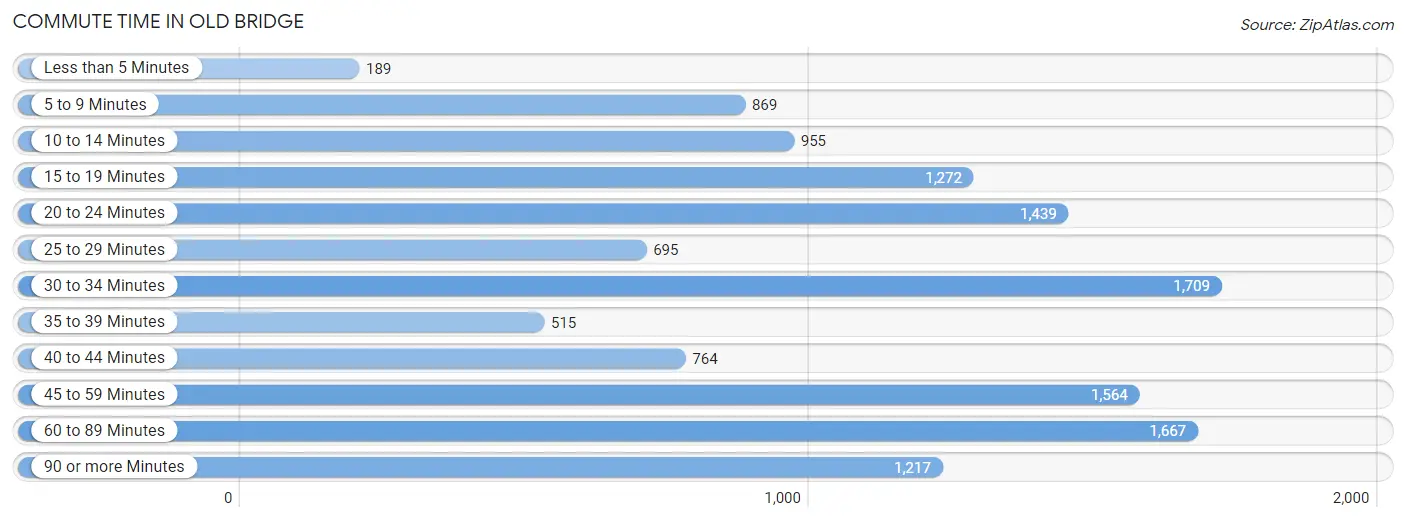
| Commute Time | # Commuters | % Commuters |
| Less than 5 Minutes | 189 | 1.5% |
| 5 to 9 Minutes | 869 | 6.8% |
| 10 to 14 Minutes | 955 | 7.4% |
| 15 to 19 Minutes | 1,272 | 9.9% |
| 20 to 24 Minutes | 1,439 | 11.2% |
| 25 to 29 Minutes | 695 | 5.4% |
| 30 to 34 Minutes | 1,709 | 13.3% |
| 35 to 39 Minutes | 515 | 4.0% |
| 40 to 44 Minutes | 764 | 5.9% |
| 45 to 59 Minutes | 1,564 | 12.2% |
| 60 to 89 Minutes | 1,667 | 13.0% |
| 90 or more Minutes | 1,217 | 9.5% |
Commute Time by Sex in Old Bridge
The most common commute times in Old Bridge are 60 to 89 minutes (1,023 commuters, 15.5%) for males and 30 to 34 minutes (944 commuters, 15.1%) for females.
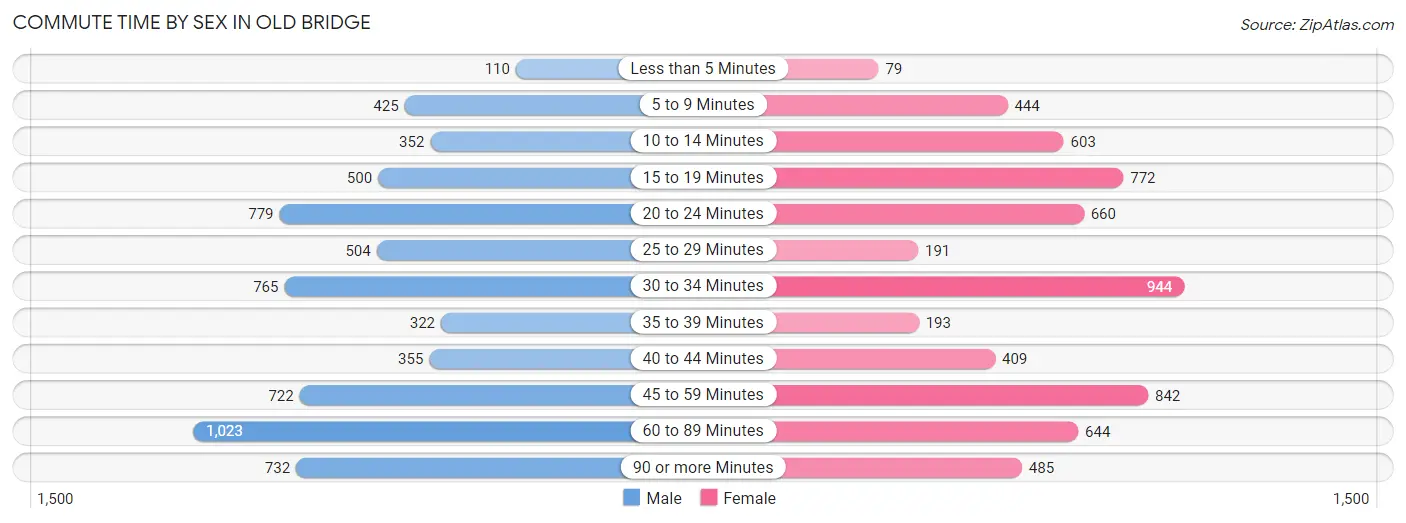
| Commute Time | Male | Female |
| Less than 5 Minutes | 110 (1.7%) | 79 (1.3%) |
| 5 to 9 Minutes | 425 (6.5%) | 444 (7.1%) |
| 10 to 14 Minutes | 352 (5.3%) | 603 (9.6%) |
| 15 to 19 Minutes | 500 (7.6%) | 772 (12.3%) |
| 20 to 24 Minutes | 779 (11.8%) | 660 (10.5%) |
| 25 to 29 Minutes | 504 (7.6%) | 191 (3.0%) |
| 30 to 34 Minutes | 765 (11.6%) | 944 (15.1%) |
| 35 to 39 Minutes | 322 (4.9%) | 193 (3.1%) |
| 40 to 44 Minutes | 355 (5.4%) | 409 (6.5%) |
| 45 to 59 Minutes | 722 (11.0%) | 842 (13.4%) |
| 60 to 89 Minutes | 1,023 (15.5%) | 644 (10.3%) |
| 90 or more Minutes | 732 (11.1%) | 485 (7.7%) |
Time of Departure to Work by Sex in Old Bridge
The most frequent times of departure to work in Old Bridge are 6:30 AM to 6:59 AM (985, 14.9%) for males and 8:00 AM to 8:29 AM (980, 15.6%) for females.
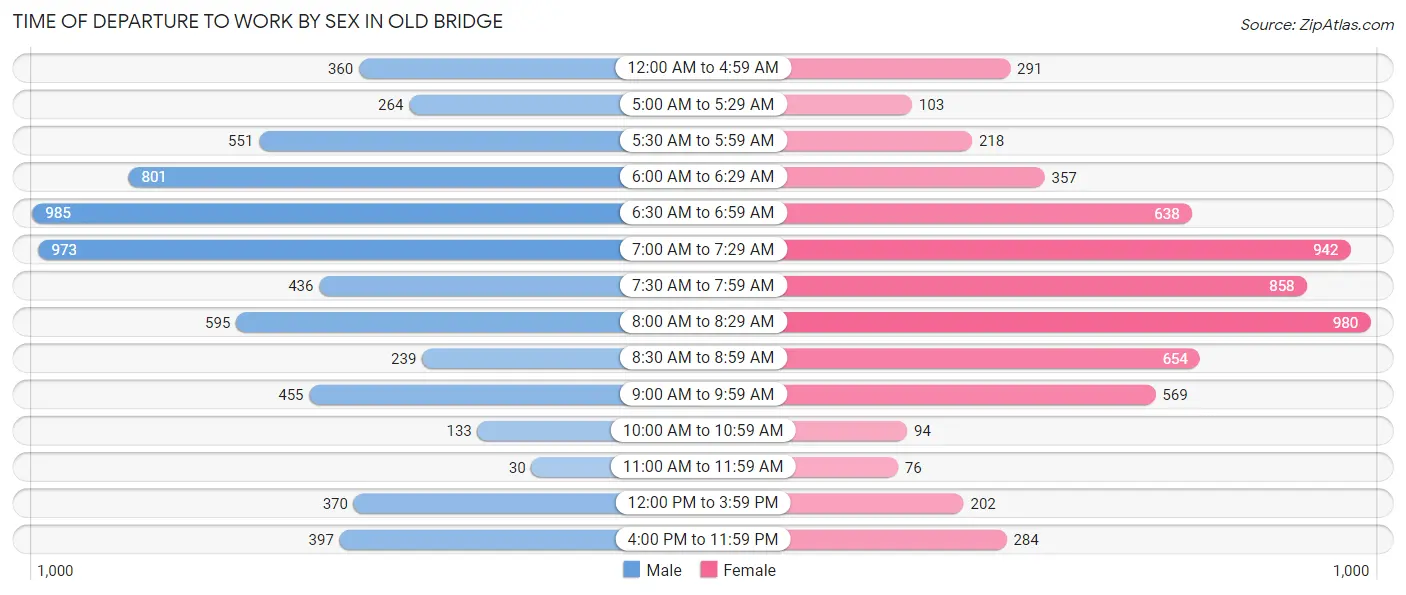
| Time of Departure | Male | Female |
| 12:00 AM to 4:59 AM | 360 (5.5%) | 291 (4.6%) |
| 5:00 AM to 5:29 AM | 264 (4.0%) | 103 (1.6%) |
| 5:30 AM to 5:59 AM | 551 (8.4%) | 218 (3.5%) |
| 6:00 AM to 6:29 AM | 801 (12.2%) | 357 (5.7%) |
| 6:30 AM to 6:59 AM | 985 (14.9%) | 638 (10.2%) |
| 7:00 AM to 7:29 AM | 973 (14.8%) | 942 (15.0%) |
| 7:30 AM to 7:59 AM | 436 (6.6%) | 858 (13.7%) |
| 8:00 AM to 8:29 AM | 595 (9.0%) | 980 (15.6%) |
| 8:30 AM to 8:59 AM | 239 (3.6%) | 654 (10.4%) |
| 9:00 AM to 9:59 AM | 455 (6.9%) | 569 (9.1%) |
| 10:00 AM to 10:59 AM | 133 (2.0%) | 94 (1.5%) |
| 11:00 AM to 11:59 AM | 30 (0.5%) | 76 (1.2%) |
| 12:00 PM to 3:59 PM | 370 (5.6%) | 202 (3.2%) |
| 4:00 PM to 11:59 PM | 397 (6.0%) | 284 (4.5%) |
| Total | 6,589 (100.0%) | 6,266 (100.0%) |
Housing Occupancy in Old Bridge
Occupancy by Ownership in Old Bridge
Of the total 10,469 dwellings in Old Bridge, owner-occupied units account for 7,644 (73.0%), while renter-occupied units make up 2,825 (27.0%).
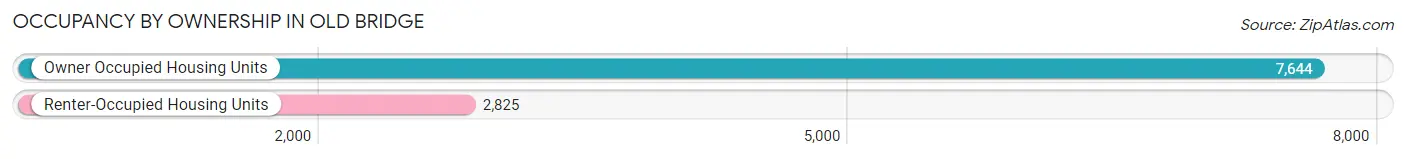
| Occupancy | # Housing Units | % Housing Units |
| Owner Occupied Housing Units | 7,644 | 73.0% |
| Renter-Occupied Housing Units | 2,825 | 27.0% |
| Total Occupied Housing Units | 10,469 | 100.0% |
Occupancy by Household Size in Old Bridge
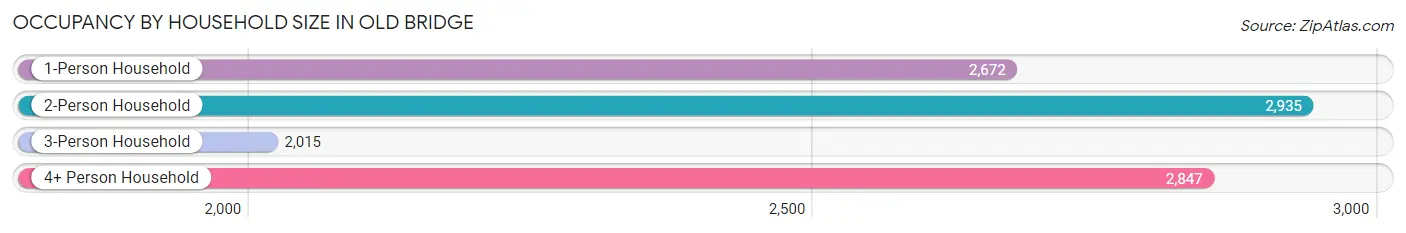
| Household Size | # Housing Units | % Housing Units |
| 1-Person Household | 2,672 | 25.5% |
| 2-Person Household | 2,935 | 28.0% |
| 3-Person Household | 2,015 | 19.3% |
| 4+ Person Household | 2,847 | 27.2% |
| Total Housing Units | 10,469 | 100.0% |
Occupancy by Ownership by Household Size in Old Bridge
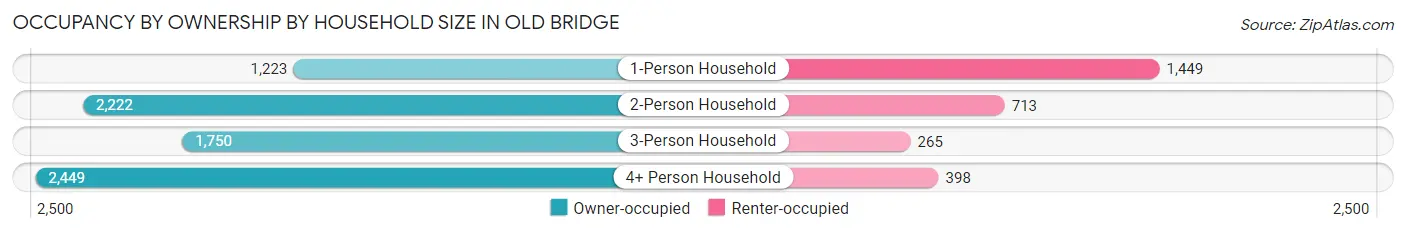
| Household Size | Owner-occupied | Renter-occupied |
| 1-Person Household | 1,223 (45.8%) | 1,449 (54.2%) |
| 2-Person Household | 2,222 (75.7%) | 713 (24.3%) |
| 3-Person Household | 1,750 (86.9%) | 265 (13.2%) |
| 4+ Person Household | 2,449 (86.0%) | 398 (14.0%) |
| Total Housing Units | 7,644 (73.0%) | 2,825 (27.0%) |
Occupancy by Educational Attainment in Old Bridge
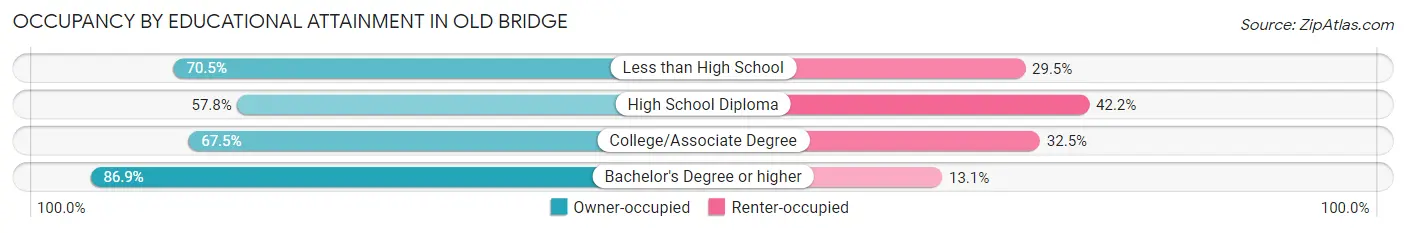
| Household Size | Owner-occupied | Renter-occupied |
| Less than High School | 358 (70.5%) | 150 (29.5%) |
| High School Diploma | 1,664 (57.8%) | 1,216 (42.2%) |
| College/Associate Degree | 1,860 (67.5%) | 894 (32.5%) |
| Bachelor's Degree or higher | 3,762 (86.9%) | 565 (13.1%) |
Occupancy by Age of Householder in Old Bridge
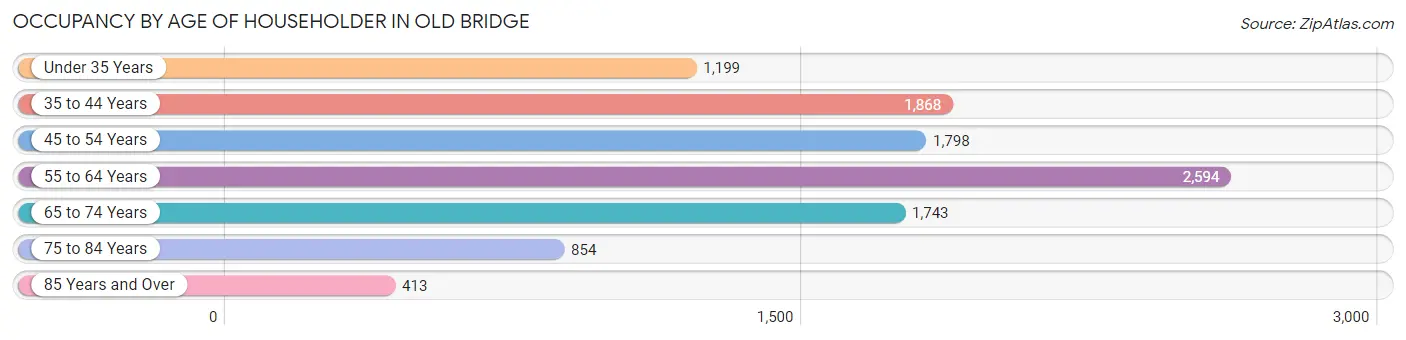
| Age Bracket | # Households | % Households |
| Under 35 Years | 1,199 | 11.5% |
| 35 to 44 Years | 1,868 | 17.8% |
| 45 to 54 Years | 1,798 | 17.2% |
| 55 to 64 Years | 2,594 | 24.8% |
| 65 to 74 Years | 1,743 | 16.7% |
| 75 to 84 Years | 854 | 8.2% |
| 85 Years and Over | 413 | 3.9% |
| Total | 10,469 | 100.0% |
Housing Finances in Old Bridge
Median Income by Occupancy in Old Bridge
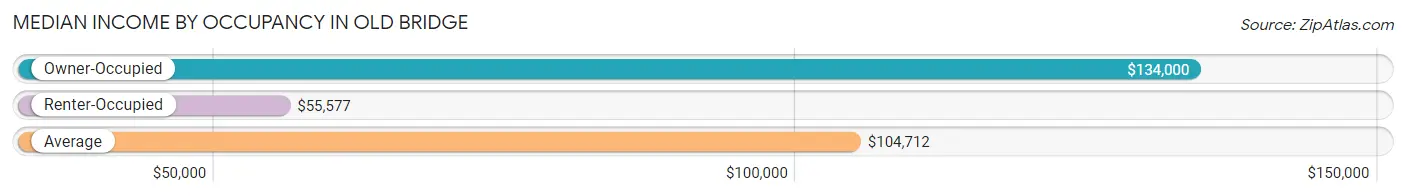
| Occupancy Type | # Households | Median Income |
| Owner-Occupied | 7,644 (73.0%) | $134,000 |
| Renter-Occupied | 2,825 (27.0%) | $55,577 |
| Average | 10,469 (100.0%) | $104,712 |
Occupancy by Householder Income Bracket in Old Bridge
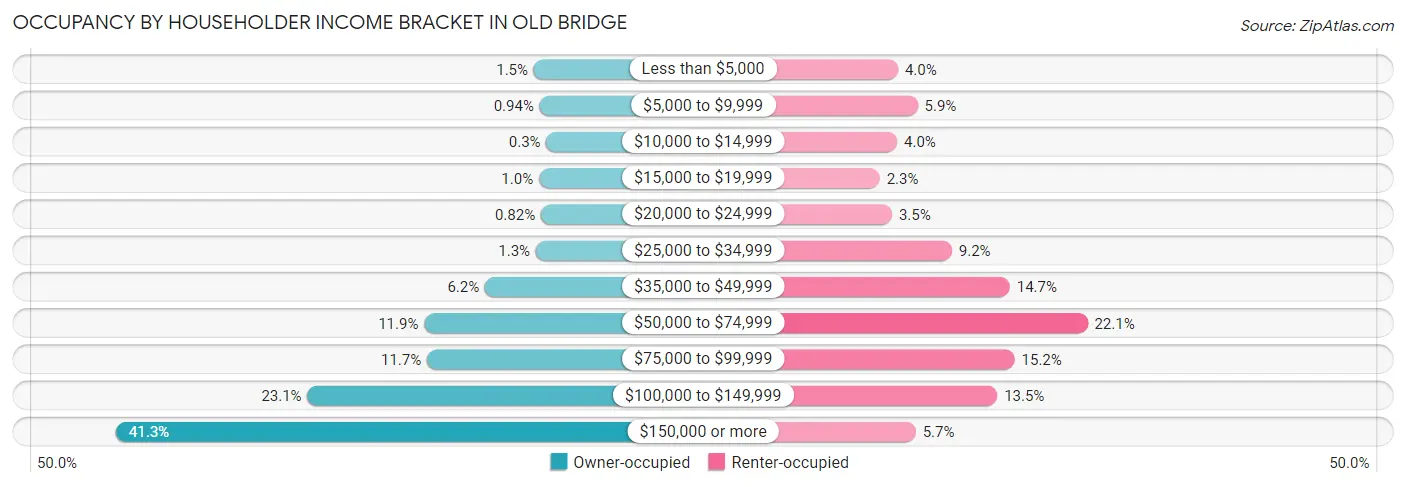
| Income Bracket | Owner-occupied | Renter-occupied |
| Less than $5,000 | 115 (1.5%) | 114 (4.0%) |
| $5,000 to $9,999 | 72 (0.9%) | 167 (5.9%) |
| $10,000 to $14,999 | 23 (0.3%) | 112 (4.0%) |
| $15,000 to $19,999 | 77 (1.0%) | 65 (2.3%) |
| $20,000 to $24,999 | 63 (0.8%) | 98 (3.5%) |
| $25,000 to $34,999 | 99 (1.3%) | 259 (9.2%) |
| $35,000 to $49,999 | 470 (6.1%) | 415 (14.7%) |
| $50,000 to $74,999 | 913 (11.9%) | 624 (22.1%) |
| $75,000 to $99,999 | 892 (11.7%) | 428 (15.1%) |
| $100,000 to $149,999 | 1,763 (23.1%) | 381 (13.5%) |
| $150,000 or more | 3,157 (41.3%) | 162 (5.7%) |
| Total | 7,644 (100.0%) | 2,825 (100.0%) |
Monthly Housing Cost Tiers in Old Bridge
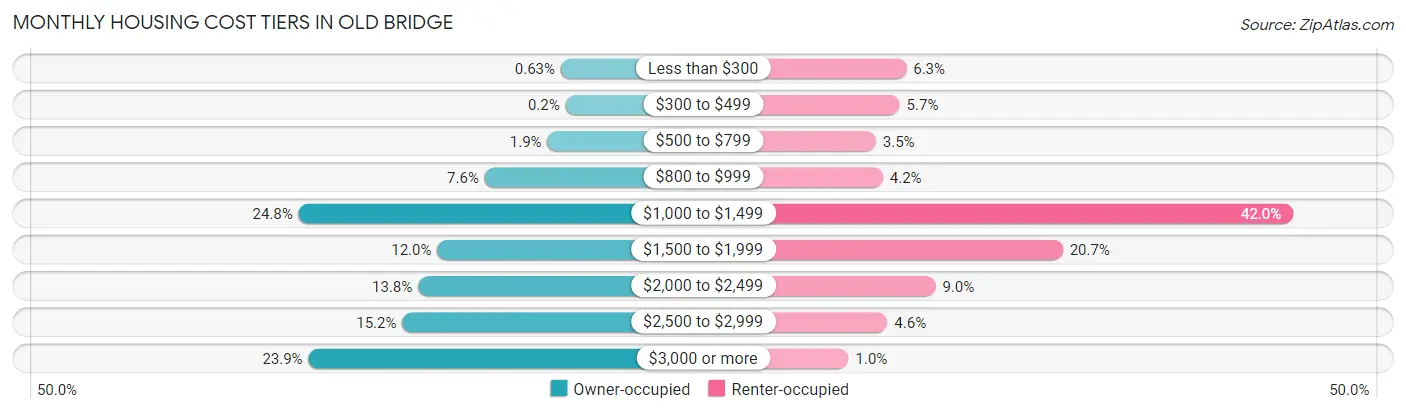
| Monthly Cost | Owner-occupied | Renter-occupied |
| Less than $300 | 48 (0.6%) | 179 (6.3%) |
| $300 to $499 | 15 (0.2%) | 162 (5.7%) |
| $500 to $799 | 143 (1.9%) | 100 (3.5%) |
| $800 to $999 | 584 (7.6%) | 118 (4.2%) |
| $1,000 to $1,499 | 1,894 (24.8%) | 1,185 (41.9%) |
| $1,500 to $1,999 | 918 (12.0%) | 586 (20.7%) |
| $2,000 to $2,499 | 1,053 (13.8%) | 255 (9.0%) |
| $2,500 to $2,999 | 1,164 (15.2%) | 130 (4.6%) |
| $3,000 or more | 1,825 (23.9%) | 29 (1.0%) |
| Total | 7,644 (100.0%) | 2,825 (100.0%) |
Physical Housing Characteristics in Old Bridge
Housing Structures in Old Bridge
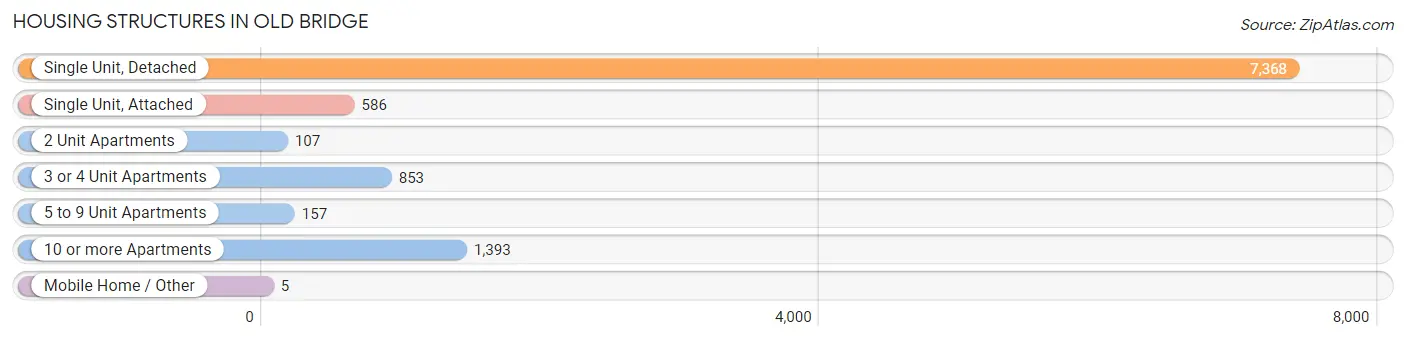
| Structure Type | # Housing Units | % Housing Units |
| Single Unit, Detached | 7,368 | 70.4% |
| Single Unit, Attached | 586 | 5.6% |
| 2 Unit Apartments | 107 | 1.0% |
| 3 or 4 Unit Apartments | 853 | 8.2% |
| 5 to 9 Unit Apartments | 157 | 1.5% |
| 10 or more Apartments | 1,393 | 13.3% |
| Mobile Home / Other | 5 | 0.1% |
| Total | 10,469 | 100.0% |
Housing Structures by Occupancy in Old Bridge
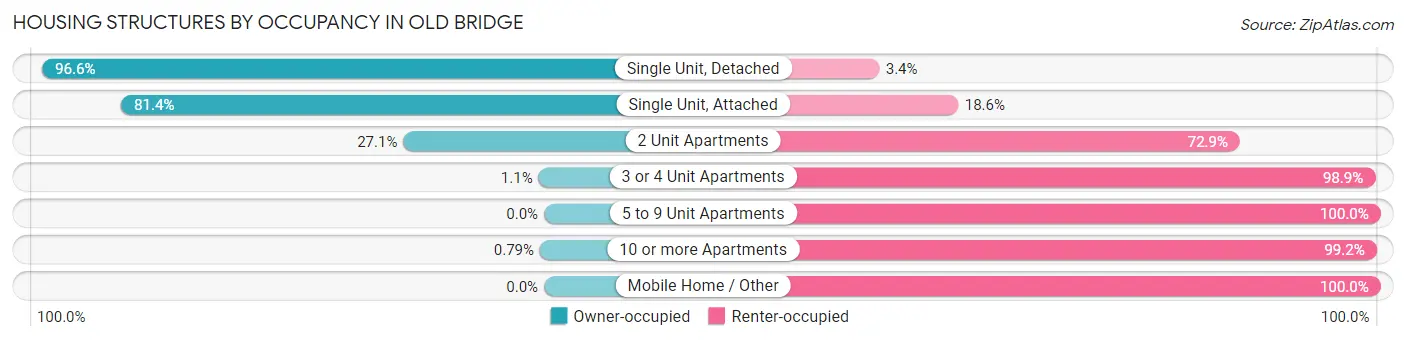
| Structure Type | Owner-occupied | Renter-occupied |
| Single Unit, Detached | 7,118 (96.6%) | 250 (3.4%) |
| Single Unit, Attached | 477 (81.4%) | 109 (18.6%) |
| 2 Unit Apartments | 29 (27.1%) | 78 (72.9%) |
| 3 or 4 Unit Apartments | 9 (1.1%) | 844 (98.9%) |
| 5 to 9 Unit Apartments | 0 (0.0%) | 157 (100.0%) |
| 10 or more Apartments | 11 (0.8%) | 1,382 (99.2%) |
| Mobile Home / Other | 0 (0.0%) | 5 (100.0%) |
| Total | 7,644 (73.0%) | 2,825 (27.0%) |
Housing Structures by Number of Rooms in Old Bridge
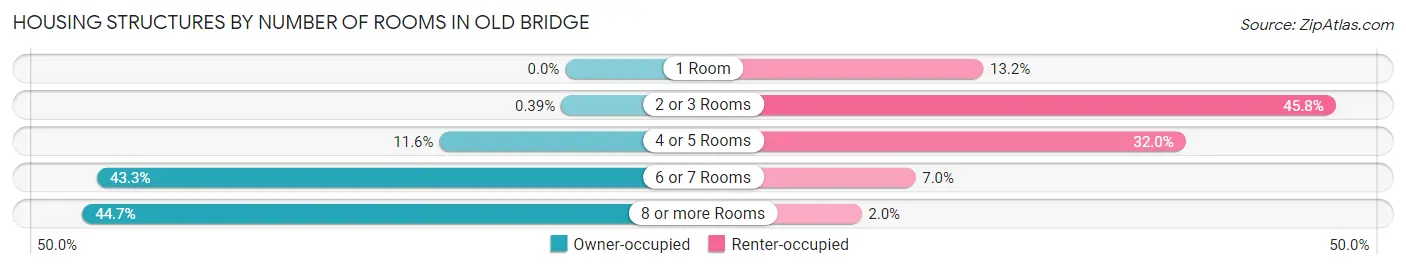
| Number of Rooms | Owner-occupied | Renter-occupied |
| 1 Room | 0 (0.0%) | 374 (13.2%) |
| 2 or 3 Rooms | 30 (0.4%) | 1,295 (45.8%) |
| 4 or 5 Rooms | 890 (11.6%) | 903 (32.0%) |
| 6 or 7 Rooms | 3,310 (43.3%) | 197 (7.0%) |
| 8 or more Rooms | 3,414 (44.7%) | 56 (2.0%) |
| Total | 7,644 (100.0%) | 2,825 (100.0%) |
Housing Structure by Heating Type in Old Bridge
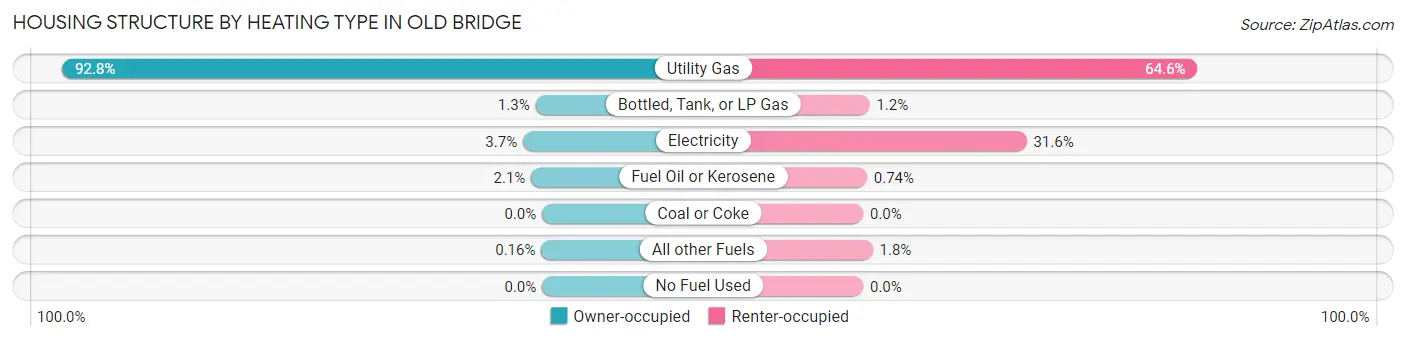
| Heating Type | Owner-occupied | Renter-occupied |
| Utility Gas | 7,091 (92.8%) | 1,825 (64.6%) |
| Bottled, Tank, or LP Gas | 98 (1.3%) | 35 (1.2%) |
| Electricity | 282 (3.7%) | 892 (31.6%) |
| Fuel Oil or Kerosene | 161 (2.1%) | 21 (0.7%) |
| Coal or Coke | 0 (0.0%) | 0 (0.0%) |
| All other Fuels | 12 (0.2%) | 52 (1.8%) |
| No Fuel Used | 0 (0.0%) | 0 (0.0%) |
| Total | 7,644 (100.0%) | 2,825 (100.0%) |
Household Vehicle Usage in Old Bridge
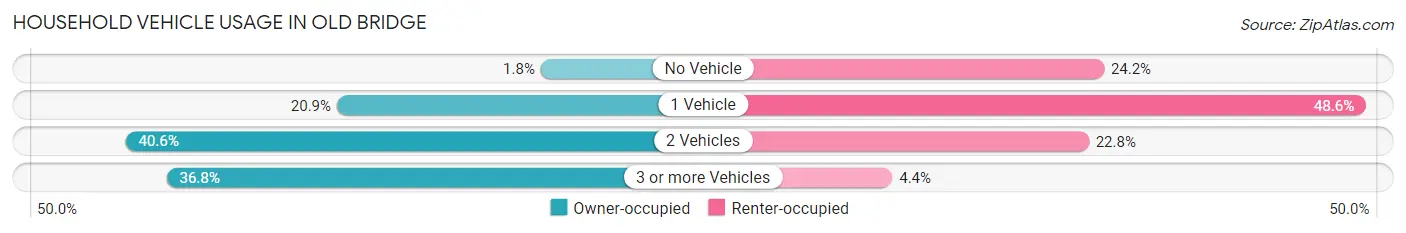
| Vehicles per Household | Owner-occupied | Renter-occupied |
| No Vehicle | 139 (1.8%) | 683 (24.2%) |
| 1 Vehicle | 1,594 (20.8%) | 1,374 (48.6%) |
| 2 Vehicles | 3,102 (40.6%) | 643 (22.8%) |
| 3 or more Vehicles | 2,809 (36.7%) | 125 (4.4%) |
| Total | 7,644 (100.0%) | 2,825 (100.0%) |
Real Estate & Mortgages in Old Bridge
Real Estate and Mortgage Overview in Old Bridge
| Characteristic | Without Mortgage | With Mortgage |
| Housing Units | 2,563 | 5,081 |
| Median Property Value | $439,700 | $440,700 |
| Median Household Income | $103,208 | $2,323 |
| Monthly Housing Costs | $1,138 | $1,825 |
| Real Estate Taxes | $8,730 | $70 |
Property Value by Mortgage Status in Old Bridge
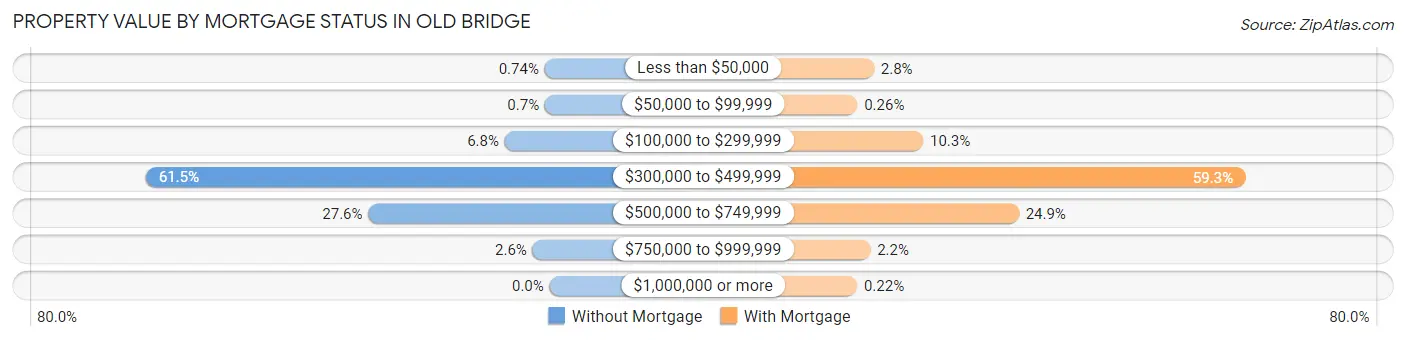
| Property Value | Without Mortgage | With Mortgage |
| Less than $50,000 | 19 (0.7%) | 142 (2.8%) |
| $50,000 to $99,999 | 18 (0.7%) | 13 (0.3%) |
| $100,000 to $299,999 | 175 (6.8%) | 523 (10.3%) |
| $300,000 to $499,999 | 1,577 (61.5%) | 3,015 (59.3%) |
| $500,000 to $749,999 | 708 (27.6%) | 1,263 (24.9%) |
| $750,000 to $999,999 | 66 (2.6%) | 114 (2.2%) |
| $1,000,000 or more | 0 (0.0%) | 11 (0.2%) |
| Total | 2,563 (100.0%) | 5,081 (100.0%) |
Household Income by Mortgage Status in Old Bridge
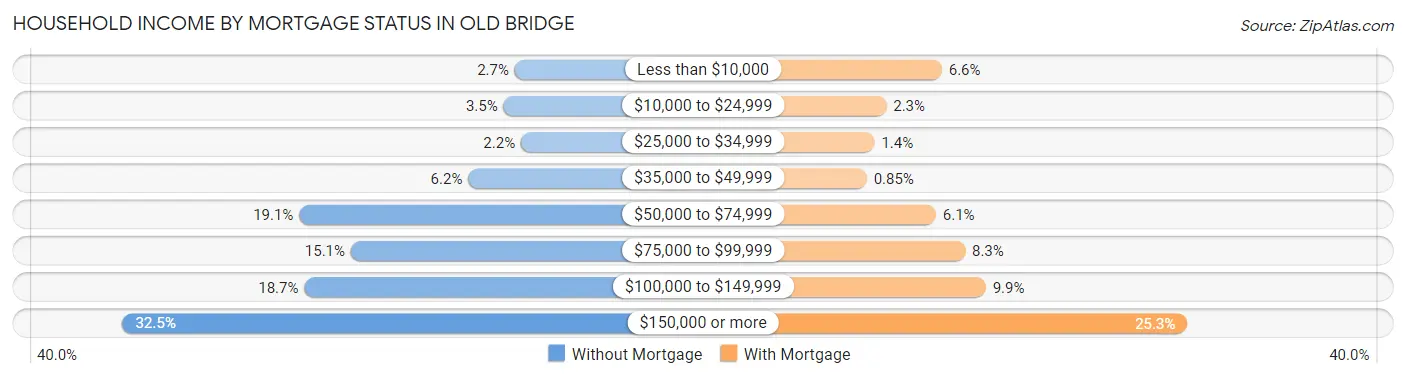
| Household Income | Without Mortgage | With Mortgage |
| Less than $10,000 | 68 (2.6%) | 334 (6.6%) |
| $10,000 to $24,999 | 90 (3.5%) | 119 (2.3%) |
| $25,000 to $34,999 | 56 (2.2%) | 73 (1.4%) |
| $35,000 to $49,999 | 159 (6.2%) | 43 (0.9%) |
| $50,000 to $74,999 | 489 (19.1%) | 311 (6.1%) |
| $75,000 to $99,999 | 388 (15.1%) | 424 (8.3%) |
| $100,000 to $149,999 | 479 (18.7%) | 504 (9.9%) |
| $150,000 or more | 834 (32.5%) | 1,284 (25.3%) |
| Total | 2,563 (100.0%) | 5,081 (100.0%) |
Property Value to Household Income Ratio in Old Bridge
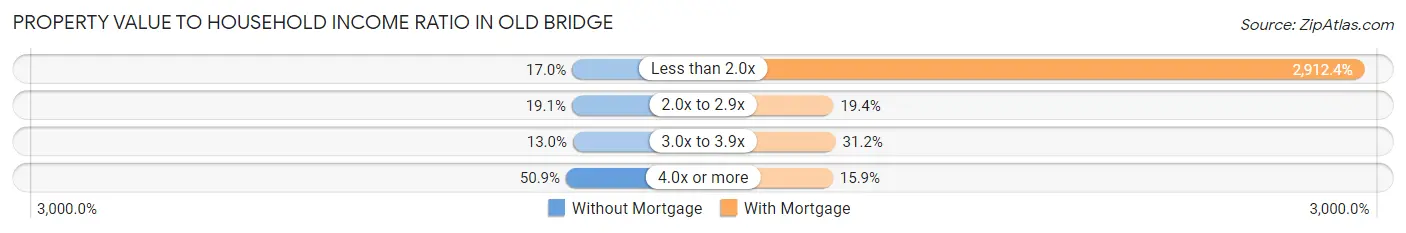
| Value-to-Income Ratio | Without Mortgage | With Mortgage |
| Less than 2.0x | 436 (17.0%) | 147,979 (2,912.4%) |
| 2.0x to 2.9x | 490 (19.1%) | 987 (19.4%) |
| 3.0x to 3.9x | 333 (13.0%) | 1,586 (31.2%) |
| 4.0x or more | 1,304 (50.9%) | 807 (15.9%) |
| Total | 2,563 (100.0%) | 5,081 (100.0%) |
Real Estate Taxes by Mortgage Status in Old Bridge
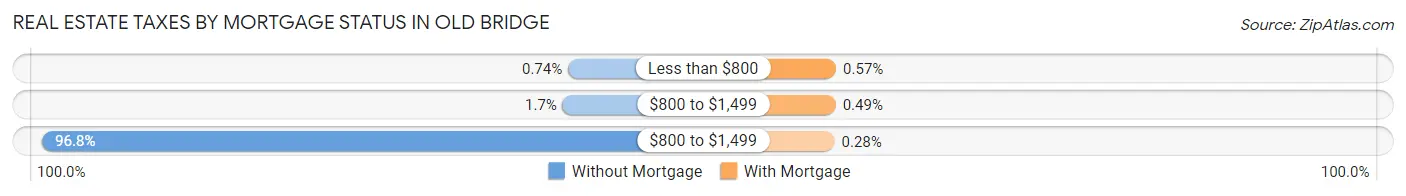
| Property Taxes | Without Mortgage | With Mortgage |
| Less than $800 | 19 (0.7%) | 29 (0.6%) |
| $800 to $1,499 | 44 (1.7%) | 25 (0.5%) |
| $800 to $1,499 | 2,481 (96.8%) | 14 (0.3%) |
| Total | 2,563 (100.0%) | 5,081 (100.0%) |
Health & Disability in Old Bridge
Health Insurance Coverage by Age in Old Bridge
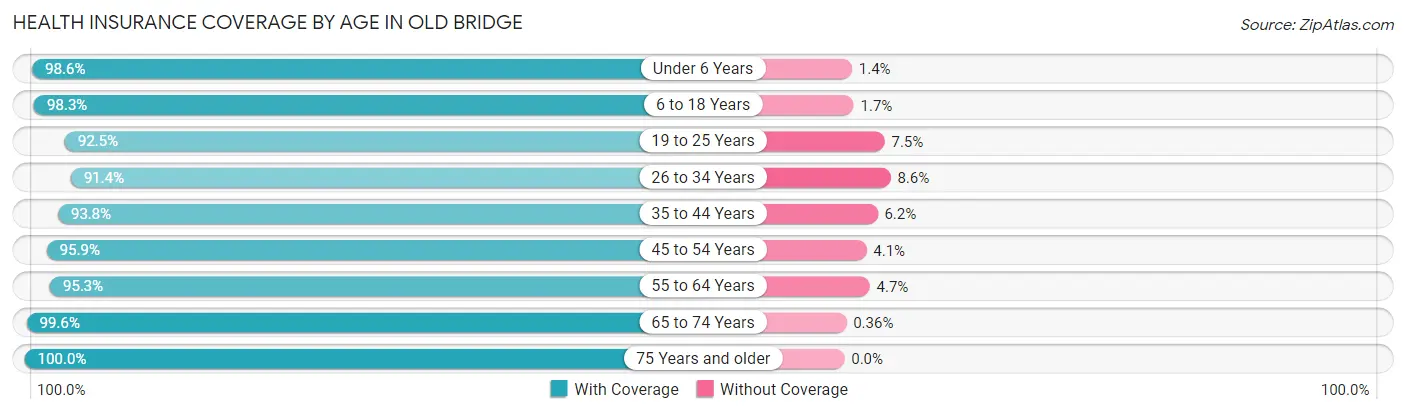
| Age Bracket | With Coverage | Without Coverage |
| Under 6 Years | 1,333 (98.6%) | 19 (1.4%) |
| 6 to 18 Years | 4,337 (98.3%) | 77 (1.7%) |
| 19 to 25 Years | 2,206 (92.5%) | 179 (7.5%) |
| 26 to 34 Years | 2,823 (91.4%) | 266 (8.6%) |
| 35 to 44 Years | 3,229 (93.8%) | 213 (6.2%) |
| 45 to 54 Years | 3,480 (95.9%) | 149 (4.1%) |
| 55 to 64 Years | 4,219 (95.3%) | 209 (4.7%) |
| 65 to 74 Years | 3,053 (99.6%) | 11 (0.4%) |
| 75 Years and older | 2,117 (100.0%) | 0 (0.0%) |
| Total | 26,797 (96.0%) | 1,123 (4.0%) |
Health Insurance Coverage by Citizenship Status in Old Bridge
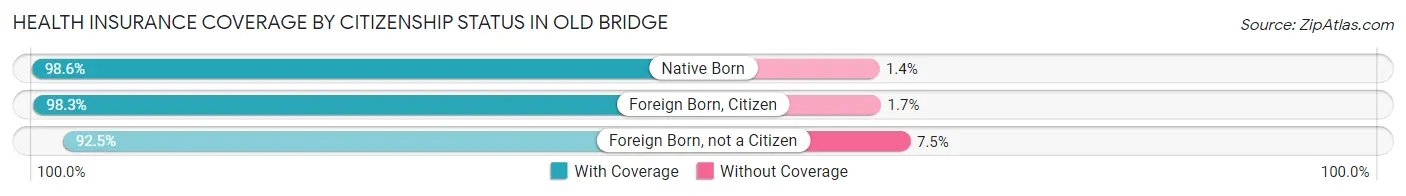
| Citizenship Status | With Coverage | Without Coverage |
| Native Born | 1,333 (98.6%) | 19 (1.4%) |
| Foreign Born, Citizen | 4,337 (98.3%) | 77 (1.7%) |
| Foreign Born, not a Citizen | 2,206 (92.5%) | 179 (7.5%) |
Health Insurance Coverage by Household Income in Old Bridge
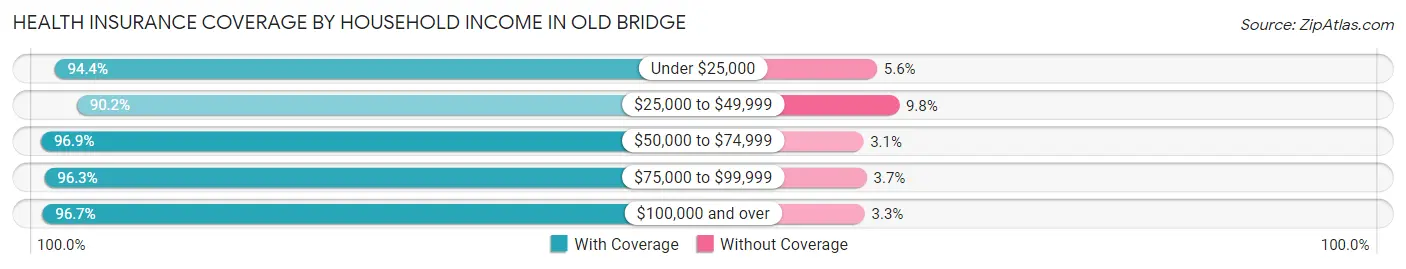
| Household Income | With Coverage | Without Coverage |
| Under $25,000 | 1,307 (94.4%) | 78 (5.6%) |
| $25,000 to $49,999 | 2,167 (90.2%) | 235 (9.8%) |
| $50,000 to $74,999 | 3,057 (96.9%) | 97 (3.1%) |
| $75,000 to $99,999 | 3,139 (96.3%) | 121 (3.7%) |
| $100,000 and over | 17,114 (96.7%) | 590 (3.3%) |
Public vs Private Health Insurance Coverage by Age in Old Bridge
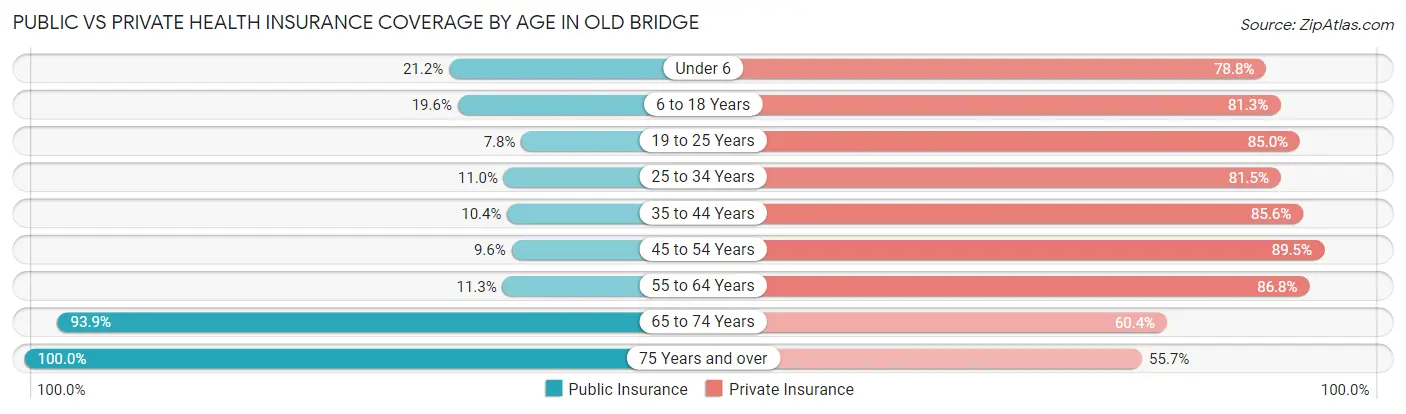
| Age Bracket | Public Insurance | Private Insurance |
| Under 6 | 287 (21.2%) | 1,065 (78.8%) |
| 6 to 18 Years | 865 (19.6%) | 3,590 (81.3%) |
| 19 to 25 Years | 186 (7.8%) | 2,028 (85.0%) |
| 25 to 34 Years | 341 (11.0%) | 2,517 (81.5%) |
| 35 to 44 Years | 358 (10.4%) | 2,947 (85.6%) |
| 45 to 54 Years | 349 (9.6%) | 3,247 (89.5%) |
| 55 to 64 Years | 500 (11.3%) | 3,842 (86.8%) |
| 65 to 74 Years | 2,876 (93.9%) | 1,849 (60.4%) |
| 75 Years and over | 2,117 (100.0%) | 1,180 (55.7%) |
| Total | 7,879 (28.2%) | 22,265 (79.7%) |
Disability Status by Sex by Age in Old Bridge
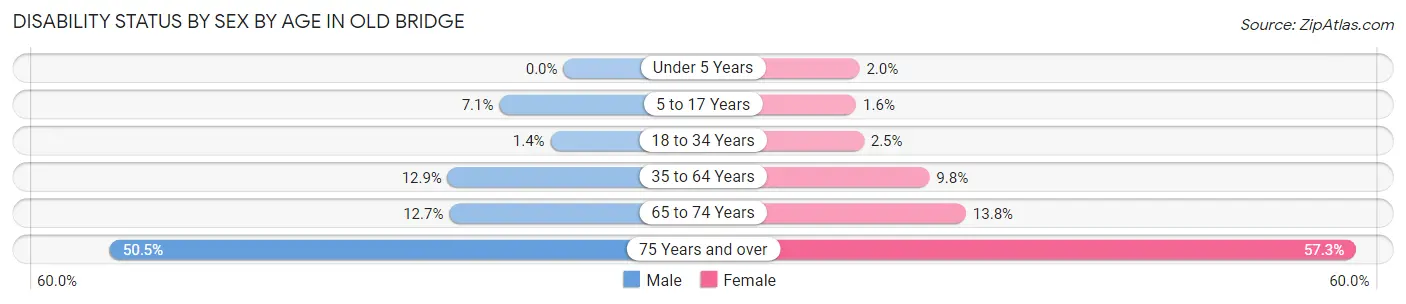
| Age Bracket | Male | Female |
| Under 5 Years | 0 (0.0%) | 11 (2.0%) |
| 5 to 17 Years | 156 (7.1%) | 34 (1.6%) |
| 18 to 34 Years | 40 (1.4%) | 73 (2.5%) |
| 35 to 64 Years | 724 (12.9%) | 574 (9.8%) |
| 65 to 74 Years | 188 (12.7%) | 219 (13.8%) |
| 75 Years and over | 457 (50.5%) | 694 (57.3%) |
Disability Class by Sex by Age in Old Bridge
Disability Class: Hearing Difficulty
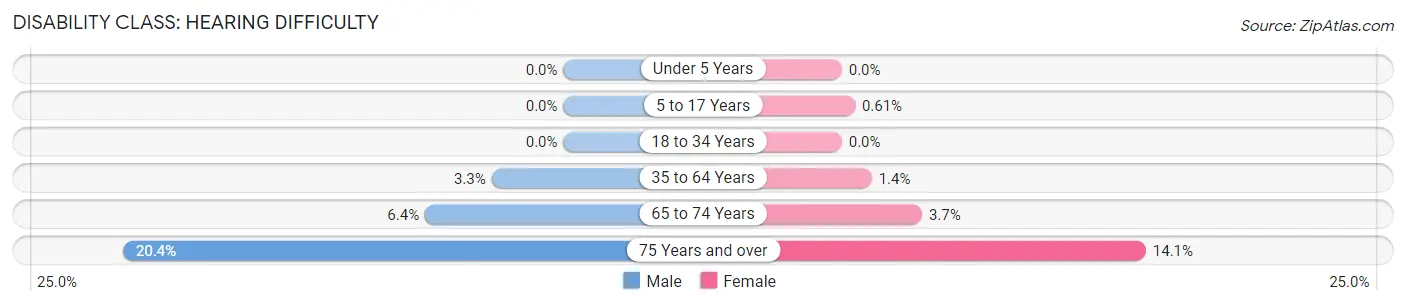
| Age Bracket | Male | Female |
| Under 5 Years | 0 (0.0%) | 0 (0.0%) |
| 5 to 17 Years | 0 (0.0%) | 13 (0.6%) |
| 18 to 34 Years | 0 (0.0%) | 0 (0.0%) |
| 35 to 64 Years | 187 (3.3%) | 82 (1.4%) |
| 65 to 74 Years | 95 (6.4%) | 59 (3.7%) |
| 75 Years and over | 185 (20.4%) | 171 (14.1%) |
Disability Class: Vision Difficulty
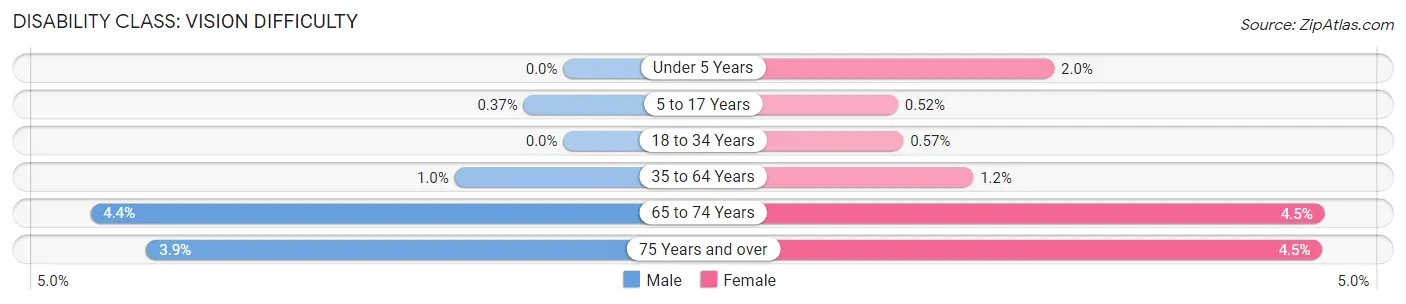
| Age Bracket | Male | Female |
| Under 5 Years | 0 (0.0%) | 11 (2.0%) |
| 5 to 17 Years | 8 (0.4%) | 11 (0.5%) |
| 18 to 34 Years | 0 (0.0%) | 17 (0.6%) |
| 35 to 64 Years | 57 (1.0%) | 72 (1.2%) |
| 65 to 74 Years | 65 (4.4%) | 71 (4.5%) |
| 75 Years and over | 35 (3.9%) | 54 (4.5%) |
Disability Class: Cognitive Difficulty
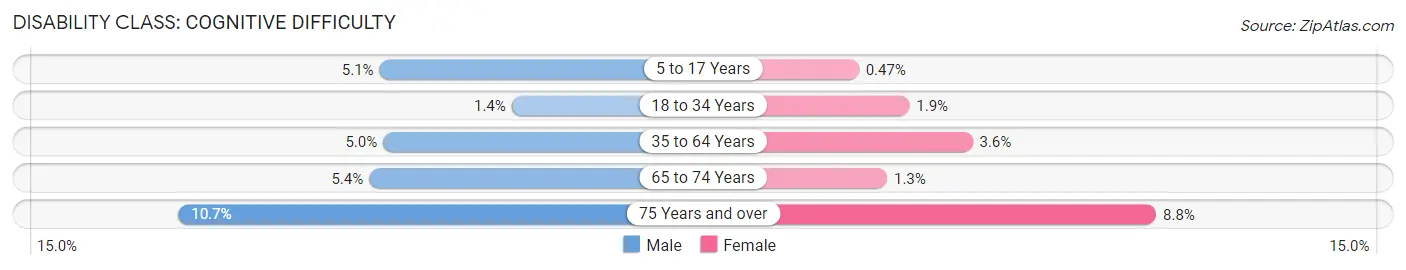
| Age Bracket | Male | Female |
| 5 to 17 Years | 112 (5.1%) | 10 (0.5%) |
| 18 to 34 Years | 40 (1.4%) | 56 (1.9%) |
| 35 to 64 Years | 282 (5.0%) | 214 (3.6%) |
| 65 to 74 Years | 80 (5.4%) | 20 (1.3%) |
| 75 Years and over | 97 (10.7%) | 106 (8.7%) |
Disability Class: Ambulatory Difficulty
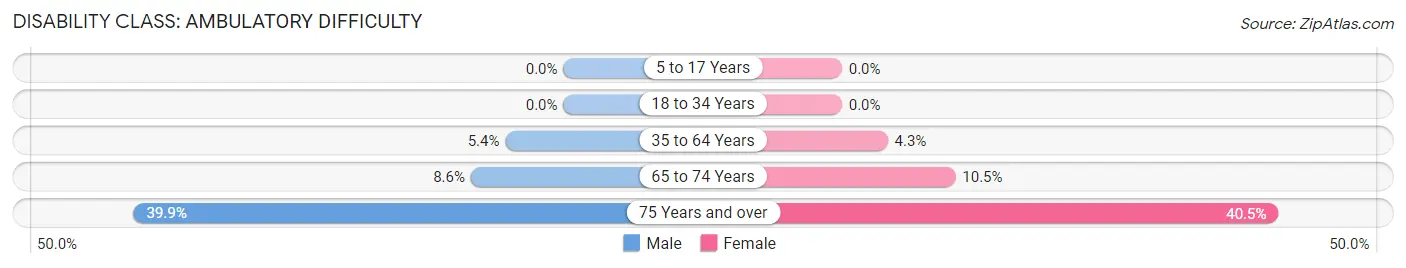
| Age Bracket | Male | Female |
| 5 to 17 Years | 0 (0.0%) | 0 (0.0%) |
| 18 to 34 Years | 0 (0.0%) | 0 (0.0%) |
| 35 to 64 Years | 303 (5.4%) | 250 (4.3%) |
| 65 to 74 Years | 127 (8.6%) | 167 (10.5%) |
| 75 Years and over | 361 (39.9%) | 491 (40.5%) |
Disability Class: Self-Care Difficulty
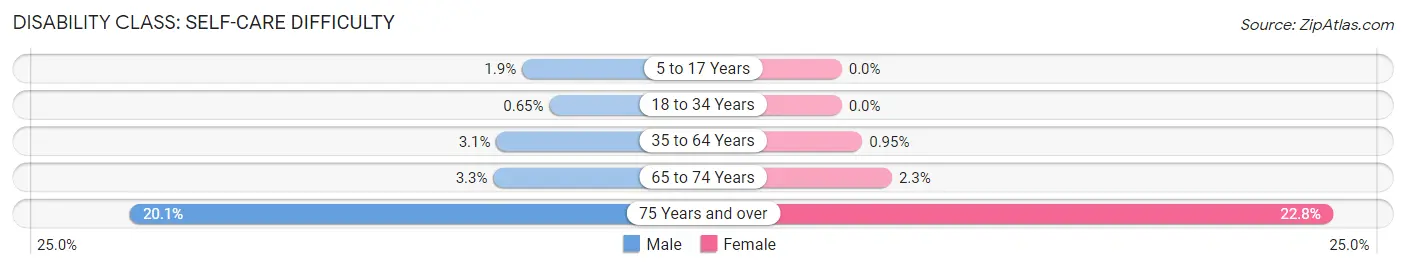
| Age Bracket | Male | Female |
| 5 to 17 Years | 42 (1.9%) | 0 (0.0%) |
| 18 to 34 Years | 18 (0.6%) | 0 (0.0%) |
| 35 to 64 Years | 175 (3.1%) | 56 (0.9%) |
| 65 to 74 Years | 48 (3.3%) | 37 (2.3%) |
| 75 Years and over | 182 (20.1%) | 276 (22.8%) |
Technology Access in Old Bridge
Computing Device Access in Old Bridge
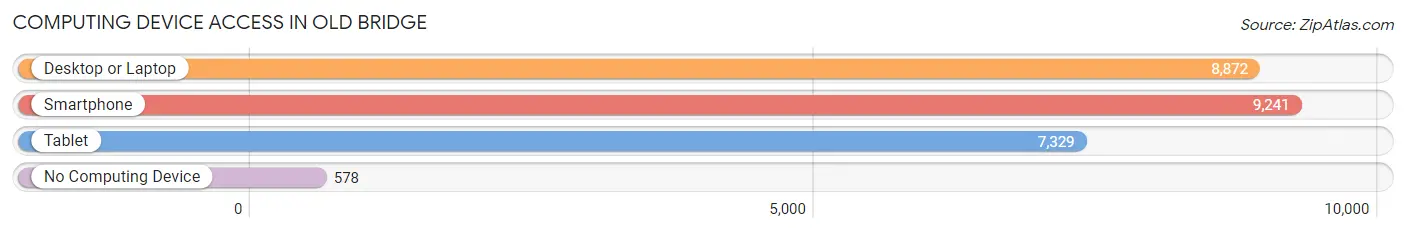
| Device Type | # Households | % Households |
| Desktop or Laptop | 8,872 | 84.8% |
| Smartphone | 9,241 | 88.3% |
| Tablet | 7,329 | 70.0% |
| No Computing Device | 578 | 5.5% |
| Total | 10,469 | 100.0% |
Internet Access in Old Bridge
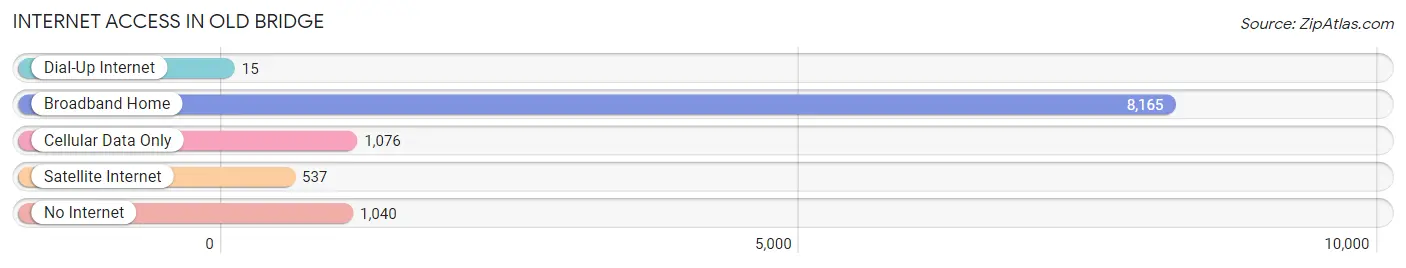
| Internet Type | # Households | % Households |
| Dial-Up Internet | 15 | 0.1% |
| Broadband Home | 8,165 | 78.0% |
| Cellular Data Only | 1,076 | 10.3% |
| Satellite Internet | 537 | 5.1% |
| No Internet | 1,040 | 9.9% |
| Total | 10,469 | 100.0% |
Old Bridge Summary
Old Bridge Township is a township located in Middlesex County, New Jersey, United States. As of the 2010 United States Census, the township had a total population of 65,375, making it the state's 18th largest municipality, after having been the state's 17th most-populous municipality in 2000. As of the 2010 Census, the township was the state's 15th most-populous municipality.
History
Old Bridge Township was incorporated as a township by an act of the New Jersey Legislature on March 2, 1869, from portions of South Amboy Township (now City of South Amboy). Portions of the township were taken to form Monroe Township (April 29, 1838), Madison Township (March 5, 1869) and Sayreville (April 6, 1870).
Geography
Old Bridge Township is located in the central part of Middlesex County, New Jersey. It is bordered by the Raritan Bay to the east, the Manalapan River to the west, and the South River to the south. The township is approximately 25 miles south of Newark and 25 miles southwest of New York City.
According to the United States Census Bureau, the township had a total area of 24.945 square miles (64.6 km2), including 24.845 square miles (64.3 km2) of land and 0.100 square miles (0.3 km2) of water (0.40%).
Economy
Old Bridge Township is home to a variety of businesses, including manufacturing, retail, and service industries. The township is home to the Old Bridge Business Park, which is home to a variety of businesses, including a distribution center for Amazon.com. The township is also home to the Old Bridge Airport, which is a general aviation airport.
Demographics
As of the 2010 United States Census, there were 65,375 people, 22,945 households, and 17,945 families residing in the township. The population density was 2,631.2 per square mile (1,014.2/km2). There were 23,845 housing units at an average density of 962.2 per square mile (371.2/km2). The racial makeup of the township was 79.2% (51,845) White, 8.2% (5,346) Black or African American, 0.2% (133) Native American, 8.2% (5,346) Asian, 0.0% (17) Pacific Islander, 1.9% (1,250) from other races, and 2.3% (1,523) from two or more races. Hispanic or Latino of any race were 8.7% (5,683) of the population.
There were 22,945 households out of which 37.2% had children under the age of 18 living with them, 59.2% were married couples living together, 11.7% had a female householder with no husband present, and 24.3% were non-families. 19.7% of all households were made up of individuals, and 7.2% had someone living alone who was 65 years of age or older. The average household size was 2.84 and the average family size was 3.30.
In the township, the population was spread out with 25.2% under the age of 18, 7.7% from 18 to 24, 30.2% from 25 to 44, 25.2% from 45 to 64, and 11.7% who were 65 years of age or older. The median age was 37.2 years. For every 100 females, there were 95.3 males. For every 100 females ages 18 and older there were 92.2 males.
The median income for a household in the township was $76,843, and the median income for a family was $86,945. Males had a median income of $60,945 versus $45,835 for females. The per capita income for the township was $30,945. About 3.2% of families and 4.4% of the population were below the poverty line, including 5.2% of those under age 18 and 5.2% of those age 65 or over.
Common Questions
What is the Total Population of Old Bridge?
Total Population of Old Bridge is 28,094.
What is the Total Male Population of Old Bridge?
Total Male Population of Old Bridge is 13,651.
What is the Total Female Population of Old Bridge?
Total Female Population of Old Bridge is 14,443.
What is the Ratio of Males per 100 Females in Old Bridge?
There are 94.52 Males per 100 Females in Old Bridge.
What is the Ratio of Females per 100 Males in Old Bridge?
There are 105.80 Females per 100 Males in Old Bridge.
What is the Median Population Age in Old Bridge?
Median Population Age in Old Bridge is 43.2 Years.
What is the Average Family Size in Old Bridge
Average Family Size in Old Bridge is 3.2 People.
What is the Average Household Size in Old Bridge
Average Household Size in Old Bridge is 2.7 People.
What is Per Capita Income in Old Bridge?
Per Capita income in Old Bridge is $49,513.
What is the Median Family Income in Old Bridge?
Median Family Income in Old Bridge is $130,878.
What is the Median Household income in Old Bridge?
Median Household Income in Old Bridge is $104,712.
What is Income or Wage Gap in Old Bridge?
Income or Wage Gap in Old Bridge is 35.1%.
Women in Old Bridge earn 64.9 cents for every dollar earned by a man.
What is Inequality or Gini Index in Old Bridge?
Inequality or Gini Index in Old Bridge is 0.41.
How Large is the Labor Force in Old Bridge?
There are 15,922 People in the Labor Forcein in Old Bridge.
What is the Percentage of People in the Labor Force in Old Bridge?
67.6% of People are in the Labor Force in Old Bridge.
What is the Unemployment Rate in Old Bridge?
Unemployment Rate in Old Bridge is 6.9%.