Cities with the Highest Percentage of Private Company Employees in New Jersey
RELATED REPORTS & OPTIONS
Private Company Employees
New Jersey
Compare Cities
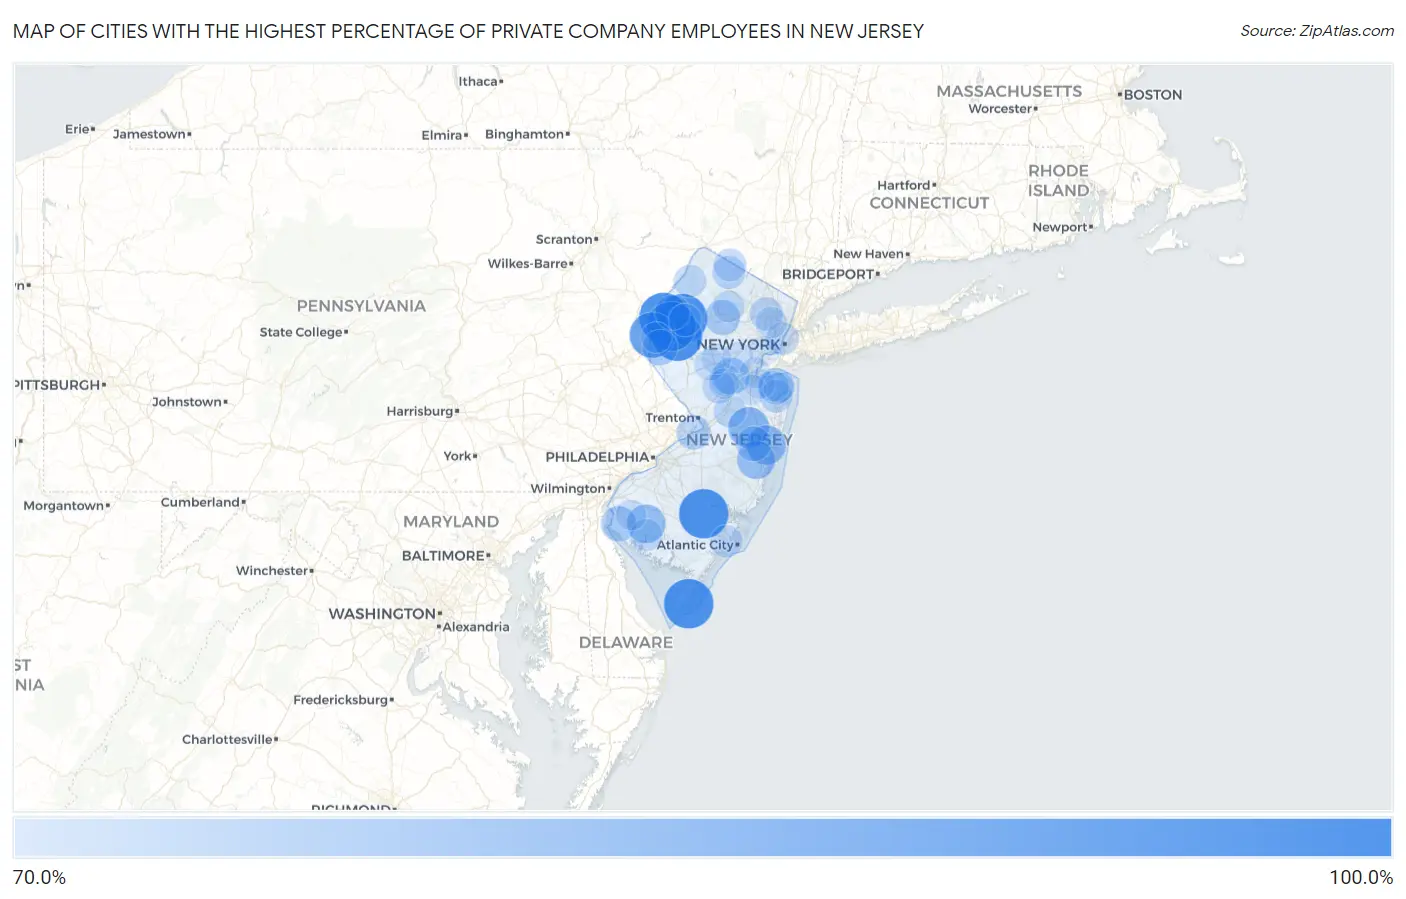
Map of Cities with the Highest Percentage of Private Company Employees in New Jersey
0.0%
100.0%
Cities with the Highest Percentage of Private Company Employees in New Jersey
| City | % Private Company Employees | vs State | vs National | |
| 1. | Elwood | 100.0% | 69.7%(+30.3)#1 | 66.9%(+33.1)#8 |
| 2. | Great Meadows | 100.0% | 69.7%(+30.3)#2 | 66.9%(+33.1)#113 |
| 3. | Diamond Beach | 100.0% | 69.7%(+30.3)#3 | 66.9%(+33.1)#182 |
| 4. | Port Colden | 100.0% | 69.7%(+30.3)#4 | 66.9%(+33.1)#186 |
| 5. | Dorchester | 100.0% | 69.7%(+30.3)#5 | 66.9%(+33.1)#270 |
| 6. | Delaware | 100.0% | 69.7%(+30.3)#6 | 66.9%(+33.1)#347 |
| 7. | Buttzville | 100.0% | 69.7%(+30.3)#7 | 66.9%(+33.1)#417 |
| 8. | Deerfield Street | 100.0% | 69.7%(+30.3)#8 | 66.9%(+33.1)#660 |
| 9. | Gandys Beach | 100.0% | 69.7%(+30.3)#9 | 66.9%(+33.1)#775 |
| 10. | Tavistock Borough | 100.0% | 69.7%(+30.3)#10 | 66.9%(+33.1)#903 |
| 11. | Richland | 97.7% | 69.7%(+28.0)#11 | 66.9%(+30.8)#978 |
| 12. | Brainards | 95.6% | 69.7%(+25.8)#12 | 66.9%(+28.7)#1,044 |
| 13. | Jobstown | 94.9% | 69.7%(+25.1)#13 | 66.9%(+28.0)#1,071 |
| 14. | Monroe Manor | 91.6% | 69.7%(+21.9)#14 | 66.9%(+24.7)#1,315 |
| 15. | Vista Center | 89.7% | 69.7%(+20.0)#15 | 66.9%(+22.8)#1,508 |
| 16. | Three Bridges | 89.7% | 69.7%(+19.9)#16 | 66.9%(+22.8)#1,514 |
| 17. | Victory Gardens Borough | 88.5% | 69.7%(+18.8)#17 | 66.9%(+21.6)#1,652 |
| 18. | Heislerville | 88.4% | 69.7%(+18.7)#18 | 66.9%(+21.5)#1,670 |
| 19. | Leisure Village East | 88.4% | 69.7%(+18.6)#19 | 66.9%(+21.5)#1,674 |
| 20. | East Vineland | 88.2% | 69.7%(+18.5)#20 | 66.9%(+21.4)#1,693 |
| 21. | Sunset Lake | 87.4% | 69.7%(+17.7)#21 | 66.9%(+20.6)#1,832 |
| 22. | Forsgate | 87.4% | 69.7%(+17.7)#22 | 66.9%(+20.5)#1,835 |
| 23. | Seabrook Farms | 87.3% | 69.7%(+17.6)#23 | 66.9%(+20.4)#1,851 |
| 24. | New Vernon | 86.8% | 69.7%(+17.1)#24 | 66.9%(+20.0)#1,934 |
| 25. | Holiday Heights | 86.8% | 69.7%(+17.1)#25 | 66.9%(+19.9)#1,948 |
| 26. | Mount Royal | 86.1% | 69.7%(+16.3)#26 | 66.9%(+19.2)#2,074 |
| 27. | Dunellen Borough | 85.5% | 69.7%(+15.7)#27 | 66.9%(+18.6)#2,208 |
| 28. | East Franklin | 85.4% | 69.7%(+15.7)#28 | 66.9%(+18.5)#2,229 |
| 29. | The Ponds | 85.4% | 69.7%(+15.7)#29 | 66.9%(+18.5)#2,235 |
| 30. | Mauricetown | 84.7% | 69.7%(+15.0)#30 | 66.9%(+17.8)#2,416 |
| 31. | Belford | 84.6% | 69.7%(+14.9)#31 | 66.9%(+17.7)#2,448 |
| 32. | Robbinsville Center | 84.1% | 69.7%(+14.4)#32 | 66.9%(+17.2)#2,577 |
| 33. | Lakeside-Beebe Run | 84.1% | 69.7%(+14.4)#33 | 66.9%(+17.2)#2,580 |
| 34. | Othello | 84.1% | 69.7%(+14.4)#34 | 66.9%(+17.2)#2,581 |
| 35. | Nesco | 84.0% | 69.7%(+14.3)#35 | 66.9%(+17.1)#2,612 |
| 36. | Stewartsville | 84.0% | 69.7%(+14.3)#36 | 66.9%(+17.1)#2,621 |
| 37. | Hancocks Bridge | 83.8% | 69.7%(+14.1)#37 | 66.9%(+17.0)#2,658 |
| 38. | Dover | 83.8% | 69.7%(+14.1)#38 | 66.9%(+16.9)#2,663 |
| 39. | Hopelawn | 83.8% | 69.7%(+14.0)#39 | 66.9%(+16.9)#2,668 |
| 40. | East Newark Borough | 83.6% | 69.7%(+13.9)#40 | 66.9%(+16.7)#2,701 |
| 41. | Audubon Park Borough | 83.5% | 69.7%(+13.8)#41 | 66.9%(+16.6)#2,730 |
| 42. | Moonachie Borough | 83.5% | 69.7%(+13.8)#42 | 66.9%(+16.6)#2,741 |
| 43. | Port Morris | 83.4% | 69.7%(+13.7)#43 | 66.9%(+16.5)#2,747 |
| 44. | Cedar Glen West | 83.2% | 69.7%(+13.5)#44 | 66.9%(+16.3)#2,830 |
| 45. | Mount Hermon | 83.2% | 69.7%(+13.5)#45 | 66.9%(+16.3)#2,833 |
| 46. | Florence | 82.4% | 69.7%(+12.7)#46 | 66.9%(+15.5)#3,075 |
| 47. | Pine Brook | 82.4% | 69.7%(+12.7)#47 | 66.9%(+15.5)#3,076 |
| 48. | Sewell | 82.2% | 69.7%(+12.5)#48 | 66.9%(+15.3)#3,141 |
| 49. | Clearbrook | 82.2% | 69.7%(+12.4)#49 | 66.9%(+15.3)#3,157 |
| 50. | Woodlynne Borough | 82.0% | 69.7%(+12.3)#50 | 66.9%(+15.1)#3,228 |
| 51. | Cumberland-Hesstown | 81.8% | 69.7%(+12.1)#51 | 66.9%(+14.9)#3,293 |
| 52. | Sheppards Mill | 81.8% | 69.7%(+12.1)#52 | 66.9%(+14.9)#3,304 |
| 53. | Landing | 81.6% | 69.7%(+11.8)#53 | 66.9%(+14.7)#3,420 |
| 54. | Germania | 81.5% | 69.7%(+11.7)#54 | 66.9%(+14.6)#3,463 |
| 55. | Paterson | 81.4% | 69.7%(+11.6)#55 | 66.9%(+14.5)#3,500 |
| 56. | Fairview | 81.1% | 69.7%(+11.3)#56 | 66.9%(+14.2)#3,633 |
| 57. | Hoboken | 81.0% | 69.7%(+11.3)#57 | 66.9%(+14.1)#3,657 |
| 58. | Vernon Center | 80.9% | 69.7%(+11.2)#58 | 66.9%(+14.1)#3,684 |
| 59. | Vernon Valley | 80.7% | 69.7%(+11.0)#59 | 66.9%(+13.8)#3,756 |
| 60. | South Bound Brook Borough | 80.7% | 69.7%(+11.0)#60 | 66.9%(+13.8)#3,758 |
| 61. | Twin Rivers | 80.7% | 69.7%(+11.0)#61 | 66.9%(+13.8)#3,782 |
| 62. | Ocean Gate Borough | 80.6% | 69.7%(+10.9)#62 | 66.9%(+13.7)#3,815 |
| 63. | Crandon Lakes | 80.6% | 69.7%(+10.9)#63 | 66.9%(+13.7)#3,832 |
| 64. | Vienna | 80.5% | 69.7%(+10.8)#64 | 66.9%(+13.6)#3,855 |
| 65. | Paulsboro Borough | 80.5% | 69.7%(+10.8)#65 | 66.9%(+13.6)#3,858 |
| 66. | Pleasantville | 80.5% | 69.7%(+10.8)#66 | 66.9%(+13.6)#3,877 |
| 67. | Ten Mile Run | 80.3% | 69.7%(+10.5)#67 | 66.9%(+13.4)#3,978 |
| 68. | Bridgeton | 80.0% | 69.7%(+10.3)#68 | 66.9%(+13.1)#4,088 |
| 69. | Pluckemin | 80.0% | 69.7%(+10.3)#69 | 66.9%(+13.1)#4,098 |
| 70. | Deans | 79.9% | 69.7%(+10.2)#70 | 66.9%(+13.0)#4,186 |
| 71. | Lake Telemark | 79.8% | 69.7%(+10.1)#71 | 66.9%(+12.9)#4,218 |
| 72. | Passaic | 79.5% | 69.7%(+9.76)#72 | 66.9%(+12.6)#4,388 |
| 73. | Six Mile Run | 79.5% | 69.7%(+9.73)#73 | 66.9%(+12.6)#4,403 |
| 74. | Bradley Gardens | 79.4% | 69.7%(+9.70)#74 | 66.9%(+12.5)#4,421 |
| 75. | Washington Crossing | 79.4% | 69.7%(+9.67)#75 | 66.9%(+12.5)#4,449 |
| 76. | Mizpah | 79.4% | 69.7%(+9.66)#76 | 66.9%(+12.5)#4,453 |
| 77. | Flanders | 79.3% | 69.7%(+9.59)#77 | 66.9%(+12.4)#4,494 |
| 78. | Branchville Borough | 79.2% | 69.7%(+9.47)#78 | 66.9%(+12.3)#4,559 |
| 79. | Lamington | 79.1% | 69.7%(+9.34)#79 | 66.9%(+12.2)#4,631 |
| 80. | Little Ferry Borough | 79.0% | 69.7%(+9.23)#80 | 66.9%(+12.1)#4,695 |
| 81. | Cranford | 78.9% | 69.7%(+9.22)#81 | 66.9%(+12.1)#4,713 |
| 82. | Plainfield | 78.8% | 69.7%(+9.04)#82 | 66.9%(+11.9)#4,812 |
| 83. | Hi Nella Borough | 78.6% | 69.7%(+8.92)#83 | 66.9%(+11.8)#4,880 |
| 84. | Harmony | 78.6% | 69.7%(+8.85)#84 | 66.9%(+11.7)#4,921 |
| 85. | Alloway | 78.5% | 69.7%(+8.77)#85 | 66.9%(+11.6)#4,987 |
| 86. | Perth Amboy | 78.5% | 69.7%(+8.76)#86 | 66.9%(+11.6)#4,989 |
| 87. | Vincentown | 78.3% | 69.7%(+8.60)#87 | 66.9%(+11.4)#5,083 |
| 88. | Port Monmouth | 78.3% | 69.7%(+8.58)#88 | 66.9%(+11.4)#5,092 |
| 89. | Brownville | 78.2% | 69.7%(+8.52)#89 | 66.9%(+11.4)#5,141 |
| 90. | Cliffwood Beach | 78.2% | 69.7%(+8.43)#90 | 66.9%(+11.3)#5,181 |
| 91. | Bound Brook Borough | 78.1% | 69.7%(+8.42)#91 | 66.9%(+11.3)#5,189 |
| 92. | Lincoln Park Borough | 78.1% | 69.7%(+8.38)#92 | 66.9%(+11.2)#5,212 |
| 93. | Elizabeth | 78.1% | 69.7%(+8.36)#93 | 66.9%(+11.2)#5,222 |
| 94. | Leonardo | 78.1% | 69.7%(+8.36)#94 | 66.9%(+11.2)#5,226 |
| 95. | Franklin Park | 78.0% | 69.7%(+8.32)#95 | 66.9%(+11.2)#5,251 |
| 96. | Keansburg Borough | 78.0% | 69.7%(+8.28)#96 | 66.9%(+11.1)#5,266 |
| 97. | Mount Hope | 78.0% | 69.7%(+8.28)#97 | 66.9%(+11.1)#5,267 |
| 98. | Green Knoll | 78.0% | 69.7%(+8.23)#98 | 66.9%(+11.1)#5,307 |
| 99. | Magnolia Borough | 77.9% | 69.7%(+8.22)#99 | 66.9%(+11.1)#5,311 |
| 100. | Bloomingdale Borough | 77.9% | 69.7%(+8.21)#100 | 66.9%(+11.0)#5,325 |
Common Questions
What are the Top 10 Cities with the Highest Percentage of Private Company Employees in New Jersey?
Top 10 Cities with the Highest Percentage of Private Company Employees in New Jersey are:
#1
100.0%
#2
100.0%
#3
100.0%
#4
100.0%
#5
100.0%
#6
100.0%
#7
95.6%
#8
89.7%
#9
88.4%
#10
87.3%
What city has the Highest Percentage of Private Company Employees in New Jersey?
Elwood has the Highest Percentage of Private Company Employees in New Jersey with 100.0%.
What is the Percentage of Private Company Employees in the State of New Jersey?
Percentage of Private Company Employees in New Jersey is 69.7%.
What is the Percentage of Private Company Employees in the United States?
Percentage of Private Company Employees in the United States is 66.9%.