Cities with the Most Immigrants from Kuwait in New Jersey
RELATED REPORTS & OPTIONS
Kuwait
New Jersey
Compare Cities
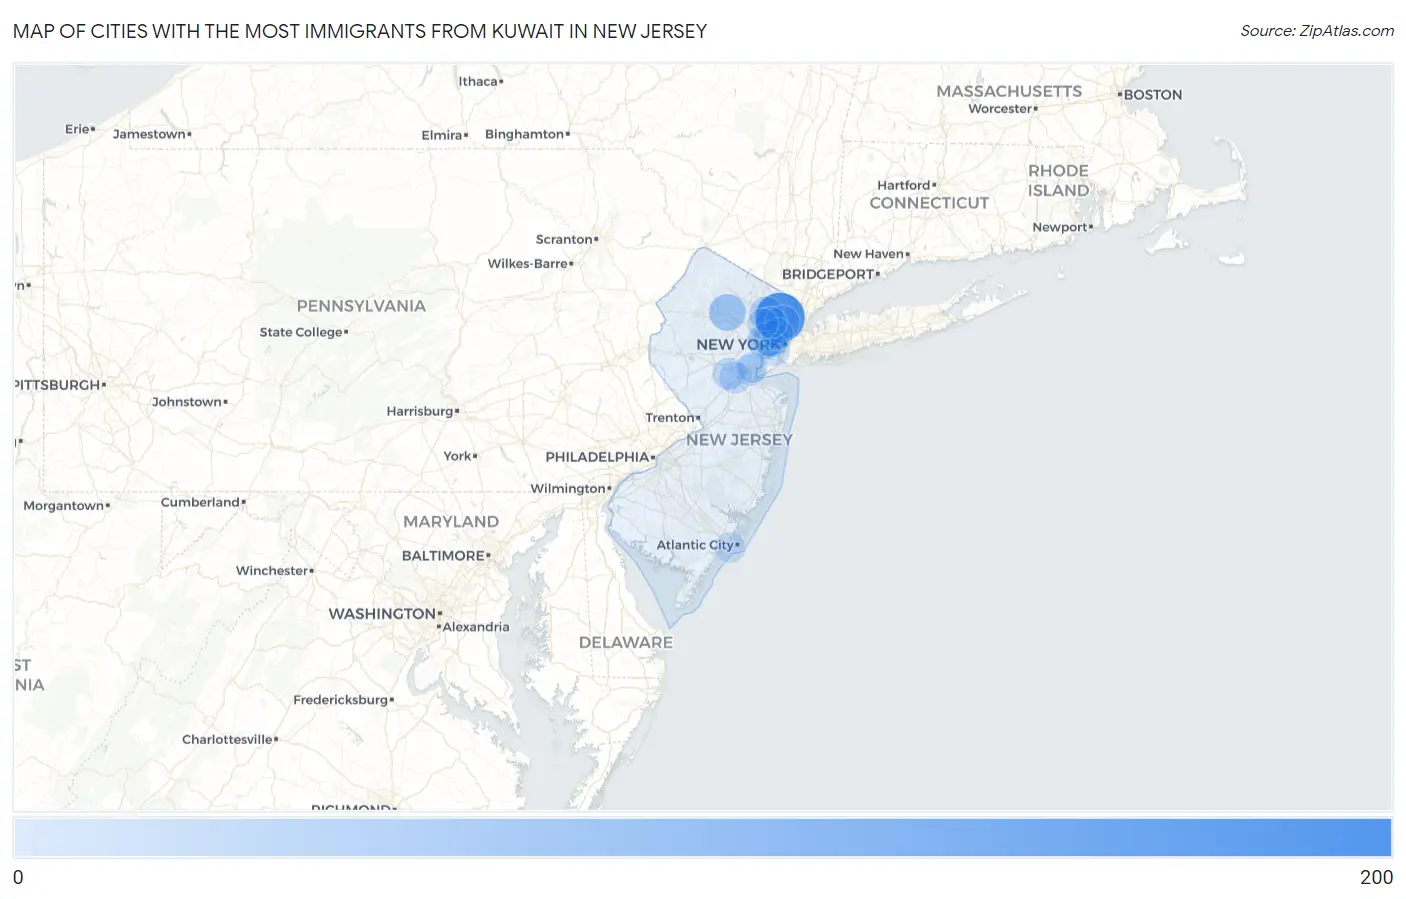
Map of Cities with the Most Immigrants from Kuwait in New Jersey
0
200
Cities with the Most Immigrants from Kuwait in New Jersey
| City | Kuwait | vs State | vs National | |
| 1. | Hackensack | 171 | 1,375(12.44%)#1 | 35,679(0.48%)#29 |
| 2. | White Meadow Lake | 58 | 1,375(4.22%)#2 | 35,679(0.16%)#128 |
| 3. | Paramus Borough | 56 | 1,375(4.07%)#3 | 35,679(0.16%)#133 |
| 4. | Kearny | 48 | 1,375(3.49%)#4 | 35,679(0.13%)#167 |
| 5. | Fort Lee Borough | 46 | 1,375(3.35%)#5 | 35,679(0.13%)#177 |
| 6. | Newark | 43 | 1,375(3.13%)#6 | 35,679(0.12%)#190 |
| 7. | Fair Lawn Borough | 43 | 1,375(3.13%)#7 | 35,679(0.12%)#193 |
| 8. | Paterson | 34 | 1,375(2.47%)#8 | 35,679(0.10%)#240 |
| 9. | Sayreville Borough | 34 | 1,375(2.47%)#9 | 35,679(0.10%)#243 |
| 10. | Ridgefield Park | 33 | 1,375(2.40%)#10 | 35,679(0.09%)#254 |
| 11. | Hasbrouck Heights Borough | 32 | 1,375(2.33%)#11 | 35,679(0.09%)#260 |
| 12. | Parsippany | 30 | 1,375(2.18%)#12 | 35,679(0.08%)#268 |
| 13. | South Plainfield Borough | 22 | 1,375(1.60%)#13 | 35,679(0.06%)#334 |
| 14. | North Plainfield Borough | 22 | 1,375(1.60%)#14 | 35,679(0.06%)#335 |
| 15. | Preakness | 20 | 1,375(1.45%)#15 | 35,679(0.06%)#358 |
| 16. | North Caldwell Borough | 20 | 1,375(1.45%)#16 | 35,679(0.06%)#361 |
| 17. | Bayonne | 19 | 1,375(1.38%)#17 | 35,679(0.05%)#367 |
| 18. | Somerset | 18 | 1,375(1.31%)#18 | 35,679(0.05%)#389 |
| 19. | New Brunswick | 15 | 1,375(1.09%)#19 | 35,679(0.04%)#423 |
| 20. | Secaucus | 11 | 1,375(0.80%)#20 | 35,679(0.03%)#518 |
| 21. | Dumont Borough | 11 | 1,375(0.80%)#21 | 35,679(0.03%)#521 |
| 22. | Maywood Borough | 11 | 1,375(0.80%)#22 | 35,679(0.03%)#523 |
| 23. | Raritan Borough | 11 | 1,375(0.80%)#23 | 35,679(0.03%)#524 |
| 24. | Passaic | 10 | 1,375(0.73%)#24 | 35,679(0.03%)#534 |
| 25. | Rutherford Borough | 10 | 1,375(0.73%)#25 | 35,679(0.03%)#548 |
| 26. | Fords | 10 | 1,375(0.73%)#26 | 35,679(0.03%)#551 |
| 27. | Rockaway Borough | 8 | 1,375(0.58%)#27 | 35,679(0.02%)#604 |
| 28. | Sicklerville | 6 | 1,375(0.44%)#28 | 35,679(0.02%)#648 |
| 29. | Woodbridge | 6 | 1,375(0.44%)#29 | 35,679(0.02%)#653 |
| 30. | Ventnor City | 6 | 1,375(0.44%)#30 | 35,679(0.02%)#657 |
| 31. | Upper Montclair | 5 | 1,375(0.36%)#31 | 35,679(0.01%)#675 |
| 32. | Waldwick Borough | 2 | 1,375(0.15%)#32 | 35,679(0.01%)#712 |
Common Questions
What are the Top 10 Cities with the Most Immigrants from Kuwait in New Jersey?
Top 10 Cities with the Most Immigrants from Kuwait in New Jersey are:
#1
171
#2
58
#3
48
#4
43
#5
34
#6
33
#7
19
#8
18
#9
15
#10
11
What city has the Most Immigrants from Kuwait in New Jersey?
Hackensack has the Most Immigrants from Kuwait in New Jersey with 171.
What is the Total Immigrants from Kuwait in the State of New Jersey?
Total Immigrants from Kuwait in New Jersey is 1,375.
What is the Total Immigrants from Kuwait in the United States?
Total Immigrants from Kuwait in the United States is 35,679.