Morristown, NJ
Morristown Map
Morristown Overview
20,126
TOTAL POPULATION
9,791
MALE POPULATION
10,335
FEMALE POPULATION
94.74
MALES / 100 FEMALES
105.56
FEMALES / 100 MALES
33.9
MEDIAN AGE
2.9
AVG FAMILY SIZE
2.2
AVG HOUSEHOLD SIZE
$66,283
PER CAPITA INCOME
$136,607
AVG FAMILY INCOME
$113,926
AVG HOUSEHOLD INCOME
4.3%
WAGE / INCOME GAP [ % ]
95.7¢/ $1
WAGE / INCOME GAP [ $ ]
$10,910
FAMILY INCOME DEFICIT
0.44
INEQUALITY / GINI INDEX
13,096
LABOR FORCE [ PEOPLE ]
75.0%
PERCENT IN LABOR FORCE
4.7%
UNEMPLOYMENT RATE
Morristown Zip Codes
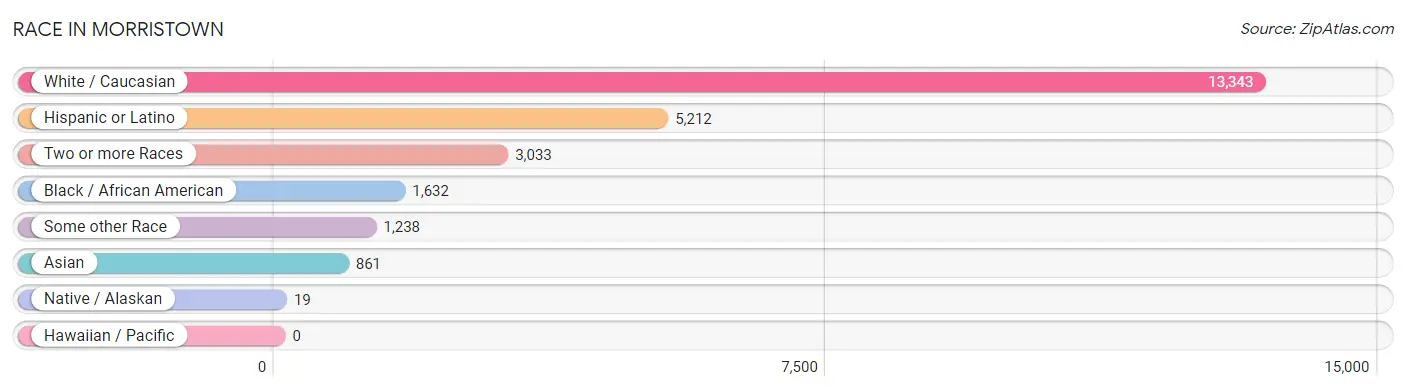
Race in Morristown
The most populous races in Morristown are White / Caucasian (13,343 | 66.3%), Hispanic or Latino (5,212 | 25.9%), and Two or more Races (3,033 | 15.1%).
| Race | # Population | % Population |
| Asian | 861 | 4.3% |
| Black / African American | 1,632 | 8.1% |
| Hawaiian / Pacific | 0 | 0.0% |
| Hispanic or Latino | 5,212 | 25.9% |
| Native / Alaskan | 19 | 0.1% |
| White / Caucasian | 13,343 | 66.3% |
| Two or more Races | 3,033 | 15.1% |
| Some other Race | 1,238 | 6.1% |
| Total | 20,126 | 100.0% |
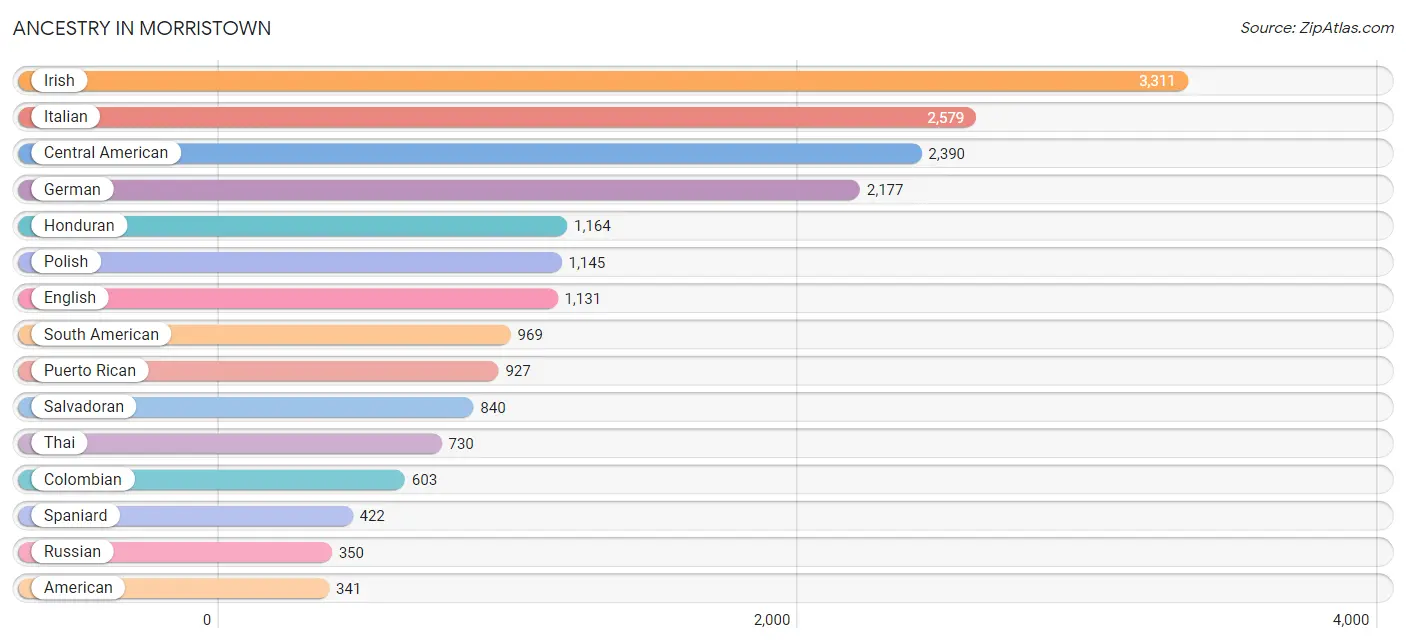
Ancestry in Morristown
The most populous ancestries reported in Morristown are Irish (3,311 | 16.5%), Italian (2,579 | 12.8%), Central American (2,390 | 11.9%), German (2,177 | 10.8%), and Honduran (1,164 | 5.8%), together accounting for 57.7% of all Morristown residents.
| Ancestry | # Population | % Population |
| African | 29 | 0.1% |
| Albanian | 15 | 0.1% |
| American | 341 | 1.7% |
| Arab | 225 | 1.1% |
| Austrian | 325 | 1.6% |
| Belgian | 14 | 0.1% |
| Bhutanese | 67 | 0.3% |
| British | 102 | 0.5% |
| Burmese | 77 | 0.4% |
| Cajun | 13 | 0.1% |
| Canadian | 81 | 0.4% |
| Central American | 2,390 | 11.9% |
| Central American Indian | 19 | 0.1% |
| Cherokee | 10 | 0.1% |
| Colombian | 603 | 3.0% |
| Costa Rican | 263 | 1.3% |
| Croatian | 87 | 0.4% |
| Cuban | 32 | 0.2% |
| Czech | 36 | 0.2% |
| Czechoslovakian | 17 | 0.1% |
| Danish | 75 | 0.4% |
| Dominican | 67 | 0.3% |
| Dutch | 158 | 0.8% |
| Eastern European | 82 | 0.4% |
| Ecuadorian | 296 | 1.5% |
| Egyptian | 93 | 0.5% |
| English | 1,131 | 5.6% |
| European | 158 | 0.8% |
| Filipino | 20 | 0.1% |
| French | 200 | 1.0% |
| French Canadian | 90 | 0.4% |
| German | 2,177 | 10.8% |
| Greek | 116 | 0.6% |
| Guatemalan | 123 | 0.6% |
| Haitian | 211 | 1.1% |
| Honduran | 1,164 | 5.8% |
| Hungarian | 193 | 1.0% |
| Indian (Asian) | 182 | 0.9% |
| Irish | 3,311 | 16.5% |
| Italian | 2,579 | 12.8% |
| Jamaican | 44 | 0.2% |
| Jordanian | 29 | 0.1% |
| Kenyan | 25 | 0.1% |
| Korean | 198 | 1.0% |
| Latvian | 16 | 0.1% |
| Lebanese | 30 | 0.2% |
| Lithuanian | 79 | 0.4% |
| Luxembourger | 17 | 0.1% |
| Maltese | 12 | 0.1% |
| Mexican | 270 | 1.3% |
| Native Hawaiian | 19 | 0.1% |
| Northern European | 12 | 0.1% |
| Norwegian | 77 | 0.4% |
| Palestinian | 13 | 0.1% |
| Pennsylvania German | 52 | 0.3% |
| Peruvian | 70 | 0.4% |
| Polish | 1,145 | 5.7% |
| Portuguese | 287 | 1.4% |
| Puerto Rican | 927 | 4.6% |
| Romanian | 184 | 0.9% |
| Russian | 350 | 1.7% |
| Salvadoran | 840 | 4.2% |
| Scandinavian | 26 | 0.1% |
| Scotch-Irish | 17 | 0.1% |
| Scottish | 96 | 0.5% |
| South American | 969 | 4.8% |
| Spaniard | 422 | 2.1% |
| Sri Lankan | 45 | 0.2% |
| Subsaharan African | 54 | 0.3% |
| Swedish | 183 | 0.9% |
| Swiss | 13 | 0.1% |
| Syrian | 72 | 0.4% |
| Thai | 730 | 3.6% |
| Trinidadian and Tobagonian | 16 | 0.1% |
| Turkish | 26 | 0.1% |
| Ukrainian | 55 | 0.3% |
| Welsh | 63 | 0.3% | View All 77 Rows |
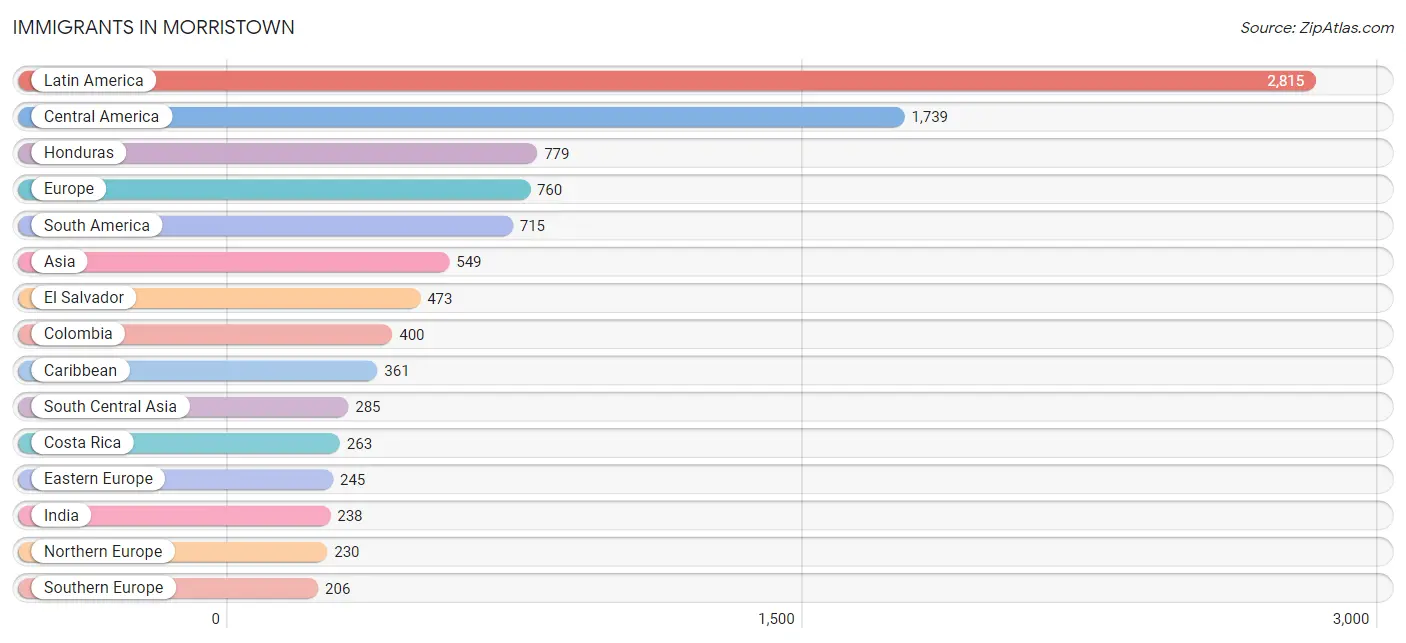
Immigrants in Morristown
The most numerous immigrant groups reported in Morristown came from Latin America (2,815 | 14.0%), Central America (1,739 | 8.6%), Honduras (779 | 3.9%), Europe (760 | 3.8%), and South America (715 | 3.5%), together accounting for 33.8% of all Morristown residents.
| Immigration Origin | # Population | % Population |
| Africa | 98 | 0.5% |
| Asia | 549 | 2.7% |
| Australia | 19 | 0.1% |
| Austria | 21 | 0.1% |
| Belarus | 22 | 0.1% |
| Brazil | 45 | 0.2% |
| Canada | 15 | 0.1% |
| Caribbean | 361 | 1.8% |
| Central America | 1,739 | 8.6% |
| China | 59 | 0.3% |
| Colombia | 400 | 2.0% |
| Costa Rica | 263 | 1.3% |
| Cuba | 39 | 0.2% |
| Dominican Republic | 73 | 0.4% |
| Eastern Africa | 25 | 0.1% |
| Eastern Asia | 133 | 0.7% |
| Eastern Europe | 245 | 1.2% |
| Ecuador | 200 | 1.0% |
| Egypt | 72 | 0.4% |
| El Salvador | 473 | 2.4% |
| England | 93 | 0.5% |
| Europe | 760 | 3.8% |
| Germany | 41 | 0.2% |
| Greece | 28 | 0.1% |
| Guatemala | 54 | 0.3% |
| Haiti | 155 | 0.8% |
| Honduras | 779 | 3.9% |
| India | 238 | 1.2% |
| Jamaica | 7 | 0.0% |
| Japan | 38 | 0.2% |
| Kenya | 25 | 0.1% |
| Korea | 36 | 0.2% |
| Latin America | 2,815 | 14.0% |
| Lebanon | 18 | 0.1% |
| Mexico | 170 | 0.8% |
| Netherlands | 17 | 0.1% |
| Northern Africa | 72 | 0.4% |
| Northern Europe | 230 | 1.1% |
| Oceania | 19 | 0.1% |
| Pakistan | 47 | 0.2% |
| Peru | 70 | 0.4% |
| Philippines | 102 | 0.5% |
| Romania | 72 | 0.4% |
| Russia | 93 | 0.5% |
| Scotland | 21 | 0.1% |
| South America | 715 | 3.5% |
| South Central Asia | 285 | 1.4% |
| South Eastern Asia | 102 | 0.5% |
| Southern Europe | 206 | 1.0% |
| Spain | 178 | 0.9% |
| Taiwan | 8 | 0.0% |
| Trinidad and Tobago | 87 | 0.4% |
| Ukraine | 22 | 0.1% |
| Western Asia | 29 | 0.1% |
| Western Europe | 79 | 0.4% | View All 55 Rows |
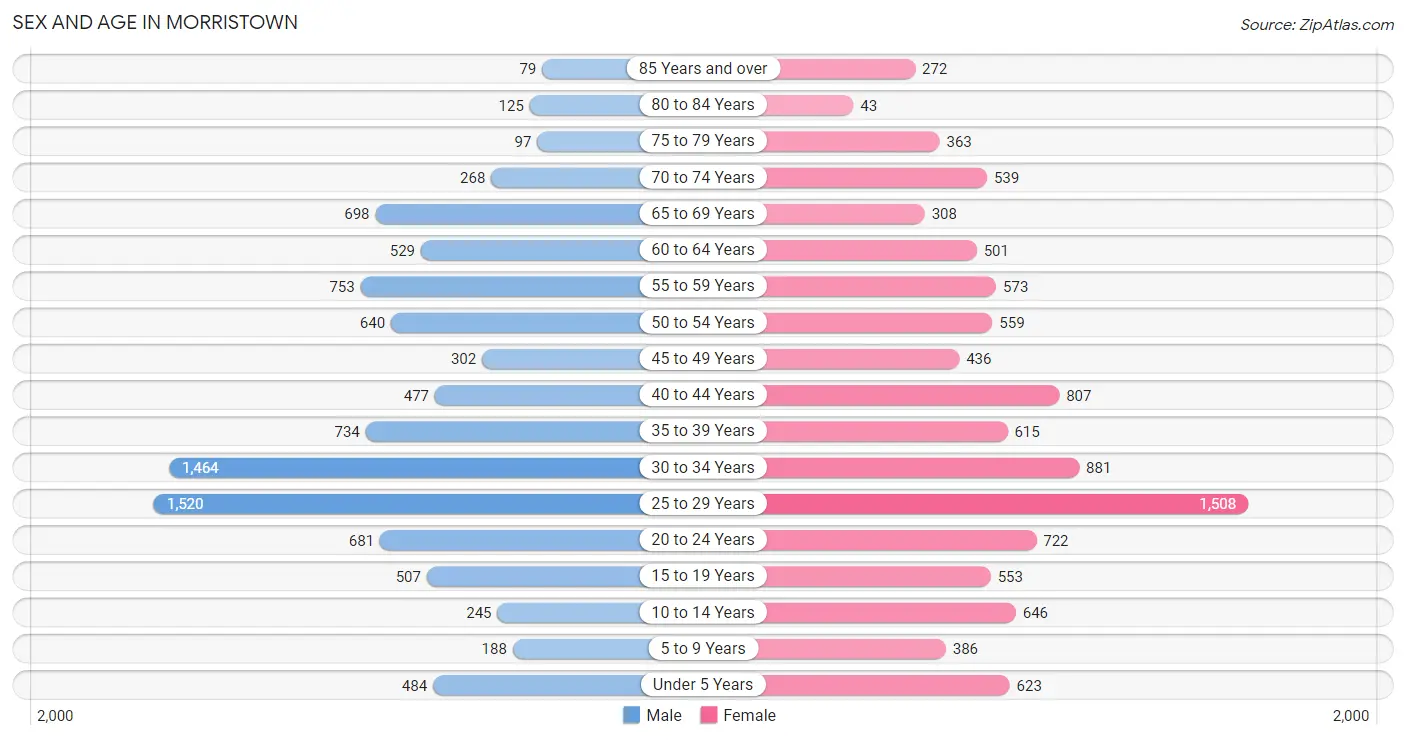
Sex and Age in Morristown
Sex and Age in Morristown
The most populous age groups in Morristown are 25 to 29 Years (1,520 | 15.5%) for men and 25 to 29 Years (1,508 | 14.6%) for women.
| Age Bracket | Male | Female |
| Under 5 Years | 484 (4.9%) | 623 (6.0%) |
| 5 to 9 Years | 188 (1.9%) | 386 (3.7%) |
| 10 to 14 Years | 245 (2.5%) | 646 (6.2%) |
| 15 to 19 Years | 507 (5.2%) | 553 (5.3%) |
| 20 to 24 Years | 681 (7.0%) | 722 (7.0%) |
| 25 to 29 Years | 1,520 (15.5%) | 1,508 (14.6%) |
| 30 to 34 Years | 1,464 (14.9%) | 881 (8.5%) |
| 35 to 39 Years | 734 (7.5%) | 615 (5.9%) |
| 40 to 44 Years | 477 (4.9%) | 807 (7.8%) |
| 45 to 49 Years | 302 (3.1%) | 436 (4.2%) |
| 50 to 54 Years | 640 (6.5%) | 559 (5.4%) |
| 55 to 59 Years | 753 (7.7%) | 573 (5.5%) |
| 60 to 64 Years | 529 (5.4%) | 501 (4.9%) |
| 65 to 69 Years | 698 (7.1%) | 308 (3.0%) |
| 70 to 74 Years | 268 (2.7%) | 539 (5.2%) |
| 75 to 79 Years | 97 (1.0%) | 363 (3.5%) |
| 80 to 84 Years | 125 (1.3%) | 43 (0.4%) |
| 85 Years and over | 79 (0.8%) | 272 (2.6%) |
| Total | 9,791 (100.0%) | 10,335 (100.0%) |
Families and Households in Morristown
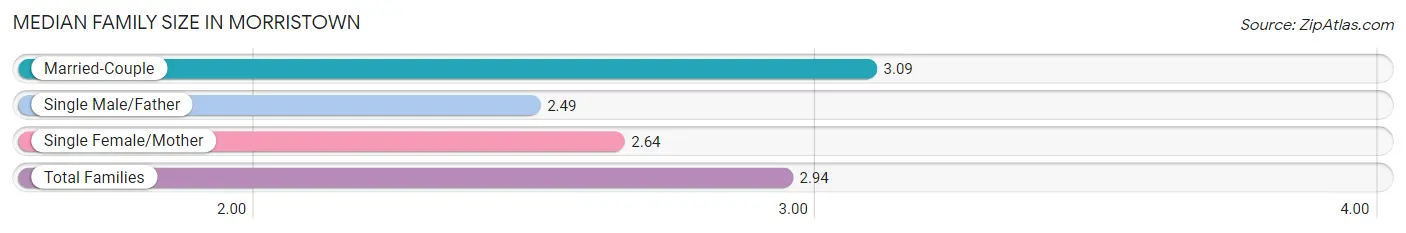
Median Family Size in Morristown
The median family size in Morristown is 2.94 persons per family, with married-couple families (2,876 | 69.0%) accounting for the largest median family size of 3.09 persons per family. On the other hand, single male/father families (284 | 6.8%) represent the smallest median family size with 2.49 persons per family.
| Family Type | # Families | Family Size |
| Married-Couple | 2,876 (69.0%) | 3.09 |
| Single Male/Father | 284 (6.8%) | 2.49 |
| Single Female/Mother | 1,006 (24.1%) | 2.64 |
| Total Families | 4,166 (100.0%) | 2.94 |
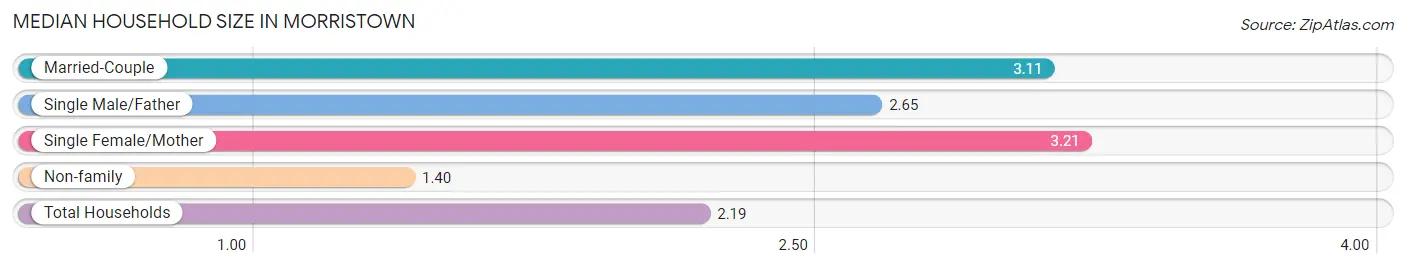
Median Household Size in Morristown
The median household size in Morristown is 2.19 persons per household, with single female/mother households (1,006 | 11.2%) accounting for the largest median household size of 3.21 persons per household. non-family households (4,783 | 53.4%) represent the smallest median household size with 1.40 persons per household.
| Household Type | # Households | Household Size |
| Married-Couple | 2,876 (32.1%) | 3.11 |
| Single Male/Father | 284 (3.2%) | 2.65 |
| Single Female/Mother | 1,006 (11.2%) | 3.21 |
| Non-family | 4,783 (53.4%) | 1.40 |
| Total Households | 8,949 (100.0%) | 2.19 |
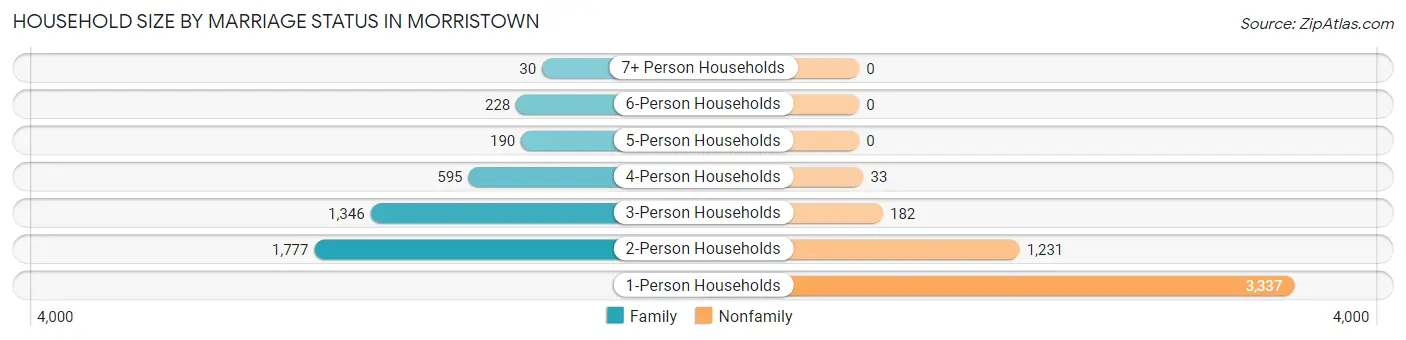
Household Size by Marriage Status in Morristown
Out of a total of 8,949 households in Morristown, 4,166 (46.6%) are family households, while 4,783 (53.4%) are nonfamily households. The most numerous type of family households are 2-person households, comprising 1,777, and the most common type of nonfamily households are 1-person households, comprising 3,337.
| Household Size | Family Households | Nonfamily Households |
| 1-Person Households | - | 3,337 (37.3%) |
| 2-Person Households | 1,777 (19.9%) | 1,231 (13.8%) |
| 3-Person Households | 1,346 (15.0%) | 182 (2.0%) |
| 4-Person Households | 595 (6.7%) | 33 (0.4%) |
| 5-Person Households | 190 (2.1%) | 0 (0.0%) |
| 6-Person Households | 228 (2.5%) | 0 (0.0%) |
| 7+ Person Households | 30 (0.3%) | 0 (0.0%) |
| Total | 4,166 (46.6%) | 4,783 (53.4%) |
Female Fertility in Morristown
Fertility by Age in Morristown
Average fertility rate in Morristown is 42.0 births per 1,000 women. Women in the age bracket of 35 to 50 years have the highest fertility rate with 81.0 births per 1,000 women. Women in the age bracket of 35 to 50 years acount for 67.6% of all women with births.
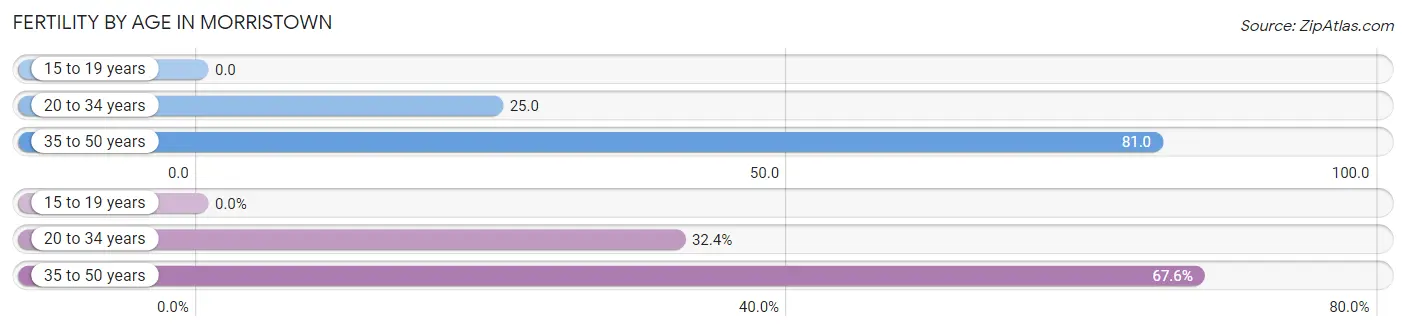
| Age Bracket | Women with Births | Births / 1,000 Women |
| 15 to 19 years | 0 (0.0%) | 0.0 |
| 20 to 34 years | 78 (32.4%) | 25.0 |
| 35 to 50 years | 163 (67.6%) | 81.0 |
| Total | 241 (100.0%) | 42.0 |
Fertility by Age by Marriage Status in Morristown
93.4% of women with births (241) in Morristown are married. The highest percentage of unmarried women with births falls into 20 to 34 years age bracket with 20.5% of them unmarried at the time of birth, while the lowest percentage of unmarried women with births belong to 35 to 50 years age bracket with 0.0% of them unmarried.
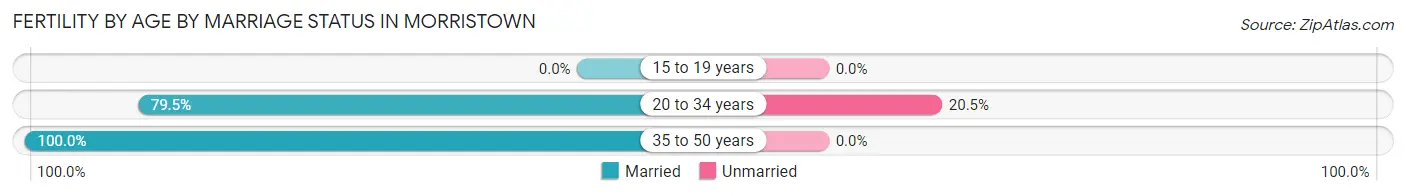
| Age Bracket | Married | Unmarried |
| 15 to 19 years | 0 (0.0%) | 0 (0.0%) |
| 20 to 34 years | 62 (79.5%) | 16 (20.5%) |
| 35 to 50 years | 163 (100.0%) | 0 (0.0%) |
| Total | 225 (93.4%) | 16 (6.6%) |
Fertility by Education in Morristown
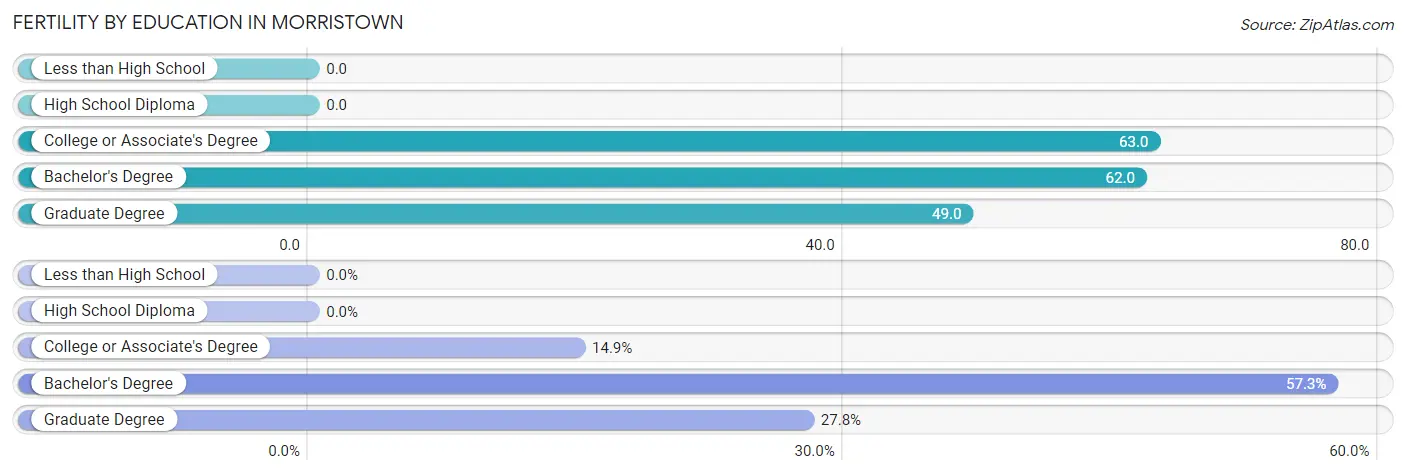
| Educational Attainment | Women with Births | Births / 1,000 Women |
| Less than High School | 0 (0.0%) | 0.0 |
| High School Diploma | 0 (0.0%) | 0.0 |
| College or Associate's Degree | 36 (14.9%) | 63.0 |
| Bachelor's Degree | 138 (57.3%) | 62.0 |
| Graduate Degree | 67 (27.8%) | 49.0 |
| Total | 241 (100.0%) | 42.0 |
Fertility by Education by Marriage Status in Morristown
6.6% of women with births in Morristown are unmarried. Women with the educational attainment of college or associate's degree are most likely to be married with 100.0% of them married at childbirth, while women with the educational attainment of graduate degree are least likely to be married with 23.9% of them unmarried at childbirth.
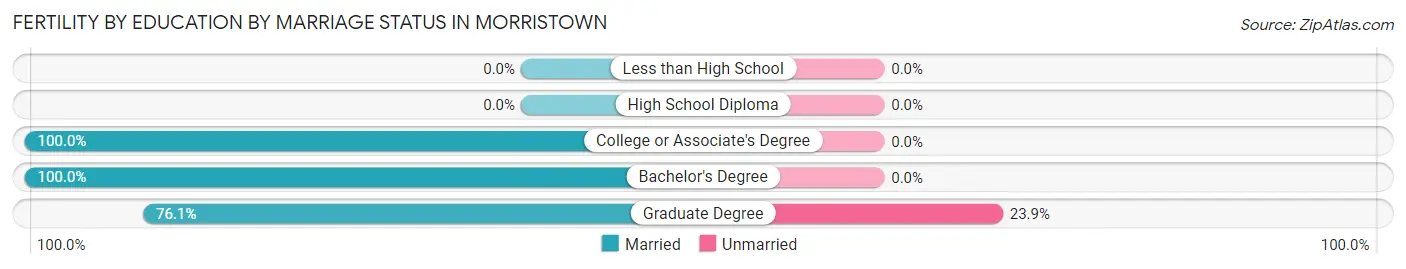
| Educational Attainment | Married | Unmarried |
| Less than High School | 0 (0.0%) | 0 (0.0%) |
| High School Diploma | 0 (0.0%) | 0 (0.0%) |
| College or Associate's Degree | 36 (100.0%) | 0 (0.0%) |
| Bachelor's Degree | 138 (100.0%) | 0 (0.0%) |
| Graduate Degree | 51 (76.1%) | 16 (23.9%) |
| Total | 225 (93.4%) | 16 (6.6%) |
Income in Morristown
Income Overview in Morristown
Per Capita Income in Morristown is $66,283, while median incomes of families and households are $136,607 and $113,926 respectively.
| Characteristic | Number | Measure |
| Per Capita Income | 20,126 | $66,283 |
| Median Family Income | 4,166 | $136,607 |
| Mean Family Income | 4,166 | $174,363 |
| Median Household Income | 8,949 | $113,926 |
| Mean Household Income | 8,949 | $146,879 |
| Income Deficit | 4,166 | $10,910 |
| Wage / Income Gap (%) | 20,126 | 4.33% |
| Wage / Income Gap ($) | 20,126 | 95.67¢ per $1 |
| Gini / Inequality Index | 20,126 | 0.44 |
Earnings by Sex in Morristown
Average Earnings in Morristown are $66,941, $68,367 for men and $65,409 for women, a difference of 4.3%.
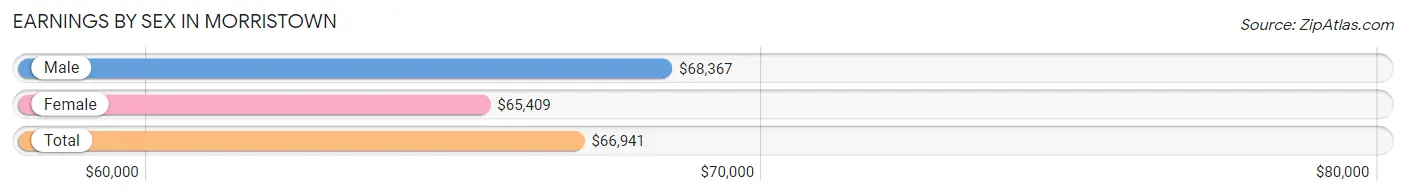
| Sex | Number | Average Earnings |
| Male | 7,359 (55.3%) | $68,367 |
| Female | 5,947 (44.7%) | $65,409 |
| Total | 13,306 (100.0%) | $66,941 |
Earnings by Sex by Income Bracket in Morristown
The most common earnings brackets in Morristown are $100,000+ for men (2,349 | 31.9%) and $100,000+ for women (1,176 | 19.8%).
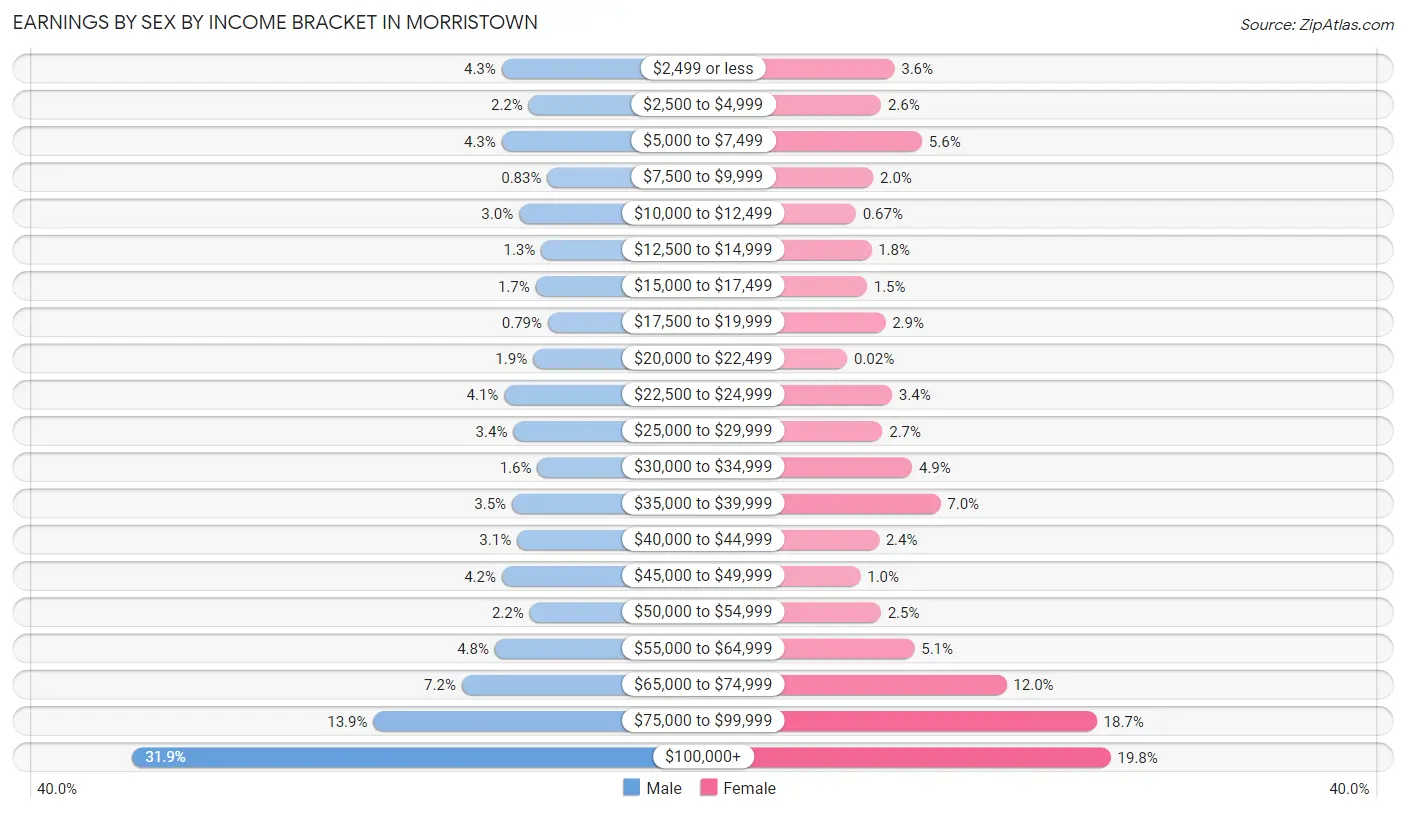
| Income | Male | Female |
| $2,499 or less | 313 (4.3%) | 212 (3.6%) |
| $2,500 to $4,999 | 164 (2.2%) | 152 (2.6%) |
| $5,000 to $7,499 | 313 (4.3%) | 335 (5.6%) |
| $7,500 to $9,999 | 61 (0.8%) | 117 (2.0%) |
| $10,000 to $12,499 | 217 (2.9%) | 40 (0.7%) |
| $12,500 to $14,999 | 95 (1.3%) | 109 (1.8%) |
| $15,000 to $17,499 | 126 (1.7%) | 89 (1.5%) |
| $17,500 to $19,999 | 58 (0.8%) | 171 (2.9%) |
| $20,000 to $22,499 | 140 (1.9%) | 1 (0.0%) |
| $22,500 to $24,999 | 299 (4.1%) | 201 (3.4%) |
| $25,000 to $29,999 | 249 (3.4%) | 158 (2.7%) |
| $30,000 to $34,999 | 116 (1.6%) | 291 (4.9%) |
| $35,000 to $39,999 | 256 (3.5%) | 417 (7.0%) |
| $40,000 to $44,999 | 228 (3.1%) | 142 (2.4%) |
| $45,000 to $49,999 | 312 (4.2%) | 60 (1.0%) |
| $50,000 to $54,999 | 159 (2.2%) | 151 (2.5%) |
| $55,000 to $64,999 | 350 (4.8%) | 301 (5.1%) |
| $65,000 to $74,999 | 533 (7.2%) | 711 (12.0%) |
| $75,000 to $99,999 | 1,021 (13.9%) | 1,113 (18.7%) |
| $100,000+ | 2,349 (31.9%) | 1,176 (19.8%) |
| Total | 7,359 (100.0%) | 5,947 (100.0%) |
Earnings by Sex by Educational Attainment in Morristown
Average earnings in Morristown are $75,783 for men and $66,389 for women, a difference of 12.4%. Men with an educational attainment of graduate degree enjoy the highest average annual earnings of $148,906, while those with high school diploma education earn the least with $36,659. Women with an educational attainment of graduate degree earn the most with the average annual earnings of $92,411, while those with high school diploma education have the smallest earnings of $27,868.
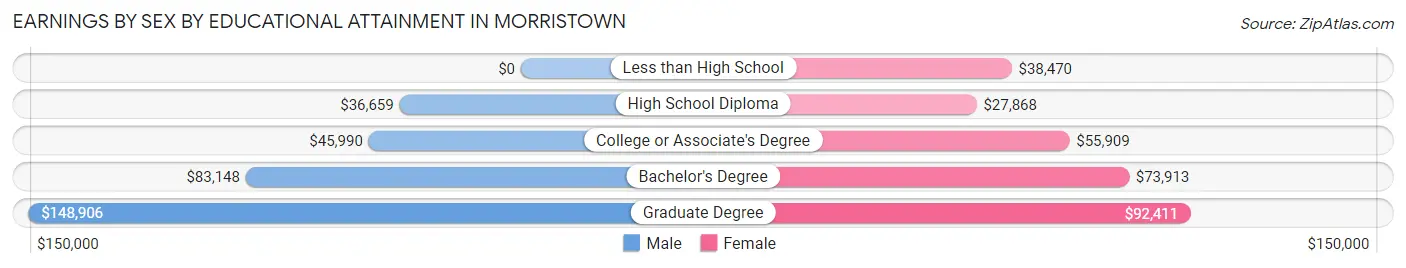
| Educational Attainment | Male Income | Female Income |
| Less than High School | - | - |
| High School Diploma | $36,659 | $27,868 |
| College or Associate's Degree | $45,990 | $55,909 |
| Bachelor's Degree | $83,148 | $73,913 |
| Graduate Degree | $148,906 | $92,411 |
| Total | $75,783 | $66,389 |
Family Income in Morristown
Family Income Brackets in Morristown
According to the Morristown family income data, there are 1,383 families falling into the $200,000+ income range, which is the most common income bracket and makes up 33.2% of all families. Conversely, the $15,000 to $24,999 income bracket is the least frequent group with only 71 families (1.7%) belonging to this category.
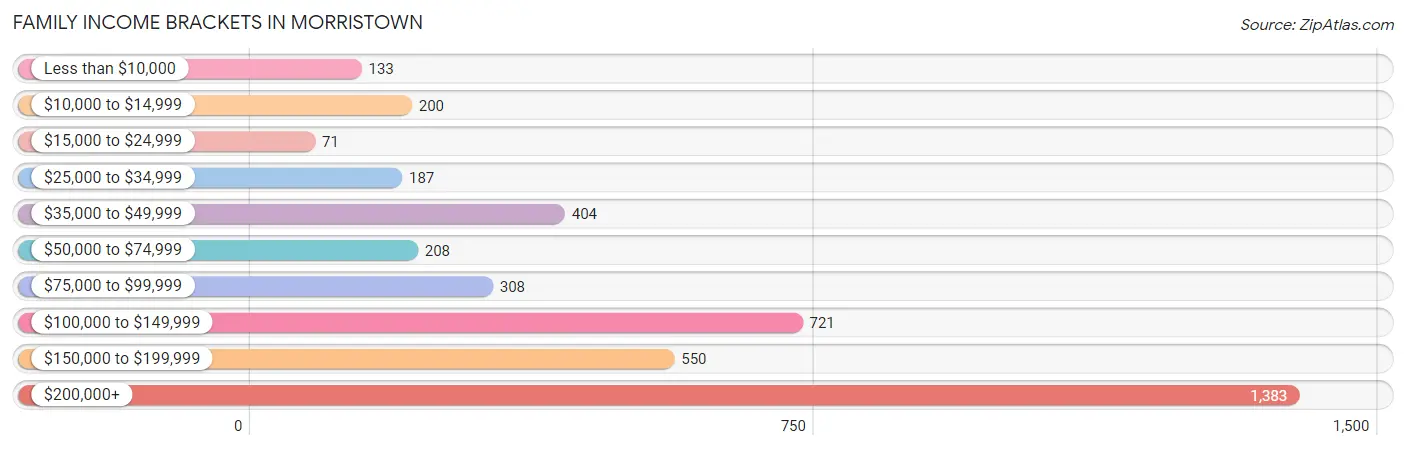
| Income Bracket | # Families | % Families |
| Less than $10,000 | 133 | 3.2% |
| $10,000 to $14,999 | 200 | 4.8% |
| $15,000 to $24,999 | 71 | 1.7% |
| $25,000 to $34,999 | 187 | 4.5% |
| $35,000 to $49,999 | 404 | 9.7% |
| $50,000 to $74,999 | 208 | 5.0% |
| $75,000 to $99,999 | 308 | 7.4% |
| $100,000 to $149,999 | 721 | 17.3% |
| $150,000 to $199,999 | 550 | 13.2% |
| $200,000+ | 1,383 | 33.2% |
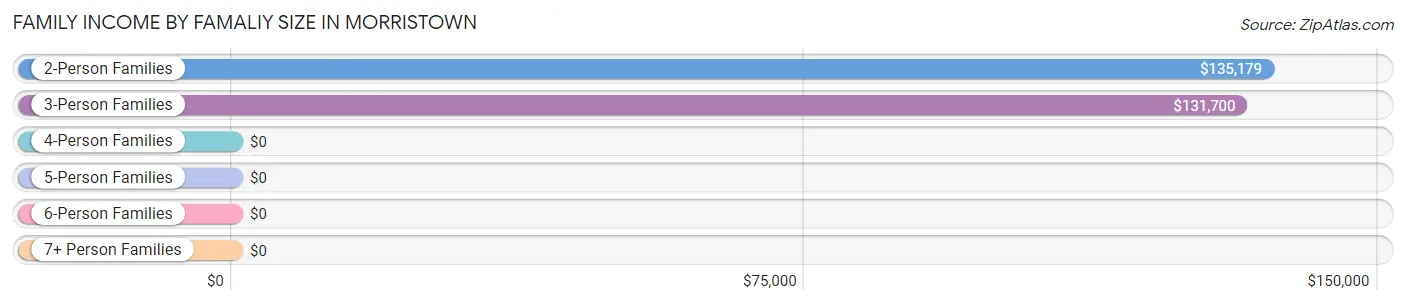
Family Income by Famaliy Size in Morristown
2-person families (1,972 | 47.3%) account for the highest median family income in Morristown with $135,179 per family, while 2-person families (1,972 | 47.3%) have the highest median income of $67,590 per family member.
| Income Bracket | # Families | Median Income |
| 2-Person Families | 1,972 (47.3%) | $135,179 |
| 3-Person Families | 1,332 (32.0%) | $131,700 |
| 4-Person Families | 516 (12.4%) | $0 |
| 5-Person Families | 190 (4.6%) | $0 |
| 6-Person Families | 126 (3.0%) | $0 |
| 7+ Person Families | 30 (0.7%) | $0 |
| Total | 4,166 (100.0%) | $136,607 |
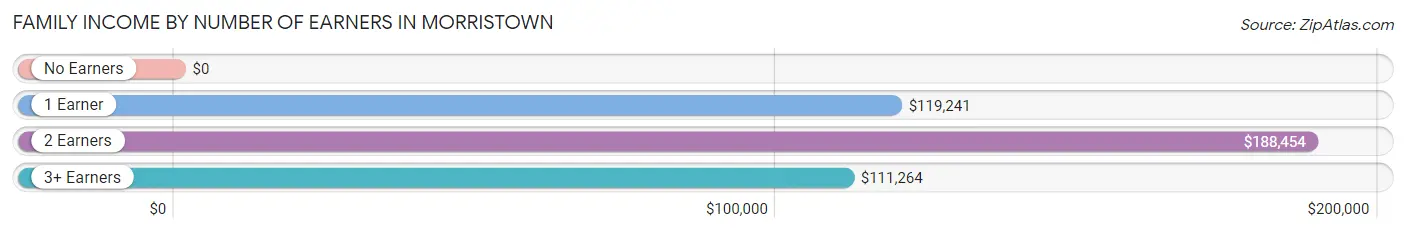
Family Income by Number of Earners in Morristown
| Number of Earners | # Families | Median Income |
| No Earners | 324 (7.8%) | $0 |
| 1 Earner | 1,471 (35.3%) | $119,241 |
| 2 Earners | 1,687 (40.5%) | $188,454 |
| 3+ Earners | 684 (16.4%) | $111,264 |
| Total | 4,166 (100.0%) | $136,607 |
Household Income in Morristown
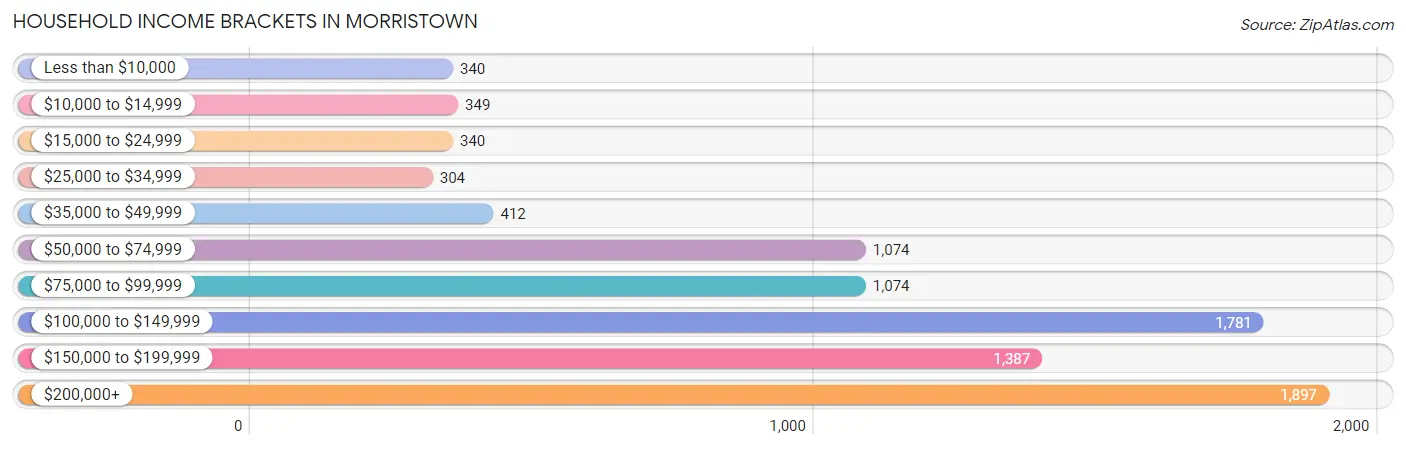
Household Income Brackets in Morristown
With 1,897 households falling in the category, the $200,000+ income range is the most frequent in Morristown, accounting for 21.2% of all households. In contrast, only 304 households (3.4%) fall into the $25,000 to $34,999 income bracket, making it the least populous group.
| Income Bracket | # Households | % Households |
| Less than $10,000 | 340 | 3.8% |
| $10,000 to $14,999 | 349 | 3.9% |
| $15,000 to $24,999 | 340 | 3.8% |
| $25,000 to $34,999 | 304 | 3.4% |
| $35,000 to $49,999 | 412 | 4.6% |
| $50,000 to $74,999 | 1,074 | 12.0% |
| $75,000 to $99,999 | 1,074 | 12.0% |
| $100,000 to $149,999 | 1,781 | 19.9% |
| $150,000 to $199,999 | 1,387 | 15.5% |
| $200,000+ | 1,897 | 21.2% |
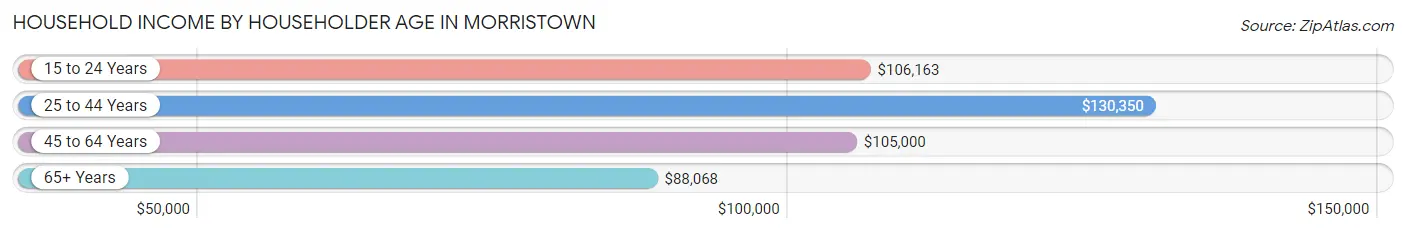
Household Income by Householder Age in Morristown
The median household income in Morristown is $113,926, with the highest median household income of $130,350 found in the 25 to 44 years age bracket for the primary householder. A total of 4,247 households (47.5%) fall into this category. Meanwhile, the 65+ years age bracket for the primary householder has the lowest median household income of $88,068, with 1,648 households (18.4%) in this group.
| Income Bracket | # Households | Median Income |
| 15 to 24 Years | 296 (3.3%) | $106,163 |
| 25 to 44 Years | 4,247 (47.5%) | $130,350 |
| 45 to 64 Years | 2,758 (30.8%) | $105,000 |
| 65+ Years | 1,648 (18.4%) | $88,068 |
| Total | 8,949 (100.0%) | $113,926 |
Poverty in Morristown
Income Below Poverty by Sex and Age in Morristown
With 9.3% poverty level for males and 12.9% for females among the residents of Morristown, 12 to 14 year old males and 12 to 14 year old females are the most vulnerable to poverty, with 129 males (72.5%) and 101 females (42.6%) in their respective age groups living below the poverty level.
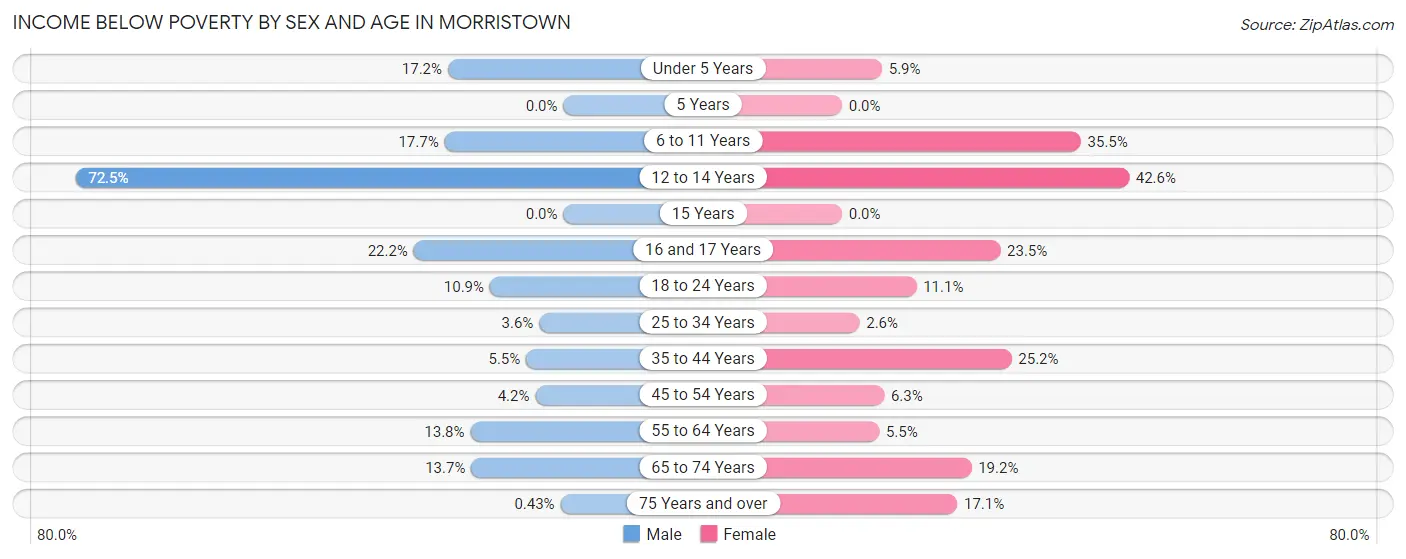
| Age Bracket | Male | Female |
| Under 5 Years | 83 (17.2%) | 37 (5.9%) |
| 5 Years | 0 (0.0%) | 0 (0.0%) |
| 6 to 11 Years | 33 (17.6%) | 206 (35.5%) |
| 12 to 14 Years | 129 (72.5%) | 101 (42.6%) |
| 15 Years | 0 (0.0%) | 0 (0.0%) |
| 16 and 17 Years | 32 (22.2%) | 63 (23.5%) |
| 18 to 24 Years | 106 (10.9%) | 100 (11.1%) |
| 25 to 34 Years | 107 (3.6%) | 62 (2.6%) |
| 35 to 44 Years | 67 (5.5%) | 358 (25.2%) |
| 45 to 54 Years | 39 (4.2%) | 62 (6.3%) |
| 55 to 64 Years | 175 (13.8%) | 58 (5.5%) |
| 65 to 74 Years | 125 (13.7%) | 162 (19.2%) |
| 75 Years and over | 1 (0.4%) | 96 (17.1%) |
| Total | 897 (9.3%) | 1,305 (12.9%) |
Income Above Poverty by Sex and Age in Morristown
According to the poverty statistics in Morristown, males aged 5 years and females aged 5 years are the age groups that are most secure financially, with 100.0% of males and 100.0% of females in these age groups living above the poverty line.
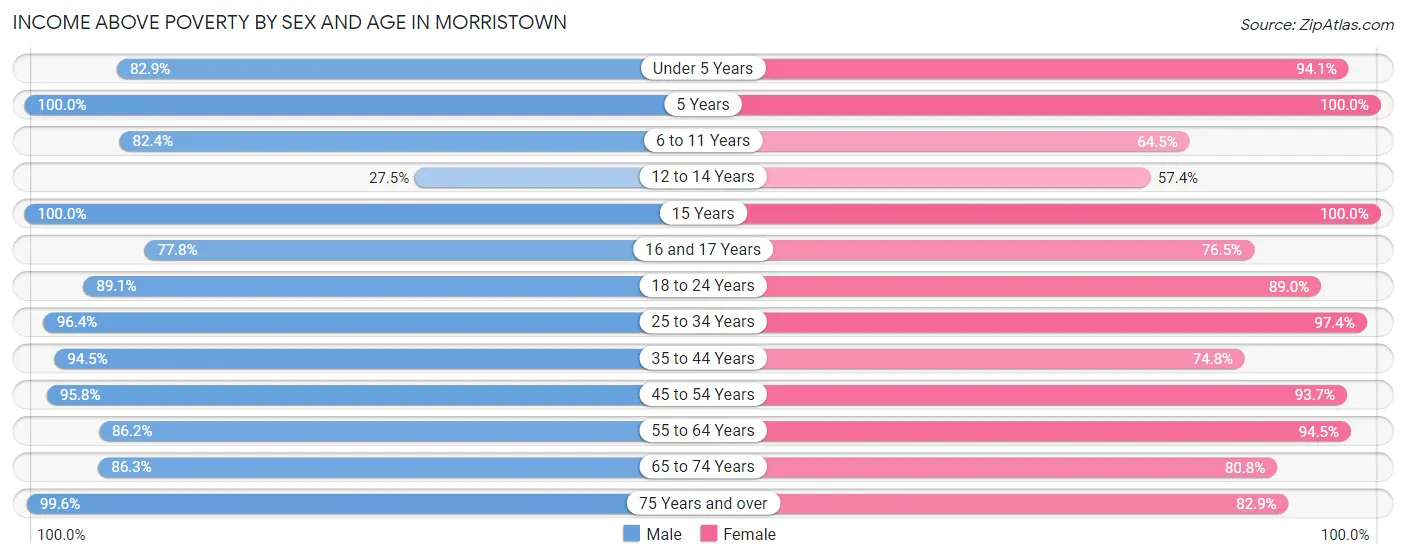
| Age Bracket | Male | Female |
| Under 5 Years | 401 (82.9%) | 586 (94.1%) |
| 5 Years | 68 (100.0%) | 214 (100.0%) |
| 6 to 11 Years | 154 (82.4%) | 375 (64.5%) |
| 12 to 14 Years | 49 (27.5%) | 136 (57.4%) |
| 15 Years | 42 (100.0%) | 50 (100.0%) |
| 16 and 17 Years | 112 (77.8%) | 205 (76.5%) |
| 18 to 24 Years | 866 (89.1%) | 805 (88.9%) |
| 25 to 34 Years | 2,877 (96.4%) | 2,327 (97.4%) |
| 35 to 44 Years | 1,144 (94.5%) | 1,064 (74.8%) |
| 45 to 54 Years | 896 (95.8%) | 928 (93.7%) |
| 55 to 64 Years | 1,092 (86.2%) | 992 (94.5%) |
| 65 to 74 Years | 789 (86.3%) | 681 (80.8%) |
| 75 Years and over | 234 (99.6%) | 465 (82.9%) |
| Total | 8,724 (90.7%) | 8,828 (87.1%) |
Income Below Poverty Among Married-Couple Families in Morristown
The poverty statistics for married-couple families in Morristown show that 4.0% or 115 of the total 2,876 families live below the poverty line. Families with 3 or 4 children have the highest poverty rate of 13.1%, comprising of 30 families. On the other hand, families with no children have the lowest poverty rate of 1.7%, which includes 29 families.
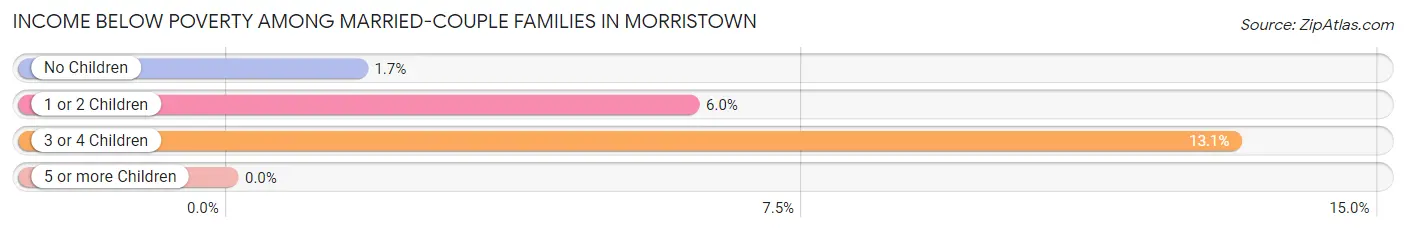
| Children | Above Poverty | Below Poverty |
| No Children | 1,688 (98.3%) | 29 (1.7%) |
| 1 or 2 Children | 874 (94.0%) | 56 (6.0%) |
| 3 or 4 Children | 199 (86.9%) | 30 (13.1%) |
| 5 or more Children | 0 (0.0%) | 0 (0.0%) |
| Total | 2,761 (96.0%) | 115 (4.0%) |
Income Below Poverty Among Single-Parent Households in Morristown
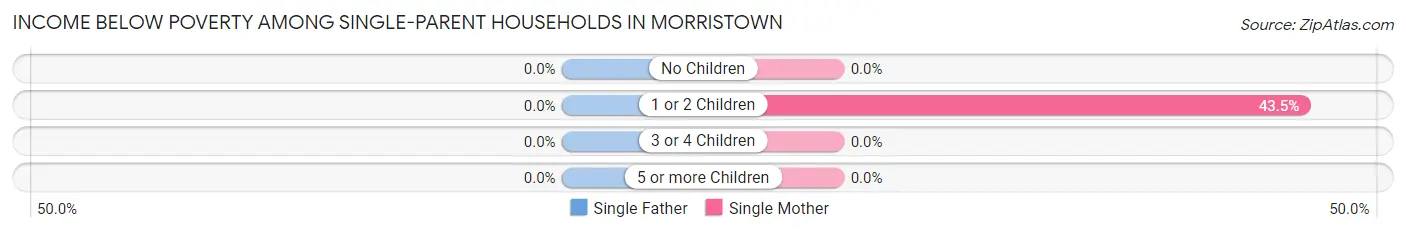
| Children | Single Father | Single Mother |
| No Children | 0 (0.0%) | 0 (0.0%) |
| 1 or 2 Children | 0 (0.0%) | 302 (43.5%) |
| 3 or 4 Children | 0 (0.0%) | 0 (0.0%) |
| 5 or more Children | 0 (0.0%) | 0 (0.0%) |
| Total | 0 (0.0%) | 302 (30.0%) |
Income Below Poverty Among Married-Couple vs Single-Parent Households in Morristown
The poverty data for Morristown shows that 115 of the married-couple family households (4.0%) and 302 of the single-parent households (23.4%) are living below the poverty level. Within the married-couple family households, those with 3 or 4 children have the highest poverty rate, with 30 households (13.1%) falling below the poverty line. Among the single-parent households, those with 1 or 2 children have the highest poverty rate, with 302 household (38.3%) living below poverty.
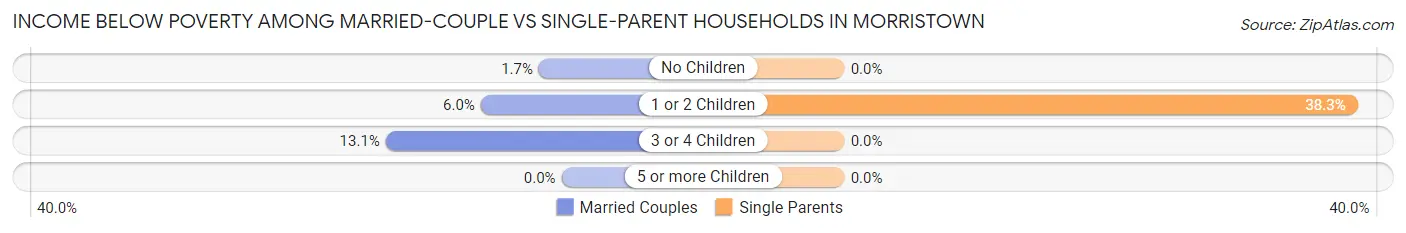
| Children | Married-Couple Families | Single-Parent Households |
| No Children | 29 (1.7%) | 0 (0.0%) |
| 1 or 2 Children | 56 (6.0%) | 302 (38.3%) |
| 3 or 4 Children | 30 (13.1%) | 0 (0.0%) |
| 5 or more Children | 0 (0.0%) | 0 (0.0%) |
| Total | 115 (4.0%) | 302 (23.4%) |
Employment Characteristics in Morristown
Employment by Class of Employer in Morristown
Among the 12,042 employed individuals in Morristown, private company employees (8,885 | 73.8%), local government employees (863 | 7.2%), and not-for-profit organizations (779 | 6.5%) make up the most common classes of employment.
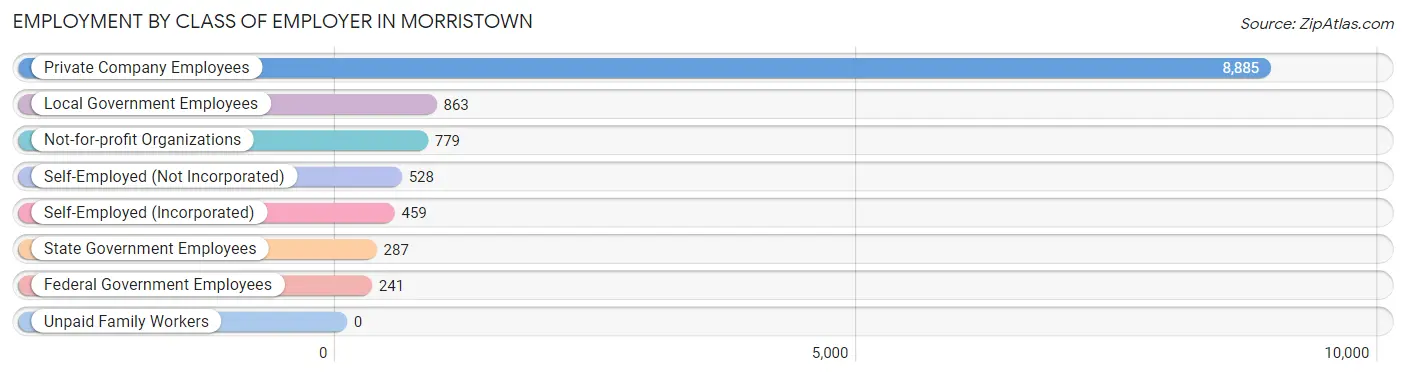
| Employer Class | # Employees | % Employees |
| Private Company Employees | 8,885 | 73.8% |
| Self-Employed (Incorporated) | 459 | 3.8% |
| Self-Employed (Not Incorporated) | 528 | 4.4% |
| Not-for-profit Organizations | 779 | 6.5% |
| Local Government Employees | 863 | 7.2% |
| State Government Employees | 287 | 2.4% |
| Federal Government Employees | 241 | 2.0% |
| Unpaid Family Workers | 0 | 0.0% |
| Total | 12,042 | 100.0% |
Employment Status by Age in Morristown
According to the labor force statistics for Morristown, out of the total population over 16 years of age (17,462), 75.0% or 13,096 individuals are in the labor force, with 4.7% or 616 of them unemployed. The age group with the highest labor force participation rate is 25 to 29 years, with 92.4% or 2,798 individuals in the labor force. Within the labor force, the 60 to 64 years age range has the highest percentage of unemployed individuals, with 14.1% or 86 of them being unemployed.
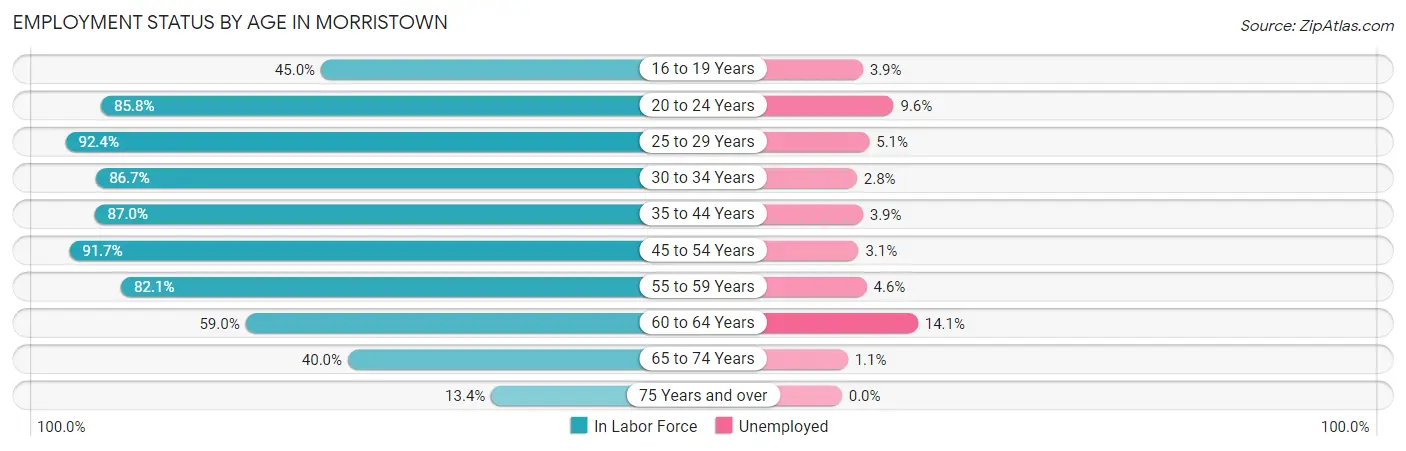
| Age Bracket | In Labor Force | Unemployed |
| 16 to 19 Years | 436 (45.0%) | 17 (3.9%) |
| 20 to 24 Years | 1,204 (85.8%) | 116 (9.6%) |
| 25 to 29 Years | 2,798 (92.4%) | 143 (5.1%) |
| 30 to 34 Years | 2,033 (86.7%) | 57 (2.8%) |
| 35 to 44 Years | 2,291 (87.0%) | 89 (3.9%) |
| 45 to 54 Years | 1,776 (91.7%) | 55 (3.1%) |
| 55 to 59 Years | 1,089 (82.1%) | 50 (4.6%) |
| 60 to 64 Years | 608 (59.0%) | 86 (14.1%) |
| 65 to 74 Years | 725 (40.0%) | 8 (1.1%) |
| 75 Years and over | 131 (13.4%) | 0 (0.0%) |
| Total | 13,096 (75.0%) | 616 (4.7%) |
Employment Status by Educational Attainment in Morristown
According to labor force statistics for Morristown, 86.2% of individuals (10,602) out of the total population between 25 and 64 years of age (12,299) are in the labor force, with 4.5% or 477 of them being unemployed. The group with the highest labor force participation rate are those with the educational attainment of less than high school, with 90.7% or 716 individuals in the labor force. Within the labor force, individuals with college / associate degree education have the highest percentage of unemployment, with 14.1% or 185 of them being unemployed.
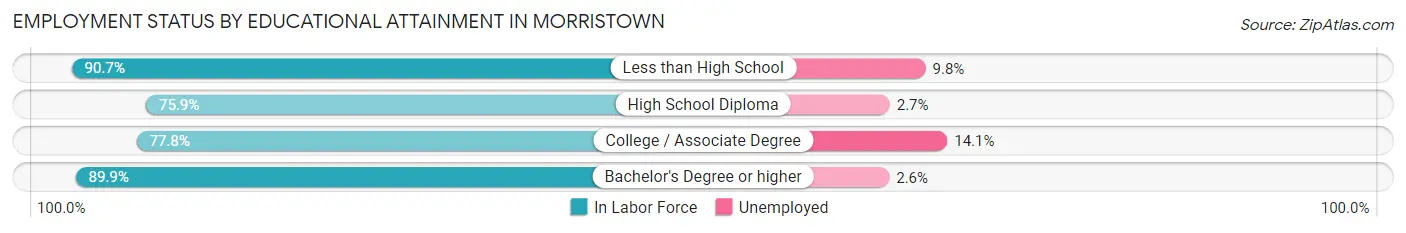
| Educational Attainment | In Labor Force | Unemployed |
| Less than High School | 716 (90.7%) | 77 (9.8%) |
| High School Diploma | 1,420 (75.9%) | 51 (2.7%) |
| College / Associate Degree | 1,313 (77.8%) | 238 (14.1%) |
| Bachelor's Degree or higher | 7,148 (89.9%) | 207 (2.6%) |
| Total | 10,602 (86.2%) | 553 (4.5%) |
Employment Occupations by Sex in Morristown
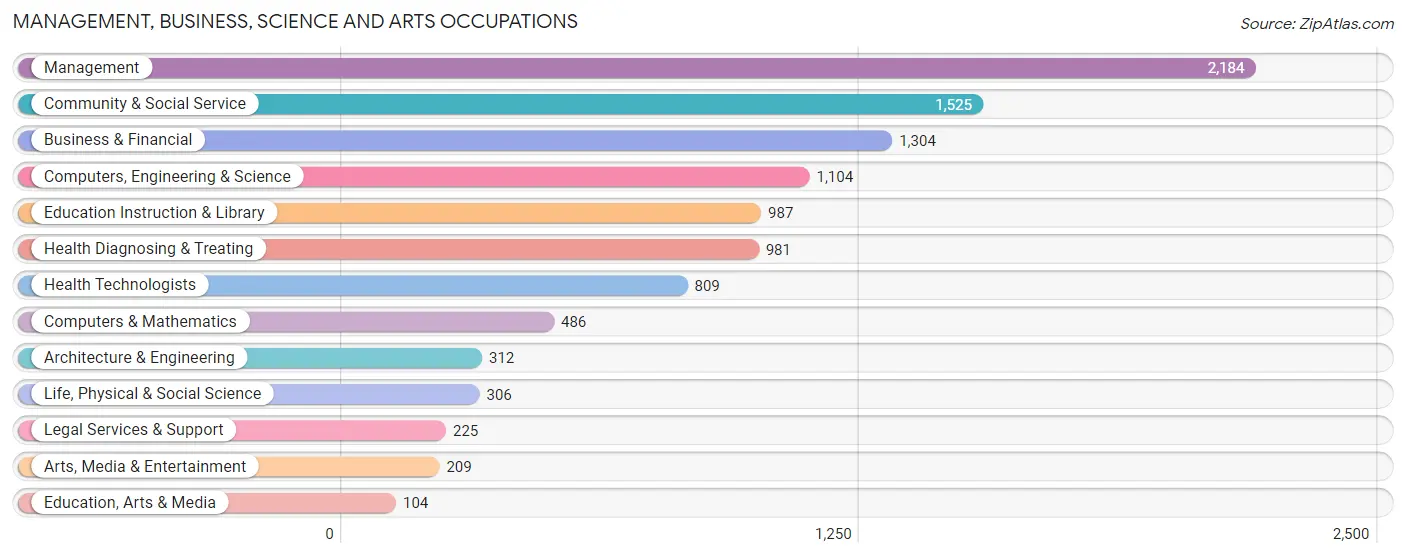
Management, Business, Science and Arts Occupations
The most common Management, Business, Science and Arts occupations in Morristown are Management (2,184 | 17.5%), Community & Social Service (1,525 | 12.2%), Business & Financial (1,304 | 10.4%), Computers, Engineering & Science (1,104 | 8.8%), and Education Instruction & Library (987 | 7.9%).
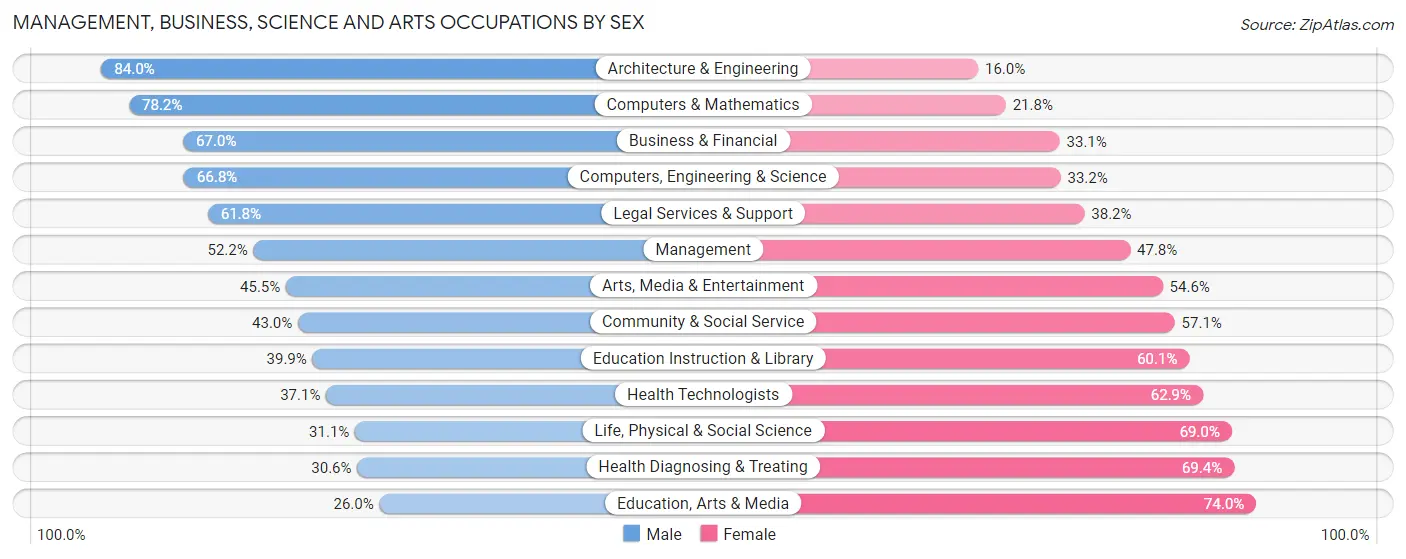
Management, Business, Science and Arts Occupations by Sex
Within the Management, Business, Science and Arts occupations in Morristown, the most male-oriented occupations are Architecture & Engineering (84.0%), Computers & Mathematics (78.2%), and Business & Financial (66.9%), while the most female-oriented occupations are Education, Arts & Media (74.0%), Health Diagnosing & Treating (69.4%), and Life, Physical & Social Science (69.0%).
| Occupation | Male | Female |
| Management | 1,141 (52.2%) | 1,043 (47.8%) |
| Business & Financial | 873 (66.9%) | 431 (33.1%) |
| Computers, Engineering & Science | 737 (66.8%) | 367 (33.2%) |
| Computers & Mathematics | 380 (78.2%) | 106 (21.8%) |
| Architecture & Engineering | 262 (84.0%) | 50 (16.0%) |
| Life, Physical & Social Science | 95 (31.0%) | 211 (69.0%) |
| Community & Social Service | 655 (42.9%) | 870 (57.1%) |
| Education, Arts & Media | 27 (26.0%) | 77 (74.0%) |
| Legal Services & Support | 139 (61.8%) | 86 (38.2%) |
| Education Instruction & Library | 394 (39.9%) | 593 (60.1%) |
| Arts, Media & Entertainment | 95 (45.5%) | 114 (54.5%) |
| Health Diagnosing & Treating | 300 (30.6%) | 681 (69.4%) |
| Health Technologists | 300 (37.1%) | 509 (62.9%) |
| Total (Category) | 3,706 (52.2%) | 3,392 (47.8%) |
| Total (Overall) | 6,982 (56.0%) | 5,491 (44.0%) |
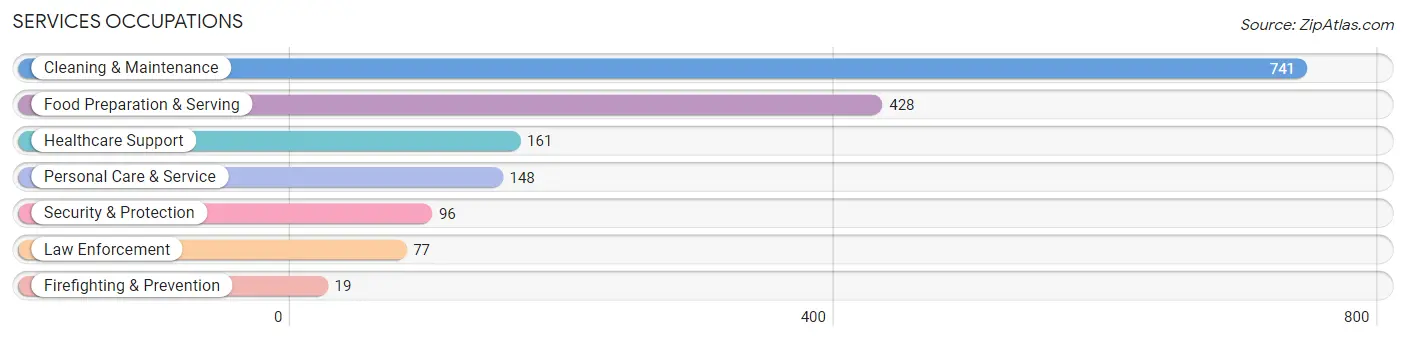
Services Occupations
The most common Services occupations in Morristown are Cleaning & Maintenance (741 | 5.9%), Food Preparation & Serving (428 | 3.4%), Healthcare Support (161 | 1.3%), Personal Care & Service (148 | 1.2%), and Security & Protection (96 | 0.8%).
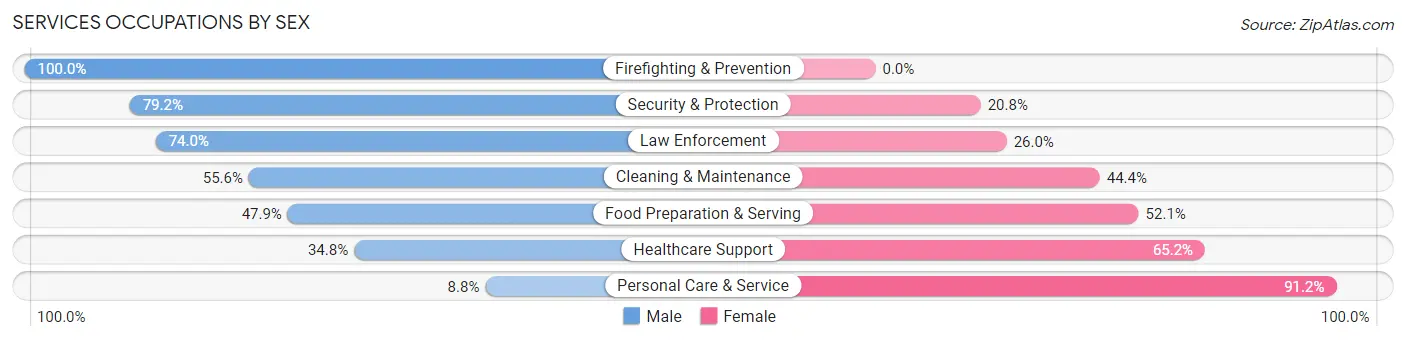
Services Occupations by Sex
Within the Services occupations in Morristown, the most male-oriented occupations are Firefighting & Prevention (100.0%), Security & Protection (79.2%), and Law Enforcement (74.0%), while the most female-oriented occupations are Personal Care & Service (91.2%), Healthcare Support (65.2%), and Food Preparation & Serving (52.1%).
| Occupation | Male | Female |
| Healthcare Support | 56 (34.8%) | 105 (65.2%) |
| Security & Protection | 76 (79.2%) | 20 (20.8%) |
| Firefighting & Prevention | 19 (100.0%) | 0 (0.0%) |
| Law Enforcement | 57 (74.0%) | 20 (26.0%) |
| Food Preparation & Serving | 205 (47.9%) | 223 (52.1%) |
| Cleaning & Maintenance | 412 (55.6%) | 329 (44.4%) |
| Personal Care & Service | 13 (8.8%) | 135 (91.2%) |
| Total (Category) | 762 (48.4%) | 812 (51.6%) |
| Total (Overall) | 6,982 (56.0%) | 5,491 (44.0%) |
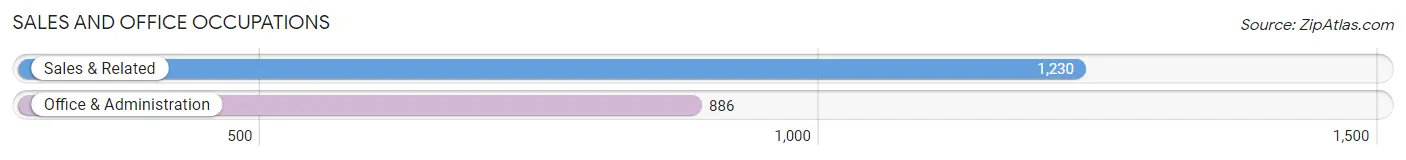
Sales and Office Occupations
The most common Sales and Office occupations in Morristown are Sales & Related (1,230 | 9.9%), and Office & Administration (886 | 7.1%).
Sales and Office Occupations by Sex
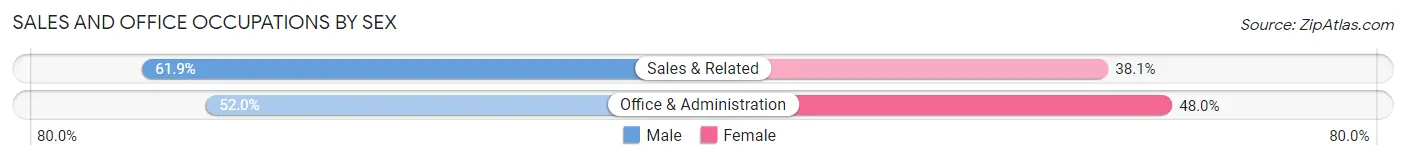
| Occupation | Male | Female |
| Sales & Related | 761 (61.9%) | 469 (38.1%) |
| Office & Administration | 461 (52.0%) | 425 (48.0%) |
| Total (Category) | 1,222 (57.8%) | 894 (42.2%) |
| Total (Overall) | 6,982 (56.0%) | 5,491 (44.0%) |
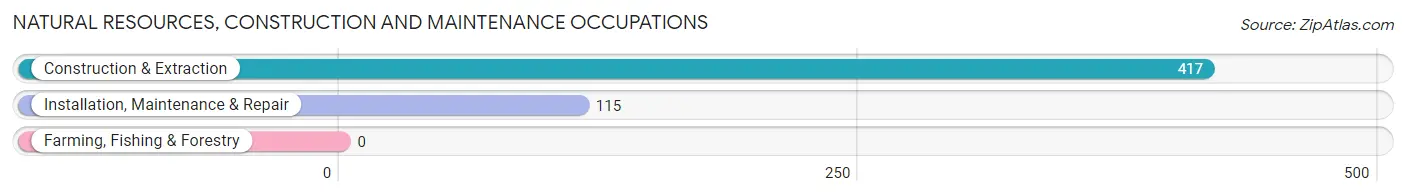
Natural Resources, Construction and Maintenance Occupations
The most common Natural Resources, Construction and Maintenance occupations in Morristown are Construction & Extraction (417 | 3.3%), and Installation, Maintenance & Repair (115 | 0.9%).
Natural Resources, Construction and Maintenance Occupations by Sex
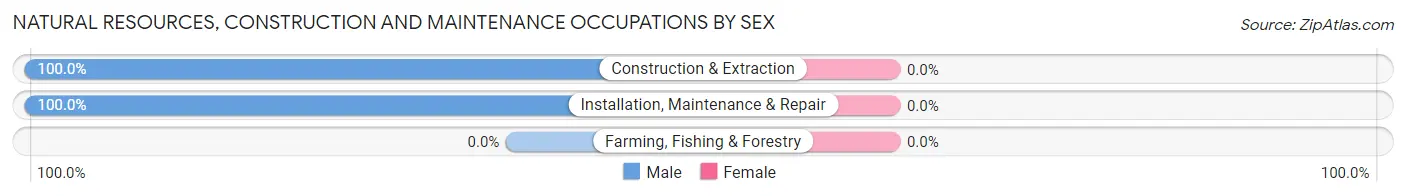
| Occupation | Male | Female |
| Farming, Fishing & Forestry | 0 (0.0%) | 0 (0.0%) |
| Construction & Extraction | 417 (100.0%) | 0 (0.0%) |
| Installation, Maintenance & Repair | 115 (100.0%) | 0 (0.0%) |
| Total (Category) | 532 (100.0%) | 0 (0.0%) |
| Total (Overall) | 6,982 (56.0%) | 5,491 (44.0%) |
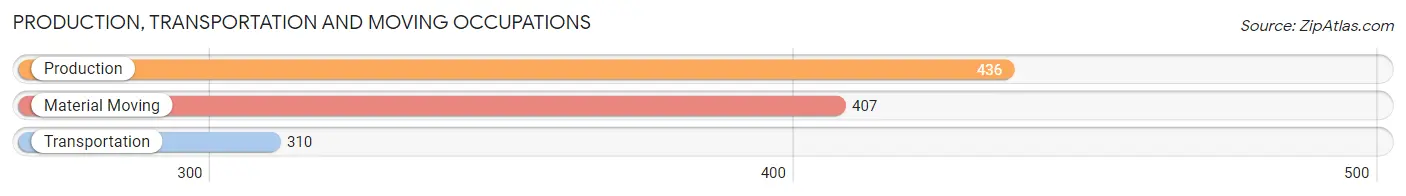
Production, Transportation and Moving Occupations
The most common Production, Transportation and Moving occupations in Morristown are Production (436 | 3.5%), Material Moving (407 | 3.3%), and Transportation (310 | 2.5%).
Production, Transportation and Moving Occupations by Sex
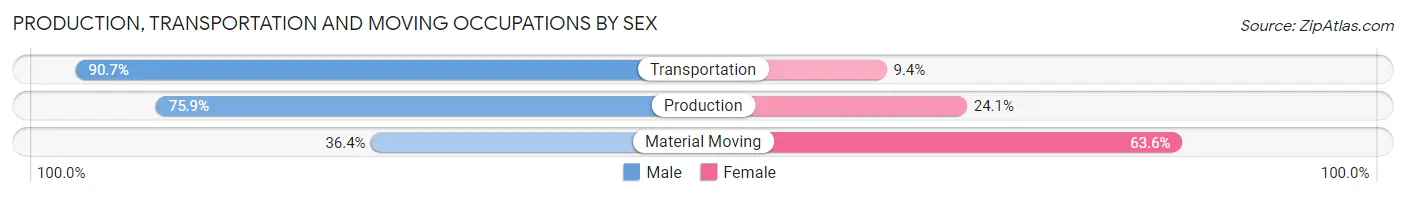
| Occupation | Male | Female |
| Production | 331 (75.9%) | 105 (24.1%) |
| Transportation | 281 (90.6%) | 29 (9.3%) |
| Material Moving | 148 (36.4%) | 259 (63.6%) |
| Total (Category) | 760 (65.9%) | 393 (34.1%) |
| Total (Overall) | 6,982 (56.0%) | 5,491 (44.0%) |
Employment Industries by Sex in Morristown
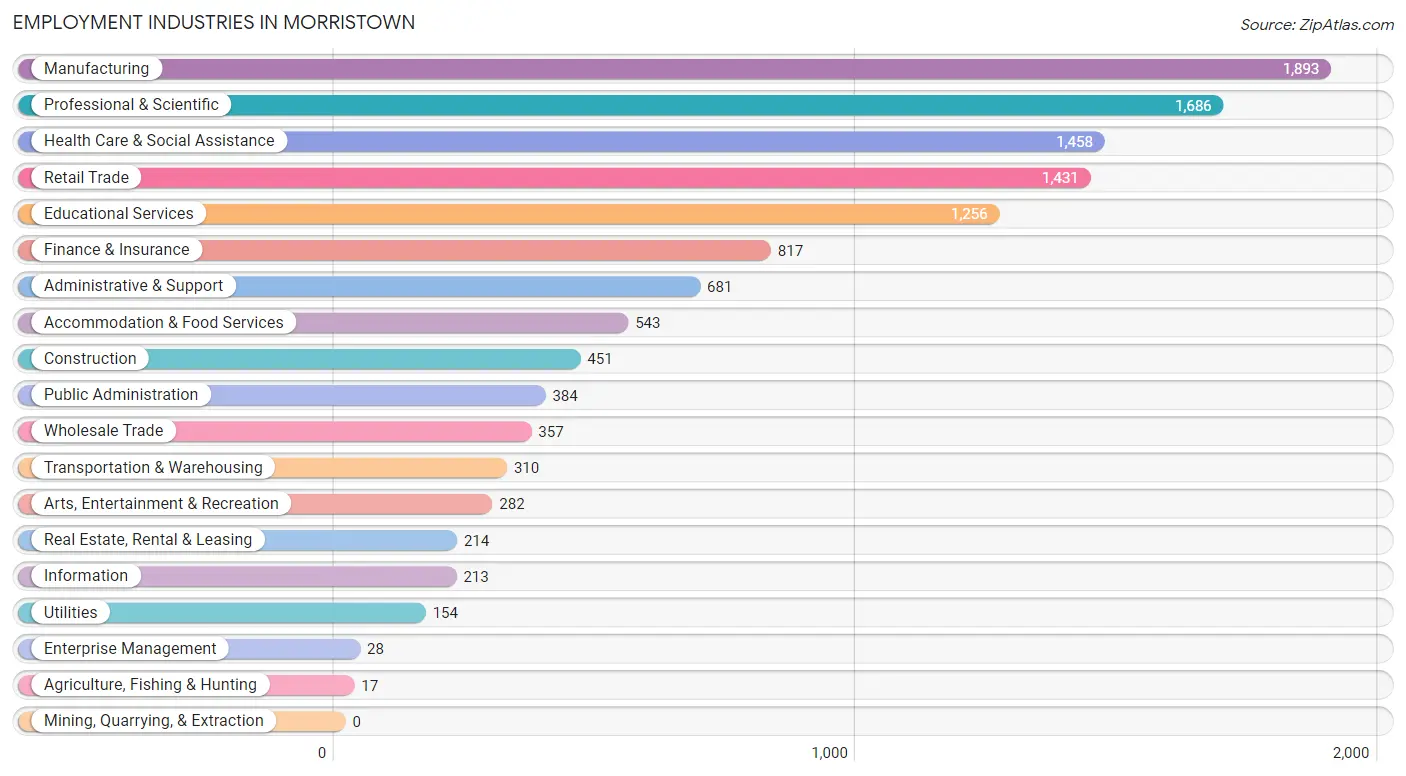
Employment Industries in Morristown
The major employment industries in Morristown include Manufacturing (1,893 | 15.2%), Professional & Scientific (1,686 | 13.5%), Health Care & Social Assistance (1,458 | 11.7%), Retail Trade (1,431 | 11.5%), and Educational Services (1,256 | 10.1%).
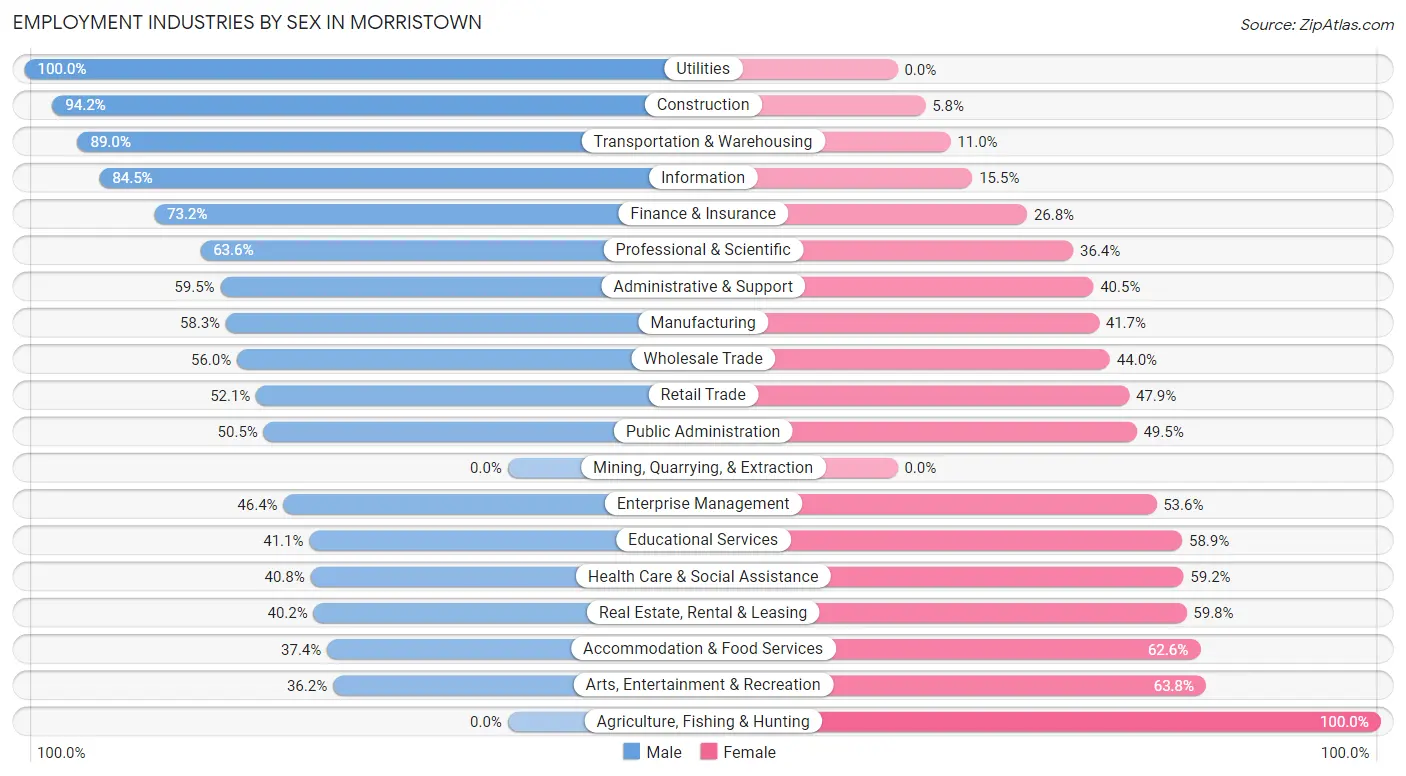
Employment Industries by Sex in Morristown
The Morristown industries that see more men than women are Utilities (100.0%), Construction (94.2%), and Transportation & Warehousing (89.0%), whereas the industries that tend to have a higher number of women are Agriculture, Fishing & Hunting (100.0%), Arts, Entertainment & Recreation (63.8%), and Accommodation & Food Services (62.6%).
| Industry | Male | Female |
| Agriculture, Fishing & Hunting | 0 (0.0%) | 17 (100.0%) |
| Mining, Quarrying, & Extraction | 0 (0.0%) | 0 (0.0%) |
| Construction | 425 (94.2%) | 26 (5.8%) |
| Manufacturing | 1,104 (58.3%) | 789 (41.7%) |
| Wholesale Trade | 200 (56.0%) | 157 (44.0%) |
| Retail Trade | 745 (52.1%) | 686 (47.9%) |
| Transportation & Warehousing | 276 (89.0%) | 34 (11.0%) |
| Utilities | 154 (100.0%) | 0 (0.0%) |
| Information | 180 (84.5%) | 33 (15.5%) |
| Finance & Insurance | 598 (73.2%) | 219 (26.8%) |
| Real Estate, Rental & Leasing | 86 (40.2%) | 128 (59.8%) |
| Professional & Scientific | 1,073 (63.6%) | 613 (36.4%) |
| Enterprise Management | 13 (46.4%) | 15 (53.6%) |
| Administrative & Support | 405 (59.5%) | 276 (40.5%) |
| Educational Services | 516 (41.1%) | 740 (58.9%) |
| Health Care & Social Assistance | 595 (40.8%) | 863 (59.2%) |
| Arts, Entertainment & Recreation | 102 (36.2%) | 180 (63.8%) |
| Accommodation & Food Services | 203 (37.4%) | 340 (62.6%) |
| Public Administration | 194 (50.5%) | 190 (49.5%) |
| Total | 6,982 (56.0%) | 5,491 (44.0%) |
Education in Morristown
School Enrollment in Morristown
The most common levels of schooling among the 4,183 students in Morristown are college / undergraduate (1,034 | 24.7%), graduate / professional (760 | 18.2%), and high school (754 | 18.0%).
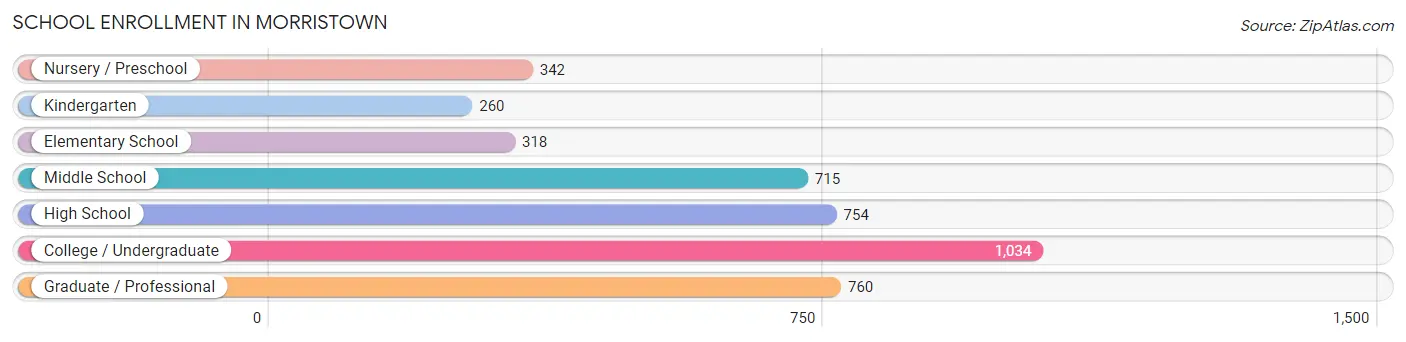
| School Level | # Students | % Students |
| Nursery / Preschool | 342 | 8.2% |
| Kindergarten | 260 | 6.2% |
| Elementary School | 318 | 7.6% |
| Middle School | 715 | 17.1% |
| High School | 754 | 18.0% |
| College / Undergraduate | 1,034 | 24.7% |
| Graduate / Professional | 760 | 18.2% |
| Total | 4,183 | 100.0% |
School Enrollment by Age by Funding Source in Morristown
Out of a total of 4,183 students who are enrolled in schools in Morristown, 841 (20.1%) attend a private institution, while the remaining 3,342 (79.9%) are enrolled in public schools. The age group of 3 to 4 year olds has the highest likelihood of being enrolled in private schools, with 139 (43.4% in the age bracket) enrolled. Conversely, the age group of 35 years and over has the lowest likelihood of being enrolled in a private school, with 32 (100.0% in the age bracket) attending a public institution.
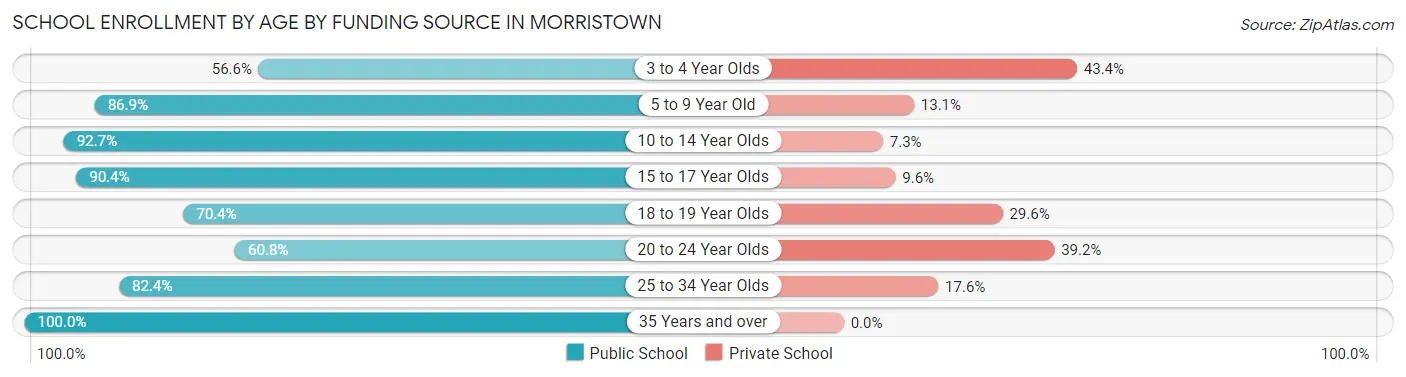
| Age Bracket | Public School | Private School |
| 3 to 4 Year Olds | 181 (56.6%) | 139 (43.4%) |
| 5 to 9 Year Old | 499 (86.9%) | 75 (13.1%) |
| 10 to 14 Year Olds | 826 (92.7%) | 65 (7.3%) |
| 15 to 17 Year Olds | 460 (90.4%) | 49 (9.6%) |
| 18 to 19 Year Olds | 288 (70.4%) | 121 (29.6%) |
| 20 to 24 Year Olds | 383 (60.8%) | 247 (39.2%) |
| 25 to 34 Year Olds | 674 (82.4%) | 144 (17.6%) |
| 35 Years and over | 32 (100.0%) | 0 (0.0%) |
| Total | 3,342 (79.9%) | 841 (20.1%) |
Educational Attainment by Field of Study in Morristown
Business (1,911 | 19.4%), social sciences (1,087 | 11.1%), science & technology (1,026 | 10.4%), bio, nature & agricultural (763 | 7.8%), and engineering (737 | 7.5%) are the most common fields of study among 9,830 individuals in Morristown who have obtained a bachelor's degree or higher.
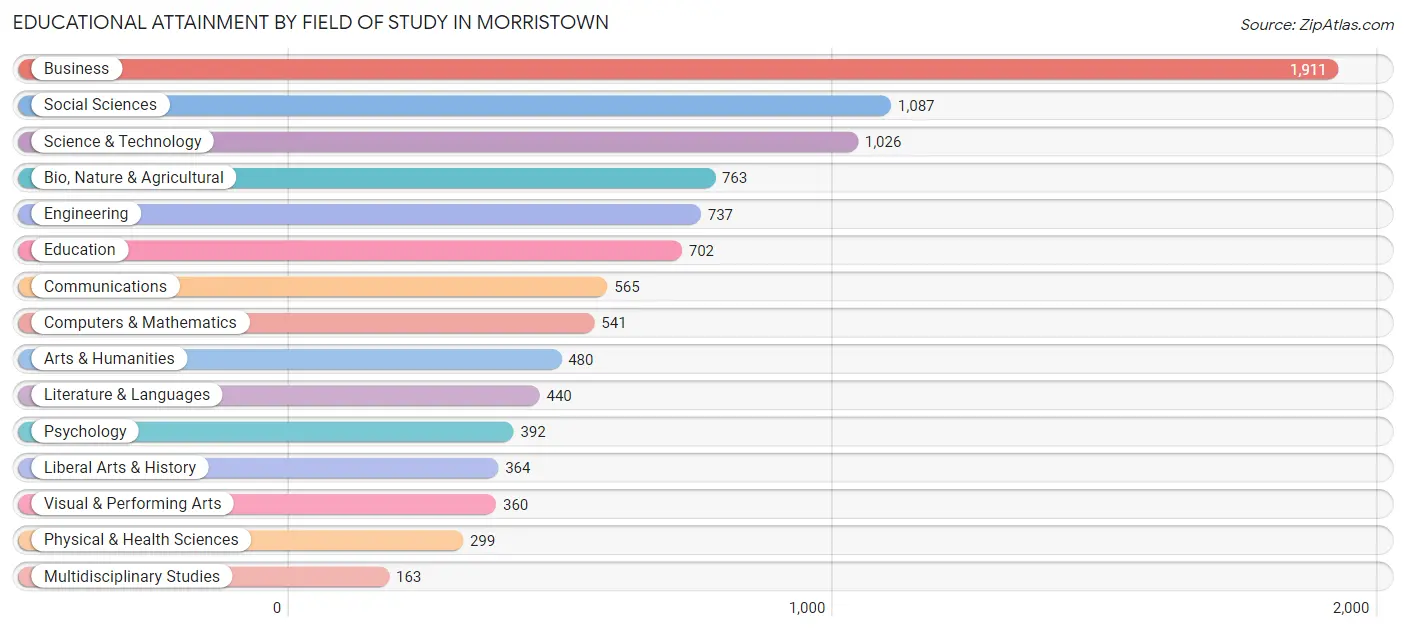
| Field of Study | # Graduates | % Graduates |
| Computers & Mathematics | 541 | 5.5% |
| Bio, Nature & Agricultural | 763 | 7.8% |
| Physical & Health Sciences | 299 | 3.0% |
| Psychology | 392 | 4.0% |
| Social Sciences | 1,087 | 11.1% |
| Engineering | 737 | 7.5% |
| Multidisciplinary Studies | 163 | 1.7% |
| Science & Technology | 1,026 | 10.4% |
| Business | 1,911 | 19.4% |
| Education | 702 | 7.1% |
| Literature & Languages | 440 | 4.5% |
| Liberal Arts & History | 364 | 3.7% |
| Visual & Performing Arts | 360 | 3.7% |
| Communications | 565 | 5.8% |
| Arts & Humanities | 480 | 4.9% |
| Total | 9,830 | 100.0% |
Transportation & Commute in Morristown
Vehicle Availability by Sex in Morristown
The most prevalent vehicle ownership categories in Morristown are males with 2 vehicles (2,487, accounting for 36.8%) and females with 2 vehicles (2,152, making up 47.5%).
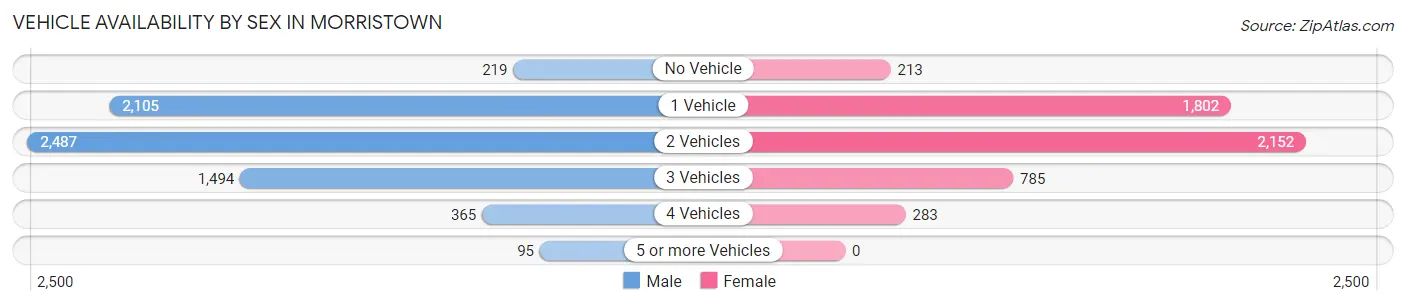
| Vehicles Available | Male | Female |
| No Vehicle | 219 (3.2%) | 213 (4.1%) |
| 1 Vehicle | 2,105 (31.1%) | 1,802 (34.4%) |
| 2 Vehicles | 2,487 (36.8%) | 2,152 (41.1%) |
| 3 Vehicles | 1,494 (22.1%) | 785 (15.0%) |
| 4 Vehicles | 365 (5.4%) | 283 (5.4%) |
| 5 or more Vehicles | 95 (1.4%) | 0 (0.0%) |
| Total | 6,765 (100.0%) | 5,235 (100.0%) |
Commute Time in Morristown
The most frequently occuring commute durations in Morristown are 15 to 19 minutes (1,988 commuters, 19.4%), 10 to 14 minutes (1,760 commuters, 17.2%), and 30 to 34 minutes (1,595 commuters, 15.5%).
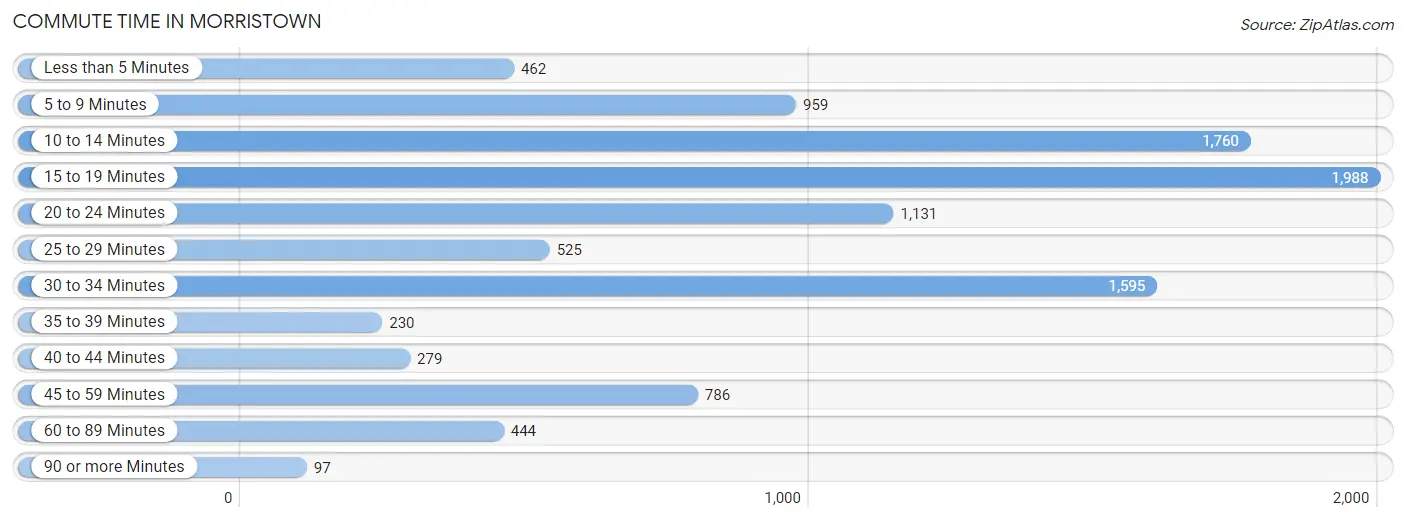
| Commute Time | # Commuters | % Commuters |
| Less than 5 Minutes | 462 | 4.5% |
| 5 to 9 Minutes | 959 | 9.3% |
| 10 to 14 Minutes | 1,760 | 17.2% |
| 15 to 19 Minutes | 1,988 | 19.4% |
| 20 to 24 Minutes | 1,131 | 11.0% |
| 25 to 29 Minutes | 525 | 5.1% |
| 30 to 34 Minutes | 1,595 | 15.5% |
| 35 to 39 Minutes | 230 | 2.2% |
| 40 to 44 Minutes | 279 | 2.7% |
| 45 to 59 Minutes | 786 | 7.7% |
| 60 to 89 Minutes | 444 | 4.3% |
| 90 or more Minutes | 97 | 0.9% |
Commute Time by Sex in Morristown
The most common commute times in Morristown are 10 to 14 minutes (1,203 commuters, 20.7%) for males and 15 to 19 minutes (1,040 commuters, 23.4%) for females.
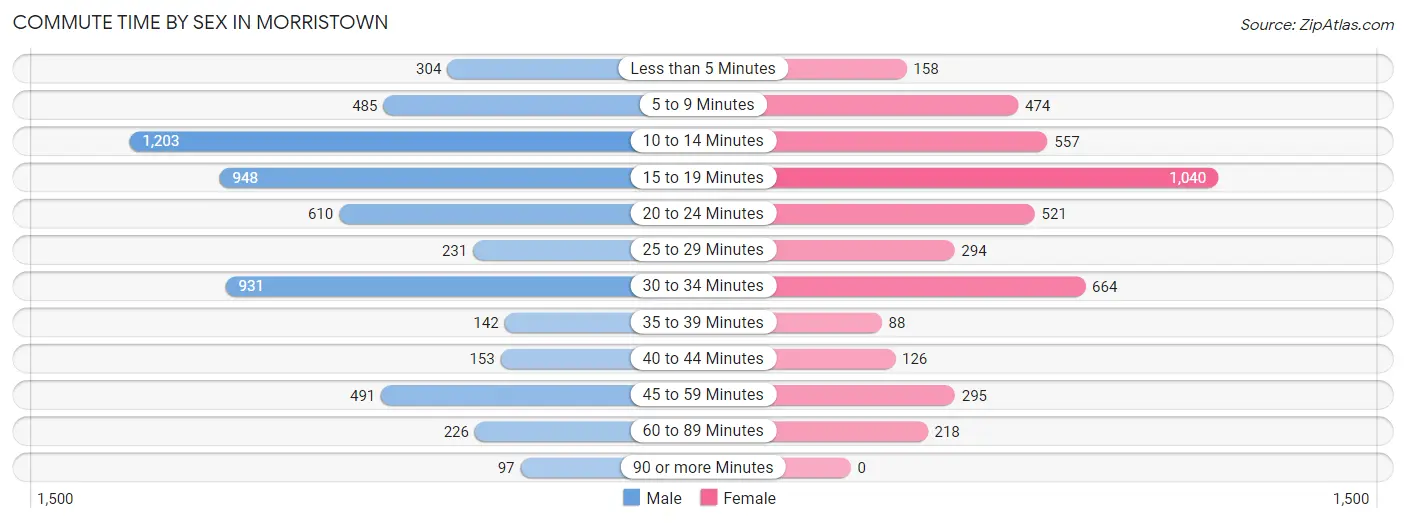
| Commute Time | Male | Female |
| Less than 5 Minutes | 304 (5.2%) | 158 (3.6%) |
| 5 to 9 Minutes | 485 (8.3%) | 474 (10.7%) |
| 10 to 14 Minutes | 1,203 (20.7%) | 557 (12.6%) |
| 15 to 19 Minutes | 948 (16.3%) | 1,040 (23.4%) |
| 20 to 24 Minutes | 610 (10.5%) | 521 (11.7%) |
| 25 to 29 Minutes | 231 (4.0%) | 294 (6.6%) |
| 30 to 34 Minutes | 931 (16.0%) | 664 (15.0%) |
| 35 to 39 Minutes | 142 (2.4%) | 88 (2.0%) |
| 40 to 44 Minutes | 153 (2.6%) | 126 (2.8%) |
| 45 to 59 Minutes | 491 (8.4%) | 295 (6.7%) |
| 60 to 89 Minutes | 226 (3.9%) | 218 (4.9%) |
| 90 or more Minutes | 97 (1.7%) | 0 (0.0%) |
Time of Departure to Work by Sex in Morristown
The most frequent times of departure to work in Morristown are 7:00 AM to 7:29 AM (1,041, 17.9%) for males and 6:30 AM to 6:59 AM (637, 14.4%) for females.
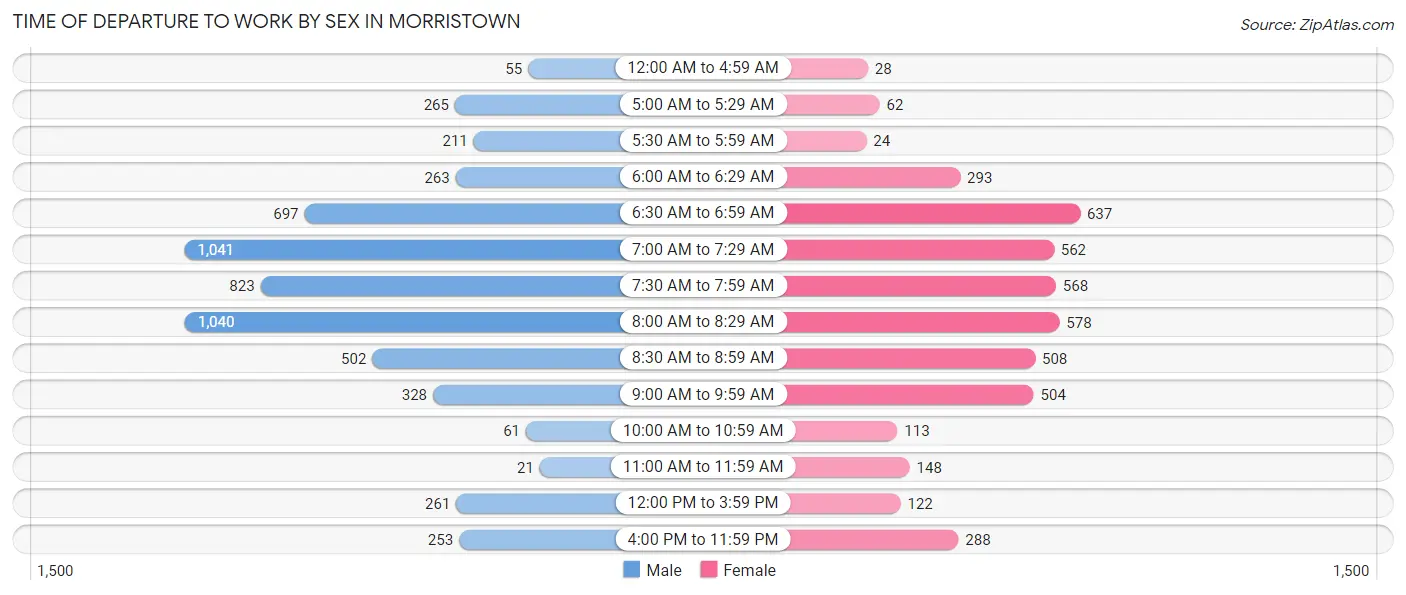
| Time of Departure | Male | Female |
| 12:00 AM to 4:59 AM | 55 (0.9%) | 28 (0.6%) |
| 5:00 AM to 5:29 AM | 265 (4.5%) | 62 (1.4%) |
| 5:30 AM to 5:59 AM | 211 (3.6%) | 24 (0.5%) |
| 6:00 AM to 6:29 AM | 263 (4.5%) | 293 (6.6%) |
| 6:30 AM to 6:59 AM | 697 (12.0%) | 637 (14.4%) |
| 7:00 AM to 7:29 AM | 1,041 (17.9%) | 562 (12.7%) |
| 7:30 AM to 7:59 AM | 823 (14.1%) | 568 (12.8%) |
| 8:00 AM to 8:29 AM | 1,040 (17.9%) | 578 (13.0%) |
| 8:30 AM to 8:59 AM | 502 (8.6%) | 508 (11.5%) |
| 9:00 AM to 9:59 AM | 328 (5.6%) | 504 (11.4%) |
| 10:00 AM to 10:59 AM | 61 (1.1%) | 113 (2.5%) |
| 11:00 AM to 11:59 AM | 21 (0.4%) | 148 (3.3%) |
| 12:00 PM to 3:59 PM | 261 (4.5%) | 122 (2.8%) |
| 4:00 PM to 11:59 PM | 253 (4.3%) | 288 (6.5%) |
| Total | 5,821 (100.0%) | 4,435 (100.0%) |
Housing Occupancy in Morristown
Occupancy by Ownership in Morristown
Of the total 8,949 dwellings in Morristown, owner-occupied units account for 3,311 (37.0%), while renter-occupied units make up 5,638 (63.0%).
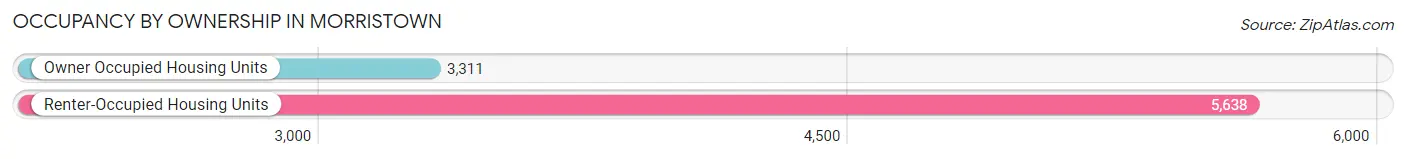
| Occupancy | # Housing Units | % Housing Units |
| Owner Occupied Housing Units | 3,311 | 37.0% |
| Renter-Occupied Housing Units | 5,638 | 63.0% |
| Total Occupied Housing Units | 8,949 | 100.0% |
Occupancy by Household Size in Morristown
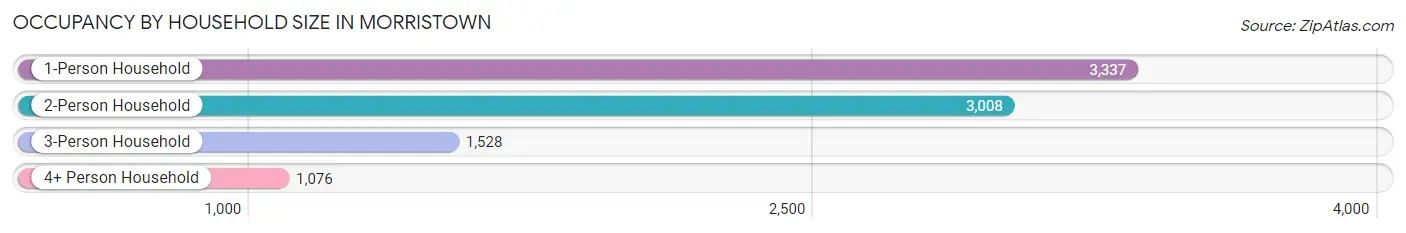
| Household Size | # Housing Units | % Housing Units |
| 1-Person Household | 3,337 | 37.3% |
| 2-Person Household | 3,008 | 33.6% |
| 3-Person Household | 1,528 | 17.1% |
| 4+ Person Household | 1,076 | 12.0% |
| Total Housing Units | 8,949 | 100.0% |
Occupancy by Ownership by Household Size in Morristown
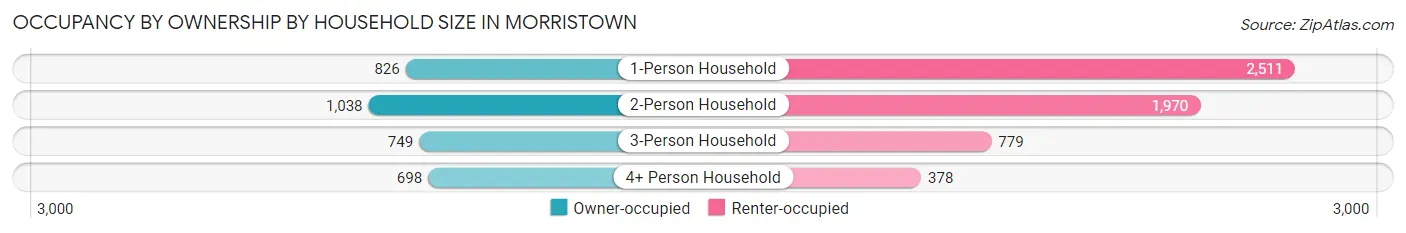
| Household Size | Owner-occupied | Renter-occupied |
| 1-Person Household | 826 (24.7%) | 2,511 (75.2%) |
| 2-Person Household | 1,038 (34.5%) | 1,970 (65.5%) |
| 3-Person Household | 749 (49.0%) | 779 (51.0%) |
| 4+ Person Household | 698 (64.9%) | 378 (35.1%) |
| Total Housing Units | 3,311 (37.0%) | 5,638 (63.0%) |
Occupancy by Educational Attainment in Morristown
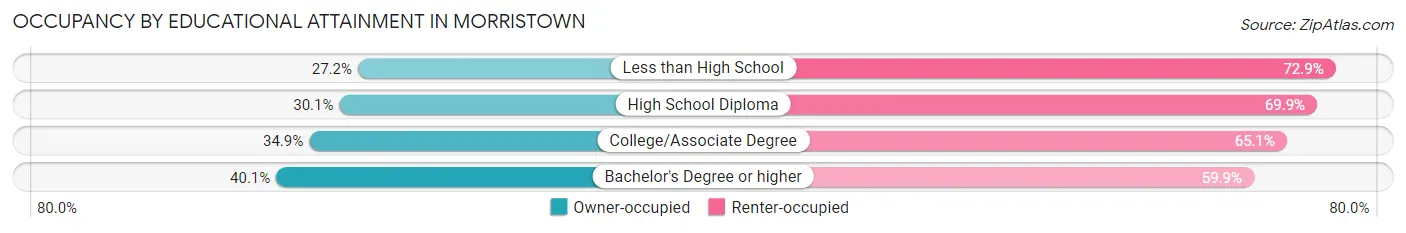
| Household Size | Owner-occupied | Renter-occupied |
| Less than High School | 142 (27.2%) | 381 (72.9%) |
| High School Diploma | 446 (30.1%) | 1,036 (69.9%) |
| College/Associate Degree | 414 (34.9%) | 773 (65.1%) |
| Bachelor's Degree or higher | 2,309 (40.1%) | 3,448 (59.9%) |
Occupancy by Age of Householder in Morristown
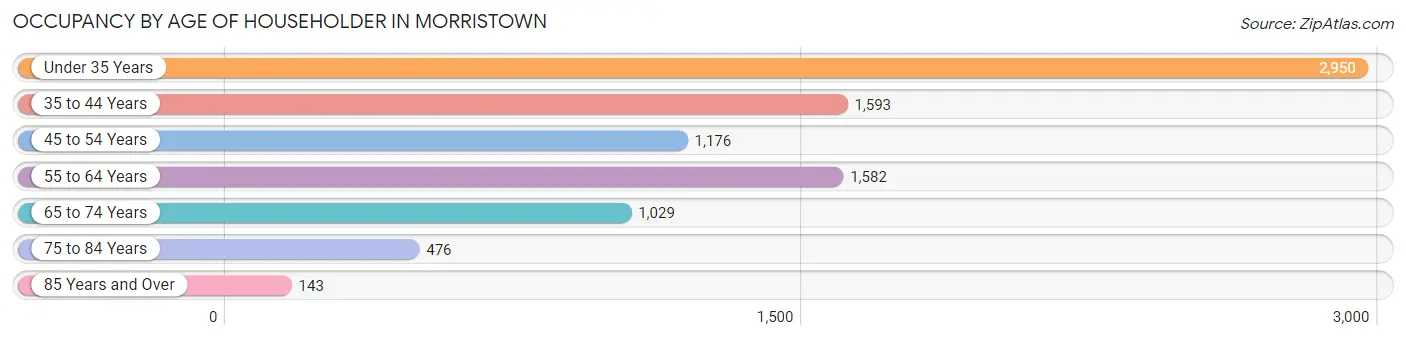
| Age Bracket | # Households | % Households |
| Under 35 Years | 2,950 | 33.0% |
| 35 to 44 Years | 1,593 | 17.8% |
| 45 to 54 Years | 1,176 | 13.1% |
| 55 to 64 Years | 1,582 | 17.7% |
| 65 to 74 Years | 1,029 | 11.5% |
| 75 to 84 Years | 476 | 5.3% |
| 85 Years and Over | 143 | 1.6% |
| Total | 8,949 | 100.0% |
Housing Finances in Morristown
Median Income by Occupancy in Morristown
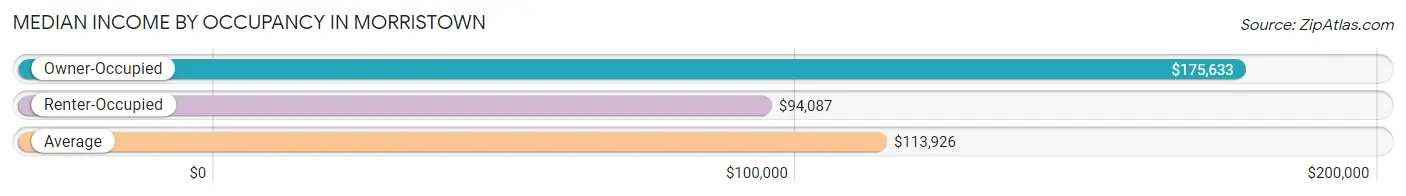
| Occupancy Type | # Households | Median Income |
| Owner-Occupied | 3,311 (37.0%) | $175,633 |
| Renter-Occupied | 5,638 (63.0%) | $94,087 |
| Average | 8,949 (100.0%) | $113,926 |
Occupancy by Householder Income Bracket in Morristown
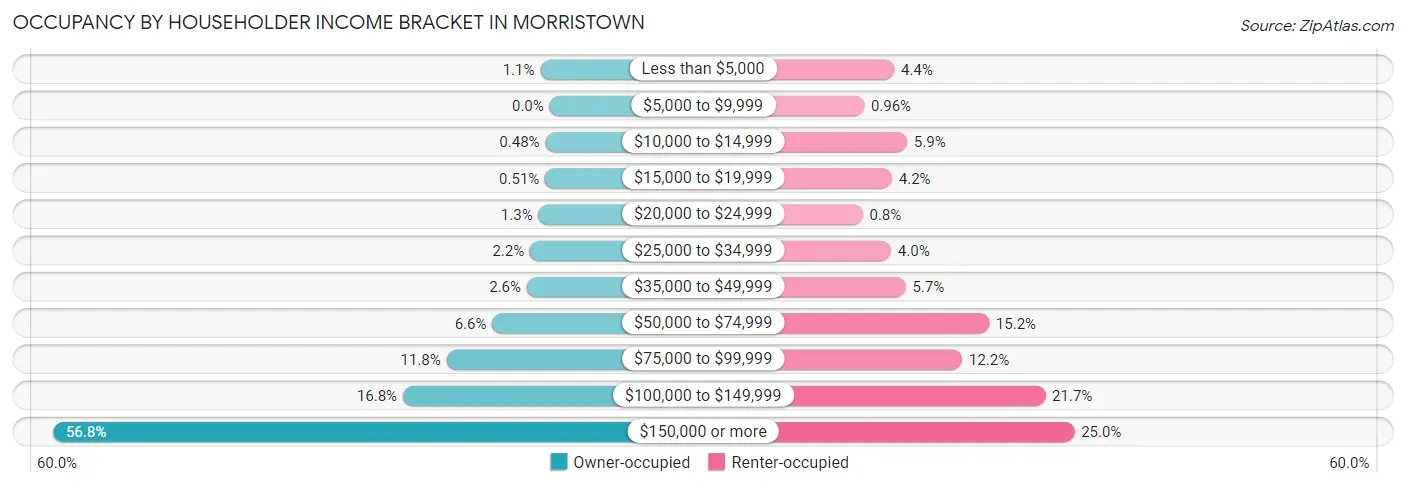
| Income Bracket | Owner-occupied | Renter-occupied |
| Less than $5,000 | 35 (1.1%) | 248 (4.4%) |
| $5,000 to $9,999 | 0 (0.0%) | 54 (1.0%) |
| $10,000 to $14,999 | 16 (0.5%) | 331 (5.9%) |
| $15,000 to $19,999 | 17 (0.5%) | 234 (4.2%) |
| $20,000 to $24,999 | 42 (1.3%) | 45 (0.8%) |
| $25,000 to $34,999 | 74 (2.2%) | 228 (4.0%) |
| $35,000 to $49,999 | 86 (2.6%) | 322 (5.7%) |
| $50,000 to $74,999 | 217 (6.6%) | 859 (15.2%) |
| $75,000 to $99,999 | 390 (11.8%) | 686 (12.2%) |
| $100,000 to $149,999 | 555 (16.8%) | 1,222 (21.7%) |
| $150,000 or more | 1,879 (56.8%) | 1,409 (25.0%) |
| Total | 3,311 (100.0%) | 5,638 (100.0%) |
Monthly Housing Cost Tiers in Morristown
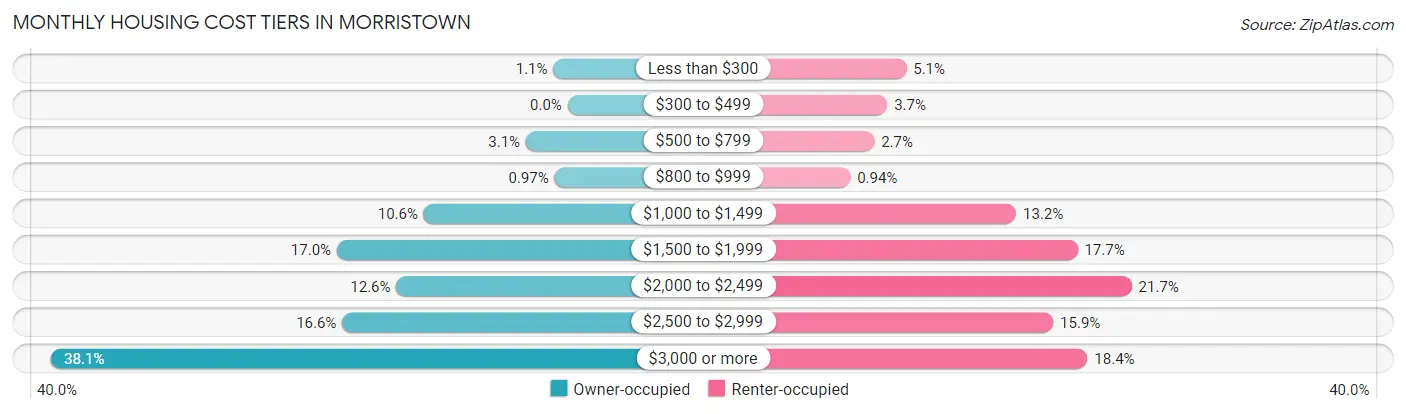
| Monthly Cost | Owner-occupied | Renter-occupied |
| Less than $300 | 35 (1.1%) | 286 (5.1%) |
| $300 to $499 | 0 (0.0%) | 207 (3.7%) |
| $500 to $799 | 102 (3.1%) | 153 (2.7%) |
| $800 to $999 | 32 (1.0%) | 53 (0.9%) |
| $1,000 to $1,499 | 351 (10.6%) | 742 (13.2%) |
| $1,500 to $1,999 | 563 (17.0%) | 997 (17.7%) |
| $2,000 to $2,499 | 418 (12.6%) | 1,222 (21.7%) |
| $2,500 to $2,999 | 550 (16.6%) | 896 (15.9%) |
| $3,000 or more | 1,260 (38.1%) | 1,038 (18.4%) |
| Total | 3,311 (100.0%) | 5,638 (100.0%) |
Physical Housing Characteristics in Morristown
Housing Structures in Morristown
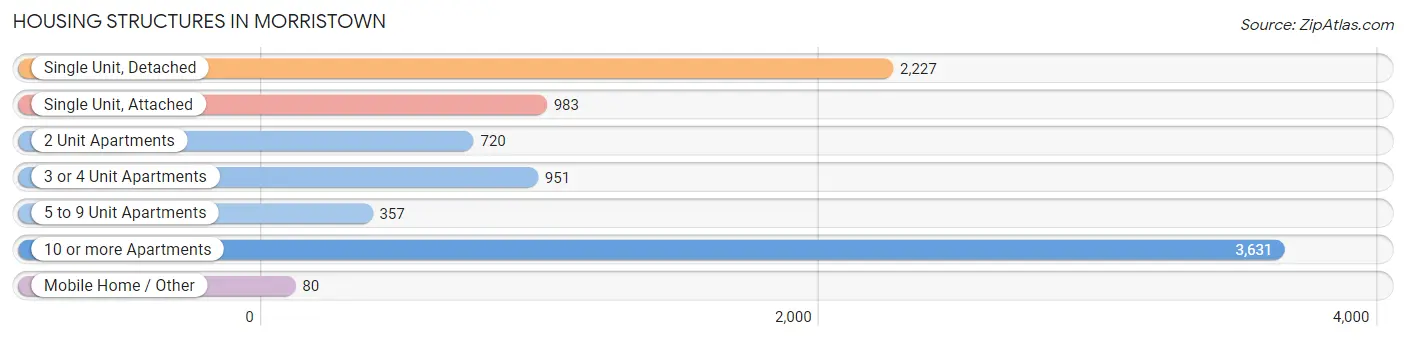
| Structure Type | # Housing Units | % Housing Units |
| Single Unit, Detached | 2,227 | 24.9% |
| Single Unit, Attached | 983 | 11.0% |
| 2 Unit Apartments | 720 | 8.1% |
| 3 or 4 Unit Apartments | 951 | 10.6% |
| 5 to 9 Unit Apartments | 357 | 4.0% |
| 10 or more Apartments | 3,631 | 40.6% |
| Mobile Home / Other | 80 | 0.9% |
| Total | 8,949 | 100.0% |
Housing Structures by Occupancy in Morristown
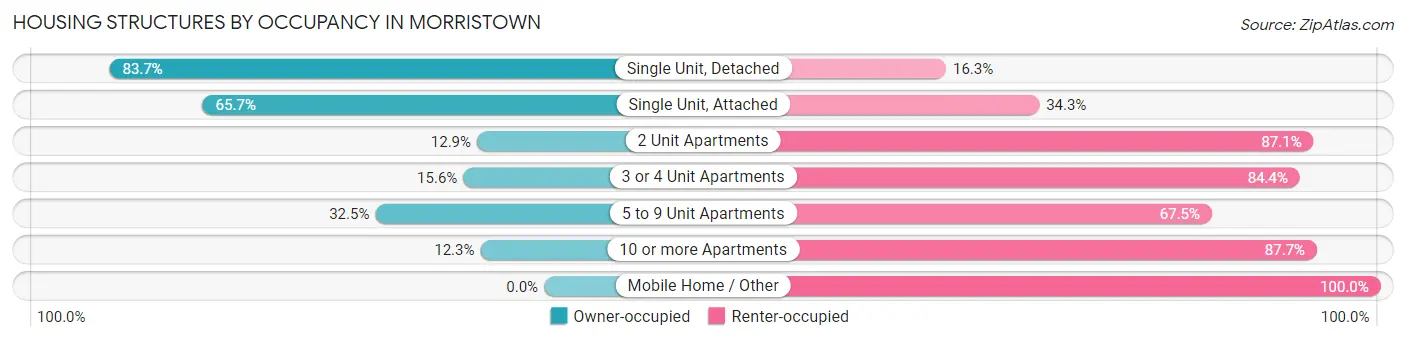
| Structure Type | Owner-occupied | Renter-occupied |
| Single Unit, Detached | 1,863 (83.7%) | 364 (16.3%) |
| Single Unit, Attached | 646 (65.7%) | 337 (34.3%) |
| 2 Unit Apartments | 93 (12.9%) | 627 (87.1%) |
| 3 or 4 Unit Apartments | 148 (15.6%) | 803 (84.4%) |
| 5 to 9 Unit Apartments | 116 (32.5%) | 241 (67.5%) |
| 10 or more Apartments | 445 (12.3%) | 3,186 (87.7%) |
| Mobile Home / Other | 0 (0.0%) | 80 (100.0%) |
| Total | 3,311 (37.0%) | 5,638 (63.0%) |
Housing Structures by Number of Rooms in Morristown
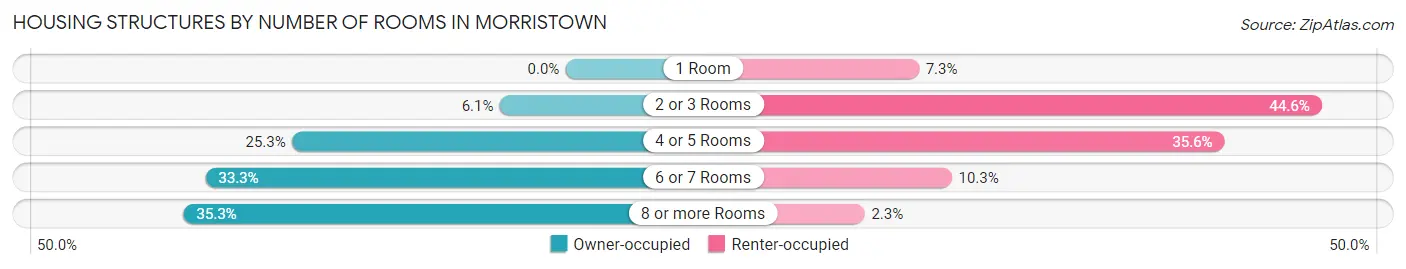
| Number of Rooms | Owner-occupied | Renter-occupied |
| 1 Room | 0 (0.0%) | 411 (7.3%) |
| 2 or 3 Rooms | 202 (6.1%) | 2,512 (44.6%) |
| 4 or 5 Rooms | 838 (25.3%) | 2,005 (35.6%) |
| 6 or 7 Rooms | 1,102 (33.3%) | 582 (10.3%) |
| 8 or more Rooms | 1,169 (35.3%) | 128 (2.3%) |
| Total | 3,311 (100.0%) | 5,638 (100.0%) |
Housing Structure by Heating Type in Morristown
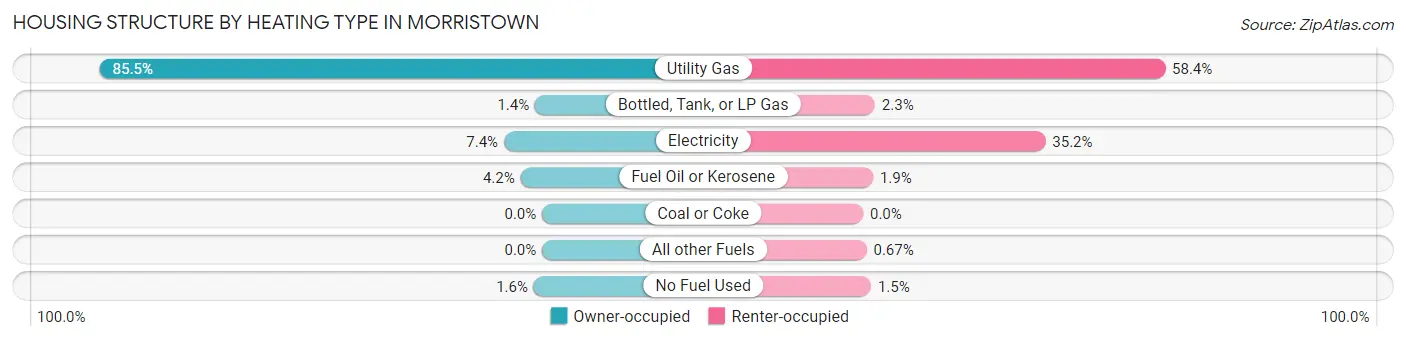
| Heating Type | Owner-occupied | Renter-occupied |
| Utility Gas | 2,831 (85.5%) | 3,291 (58.4%) |
| Bottled, Tank, or LP Gas | 45 (1.4%) | 129 (2.3%) |
| Electricity | 244 (7.4%) | 1,986 (35.2%) |
| Fuel Oil or Kerosene | 138 (4.2%) | 108 (1.9%) |
| Coal or Coke | 0 (0.0%) | 0 (0.0%) |
| All other Fuels | 0 (0.0%) | 38 (0.7%) |
| No Fuel Used | 53 (1.6%) | 86 (1.5%) |
| Total | 3,311 (100.0%) | 5,638 (100.0%) |
Household Vehicle Usage in Morristown
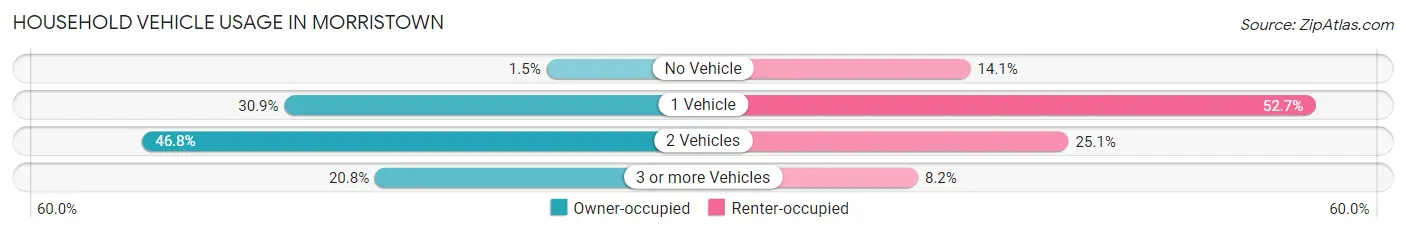
| Vehicles per Household | Owner-occupied | Renter-occupied |
| No Vehicle | 51 (1.5%) | 794 (14.1%) |
| 1 Vehicle | 1,023 (30.9%) | 2,969 (52.7%) |
| 2 Vehicles | 1,550 (46.8%) | 1,413 (25.1%) |
| 3 or more Vehicles | 687 (20.7%) | 462 (8.2%) |
| Total | 3,311 (100.0%) | 5,638 (100.0%) |
Real Estate & Mortgages in Morristown
Real Estate and Mortgage Overview in Morristown
| Characteristic | Without Mortgage | With Mortgage |
| Housing Units | 855 | 2,456 |
| Median Property Value | $497,300 | $546,700 |
| Median Household Income | $117,257 | $1,524 |
| Monthly Housing Costs | $1,485 | $1,242 |
| Real Estate Taxes | $10,001 | $39 |
Property Value by Mortgage Status in Morristown
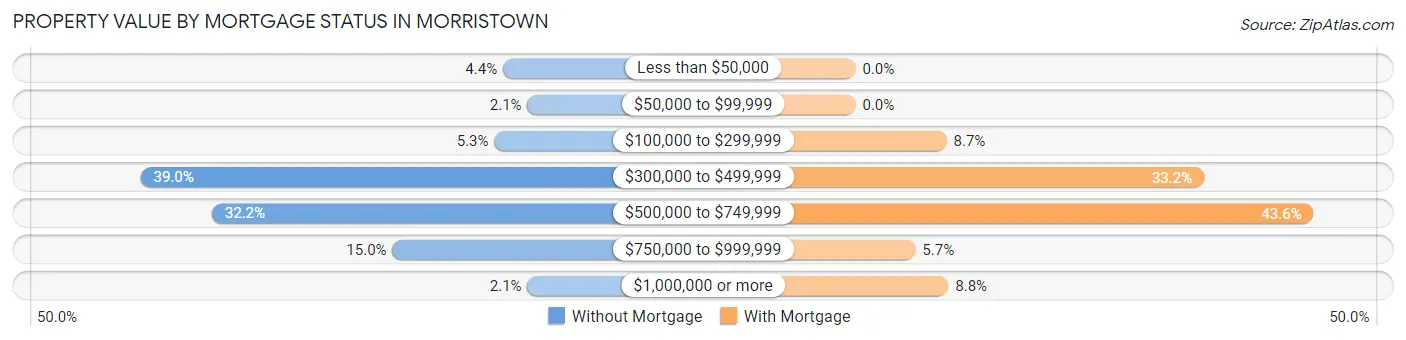
| Property Value | Without Mortgage | With Mortgage |
| Less than $50,000 | 38 (4.4%) | 0 (0.0%) |
| $50,000 to $99,999 | 18 (2.1%) | 0 (0.0%) |
| $100,000 to $299,999 | 45 (5.3%) | 213 (8.7%) |
| $300,000 to $499,999 | 333 (39.0%) | 815 (33.2%) |
| $500,000 to $749,999 | 275 (32.2%) | 1,071 (43.6%) |
| $750,000 to $999,999 | 128 (15.0%) | 140 (5.7%) |
| $1,000,000 or more | 18 (2.1%) | 217 (8.8%) |
| Total | 855 (100.0%) | 2,456 (100.0%) |
Household Income by Mortgage Status in Morristown
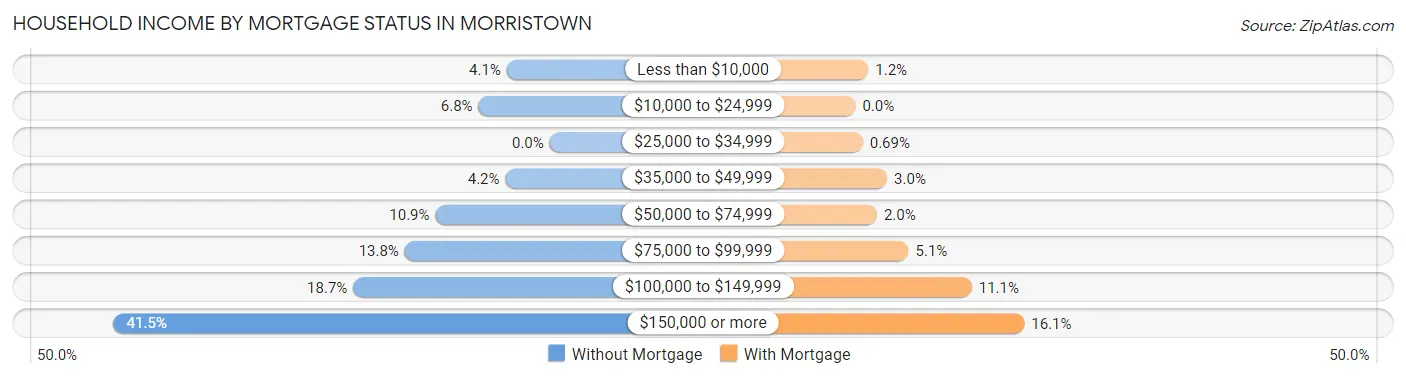
| Household Income | Without Mortgage | With Mortgage |
| Less than $10,000 | 35 (4.1%) | 30 (1.2%) |
| $10,000 to $24,999 | 58 (6.8%) | 0 (0.0%) |
| $25,000 to $34,999 | 0 (0.0%) | 17 (0.7%) |
| $35,000 to $49,999 | 36 (4.2%) | 74 (3.0%) |
| $50,000 to $74,999 | 93 (10.9%) | 50 (2.0%) |
| $75,000 to $99,999 | 118 (13.8%) | 124 (5.1%) |
| $100,000 to $149,999 | 160 (18.7%) | 272 (11.1%) |
| $150,000 or more | 355 (41.5%) | 395 (16.1%) |
| Total | 855 (100.0%) | 2,456 (100.0%) |
Property Value to Household Income Ratio in Morristown
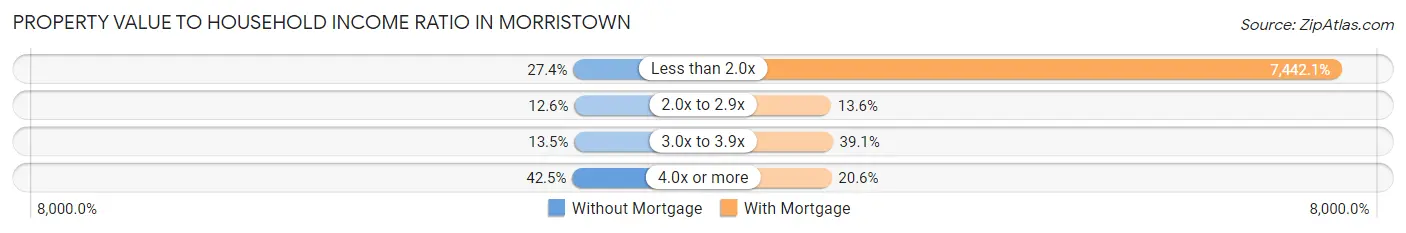
| Value-to-Income Ratio | Without Mortgage | With Mortgage |
| Less than 2.0x | 234 (27.4%) | 182,778 (7,442.1%) |
| 2.0x to 2.9x | 108 (12.6%) | 335 (13.6%) |
| 3.0x to 3.9x | 115 (13.5%) | 960 (39.1%) |
| 4.0x or more | 363 (42.5%) | 507 (20.6%) |
| Total | 855 (100.0%) | 2,456 (100.0%) |
Real Estate Taxes by Mortgage Status in Morristown
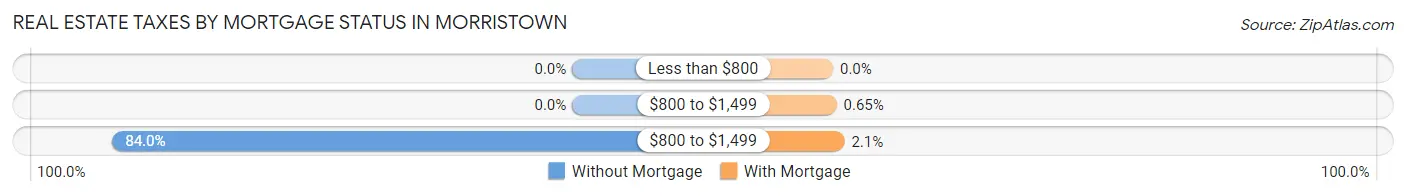
| Property Taxes | Without Mortgage | With Mortgage |
| Less than $800 | 0 (0.0%) | 0 (0.0%) |
| $800 to $1,499 | 0 (0.0%) | 16 (0.6%) |
| $800 to $1,499 | 718 (84.0%) | 51 (2.1%) |
| Total | 855 (100.0%) | 2,456 (100.0%) |
Health & Disability in Morristown
Health Insurance Coverage by Age in Morristown
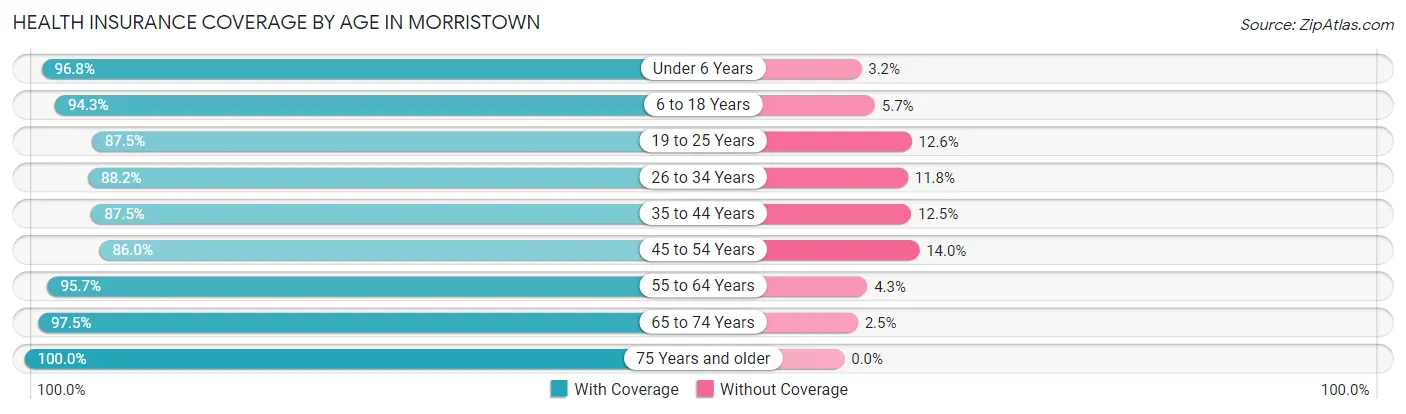
| Age Bracket | With Coverage | Without Coverage |
| Under 6 Years | 1,345 (96.8%) | 44 (3.2%) |
| 6 to 18 Years | 1,689 (94.3%) | 102 (5.7%) |
| 19 to 25 Years | 2,063 (87.5%) | 296 (12.6%) |
| 26 to 34 Years | 4,280 (88.2%) | 575 (11.8%) |
| 35 to 44 Years | 2,305 (87.5%) | 328 (12.5%) |
| 45 to 54 Years | 1,656 (86.0%) | 269 (14.0%) |
| 55 to 64 Years | 2,218 (95.7%) | 99 (4.3%) |
| 65 to 74 Years | 1,713 (97.5%) | 44 (2.5%) |
| 75 Years and older | 796 (100.0%) | 0 (0.0%) |
| Total | 18,065 (91.1%) | 1,757 (8.9%) |
Health Insurance Coverage by Citizenship Status in Morristown
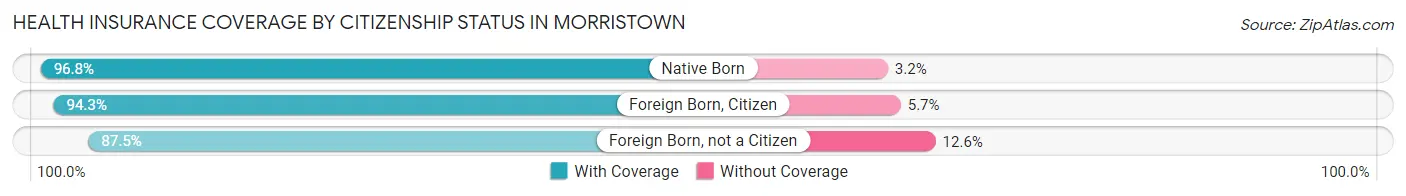
| Citizenship Status | With Coverage | Without Coverage |
| Native Born | 1,345 (96.8%) | 44 (3.2%) |
| Foreign Born, Citizen | 1,689 (94.3%) | 102 (5.7%) |
| Foreign Born, not a Citizen | 2,063 (87.5%) | 296 (12.6%) |
Health Insurance Coverage by Household Income in Morristown
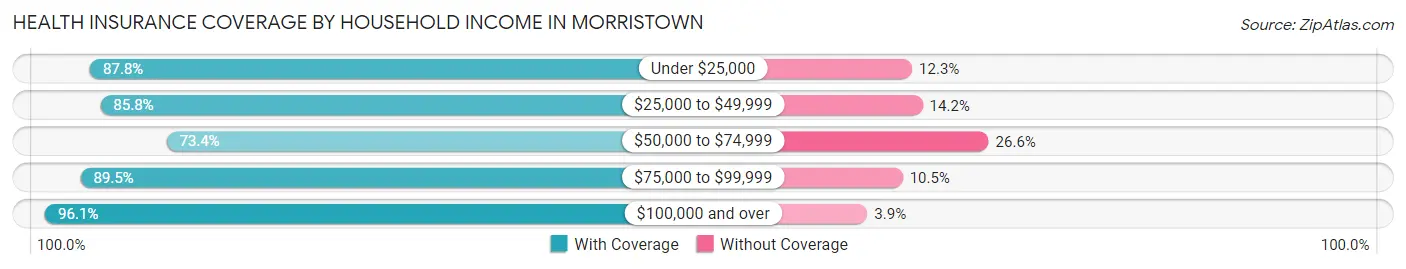
| Household Income | With Coverage | Without Coverage |
| Under $25,000 | 1,397 (87.7%) | 195 (12.2%) |
| $25,000 to $49,999 | 1,527 (85.8%) | 253 (14.2%) |
| $50,000 to $74,999 | 1,677 (73.4%) | 607 (26.6%) |
| $75,000 to $99,999 | 2,017 (89.5%) | 236 (10.5%) |
| $100,000 and over | 11,275 (96.1%) | 453 (3.9%) |
Public vs Private Health Insurance Coverage by Age in Morristown
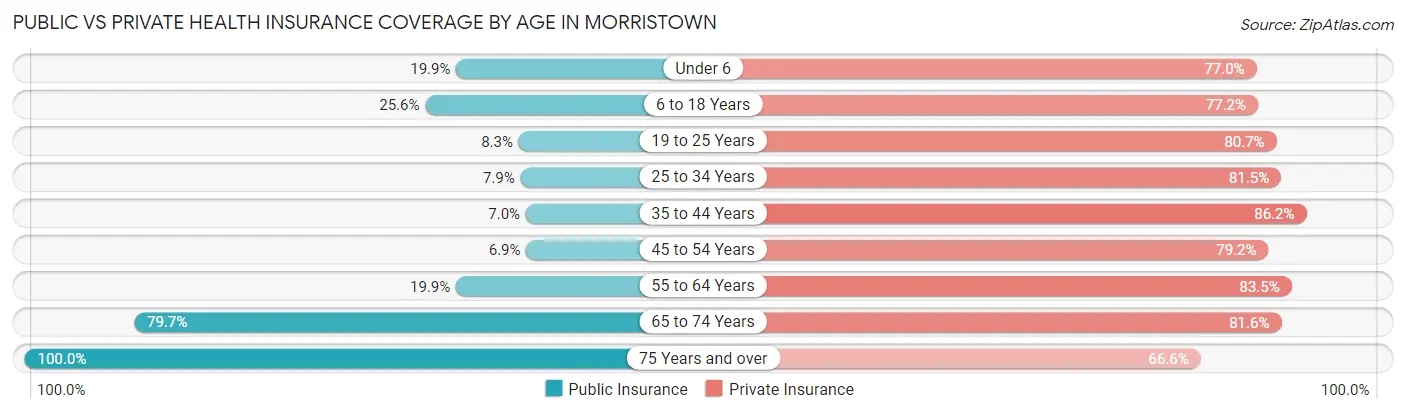
| Age Bracket | Public Insurance | Private Insurance |
| Under 6 | 276 (19.9%) | 1,069 (77.0%) |
| 6 to 18 Years | 459 (25.6%) | 1,383 (77.2%) |
| 19 to 25 Years | 195 (8.3%) | 1,903 (80.7%) |
| 25 to 34 Years | 385 (7.9%) | 3,959 (81.5%) |
| 35 to 44 Years | 183 (7.0%) | 2,270 (86.2%) |
| 45 to 54 Years | 132 (6.9%) | 1,524 (79.2%) |
| 55 to 64 Years | 461 (19.9%) | 1,934 (83.5%) |
| 65 to 74 Years | 1,400 (79.7%) | 1,433 (81.6%) |
| 75 Years and over | 796 (100.0%) | 530 (66.6%) |
| Total | 4,287 (21.6%) | 16,005 (80.7%) |
Disability Status by Sex by Age in Morristown
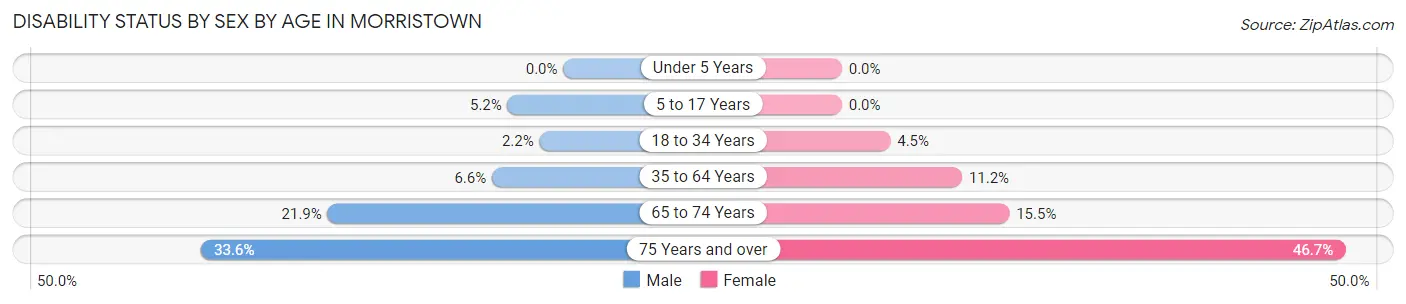
| Age Bracket | Male | Female |
| Under 5 Years | 0 (0.0%) | 0 (0.0%) |
| 5 to 17 Years | 32 (5.2%) | 0 (0.0%) |
| 18 to 34 Years | 88 (2.2%) | 150 (4.5%) |
| 35 to 64 Years | 226 (6.6%) | 386 (11.2%) |
| 65 to 74 Years | 200 (21.9%) | 131 (15.5%) |
| 75 Years and over | 79 (33.6%) | 262 (46.7%) |
Disability Class by Sex by Age in Morristown
Disability Class: Hearing Difficulty
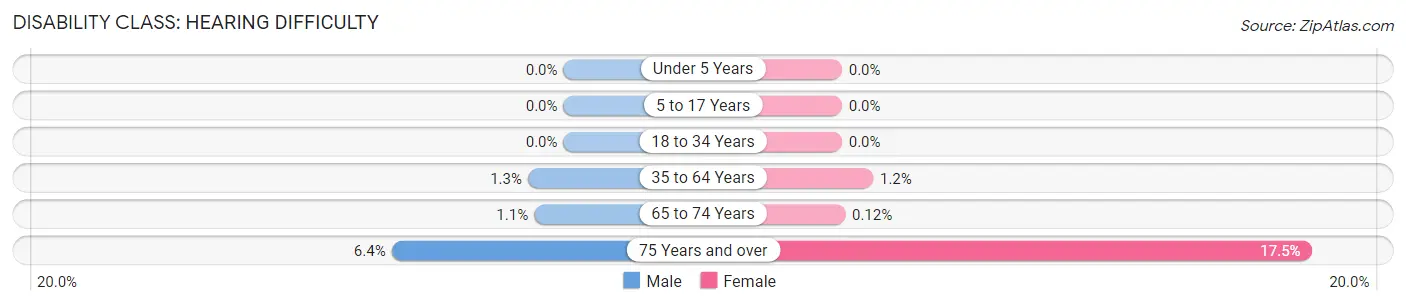
| Age Bracket | Male | Female |
| Under 5 Years | 0 (0.0%) | 0 (0.0%) |
| 5 to 17 Years | 0 (0.0%) | 0 (0.0%) |
| 18 to 34 Years | 0 (0.0%) | 0 (0.0%) |
| 35 to 64 Years | 45 (1.3%) | 40 (1.2%) |
| 65 to 74 Years | 10 (1.1%) | 1 (0.1%) |
| 75 Years and over | 15 (6.4%) | 98 (17.5%) |
Disability Class: Vision Difficulty
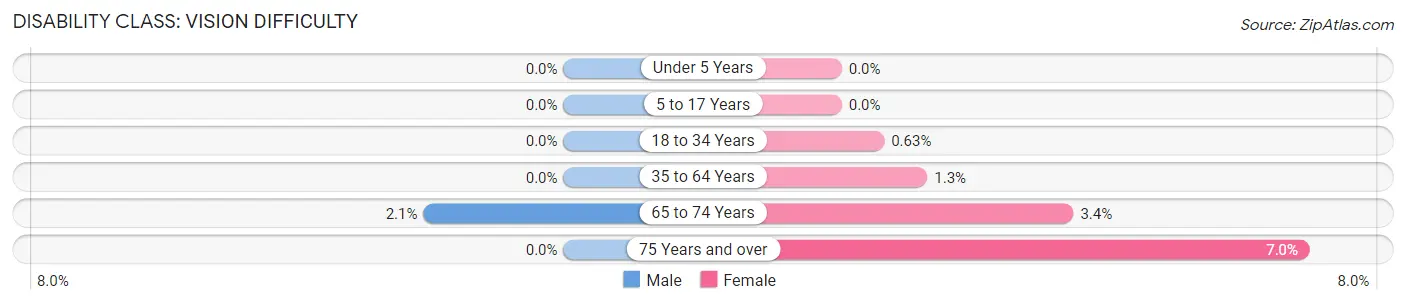
| Age Bracket | Male | Female |
| Under 5 Years | 0 (0.0%) | 0 (0.0%) |
| 5 to 17 Years | 0 (0.0%) | 0 (0.0%) |
| 18 to 34 Years | 0 (0.0%) | 21 (0.6%) |
| 35 to 64 Years | 0 (0.0%) | 44 (1.3%) |
| 65 to 74 Years | 19 (2.1%) | 29 (3.4%) |
| 75 Years and over | 0 (0.0%) | 39 (7.0%) |
Disability Class: Cognitive Difficulty
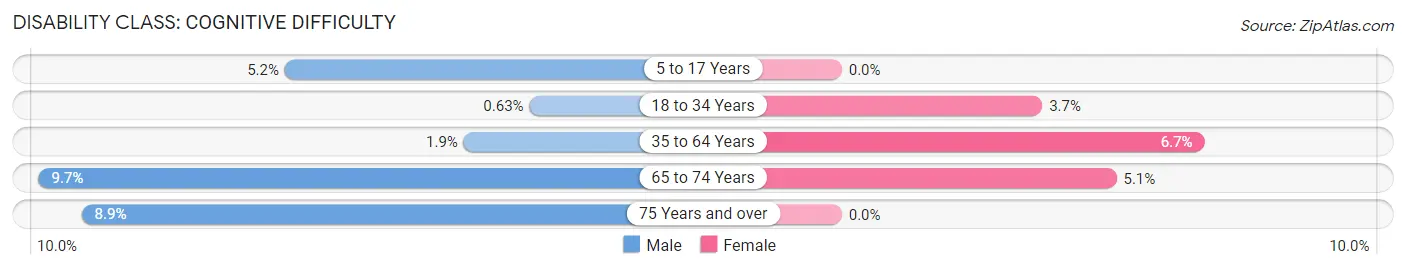
| Age Bracket | Male | Female |
| 5 to 17 Years | 32 (5.2%) | 0 (0.0%) |
| 18 to 34 Years | 25 (0.6%) | 124 (3.7%) |
| 35 to 64 Years | 63 (1.8%) | 233 (6.7%) |
| 65 to 74 Years | 89 (9.7%) | 43 (5.1%) |
| 75 Years and over | 21 (8.9%) | 0 (0.0%) |
Disability Class: Ambulatory Difficulty
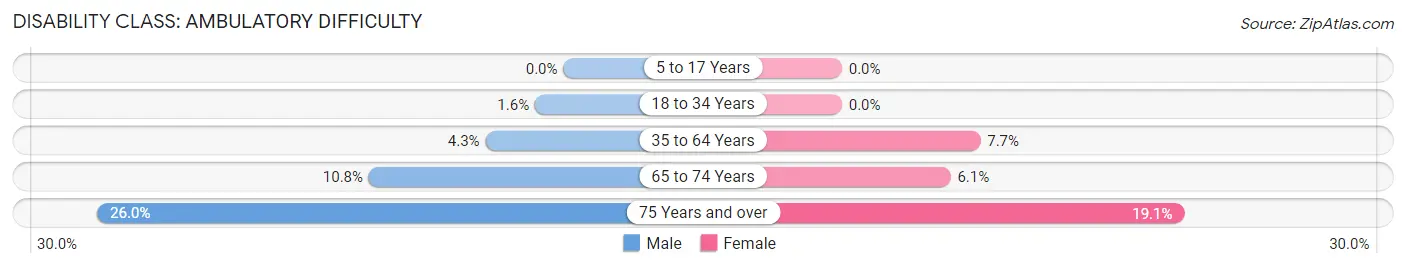
| Age Bracket | Male | Female |
| 5 to 17 Years | 0 (0.0%) | 0 (0.0%) |
| 18 to 34 Years | 63 (1.6%) | 0 (0.0%) |
| 35 to 64 Years | 148 (4.3%) | 267 (7.7%) |
| 65 to 74 Years | 99 (10.8%) | 51 (6.0%) |
| 75 Years and over | 61 (26.0%) | 107 (19.1%) |
Disability Class: Self-Care Difficulty
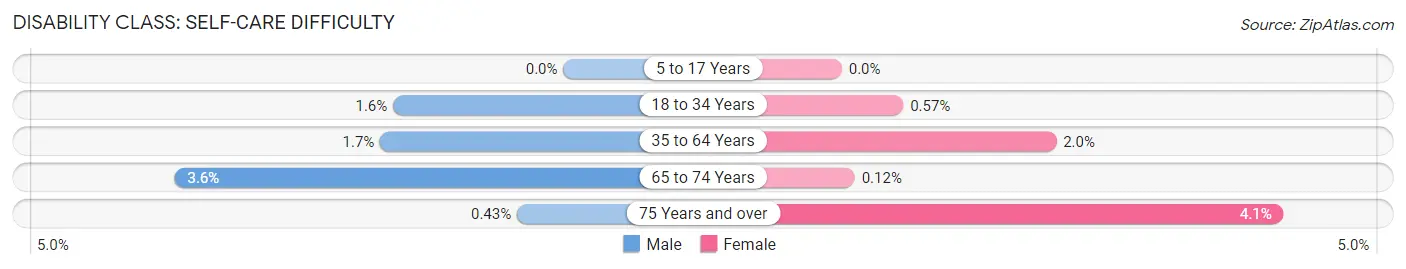
| Age Bracket | Male | Female |
| 5 to 17 Years | 0 (0.0%) | 0 (0.0%) |
| 18 to 34 Years | 63 (1.6%) | 19 (0.6%) |
| 35 to 64 Years | 58 (1.7%) | 69 (2.0%) |
| 65 to 74 Years | 33 (3.6%) | 1 (0.1%) |
| 75 Years and over | 1 (0.4%) | 23 (4.1%) |
Technology Access in Morristown
Computing Device Access in Morristown
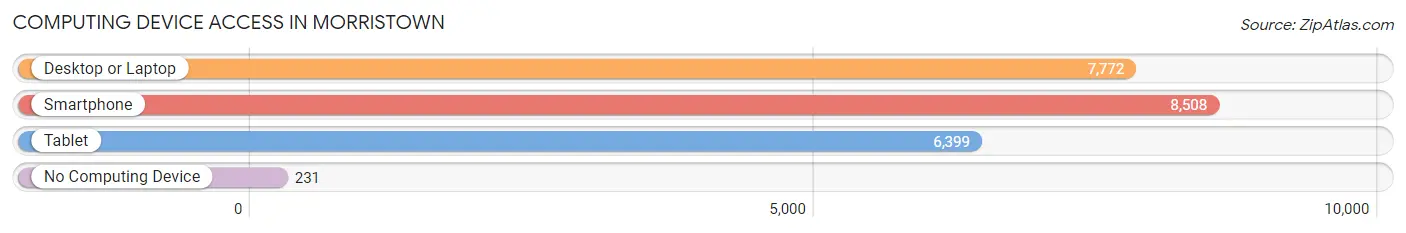
| Device Type | # Households | % Households |
| Desktop or Laptop | 7,772 | 86.9% |
| Smartphone | 8,508 | 95.1% |
| Tablet | 6,399 | 71.5% |
| No Computing Device | 231 | 2.6% |
| Total | 8,949 | 100.0% |
Internet Access in Morristown
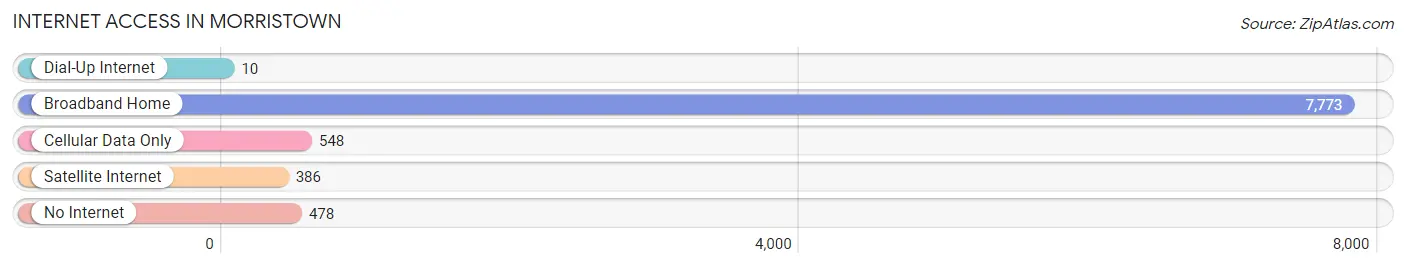
| Internet Type | # Households | % Households |
| Dial-Up Internet | 10 | 0.1% |
| Broadband Home | 7,773 | 86.9% |
| Cellular Data Only | 548 | 6.1% |
| Satellite Internet | 386 | 4.3% |
| No Internet | 478 | 5.3% |
| Total | 8,949 | 100.0% |
Morristown Summary
Morristown, NJ is a town located in Morris County, New Jersey. It is situated approximately 25 miles west of New York City and is part of the New York metropolitan area. The town has a population of approximately 19,000 people and is the county seat of Morris County.
History
Morristown was first settled in 1715 by English settlers from New York and Connecticut. The town was named after the first settler, Lewis Morris, who was the first governor of New Jersey. The town was officially incorporated in 1865. During the Revolutionary War, Morristown served as the military headquarters of General George Washington. The town was also the site of the first public library in New Jersey, which was established in 1795.
Geography
Morristown is located in the northern part of Morris County, New Jersey. It is situated in the Great Appalachian Valley, which is part of the larger Appalachian Mountains. The town is bordered by the towns of Morris Plains, Parsippany-Troy Hills, and Madison. The town is located approximately 25 miles west of New York City and is part of the New York metropolitan area.
Economy
Morristown is home to a variety of businesses and industries. The town is home to several large corporations, including Honeywell, AT&T, and Pfizer. The town is also home to several smaller businesses, including restaurants, retail stores, and professional services. The town is also home to Morristown Medical Center, which is a major employer in the area.
Demographics
As of the 2010 census, the population of Morristown was 19,086. The racial makeup of the town was 79.2% White, 8.2% African American, 0.3% Native American, 6.7% Asian, and 4.6% from other races. The median household income in the town was $77,837. The median age of the population was 40.7 years.
Morristown is a diverse and vibrant community. The town is home to a variety of cultures and backgrounds, and is a great place to live and work. The town is home to a variety of businesses and industries, and is a great place to start a business or find employment. The town is also home to a variety of recreational activities, including parks, trails, and museums. Morristown is a great place to live and work, and is a great place to call home.
Common Questions
What is the Total Population of Morristown?
Total Population of Morristown is 20,126.
What is the Total Male Population of Morristown?
Total Male Population of Morristown is 9,791.
What is the Total Female Population of Morristown?
Total Female Population of Morristown is 10,335.
What is the Ratio of Males per 100 Females in Morristown?
There are 94.74 Males per 100 Females in Morristown.
What is the Ratio of Females per 100 Males in Morristown?
There are 105.56 Females per 100 Males in Morristown.
What is the Median Population Age in Morristown?
Median Population Age in Morristown is 33.9 Years.
What is the Average Family Size in Morristown
Average Family Size in Morristown is 2.9 People.
What is the Average Household Size in Morristown
Average Household Size in Morristown is 2.2 People.
What is Per Capita Income in Morristown?
Per Capita income in Morristown is $66,283.
What is the Median Family Income in Morristown?
Median Family Income in Morristown is $136,607.
What is the Median Household income in Morristown?
Median Household Income in Morristown is $113,926.
What is Income or Wage Gap in Morristown?
Income or Wage Gap in Morristown is 4.3%.
Women in Morristown earn 95.7 cents for every dollar earned by a man.
What is Family Income Deficit in Morristown?
Family Income Deficit in Morristown is $10,910.
Families that are below poverty line in Morristown earn $10,910 less on average than the poverty threshold level.
What is Inequality or Gini Index in Morristown?
Inequality or Gini Index in Morristown is 0.44.
How Large is the Labor Force in Morristown?
There are 13,096 People in the Labor Forcein in Morristown.
What is the Percentage of People in the Labor Force in Morristown?
75.0% of People are in the Labor Force in Morristown.
What is the Unemployment Rate in Morristown?
Unemployment Rate in Morristown is 4.7%.