Hawthorne borough, NJ
Hawthorne borough Overview
19,456
TOTAL POPULATION
9,848
MALE POPULATION
9,608
FEMALE POPULATION
102.50
MALES / 100 FEMALES
97.56
FEMALES / 100 MALES
41.8
MEDIAN AGE
3.0
AVG FAMILY SIZE
2.6
AVG HOUSEHOLD SIZE
$51,860
PER CAPITA INCOME
$123,688
AVG FAMILY INCOME
$105,168
AVG HOUSEHOLD INCOME
31.5%
WAGE / INCOME GAP [ % ]
68.5¢/ $1
WAGE / INCOME GAP [ $ ]
0.41
INEQUALITY / GINI INDEX
11,776
LABOR FORCE [ PEOPLE ]
72.3%
PERCENT IN LABOR FORCE
5.5%
UNEMPLOYMENT RATE
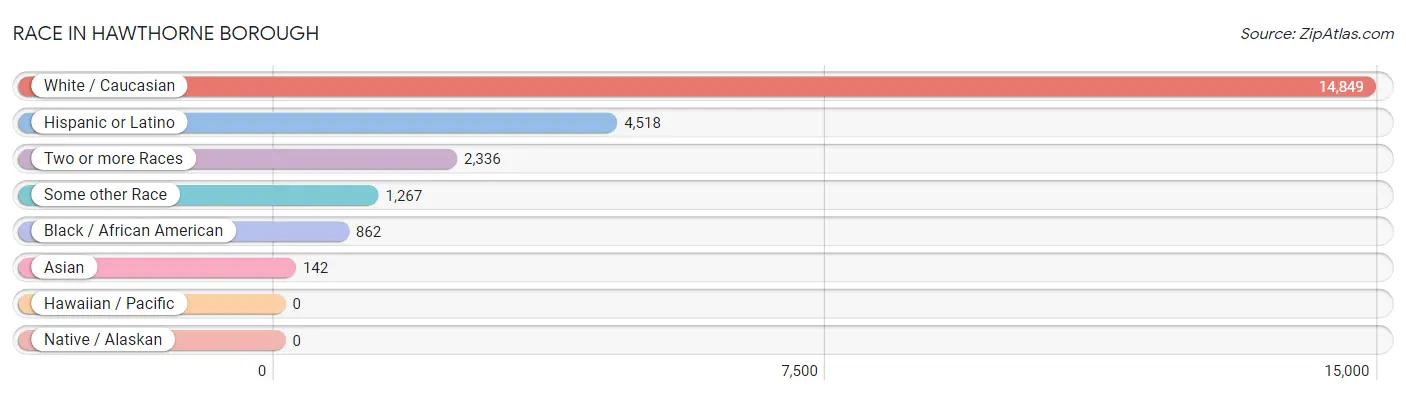
Race in Hawthorne borough
The most populous races in Hawthorne borough are White / Caucasian (14,849 | 76.3%), Hispanic or Latino (4,518 | 23.2%), and Two or more Races (2,336 | 12.0%).
| Race | # Population | % Population |
| Asian | 142 | 0.7% |
| Black / African American | 862 | 4.4% |
| Hawaiian / Pacific | 0 | 0.0% |
| Hispanic or Latino | 4,518 | 23.2% |
| Native / Alaskan | 0 | 0.0% |
| White / Caucasian | 14,849 | 76.3% |
| Two or more Races | 2,336 | 12.0% |
| Some other Race | 1,267 | 6.5% |
| Total | 19,456 | 100.0% |
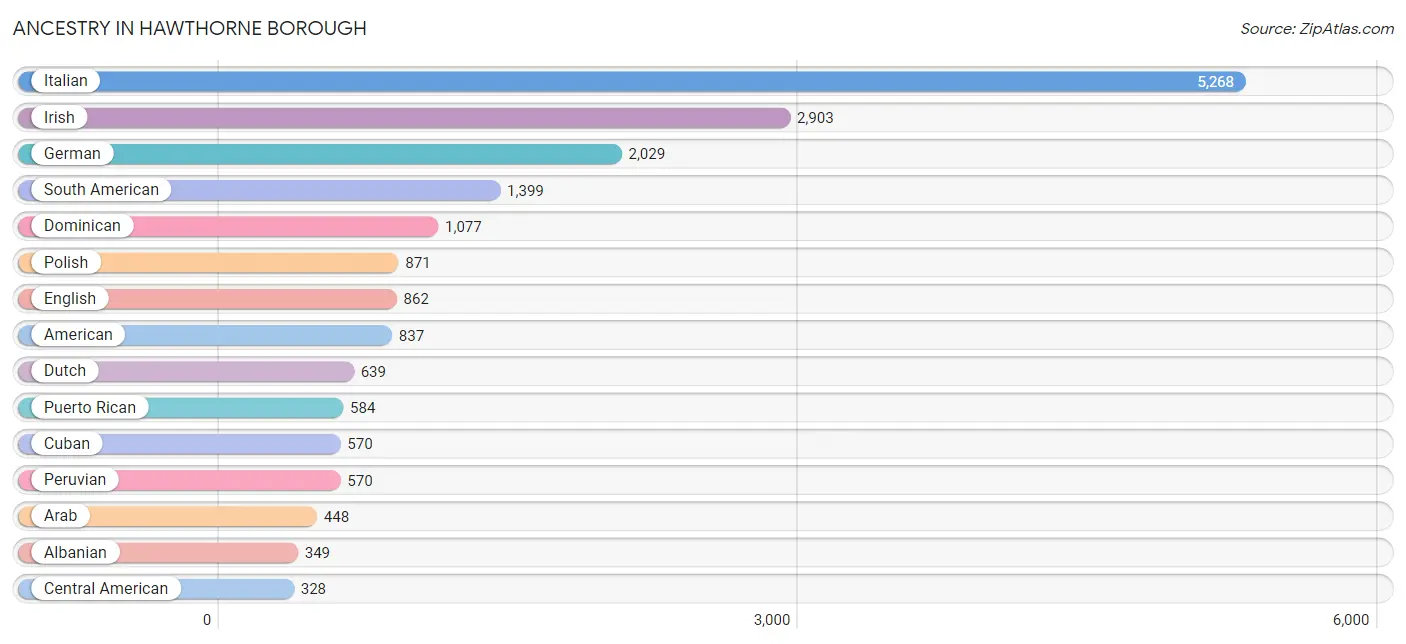
Ancestry in Hawthorne borough
The most populous ancestries reported in Hawthorne borough are Italian (5,268 | 27.1%), Irish (2,903 | 14.9%), German (2,029 | 10.4%), South American (1,399 | 7.2%), and Dominican (1,077 | 5.5%), together accounting for 65.2% of all Hawthorne borough residents.
| Ancestry | # Population | % Population |
| Albanian | 349 | 1.8% |
| American | 837 | 4.3% |
| Arab | 448 | 2.3% |
| Argentinean | 95 | 0.5% |
| Armenian | 52 | 0.3% |
| Austrian | 96 | 0.5% |
| Belgian | 16 | 0.1% |
| Bhutanese | 57 | 0.3% |
| Bolivian | 17 | 0.1% |
| British | 115 | 0.6% |
| Burmese | 72 | 0.4% |
| Canadian | 44 | 0.2% |
| Central American | 328 | 1.7% |
| Cherokee | 52 | 0.3% |
| Colombian | 287 | 1.5% |
| Costa Rican | 24 | 0.1% |
| Croatian | 10 | 0.1% |
| Cuban | 570 | 2.9% |
| Czech | 58 | 0.3% |
| Czechoslovakian | 14 | 0.1% |
| Dominican | 1,077 | 5.5% |
| Dutch | 639 | 3.3% |
| Eastern European | 60 | 0.3% |
| Ecuadorian | 302 | 1.5% |
| English | 862 | 4.4% |
| European | 155 | 0.8% |
| Finnish | 20 | 0.1% |
| French | 267 | 1.4% |
| French Canadian | 35 | 0.2% |
| German | 2,029 | 10.4% |
| Greek | 68 | 0.4% |
| Guatemalan | 178 | 0.9% |
| Honduran | 75 | 0.4% |
| Hungarian | 58 | 0.3% |
| Indian (Asian) | 51 | 0.3% |
| Irish | 2,903 | 14.9% |
| Italian | 5,268 | 27.1% |
| Jamaican | 148 | 0.8% |
| Jordanian | 110 | 0.6% |
| Korean | 72 | 0.4% |
| Lebanese | 49 | 0.3% |
| Lithuanian | 136 | 0.7% |
| Macedonian | 51 | 0.3% |
| Mexican | 321 | 1.7% |
| Northern European | 47 | 0.2% |
| Norwegian | 44 | 0.2% |
| Panamanian | 20 | 0.1% |
| Paraguayan | 12 | 0.1% |
| Pennsylvania German | 10 | 0.1% |
| Peruvian | 570 | 2.9% |
| Polish | 871 | 4.5% |
| Portuguese | 62 | 0.3% |
| Puerto Rican | 584 | 3.0% |
| Romanian | 1 | 0.0% |
| Russian | 210 | 1.1% |
| Salvadoran | 31 | 0.2% |
| Scotch-Irish | 84 | 0.4% |
| Scottish | 71 | 0.4% |
| Slovak | 33 | 0.2% |
| Slovene | 12 | 0.1% |
| South American | 1,399 | 7.2% |
| South American Indian | 29 | 0.2% |
| Spaniard | 9 | 0.1% |
| Spanish | 125 | 0.6% |
| Swedish | 25 | 0.1% |
| Syrian | 248 | 1.3% |
| Thai | 4 | 0.0% |
| Trinidadian and Tobagonian | 23 | 0.1% |
| Turkish | 8 | 0.0% |
| Ukrainian | 46 | 0.2% |
| Uruguayan | 28 | 0.1% |
| Venezuelan | 88 | 0.4% |
| Welsh | 53 | 0.3% | View All 73 Rows |
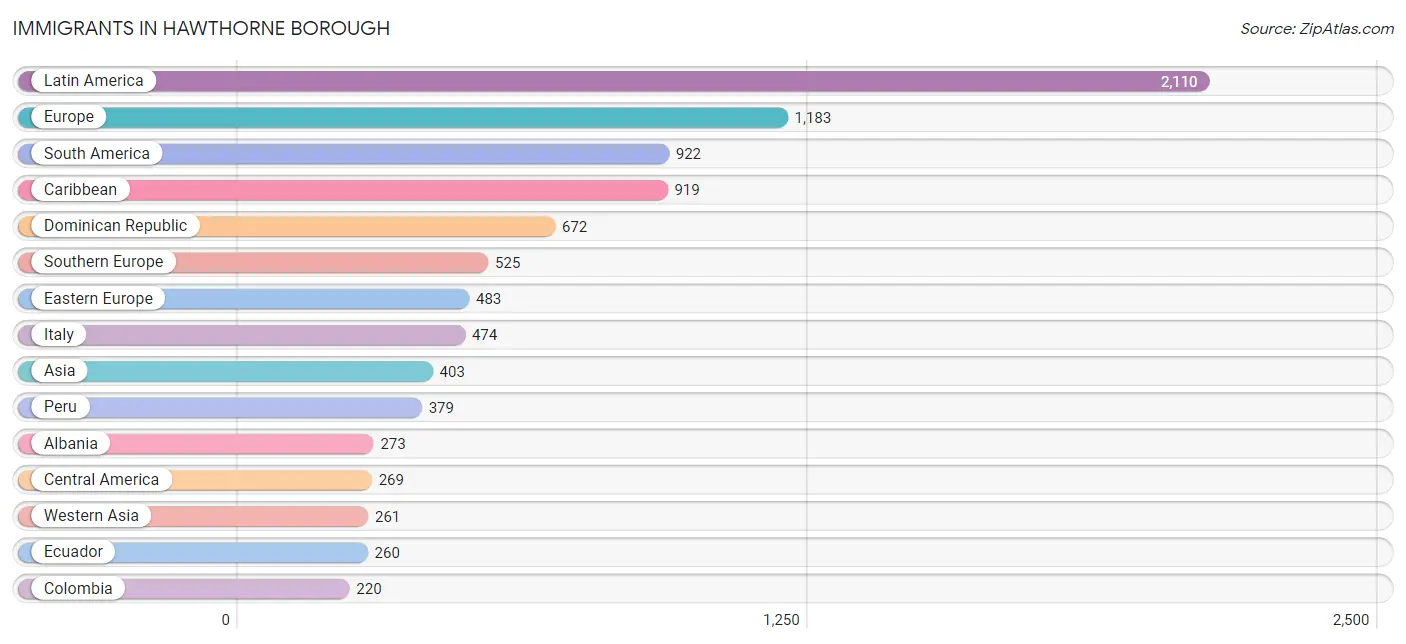
Immigrants in Hawthorne borough
The most numerous immigrant groups reported in Hawthorne borough came from Latin America (2,110 | 10.8%), Europe (1,183 | 6.1%), South America (922 | 4.7%), Caribbean (919 | 4.7%), and Dominican Republic (672 | 3.5%), together accounting for 29.8% of all Hawthorne borough residents.
| Immigration Origin | # Population | % Population |
| Africa | 16 | 0.1% |
| Albania | 273 | 1.4% |
| Asia | 403 | 2.1% |
| Bolivia | 17 | 0.1% |
| Caribbean | 919 | 4.7% |
| Central America | 269 | 1.4% |
| China | 51 | 0.3% |
| Colombia | 220 | 1.1% |
| Costa Rica | 24 | 0.1% |
| Cuba | 85 | 0.4% |
| Dominican Republic | 672 | 3.5% |
| Eastern Asia | 70 | 0.4% |
| Eastern Europe | 483 | 2.5% |
| Ecuador | 260 | 1.3% |
| England | 31 | 0.2% |
| Europe | 1,183 | 6.1% |
| France | 12 | 0.1% |
| Germany | 106 | 0.5% |
| Greece | 25 | 0.1% |
| Guatemala | 111 | 0.6% |
| Guyana | 18 | 0.1% |
| Honduras | 75 | 0.4% |
| Ireland | 26 | 0.1% |
| Italy | 474 | 2.4% |
| Jamaica | 80 | 0.4% |
| Jordan | 110 | 0.6% |
| Korea | 19 | 0.1% |
| Latin America | 2,110 | 10.8% |
| Lebanon | 28 | 0.1% |
| Mexico | 39 | 0.2% |
| Morocco | 16 | 0.1% |
| North Macedonia | 41 | 0.2% |
| Northern Africa | 16 | 0.1% |
| Northern Europe | 57 | 0.3% |
| Panama | 20 | 0.1% |
| Peru | 379 | 1.9% |
| Philippines | 72 | 0.4% |
| Poland | 73 | 0.4% |
| Portugal | 5 | 0.0% |
| Russia | 92 | 0.5% |
| South America | 922 | 4.7% |
| South Eastern Asia | 72 | 0.4% |
| Southern Europe | 525 | 2.7% |
| Spain | 21 | 0.1% |
| Syria | 60 | 0.3% |
| Trinidad and Tobago | 82 | 0.4% |
| Turkey | 50 | 0.3% |
| Ukraine | 4 | 0.0% |
| Uruguay | 28 | 0.1% |
| Western Asia | 261 | 1.3% |
| Western Europe | 118 | 0.6% | View All 51 Rows |
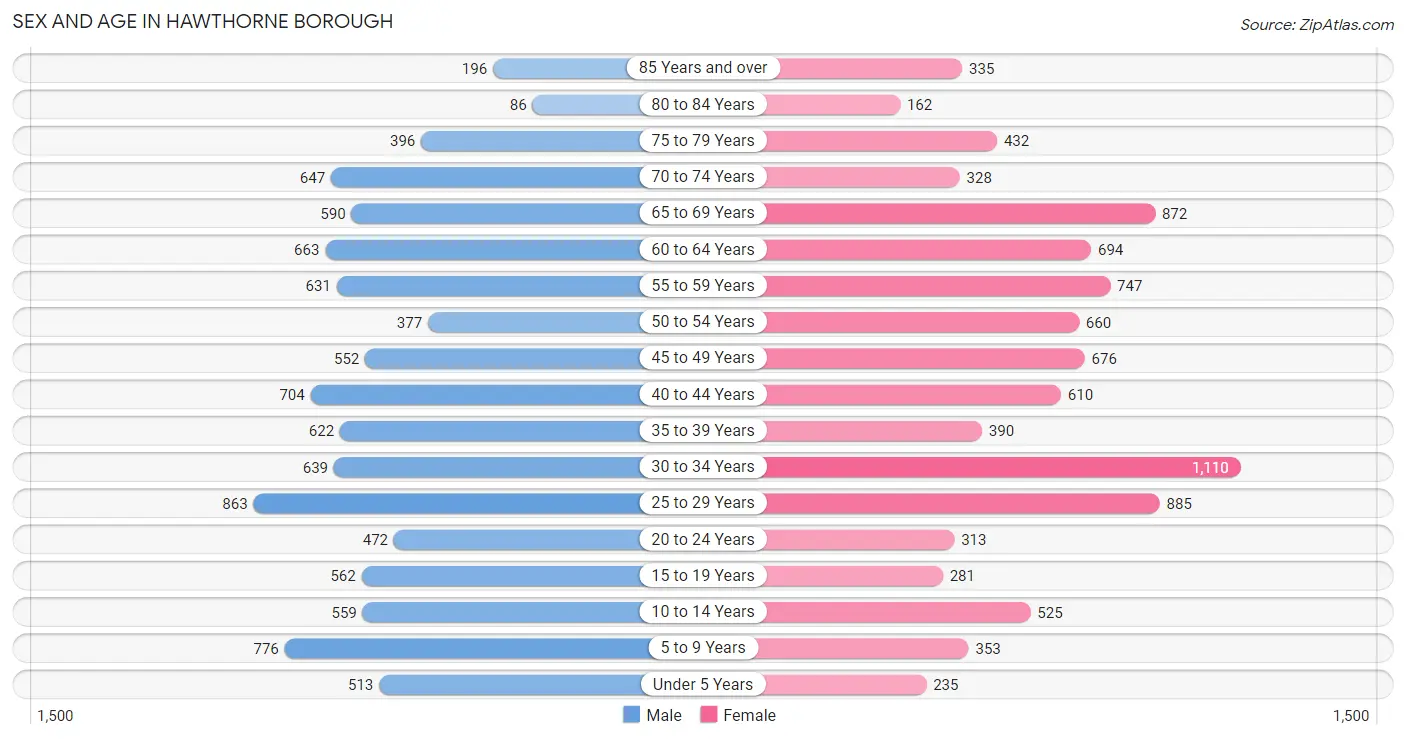
Sex and Age in Hawthorne borough
Sex and Age in Hawthorne borough
The most populous age groups in Hawthorne borough are 25 to 29 Years (863 | 8.8%) for men and 30 to 34 Years (1,110 | 11.6%) for women.
| Age Bracket | Male | Female |
| Under 5 Years | 513 (5.2%) | 235 (2.5%) |
| 5 to 9 Years | 776 (7.9%) | 353 (3.7%) |
| 10 to 14 Years | 559 (5.7%) | 525 (5.5%) |
| 15 to 19 Years | 562 (5.7%) | 281 (2.9%) |
| 20 to 24 Years | 472 (4.8%) | 313 (3.3%) |
| 25 to 29 Years | 863 (8.8%) | 885 (9.2%) |
| 30 to 34 Years | 639 (6.5%) | 1,110 (11.6%) |
| 35 to 39 Years | 622 (6.3%) | 390 (4.1%) |
| 40 to 44 Years | 704 (7.1%) | 610 (6.4%) |
| 45 to 49 Years | 552 (5.6%) | 676 (7.0%) |
| 50 to 54 Years | 377 (3.8%) | 660 (6.9%) |
| 55 to 59 Years | 631 (6.4%) | 747 (7.8%) |
| 60 to 64 Years | 663 (6.7%) | 694 (7.2%) |
| 65 to 69 Years | 590 (6.0%) | 872 (9.1%) |
| 70 to 74 Years | 647 (6.6%) | 328 (3.4%) |
| 75 to 79 Years | 396 (4.0%) | 432 (4.5%) |
| 80 to 84 Years | 86 (0.9%) | 162 (1.7%) |
| 85 Years and over | 196 (2.0%) | 335 (3.5%) |
| Total | 9,848 (100.0%) | 9,608 (100.0%) |
Families and Households in Hawthorne borough
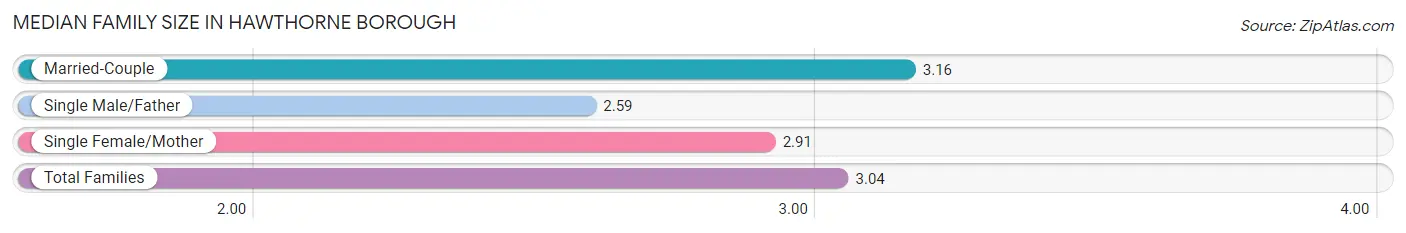
Median Family Size in Hawthorne borough
The median family size in Hawthorne borough is 3.04 persons per family, with married-couple families (3,727 | 69.3%) accounting for the largest median family size of 3.16 persons per family. On the other hand, single male/father families (718 | 13.3%) represent the smallest median family size with 2.59 persons per family.
| Family Type | # Families | Family Size |
| Married-Couple | 3,727 (69.3%) | 3.16 |
| Single Male/Father | 718 (13.3%) | 2.59 |
| Single Female/Mother | 937 (17.4%) | 2.91 |
| Total Families | 5,382 (100.0%) | 3.04 |
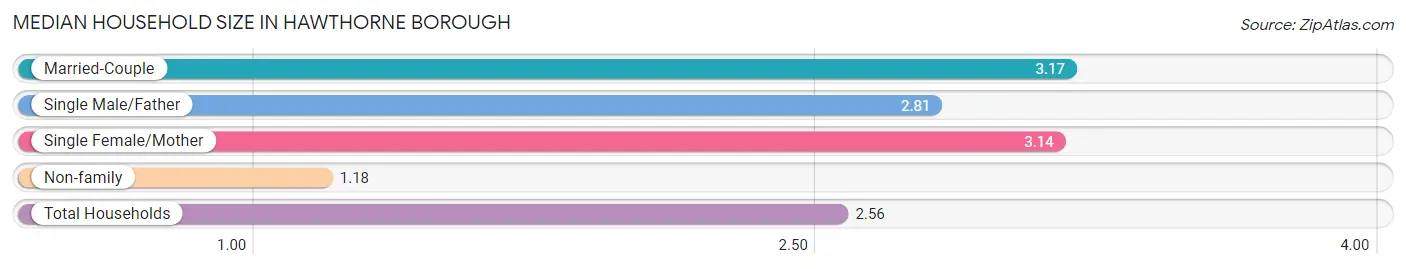
Median Household Size in Hawthorne borough
The median household size in Hawthorne borough is 2.56 persons per household, with married-couple households (3,727 | 49.1%) accounting for the largest median household size of 3.17 persons per household. non-family households (2,203 | 29.0%) represent the smallest median household size with 1.18 persons per household.
| Household Type | # Households | Household Size |
| Married-Couple | 3,727 (49.1%) | 3.17 |
| Single Male/Father | 718 (9.5%) | 2.81 |
| Single Female/Mother | 937 (12.3%) | 3.14 |
| Non-family | 2,203 (29.0%) | 1.18 |
| Total Households | 7,585 (100.0%) | 2.56 |
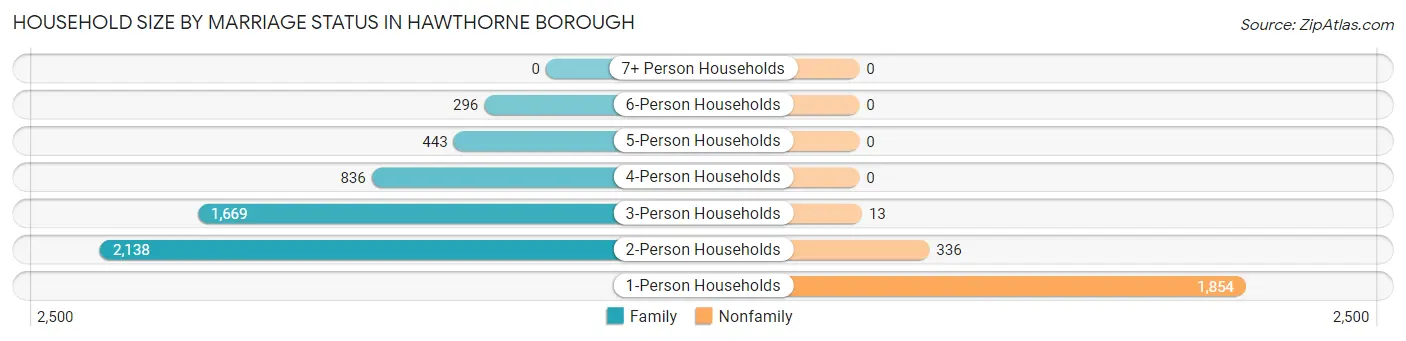
Household Size by Marriage Status in Hawthorne borough
Out of a total of 7,585 households in Hawthorne borough, 5,382 (71.0%) are family households, while 2,203 (29.0%) are nonfamily households. The most numerous type of family households are 2-person households, comprising 2,138, and the most common type of nonfamily households are 1-person households, comprising 1,854.
| Household Size | Family Households | Nonfamily Households |
| 1-Person Households | - | 1,854 (24.4%) |
| 2-Person Households | 2,138 (28.2%) | 336 (4.4%) |
| 3-Person Households | 1,669 (22.0%) | 13 (0.2%) |
| 4-Person Households | 836 (11.0%) | 0 (0.0%) |
| 5-Person Households | 443 (5.8%) | 0 (0.0%) |
| 6-Person Households | 296 (3.9%) | 0 (0.0%) |
| 7+ Person Households | 0 (0.0%) | 0 (0.0%) |
| Total | 5,382 (71.0%) | 2,203 (29.0%) |
Female Fertility in Hawthorne borough
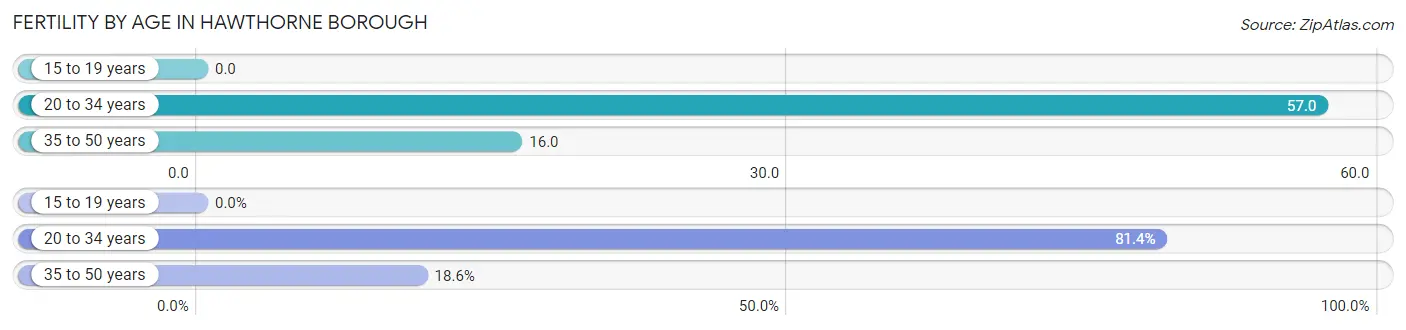
Fertility by Age in Hawthorne borough
Average fertility rate in Hawthorne borough is 36.0 births per 1,000 women. Women in the age bracket of 20 to 34 years have the highest fertility rate with 57.0 births per 1,000 women. Women in the age bracket of 20 to 34 years acount for 81.4% of all women with births.
| Age Bracket | Women with Births | Births / 1,000 Women |
| 15 to 19 years | 0 (0.0%) | 0.0 |
| 20 to 34 years | 131 (81.4%) | 57.0 |
| 35 to 50 years | 30 (18.6%) | 16.0 |
| Total | 161 (100.0%) | 36.0 |
Fertility by Age by Marriage Status in Hawthorne borough
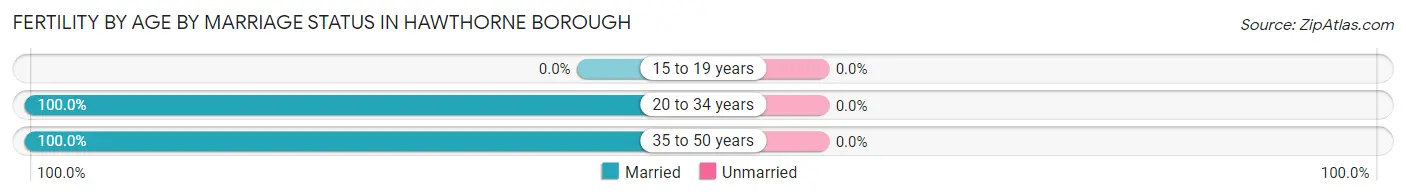
| Age Bracket | Married | Unmarried |
| 15 to 19 years | 0 (0.0%) | 0 (0.0%) |
| 20 to 34 years | 131 (100.0%) | 0 (0.0%) |
| 35 to 50 years | 30 (100.0%) | 0 (0.0%) |
| Total | 161 (100.0%) | 0 (0.0%) |
Fertility by Education in Hawthorne borough
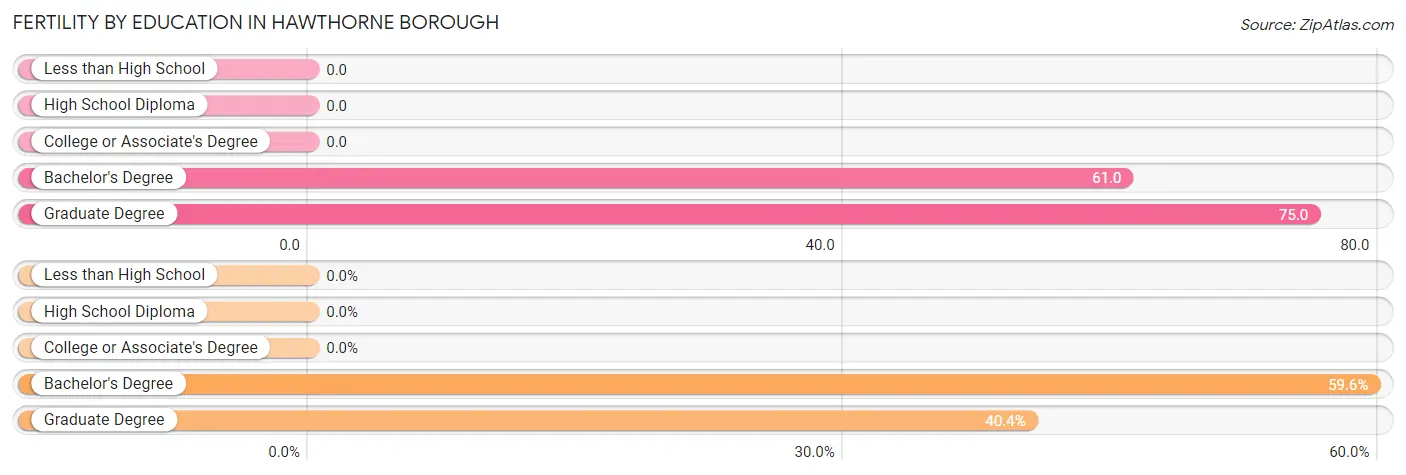
| Educational Attainment | Women with Births | Births / 1,000 Women |
| Less than High School | 0 (0.0%) | 0.0 |
| High School Diploma | 0 (0.0%) | 0.0 |
| College or Associate's Degree | 0 (0.0%) | 0.0 |
| Bachelor's Degree | 96 (59.6%) | 61.0 |
| Graduate Degree | 65 (40.4%) | 75.0 |
| Total | 161 (100.0%) | 36.0 |
Fertility by Education by Marriage Status in Hawthorne borough
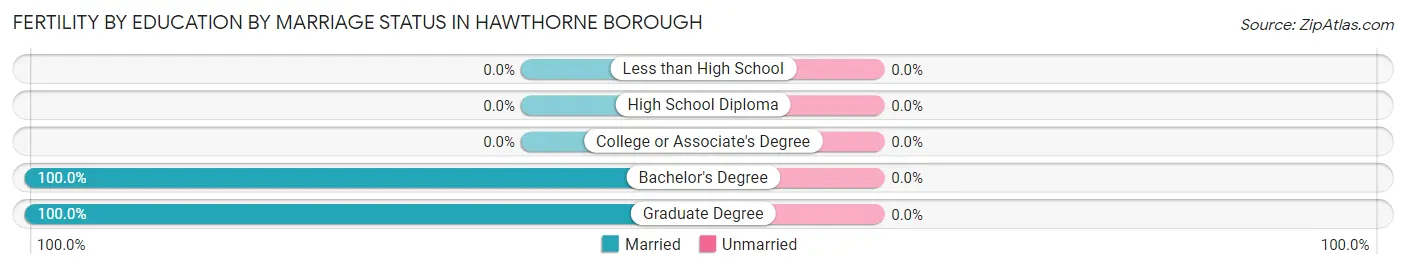
| Educational Attainment | Married | Unmarried |
| Less than High School | 0 (0.0%) | 0 (0.0%) |
| High School Diploma | 0 (0.0%) | 0 (0.0%) |
| College or Associate's Degree | 0 (0.0%) | 0 (0.0%) |
| Bachelor's Degree | 96 (100.0%) | 0 (0.0%) |
| Graduate Degree | 65 (100.0%) | 0 (0.0%) |
| Total | 161 (100.0%) | 0 (0.0%) |
Income in Hawthorne borough
Income Overview in Hawthorne borough
Per Capita Income in Hawthorne borough is $51,860, while median incomes of families and households are $123,688 and $105,168 respectively.
| Characteristic | Number | Measure |
| Per Capita Income | 19,456 | $51,860 |
| Median Family Income | 5,382 | $123,688 |
| Mean Family Income | 5,382 | $149,091 |
| Median Household Income | 7,585 | $105,168 |
| Mean Household Income | 7,585 | $131,850 |
| Income Deficit | 5,382 | $0 |
| Wage / Income Gap (%) | 19,456 | 31.50% |
| Wage / Income Gap ($) | 19,456 | 68.50¢ per $1 |
| Gini / Inequality Index | 19,456 | 0.41 |
Earnings by Sex in Hawthorne borough
Average Earnings in Hawthorne borough are $57,235, $68,338 for men and $46,810 for women, a difference of 31.5%.
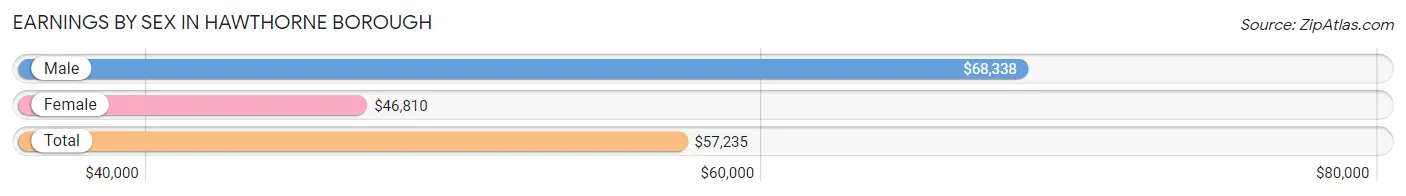
| Sex | Number | Average Earnings |
| Male | 5,911 (50.0%) | $68,338 |
| Female | 5,902 (50.0%) | $46,810 |
| Total | 11,813 (100.0%) | $57,235 |
Earnings by Sex by Income Bracket in Hawthorne borough
The most common earnings brackets in Hawthorne borough are $100,000+ for men (1,587 | 26.9%) and $100,000+ for women (1,010 | 17.1%).
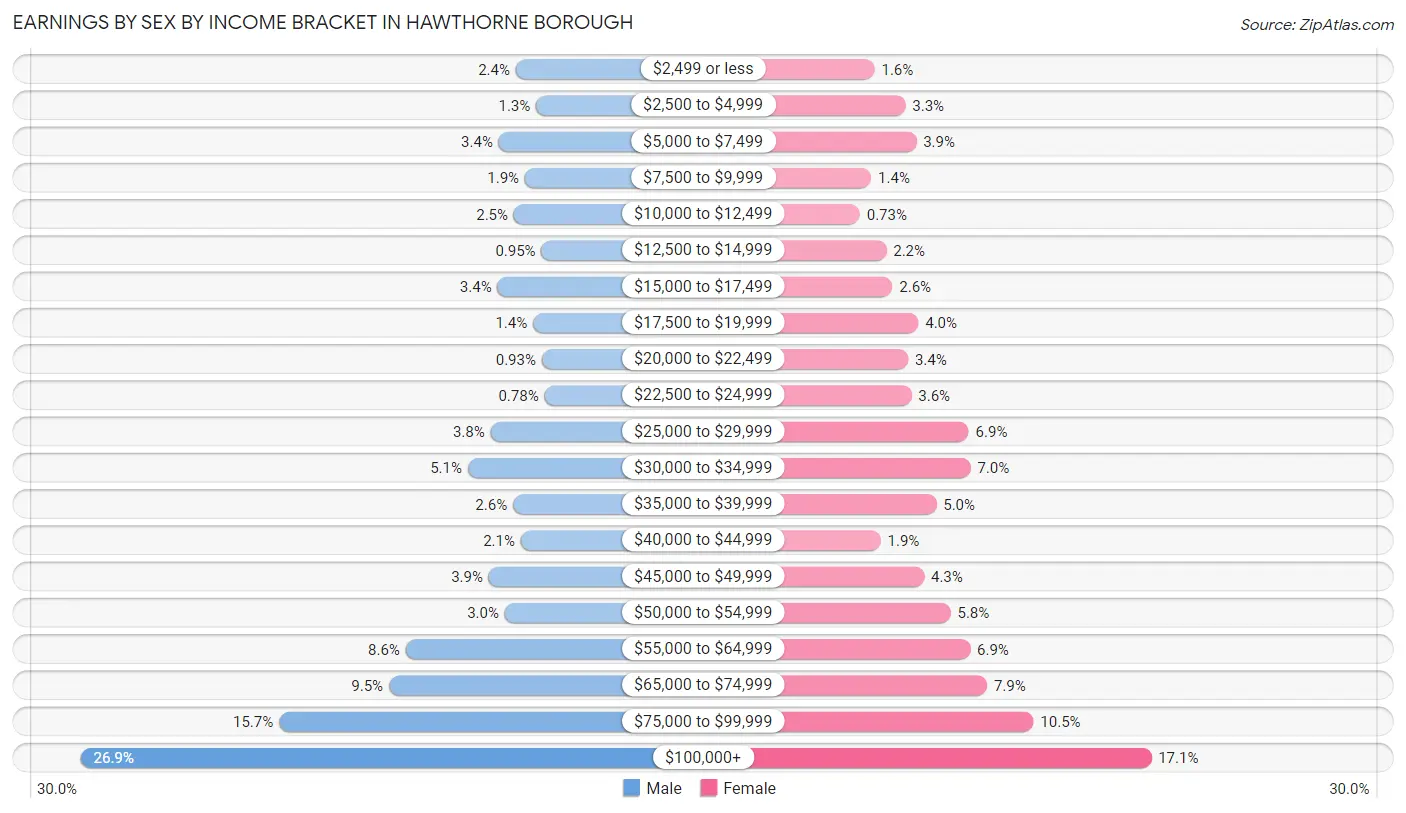
| Income | Male | Female |
| $2,499 or less | 141 (2.4%) | 92 (1.6%) |
| $2,500 to $4,999 | 74 (1.3%) | 194 (3.3%) |
| $5,000 to $7,499 | 198 (3.4%) | 230 (3.9%) |
| $7,500 to $9,999 | 111 (1.9%) | 81 (1.4%) |
| $10,000 to $12,499 | 148 (2.5%) | 43 (0.7%) |
| $12,500 to $14,999 | 56 (0.9%) | 131 (2.2%) |
| $15,000 to $17,499 | 202 (3.4%) | 151 (2.6%) |
| $17,500 to $19,999 | 84 (1.4%) | 237 (4.0%) |
| $20,000 to $22,499 | 55 (0.9%) | 203 (3.4%) |
| $22,500 to $24,999 | 46 (0.8%) | 214 (3.6%) |
| $25,000 to $29,999 | 225 (3.8%) | 404 (6.9%) |
| $30,000 to $34,999 | 301 (5.1%) | 410 (7.0%) |
| $35,000 to $39,999 | 151 (2.5%) | 297 (5.0%) |
| $40,000 to $44,999 | 125 (2.1%) | 112 (1.9%) |
| $45,000 to $49,999 | 231 (3.9%) | 256 (4.3%) |
| $50,000 to $54,999 | 178 (3.0%) | 344 (5.8%) |
| $55,000 to $64,999 | 507 (8.6%) | 409 (6.9%) |
| $65,000 to $74,999 | 563 (9.5%) | 465 (7.9%) |
| $75,000 to $99,999 | 928 (15.7%) | 619 (10.5%) |
| $100,000+ | 1,587 (26.9%) | 1,010 (17.1%) |
| Total | 5,911 (100.0%) | 5,902 (100.0%) |
Earnings by Sex by Educational Attainment in Hawthorne borough
Average earnings in Hawthorne borough are $70,553 for men and $50,765 for women, a difference of 28.1%. Men with an educational attainment of graduate degree enjoy the highest average annual earnings of $107,705, while those with less than high school education earn the least with $33,378. Women with an educational attainment of graduate degree earn the most with the average annual earnings of $89,563, while those with high school diploma education have the smallest earnings of $30,717.
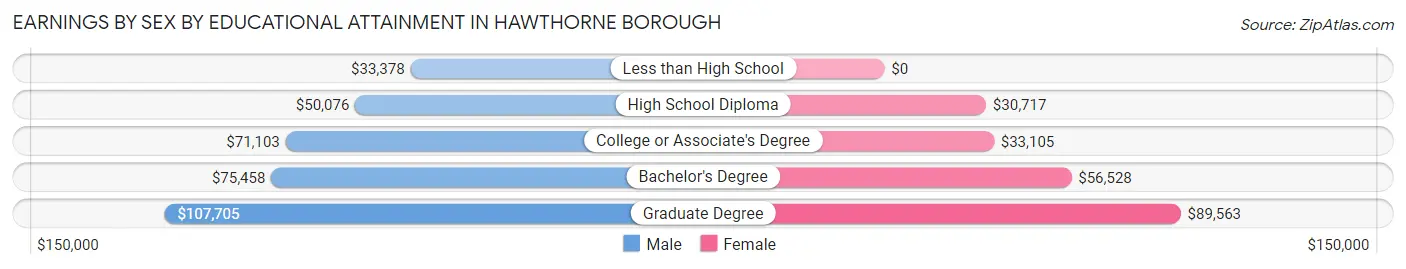
| Educational Attainment | Male Income | Female Income |
| Less than High School | $33,378 | $0 |
| High School Diploma | $50,076 | $30,717 |
| College or Associate's Degree | $71,103 | $33,105 |
| Bachelor's Degree | $75,458 | $56,528 |
| Graduate Degree | $107,705 | $89,563 |
| Total | $70,553 | $50,765 |
Family Income in Hawthorne borough
Family Income Brackets in Hawthorne borough
According to the Hawthorne borough family income data, there are 1,346 families falling into the $200,000+ income range, which is the most common income bracket and makes up 25.0% of all families. Conversely, the less than $10,000 income bracket is the least frequent group with only 32 families (0.6%) belonging to this category.
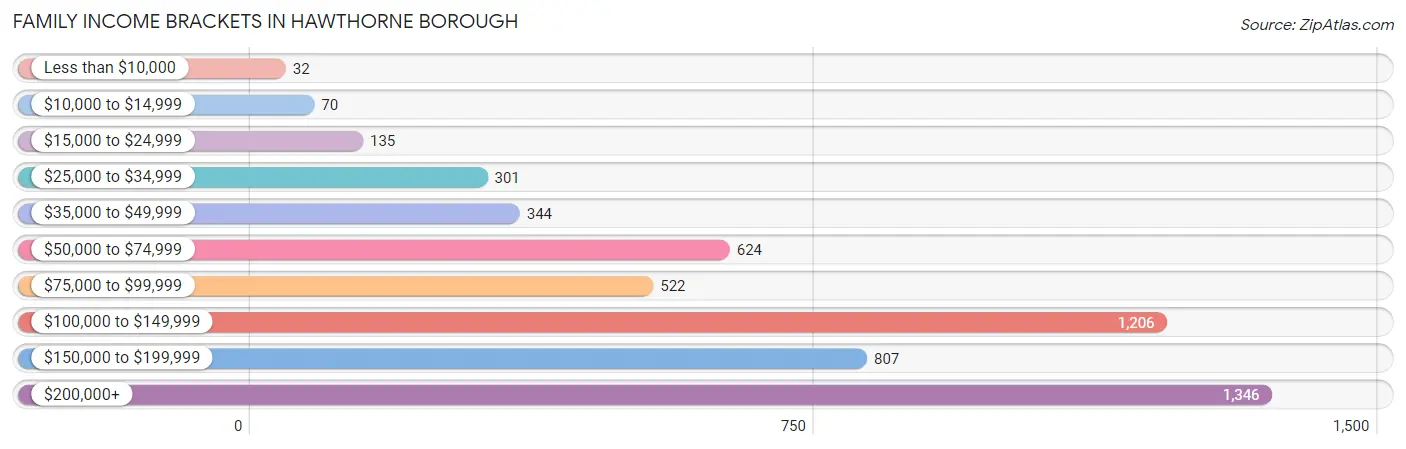
| Income Bracket | # Families | % Families |
| Less than $10,000 | 32 | 0.6% |
| $10,000 to $14,999 | 70 | 1.3% |
| $15,000 to $24,999 | 135 | 2.5% |
| $25,000 to $34,999 | 301 | 5.6% |
| $35,000 to $49,999 | 344 | 6.4% |
| $50,000 to $74,999 | 624 | 11.6% |
| $75,000 to $99,999 | 522 | 9.7% |
| $100,000 to $149,999 | 1,206 | 22.4% |
| $150,000 to $199,999 | 807 | 15.0% |
| $200,000+ | 1,346 | 25.0% |
Family Income by Famaliy Size in Hawthorne borough
5-person families (486 | 9.0%) account for the highest median family income in Hawthorne borough with $172,500 per family, while 3-person families (1,610 | 29.9%) have the highest median income of $46,387 per family member.
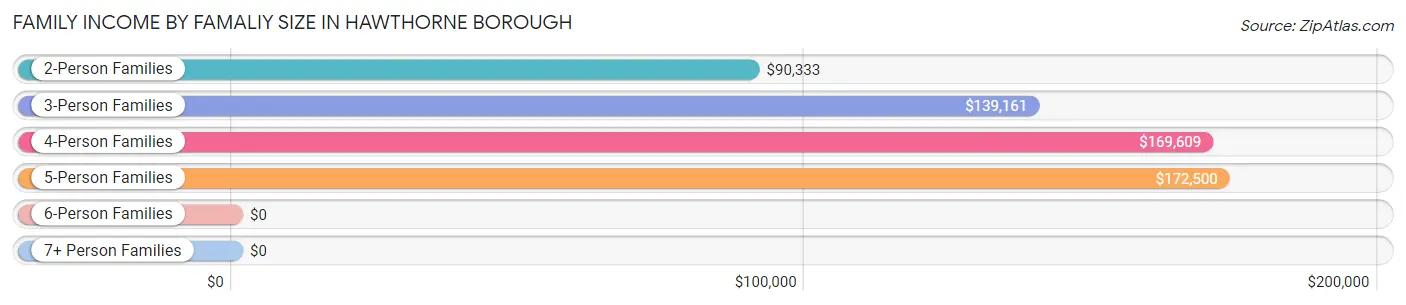
| Income Bracket | # Families | Median Income |
| 2-Person Families | 2,318 (43.1%) | $90,333 |
| 3-Person Families | 1,610 (29.9%) | $139,161 |
| 4-Person Families | 761 (14.1%) | $169,609 |
| 5-Person Families | 486 (9.0%) | $172,500 |
| 6-Person Families | 207 (3.8%) | $0 |
| 7+ Person Families | 0 (0.0%) | $0 |
| Total | 5,382 (100.0%) | $123,688 |
Family Income by Number of Earners in Hawthorne borough
The median family income in Hawthorne borough is $123,688, with families comprising 3+ earners (753) having the highest median family income of $217,125, while families with no earners (601) have the lowest median family income of $60,554, accounting for 14.0% and 11.2% of families, respectively.
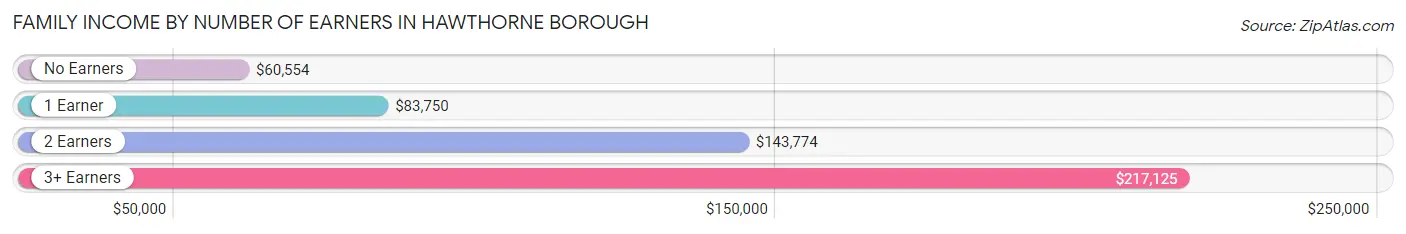
| Number of Earners | # Families | Median Income |
| No Earners | 601 (11.2%) | $60,554 |
| 1 Earner | 1,260 (23.4%) | $83,750 |
| 2 Earners | 2,768 (51.4%) | $143,774 |
| 3+ Earners | 753 (14.0%) | $217,125 |
| Total | 5,382 (100.0%) | $123,688 |
Household Income in Hawthorne borough
Household Income Brackets in Hawthorne borough
With 1,638 households falling in the category, the $100,000 to $149,999 income range is the most frequent in Hawthorne borough, accounting for 21.6% of all households. In contrast, only 152 households (2.0%) fall into the less than $10,000 income bracket, making it the least populous group.
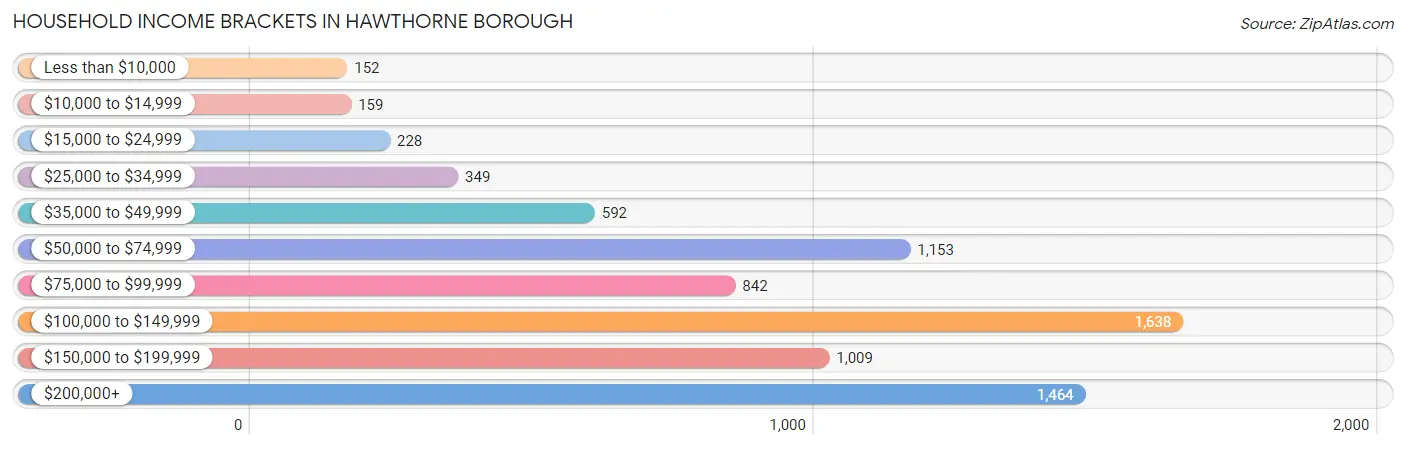
| Income Bracket | # Households | % Households |
| Less than $10,000 | 152 | 2.0% |
| $10,000 to $14,999 | 159 | 2.1% |
| $15,000 to $24,999 | 228 | 3.0% |
| $25,000 to $34,999 | 349 | 4.6% |
| $35,000 to $49,999 | 592 | 7.8% |
| $50,000 to $74,999 | 1,153 | 15.2% |
| $75,000 to $99,999 | 842 | 11.1% |
| $100,000 to $149,999 | 1,638 | 21.6% |
| $150,000 to $199,999 | 1,009 | 13.3% |
| $200,000+ | 1,464 | 19.3% |
Household Income by Householder Age in Hawthorne borough
The median household income in Hawthorne borough is $105,168, with the highest median household income of $130,905 found in the 45 to 64 years age bracket for the primary householder. A total of 2,843 households (37.5%) fall into this category. Meanwhile, the 15 to 24 years age bracket for the primary householder has the lowest median household income of $0, with 69 households (0.9%) in this group.
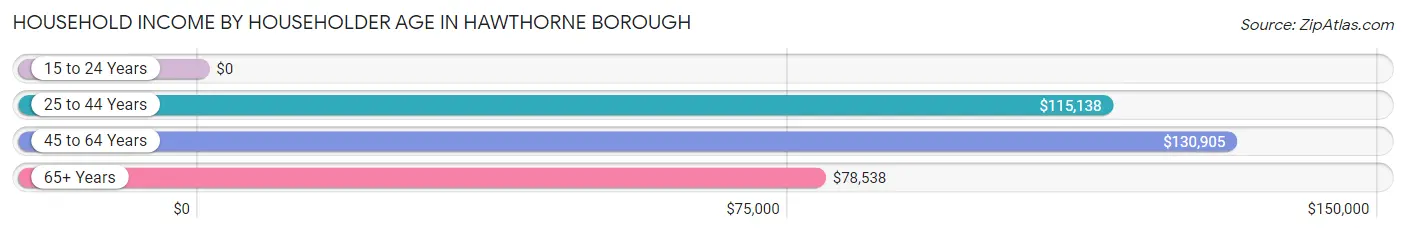
| Income Bracket | # Households | Median Income |
| 15 to 24 Years | 69 (0.9%) | $0 |
| 25 to 44 Years | 2,251 (29.7%) | $115,138 |
| 45 to 64 Years | 2,843 (37.5%) | $130,905 |
| 65+ Years | 2,422 (31.9%) | $78,538 |
| Total | 7,585 (100.0%) | $105,168 |
Poverty in Hawthorne borough
Income Below Poverty by Sex and Age in Hawthorne borough
With 4.5% poverty level for males and 5.3% for females among the residents of Hawthorne borough, 65 to 74 year old males and 18 to 24 year old females are the most vulnerable to poverty, with 91 males (7.4%) and 55 females (15.4%) in their respective age groups living below the poverty level.
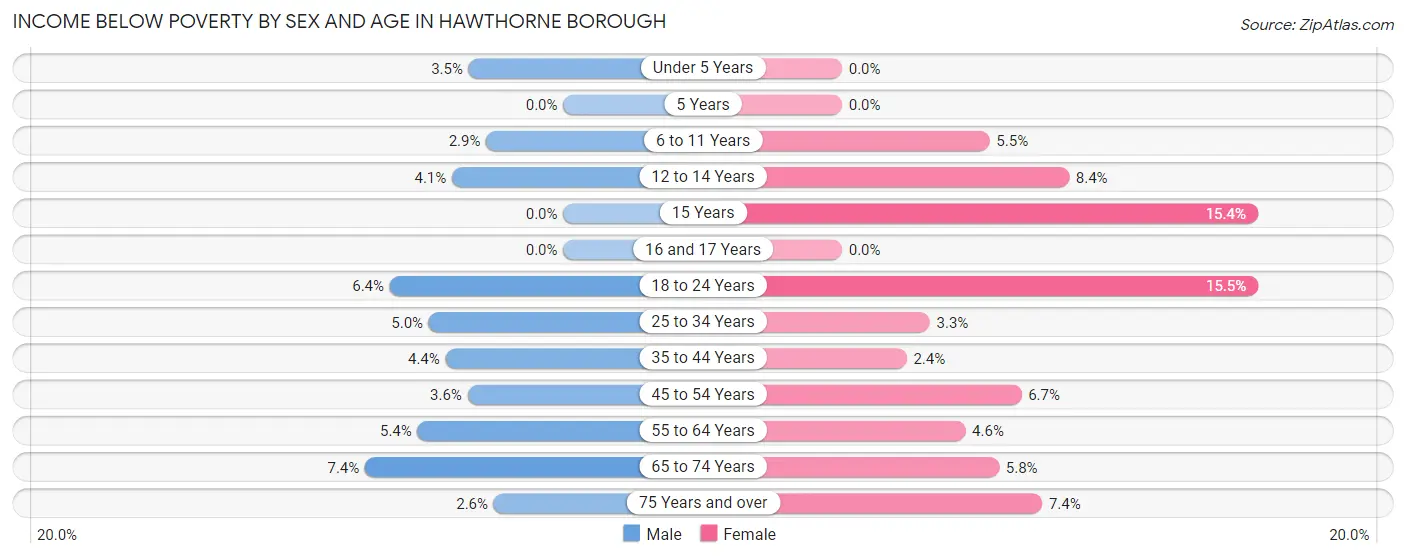
| Age Bracket | Male | Female |
| Under 5 Years | 18 (3.5%) | 0 (0.0%) |
| 5 Years | 0 (0.0%) | 0 (0.0%) |
| 6 to 11 Years | 26 (2.9%) | 23 (5.5%) |
| 12 to 14 Years | 10 (4.1%) | 30 (8.4%) |
| 15 Years | 0 (0.0%) | 21 (15.4%) |
| 16 and 17 Years | 0 (0.0%) | 0 (0.0%) |
| 18 to 24 Years | 40 (6.4%) | 55 (15.4%) |
| 25 to 34 Years | 75 (5.0%) | 65 (3.3%) |
| 35 to 44 Years | 58 (4.4%) | 24 (2.4%) |
| 45 to 54 Years | 33 (3.5%) | 89 (6.7%) |
| 55 to 64 Years | 70 (5.4%) | 66 (4.6%) |
| 65 to 74 Years | 91 (7.4%) | 70 (5.8%) |
| 75 Years and over | 17 (2.6%) | 69 (7.4%) |
| Total | 438 (4.5%) | 512 (5.3%) |
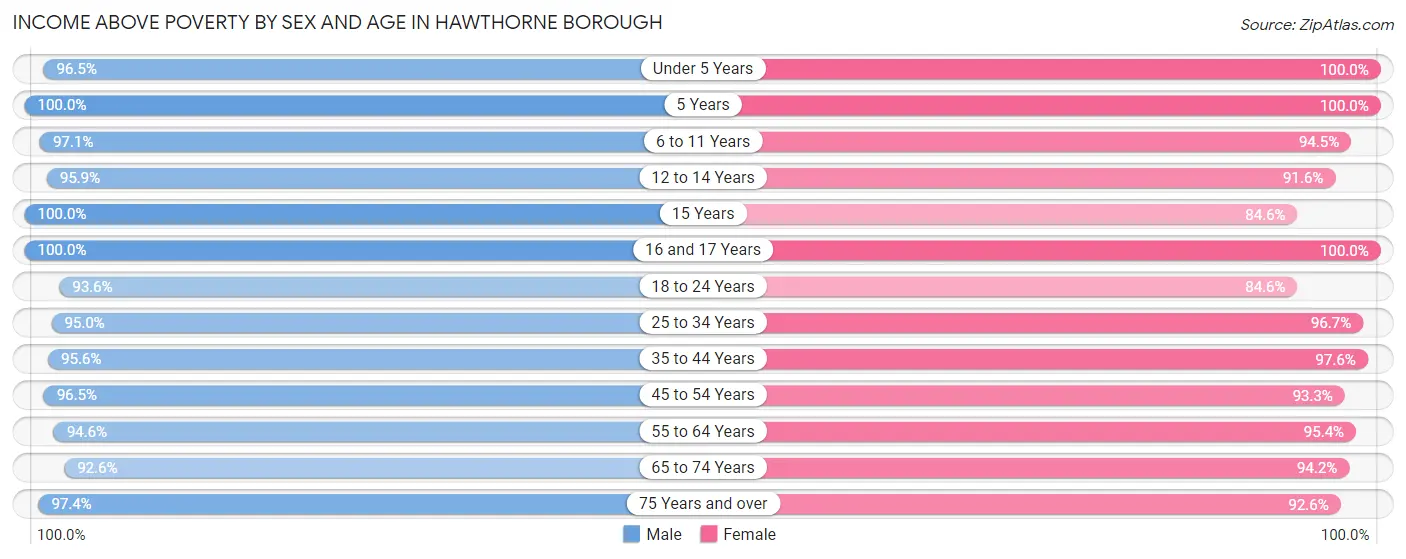
Income Above Poverty by Sex and Age in Hawthorne borough
According to the poverty statistics in Hawthorne borough, males aged 5 years and females aged under 5 years are the age groups that are most secure financially, with 100.0% of males and 100.0% of females in these age groups living above the poverty line.
| Age Bracket | Male | Female |
| Under 5 Years | 495 (96.5%) | 227 (100.0%) |
| 5 Years | 184 (100.0%) | 94 (100.0%) |
| 6 to 11 Years | 883 (97.1%) | 397 (94.5%) |
| 12 to 14 Years | 232 (95.9%) | 326 (91.6%) |
| 15 Years | 71 (100.0%) | 115 (84.6%) |
| 16 and 17 Years | 341 (100.0%) | 102 (100.0%) |
| 18 to 24 Years | 581 (93.6%) | 301 (84.6%) |
| 25 to 34 Years | 1,427 (95.0%) | 1,930 (96.7%) |
| 35 to 44 Years | 1,268 (95.6%) | 976 (97.6%) |
| 45 to 54 Years | 896 (96.5%) | 1,247 (93.3%) |
| 55 to 64 Years | 1,224 (94.6%) | 1,375 (95.4%) |
| 65 to 74 Years | 1,146 (92.6%) | 1,130 (94.2%) |
| 75 Years and over | 641 (97.4%) | 860 (92.6%) |
| Total | 9,389 (95.5%) | 9,080 (94.7%) |
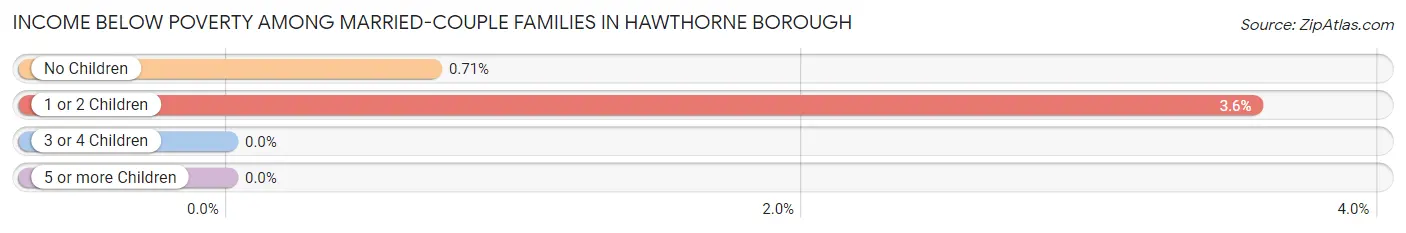
Income Below Poverty Among Married-Couple Families in Hawthorne borough
The poverty statistics for married-couple families in Hawthorne borough show that 1.6% or 60 of the total 3,727 families live below the poverty line. Families with 1 or 2 children have the highest poverty rate of 3.6%, comprising of 44 families. On the other hand, families with 3 or 4 children have the lowest poverty rate of 0.0%, which includes 0 families.
| Children | Above Poverty | Below Poverty |
| No Children | 2,222 (99.3%) | 16 (0.7%) |
| 1 or 2 Children | 1,190 (96.4%) | 44 (3.6%) |
| 3 or 4 Children | 255 (100.0%) | 0 (0.0%) |
| 5 or more Children | 0 (0.0%) | 0 (0.0%) |
| Total | 3,667 (98.4%) | 60 (1.6%) |
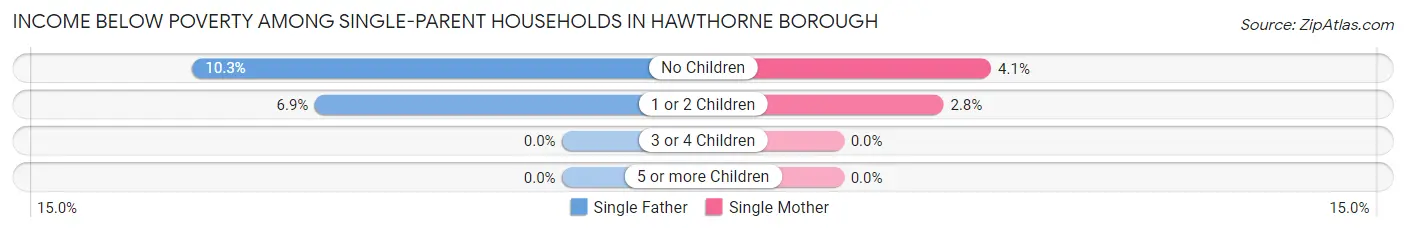
Income Below Poverty Among Single-Parent Households in Hawthorne borough
According to the poverty data in Hawthorne borough, 9.2% or 66 single-father households and 3.2% or 30 single-mother households are living below the poverty line. Among single-father households, those with no children have the highest poverty rate, with 53 households (10.3%) experiencing poverty. Likewise, among single-mother households, those with no children have the highest poverty rate, with 22 households (4.1%) falling below the poverty line.
| Children | Single Father | Single Mother |
| No Children | 53 (10.3%) | 22 (4.1%) |
| 1 or 2 Children | 13 (6.9%) | 8 (2.8%) |
| 3 or 4 Children | 0 (0.0%) | 0 (0.0%) |
| 5 or more Children | 0 (0.0%) | 0 (0.0%) |
| Total | 66 (9.2%) | 30 (3.2%) |
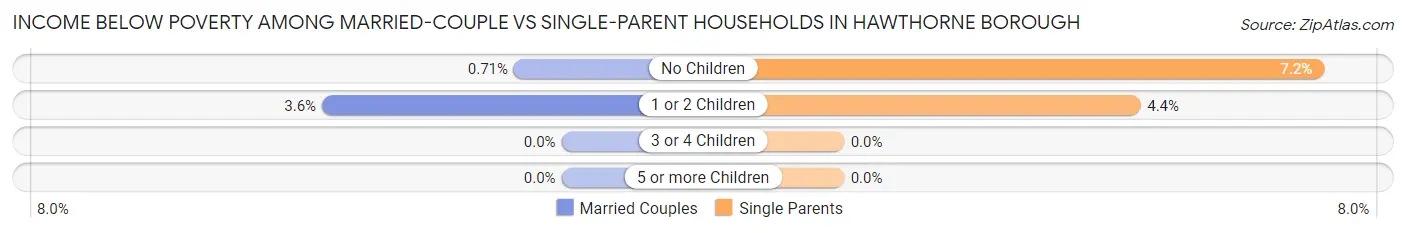
Income Below Poverty Among Married-Couple vs Single-Parent Households in Hawthorne borough
The poverty data for Hawthorne borough shows that 60 of the married-couple family households (1.6%) and 96 of the single-parent households (5.8%) are living below the poverty level. Within the married-couple family households, those with 1 or 2 children have the highest poverty rate, with 44 households (3.6%) falling below the poverty line. Among the single-parent households, those with no children have the highest poverty rate, with 75 household (7.2%) living below poverty.
| Children | Married-Couple Families | Single-Parent Households |
| No Children | 16 (0.7%) | 75 (7.2%) |
| 1 or 2 Children | 44 (3.6%) | 21 (4.4%) |
| 3 or 4 Children | 0 (0.0%) | 0 (0.0%) |
| 5 or more Children | 0 (0.0%) | 0 (0.0%) |
| Total | 60 (1.6%) | 96 (5.8%) |
Employment Characteristics in Hawthorne borough
Employment by Class of Employer in Hawthorne borough
Among the 10,859 employed individuals in Hawthorne borough, private company employees (7,588 | 69.9%), local government employees (1,399 | 12.9%), and not-for-profit organizations (575 | 5.3%) make up the most common classes of employment.
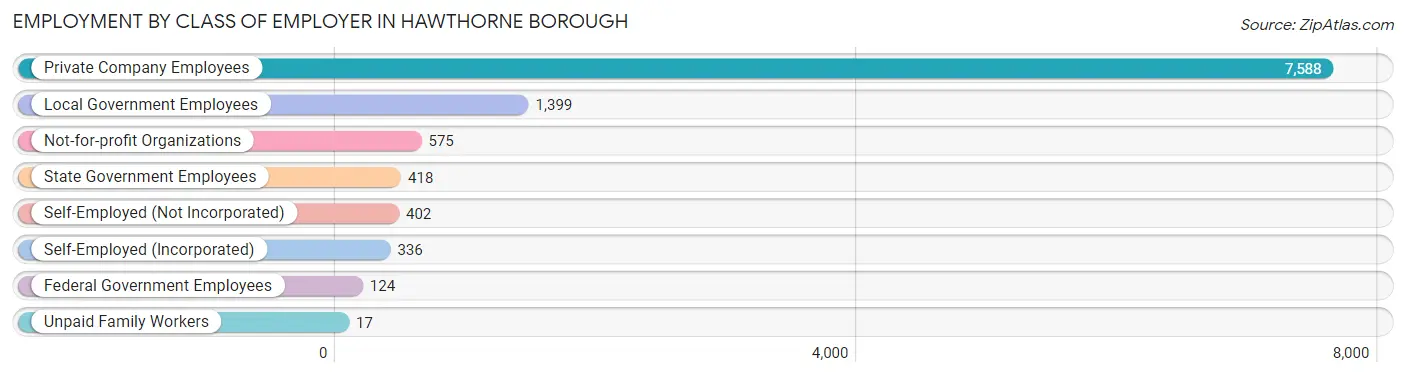
| Employer Class | # Employees | % Employees |
| Private Company Employees | 7,588 | 69.9% |
| Self-Employed (Incorporated) | 336 | 3.1% |
| Self-Employed (Not Incorporated) | 402 | 3.7% |
| Not-for-profit Organizations | 575 | 5.3% |
| Local Government Employees | 1,399 | 12.9% |
| State Government Employees | 418 | 3.8% |
| Federal Government Employees | 124 | 1.1% |
| Unpaid Family Workers | 17 | 0.2% |
| Total | 10,859 | 100.0% |
Employment Status by Age in Hawthorne borough
According to the labor force statistics for Hawthorne borough, out of the total population over 16 years of age (16,287), 72.3% or 11,776 individuals are in the labor force, with 5.5% or 648 of them unemployed. The age group with the highest labor force participation rate is 35 to 44 years, with 93.2% or 2,168 individuals in the labor force. Within the labor force, the 75 years and over age range has the highest percentage of unemployed individuals, with 16.1% or 34 of them being unemployed.
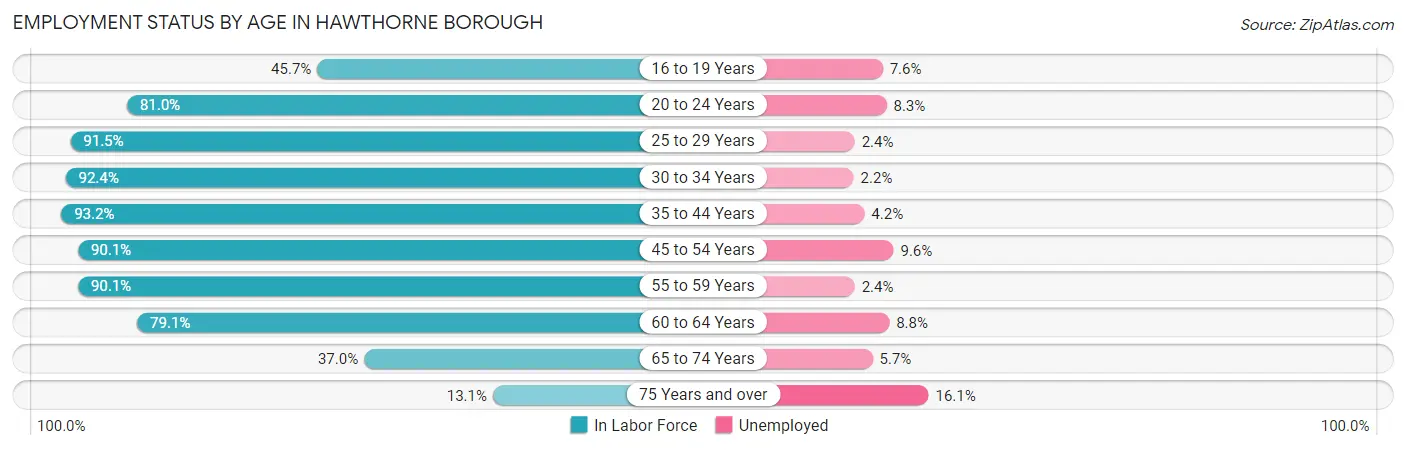
| Age Bracket | In Labor Force | Unemployed |
| 16 to 19 Years | 290 (45.7%) | 22 (7.6%) |
| 20 to 24 Years | 636 (81.0%) | 53 (8.3%) |
| 25 to 29 Years | 1,599 (91.5%) | 38 (2.4%) |
| 30 to 34 Years | 1,616 (92.4%) | 36 (2.2%) |
| 35 to 44 Years | 2,168 (93.2%) | 91 (4.2%) |
| 45 to 54 Years | 2,041 (90.1%) | 196 (9.6%) |
| 55 to 59 Years | 1,242 (90.1%) | 30 (2.4%) |
| 60 to 64 Years | 1,073 (79.1%) | 94 (8.8%) |
| 65 to 74 Years | 902 (37.0%) | 51 (5.7%) |
| 75 Years and over | 211 (13.1%) | 34 (16.1%) |
| Total | 11,776 (72.3%) | 648 (5.5%) |
Employment Status by Educational Attainment in Hawthorne borough
According to labor force statistics for Hawthorne borough, 90.0% of individuals (9,741) out of the total population between 25 and 64 years of age (10,823) are in the labor force, with 5.0% or 487 of them being unemployed. The group with the highest labor force participation rate are those with the educational attainment of bachelor's degree or higher, with 95.1% or 5,293 individuals in the labor force. Within the labor force, individuals with high school diploma education have the highest percentage of unemployment, with 8.4% or 157 of them being unemployed.
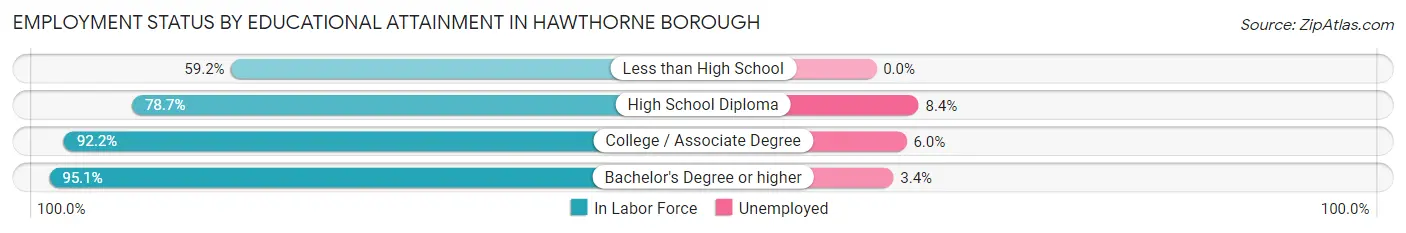
| Educational Attainment | In Labor Force | Unemployed |
| Less than High School | 145 (59.2%) | 0 (0.0%) |
| High School Diploma | 1,864 (78.7%) | 199 (8.4%) |
| College / Associate Degree | 2,438 (92.2%) | 159 (6.0%) |
| Bachelor's Degree or higher | 5,293 (95.1%) | 189 (3.4%) |
| Total | 9,741 (90.0%) | 541 (5.0%) |
Employment Occupations by Sex in Hawthorne borough
Management, Business, Science and Arts Occupations
The most common Management, Business, Science and Arts occupations in Hawthorne borough are Management (1,634 | 14.7%), Community & Social Service (1,501 | 13.5%), Education Instruction & Library (1,051 | 9.4%), Business & Financial (848 | 7.6%), and Health Diagnosing & Treating (732 | 6.6%).
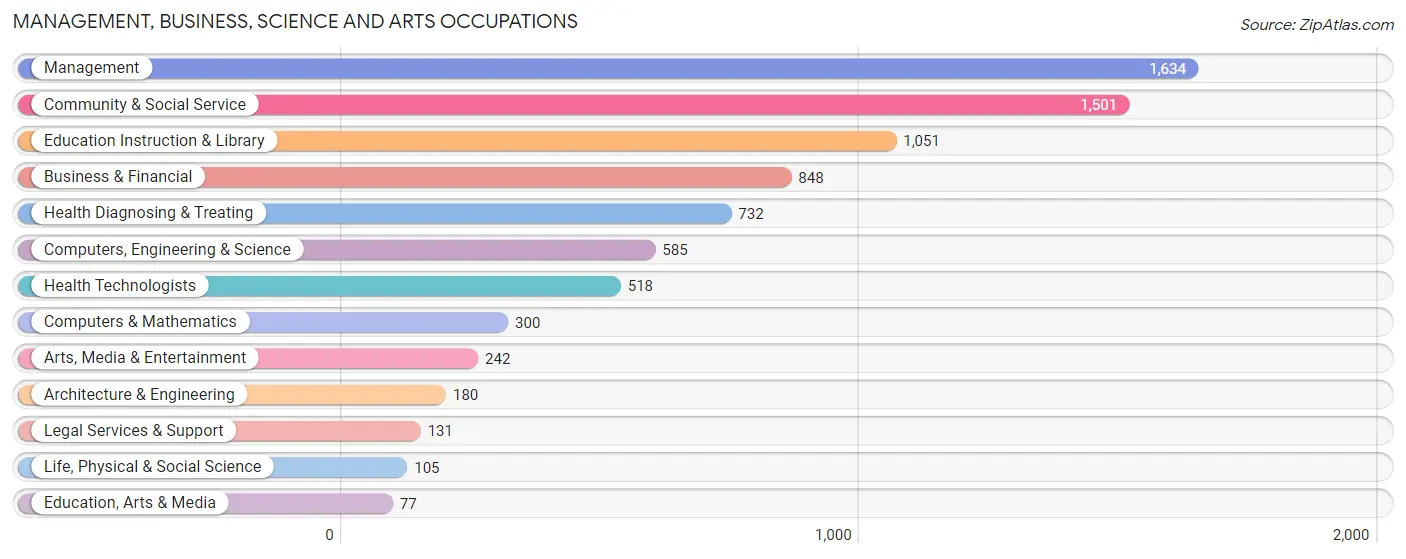
Management, Business, Science and Arts Occupations by Sex
Within the Management, Business, Science and Arts occupations in Hawthorne borough, the most male-oriented occupations are Architecture & Engineering (100.0%), Life, Physical & Social Science (100.0%), and Computers, Engineering & Science (93.0%), while the most female-oriented occupations are Education, Arts & Media (81.8%), Health Technologists (78.6%), and Health Diagnosing & Treating (78.5%).
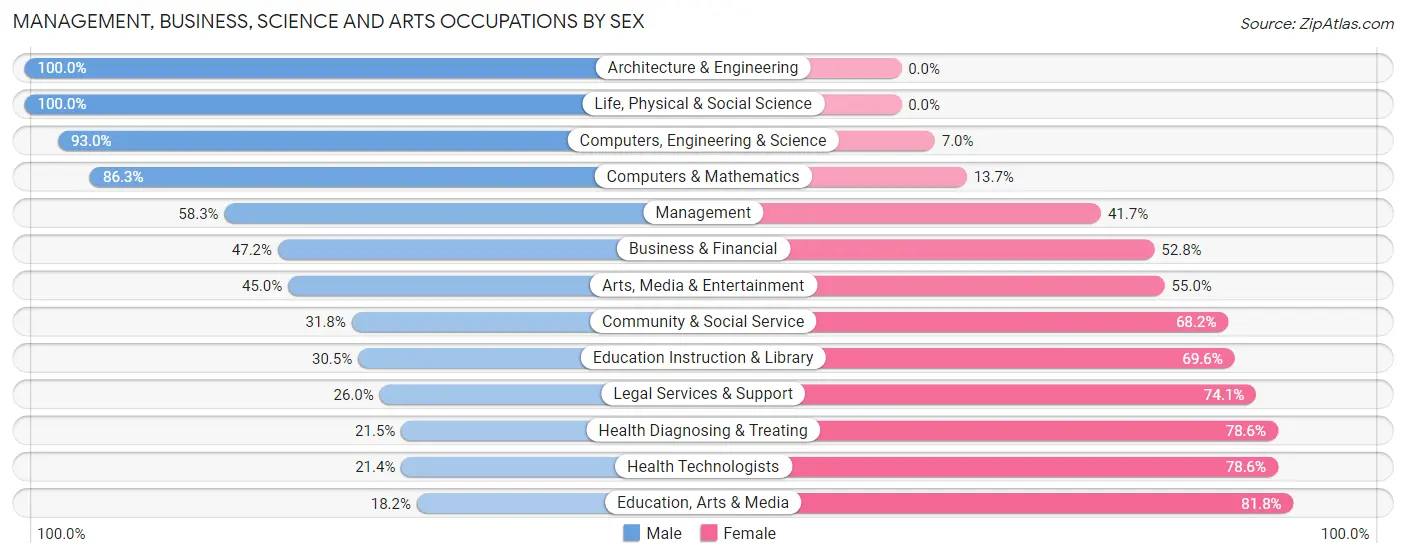
| Occupation | Male | Female |
| Management | 953 (58.3%) | 681 (41.7%) |
| Business & Financial | 400 (47.2%) | 448 (52.8%) |
| Computers, Engineering & Science | 544 (93.0%) | 41 (7.0%) |
| Computers & Mathematics | 259 (86.3%) | 41 (13.7%) |
| Architecture & Engineering | 180 (100.0%) | 0 (0.0%) |
| Life, Physical & Social Science | 105 (100.0%) | 0 (0.0%) |
| Community & Social Service | 477 (31.8%) | 1,024 (68.2%) |
| Education, Arts & Media | 14 (18.2%) | 63 (81.8%) |
| Legal Services & Support | 34 (26.0%) | 97 (74.1%) |
| Education Instruction & Library | 320 (30.4%) | 731 (69.6%) |
| Arts, Media & Entertainment | 109 (45.0%) | 133 (55.0%) |
| Health Diagnosing & Treating | 157 (21.4%) | 575 (78.5%) |
| Health Technologists | 111 (21.4%) | 407 (78.6%) |
| Total (Category) | 2,531 (47.7%) | 2,769 (52.2%) |
| Total (Overall) | 5,507 (49.5%) | 5,627 (50.5%) |
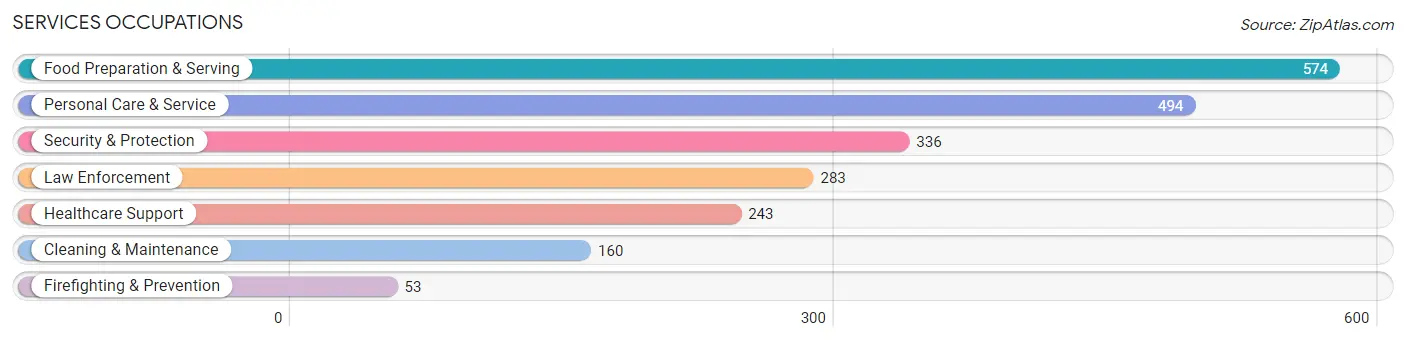
Services Occupations
The most common Services occupations in Hawthorne borough are Food Preparation & Serving (574 | 5.2%), Personal Care & Service (494 | 4.4%), Security & Protection (336 | 3.0%), Law Enforcement (283 | 2.5%), and Healthcare Support (243 | 2.2%).
Services Occupations by Sex
Within the Services occupations in Hawthorne borough, the most male-oriented occupations are Firefighting & Prevention (100.0%), Security & Protection (95.2%), and Cleaning & Maintenance (95.0%), while the most female-oriented occupations are Healthcare Support (89.7%), Personal Care & Service (87.5%), and Food Preparation & Serving (70.0%).
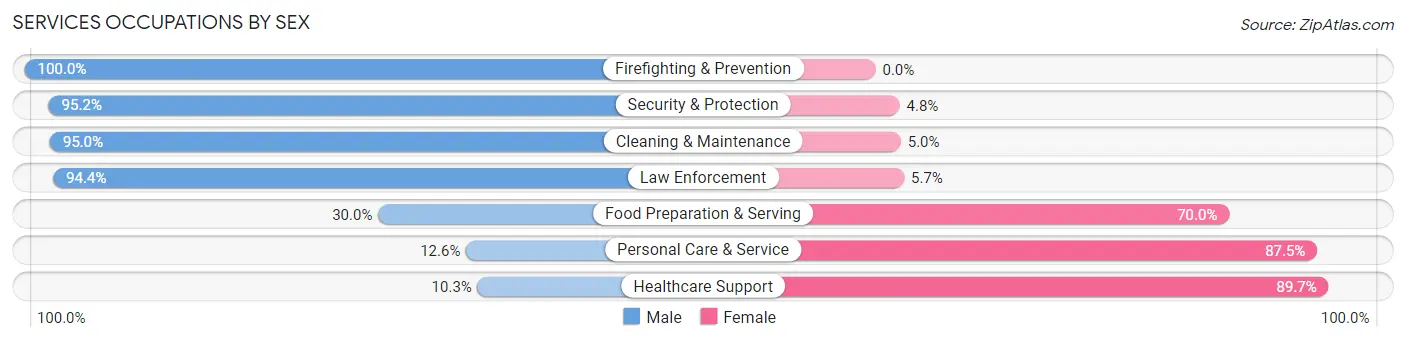
| Occupation | Male | Female |
| Healthcare Support | 25 (10.3%) | 218 (89.7%) |
| Security & Protection | 320 (95.2%) | 16 (4.8%) |
| Firefighting & Prevention | 53 (100.0%) | 0 (0.0%) |
| Law Enforcement | 267 (94.4%) | 16 (5.7%) |
| Food Preparation & Serving | 172 (30.0%) | 402 (70.0%) |
| Cleaning & Maintenance | 152 (95.0%) | 8 (5.0%) |
| Personal Care & Service | 62 (12.6%) | 432 (87.5%) |
| Total (Category) | 731 (40.5%) | 1,076 (59.6%) |
| Total (Overall) | 5,507 (49.5%) | 5,627 (50.5%) |
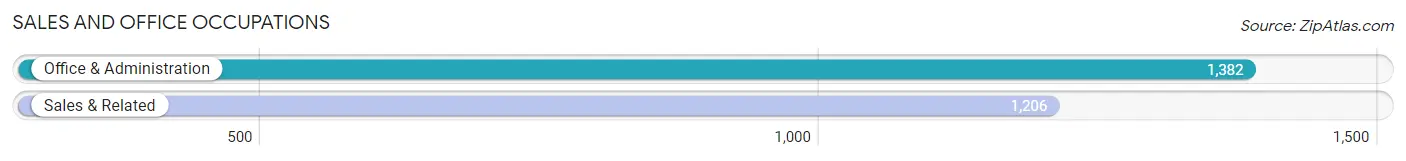
Sales and Office Occupations
The most common Sales and Office occupations in Hawthorne borough are Office & Administration (1,382 | 12.4%), and Sales & Related (1,206 | 10.8%).
Sales and Office Occupations by Sex
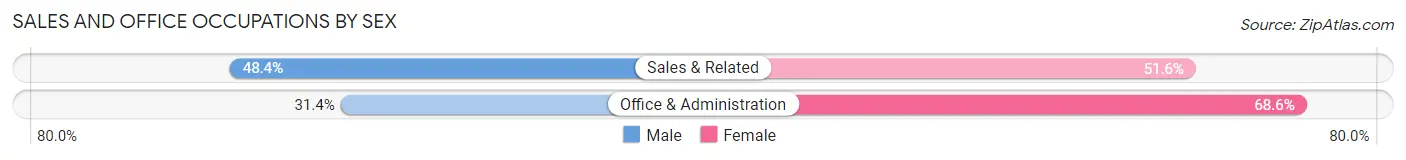
| Occupation | Male | Female |
| Sales & Related | 584 (48.4%) | 622 (51.6%) |
| Office & Administration | 434 (31.4%) | 948 (68.6%) |
| Total (Category) | 1,018 (39.3%) | 1,570 (60.7%) |
| Total (Overall) | 5,507 (49.5%) | 5,627 (50.5%) |
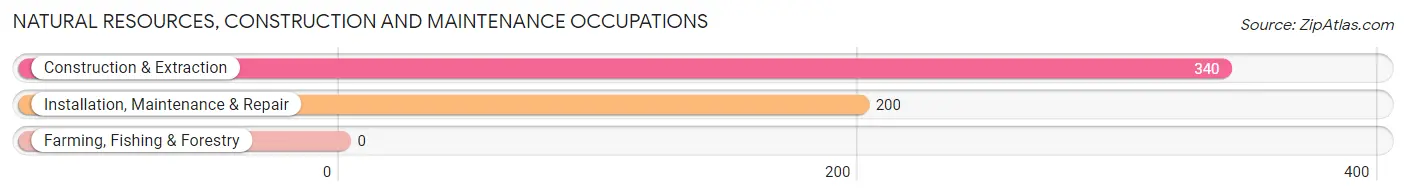
Natural Resources, Construction and Maintenance Occupations
The most common Natural Resources, Construction and Maintenance occupations in Hawthorne borough are Construction & Extraction (340 | 3.0%), and Installation, Maintenance & Repair (200 | 1.8%).
Natural Resources, Construction and Maintenance Occupations by Sex
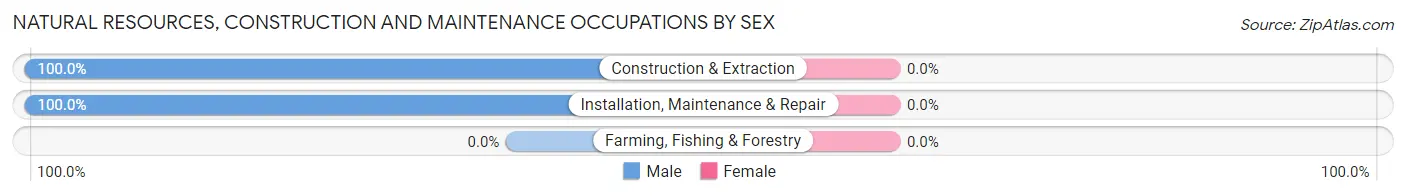
| Occupation | Male | Female |
| Farming, Fishing & Forestry | 0 (0.0%) | 0 (0.0%) |
| Construction & Extraction | 340 (100.0%) | 0 (0.0%) |
| Installation, Maintenance & Repair | 200 (100.0%) | 0 (0.0%) |
| Total (Category) | 540 (100.0%) | 0 (0.0%) |
| Total (Overall) | 5,507 (49.5%) | 5,627 (50.5%) |
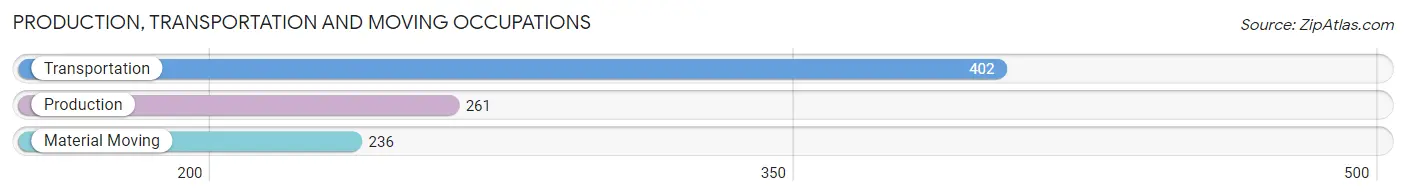
Production, Transportation and Moving Occupations
The most common Production, Transportation and Moving occupations in Hawthorne borough are Transportation (402 | 3.6%), Production (261 | 2.3%), and Material Moving (236 | 2.1%).
Production, Transportation and Moving Occupations by Sex
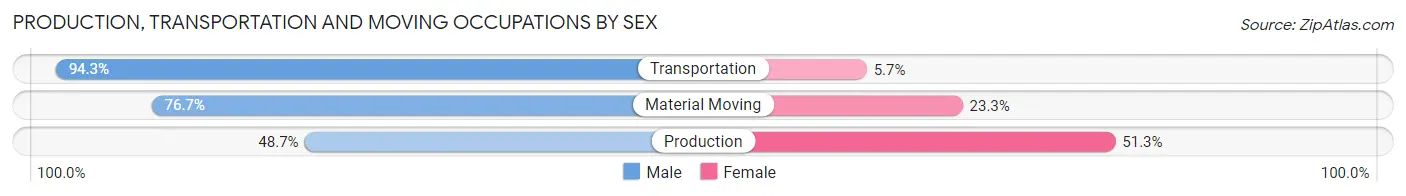
| Occupation | Male | Female |
| Production | 127 (48.7%) | 134 (51.3%) |
| Transportation | 379 (94.3%) | 23 (5.7%) |
| Material Moving | 181 (76.7%) | 55 (23.3%) |
| Total (Category) | 687 (76.4%) | 212 (23.6%) |
| Total (Overall) | 5,507 (49.5%) | 5,627 (50.5%) |
Employment Industries by Sex in Hawthorne borough
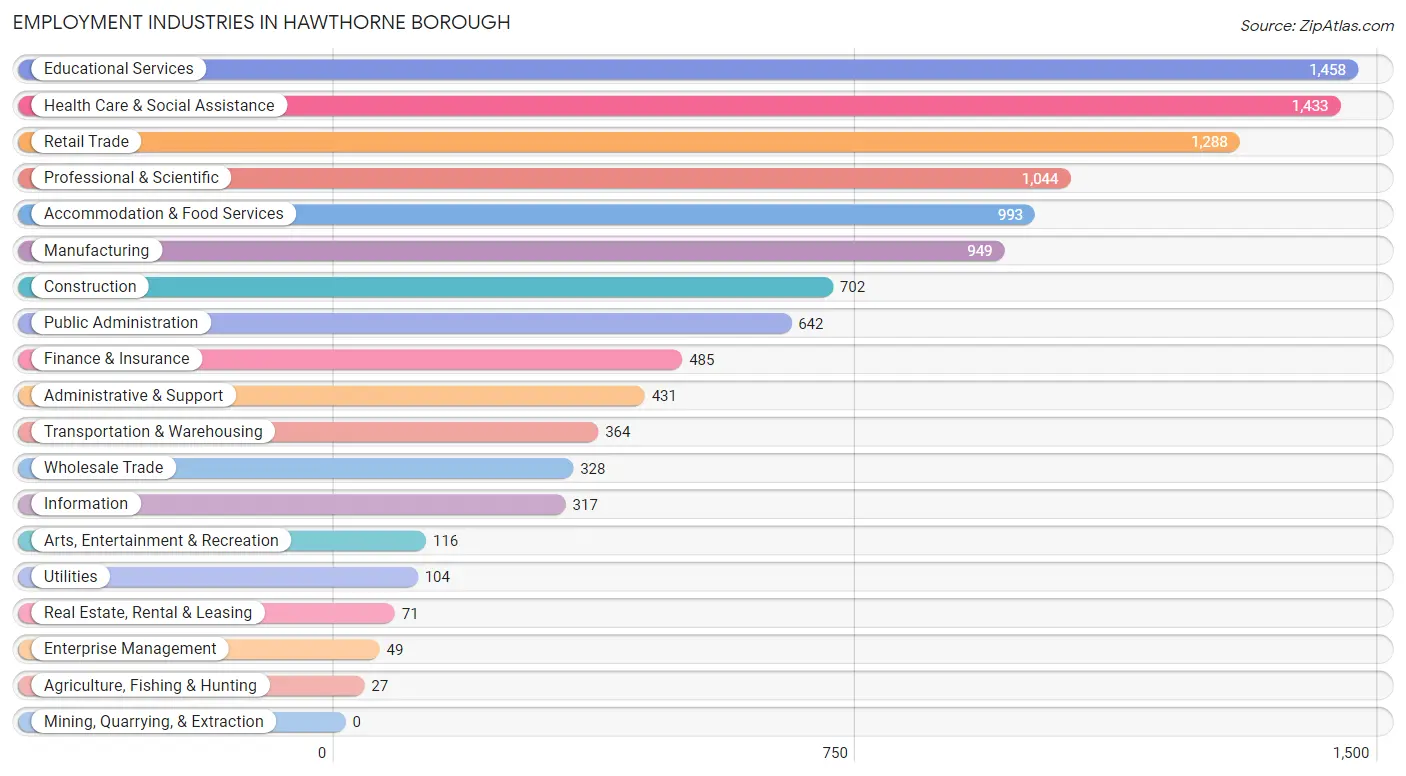
Employment Industries in Hawthorne borough
The major employment industries in Hawthorne borough include Educational Services (1,458 | 13.1%), Health Care & Social Assistance (1,433 | 12.9%), Retail Trade (1,288 | 11.6%), Professional & Scientific (1,044 | 9.4%), and Accommodation & Food Services (993 | 8.9%).
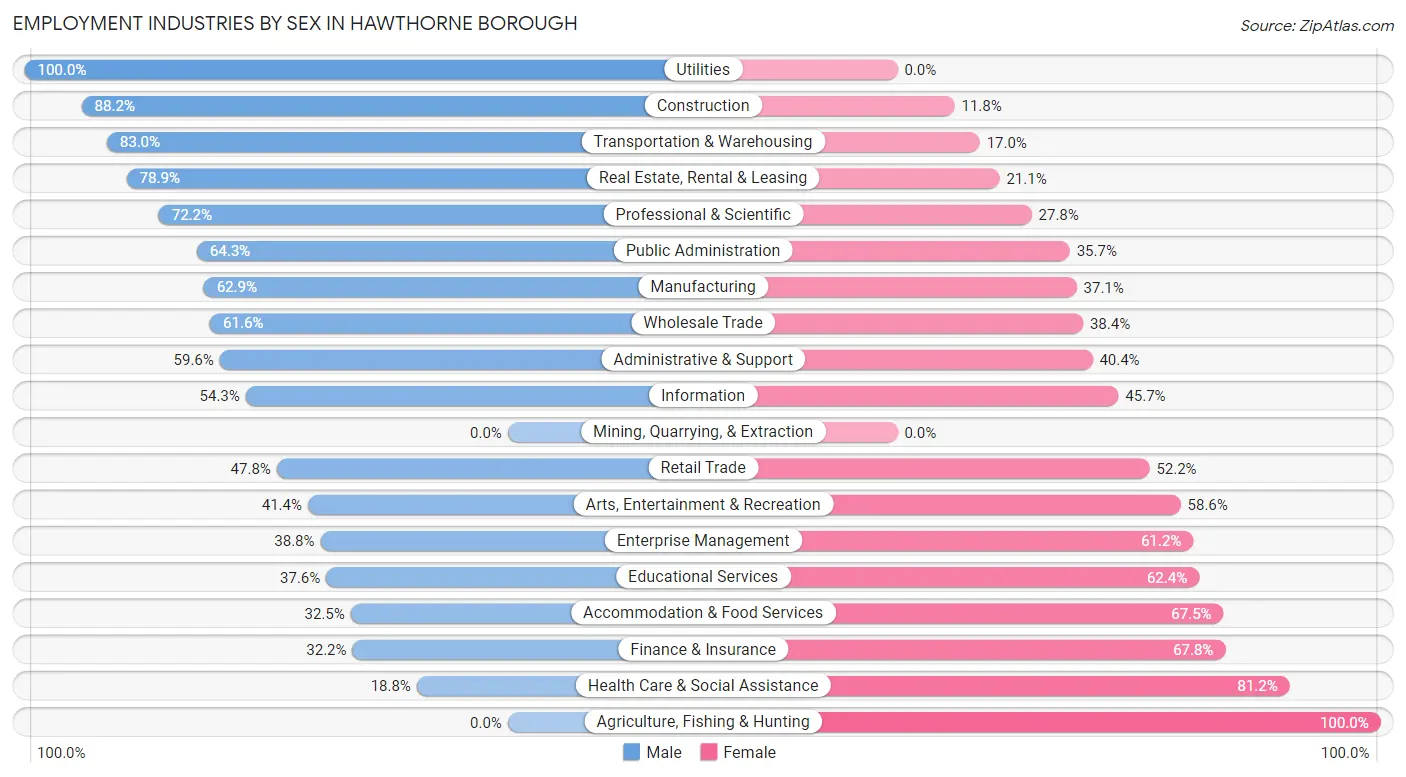
Employment Industries by Sex in Hawthorne borough
The Hawthorne borough industries that see more men than women are Utilities (100.0%), Construction (88.2%), and Transportation & Warehousing (83.0%), whereas the industries that tend to have a higher number of women are Agriculture, Fishing & Hunting (100.0%), Health Care & Social Assistance (81.2%), and Finance & Insurance (67.8%).
| Industry | Male | Female |
| Agriculture, Fishing & Hunting | 0 (0.0%) | 27 (100.0%) |
| Mining, Quarrying, & Extraction | 0 (0.0%) | 0 (0.0%) |
| Construction | 619 (88.2%) | 83 (11.8%) |
| Manufacturing | 597 (62.9%) | 352 (37.1%) |
| Wholesale Trade | 202 (61.6%) | 126 (38.4%) |
| Retail Trade | 616 (47.8%) | 672 (52.2%) |
| Transportation & Warehousing | 302 (83.0%) | 62 (17.0%) |
| Utilities | 104 (100.0%) | 0 (0.0%) |
| Information | 172 (54.3%) | 145 (45.7%) |
| Finance & Insurance | 156 (32.2%) | 329 (67.8%) |
| Real Estate, Rental & Leasing | 56 (78.9%) | 15 (21.1%) |
| Professional & Scientific | 754 (72.2%) | 290 (27.8%) |
| Enterprise Management | 19 (38.8%) | 30 (61.2%) |
| Administrative & Support | 257 (59.6%) | 174 (40.4%) |
| Educational Services | 548 (37.6%) | 910 (62.4%) |
| Health Care & Social Assistance | 270 (18.8%) | 1,163 (81.2%) |
| Arts, Entertainment & Recreation | 48 (41.4%) | 68 (58.6%) |
| Accommodation & Food Services | 323 (32.5%) | 670 (67.5%) |
| Public Administration | 413 (64.3%) | 229 (35.7%) |
| Total | 5,507 (49.5%) | 5,627 (50.5%) |
Education in Hawthorne borough
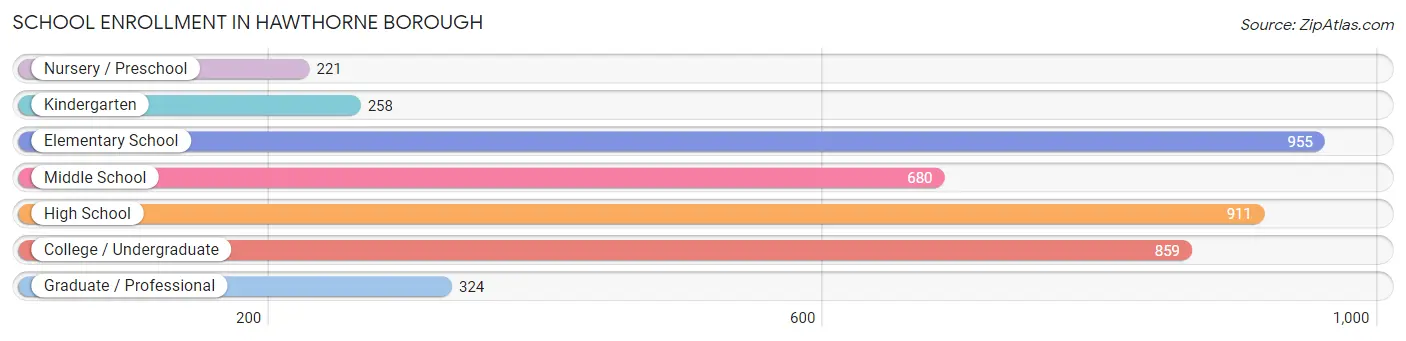
School Enrollment in Hawthorne borough
The most common levels of schooling among the 4,208 students in Hawthorne borough are elementary school (955 | 22.7%), high school (911 | 21.6%), and college / undergraduate (859 | 20.4%).
| School Level | # Students | % Students |
| Nursery / Preschool | 221 | 5.2% |
| Kindergarten | 258 | 6.1% |
| Elementary School | 955 | 22.7% |
| Middle School | 680 | 16.2% |
| High School | 911 | 21.6% |
| College / Undergraduate | 859 | 20.4% |
| Graduate / Professional | 324 | 7.7% |
| Total | 4,208 | 100.0% |
School Enrollment by Age by Funding Source in Hawthorne borough
Out of a total of 4,208 students who are enrolled in schools in Hawthorne borough, 467 (11.1%) attend a private institution, while the remaining 3,741 (88.9%) are enrolled in public schools. The age group of 3 to 4 year olds has the highest likelihood of being enrolled in private schools, with 73 (59.8% in the age bracket) enrolled. Conversely, the age group of 18 to 19 year olds has the lowest likelihood of being enrolled in a private school, with 182 (100.0% in the age bracket) attending a public institution.
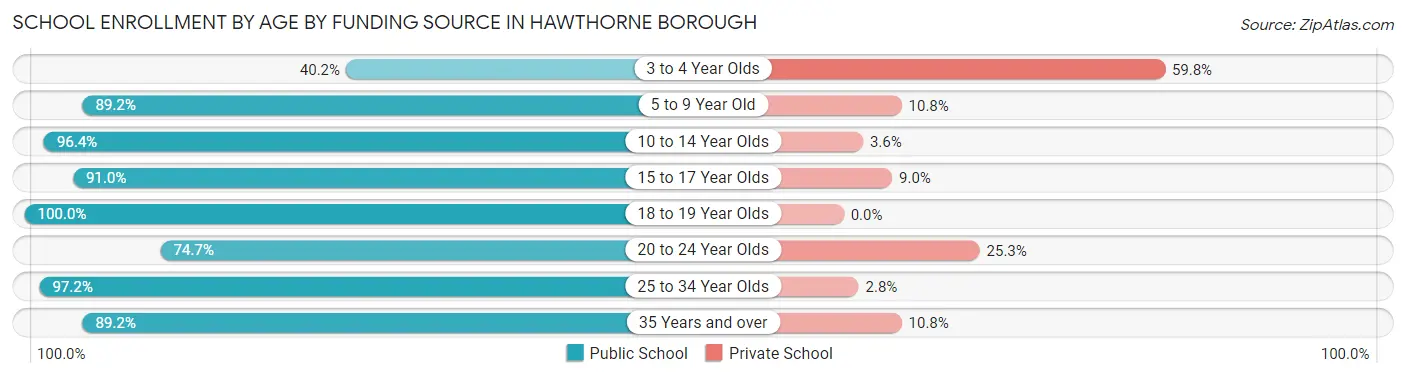
| Age Bracket | Public School | Private School |
| 3 to 4 Year Olds | 49 (40.2%) | 73 (59.8%) |
| 5 to 9 Year Old | 992 (89.2%) | 120 (10.8%) |
| 10 to 14 Year Olds | 1,045 (96.4%) | 39 (3.6%) |
| 15 to 17 Year Olds | 575 (91.0%) | 57 (9.0%) |
| 18 to 19 Year Olds | 182 (100.0%) | 0 (0.0%) |
| 20 to 24 Year Olds | 407 (74.7%) | 138 (25.3%) |
| 25 to 34 Year Olds | 210 (97.2%) | 6 (2.8%) |
| 35 Years and over | 281 (89.2%) | 34 (10.8%) |
| Total | 3,741 (88.9%) | 467 (11.1%) |
Educational Attainment by Field of Study in Hawthorne borough
Business (1,612 | 22.6%), education (1,004 | 14.1%), science & technology (760 | 10.6%), engineering (492 | 6.9%), and social sciences (453 | 6.3%) are the most common fields of study among 7,141 individuals in Hawthorne borough who have obtained a bachelor's degree or higher.

| Field of Study | # Graduates | % Graduates |
| Computers & Mathematics | 373 | 5.2% |
| Bio, Nature & Agricultural | 198 | 2.8% |
| Physical & Health Sciences | 189 | 2.6% |
| Psychology | 362 | 5.1% |
| Social Sciences | 453 | 6.3% |
| Engineering | 492 | 6.9% |
| Multidisciplinary Studies | 16 | 0.2% |
| Science & Technology | 760 | 10.6% |
| Business | 1,612 | 22.6% |
| Education | 1,004 | 14.1% |
| Literature & Languages | 351 | 4.9% |
| Liberal Arts & History | 369 | 5.2% |
| Visual & Performing Arts | 316 | 4.4% |
| Communications | 345 | 4.8% |
| Arts & Humanities | 301 | 4.2% |
| Total | 7,141 | 100.0% |
Transportation & Commute in Hawthorne borough
Vehicle Availability by Sex in Hawthorne borough
The most prevalent vehicle ownership categories in Hawthorne borough are males with 2 vehicles (2,285, accounting for 42.2%) and females with 2 vehicles (1,977, making up 42.0%).
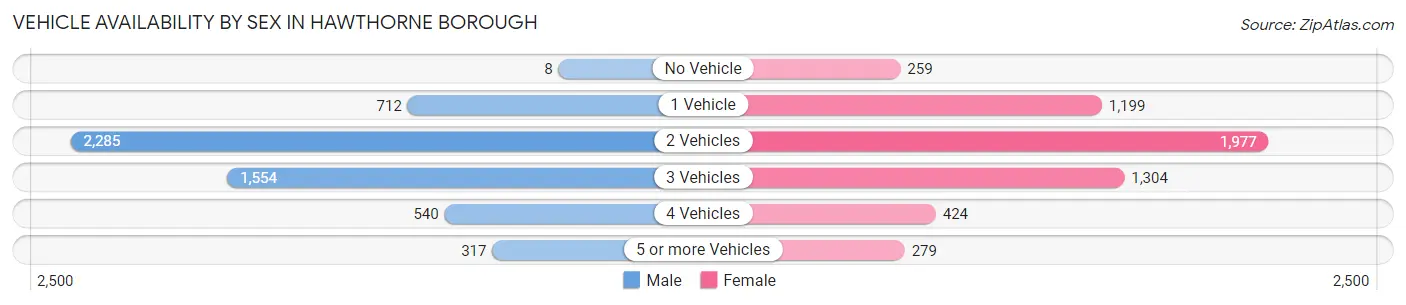
| Vehicles Available | Male | Female |
| No Vehicle | 8 (0.2%) | 259 (4.8%) |
| 1 Vehicle | 712 (13.2%) | 1,199 (22.0%) |
| 2 Vehicles | 2,285 (42.2%) | 1,977 (36.3%) |
| 3 Vehicles | 1,554 (28.7%) | 1,304 (24.0%) |
| 4 Vehicles | 540 (10.0%) | 424 (7.8%) |
| 5 or more Vehicles | 317 (5.9%) | 279 (5.1%) |
| Total | 5,416 (100.0%) | 5,442 (100.0%) |
Commute Time in Hawthorne borough
The most frequently occuring commute durations in Hawthorne borough are 15 to 19 minutes (2,104 commuters, 21.2%), 10 to 14 minutes (1,541 commuters, 15.5%), and 20 to 24 minutes (1,352 commuters, 13.6%).
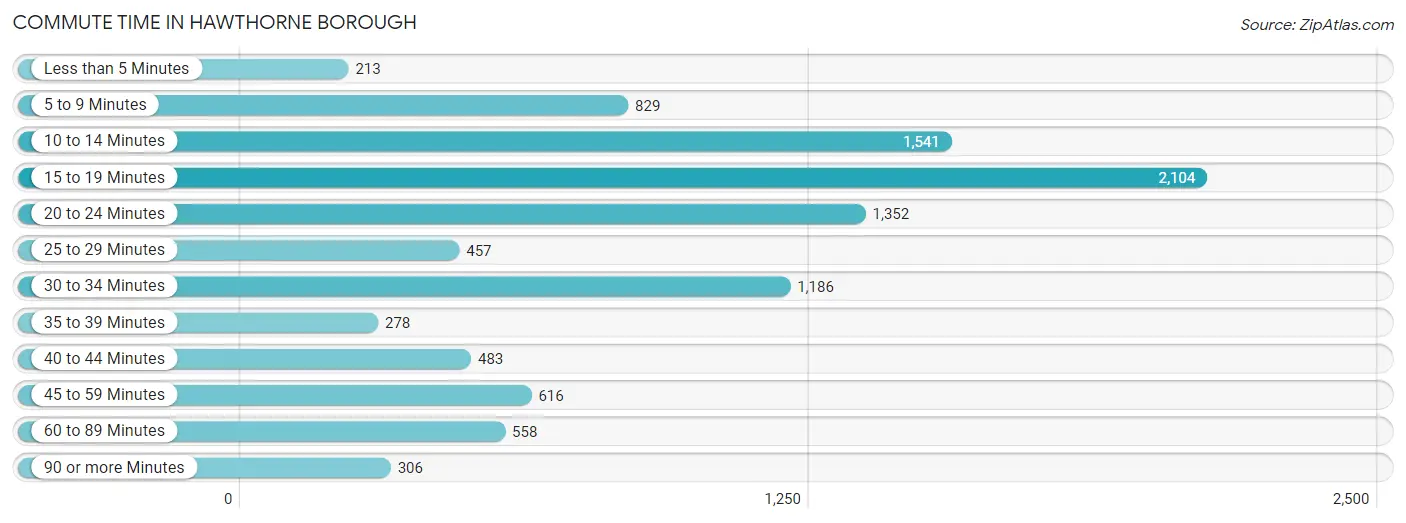
| Commute Time | # Commuters | % Commuters |
| Less than 5 Minutes | 213 | 2.1% |
| 5 to 9 Minutes | 829 | 8.4% |
| 10 to 14 Minutes | 1,541 | 15.5% |
| 15 to 19 Minutes | 2,104 | 21.2% |
| 20 to 24 Minutes | 1,352 | 13.6% |
| 25 to 29 Minutes | 457 | 4.6% |
| 30 to 34 Minutes | 1,186 | 11.9% |
| 35 to 39 Minutes | 278 | 2.8% |
| 40 to 44 Minutes | 483 | 4.9% |
| 45 to 59 Minutes | 616 | 6.2% |
| 60 to 89 Minutes | 558 | 5.6% |
| 90 or more Minutes | 306 | 3.1% |
Commute Time by Sex in Hawthorne borough
The most common commute times in Hawthorne borough are 15 to 19 minutes (1,074 commuters, 22.1%) for males and 15 to 19 minutes (1,030 commuters, 20.3%) for females.
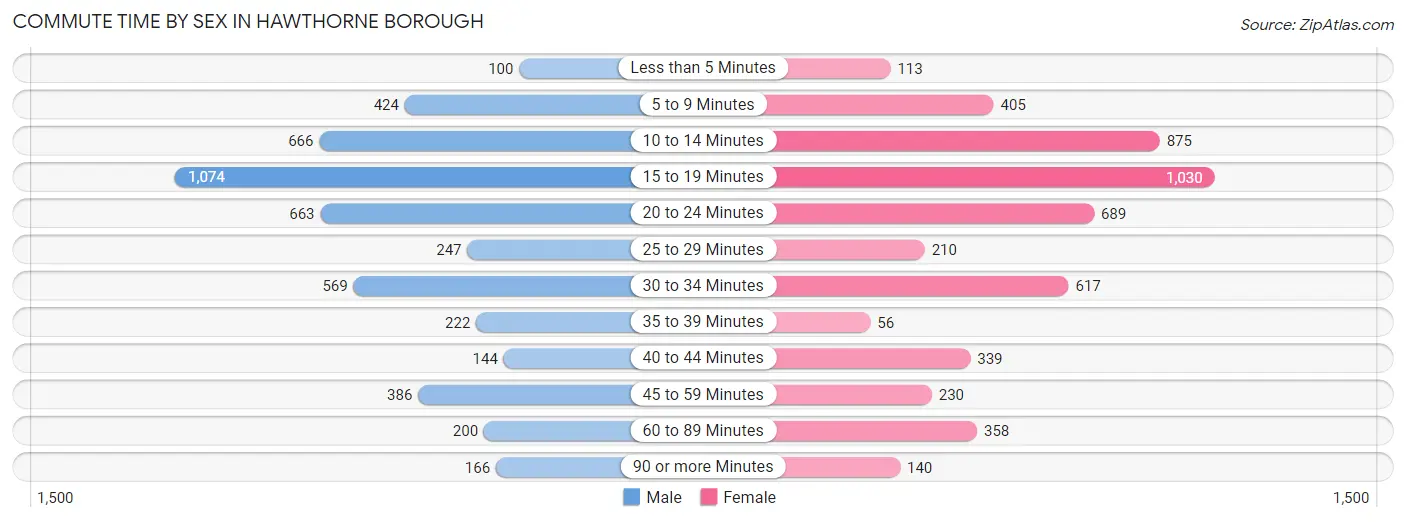
| Commute Time | Male | Female |
| Less than 5 Minutes | 100 (2.1%) | 113 (2.2%) |
| 5 to 9 Minutes | 424 (8.7%) | 405 (8.0%) |
| 10 to 14 Minutes | 666 (13.7%) | 875 (17.3%) |
| 15 to 19 Minutes | 1,074 (22.1%) | 1,030 (20.3%) |
| 20 to 24 Minutes | 663 (13.6%) | 689 (13.6%) |
| 25 to 29 Minutes | 247 (5.1%) | 210 (4.2%) |
| 30 to 34 Minutes | 569 (11.7%) | 617 (12.2%) |
| 35 to 39 Minutes | 222 (4.6%) | 56 (1.1%) |
| 40 to 44 Minutes | 144 (3.0%) | 339 (6.7%) |
| 45 to 59 Minutes | 386 (7.9%) | 230 (4.5%) |
| 60 to 89 Minutes | 200 (4.1%) | 358 (7.1%) |
| 90 or more Minutes | 166 (3.4%) | 140 (2.8%) |
Time of Departure to Work by Sex in Hawthorne borough
The most frequent times of departure to work in Hawthorne borough are 7:00 AM to 7:29 AM (789, 16.2%) for males and 7:30 AM to 7:59 AM (1,069, 21.1%) for females.
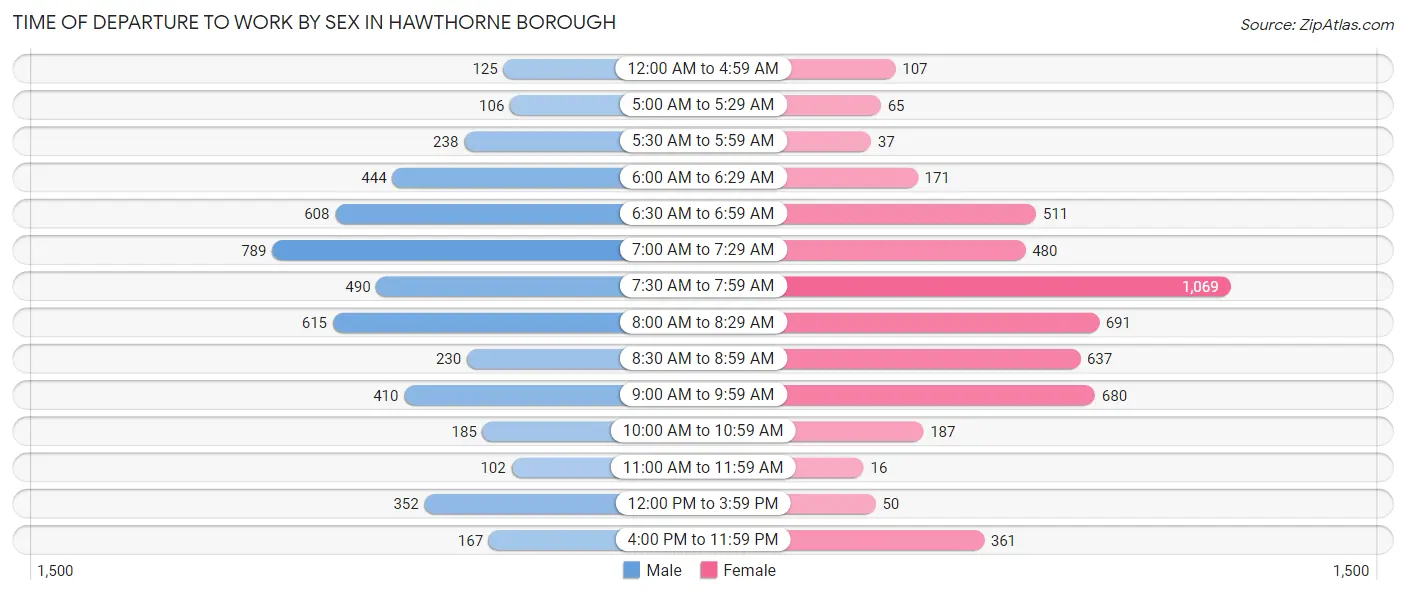
| Time of Departure | Male | Female |
| 12:00 AM to 4:59 AM | 125 (2.6%) | 107 (2.1%) |
| 5:00 AM to 5:29 AM | 106 (2.2%) | 65 (1.3%) |
| 5:30 AM to 5:59 AM | 238 (4.9%) | 37 (0.7%) |
| 6:00 AM to 6:29 AM | 444 (9.1%) | 171 (3.4%) |
| 6:30 AM to 6:59 AM | 608 (12.5%) | 511 (10.1%) |
| 7:00 AM to 7:29 AM | 789 (16.2%) | 480 (9.5%) |
| 7:30 AM to 7:59 AM | 490 (10.1%) | 1,069 (21.1%) |
| 8:00 AM to 8:29 AM | 615 (12.7%) | 691 (13.7%) |
| 8:30 AM to 8:59 AM | 230 (4.7%) | 637 (12.6%) |
| 9:00 AM to 9:59 AM | 410 (8.4%) | 680 (13.4%) |
| 10:00 AM to 10:59 AM | 185 (3.8%) | 187 (3.7%) |
| 11:00 AM to 11:59 AM | 102 (2.1%) | 16 (0.3%) |
| 12:00 PM to 3:59 PM | 352 (7.2%) | 50 (1.0%) |
| 4:00 PM to 11:59 PM | 167 (3.4%) | 361 (7.1%) |
| Total | 4,861 (100.0%) | 5,062 (100.0%) |
Housing Occupancy in Hawthorne borough
Occupancy by Ownership in Hawthorne borough
Of the total 7,585 dwellings in Hawthorne borough, owner-occupied units account for 5,148 (67.9%), while renter-occupied units make up 2,437 (32.1%).
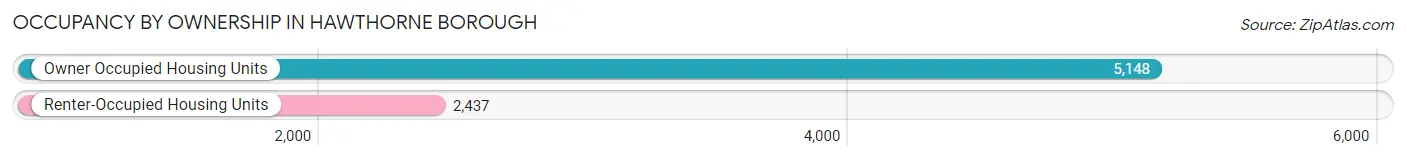
| Occupancy | # Housing Units | % Housing Units |
| Owner Occupied Housing Units | 5,148 | 67.9% |
| Renter-Occupied Housing Units | 2,437 | 32.1% |
| Total Occupied Housing Units | 7,585 | 100.0% |
Occupancy by Household Size in Hawthorne borough
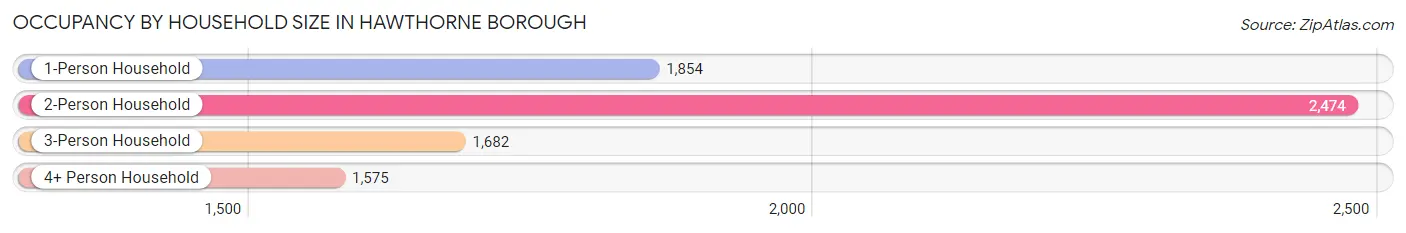
| Household Size | # Housing Units | % Housing Units |
| 1-Person Household | 1,854 | 24.4% |
| 2-Person Household | 2,474 | 32.6% |
| 3-Person Household | 1,682 | 22.2% |
| 4+ Person Household | 1,575 | 20.8% |
| Total Housing Units | 7,585 | 100.0% |
Occupancy by Ownership by Household Size in Hawthorne borough
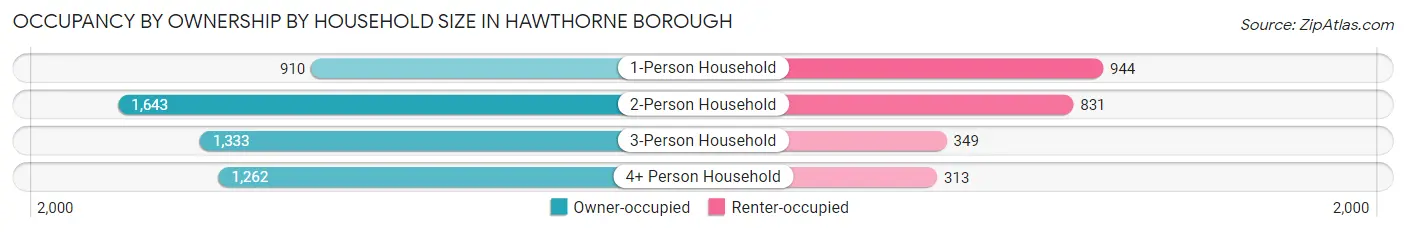
| Household Size | Owner-occupied | Renter-occupied |
| 1-Person Household | 910 (49.1%) | 944 (50.9%) |
| 2-Person Household | 1,643 (66.4%) | 831 (33.6%) |
| 3-Person Household | 1,333 (79.2%) | 349 (20.7%) |
| 4+ Person Household | 1,262 (80.1%) | 313 (19.9%) |
| Total Housing Units | 5,148 (67.9%) | 2,437 (32.1%) |
Occupancy by Educational Attainment in Hawthorne borough
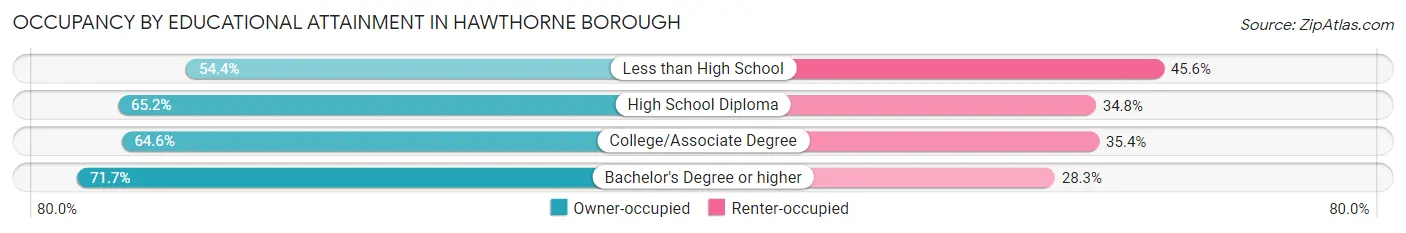
| Household Size | Owner-occupied | Renter-occupied |
| Less than High School | 168 (54.4%) | 141 (45.6%) |
| High School Diploma | 1,126 (65.2%) | 602 (34.8%) |
| College/Associate Degree | 1,122 (64.6%) | 614 (35.4%) |
| Bachelor's Degree or higher | 2,732 (71.7%) | 1,080 (28.3%) |
Occupancy by Age of Householder in Hawthorne borough
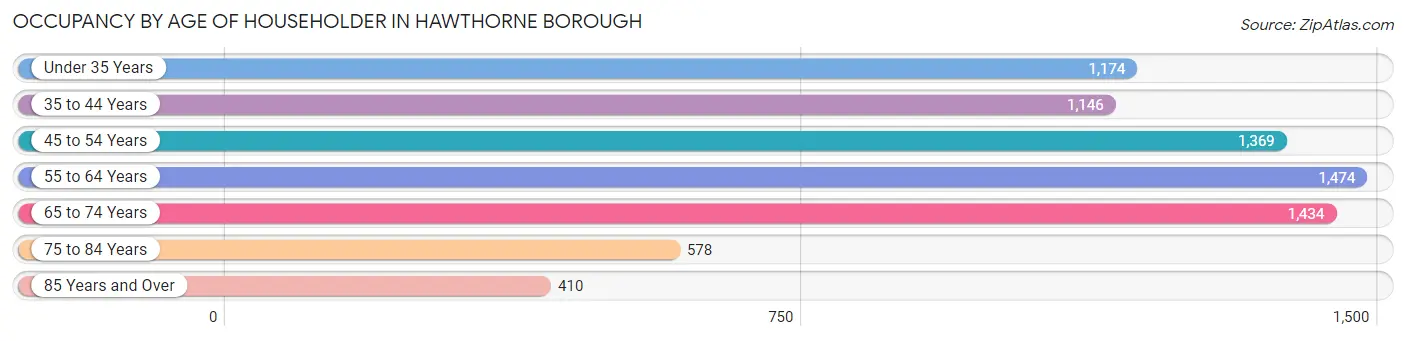
| Age Bracket | # Households | % Households |
| Under 35 Years | 1,174 | 15.5% |
| 35 to 44 Years | 1,146 | 15.1% |
| 45 to 54 Years | 1,369 | 18.0% |
| 55 to 64 Years | 1,474 | 19.4% |
| 65 to 74 Years | 1,434 | 18.9% |
| 75 to 84 Years | 578 | 7.6% |
| 85 Years and Over | 410 | 5.4% |
| Total | 7,585 | 100.0% |
Housing Finances in Hawthorne borough
Median Income by Occupancy in Hawthorne borough
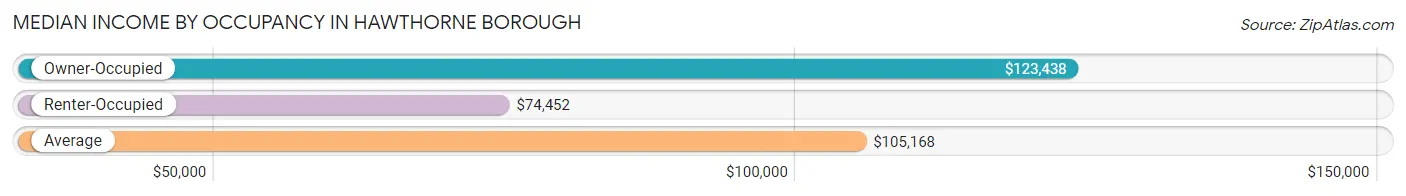
| Occupancy Type | # Households | Median Income |
| Owner-Occupied | 5,148 (67.9%) | $123,438 |
| Renter-Occupied | 2,437 (32.1%) | $74,452 |
| Average | 7,585 (100.0%) | $105,168 |
Occupancy by Householder Income Bracket in Hawthorne borough
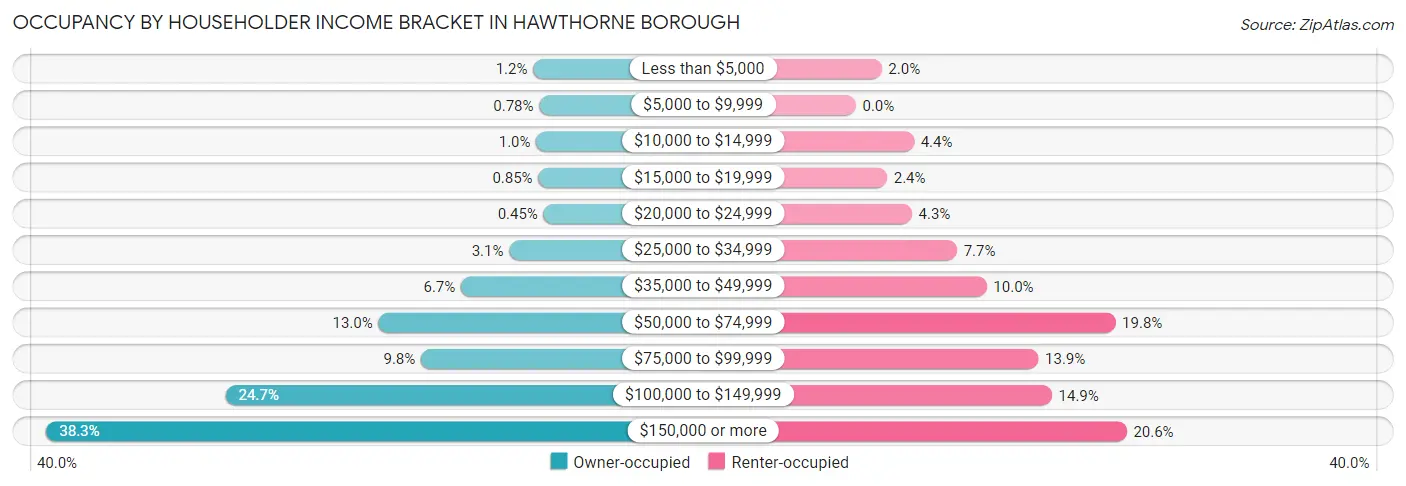
| Income Bracket | Owner-occupied | Renter-occupied |
| Less than $5,000 | 64 (1.2%) | 48 (2.0%) |
| $5,000 to $9,999 | 40 (0.8%) | 0 (0.0%) |
| $10,000 to $14,999 | 52 (1.0%) | 108 (4.4%) |
| $15,000 to $19,999 | 44 (0.9%) | 58 (2.4%) |
| $20,000 to $24,999 | 23 (0.4%) | 104 (4.3%) |
| $25,000 to $34,999 | 158 (3.1%) | 188 (7.7%) |
| $35,000 to $49,999 | 347 (6.7%) | 243 (10.0%) |
| $50,000 to $74,999 | 671 (13.0%) | 482 (19.8%) |
| $75,000 to $99,999 | 504 (9.8%) | 339 (13.9%) |
| $100,000 to $149,999 | 1,271 (24.7%) | 364 (14.9%) |
| $150,000 or more | 1,974 (38.3%) | 503 (20.6%) |
| Total | 5,148 (100.0%) | 2,437 (100.0%) |
Monthly Housing Cost Tiers in Hawthorne borough
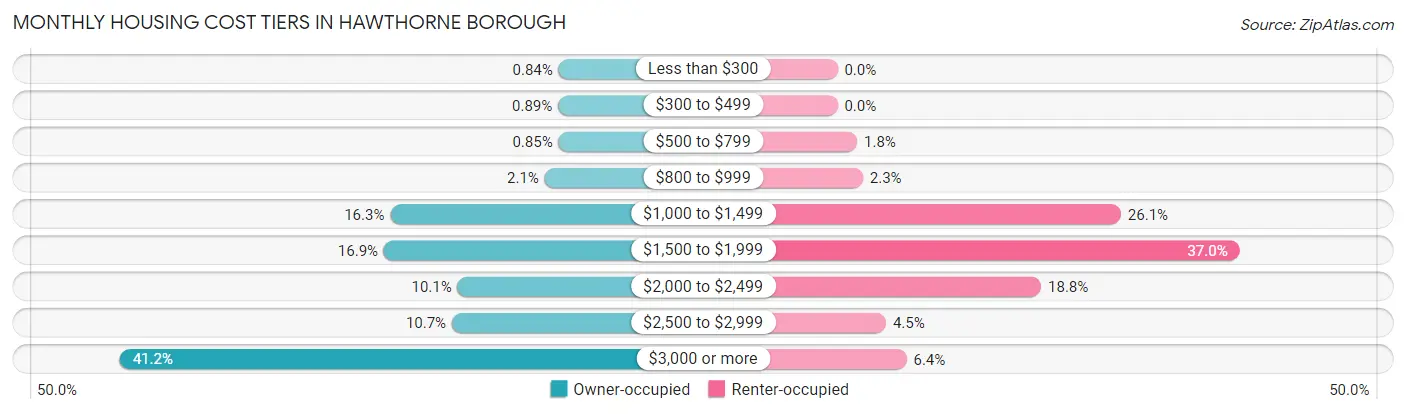
| Monthly Cost | Owner-occupied | Renter-occupied |
| Less than $300 | 43 (0.8%) | 0 (0.0%) |
| $300 to $499 | 46 (0.9%) | 0 (0.0%) |
| $500 to $799 | 44 (0.9%) | 44 (1.8%) |
| $800 to $999 | 109 (2.1%) | 57 (2.3%) |
| $1,000 to $1,499 | 841 (16.3%) | 636 (26.1%) |
| $1,500 to $1,999 | 871 (16.9%) | 902 (37.0%) |
| $2,000 to $2,499 | 522 (10.1%) | 457 (18.8%) |
| $2,500 to $2,999 | 549 (10.7%) | 109 (4.5%) |
| $3,000 or more | 2,123 (41.2%) | 155 (6.4%) |
| Total | 5,148 (100.0%) | 2,437 (100.0%) |
Physical Housing Characteristics in Hawthorne borough
Housing Structures in Hawthorne borough
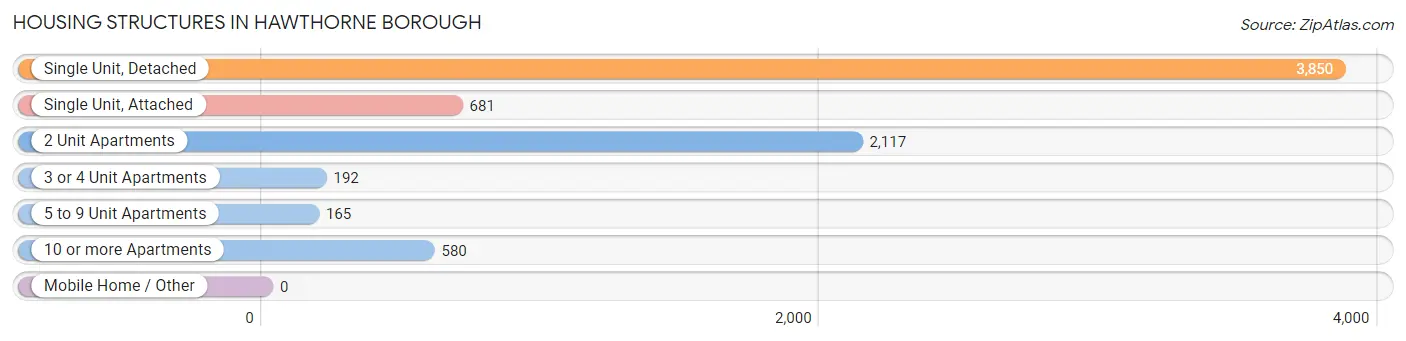
| Structure Type | # Housing Units | % Housing Units |
| Single Unit, Detached | 3,850 | 50.8% |
| Single Unit, Attached | 681 | 9.0% |
| 2 Unit Apartments | 2,117 | 27.9% |
| 3 or 4 Unit Apartments | 192 | 2.5% |
| 5 to 9 Unit Apartments | 165 | 2.2% |
| 10 or more Apartments | 580 | 7.6% |
| Mobile Home / Other | 0 | 0.0% |
| Total | 7,585 | 100.0% |
Housing Structures by Occupancy in Hawthorne borough
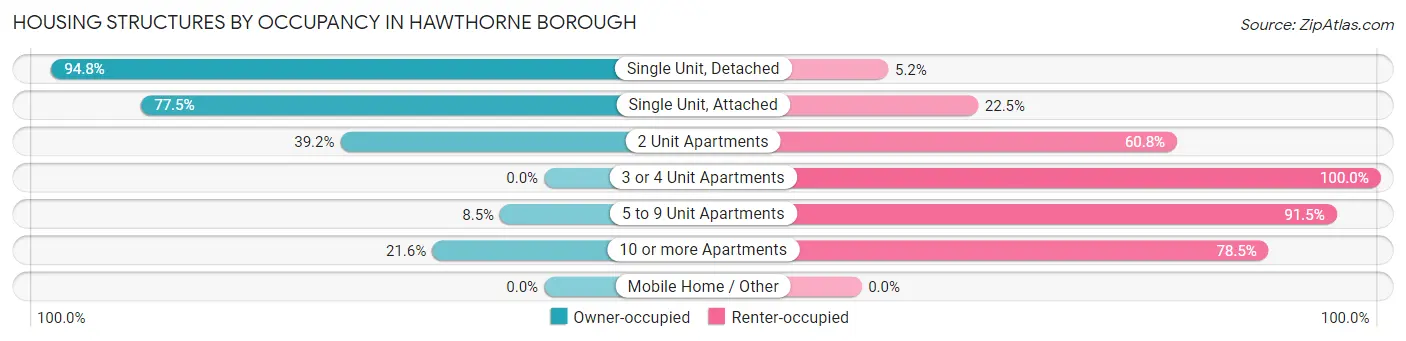
| Structure Type | Owner-occupied | Renter-occupied |
| Single Unit, Detached | 3,651 (94.8%) | 199 (5.2%) |
| Single Unit, Attached | 528 (77.5%) | 153 (22.5%) |
| 2 Unit Apartments | 830 (39.2%) | 1,287 (60.8%) |
| 3 or 4 Unit Apartments | 0 (0.0%) | 192 (100.0%) |
| 5 to 9 Unit Apartments | 14 (8.5%) | 151 (91.5%) |
| 10 or more Apartments | 125 (21.5%) | 455 (78.4%) |
| Mobile Home / Other | 0 (0.0%) | 0 (0.0%) |
| Total | 5,148 (67.9%) | 2,437 (32.1%) |
Housing Structures by Number of Rooms in Hawthorne borough
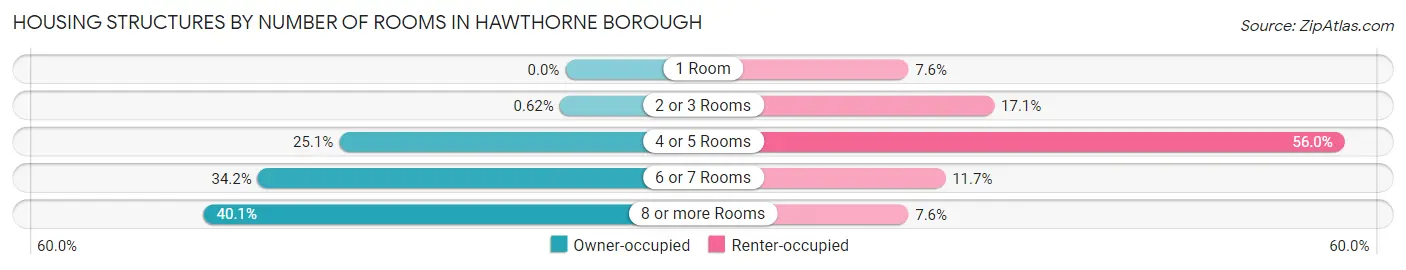
| Number of Rooms | Owner-occupied | Renter-occupied |
| 1 Room | 0 (0.0%) | 185 (7.6%) |
| 2 or 3 Rooms | 32 (0.6%) | 417 (17.1%) |
| 4 or 5 Rooms | 1,292 (25.1%) | 1,365 (56.0%) |
| 6 or 7 Rooms | 1,758 (34.2%) | 285 (11.7%) |
| 8 or more Rooms | 2,066 (40.1%) | 185 (7.6%) |
| Total | 5,148 (100.0%) | 2,437 (100.0%) |
Housing Structure by Heating Type in Hawthorne borough
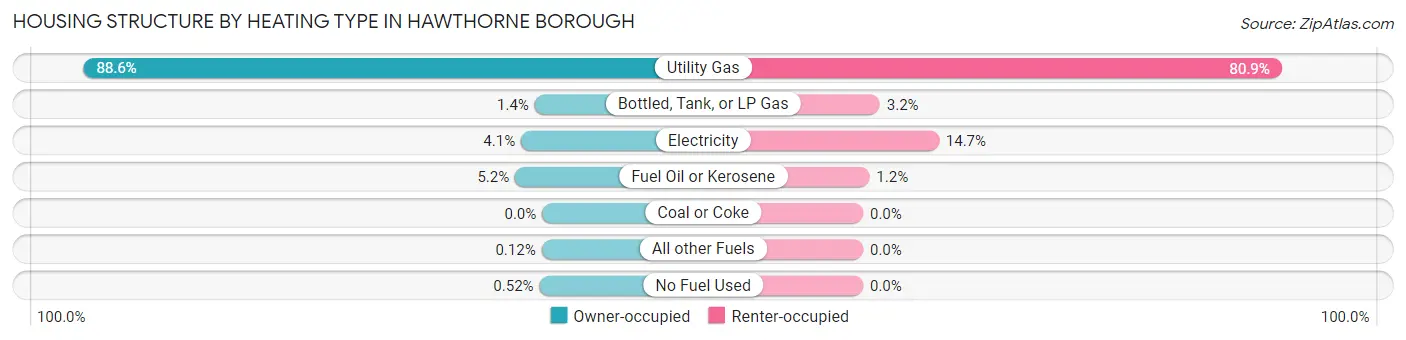
| Heating Type | Owner-occupied | Renter-occupied |
| Utility Gas | 4,562 (88.6%) | 1,971 (80.9%) |
| Bottled, Tank, or LP Gas | 74 (1.4%) | 79 (3.2%) |
| Electricity | 210 (4.1%) | 357 (14.6%) |
| Fuel Oil or Kerosene | 269 (5.2%) | 30 (1.2%) |
| Coal or Coke | 0 (0.0%) | 0 (0.0%) |
| All other Fuels | 6 (0.1%) | 0 (0.0%) |
| No Fuel Used | 27 (0.5%) | 0 (0.0%) |
| Total | 5,148 (100.0%) | 2,437 (100.0%) |
Household Vehicle Usage in Hawthorne borough
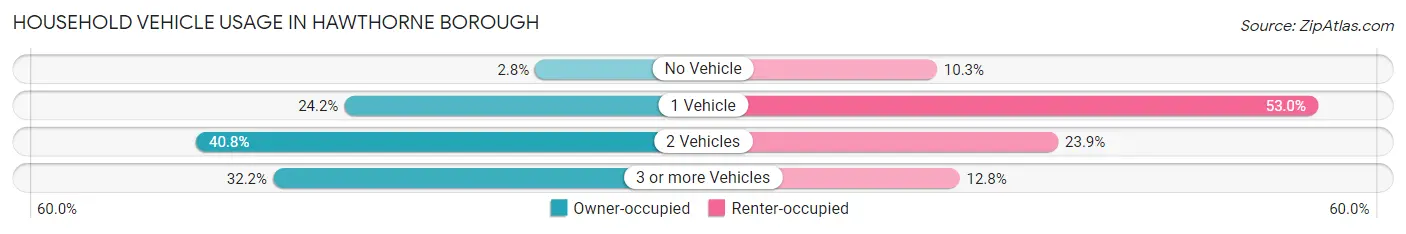
| Vehicles per Household | Owner-occupied | Renter-occupied |
| No Vehicle | 145 (2.8%) | 251 (10.3%) |
| 1 Vehicle | 1,246 (24.2%) | 1,291 (53.0%) |
| 2 Vehicles | 2,100 (40.8%) | 582 (23.9%) |
| 3 or more Vehicles | 1,657 (32.2%) | 313 (12.8%) |
| Total | 5,148 (100.0%) | 2,437 (100.0%) |
Real Estate & Mortgages in Hawthorne borough
Real Estate and Mortgage Overview in Hawthorne borough
| Characteristic | Without Mortgage | With Mortgage |
| Housing Units | 1,862 | 3,286 |
| Median Property Value | $482,200 | $481,200 |
| Median Household Income | $108,409 | $1,390 |
| Monthly Housing Costs | $1,439 | $2,123 |
| Real Estate Taxes | $10,001 | $16 |
Property Value by Mortgage Status in Hawthorne borough
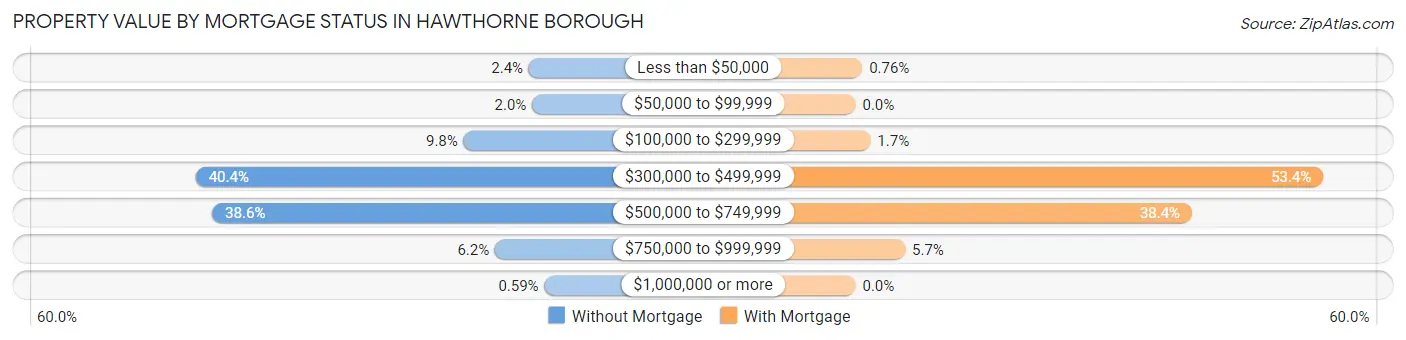
| Property Value | Without Mortgage | With Mortgage |
| Less than $50,000 | 44 (2.4%) | 25 (0.8%) |
| $50,000 to $99,999 | 37 (2.0%) | 0 (0.0%) |
| $100,000 to $299,999 | 183 (9.8%) | 56 (1.7%) |
| $300,000 to $499,999 | 753 (40.4%) | 1,756 (53.4%) |
| $500,000 to $749,999 | 718 (38.6%) | 1,263 (38.4%) |
| $750,000 to $999,999 | 116 (6.2%) | 186 (5.7%) |
| $1,000,000 or more | 11 (0.6%) | 0 (0.0%) |
| Total | 1,862 (100.0%) | 3,286 (100.0%) |
Household Income by Mortgage Status in Hawthorne borough
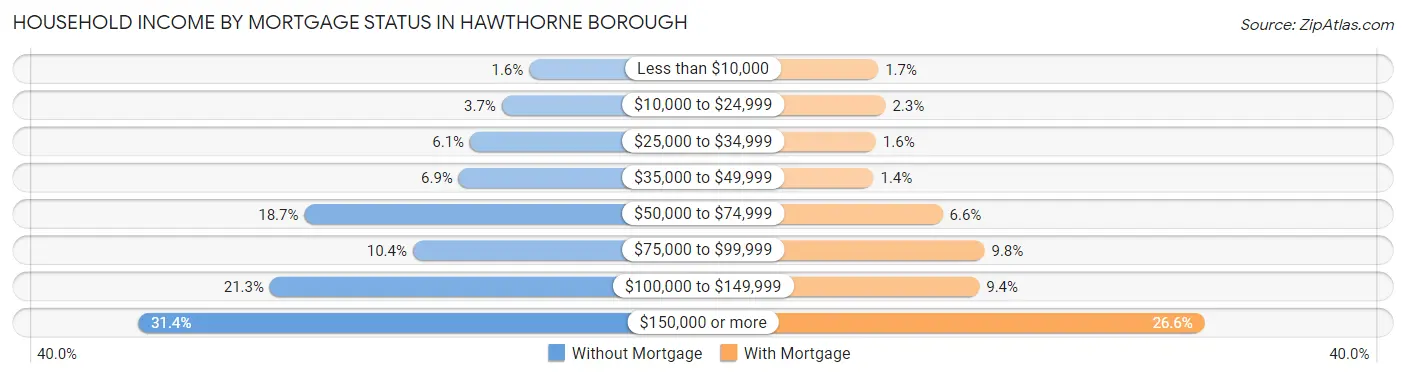
| Household Income | Without Mortgage | With Mortgage |
| Less than $10,000 | 29 (1.6%) | 57 (1.7%) |
| $10,000 to $24,999 | 68 (3.6%) | 75 (2.3%) |
| $25,000 to $34,999 | 113 (6.1%) | 51 (1.5%) |
| $35,000 to $49,999 | 129 (6.9%) | 45 (1.4%) |
| $50,000 to $74,999 | 348 (18.7%) | 218 (6.6%) |
| $75,000 to $99,999 | 194 (10.4%) | 323 (9.8%) |
| $100,000 to $149,999 | 397 (21.3%) | 310 (9.4%) |
| $150,000 or more | 584 (31.4%) | 874 (26.6%) |
| Total | 1,862 (100.0%) | 3,286 (100.0%) |
Property Value to Household Income Ratio in Hawthorne borough
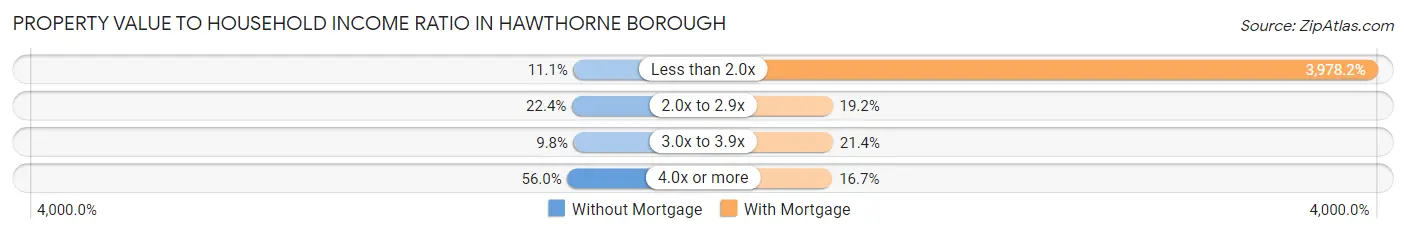
| Value-to-Income Ratio | Without Mortgage | With Mortgage |
| Less than 2.0x | 206 (11.1%) | 130,722 (3,978.2%) |
| 2.0x to 2.9x | 417 (22.4%) | 631 (19.2%) |
| 3.0x to 3.9x | 182 (9.8%) | 702 (21.4%) |
| 4.0x or more | 1,043 (56.0%) | 548 (16.7%) |
| Total | 1,862 (100.0%) | 3,286 (100.0%) |
Real Estate Taxes by Mortgage Status in Hawthorne borough
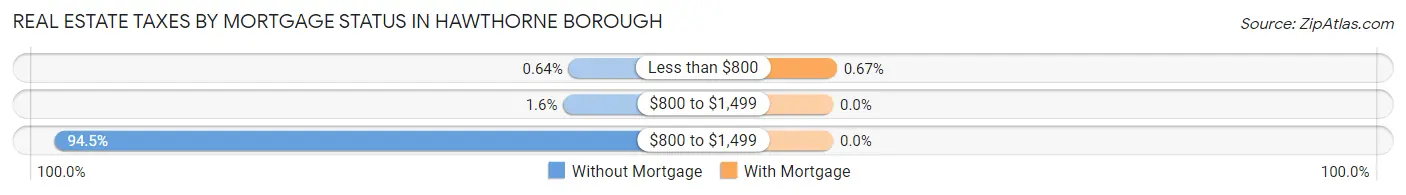
| Property Taxes | Without Mortgage | With Mortgage |
| Less than $800 | 12 (0.6%) | 22 (0.7%) |
| $800 to $1,499 | 30 (1.6%) | 0 (0.0%) |
| $800 to $1,499 | 1,760 (94.5%) | 0 (0.0%) |
| Total | 1,862 (100.0%) | 3,286 (100.0%) |
Health & Disability in Hawthorne borough
Health Insurance Coverage by Age in Hawthorne borough
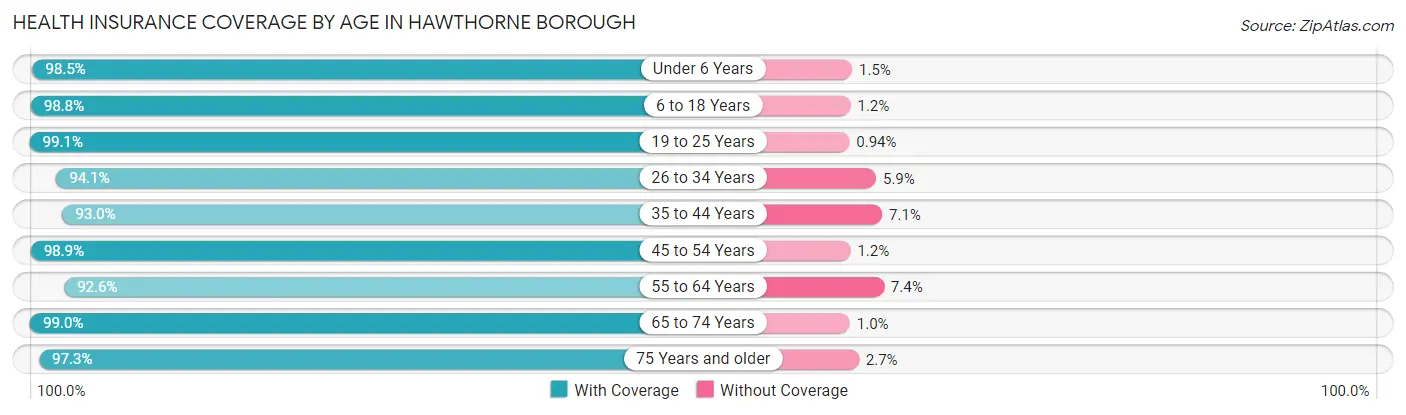
| Age Bracket | With Coverage | Without Coverage |
| Under 6 Years | 1,011 (98.5%) | 15 (1.5%) |
| 6 to 18 Years | 2,651 (98.8%) | 31 (1.2%) |
| 19 to 25 Years | 1,372 (99.1%) | 13 (0.9%) |
| 26 to 34 Years | 2,815 (94.1%) | 177 (5.9%) |
| 35 to 44 Years | 2,162 (92.9%) | 164 (7.0%) |
| 45 to 54 Years | 2,239 (98.9%) | 26 (1.1%) |
| 55 to 64 Years | 2,533 (92.6%) | 202 (7.4%) |
| 65 to 74 Years | 2,412 (99.0%) | 25 (1.0%) |
| 75 Years and older | 1,544 (97.3%) | 43 (2.7%) |
| Total | 18,739 (96.4%) | 696 (3.6%) |
Health Insurance Coverage by Citizenship Status in Hawthorne borough
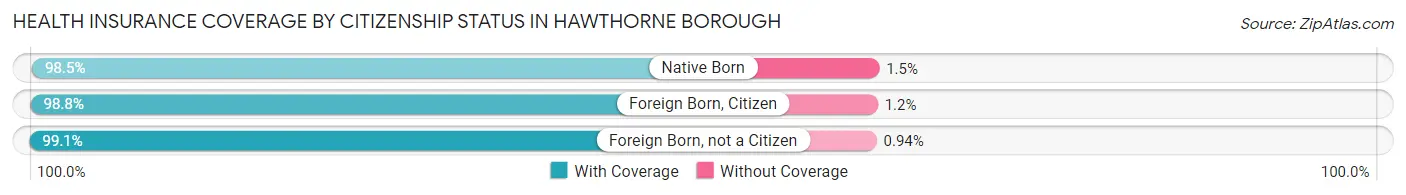
| Citizenship Status | With Coverage | Without Coverage |
| Native Born | 1,011 (98.5%) | 15 (1.5%) |
| Foreign Born, Citizen | 2,651 (98.8%) | 31 (1.2%) |
| Foreign Born, not a Citizen | 1,372 (99.1%) | 13 (0.9%) |
Health Insurance Coverage by Household Income in Hawthorne borough
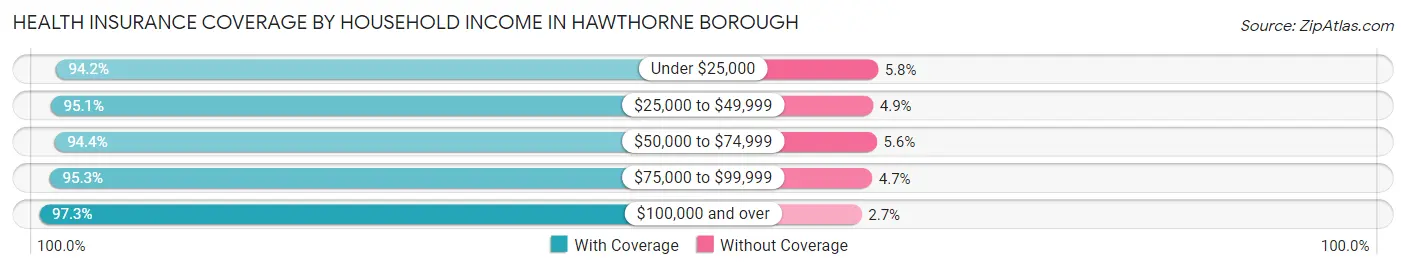
| Household Income | With Coverage | Without Coverage |
| Under $25,000 | 877 (94.2%) | 54 (5.8%) |
| $25,000 to $49,999 | 2,067 (95.1%) | 106 (4.9%) |
| $50,000 to $74,999 | 1,800 (94.4%) | 106 (5.6%) |
| $75,000 to $99,999 | 1,783 (95.3%) | 88 (4.7%) |
| $100,000 and over | 12,177 (97.3%) | 341 (2.7%) |
Public vs Private Health Insurance Coverage by Age in Hawthorne borough
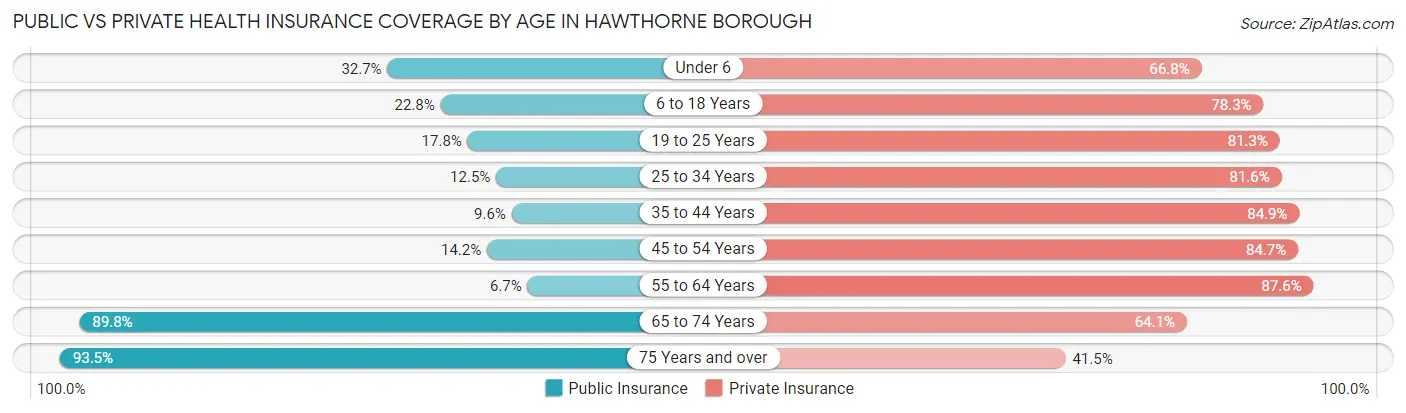
| Age Bracket | Public Insurance | Private Insurance |
| Under 6 | 335 (32.7%) | 685 (66.8%) |
| 6 to 18 Years | 611 (22.8%) | 2,099 (78.3%) |
| 19 to 25 Years | 246 (17.8%) | 1,126 (81.3%) |
| 25 to 34 Years | 373 (12.5%) | 2,442 (81.6%) |
| 35 to 44 Years | 223 (9.6%) | 1,975 (84.9%) |
| 45 to 54 Years | 321 (14.2%) | 1,918 (84.7%) |
| 55 to 64 Years | 182 (6.7%) | 2,395 (87.6%) |
| 65 to 74 Years | 2,189 (89.8%) | 1,561 (64.0%) |
| 75 Years and over | 1,483 (93.4%) | 659 (41.5%) |
| Total | 5,963 (30.7%) | 14,860 (76.5%) |
Disability Status by Sex by Age in Hawthorne borough
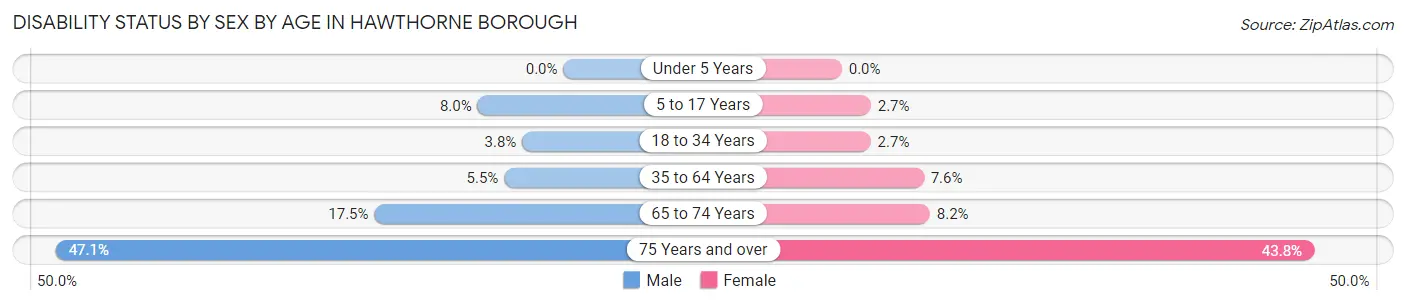
| Age Bracket | Male | Female |
| Under 5 Years | 0 (0.0%) | 0 (0.0%) |
| 5 to 17 Years | 139 (8.0%) | 30 (2.7%) |
| 18 to 34 Years | 81 (3.8%) | 63 (2.7%) |
| 35 to 64 Years | 195 (5.5%) | 287 (7.6%) |
| 65 to 74 Years | 217 (17.5%) | 98 (8.2%) |
| 75 Years and over | 310 (47.1%) | 407 (43.8%) |
Disability Class by Sex by Age in Hawthorne borough
Disability Class: Hearing Difficulty
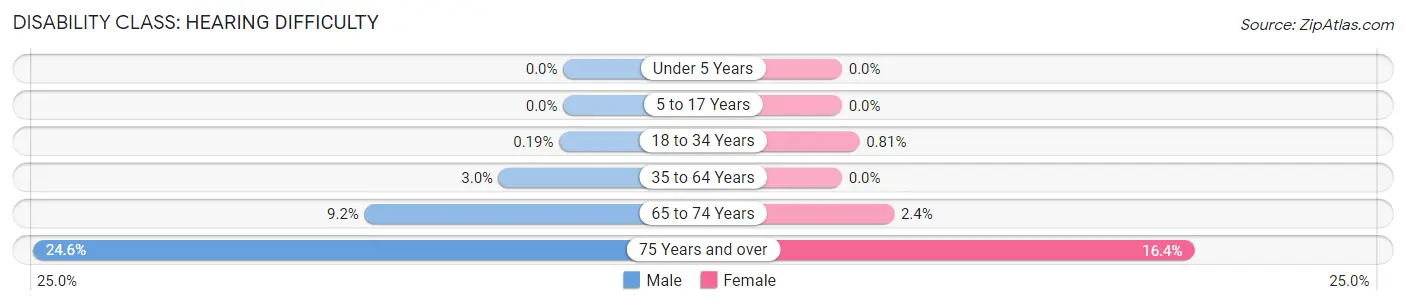
| Age Bracket | Male | Female |
| Under 5 Years | 0 (0.0%) | 0 (0.0%) |
| 5 to 17 Years | 0 (0.0%) | 0 (0.0%) |
| 18 to 34 Years | 4 (0.2%) | 19 (0.8%) |
| 35 to 64 Years | 106 (3.0%) | 0 (0.0%) |
| 65 to 74 Years | 114 (9.2%) | 29 (2.4%) |
| 75 Years and over | 162 (24.6%) | 152 (16.4%) |
Disability Class: Vision Difficulty
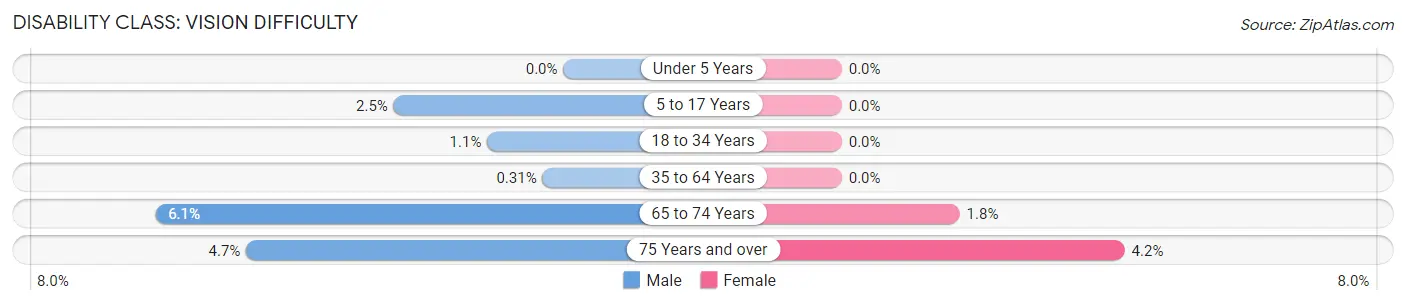
| Age Bracket | Male | Female |
| Under 5 Years | 0 (0.0%) | 0 (0.0%) |
| 5 to 17 Years | 44 (2.5%) | 0 (0.0%) |
| 18 to 34 Years | 24 (1.1%) | 0 (0.0%) |
| 35 to 64 Years | 11 (0.3%) | 0 (0.0%) |
| 65 to 74 Years | 75 (6.1%) | 21 (1.8%) |
| 75 Years and over | 31 (4.7%) | 39 (4.2%) |
Disability Class: Cognitive Difficulty
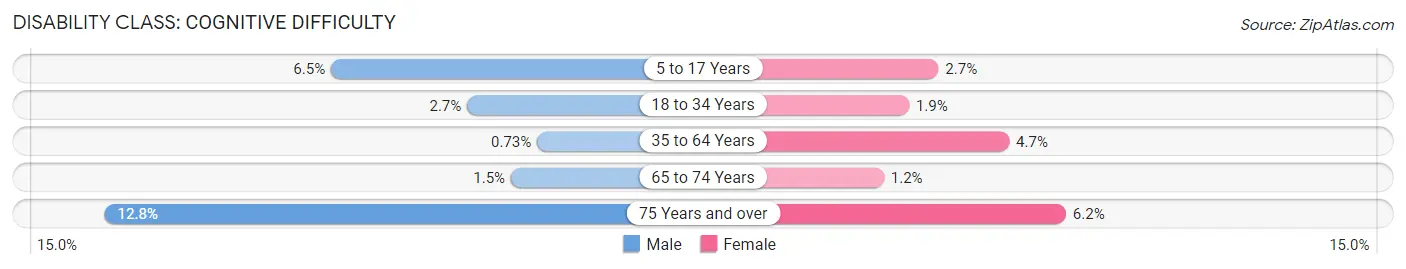
| Age Bracket | Male | Female |
| 5 to 17 Years | 113 (6.5%) | 30 (2.7%) |
| 18 to 34 Years | 57 (2.7%) | 44 (1.9%) |
| 35 to 64 Years | 26 (0.7%) | 176 (4.7%) |
| 65 to 74 Years | 18 (1.5%) | 14 (1.2%) |
| 75 Years and over | 84 (12.8%) | 58 (6.2%) |
Disability Class: Ambulatory Difficulty
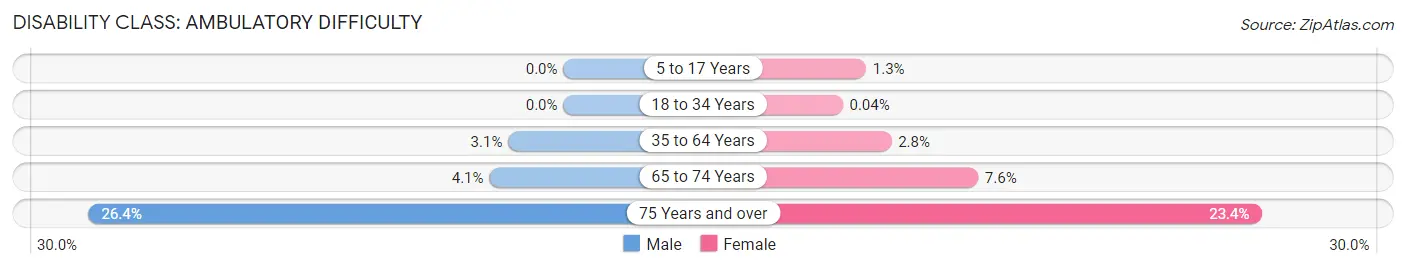
| Age Bracket | Male | Female |
| 5 to 17 Years | 0 (0.0%) | 15 (1.3%) |
| 18 to 34 Years | 0 (0.0%) | 1 (0.0%) |
| 35 to 64 Years | 109 (3.1%) | 104 (2.8%) |
| 65 to 74 Years | 51 (4.1%) | 91 (7.6%) |
| 75 Years and over | 174 (26.4%) | 217 (23.4%) |
Disability Class: Self-Care Difficulty
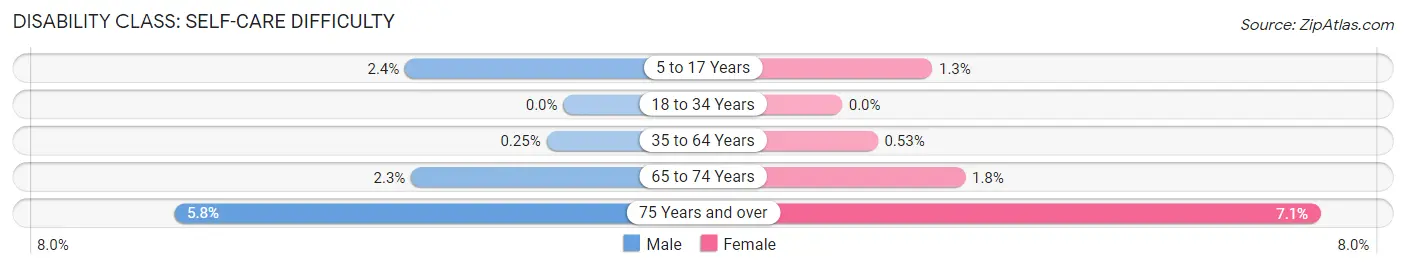
| Age Bracket | Male | Female |
| 5 to 17 Years | 41 (2.4%) | 15 (1.3%) |
| 18 to 34 Years | 0 (0.0%) | 0 (0.0%) |
| 35 to 64 Years | 9 (0.3%) | 20 (0.5%) |
| 65 to 74 Years | 28 (2.3%) | 22 (1.8%) |
| 75 Years and over | 38 (5.8%) | 66 (7.1%) |
Technology Access in Hawthorne borough
Computing Device Access in Hawthorne borough
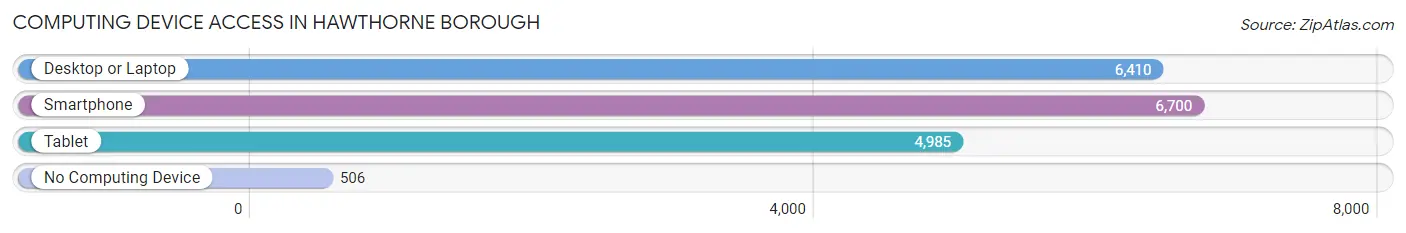
| Device Type | # Households | % Households |
| Desktop or Laptop | 6,410 | 84.5% |
| Smartphone | 6,700 | 88.3% |
| Tablet | 4,985 | 65.7% |
| No Computing Device | 506 | 6.7% |
| Total | 7,585 | 100.0% |
Internet Access in Hawthorne borough
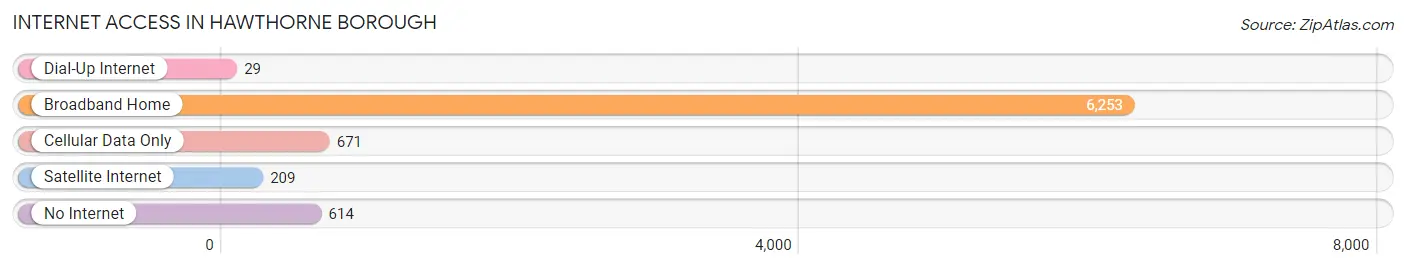
| Internet Type | # Households | % Households |
| Dial-Up Internet | 29 | 0.4% |
| Broadband Home | 6,253 | 82.4% |
| Cellular Data Only | 671 | 8.8% |
| Satellite Internet | 209 | 2.8% |
| No Internet | 614 | 8.1% |
| Total | 7,585 | 100.0% |
Hawthorne borough Summary
Hawthorne Borough is a small borough located in Passaic County, New Jersey. It is situated in the northern part of the state, approximately 20 miles northwest of New York City. The borough is bordered by the towns of North Haledon, Prospect Park, and Paterson. According to the 2010 United States Census, the population of Hawthorne Borough was 18,791.
History
The area that is now Hawthorne Borough was originally inhabited by the Lenni Lenape Native Americans. The first European settlers arrived in the area in the late 17th century. The area was part of the Haring Township, which was established in 1717. In 1871, the area was incorporated as the Borough of Hawthorne. The borough was named after Nathaniel Hawthorne, the famous American author.
Geography
Hawthorne Borough is located at 40°55'45" North, 74°10'45" West (40.929167, -74.179167). The borough has a total area of 2.3 square miles, all of which is land. The borough is located in the Passaic River Valley, and is surrounded by the towns of North Haledon, Prospect Park, and Paterson.
Climate
Hawthorne Borough has a humid subtropical climate, with hot, humid summers and cold, wet winters. The average annual temperature is around 50°F, with an average high of around 70°F in the summer and an average low of around 30°F in the winter. The average annual precipitation is around 45 inches.
Demographics
As of the 2010 United States Census, there were 18,791 people, 6,945 households, and 4,845 families residing in the borough. The population density was 8,093.3 people per square mile. The racial makeup of the borough was 79.2% White, 8.3% African American, 0.3% Native American, 5.2% Asian, 0.1% Pacific Islander, 4.7% from other races, and 2.2% from two or more races. Hispanic or Latino of any race were 14.7% of the population.
The median age in the borough was 38.7 years. 22.2% of residents were under the age of 18; 8.2% were between the ages of 18 and 24; 28.2% were from 25 to 44; 27.3% were from 45 to 64; and 14.1% were 65 years of age or older. The gender makeup of the borough was 48.2% male and 51.8% female.
Economy
The economy of Hawthorne Borough is largely based on small businesses and retail. The borough is home to several small businesses, including restaurants, shops, and professional services. The borough also has a few larger employers, such as the Hawthorne Works, a manufacturing plant that produces automotive parts. The median household income in the borough was $62,845 in 2017. The median home value was $346,400 in 2017.
Conclusion
Hawthorne Borough is a small borough located in Passaic County, New Jersey. It is situated in the northern part of the state, approximately 20 miles northwest of New York City. The borough has a population of 18,791, and is home to several small businesses and retail establishments. The economy of the borough is largely based on small businesses and retail, with a few larger employers such as the Hawthorne Works. The median household income in the borough was $62,845 in 2017, and the median home value was $346,400 in 2017.
Common Questions
What is the Total Population of Hawthorne borough?
Total Population of Hawthorne borough is 19,456.
What is the Total Male Population of Hawthorne borough?
Total Male Population of Hawthorne borough is 9,848.
What is the Total Female Population of Hawthorne borough?
Total Female Population of Hawthorne borough is 9,608.
What is the Ratio of Males per 100 Females in Hawthorne borough?
There are 102.50 Males per 100 Females in Hawthorne borough.
What is the Ratio of Females per 100 Males in Hawthorne borough?
There are 97.56 Females per 100 Males in Hawthorne borough.
What is the Median Population Age in Hawthorne borough?
Median Population Age in Hawthorne borough is 41.8 Years.
What is the Average Family Size in Hawthorne borough
Average Family Size in Hawthorne borough is 3.0 People.
What is the Average Household Size in Hawthorne borough
Average Household Size in Hawthorne borough is 2.6 People.
What is Per Capita Income in Hawthorne borough?
Per Capita income in Hawthorne borough is $51,860.
What is the Median Family Income in Hawthorne borough?
Median Family Income in Hawthorne borough is $123,688.
What is the Median Household income in Hawthorne borough?
Median Household Income in Hawthorne borough is $105,168.
What is Income or Wage Gap in Hawthorne borough?
Income or Wage Gap in Hawthorne borough is 31.5%.
Women in Hawthorne borough earn 68.5 cents for every dollar earned by a man.
What is Inequality or Gini Index in Hawthorne borough?
Inequality or Gini Index in Hawthorne borough is 0.41.
How Large is the Labor Force in Hawthorne borough?
There are 11,776 People in the Labor Forcein in Hawthorne borough.
What is the Percentage of People in the Labor Force in Hawthorne borough?
72.3% of People are in the Labor Force in Hawthorne borough.
What is the Unemployment Rate in Hawthorne borough?
Unemployment Rate in Hawthorne borough is 5.5%.