Cities with the Highest Percentage of Population Employed in Utilities in New Jersey
RELATED REPORTS & OPTIONS
Utilities
New Jersey
Compare Cities
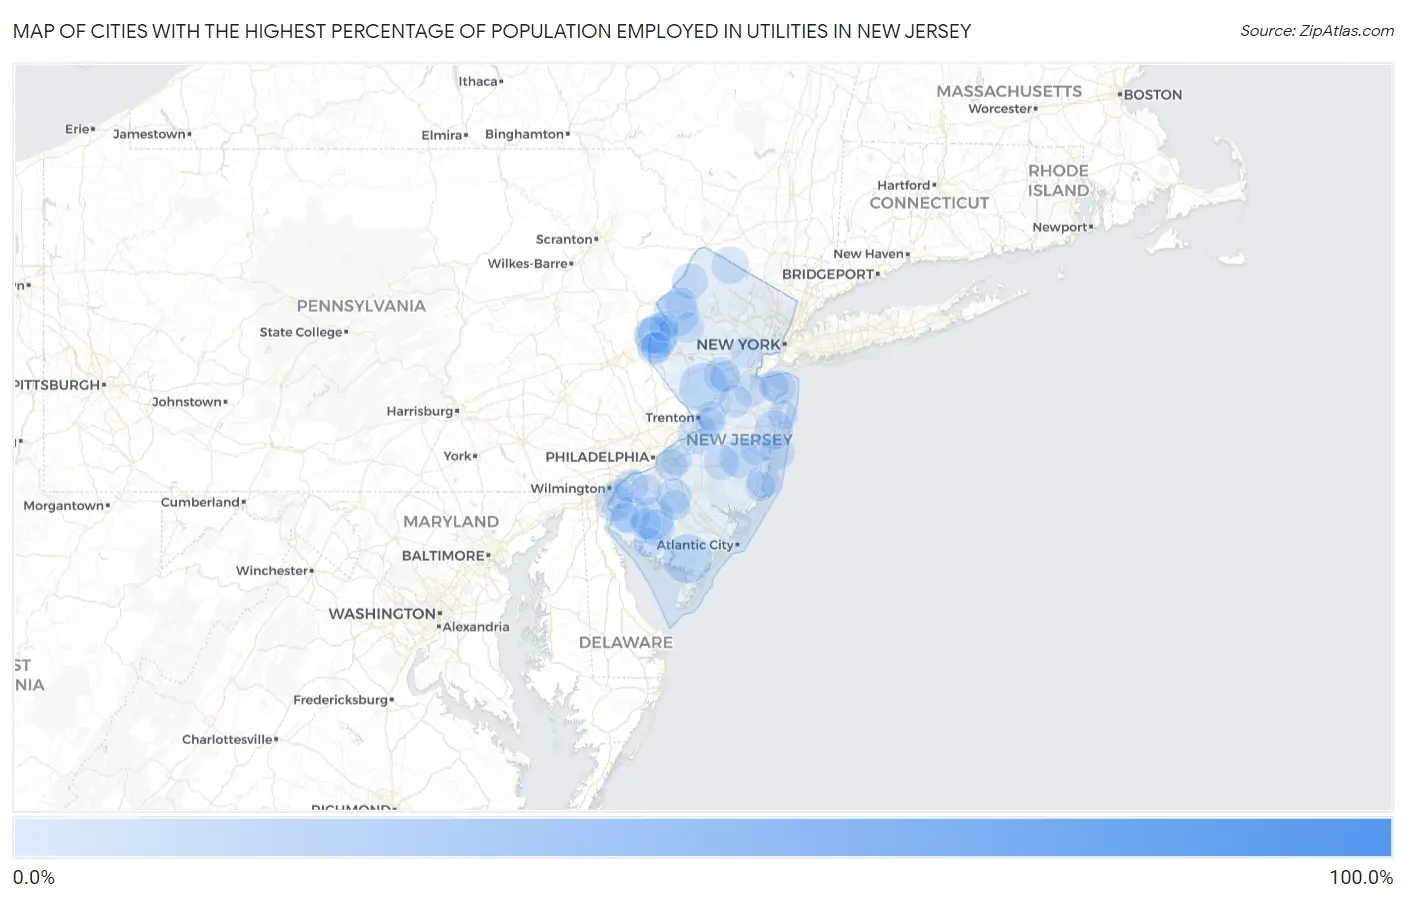
Map of Cities with the Highest Percentage of Population Employed in Utilities in New Jersey
0.0%
100.0%
Cities with the Highest Percentage of Population Employed in Utilities in New Jersey
| City | % Employed | vs State | vs National | |
| 1. | Money Island | 100.0% | 0.75%(+99.2)#1 | 0.84%(+99.2)#7 |
| 2. | Port Elizabeth | 14.1% | 0.75%(+13.3)#2 | 0.84%(+13.3)#317 |
| 3. | Roadstown | 12.7% | 0.75%(+11.9)#3 | 0.84%(+11.8)#372 |
| 4. | Tuckahoe | 11.5% | 0.75%(+10.8)#4 | 0.84%(+10.7)#436 |
| 5. | Liberty Corner | 11.5% | 0.75%(+10.8)#5 | 0.84%(+10.7)#438 |
| 6. | Clearbrook | 10.5% | 0.75%(+9.77)#6 | 0.84%(+9.68)#487 |
| 7. | Skillman | 10.5% | 0.75%(+9.74)#7 | 0.84%(+9.66)#488 |
| 8. | Belleplain | 10.5% | 0.75%(+9.71)#8 | 0.84%(+9.63)#490 |
| 9. | Carlstadt Borough | 9.8% | 0.75%(+9.09)#9 | 0.84%(+9.01)#539 |
| 10. | Marlboro | 9.7% | 0.75%(+8.92)#10 | 0.84%(+8.84)#555 |
| 11. | Hope | 8.6% | 0.75%(+7.84)#11 | 0.84%(+7.75)#662 |
| 12. | Germania | 8.4% | 0.75%(+7.61)#12 | 0.84%(+7.53)#684 |
| 13. | Franklinville | 8.0% | 0.75%(+7.25)#13 | 0.84%(+7.17)#724 |
| 14. | Olivet | 7.7% | 0.75%(+6.90)#14 | 0.84%(+6.82)#774 |
| 15. | Harmony | 7.5% | 0.75%(+6.70)#15 | 0.84%(+6.62)#799 |
| 16. | Hutchinson | 6.8% | 0.75%(+6.10)#16 | 0.84%(+6.01)#892 |
| 17. | Cedar Glen Lakes | 6.7% | 0.75%(+5.96)#17 | 0.84%(+5.88)#916 |
| 18. | Port Morris | 6.6% | 0.75%(+5.87)#18 | 0.84%(+5.79)#950 |
| 19. | Centre Grove | 6.5% | 0.75%(+5.77)#19 | 0.84%(+5.69)#969 |
| 20. | Glen Gardner Borough | 6.5% | 0.75%(+5.75)#20 | 0.84%(+5.67)#980 |
| 21. | Lawnside Borough | 6.4% | 0.75%(+5.62)#21 | 0.84%(+5.54)#1,008 |
| 22. | Malaga | 6.1% | 0.75%(+5.40)#22 | 0.84%(+5.31)#1,065 |
| 23. | Roebling | 6.1% | 0.75%(+5.37)#23 | 0.84%(+5.28)#1,079 |
| 24. | Bradley Beach Borough | 6.0% | 0.75%(+5.26)#24 | 0.84%(+5.18)#1,103 |
| 25. | Allenwood | 6.0% | 0.75%(+5.21)#25 | 0.84%(+5.12)#1,120 |
| 26. | South Dennis | 5.7% | 0.75%(+4.99)#26 | 0.84%(+4.91)#1,183 |
| 27. | Dividing Creek | 5.7% | 0.75%(+4.91)#27 | 0.84%(+4.82)#1,210 |
| 28. | Pennsville | 5.4% | 0.75%(+4.61)#28 | 0.84%(+4.53)#1,298 |
| 29. | Alloway | 5.3% | 0.75%(+4.54)#29 | 0.84%(+4.45)#1,333 |
| 30. | Auburn | 5.3% | 0.75%(+4.53)#30 | 0.84%(+4.44)#1,336 |
| 31. | Vernon Valley | 5.2% | 0.75%(+4.48)#31 | 0.84%(+4.40)#1,356 |
| 32. | Brainards | 5.1% | 0.75%(+4.33)#32 | 0.84%(+4.25)#1,431 |
| 33. | Silver Lake | 5.1% | 0.75%(+4.31)#33 | 0.84%(+4.22)#1,439 |
| 34. | Carlls Corner | 4.9% | 0.75%(+4.18)#34 | 0.84%(+4.09)#1,498 |
| 35. | Rosenhayn | 4.6% | 0.75%(+3.89)#35 | 0.84%(+3.81)#1,637 |
| 36. | Crandon Lakes | 4.6% | 0.75%(+3.81)#36 | 0.84%(+3.73)#1,680 |
| 37. | Williamstown | 4.5% | 0.75%(+3.74)#37 | 0.84%(+3.66)#1,735 |
| 38. | East Millstone | 4.5% | 0.75%(+3.72)#38 | 0.84%(+3.63)#1,750 |
| 39. | Othello | 4.4% | 0.75%(+3.69)#39 | 0.84%(+3.61)#1,762 |
| 40. | Presidential Lakes Estates | 4.3% | 0.75%(+3.56)#40 | 0.84%(+3.48)#1,842 |
| 41. | Dover Beaches North | 4.1% | 0.75%(+3.33)#41 | 0.84%(+3.24)#1,989 |
| 42. | Leonardo | 3.8% | 0.75%(+3.04)#42 | 0.84%(+2.95)#2,200 |
| 43. | Paulsboro Borough | 3.8% | 0.75%(+3.01)#43 | 0.84%(+2.93)#2,220 |
| 44. | Beckett | 3.7% | 0.75%(+2.96)#44 | 0.84%(+2.87)#2,276 |
| 45. | Grenloch | 3.6% | 0.75%(+2.86)#45 | 0.84%(+2.78)#2,353 |
| 46. | Waretown | 3.5% | 0.75%(+2.75)#46 | 0.84%(+2.67)#2,443 |
| 47. | Kenilworth Borough | 3.5% | 0.75%(+2.74)#47 | 0.84%(+2.66)#2,449 |
| 48. | Menlo Park Terrace | 3.5% | 0.75%(+2.74)#48 | 0.84%(+2.66)#2,451 |
| 49. | North Haledon Borough | 3.4% | 0.75%(+2.66)#49 | 0.84%(+2.57)#2,533 |
| 50. | Brownville | 3.3% | 0.75%(+2.58)#50 | 0.84%(+2.50)#2,599 |
| 51. | Flanders | 3.3% | 0.75%(+2.55)#51 | 0.84%(+2.47)#2,631 |
| 52. | Elmer Borough | 3.3% | 0.75%(+2.52)#52 | 0.84%(+2.44)#2,663 |
| 53. | Whittingham | 3.2% | 0.75%(+2.46)#53 | 0.84%(+2.38)#2,728 |
| 54. | Newfield Borough | 3.1% | 0.75%(+2.38)#54 | 0.84%(+2.29)#2,801 |
| 55. | Bloomingdale Borough | 3.1% | 0.75%(+2.35)#55 | 0.84%(+2.27)#2,829 |
| 56. | Keyport Borough | 3.1% | 0.75%(+2.33)#56 | 0.84%(+2.25)#2,853 |
| 57. | Silver Lake Cdp Warren County | 3.0% | 0.75%(+2.28)#57 | 0.84%(+2.19)#2,911 |
| 58. | Marksboro | 2.9% | 0.75%(+2.19)#58 | 0.84%(+2.10)#3,019 |
| 59. | Franklin Borough | 2.9% | 0.75%(+2.17)#59 | 0.84%(+2.09)#3,035 |
| 60. | Seaside Heights Borough | 2.9% | 0.75%(+2.14)#60 | 0.84%(+2.06)#3,078 |
| 61. | Allendale Borough | 2.9% | 0.75%(+2.13)#61 | 0.84%(+2.05)#3,087 |
| 62. | Upper Pohatcong | 2.9% | 0.75%(+2.13)#62 | 0.84%(+2.05)#3,090 |
| 63. | Shiloh Borough | 2.8% | 0.75%(+2.01)#63 | 0.84%(+1.92)#3,268 |
| 64. | Pompton Lakes Borough | 2.8% | 0.75%(+2.00)#64 | 0.84%(+1.92)#3,271 |
| 65. | Barclay | 2.8% | 0.75%(+2.00)#65 | 0.84%(+1.92)#3,278 |
| 66. | Greenwich | 2.7% | 0.75%(+1.92)#66 | 0.84%(+1.83)#3,395 |
| 67. | Westfield | 2.6% | 0.75%(+1.82)#67 | 0.84%(+1.74)#3,542 |
| 68. | Middlebush | 2.4% | 0.75%(+1.69)#68 | 0.84%(+1.61)#3,741 |
| 69. | Mullica Hill | 2.4% | 0.75%(+1.68)#69 | 0.84%(+1.60)#3,763 |
| 70. | Englishtown Borough | 2.4% | 0.75%(+1.68)#70 | 0.84%(+1.59)#3,767 |
| 71. | Roseland Borough | 2.4% | 0.75%(+1.67)#71 | 0.84%(+1.59)#3,776 |
| 72. | Ramblewood | 2.4% | 0.75%(+1.64)#72 | 0.84%(+1.55)#3,843 |
| 73. | Gouldtown | 2.4% | 0.75%(+1.62)#73 | 0.84%(+1.53)#3,867 |
| 74. | Pine Lake Park | 2.3% | 0.75%(+1.59)#74 | 0.84%(+1.50)#3,934 |
| 75. | West Park | 2.3% | 0.75%(+1.59)#75 | 0.84%(+1.50)#3,936 |
| 76. | Seabrook Farms | 2.3% | 0.75%(+1.56)#76 | 0.84%(+1.48)#3,986 |
| 77. | West Berlin | 2.3% | 0.75%(+1.54)#77 | 0.84%(+1.45)#4,028 |
| 78. | Cresskill Borough | 2.3% | 0.75%(+1.51)#78 | 0.84%(+1.42)#4,075 |
| 79. | Union | 2.2% | 0.75%(+1.47)#79 | 0.84%(+1.39)#4,147 |
| 80. | Union Beach Borough | 2.2% | 0.75%(+1.45)#80 | 0.84%(+1.37)#4,187 |
| 81. | Beattystown | 2.2% | 0.75%(+1.40)#81 | 0.84%(+1.32)#4,304 |
| 82. | Belvidere | 2.1% | 0.75%(+1.35)#82 | 0.84%(+1.27)#4,402 |
| 83. | Atco | 2.1% | 0.75%(+1.34)#83 | 0.84%(+1.26)#4,436 |
| 84. | Victory Lakes | 2.1% | 0.75%(+1.30)#84 | 0.84%(+1.22)#4,523 |
| 85. | Barnegat | 2.1% | 0.75%(+1.30)#85 | 0.84%(+1.21)#4,533 |
| 86. | Pleasantdale | 2.0% | 0.75%(+1.29)#86 | 0.84%(+1.21)#4,542 |
| 87. | Carneys Point | 2.0% | 0.75%(+1.28)#87 | 0.84%(+1.19)#4,577 |
| 88. | Cologne | 2.0% | 0.75%(+1.27)#88 | 0.84%(+1.19)#4,591 |
| 89. | Fairton | 2.0% | 0.75%(+1.27)#89 | 0.84%(+1.19)#4,592 |
| 90. | Hamilton Square | 2.0% | 0.75%(+1.27)#90 | 0.84%(+1.19)#4,605 |
| 91. | Yardville | 2.0% | 0.75%(+1.25)#91 | 0.84%(+1.17)#4,649 |
| 92. | Spotswood Borough | 2.0% | 0.75%(+1.21)#92 | 0.84%(+1.12)#4,736 |
| 93. | Wanamassa | 2.0% | 0.75%(+1.20)#93 | 0.84%(+1.12)#4,756 |
| 94. | Oceanport Borough | 2.0% | 0.75%(+1.20)#94 | 0.84%(+1.12)#4,766 |
| 95. | New Gretna | 1.9% | 0.75%(+1.19)#95 | 0.84%(+1.10)#4,787 |
| 96. | Port Monmouth | 1.9% | 0.75%(+1.16)#96 | 0.84%(+1.07)#4,871 |
| 97. | Newport | 1.9% | 0.75%(+1.15)#97 | 0.84%(+1.07)#4,884 |
| 98. | Quinton | 1.9% | 0.75%(+1.15)#98 | 0.84%(+1.06)#4,894 |
| 99. | Milltown Borough | 1.9% | 0.75%(+1.14)#99 | 0.84%(+1.06)#4,912 |
| 100. | Audubon Park Borough | 1.9% | 0.75%(+1.12)#100 | 0.84%(+1.04)#4,979 |
Common Questions
What are the Top 10 Cities with the Highest Percentage of Population Employed in Utilities in New Jersey?
Top 10 Cities with the Highest Percentage of Population Employed in Utilities in New Jersey are:
#1
10.5%
#2
10.5%
#3
8.6%
#4
7.7%
#5
7.5%
#6
6.8%
#7
6.7%
#8
6.1%
#9
6.0%
#10
5.4%
What city has the Highest Percentage of Population Employed in Utilities in New Jersey?
Skillman has the Highest Percentage of Population Employed in Utilities in New Jersey with 10.5%.
What is the Percentage of Population Employed in Utilities in the State of New Jersey?
Percentage of Population Employed in Utilities in New Jersey is 0.75%.
What is the Percentage of Population Employed in Utilities in the United States?
Percentage of Population Employed in Utilities in the United States is 0.84%.