Rahway, NJ
Rahway Map
Rahway Overview
29,664
TOTAL POPULATION
14,347
MALE POPULATION
15,317
FEMALE POPULATION
93.67
MALES / 100 FEMALES
106.76
FEMALES / 100 MALES
39.3
MEDIAN AGE
3.1
AVG FAMILY SIZE
2.5
AVG HOUSEHOLD SIZE
$43,300
PER CAPITA INCOME
$106,711
AVG FAMILY INCOME
$86,557
AVG HOUSEHOLD INCOME
20.9%
WAGE / INCOME GAP [ % ]
79.1¢/ $1
WAGE / INCOME GAP [ $ ]
0.42
INEQUALITY / GINI INDEX
16,321
LABOR FORCE [ PEOPLE ]
67.9%
PERCENT IN LABOR FORCE
8.3%
UNEMPLOYMENT RATE
Rahway Zip Codes
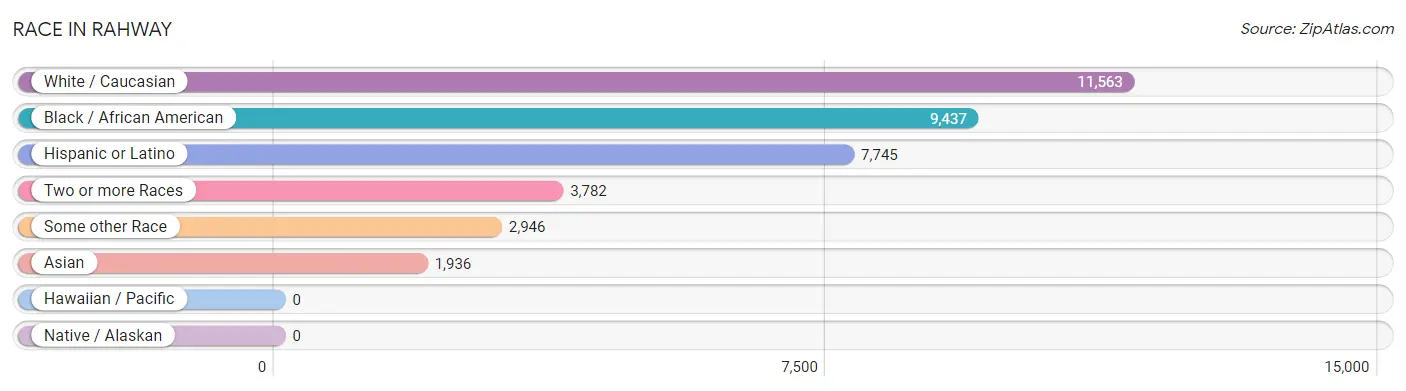
Race in Rahway
The most populous races in Rahway are White / Caucasian (11,563 | 39.0%), Black / African American (9,437 | 31.8%), and Hispanic or Latino (7,745 | 26.1%).
| Race | # Population | % Population |
| Asian | 1,936 | 6.5% |
| Black / African American | 9,437 | 31.8% |
| Hawaiian / Pacific | 0 | 0.0% |
| Hispanic or Latino | 7,745 | 26.1% |
| Native / Alaskan | 0 | 0.0% |
| White / Caucasian | 11,563 | 39.0% |
| Two or more Races | 3,782 | 12.8% |
| Some other Race | 2,946 | 9.9% |
| Total | 29,664 | 100.0% |
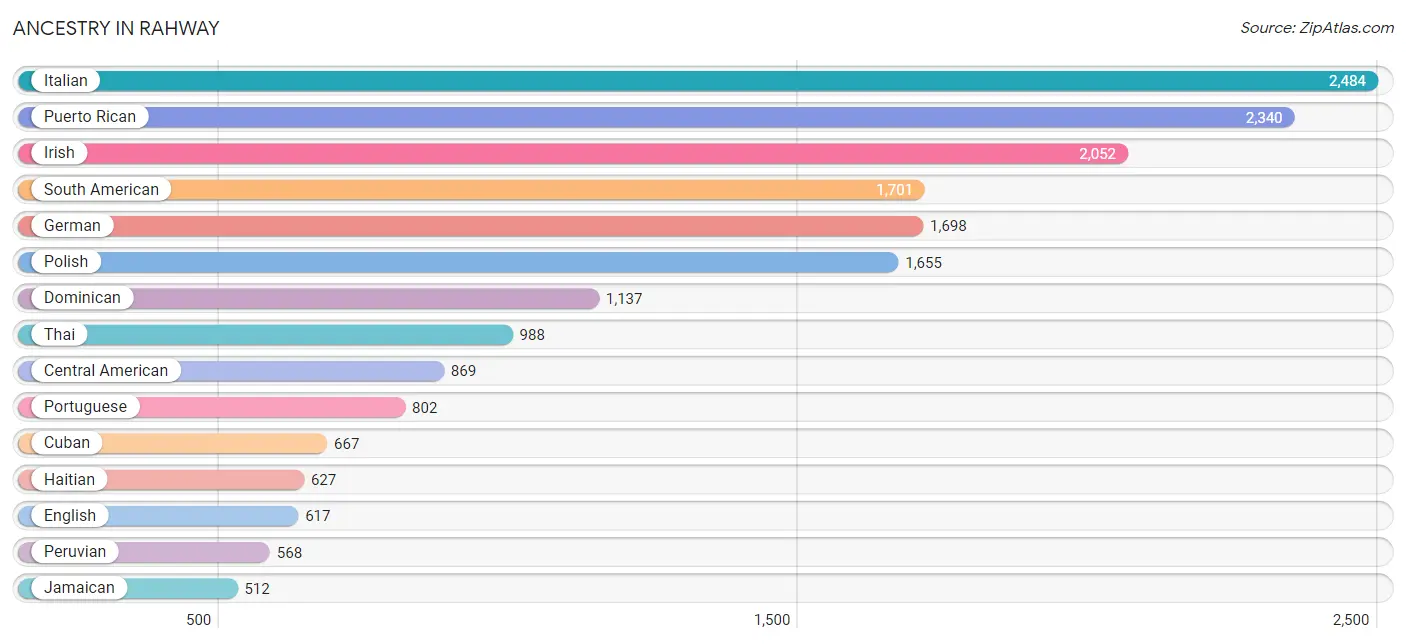
Ancestry in Rahway
The most populous ancestries reported in Rahway are Italian (2,484 | 8.4%), Puerto Rican (2,340 | 7.9%), Irish (2,052 | 6.9%), South American (1,701 | 5.7%), and German (1,698 | 5.7%), together accounting for 34.6% of all Rahway residents.
| Ancestry | # Population | % Population |
| African | 120 | 0.4% |
| American | 509 | 1.7% |
| Arab | 65 | 0.2% |
| Armenian | 54 | 0.2% |
| Austrian | 15 | 0.1% |
| Barbadian | 72 | 0.2% |
| Belgian | 8 | 0.0% |
| Bhutanese | 12 | 0.0% |
| Brazilian | 245 | 0.8% |
| British | 16 | 0.1% |
| British West Indian | 151 | 0.5% |
| Burmese | 170 | 0.6% |
| Central American | 869 | 2.9% |
| Central American Indian | 4 | 0.0% |
| Chilean | 97 | 0.3% |
| Colombian | 289 | 1.0% |
| Costa Rican | 48 | 0.2% |
| Croatian | 41 | 0.1% |
| Cuban | 667 | 2.2% |
| Czech | 54 | 0.2% |
| Dominican | 1,137 | 3.8% |
| Dutch | 145 | 0.5% |
| Eastern European | 31 | 0.1% |
| Ecuadorian | 489 | 1.7% |
| Egyptian | 48 | 0.2% |
| English | 617 | 2.1% |
| European | 215 | 0.7% |
| Finnish | 35 | 0.1% |
| French | 238 | 0.8% |
| French Canadian | 19 | 0.1% |
| German | 1,698 | 5.7% |
| Ghanaian | 39 | 0.1% |
| Greek | 184 | 0.6% |
| Guatemalan | 53 | 0.2% |
| Guyanese | 15 | 0.1% |
| Haitian | 627 | 2.1% |
| Honduran | 419 | 1.4% |
| Hungarian | 376 | 1.3% |
| Indian (Asian) | 310 | 1.1% |
| Irish | 2,052 | 6.9% |
| Israeli | 16 | 0.1% |
| Italian | 2,484 | 8.4% |
| Jamaican | 512 | 1.7% |
| Kenyan | 10 | 0.0% |
| Korean | 405 | 1.4% |
| Latvian | 89 | 0.3% |
| Lithuanian | 175 | 0.6% |
| Mexican | 337 | 1.1% |
| Moroccan | 17 | 0.1% |
| Nicaraguan | 21 | 0.1% |
| Nigerian | 13 | 0.0% |
| Norwegian | 13 | 0.0% |
| Panamanian | 89 | 0.3% |
| Peruvian | 568 | 1.9% |
| Polish | 1,655 | 5.6% |
| Portuguese | 802 | 2.7% |
| Puerto Rican | 2,340 | 7.9% |
| Romanian | 26 | 0.1% |
| Russian | 234 | 0.8% |
| Salvadoran | 239 | 0.8% |
| Scotch-Irish | 91 | 0.3% |
| Scottish | 242 | 0.8% |
| Slavic | 93 | 0.3% |
| Slovak | 158 | 0.5% |
| South American | 1,701 | 5.7% |
| Spaniard | 180 | 0.6% |
| Sri Lankan | 56 | 0.2% |
| Subsaharan African | 172 | 0.6% |
| Swedish | 86 | 0.3% |
| Thai | 988 | 3.3% |
| Trinidadian and Tobagonian | 54 | 0.2% |
| Ukrainian | 198 | 0.7% |
| Uruguayan | 59 | 0.2% |
| Venezuelan | 118 | 0.4% |
| West Indian | 76 | 0.3% | View All 75 Rows |
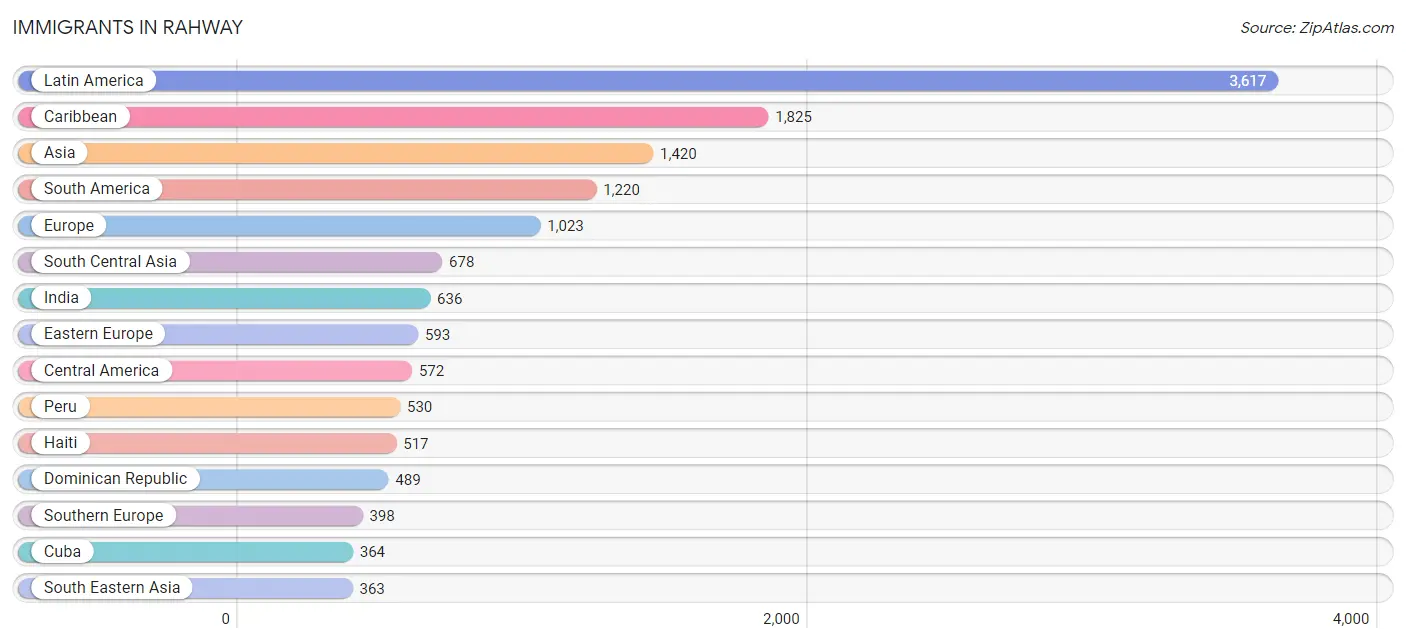
Immigrants in Rahway
The most numerous immigrant groups reported in Rahway came from Latin America (3,617 | 12.2%), Caribbean (1,825 | 6.1%), Asia (1,420 | 4.8%), South America (1,220 | 4.1%), and Europe (1,023 | 3.5%), together accounting for 30.7% of all Rahway residents.
| Immigration Origin | # Population | % Population |
| Africa | 90 | 0.3% |
| Argentina | 11 | 0.0% |
| Armenia | 54 | 0.2% |
| Asia | 1,420 | 4.8% |
| Barbados | 39 | 0.1% |
| Brazil | 263 | 0.9% |
| Caribbean | 1,825 | 6.1% |
| Central America | 572 | 1.9% |
| Chile | 15 | 0.1% |
| China | 175 | 0.6% |
| Colombia | 124 | 0.4% |
| Costa Rica | 48 | 0.2% |
| Cuba | 364 | 1.2% |
| Czechoslovakia | 40 | 0.1% |
| Dominican Republic | 489 | 1.7% |
| Eastern Asia | 325 | 1.1% |
| Eastern Europe | 593 | 2.0% |
| Ecuador | 56 | 0.2% |
| Egypt | 67 | 0.2% |
| El Salvador | 101 | 0.3% |
| Europe | 1,023 | 3.5% |
| Grenada | 58 | 0.2% |
| Guatemala | 32 | 0.1% |
| Guyana | 24 | 0.1% |
| Haiti | 517 | 1.7% |
| Honduras | 292 | 1.0% |
| Hong Kong | 19 | 0.1% |
| Hungary | 61 | 0.2% |
| India | 636 | 2.1% |
| Ireland | 21 | 0.1% |
| Italy | 111 | 0.4% |
| Jamaica | 139 | 0.5% |
| Korea | 150 | 0.5% |
| Latin America | 3,617 | 12.2% |
| Latvia | 89 | 0.3% |
| Lithuania | 24 | 0.1% |
| Mexico | 63 | 0.2% |
| Nicaragua | 16 | 0.1% |
| Nigeria | 13 | 0.0% |
| Northern Africa | 67 | 0.2% |
| Northern Europe | 32 | 0.1% |
| Panama | 20 | 0.1% |
| Peru | 530 | 1.8% |
| Philippines | 334 | 1.1% |
| Poland | 327 | 1.1% |
| Portugal | 242 | 0.8% |
| Russia | 39 | 0.1% |
| South America | 1,220 | 4.1% |
| South Central Asia | 678 | 2.3% |
| South Eastern Asia | 363 | 1.2% |
| Southern Europe | 398 | 1.3% |
| Spain | 45 | 0.2% |
| Trinidad and Tobago | 146 | 0.5% |
| Ukraine | 13 | 0.0% |
| Uruguay | 92 | 0.3% |
| Venezuela | 105 | 0.4% |
| Vietnam | 29 | 0.1% |
| Western Africa | 13 | 0.0% |
| Western Asia | 54 | 0.2% | View All 59 Rows |
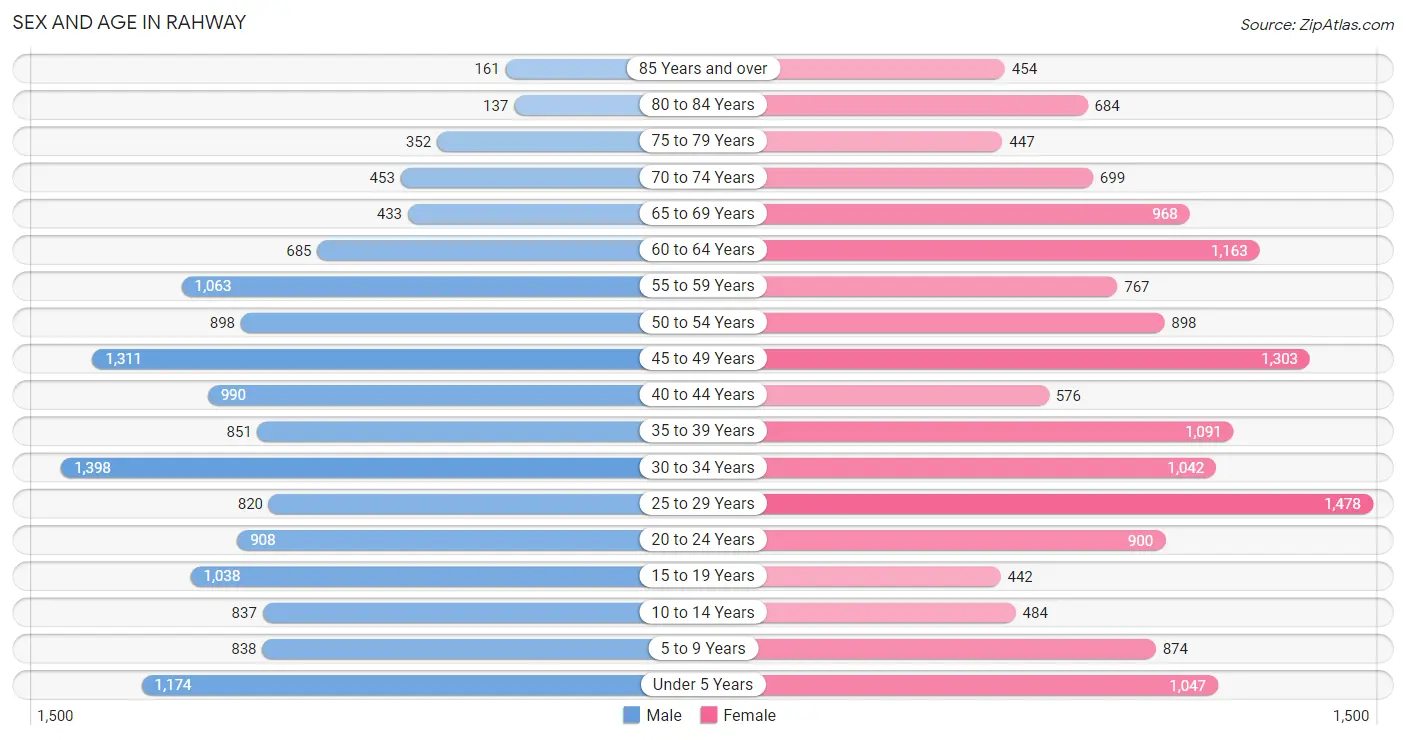
Sex and Age in Rahway
Sex and Age in Rahway
The most populous age groups in Rahway are 30 to 34 Years (1,398 | 9.7%) for men and 25 to 29 Years (1,478 | 9.7%) for women.
| Age Bracket | Male | Female |
| Under 5 Years | 1,174 (8.2%) | 1,047 (6.8%) |
| 5 to 9 Years | 838 (5.8%) | 874 (5.7%) |
| 10 to 14 Years | 837 (5.8%) | 484 (3.2%) |
| 15 to 19 Years | 1,038 (7.2%) | 442 (2.9%) |
| 20 to 24 Years | 908 (6.3%) | 900 (5.9%) |
| 25 to 29 Years | 820 (5.7%) | 1,478 (9.7%) |
| 30 to 34 Years | 1,398 (9.7%) | 1,042 (6.8%) |
| 35 to 39 Years | 851 (5.9%) | 1,091 (7.1%) |
| 40 to 44 Years | 990 (6.9%) | 576 (3.8%) |
| 45 to 49 Years | 1,311 (9.1%) | 1,303 (8.5%) |
| 50 to 54 Years | 898 (6.3%) | 898 (5.9%) |
| 55 to 59 Years | 1,063 (7.4%) | 767 (5.0%) |
| 60 to 64 Years | 685 (4.8%) | 1,163 (7.6%) |
| 65 to 69 Years | 433 (3.0%) | 968 (6.3%) |
| 70 to 74 Years | 453 (3.2%) | 699 (4.6%) |
| 75 to 79 Years | 352 (2.5%) | 447 (2.9%) |
| 80 to 84 Years | 137 (0.9%) | 684 (4.5%) |
| 85 Years and over | 161 (1.1%) | 454 (3.0%) |
| Total | 14,347 (100.0%) | 15,317 (100.0%) |
Families and Households in Rahway
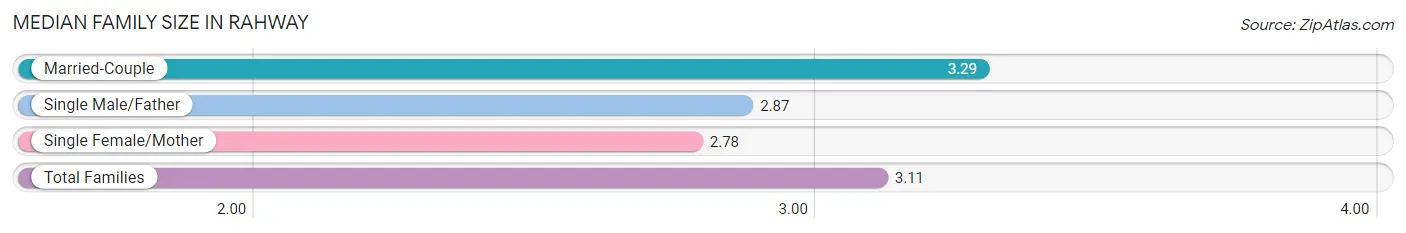
Median Family Size in Rahway
The median family size in Rahway is 3.11 persons per family, with married-couple families (4,915 | 63.6%) accounting for the largest median family size of 3.29 persons per family. On the other hand, single female/mother families (1,964 | 25.4%) represent the smallest median family size with 2.78 persons per family.
| Family Type | # Families | Family Size |
| Married-Couple | 4,915 (63.6%) | 3.29 |
| Single Male/Father | 848 (11.0%) | 2.87 |
| Single Female/Mother | 1,964 (25.4%) | 2.78 |
| Total Families | 7,727 (100.0%) | 3.11 |
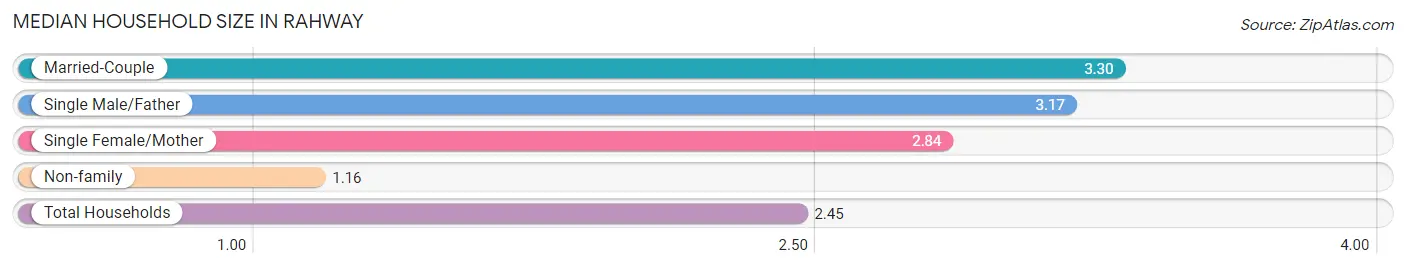
Median Household Size in Rahway
The median household size in Rahway is 2.45 persons per household, with married-couple households (4,915 | 40.7%) accounting for the largest median household size of 3.3 persons per household. non-family households (4,352 | 36.0%) represent the smallest median household size with 1.16 persons per household.
| Household Type | # Households | Household Size |
| Married-Couple | 4,915 (40.7%) | 3.30 |
| Single Male/Father | 848 (7.0%) | 3.17 |
| Single Female/Mother | 1,964 (16.3%) | 2.84 |
| Non-family | 4,352 (36.0%) | 1.16 |
| Total Households | 12,079 (100.0%) | 2.45 |
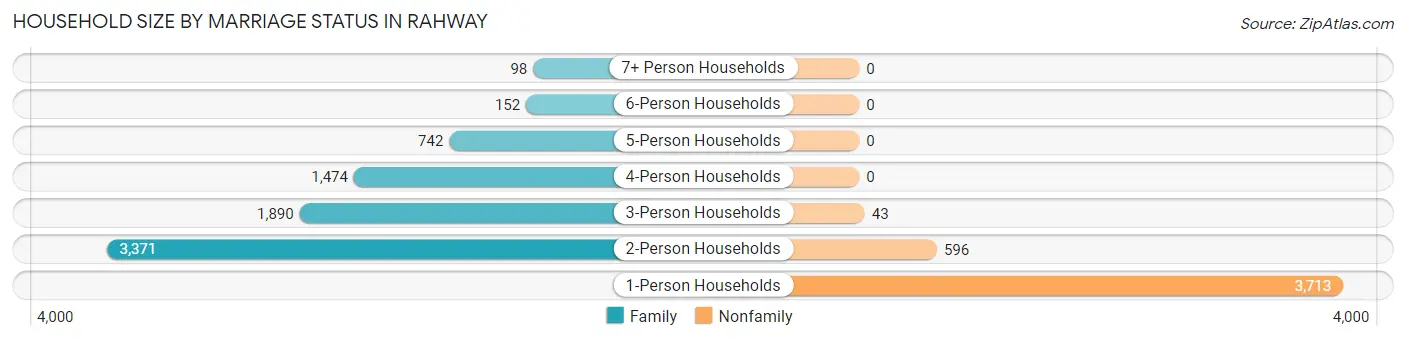
Household Size by Marriage Status in Rahway
Out of a total of 12,079 households in Rahway, 7,727 (64.0%) are family households, while 4,352 (36.0%) are nonfamily households. The most numerous type of family households are 2-person households, comprising 3,371, and the most common type of nonfamily households are 1-person households, comprising 3,713.
| Household Size | Family Households | Nonfamily Households |
| 1-Person Households | - | 3,713 (30.7%) |
| 2-Person Households | 3,371 (27.9%) | 596 (4.9%) |
| 3-Person Households | 1,890 (15.7%) | 43 (0.4%) |
| 4-Person Households | 1,474 (12.2%) | 0 (0.0%) |
| 5-Person Households | 742 (6.1%) | 0 (0.0%) |
| 6-Person Households | 152 (1.3%) | 0 (0.0%) |
| 7+ Person Households | 98 (0.8%) | 0 (0.0%) |
| Total | 7,727 (64.0%) | 4,352 (36.0%) |
Female Fertility in Rahway
Fertility by Age in Rahway
Average fertility rate in Rahway is 76.0 births per 1,000 women. Women in the age bracket of 15 to 19 years have the highest fertility rate with 100.0 births per 1,000 women. Women in the age bracket of 35 to 50 years acount for 47.2% of all women with births.
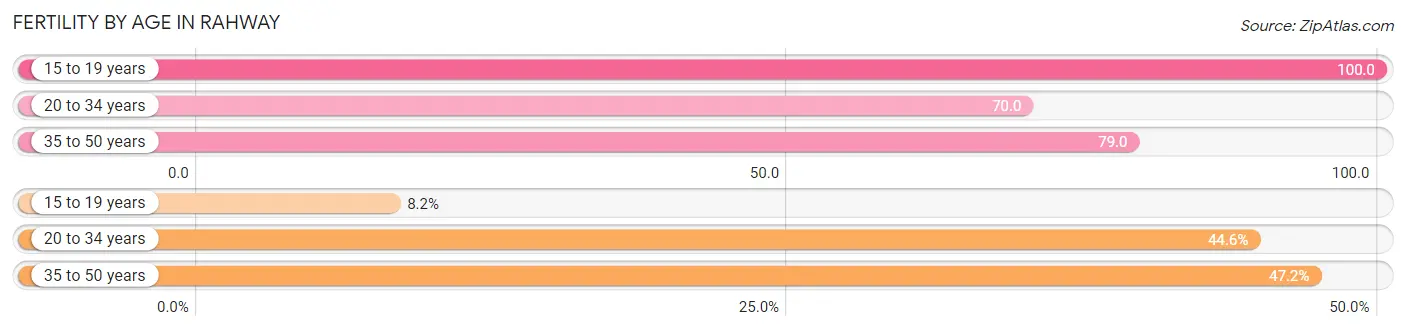
| Age Bracket | Women with Births | Births / 1,000 Women |
| 15 to 19 years | 44 (8.2%) | 100.0 |
| 20 to 34 years | 241 (44.6%) | 70.0 |
| 35 to 50 years | 255 (47.2%) | 79.0 |
| Total | 540 (100.0%) | 76.0 |
Fertility by Age by Marriage Status in Rahway
58.7% of women with births (540) in Rahway are married. The highest percentage of unmarried women with births falls into 15 to 19 years age bracket with 100.0% of them unmarried at the time of birth, while the lowest percentage of unmarried women with births belong to 20 to 34 years age bracket with 26.1% of them unmarried.
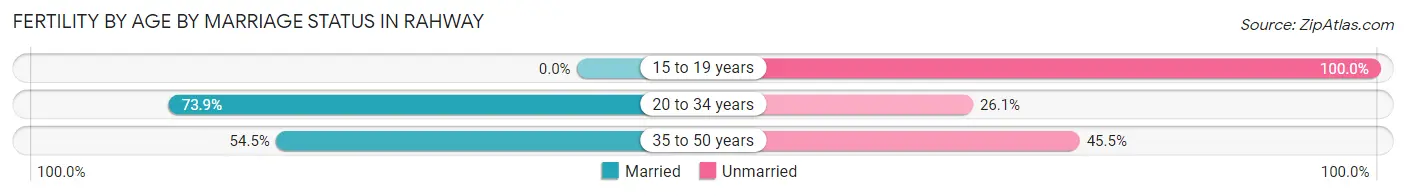
| Age Bracket | Married | Unmarried |
| 15 to 19 years | 0 (0.0%) | 44 (100.0%) |
| 20 to 34 years | 178 (73.9%) | 63 (26.1%) |
| 35 to 50 years | 139 (54.5%) | 116 (45.5%) |
| Total | 317 (58.7%) | 223 (41.3%) |
Fertility by Education in Rahway
Average fertility rate in Rahway is 76.0 births per 1,000 women. Women with the education attainment of high school diploma have the highest fertility rate of 140.0 births per 1,000 women, while women with the education attainment of college or associate's degree have the lowest fertility at 45.0 births per 1,000 women. Women with the education attainment of high school diploma represent 39.6% of all women with births.
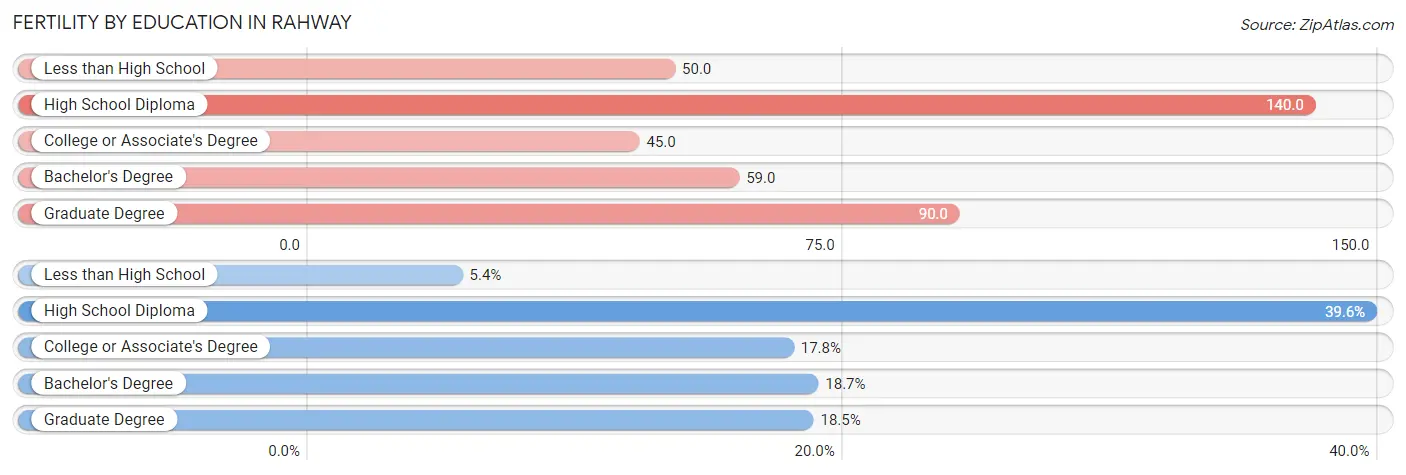
| Educational Attainment | Women with Births | Births / 1,000 Women |
| Less than High School | 29 (5.4%) | 50.0 |
| High School Diploma | 214 (39.6%) | 140.0 |
| College or Associate's Degree | 96 (17.8%) | 45.0 |
| Bachelor's Degree | 101 (18.7%) | 59.0 |
| Graduate Degree | 100 (18.5%) | 90.0 |
| Total | 540 (100.0%) | 76.0 |
Fertility by Education by Marriage Status in Rahway
41.3% of women with births in Rahway are unmarried. Women with the educational attainment of graduate degree are most likely to be married with 100.0% of them married at childbirth, while women with the educational attainment of high school diploma are least likely to be married with 76.6% of them unmarried at childbirth.
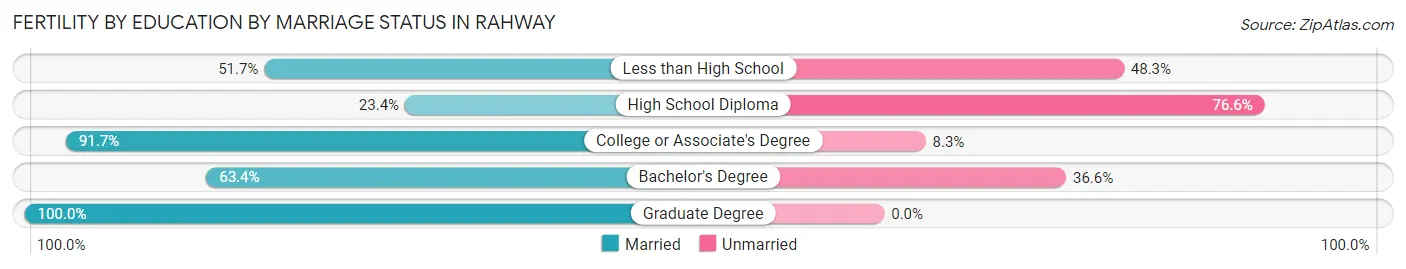
| Educational Attainment | Married | Unmarried |
| Less than High School | 15 (51.7%) | 14 (48.3%) |
| High School Diploma | 50 (23.4%) | 164 (76.6%) |
| College or Associate's Degree | 88 (91.7%) | 8 (8.3%) |
| Bachelor's Degree | 64 (63.4%) | 37 (36.6%) |
| Graduate Degree | 100 (100.0%) | 0 (0.0%) |
| Total | 317 (58.7%) | 223 (41.3%) |
Income in Rahway
Income Overview in Rahway
Per Capita Income in Rahway is $43,300, while median incomes of families and households are $106,711 and $86,557 respectively.
| Characteristic | Number | Measure |
| Per Capita Income | 29,664 | $43,300 |
| Median Family Income | 7,727 | $106,711 |
| Mean Family Income | 7,727 | $125,027 |
| Median Household Income | 12,079 | $86,557 |
| Mean Household Income | 12,079 | $103,923 |
| Income Deficit | 7,727 | $0 |
| Wage / Income Gap (%) | 29,664 | 20.92% |
| Wage / Income Gap ($) | 29,664 | 79.08¢ per $1 |
| Gini / Inequality Index | 29,664 | 0.42 |
Earnings by Sex in Rahway
Average Earnings in Rahway are $54,885, $59,853 for men and $47,333 for women, a difference of 20.9%.
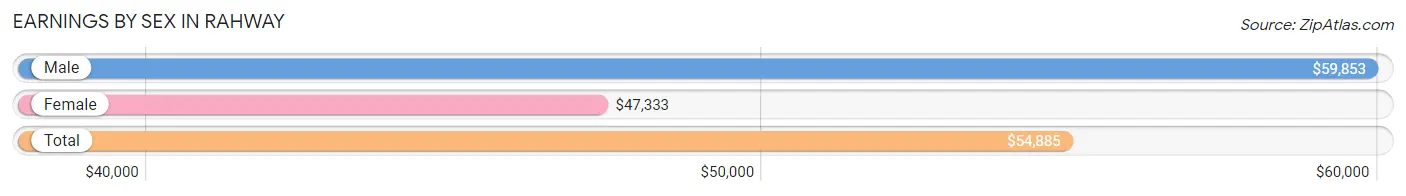
| Sex | Number | Average Earnings |
| Male | 8,284 (50.2%) | $59,853 |
| Female | 8,223 (49.8%) | $47,333 |
| Total | 16,507 (100.0%) | $54,885 |
Earnings by Sex by Income Bracket in Rahway
The most common earnings brackets in Rahway are $100,000+ for men (1,980 | 23.9%) and $75,000 to $99,999 for women (1,124 | 13.7%).
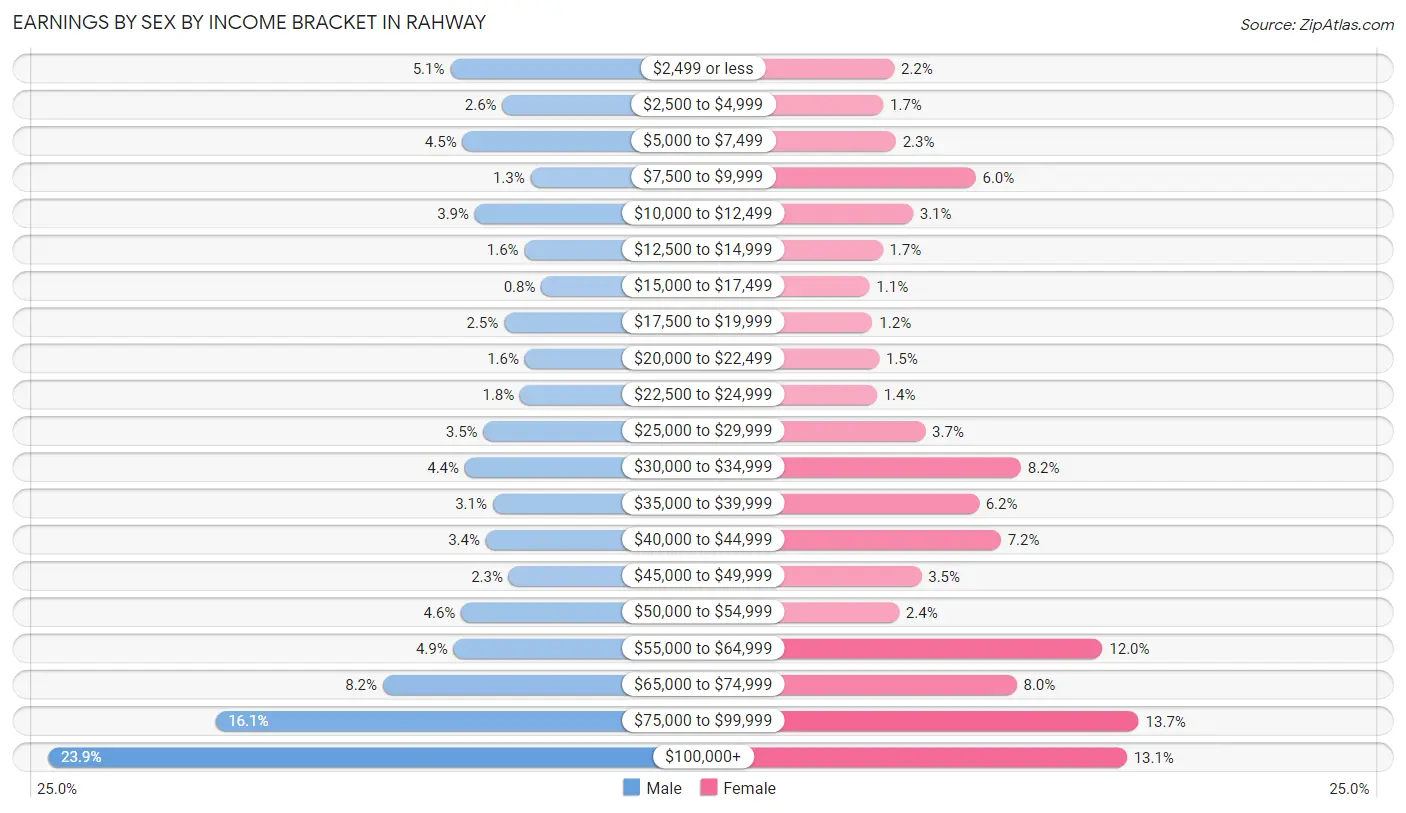
| Income | Male | Female |
| $2,499 or less | 419 (5.1%) | 182 (2.2%) |
| $2,500 to $4,999 | 217 (2.6%) | 140 (1.7%) |
| $5,000 to $7,499 | 372 (4.5%) | 188 (2.3%) |
| $7,500 to $9,999 | 108 (1.3%) | 496 (6.0%) |
| $10,000 to $12,499 | 324 (3.9%) | 254 (3.1%) |
| $12,500 to $14,999 | 132 (1.6%) | 137 (1.7%) |
| $15,000 to $17,499 | 66 (0.8%) | 87 (1.1%) |
| $17,500 to $19,999 | 210 (2.5%) | 99 (1.2%) |
| $20,000 to $22,499 | 130 (1.6%) | 124 (1.5%) |
| $22,500 to $24,999 | 148 (1.8%) | 115 (1.4%) |
| $25,000 to $29,999 | 291 (3.5%) | 302 (3.7%) |
| $30,000 to $34,999 | 363 (4.4%) | 670 (8.2%) |
| $35,000 to $39,999 | 254 (3.1%) | 508 (6.2%) |
| $40,000 to $44,999 | 282 (3.4%) | 593 (7.2%) |
| $45,000 to $49,999 | 192 (2.3%) | 287 (3.5%) |
| $50,000 to $54,999 | 377 (4.5%) | 201 (2.4%) |
| $55,000 to $64,999 | 407 (4.9%) | 984 (12.0%) |
| $65,000 to $74,999 | 681 (8.2%) | 654 (8.0%) |
| $75,000 to $99,999 | 1,331 (16.1%) | 1,124 (13.7%) |
| $100,000+ | 1,980 (23.9%) | 1,078 (13.1%) |
| Total | 8,284 (100.0%) | 8,223 (100.0%) |
Earnings by Sex by Educational Attainment in Rahway
Average earnings in Rahway are $69,579 for men and $55,808 for women, a difference of 19.8%. Men with an educational attainment of graduate degree enjoy the highest average annual earnings of $97,342, while those with high school diploma education earn the least with $43,472. Women with an educational attainment of graduate degree earn the most with the average annual earnings of $78,095, while those with high school diploma education have the smallest earnings of $33,557.
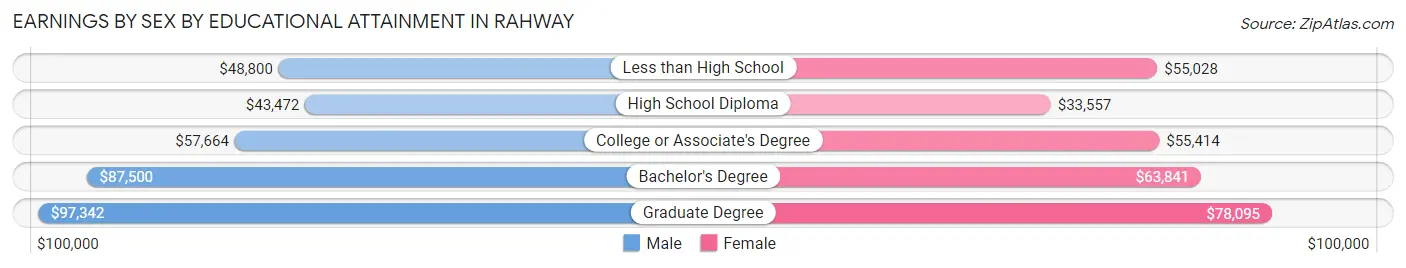
| Educational Attainment | Male Income | Female Income |
| Less than High School | $48,800 | $55,028 |
| High School Diploma | $43,472 | $33,557 |
| College or Associate's Degree | $57,664 | $55,414 |
| Bachelor's Degree | $87,500 | $63,841 |
| Graduate Degree | $97,342 | $78,095 |
| Total | $69,579 | $55,808 |
Family Income in Rahway
Family Income Brackets in Rahway
According to the Rahway family income data, there are 1,793 families falling into the $100,000 to $149,999 income range, which is the most common income bracket and makes up 23.2% of all families. Conversely, the $10,000 to $14,999 income bracket is the least frequent group with only 46 families (0.6%) belonging to this category.
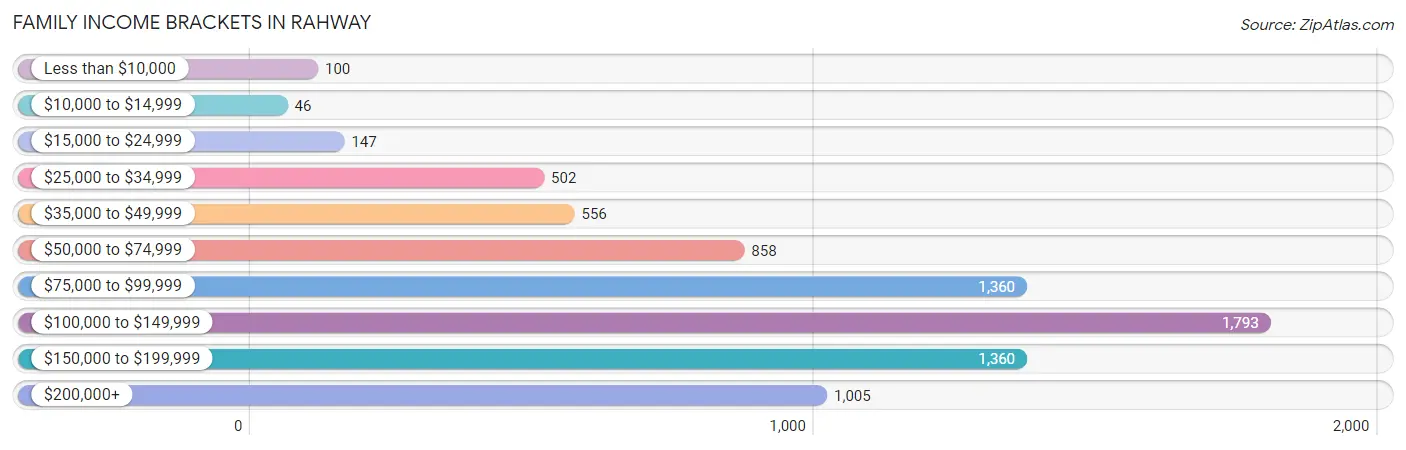
| Income Bracket | # Families | % Families |
| Less than $10,000 | 100 | 1.3% |
| $10,000 to $14,999 | 46 | 0.6% |
| $15,000 to $24,999 | 147 | 1.9% |
| $25,000 to $34,999 | 502 | 6.5% |
| $35,000 to $49,999 | 556 | 7.2% |
| $50,000 to $74,999 | 858 | 11.1% |
| $75,000 to $99,999 | 1,360 | 17.6% |
| $100,000 to $149,999 | 1,793 | 23.2% |
| $150,000 to $199,999 | 1,360 | 17.6% |
| $200,000+ | 1,005 | 13.0% |
Family Income by Famaliy Size in Rahway
6-person families (152 | 2.0%) account for the highest median family income in Rahway with $223,520 per family, while 2-person families (3,491 | 45.2%) have the highest median income of $46,026 per family member.
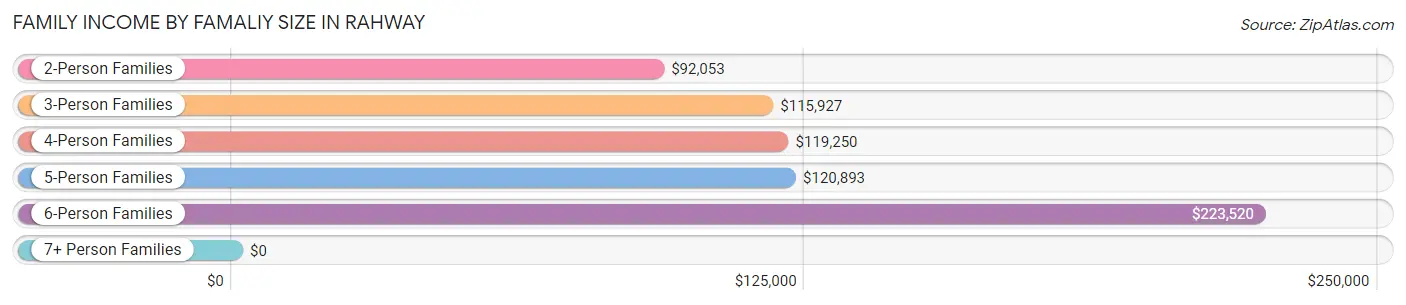
| Income Bracket | # Families | Median Income |
| 2-Person Families | 3,491 (45.2%) | $92,053 |
| 3-Person Families | 1,969 (25.5%) | $115,927 |
| 4-Person Families | 1,341 (17.3%) | $119,250 |
| 5-Person Families | 700 (9.1%) | $120,893 |
| 6-Person Families | 152 (2.0%) | $223,520 |
| 7+ Person Families | 74 (1.0%) | $0 |
| Total | 7,727 (100.0%) | $106,711 |
Family Income by Number of Earners in Rahway
The median family income in Rahway is $106,711, with families comprising 3+ earners (983) having the highest median family income of $154,840, while families with no earners (789) have the lowest median family income of $51,354, accounting for 12.7% and 10.2% of families, respectively.
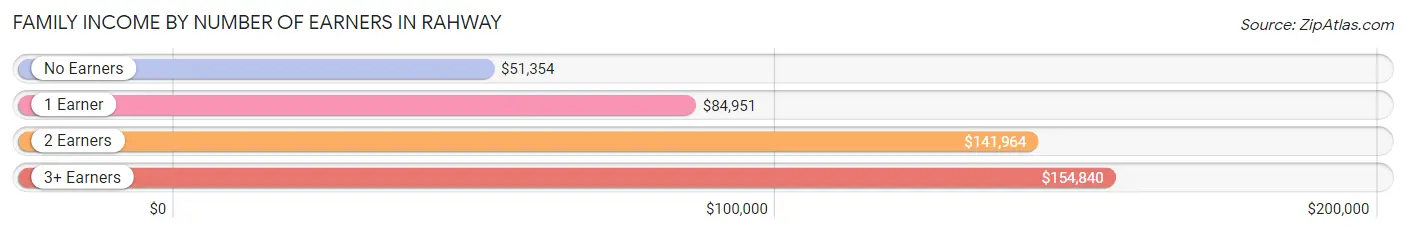
| Number of Earners | # Families | Median Income |
| No Earners | 789 (10.2%) | $51,354 |
| 1 Earner | 2,658 (34.4%) | $84,951 |
| 2 Earners | 3,297 (42.7%) | $141,964 |
| 3+ Earners | 983 (12.7%) | $154,840 |
| Total | 7,727 (100.0%) | $106,711 |
Household Income in Rahway
Household Income Brackets in Rahway
With 2,343 households falling in the category, the $100,000 to $149,999 income range is the most frequent in Rahway, accounting for 19.4% of all households. In contrast, only 278 households (2.3%) fall into the $10,000 to $14,999 income bracket, making it the least populous group.
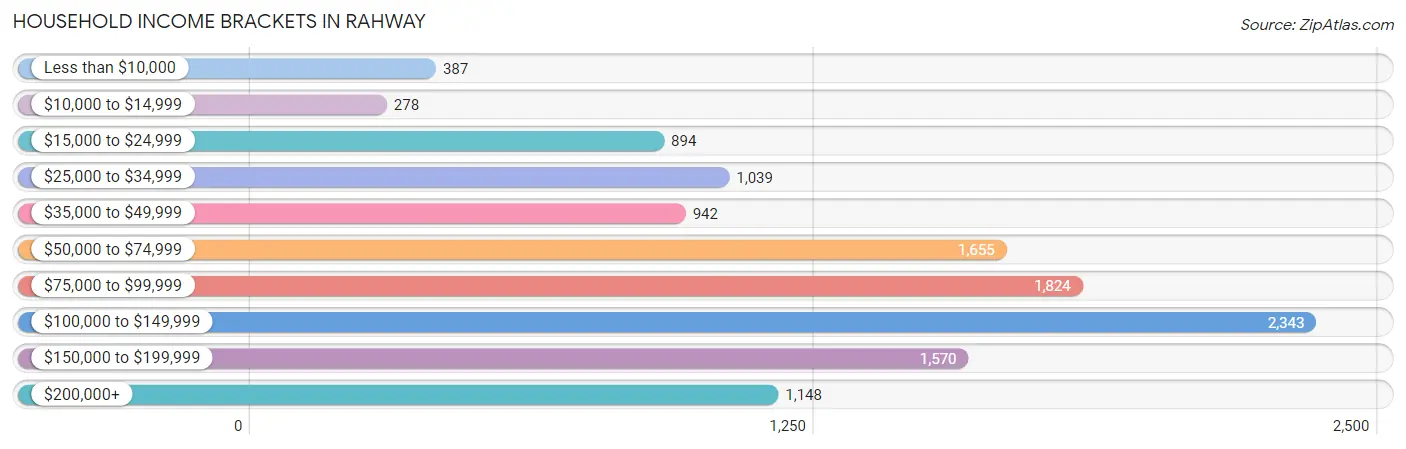
| Income Bracket | # Households | % Households |
| Less than $10,000 | 387 | 3.2% |
| $10,000 to $14,999 | 278 | 2.3% |
| $15,000 to $24,999 | 894 | 7.4% |
| $25,000 to $34,999 | 1,039 | 8.6% |
| $35,000 to $49,999 | 942 | 7.8% |
| $50,000 to $74,999 | 1,655 | 13.7% |
| $75,000 to $99,999 | 1,824 | 15.1% |
| $100,000 to $149,999 | 2,343 | 19.4% |
| $150,000 to $199,999 | 1,570 | 13.0% |
| $200,000+ | 1,148 | 9.5% |
Household Income by Householder Age in Rahway
The median household income in Rahway is $86,557, with the highest median household income of $103,983 found in the 45 to 64 years age bracket for the primary householder. A total of 4,855 households (40.2%) fall into this category. Meanwhile, the 15 to 24 years age bracket for the primary householder has the lowest median household income of $0, with 175 households (1.5%) in this group.
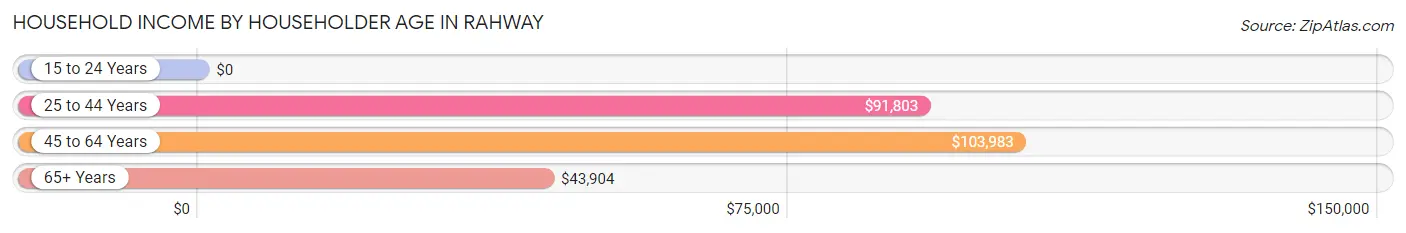
| Income Bracket | # Households | Median Income |
| 15 to 24 Years | 175 (1.5%) | $0 |
| 25 to 44 Years | 3,959 (32.8%) | $91,803 |
| 45 to 64 Years | 4,855 (40.2%) | $103,983 |
| 65+ Years | 3,090 (25.6%) | $43,904 |
| Total | 12,079 (100.0%) | $86,557 |
Poverty in Rahway
Income Below Poverty by Sex and Age in Rahway
With 6.8% poverty level for males and 7.0% for females among the residents of Rahway, 16 and 17 year old males and 18 to 24 year old females are the most vulnerable to poverty, with 47 males (17.6%) and 158 females (14.7%) in their respective age groups living below the poverty level.
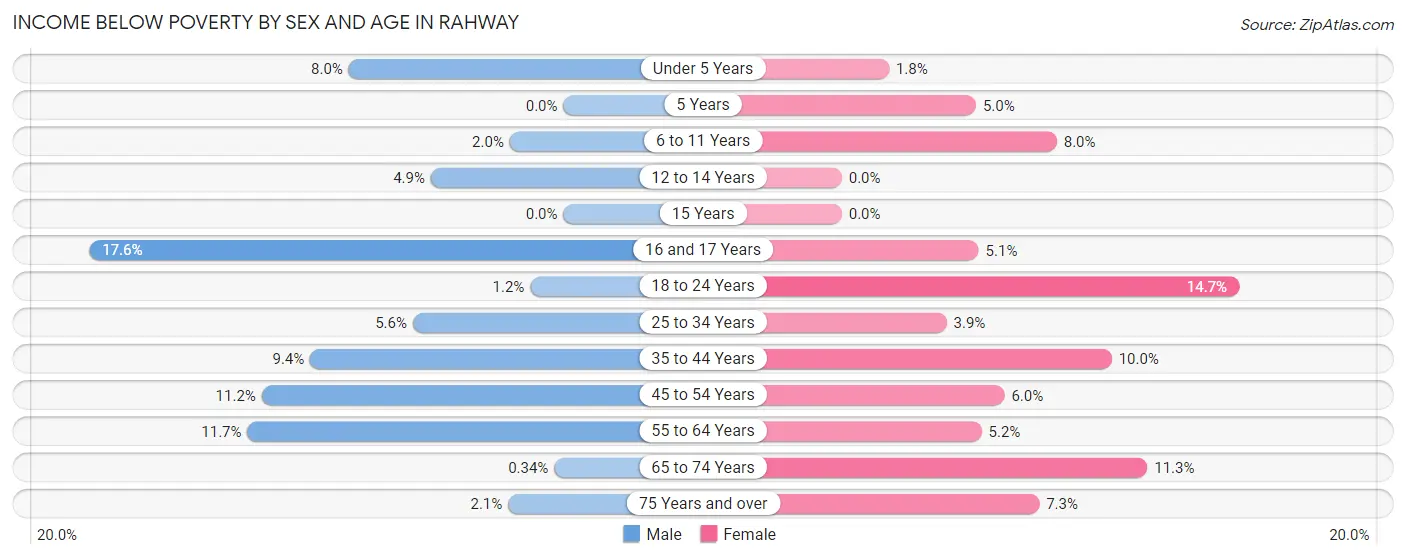
| Age Bracket | Male | Female |
| Under 5 Years | 91 (8.0%) | 18 (1.8%) |
| 5 Years | 0 (0.0%) | 13 (5.0%) |
| 6 to 11 Years | 21 (2.0%) | 64 (8.0%) |
| 12 to 14 Years | 25 (4.9%) | 0 (0.0%) |
| 15 Years | 0 (0.0%) | 0 (0.0%) |
| 16 and 17 Years | 47 (17.6%) | 10 (5.1%) |
| 18 to 24 Years | 17 (1.2%) | 158 (14.7%) |
| 25 to 34 Years | 124 (5.6%) | 98 (3.9%) |
| 35 to 44 Years | 173 (9.4%) | 167 (10.0%) |
| 45 to 54 Years | 246 (11.2%) | 133 (6.0%) |
| 55 to 64 Years | 205 (11.7%) | 99 (5.2%) |
| 65 to 74 Years | 3 (0.3%) | 189 (11.3%) |
| 75 Years and over | 13 (2.1%) | 113 (7.3%) |
| Total | 965 (6.8%) | 1,062 (7.0%) |
Income Above Poverty by Sex and Age in Rahway
According to the poverty statistics in Rahway, males aged 5 years and females aged 12 to 14 years are the age groups that are most secure financially, with 100.0% of males and 100.0% of females in these age groups living above the poverty line.
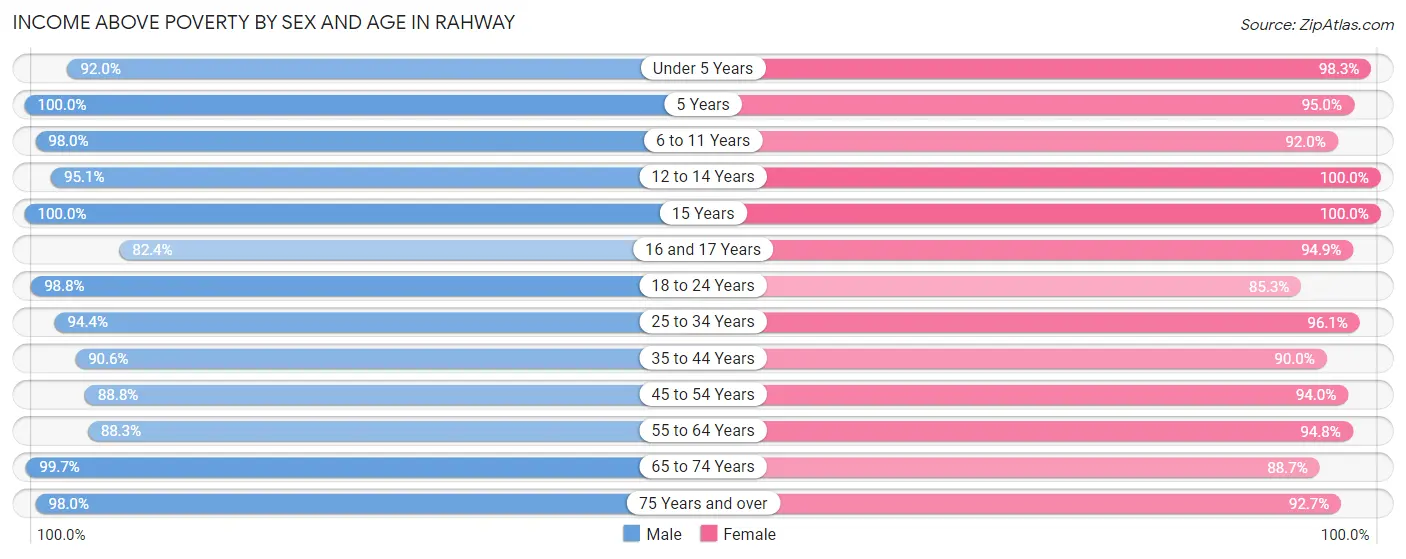
| Age Bracket | Male | Female |
| Under 5 Years | 1,051 (92.0%) | 1,008 (98.3%) |
| 5 Years | 114 (100.0%) | 248 (95.0%) |
| 6 to 11 Years | 1,032 (98.0%) | 738 (92.0%) |
| 12 to 14 Years | 483 (95.1%) | 295 (100.0%) |
| 15 Years | 300 (100.0%) | 73 (100.0%) |
| 16 and 17 Years | 220 (82.4%) | 187 (94.9%) |
| 18 to 24 Years | 1,362 (98.8%) | 914 (85.3%) |
| 25 to 34 Years | 2,094 (94.4%) | 2,422 (96.1%) |
| 35 to 44 Years | 1,668 (90.6%) | 1,500 (90.0%) |
| 45 to 54 Years | 1,950 (88.8%) | 2,068 (94.0%) |
| 55 to 64 Years | 1,543 (88.3%) | 1,809 (94.8%) |
| 65 to 74 Years | 883 (99.7%) | 1,478 (88.7%) |
| 75 Years and over | 622 (98.0%) | 1,428 (92.7%) |
| Total | 13,322 (93.2%) | 14,168 (93.0%) |
Income Below Poverty Among Married-Couple Families in Rahway
The poverty statistics for married-couple families in Rahway show that 1.9% or 96 of the total 4,915 families live below the poverty line. Families with 1 or 2 children have the highest poverty rate of 3.3%, comprising of 66 families. On the other hand, families with no children have the lowest poverty rate of 0.7%, which includes 19 families.
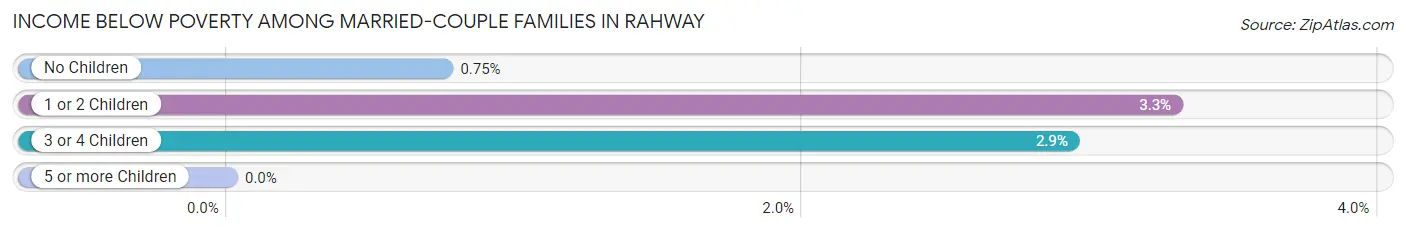
| Children | Above Poverty | Below Poverty |
| No Children | 2,512 (99.3%) | 19 (0.7%) |
| 1 or 2 Children | 1,942 (96.7%) | 66 (3.3%) |
| 3 or 4 Children | 365 (97.1%) | 11 (2.9%) |
| 5 or more Children | 0 (0.0%) | 0 (0.0%) |
| Total | 4,819 (98.1%) | 96 (1.9%) |
Income Below Poverty Among Single-Parent Households in Rahway
According to the poverty data in Rahway, 1.5% or 13 single-father households and 10.5% or 207 single-mother households are living below the poverty line. Among single-father households, those with 3 or 4 children have the highest poverty rate, with 13 households (100.0%) experiencing poverty. Likewise, among single-mother households, those with no children have the highest poverty rate, with 128 households (11.9%) falling below the poverty line.
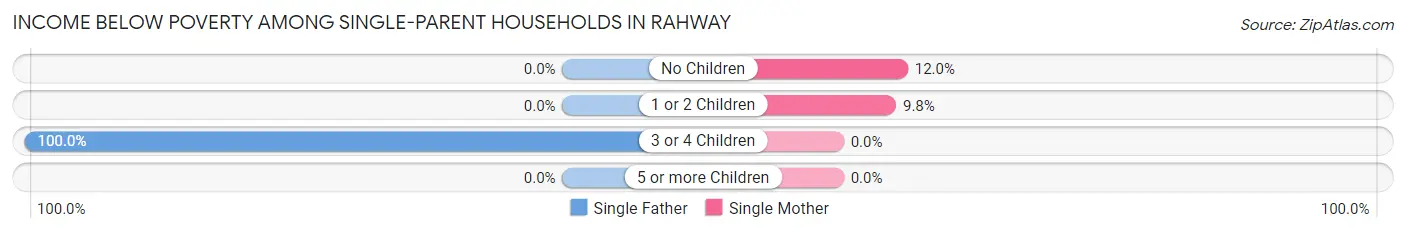
| Children | Single Father | Single Mother |
| No Children | 0 (0.0%) | 128 (11.9%) |
| 1 or 2 Children | 0 (0.0%) | 79 (9.8%) |
| 3 or 4 Children | 13 (100.0%) | 0 (0.0%) |
| 5 or more Children | 0 (0.0%) | 0 (0.0%) |
| Total | 13 (1.5%) | 207 (10.5%) |
Income Below Poverty Among Married-Couple vs Single-Parent Households in Rahway
The poverty data for Rahway shows that 96 of the married-couple family households (1.9%) and 220 of the single-parent households (7.8%) are living below the poverty level. Within the married-couple family households, those with 1 or 2 children have the highest poverty rate, with 66 households (3.3%) falling below the poverty line. Among the single-parent households, those with 3 or 4 children have the highest poverty rate, with 13 household (13.5%) living below poverty.
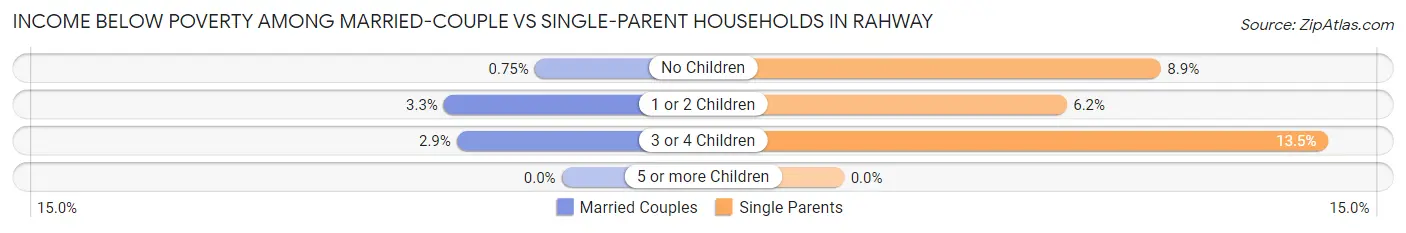
| Children | Married-Couple Families | Single-Parent Households |
| No Children | 19 (0.7%) | 128 (8.8%) |
| 1 or 2 Children | 66 (3.3%) | 79 (6.2%) |
| 3 or 4 Children | 11 (2.9%) | 13 (13.5%) |
| 5 or more Children | 0 (0.0%) | 0 (0.0%) |
| Total | 96 (1.9%) | 220 (7.8%) |
Employment Characteristics in Rahway
Employment by Class of Employer in Rahway
Among the 14,608 employed individuals in Rahway, private company employees (10,668 | 73.0%), local government employees (1,296 | 8.9%), and state government employees (978 | 6.7%) make up the most common classes of employment.
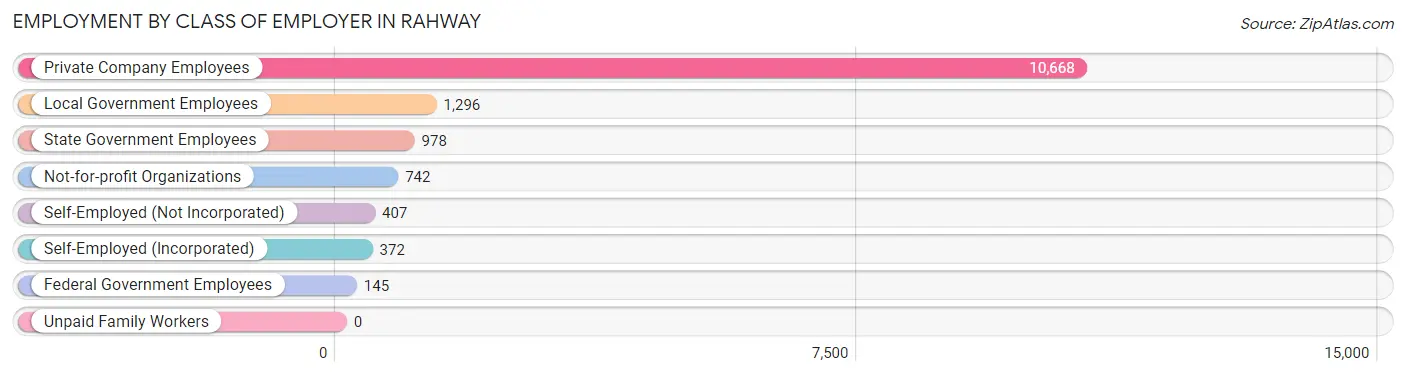
| Employer Class | # Employees | % Employees |
| Private Company Employees | 10,668 | 73.0% |
| Self-Employed (Incorporated) | 372 | 2.5% |
| Self-Employed (Not Incorporated) | 407 | 2.8% |
| Not-for-profit Organizations | 742 | 5.1% |
| Local Government Employees | 1,296 | 8.9% |
| State Government Employees | 978 | 6.7% |
| Federal Government Employees | 145 | 1.0% |
| Unpaid Family Workers | 0 | 0.0% |
| Total | 14,608 | 100.0% |
Employment Status by Age in Rahway
According to the labor force statistics for Rahway, out of the total population over 16 years of age (24,037), 67.9% or 16,321 individuals are in the labor force, with 8.3% or 1,355 of them unemployed. The age group with the highest labor force participation rate is 45 to 54 years, with 88.8% or 3,916 individuals in the labor force. Within the labor force, the 16 to 19 years age range has the highest percentage of unemployed individuals, with 24.0% or 71 of them being unemployed.
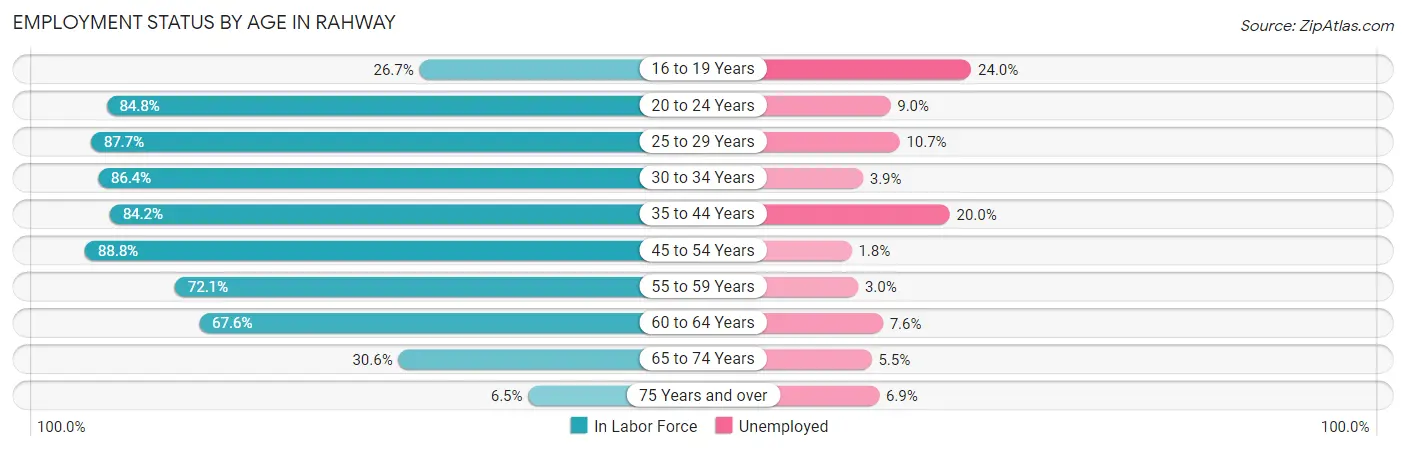
| Age Bracket | In Labor Force | Unemployed |
| 16 to 19 Years | 296 (26.7%) | 71 (24.0%) |
| 20 to 24 Years | 1,533 (84.8%) | 138 (9.0%) |
| 25 to 29 Years | 2,015 (87.7%) | 216 (10.7%) |
| 30 to 34 Years | 2,108 (86.4%) | 82 (3.9%) |
| 35 to 44 Years | 2,954 (84.2%) | 591 (20.0%) |
| 45 to 54 Years | 3,916 (88.8%) | 70 (1.8%) |
| 55 to 59 Years | 1,319 (72.1%) | 40 (3.0%) |
| 60 to 64 Years | 1,249 (67.6%) | 95 (7.6%) |
| 65 to 74 Years | 781 (30.6%) | 43 (5.5%) |
| 75 Years and over | 145 (6.5%) | 10 (6.9%) |
| Total | 16,321 (67.9%) | 1,355 (8.3%) |
Employment Status by Educational Attainment in Rahway
According to labor force statistics for Rahway, 83.0% of individuals (13,557) out of the total population between 25 and 64 years of age (16,334) are in the labor force, with 8.1% or 1,098 of them being unemployed. The group with the highest labor force participation rate are those with the educational attainment of bachelor's degree or higher, with 92.0% or 5,565 individuals in the labor force. Within the labor force, individuals with high school diploma education have the highest percentage of unemployment, with 20.9% or 723 of them being unemployed.
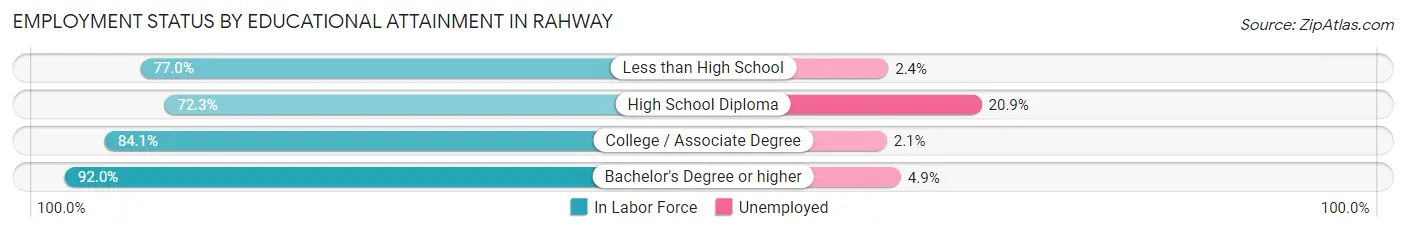
| Educational Attainment | In Labor Force | Unemployed |
| Less than High School | 993 (77.0%) | 31 (2.4%) |
| High School Diploma | 3,457 (72.3%) | 999 (20.9%) |
| College / Associate Degree | 3,544 (84.1%) | 88 (2.1%) |
| Bachelor's Degree or higher | 5,565 (92.0%) | 296 (4.9%) |
| Total | 13,557 (83.0%) | 1,323 (8.1%) |
Employment Occupations by Sex in Rahway
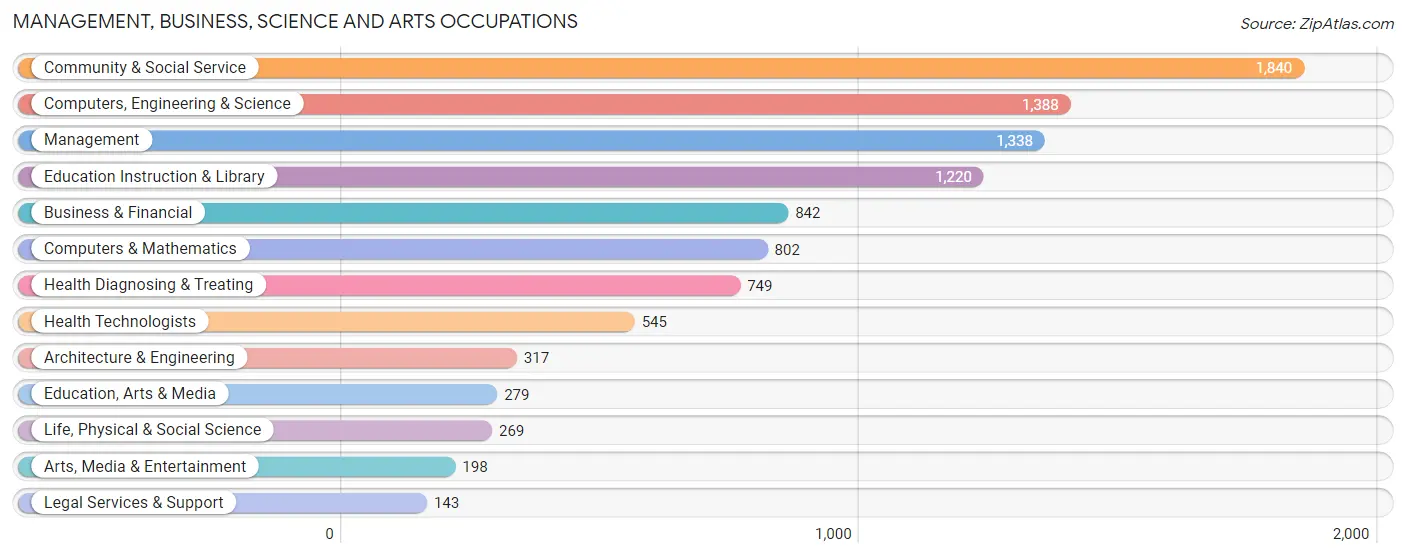
Management, Business, Science and Arts Occupations
The most common Management, Business, Science and Arts occupations in Rahway are Community & Social Service (1,840 | 12.3%), Computers, Engineering & Science (1,388 | 9.3%), Management (1,338 | 9.0%), Education Instruction & Library (1,220 | 8.2%), and Business & Financial (842 | 5.6%).
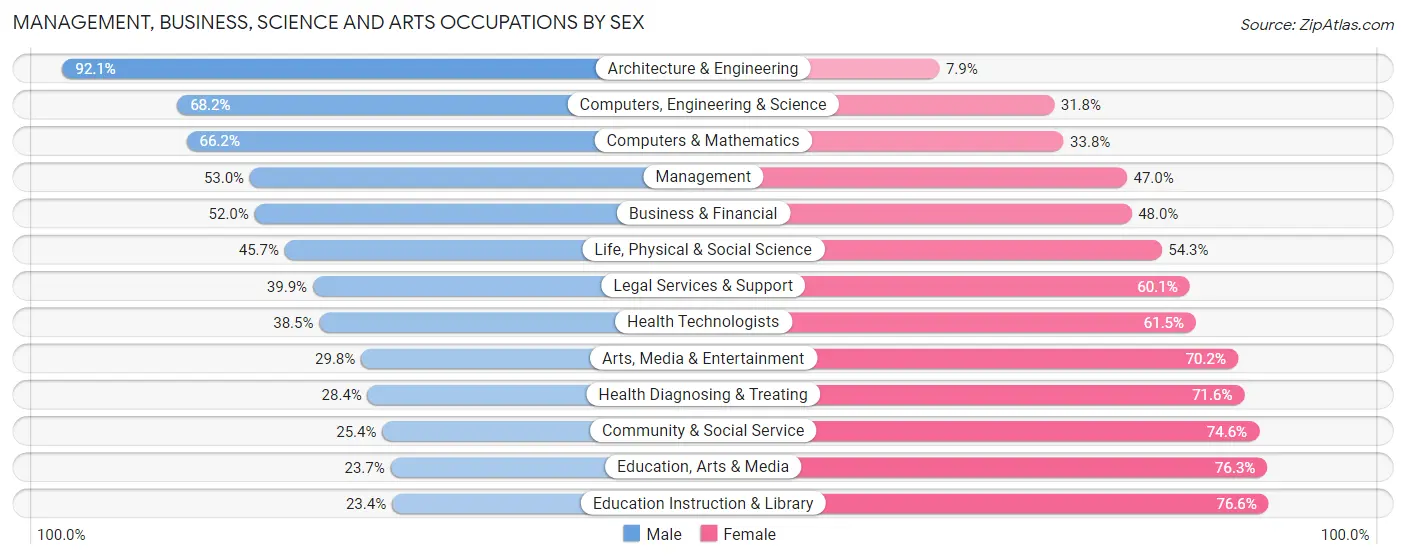
Management, Business, Science and Arts Occupations by Sex
Within the Management, Business, Science and Arts occupations in Rahway, the most male-oriented occupations are Architecture & Engineering (92.1%), Computers, Engineering & Science (68.2%), and Computers & Mathematics (66.2%), while the most female-oriented occupations are Education Instruction & Library (76.6%), Education, Arts & Media (76.3%), and Community & Social Service (74.6%).
| Occupation | Male | Female |
| Management | 709 (53.0%) | 629 (47.0%) |
| Business & Financial | 438 (52.0%) | 404 (48.0%) |
| Computers, Engineering & Science | 946 (68.2%) | 442 (31.8%) |
| Computers & Mathematics | 531 (66.2%) | 271 (33.8%) |
| Architecture & Engineering | 292 (92.1%) | 25 (7.9%) |
| Life, Physical & Social Science | 123 (45.7%) | 146 (54.3%) |
| Community & Social Service | 467 (25.4%) | 1,373 (74.6%) |
| Education, Arts & Media | 66 (23.7%) | 213 (76.3%) |
| Legal Services & Support | 57 (39.9%) | 86 (60.1%) |
| Education Instruction & Library | 285 (23.4%) | 935 (76.6%) |
| Arts, Media & Entertainment | 59 (29.8%) | 139 (70.2%) |
| Health Diagnosing & Treating | 213 (28.4%) | 536 (71.6%) |
| Health Technologists | 210 (38.5%) | 335 (61.5%) |
| Total (Category) | 2,773 (45.0%) | 3,384 (55.0%) |
| Total (Overall) | 7,363 (49.3%) | 7,571 (50.7%) |
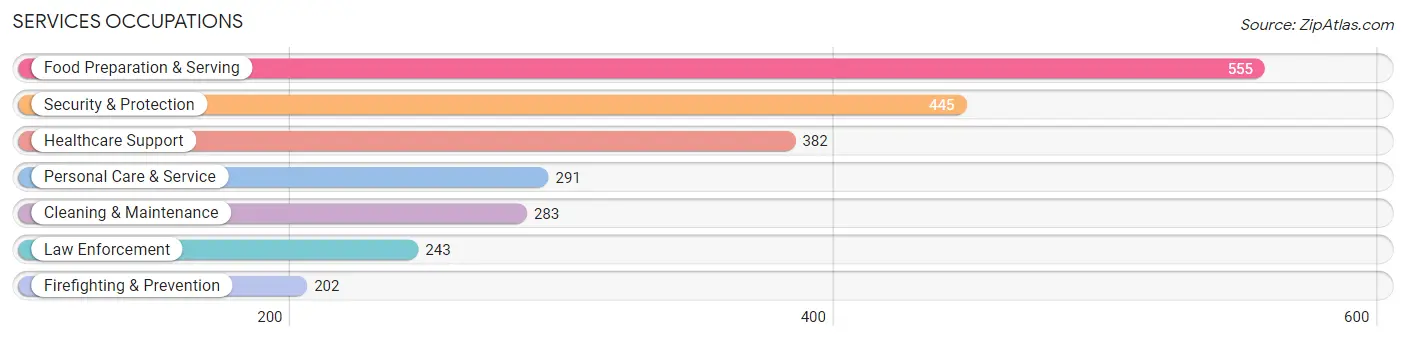
Services Occupations
The most common Services occupations in Rahway are Food Preparation & Serving (555 | 3.7%), Security & Protection (445 | 3.0%), Healthcare Support (382 | 2.6%), Personal Care & Service (291 | 1.9%), and Cleaning & Maintenance (283 | 1.9%).
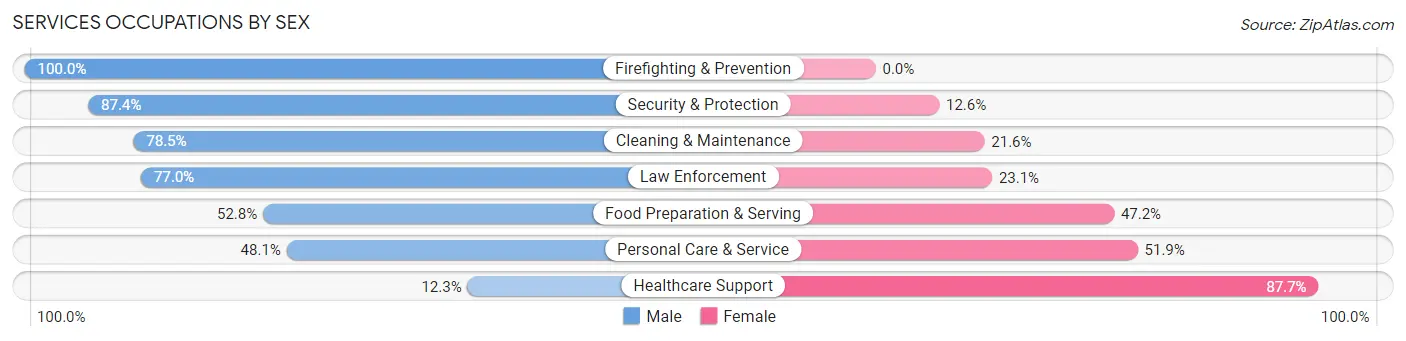
Services Occupations by Sex
Within the Services occupations in Rahway, the most male-oriented occupations are Firefighting & Prevention (100.0%), Security & Protection (87.4%), and Cleaning & Maintenance (78.4%), while the most female-oriented occupations are Healthcare Support (87.7%), Personal Care & Service (51.9%), and Food Preparation & Serving (47.2%).
| Occupation | Male | Female |
| Healthcare Support | 47 (12.3%) | 335 (87.7%) |
| Security & Protection | 389 (87.4%) | 56 (12.6%) |
| Firefighting & Prevention | 202 (100.0%) | 0 (0.0%) |
| Law Enforcement | 187 (76.9%) | 56 (23.1%) |
| Food Preparation & Serving | 293 (52.8%) | 262 (47.2%) |
| Cleaning & Maintenance | 222 (78.4%) | 61 (21.5%) |
| Personal Care & Service | 140 (48.1%) | 151 (51.9%) |
| Total (Category) | 1,091 (55.8%) | 865 (44.2%) |
| Total (Overall) | 7,363 (49.3%) | 7,571 (50.7%) |
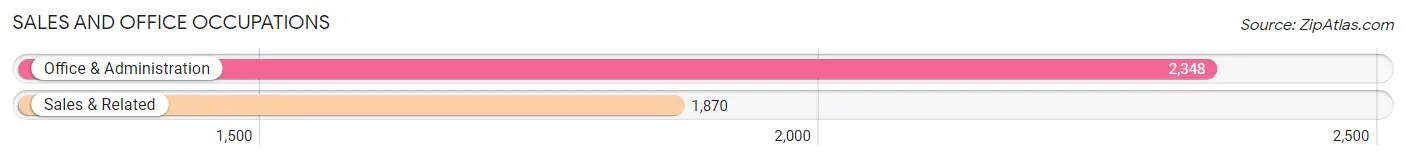
Sales and Office Occupations
The most common Sales and Office occupations in Rahway are Office & Administration (2,348 | 15.7%), and Sales & Related (1,870 | 12.5%).
Sales and Office Occupations by Sex
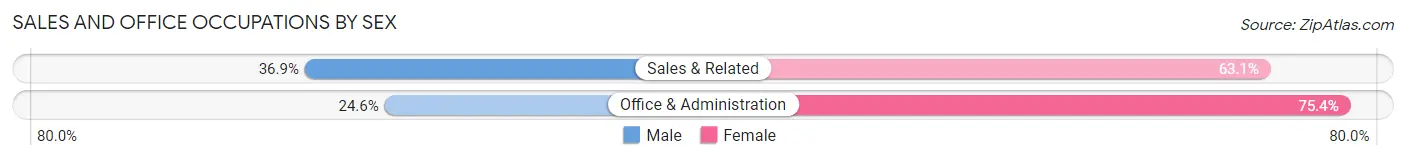
| Occupation | Male | Female |
| Sales & Related | 690 (36.9%) | 1,180 (63.1%) |
| Office & Administration | 578 (24.6%) | 1,770 (75.4%) |
| Total (Category) | 1,268 (30.1%) | 2,950 (69.9%) |
| Total (Overall) | 7,363 (49.3%) | 7,571 (50.7%) |
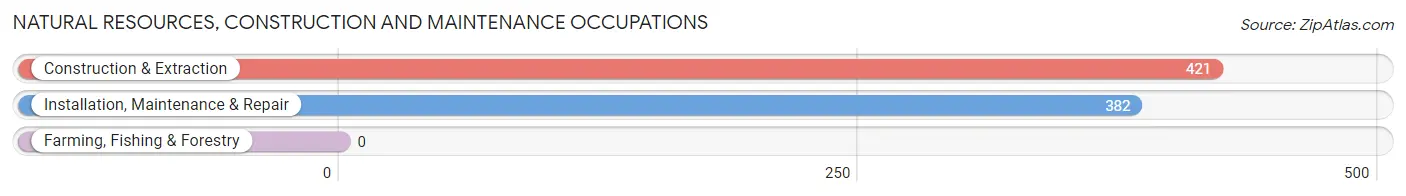
Natural Resources, Construction and Maintenance Occupations
The most common Natural Resources, Construction and Maintenance occupations in Rahway are Construction & Extraction (421 | 2.8%), and Installation, Maintenance & Repair (382 | 2.6%).
Natural Resources, Construction and Maintenance Occupations by Sex
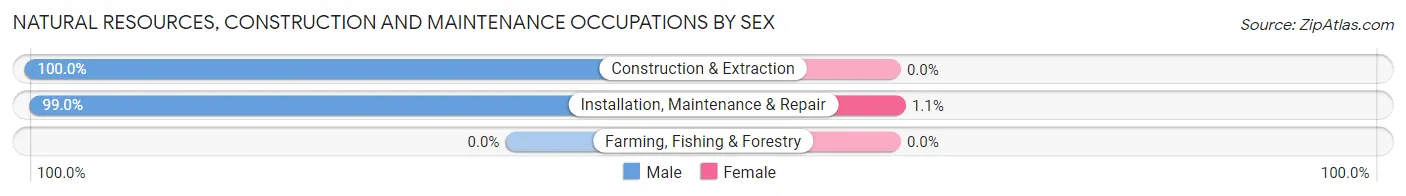
| Occupation | Male | Female |
| Farming, Fishing & Forestry | 0 (0.0%) | 0 (0.0%) |
| Construction & Extraction | 421 (100.0%) | 0 (0.0%) |
| Installation, Maintenance & Repair | 378 (99.0%) | 4 (1.1%) |
| Total (Category) | 799 (99.5%) | 4 (0.5%) |
| Total (Overall) | 7,363 (49.3%) | 7,571 (50.7%) |
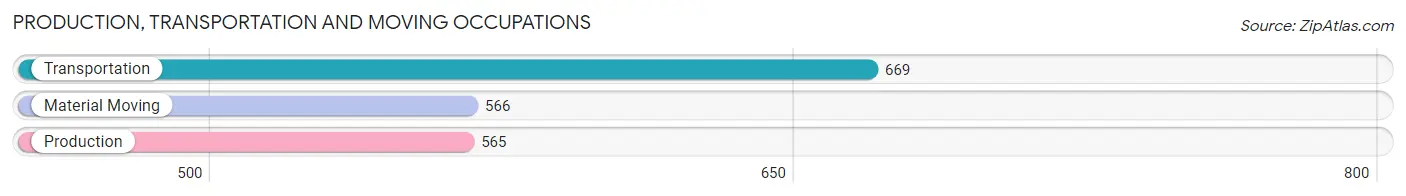
Production, Transportation and Moving Occupations
The most common Production, Transportation and Moving occupations in Rahway are Transportation (669 | 4.5%), Material Moving (566 | 3.8%), and Production (565 | 3.8%).
Production, Transportation and Moving Occupations by Sex
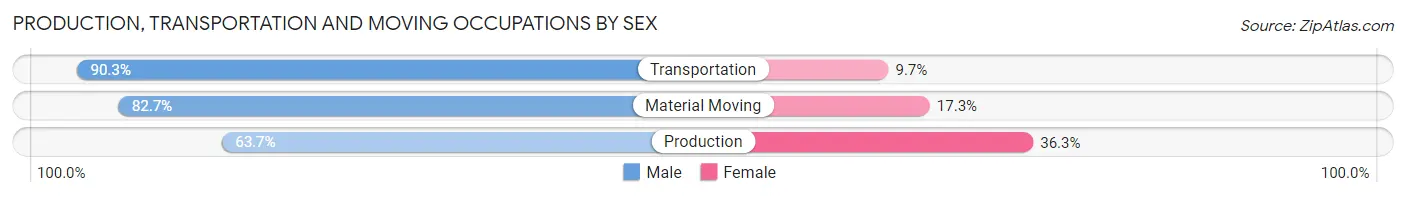
| Occupation | Male | Female |
| Production | 360 (63.7%) | 205 (36.3%) |
| Transportation | 604 (90.3%) | 65 (9.7%) |
| Material Moving | 468 (82.7%) | 98 (17.3%) |
| Total (Category) | 1,432 (79.6%) | 368 (20.4%) |
| Total (Overall) | 7,363 (49.3%) | 7,571 (50.7%) |
Employment Industries by Sex in Rahway
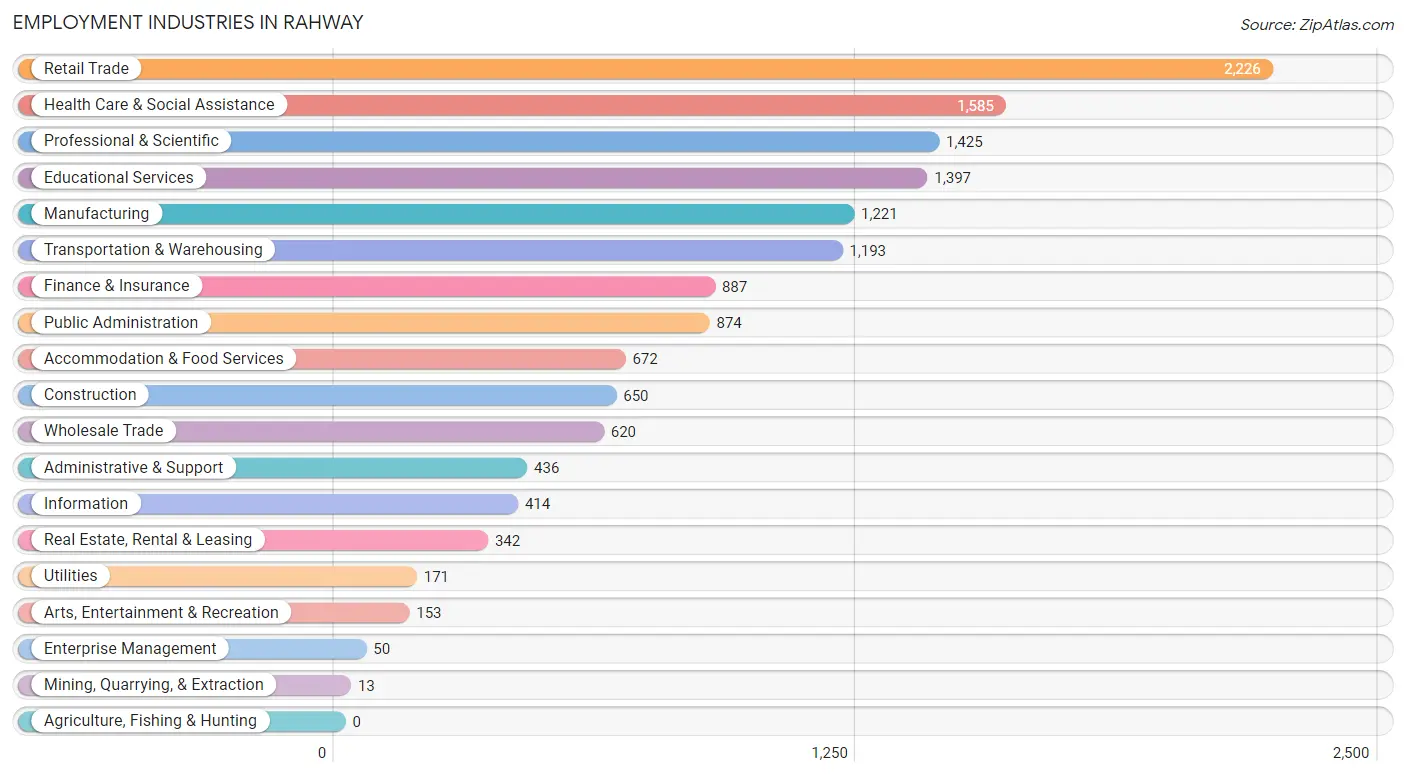
Employment Industries in Rahway
The major employment industries in Rahway include Retail Trade (2,226 | 14.9%), Health Care & Social Assistance (1,585 | 10.6%), Professional & Scientific (1,425 | 9.5%), Educational Services (1,397 | 9.3%), and Manufacturing (1,221 | 8.2%).
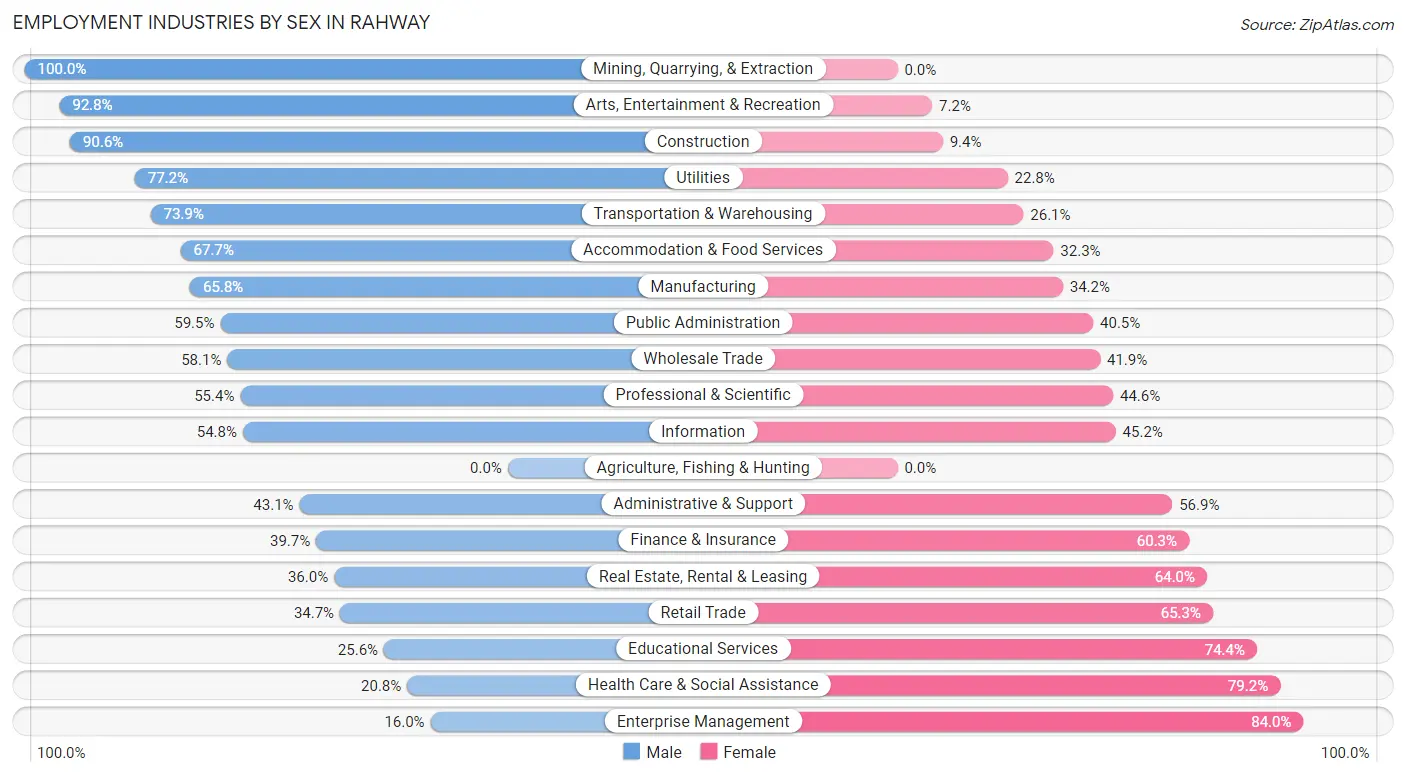
Employment Industries by Sex in Rahway
The Rahway industries that see more men than women are Mining, Quarrying, & Extraction (100.0%), Arts, Entertainment & Recreation (92.8%), and Construction (90.6%), whereas the industries that tend to have a higher number of women are Enterprise Management (84.0%), Health Care & Social Assistance (79.2%), and Educational Services (74.4%).
| Industry | Male | Female |
| Agriculture, Fishing & Hunting | 0 (0.0%) | 0 (0.0%) |
| Mining, Quarrying, & Extraction | 13 (100.0%) | 0 (0.0%) |
| Construction | 589 (90.6%) | 61 (9.4%) |
| Manufacturing | 803 (65.8%) | 418 (34.2%) |
| Wholesale Trade | 360 (58.1%) | 260 (41.9%) |
| Retail Trade | 773 (34.7%) | 1,453 (65.3%) |
| Transportation & Warehousing | 882 (73.9%) | 311 (26.1%) |
| Utilities | 132 (77.2%) | 39 (22.8%) |
| Information | 227 (54.8%) | 187 (45.2%) |
| Finance & Insurance | 352 (39.7%) | 535 (60.3%) |
| Real Estate, Rental & Leasing | 123 (36.0%) | 219 (64.0%) |
| Professional & Scientific | 789 (55.4%) | 636 (44.6%) |
| Enterprise Management | 8 (16.0%) | 42 (84.0%) |
| Administrative & Support | 188 (43.1%) | 248 (56.9%) |
| Educational Services | 358 (25.6%) | 1,039 (74.4%) |
| Health Care & Social Assistance | 330 (20.8%) | 1,255 (79.2%) |
| Arts, Entertainment & Recreation | 142 (92.8%) | 11 (7.2%) |
| Accommodation & Food Services | 455 (67.7%) | 217 (32.3%) |
| Public Administration | 520 (59.5%) | 354 (40.5%) |
| Total | 7,363 (49.3%) | 7,571 (50.7%) |
Education in Rahway
School Enrollment in Rahway
The most common levels of schooling among the 6,537 students in Rahway are college / undergraduate (1,862 | 28.5%), elementary school (1,204 | 18.4%), and middle school (1,065 | 16.3%).
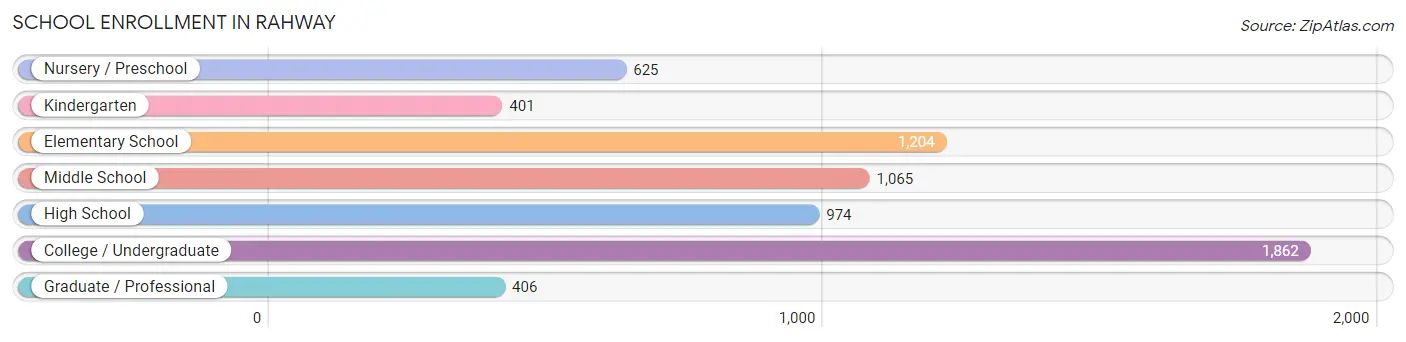
| School Level | # Students | % Students |
| Nursery / Preschool | 625 | 9.6% |
| Kindergarten | 401 | 6.1% |
| Elementary School | 1,204 | 18.4% |
| Middle School | 1,065 | 16.3% |
| High School | 974 | 14.9% |
| College / Undergraduate | 1,862 | 28.5% |
| Graduate / Professional | 406 | 6.2% |
| Total | 6,537 | 100.0% |
School Enrollment by Age by Funding Source in Rahway
Out of a total of 6,537 students who are enrolled in schools in Rahway, 1,595 (24.4%) attend a private institution, while the remaining 4,942 (75.6%) are enrolled in public schools. The age group of 20 to 24 year olds has the highest likelihood of being enrolled in private schools, with 473 (53.6% in the age bracket) enrolled. Conversely, the age group of 10 to 14 year olds has the lowest likelihood of being enrolled in a private school, with 1,072 (87.7% in the age bracket) attending a public institution.
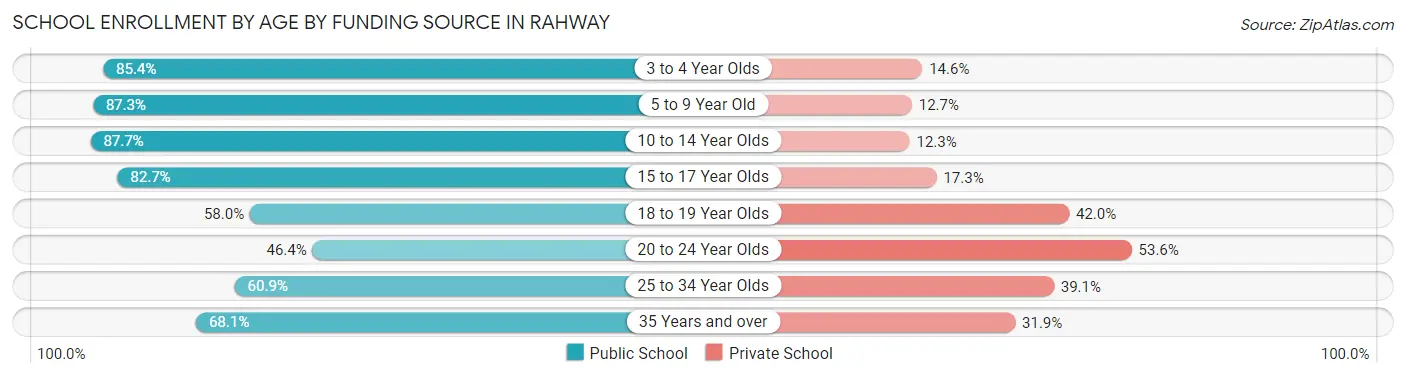
| Age Bracket | Public School | Private School |
| 3 to 4 Year Olds | 391 (85.4%) | 67 (14.6%) |
| 5 to 9 Year Old | 1,438 (87.3%) | 209 (12.7%) |
| 10 to 14 Year Olds | 1,072 (87.7%) | 150 (12.3%) |
| 15 to 17 Year Olds | 689 (82.7%) | 144 (17.3%) |
| 18 to 19 Year Olds | 322 (58.0%) | 233 (42.0%) |
| 20 to 24 Year Olds | 409 (46.4%) | 473 (53.6%) |
| 25 to 34 Year Olds | 168 (60.9%) | 108 (39.1%) |
| 35 Years and over | 452 (68.1%) | 212 (31.9%) |
| Total | 4,942 (75.6%) | 1,595 (24.4%) |
Educational Attainment by Field of Study in Rahway
Business (1,331 | 17.0%), computers & mathematics (860 | 11.0%), science & technology (847 | 10.8%), education (799 | 10.2%), and engineering (721 | 9.2%) are the most common fields of study among 7,847 individuals in Rahway who have obtained a bachelor's degree or higher.
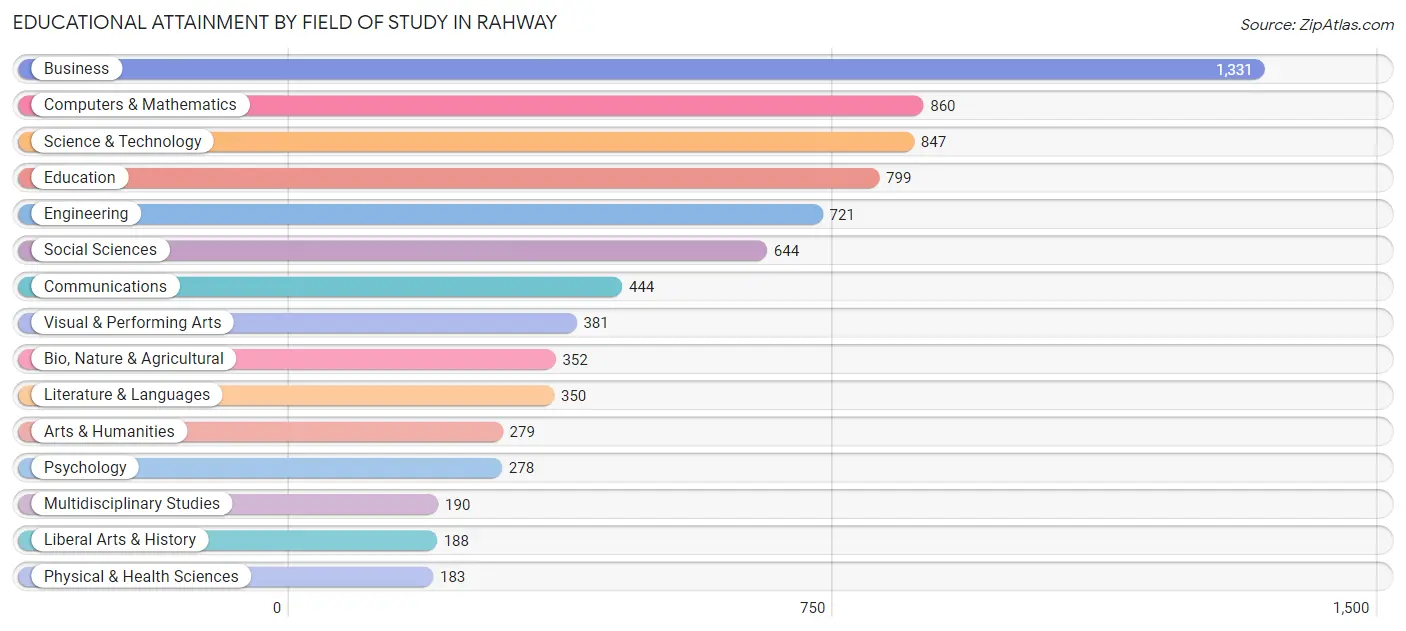
| Field of Study | # Graduates | % Graduates |
| Computers & Mathematics | 860 | 11.0% |
| Bio, Nature & Agricultural | 352 | 4.5% |
| Physical & Health Sciences | 183 | 2.3% |
| Psychology | 278 | 3.5% |
| Social Sciences | 644 | 8.2% |
| Engineering | 721 | 9.2% |
| Multidisciplinary Studies | 190 | 2.4% |
| Science & Technology | 847 | 10.8% |
| Business | 1,331 | 17.0% |
| Education | 799 | 10.2% |
| Literature & Languages | 350 | 4.5% |
| Liberal Arts & History | 188 | 2.4% |
| Visual & Performing Arts | 381 | 4.9% |
| Communications | 444 | 5.7% |
| Arts & Humanities | 279 | 3.6% |
| Total | 7,847 | 100.0% |
Transportation & Commute in Rahway
Vehicle Availability by Sex in Rahway
The most prevalent vehicle ownership categories in Rahway are males with 2 vehicles (3,470, accounting for 47.7%) and females with 2 vehicles (3,094, making up 47.4%).
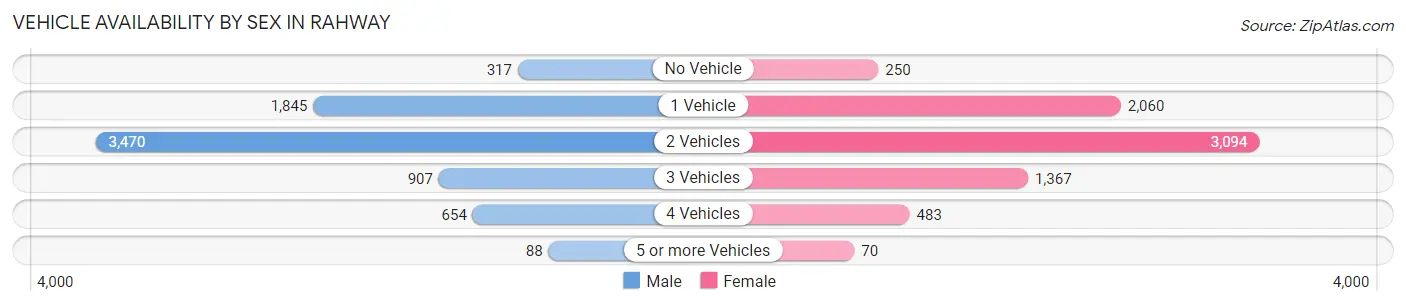
| Vehicles Available | Male | Female |
| No Vehicle | 317 (4.3%) | 250 (3.4%) |
| 1 Vehicle | 1,845 (25.3%) | 2,060 (28.1%) |
| 2 Vehicles | 3,470 (47.7%) | 3,094 (42.2%) |
| 3 Vehicles | 907 (12.5%) | 1,367 (18.7%) |
| 4 Vehicles | 654 (9.0%) | 483 (6.6%) |
| 5 or more Vehicles | 88 (1.2%) | 70 (1.0%) |
| Total | 7,281 (100.0%) | 7,324 (100.0%) |
Commute Time in Rahway
The most frequently occuring commute durations in Rahway are 30 to 34 minutes (1,882 commuters, 14.6%), 20 to 24 minutes (1,503 commuters, 11.6%), and 45 to 59 minutes (1,444 commuters, 11.2%).
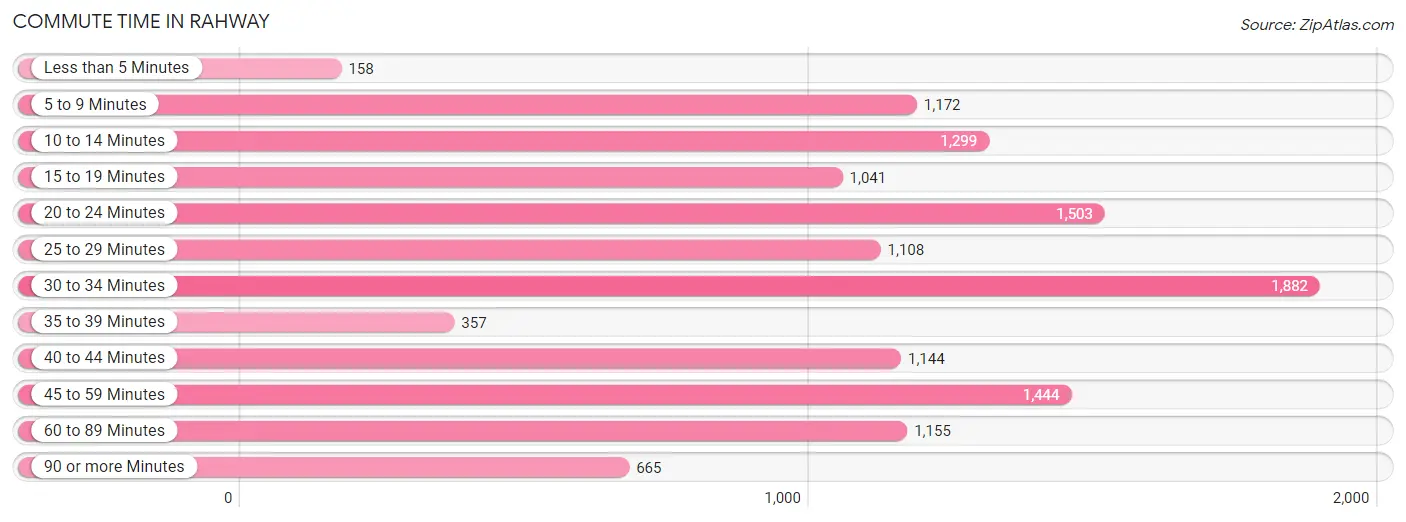
| Commute Time | # Commuters | % Commuters |
| Less than 5 Minutes | 158 | 1.2% |
| 5 to 9 Minutes | 1,172 | 9.1% |
| 10 to 14 Minutes | 1,299 | 10.1% |
| 15 to 19 Minutes | 1,041 | 8.1% |
| 20 to 24 Minutes | 1,503 | 11.6% |
| 25 to 29 Minutes | 1,108 | 8.6% |
| 30 to 34 Minutes | 1,882 | 14.6% |
| 35 to 39 Minutes | 357 | 2.8% |
| 40 to 44 Minutes | 1,144 | 8.8% |
| 45 to 59 Minutes | 1,444 | 11.2% |
| 60 to 89 Minutes | 1,155 | 8.9% |
| 90 or more Minutes | 665 | 5.1% |
Commute Time by Sex in Rahway
The most common commute times in Rahway are 30 to 34 minutes (1,057 commuters, 15.9%) for males and 30 to 34 minutes (825 commuters, 13.2%) for females.
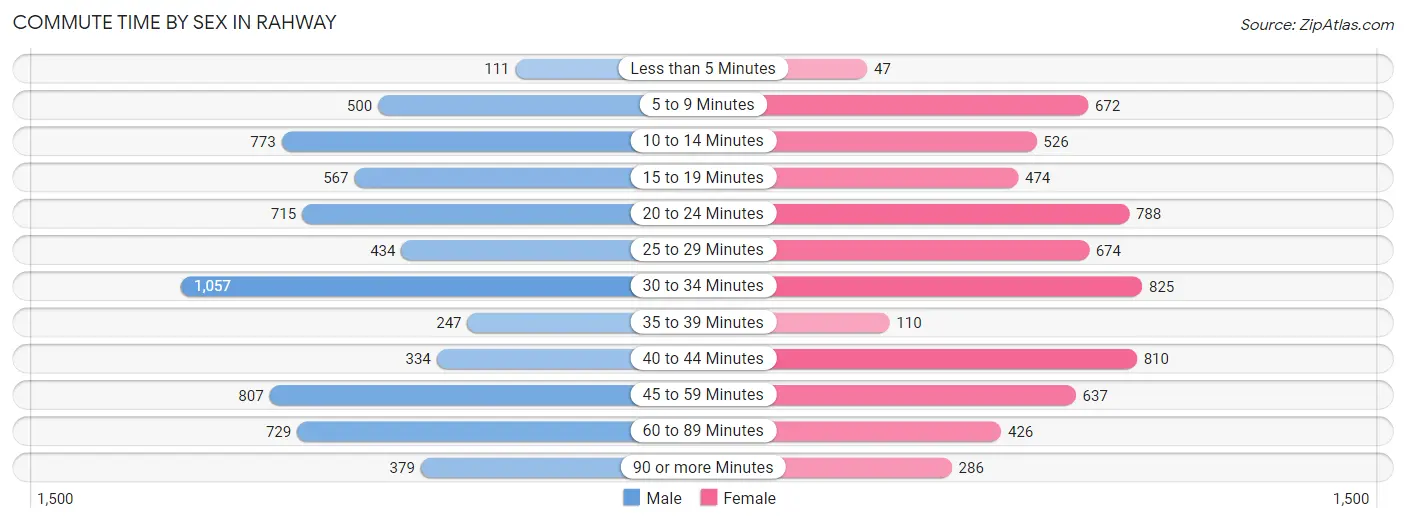
| Commute Time | Male | Female |
| Less than 5 Minutes | 111 (1.7%) | 47 (0.7%) |
| 5 to 9 Minutes | 500 (7.5%) | 672 (10.7%) |
| 10 to 14 Minutes | 773 (11.6%) | 526 (8.4%) |
| 15 to 19 Minutes | 567 (8.5%) | 474 (7.5%) |
| 20 to 24 Minutes | 715 (10.7%) | 788 (12.6%) |
| 25 to 29 Minutes | 434 (6.5%) | 674 (10.7%) |
| 30 to 34 Minutes | 1,057 (15.9%) | 825 (13.2%) |
| 35 to 39 Minutes | 247 (3.7%) | 110 (1.8%) |
| 40 to 44 Minutes | 334 (5.0%) | 810 (12.9%) |
| 45 to 59 Minutes | 807 (12.1%) | 637 (10.2%) |
| 60 to 89 Minutes | 729 (11.0%) | 426 (6.8%) |
| 90 or more Minutes | 379 (5.7%) | 286 (4.6%) |
Time of Departure to Work by Sex in Rahway
The most frequent times of departure to work in Rahway are 7:30 AM to 7:59 AM (903, 13.6%) for males and 7:00 AM to 7:29 AM (1,383, 22.0%) for females.
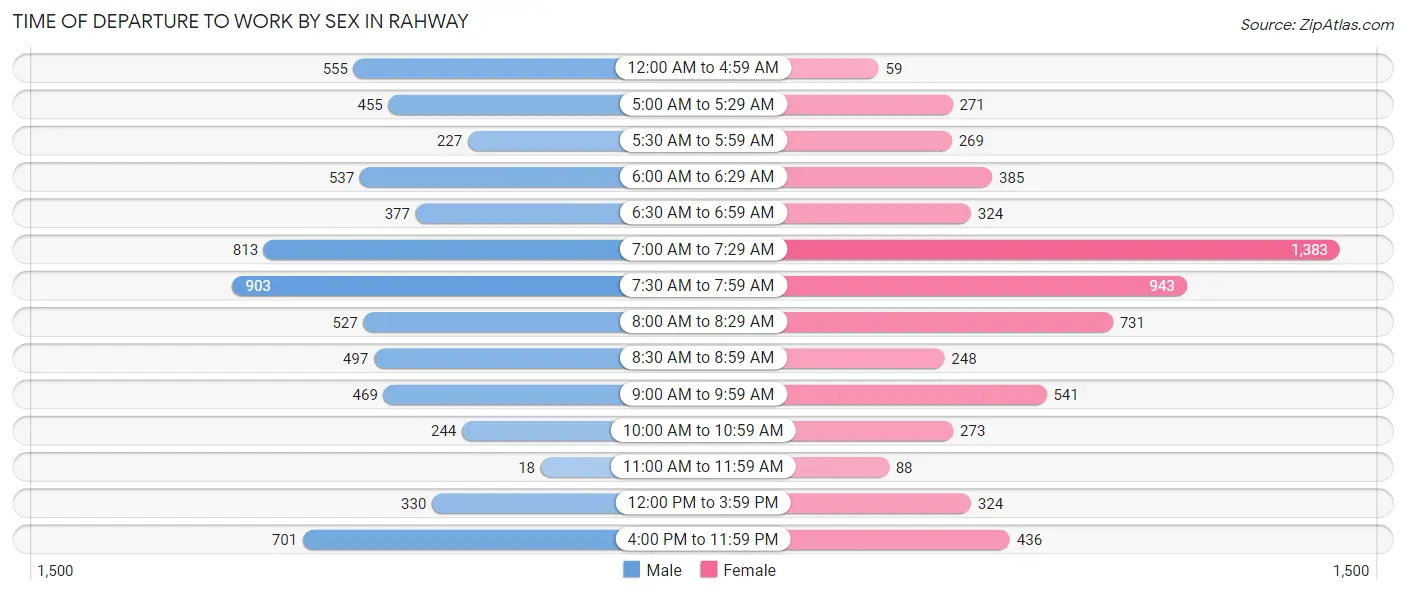
| Time of Departure | Male | Female |
| 12:00 AM to 4:59 AM | 555 (8.3%) | 59 (0.9%) |
| 5:00 AM to 5:29 AM | 455 (6.8%) | 271 (4.3%) |
| 5:30 AM to 5:59 AM | 227 (3.4%) | 269 (4.3%) |
| 6:00 AM to 6:29 AM | 537 (8.1%) | 385 (6.1%) |
| 6:30 AM to 6:59 AM | 377 (5.7%) | 324 (5.2%) |
| 7:00 AM to 7:29 AM | 813 (12.2%) | 1,383 (22.0%) |
| 7:30 AM to 7:59 AM | 903 (13.6%) | 943 (15.0%) |
| 8:00 AM to 8:29 AM | 527 (7.9%) | 731 (11.7%) |
| 8:30 AM to 8:59 AM | 497 (7.5%) | 248 (4.0%) |
| 9:00 AM to 9:59 AM | 469 (7.0%) | 541 (8.6%) |
| 10:00 AM to 10:59 AM | 244 (3.7%) | 273 (4.3%) |
| 11:00 AM to 11:59 AM | 18 (0.3%) | 88 (1.4%) |
| 12:00 PM to 3:59 PM | 330 (5.0%) | 324 (5.2%) |
| 4:00 PM to 11:59 PM | 701 (10.5%) | 436 (7.0%) |
| Total | 6,653 (100.0%) | 6,275 (100.0%) |
Housing Occupancy in Rahway
Occupancy by Ownership in Rahway
Of the total 12,079 dwellings in Rahway, owner-occupied units account for 6,655 (55.1%), while renter-occupied units make up 5,424 (44.9%).
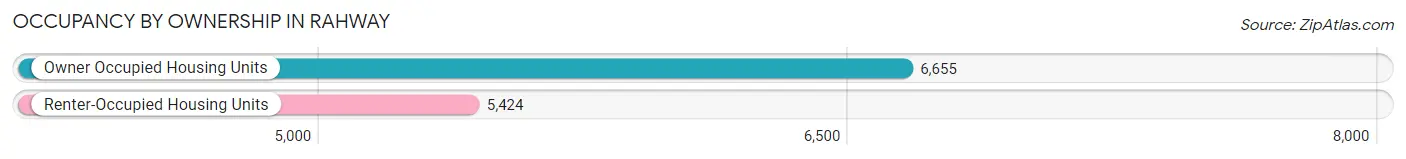
| Occupancy | # Housing Units | % Housing Units |
| Owner Occupied Housing Units | 6,655 | 55.1% |
| Renter-Occupied Housing Units | 5,424 | 44.9% |
| Total Occupied Housing Units | 12,079 | 100.0% |
Occupancy by Household Size in Rahway
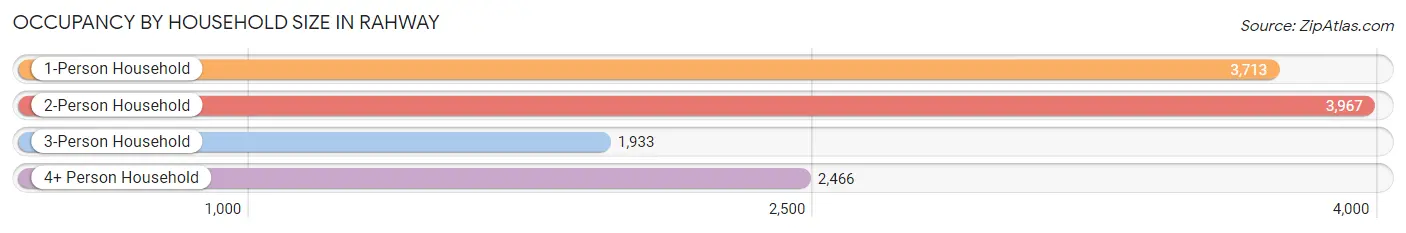
| Household Size | # Housing Units | % Housing Units |
| 1-Person Household | 3,713 | 30.7% |
| 2-Person Household | 3,967 | 32.8% |
| 3-Person Household | 1,933 | 16.0% |
| 4+ Person Household | 2,466 | 20.4% |
| Total Housing Units | 12,079 | 100.0% |
Occupancy by Ownership by Household Size in Rahway
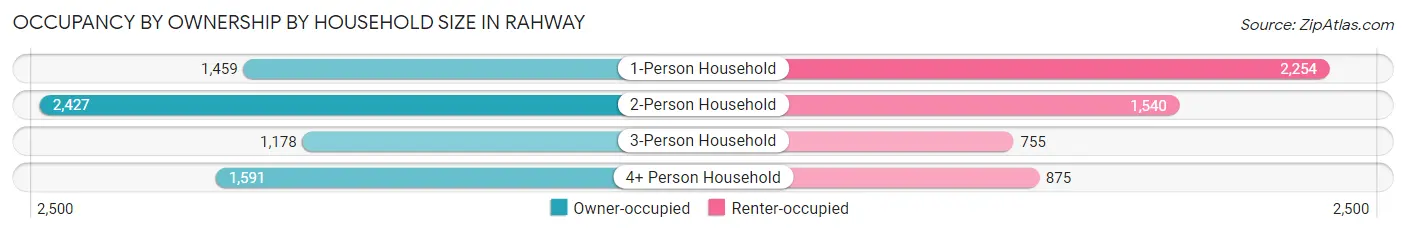
| Household Size | Owner-occupied | Renter-occupied |
| 1-Person Household | 1,459 (39.3%) | 2,254 (60.7%) |
| 2-Person Household | 2,427 (61.2%) | 1,540 (38.8%) |
| 3-Person Household | 1,178 (60.9%) | 755 (39.1%) |
| 4+ Person Household | 1,591 (64.5%) | 875 (35.5%) |
| Total Housing Units | 6,655 (55.1%) | 5,424 (44.9%) |
Occupancy by Educational Attainment in Rahway
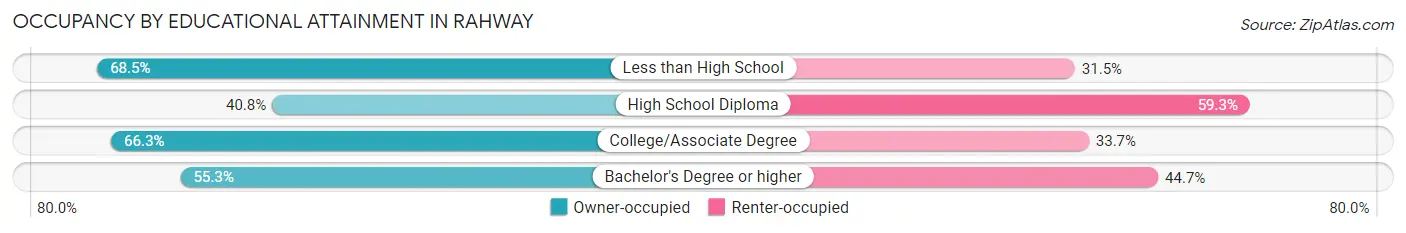
| Household Size | Owner-occupied | Renter-occupied |
| Less than High School | 643 (68.5%) | 296 (31.5%) |
| High School Diploma | 1,388 (40.7%) | 2,018 (59.3%) |
| College/Associate Degree | 2,106 (66.3%) | 1,072 (33.7%) |
| Bachelor's Degree or higher | 2,518 (55.3%) | 2,038 (44.7%) |
Occupancy by Age of Householder in Rahway
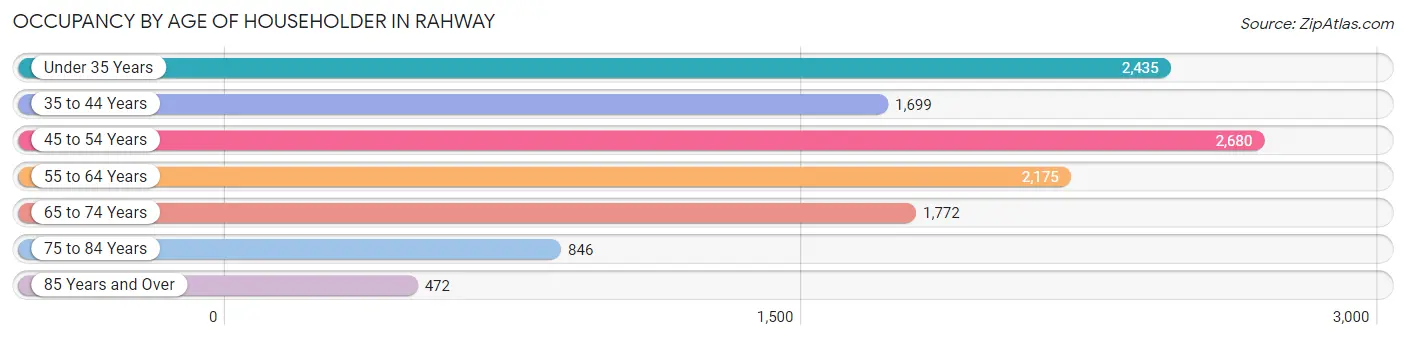
| Age Bracket | # Households | % Households |
| Under 35 Years | 2,435 | 20.2% |
| 35 to 44 Years | 1,699 | 14.1% |
| 45 to 54 Years | 2,680 | 22.2% |
| 55 to 64 Years | 2,175 | 18.0% |
| 65 to 74 Years | 1,772 | 14.7% |
| 75 to 84 Years | 846 | 7.0% |
| 85 Years and Over | 472 | 3.9% |
| Total | 12,079 | 100.0% |
Housing Finances in Rahway
Median Income by Occupancy in Rahway
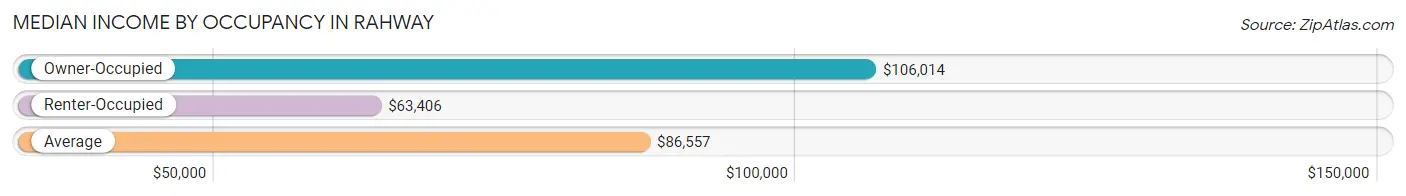
| Occupancy Type | # Households | Median Income |
| Owner-Occupied | 6,655 (55.1%) | $106,014 |
| Renter-Occupied | 5,424 (44.9%) | $63,406 |
| Average | 12,079 (100.0%) | $86,557 |
Occupancy by Householder Income Bracket in Rahway
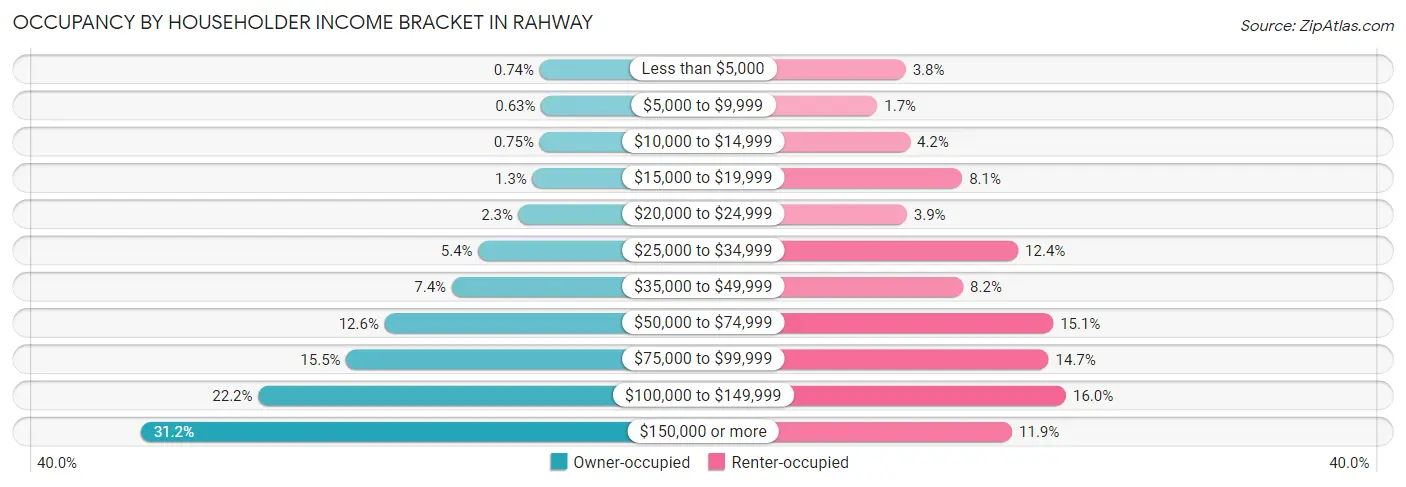
| Income Bracket | Owner-occupied | Renter-occupied |
| Less than $5,000 | 49 (0.7%) | 207 (3.8%) |
| $5,000 to $9,999 | 42 (0.6%) | 90 (1.7%) |
| $10,000 to $14,999 | 50 (0.7%) | 225 (4.2%) |
| $15,000 to $19,999 | 86 (1.3%) | 441 (8.1%) |
| $20,000 to $24,999 | 156 (2.3%) | 212 (3.9%) |
| $25,000 to $34,999 | 361 (5.4%) | 672 (12.4%) |
| $35,000 to $49,999 | 495 (7.4%) | 445 (8.2%) |
| $50,000 to $74,999 | 836 (12.6%) | 817 (15.1%) |
| $75,000 to $99,999 | 1,030 (15.5%) | 798 (14.7%) |
| $100,000 to $149,999 | 1,477 (22.2%) | 870 (16.0%) |
| $150,000 or more | 2,073 (31.1%) | 647 (11.9%) |
| Total | 6,655 (100.0%) | 5,424 (100.0%) |
Monthly Housing Cost Tiers in Rahway
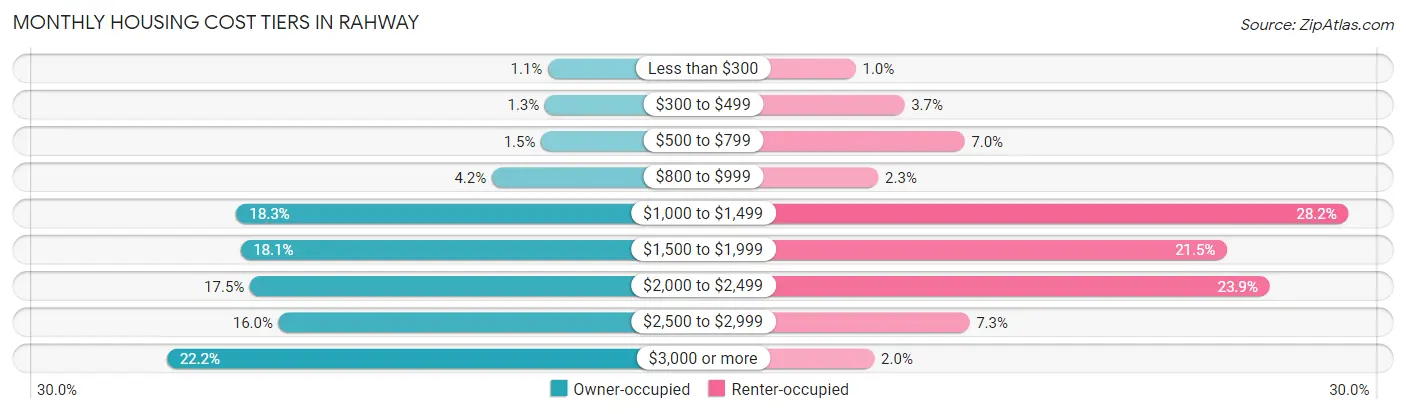
| Monthly Cost | Owner-occupied | Renter-occupied |
| Less than $300 | 72 (1.1%) | 54 (1.0%) |
| $300 to $499 | 83 (1.3%) | 200 (3.7%) |
| $500 to $799 | 97 (1.5%) | 380 (7.0%) |
| $800 to $999 | 278 (4.2%) | 122 (2.2%) |
| $1,000 to $1,499 | 1,218 (18.3%) | 1,531 (28.2%) |
| $1,500 to $1,999 | 1,204 (18.1%) | 1,168 (21.5%) |
| $2,000 to $2,499 | 1,167 (17.5%) | 1,295 (23.9%) |
| $2,500 to $2,999 | 1,062 (16.0%) | 395 (7.3%) |
| $3,000 or more | 1,474 (22.2%) | 110 (2.0%) |
| Total | 6,655 (100.0%) | 5,424 (100.0%) |
Physical Housing Characteristics in Rahway
Housing Structures in Rahway
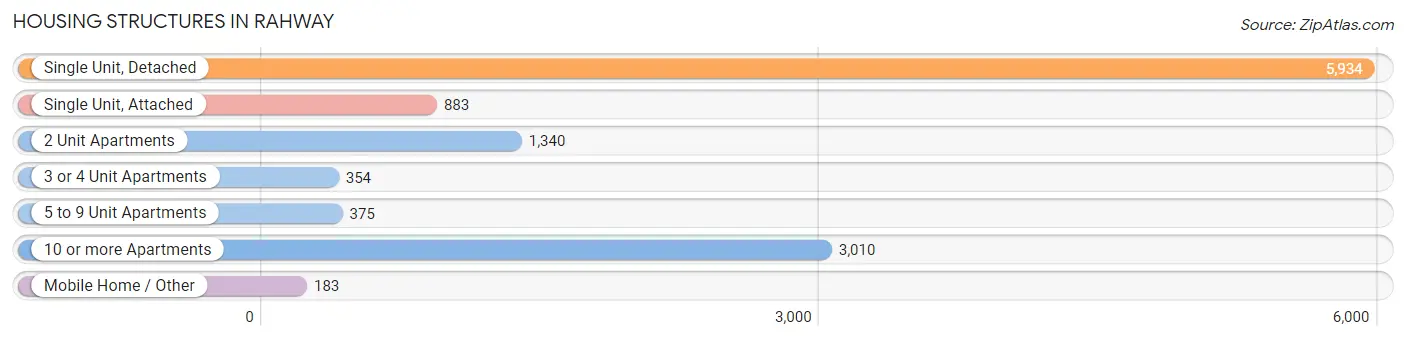
| Structure Type | # Housing Units | % Housing Units |
| Single Unit, Detached | 5,934 | 49.1% |
| Single Unit, Attached | 883 | 7.3% |
| 2 Unit Apartments | 1,340 | 11.1% |
| 3 or 4 Unit Apartments | 354 | 2.9% |
| 5 to 9 Unit Apartments | 375 | 3.1% |
| 10 or more Apartments | 3,010 | 24.9% |
| Mobile Home / Other | 183 | 1.5% |
| Total | 12,079 | 100.0% |
Housing Structures by Occupancy in Rahway
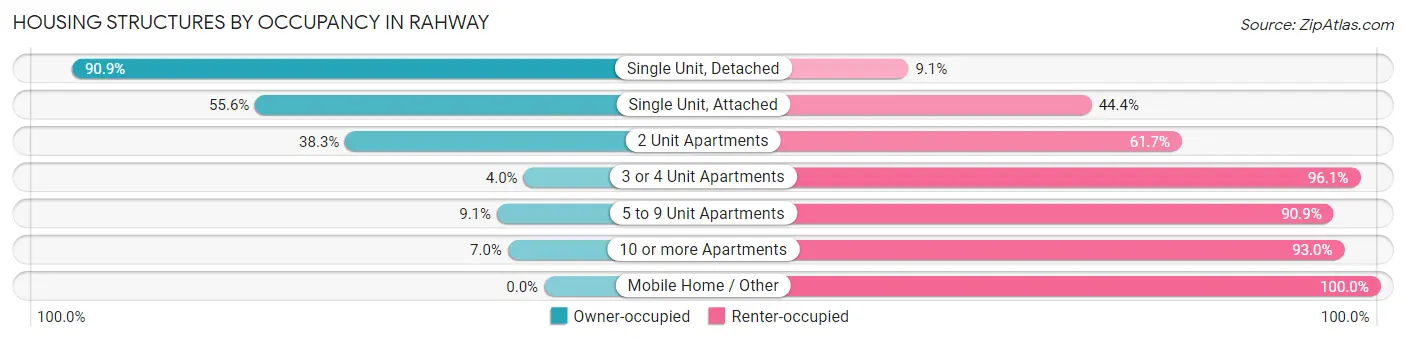
| Structure Type | Owner-occupied | Renter-occupied |
| Single Unit, Detached | 5,393 (90.9%) | 541 (9.1%) |
| Single Unit, Attached | 491 (55.6%) | 392 (44.4%) |
| 2 Unit Apartments | 513 (38.3%) | 827 (61.7%) |
| 3 or 4 Unit Apartments | 14 (4.0%) | 340 (96.1%) |
| 5 to 9 Unit Apartments | 34 (9.1%) | 341 (90.9%) |
| 10 or more Apartments | 210 (7.0%) | 2,800 (93.0%) |
| Mobile Home / Other | 0 (0.0%) | 183 (100.0%) |
| Total | 6,655 (55.1%) | 5,424 (44.9%) |
Housing Structures by Number of Rooms in Rahway
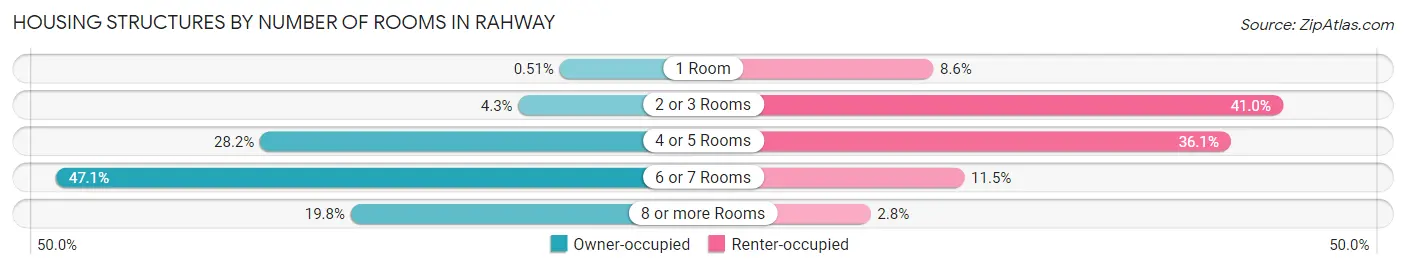
| Number of Rooms | Owner-occupied | Renter-occupied |
| 1 Room | 34 (0.5%) | 467 (8.6%) |
| 2 or 3 Rooms | 288 (4.3%) | 2,221 (40.9%) |
| 4 or 5 Rooms | 1,878 (28.2%) | 1,960 (36.1%) |
| 6 or 7 Rooms | 3,135 (47.1%) | 623 (11.5%) |
| 8 or more Rooms | 1,320 (19.8%) | 153 (2.8%) |
| Total | 6,655 (100.0%) | 5,424 (100.0%) |
Housing Structure by Heating Type in Rahway
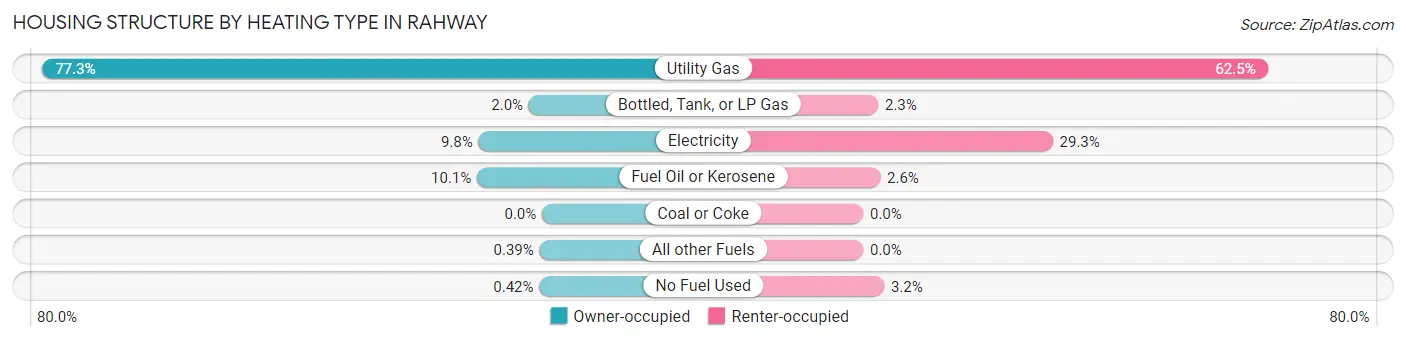
| Heating Type | Owner-occupied | Renter-occupied |
| Utility Gas | 5,142 (77.3%) | 3,391 (62.5%) |
| Bottled, Tank, or LP Gas | 136 (2.0%) | 126 (2.3%) |
| Electricity | 654 (9.8%) | 1,589 (29.3%) |
| Fuel Oil or Kerosene | 669 (10.1%) | 143 (2.6%) |
| Coal or Coke | 0 (0.0%) | 0 (0.0%) |
| All other Fuels | 26 (0.4%) | 0 (0.0%) |
| No Fuel Used | 28 (0.4%) | 175 (3.2%) |
| Total | 6,655 (100.0%) | 5,424 (100.0%) |
Household Vehicle Usage in Rahway
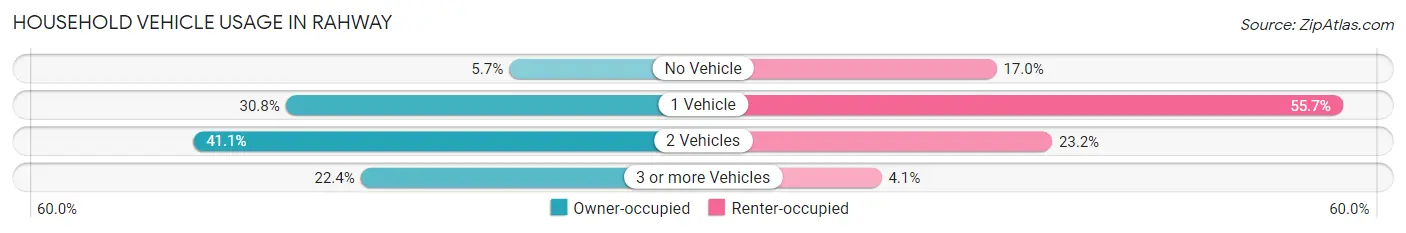
| Vehicles per Household | Owner-occupied | Renter-occupied |
| No Vehicle | 382 (5.7%) | 921 (17.0%) |
| 1 Vehicle | 2,048 (30.8%) | 3,023 (55.7%) |
| 2 Vehicles | 2,736 (41.1%) | 1,258 (23.2%) |
| 3 or more Vehicles | 1,489 (22.4%) | 222 (4.1%) |
| Total | 6,655 (100.0%) | 5,424 (100.0%) |
Real Estate & Mortgages in Rahway
Real Estate and Mortgage Overview in Rahway
| Characteristic | Without Mortgage | With Mortgage |
| Housing Units | 1,948 | 4,707 |
| Median Property Value | $343,000 | $343,200 |
| Median Household Income | $83,667 | $1,575 |
| Monthly Housing Costs | $1,266 | $1,444 |
| Real Estate Taxes | $10,001 | $43 |
Property Value by Mortgage Status in Rahway
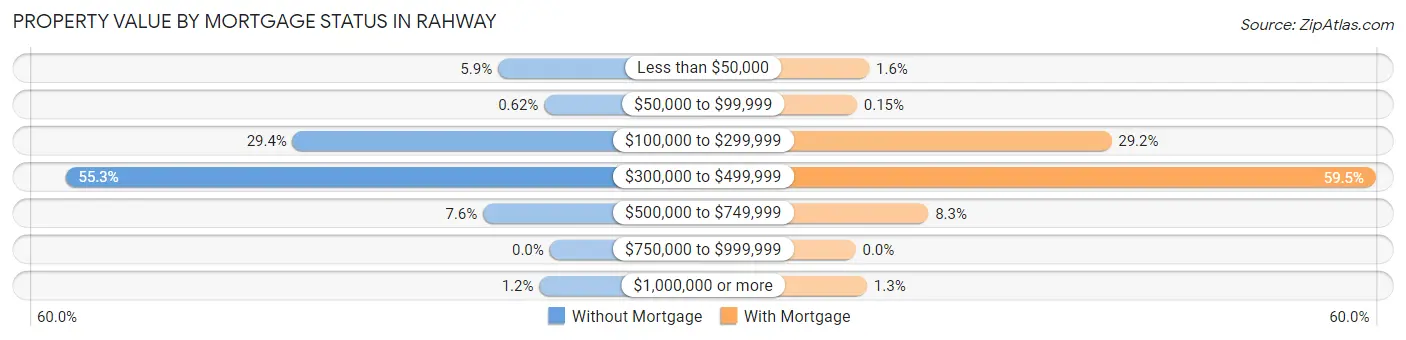
| Property Value | Without Mortgage | With Mortgage |
| Less than $50,000 | 115 (5.9%) | 73 (1.5%) |
| $50,000 to $99,999 | 12 (0.6%) | 7 (0.2%) |
| $100,000 to $299,999 | 572 (29.4%) | 1,376 (29.2%) |
| $300,000 to $499,999 | 1,078 (55.3%) | 2,799 (59.5%) |
| $500,000 to $749,999 | 148 (7.6%) | 391 (8.3%) |
| $750,000 to $999,999 | 0 (0.0%) | 0 (0.0%) |
| $1,000,000 or more | 23 (1.2%) | 61 (1.3%) |
| Total | 1,948 (100.0%) | 4,707 (100.0%) |
Household Income by Mortgage Status in Rahway
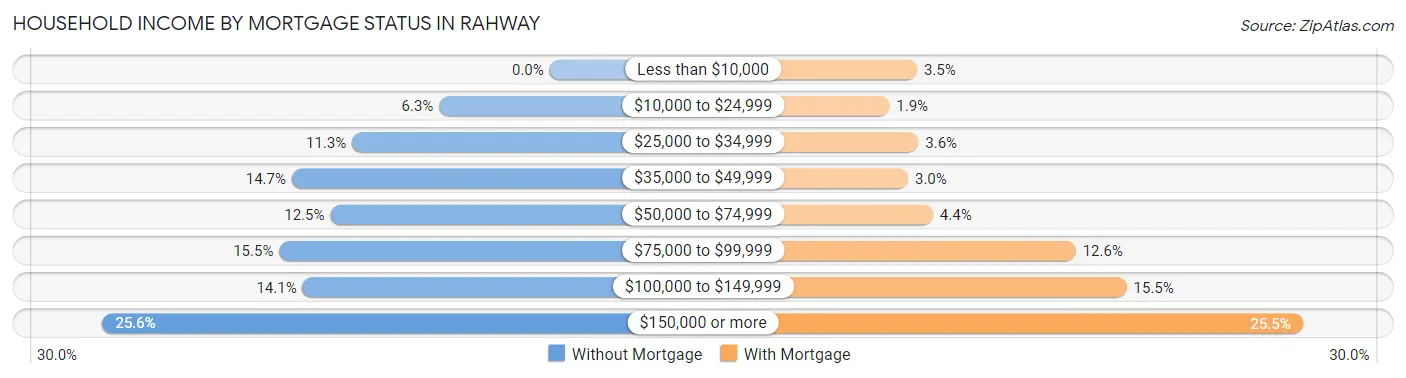
| Household Income | Without Mortgage | With Mortgage |
| Less than $10,000 | 0 (0.0%) | 165 (3.5%) |
| $10,000 to $24,999 | 123 (6.3%) | 91 (1.9%) |
| $25,000 to $34,999 | 220 (11.3%) | 169 (3.6%) |
| $35,000 to $49,999 | 287 (14.7%) | 141 (3.0%) |
| $50,000 to $74,999 | 244 (12.5%) | 208 (4.4%) |
| $75,000 to $99,999 | 301 (15.4%) | 592 (12.6%) |
| $100,000 to $149,999 | 275 (14.1%) | 729 (15.5%) |
| $150,000 or more | 498 (25.6%) | 1,202 (25.5%) |
| Total | 1,948 (100.0%) | 4,707 (100.0%) |
Property Value to Household Income Ratio in Rahway
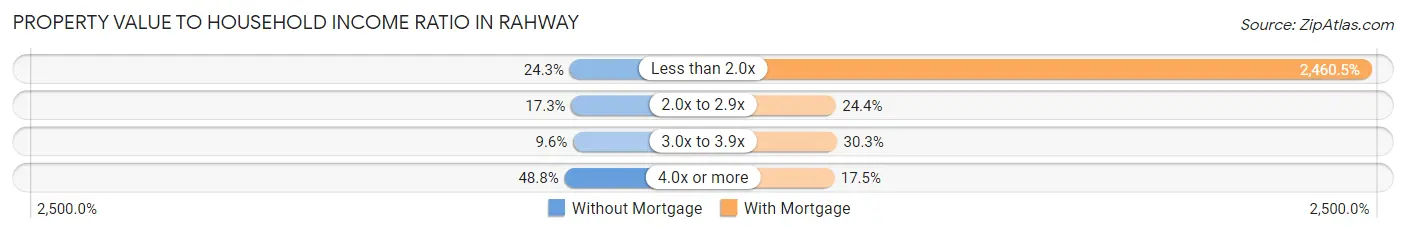
| Value-to-Income Ratio | Without Mortgage | With Mortgage |
| Less than 2.0x | 473 (24.3%) | 115,815 (2,460.5%) |
| 2.0x to 2.9x | 337 (17.3%) | 1,149 (24.4%) |
| 3.0x to 3.9x | 187 (9.6%) | 1,426 (30.3%) |
| 4.0x or more | 951 (48.8%) | 823 (17.5%) |
| Total | 1,948 (100.0%) | 4,707 (100.0%) |
Real Estate Taxes by Mortgage Status in Rahway
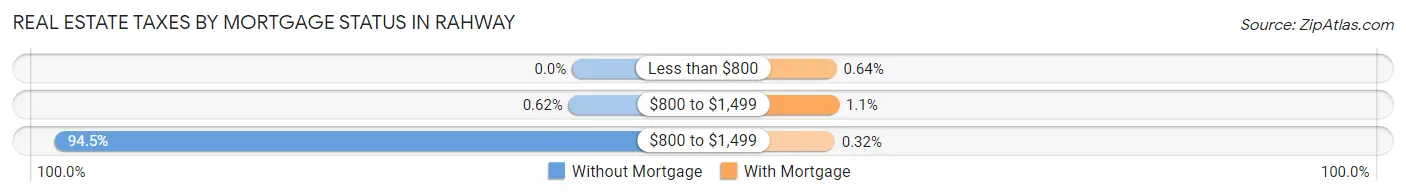
| Property Taxes | Without Mortgage | With Mortgage |
| Less than $800 | 0 (0.0%) | 30 (0.6%) |
| $800 to $1,499 | 12 (0.6%) | 51 (1.1%) |
| $800 to $1,499 | 1,840 (94.5%) | 15 (0.3%) |
| Total | 1,948 (100.0%) | 4,707 (100.0%) |
Health & Disability in Rahway
Health Insurance Coverage by Age in Rahway
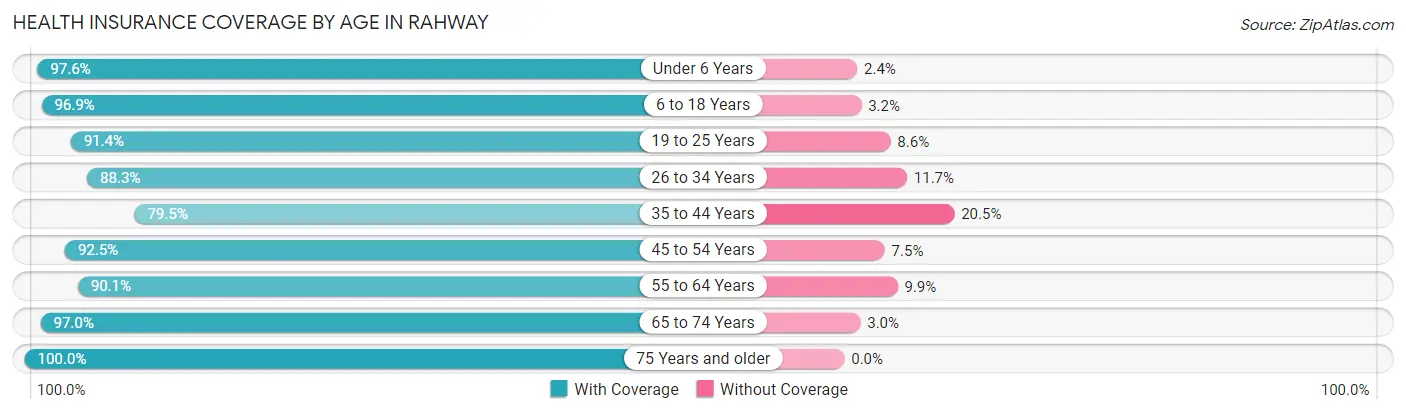
| Age Bracket | With Coverage | Without Coverage |
| Under 6 Years | 2,534 (97.6%) | 62 (2.4%) |
| 6 to 18 Years | 3,476 (96.9%) | 113 (3.2%) |
| 19 to 25 Years | 2,573 (91.4%) | 242 (8.6%) |
| 26 to 34 Years | 3,769 (88.3%) | 498 (11.7%) |
| 35 to 44 Years | 2,776 (79.5%) | 716 (20.5%) |
| 45 to 54 Years | 4,066 (92.5%) | 331 (7.5%) |
| 55 to 64 Years | 3,293 (90.1%) | 363 (9.9%) |
| 65 to 74 Years | 2,477 (97.0%) | 76 (3.0%) |
| 75 Years and older | 2,176 (100.0%) | 0 (0.0%) |
| Total | 27,140 (91.9%) | 2,401 (8.1%) |
Health Insurance Coverage by Citizenship Status in Rahway
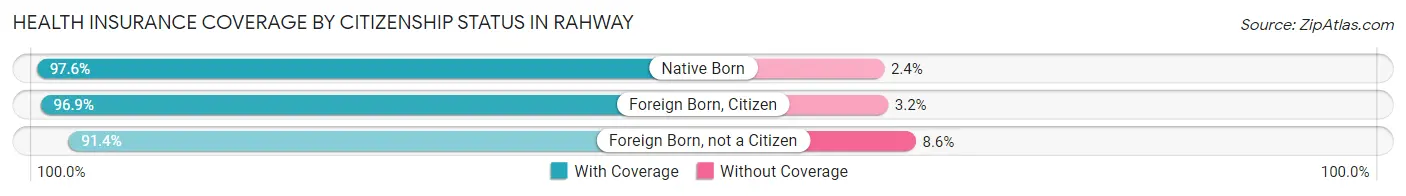
| Citizenship Status | With Coverage | Without Coverage |
| Native Born | 2,534 (97.6%) | 62 (2.4%) |
| Foreign Born, Citizen | 3,476 (96.9%) | 113 (3.2%) |
| Foreign Born, not a Citizen | 2,573 (91.4%) | 242 (8.6%) |
Health Insurance Coverage by Household Income in Rahway
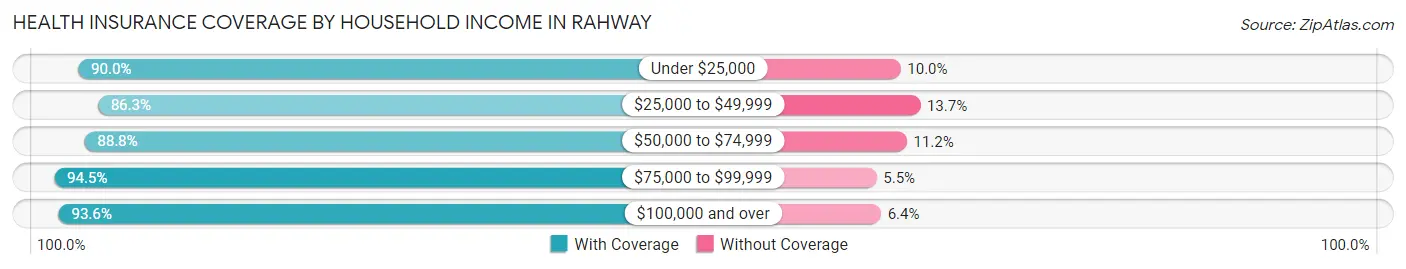
| Household Income | With Coverage | Without Coverage |
| Under $25,000 | 1,954 (90.0%) | 218 (10.0%) |
| $25,000 to $49,999 | 3,530 (86.3%) | 561 (13.7%) |
| $50,000 to $74,999 | 3,276 (88.8%) | 413 (11.2%) |
| $75,000 to $99,999 | 4,095 (94.5%) | 240 (5.5%) |
| $100,000 and over | 14,259 (93.6%) | 969 (6.4%) |
Public vs Private Health Insurance Coverage by Age in Rahway
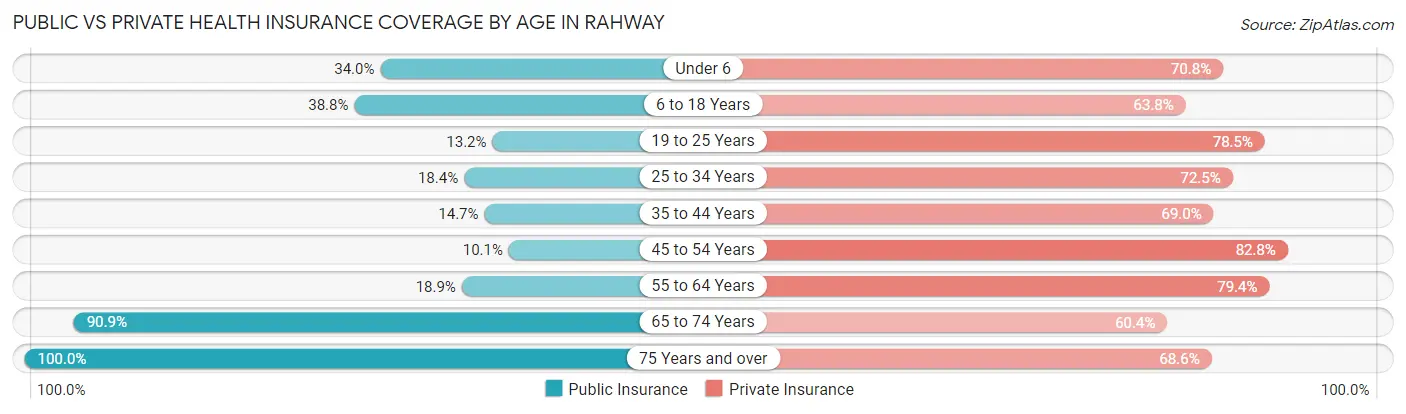
| Age Bracket | Public Insurance | Private Insurance |
| Under 6 | 882 (34.0%) | 1,837 (70.8%) |
| 6 to 18 Years | 1,393 (38.8%) | 2,290 (63.8%) |
| 19 to 25 Years | 371 (13.2%) | 2,210 (78.5%) |
| 25 to 34 Years | 787 (18.4%) | 3,095 (72.5%) |
| 35 to 44 Years | 512 (14.7%) | 2,409 (69.0%) |
| 45 to 54 Years | 445 (10.1%) | 3,639 (82.8%) |
| 55 to 64 Years | 690 (18.9%) | 2,901 (79.3%) |
| 65 to 74 Years | 2,320 (90.9%) | 1,542 (60.4%) |
| 75 Years and over | 2,176 (100.0%) | 1,493 (68.6%) |
| Total | 9,576 (32.4%) | 21,416 (72.5%) |
Disability Status by Sex by Age in Rahway
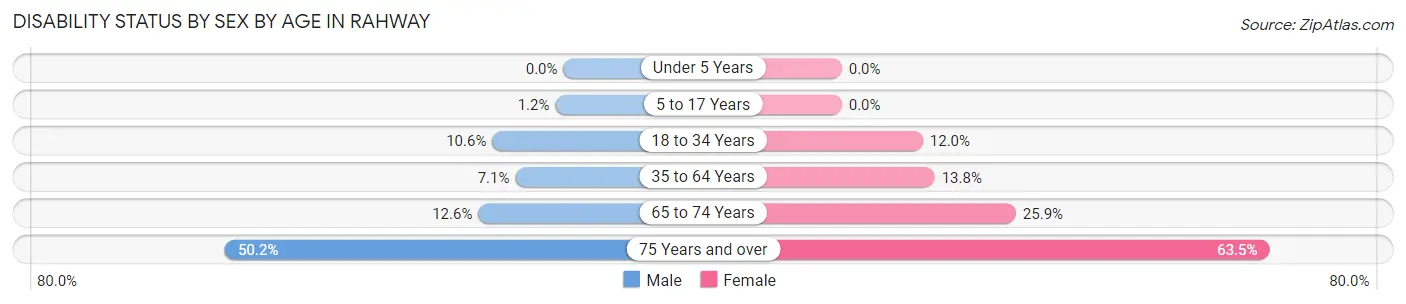
| Age Bracket | Male | Female |
| Under 5 Years | 0 (0.0%) | 0 (0.0%) |
| 5 to 17 Years | 27 (1.2%) | 0 (0.0%) |
| 18 to 34 Years | 380 (10.6%) | 431 (12.0%) |
| 35 to 64 Years | 412 (7.1%) | 797 (13.8%) |
| 65 to 74 Years | 112 (12.6%) | 431 (25.9%) |
| 75 Years and over | 319 (50.2%) | 978 (63.5%) |
Disability Class by Sex by Age in Rahway
Disability Class: Hearing Difficulty
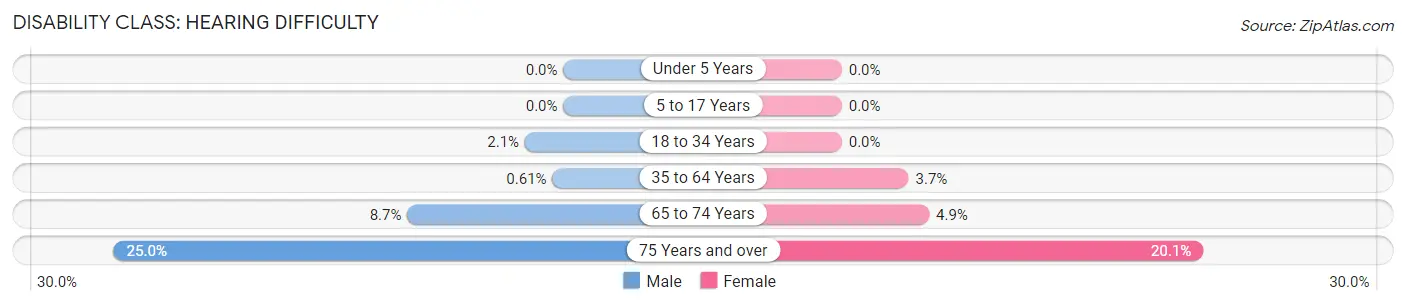
| Age Bracket | Male | Female |
| Under 5 Years | 0 (0.0%) | 0 (0.0%) |
| 5 to 17 Years | 0 (0.0%) | 0 (0.0%) |
| 18 to 34 Years | 77 (2.1%) | 0 (0.0%) |
| 35 to 64 Years | 35 (0.6%) | 215 (3.7%) |
| 65 to 74 Years | 77 (8.7%) | 81 (4.9%) |
| 75 Years and over | 159 (25.0%) | 310 (20.1%) |
Disability Class: Vision Difficulty
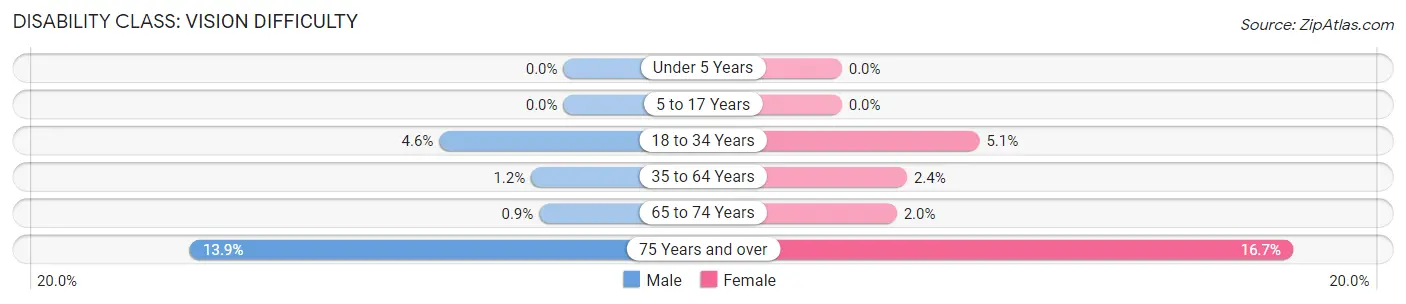
| Age Bracket | Male | Female |
| Under 5 Years | 0 (0.0%) | 0 (0.0%) |
| 5 to 17 Years | 0 (0.0%) | 0 (0.0%) |
| 18 to 34 Years | 166 (4.6%) | 183 (5.1%) |
| 35 to 64 Years | 69 (1.2%) | 140 (2.4%) |
| 65 to 74 Years | 8 (0.9%) | 34 (2.0%) |
| 75 Years and over | 88 (13.9%) | 258 (16.7%) |
Disability Class: Cognitive Difficulty
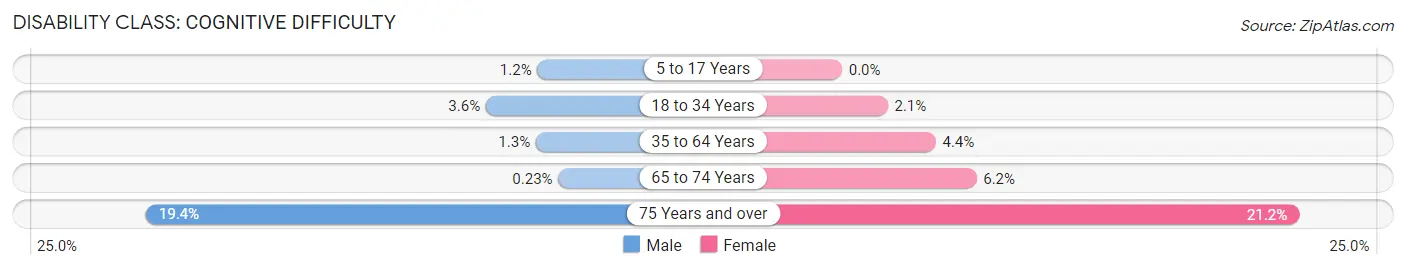
| Age Bracket | Male | Female |
| 5 to 17 Years | 27 (1.2%) | 0 (0.0%) |
| 18 to 34 Years | 129 (3.6%) | 76 (2.1%) |
| 35 to 64 Years | 73 (1.3%) | 251 (4.3%) |
| 65 to 74 Years | 2 (0.2%) | 104 (6.2%) |
| 75 Years and over | 123 (19.4%) | 327 (21.2%) |
Disability Class: Ambulatory Difficulty
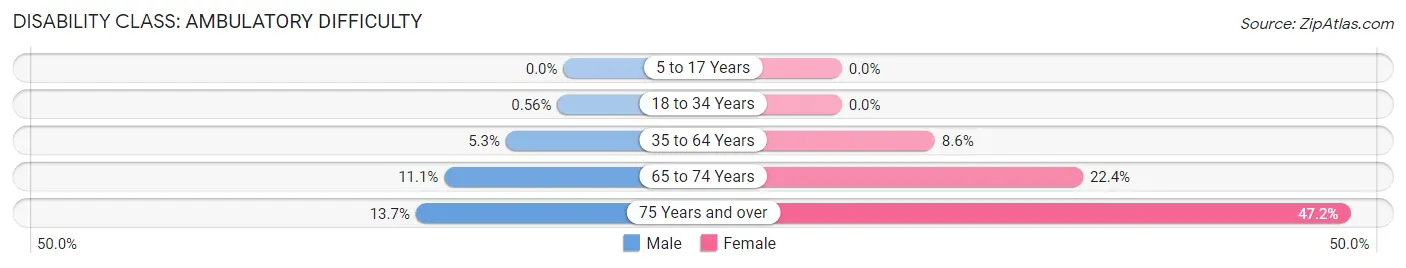
| Age Bracket | Male | Female |
| 5 to 17 Years | 0 (0.0%) | 0 (0.0%) |
| 18 to 34 Years | 20 (0.6%) | 0 (0.0%) |
| 35 to 64 Years | 308 (5.3%) | 499 (8.6%) |
| 65 to 74 Years | 98 (11.1%) | 373 (22.4%) |
| 75 Years and over | 87 (13.7%) | 727 (47.2%) |
Disability Class: Self-Care Difficulty
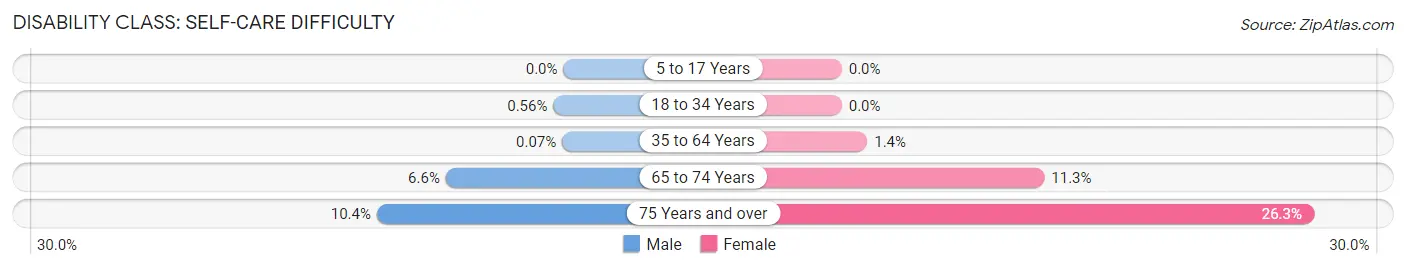
| Age Bracket | Male | Female |
| 5 to 17 Years | 0 (0.0%) | 0 (0.0%) |
| 18 to 34 Years | 20 (0.6%) | 0 (0.0%) |
| 35 to 64 Years | 4 (0.1%) | 82 (1.4%) |
| 65 to 74 Years | 58 (6.6%) | 188 (11.3%) |
| 75 Years and over | 66 (10.4%) | 405 (26.3%) |
Technology Access in Rahway
Computing Device Access in Rahway
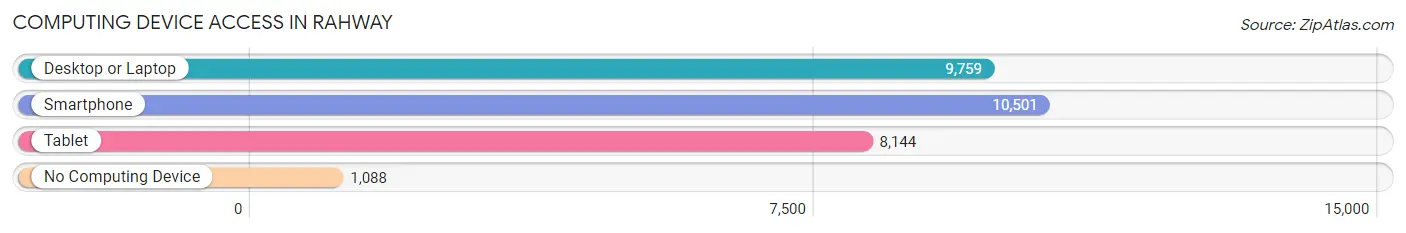
| Device Type | # Households | % Households |
| Desktop or Laptop | 9,759 | 80.8% |
| Smartphone | 10,501 | 86.9% |
| Tablet | 8,144 | 67.4% |
| No Computing Device | 1,088 | 9.0% |
| Total | 12,079 | 100.0% |
Internet Access in Rahway
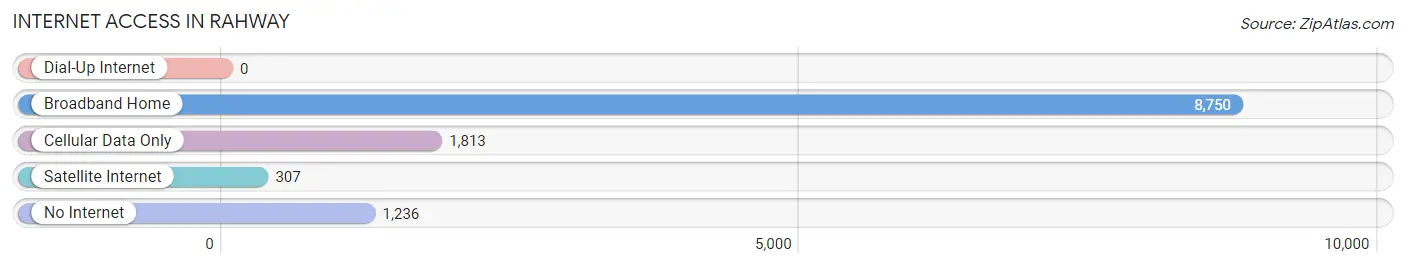
| Internet Type | # Households | % Households |
| Dial-Up Internet | 0 | 0.0% |
| Broadband Home | 8,750 | 72.4% |
| Cellular Data Only | 1,813 | 15.0% |
| Satellite Internet | 307 | 2.5% |
| No Internet | 1,236 | 10.2% |
| Total | 12,079 | 100.0% |
Rahway Summary
Rahway, NJ is a city located in Union County, New Jersey. It is situated along the Rahway River, which is a tributary of the Arthur Kill. The city is located approximately 25 miles southwest of New York City and is part of the New York metropolitan area. As of the 2010 United States Census, the city had a total population of 27,346.
History
The area that is now Rahway was originally inhabited by the Lenape Native Americans. The first European settlers arrived in the area in the late 17th century. The area was originally part of Elizabethtown, which was founded in 1664. In 1703, the area was incorporated as the Township of Rahway. The name Rahway is derived from the Lenape word “Raritan,” which means “river of the fork.”
In 1804, the Township of Rahway was divided into two parts, the Township of Rahway and the Township of Union. In 1858, the Township of Union was incorporated as the City of Rahway. The city was an important industrial center during the 19th and 20th centuries. It was home to several factories, including the Rahway Iron Works, which produced iron products for the Union Army during the Civil War.
Geography
Rahway is located at 40°33'25" North, 74°17'45" West (40.556944, -74.295833). According to the United States Census Bureau, the city has a total area of 5.2 square miles, all of which is land. The Rahway River runs through the city.
Economy
Rahway is a major industrial center. The city is home to several large companies, including Merck & Co., Inc., which has a large manufacturing facility in the city. Other major employers in the city include the Rahway Public Schools, the Rahway Hospital, and the Rahway Police Department.
Demographics
As of the 2010 United States Census, there were 27,346 people, 10,845 households, and 6,845 families residing in the city. The population density was 5,250.3 people per square mile. The racial makeup of the city was 54.2% White, 28.2% African American, 0.3% Native American, 8.2% Asian, 0.1% Pacific Islander, 5.2% from other races, and 3.0% from two or more races. Hispanic or Latino of any race were 15.3% of the population.
The median income for a household in the city was $50,945, and the median income for a family was $60,945. The per capita income for the city was $25,945. About 11.2% of families and 13.3% of the population were below the poverty line, including 18.2% of those under age 18 and 8.2% of those age 65 or over.
Common Questions
What is the Total Population of Rahway?
Total Population of Rahway is 29,664.
What is the Total Male Population of Rahway?
Total Male Population of Rahway is 14,347.
What is the Total Female Population of Rahway?
Total Female Population of Rahway is 15,317.
What is the Ratio of Males per 100 Females in Rahway?
There are 93.67 Males per 100 Females in Rahway.
What is the Ratio of Females per 100 Males in Rahway?
There are 106.76 Females per 100 Males in Rahway.
What is the Median Population Age in Rahway?
Median Population Age in Rahway is 39.3 Years.
What is the Average Family Size in Rahway
Average Family Size in Rahway is 3.1 People.
What is the Average Household Size in Rahway
Average Household Size in Rahway is 2.5 People.
What is Per Capita Income in Rahway?
Per Capita income in Rahway is $43,300.
What is the Median Family Income in Rahway?
Median Family Income in Rahway is $106,711.
What is the Median Household income in Rahway?
Median Household Income in Rahway is $86,557.
What is Income or Wage Gap in Rahway?
Income or Wage Gap in Rahway is 20.9%.
Women in Rahway earn 79.1 cents for every dollar earned by a man.
What is Inequality or Gini Index in Rahway?
Inequality or Gini Index in Rahway is 0.42.
How Large is the Labor Force in Rahway?
There are 16,321 People in the Labor Forcein in Rahway.
What is the Percentage of People in the Labor Force in Rahway?
67.9% of People are in the Labor Force in Rahway.
What is the Unemployment Rate in Rahway?
Unemployment Rate in Rahway is 8.3%.