Cities with the Highest Percentage of British West Indian Population in New Jersey
RELATED REPORTS & OPTIONS
British West Indian
New Jersey
Compare Cities
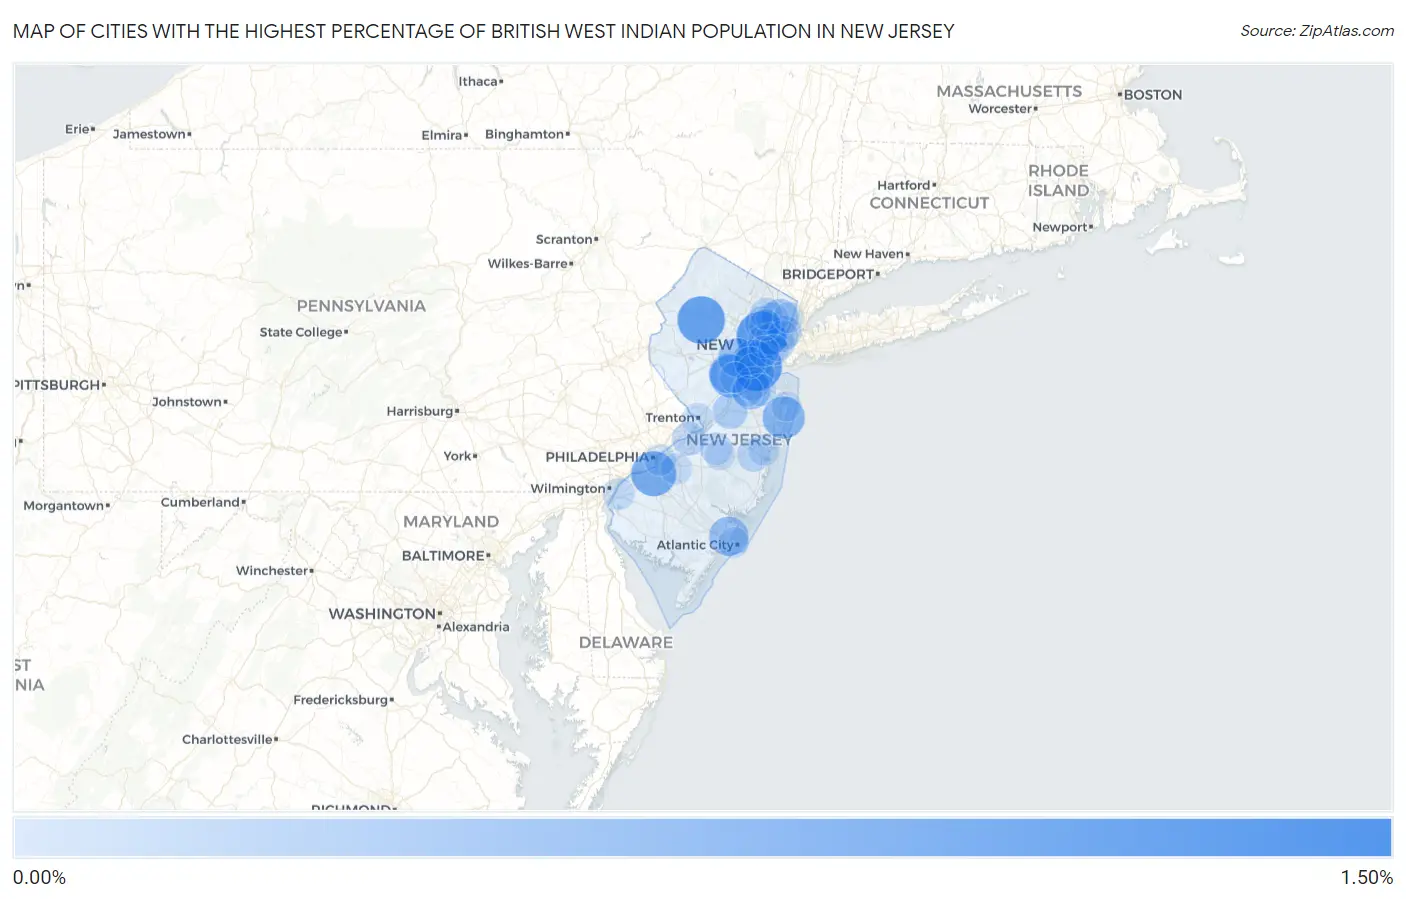
Map of Cities with the Highest Percentage of British West Indian Population in New Jersey
0.00%
1.50%
Cities with the Highest Percentage of British West Indian Population in New Jersey
| City | British West Indian | vs State | vs National | |
| 1. | Pine Brook | 1.11% | 0.077%(+1.03)#1 | 0.037%(+1.07)#46 |
| 2. | East Orange | 0.96% | 0.077%(+0.884)#2 | 0.037%(+0.925)#63 |
| 3. | Port Reading | 0.94% | 0.077%(+0.864)#3 | 0.037%(+0.904)#67 |
| 4. | Freehold Borough | 0.94% | 0.077%(+0.859)#4 | 0.037%(+0.900)#69 |
| 5. | Budd Lake | 0.86% | 0.077%(+0.785)#5 | 0.037%(+0.825)#74 |
| 6. | Mountainside Borough | 0.80% | 0.077%(+0.724)#6 | 0.037%(+0.764)#78 |
| 7. | Woodbury | 0.73% | 0.077%(+0.655)#7 | 0.037%(+0.695)#87 |
| 8. | Westwood Borough | 0.73% | 0.077%(+0.653)#8 | 0.037%(+0.693)#88 |
| 9. | East Franklin | 0.62% | 0.077%(+0.546)#9 | 0.037%(+0.587)#108 |
| 10. | Eatontown Borough | 0.62% | 0.077%(+0.545)#10 | 0.037%(+0.585)#109 |
| 11. | Asbury Park | 0.60% | 0.077%(+0.520)#11 | 0.037%(+0.560)#115 |
| 12. | Ampere North | 0.52% | 0.077%(+0.446)#12 | 0.037%(+0.486)#138 |
| 13. | Rahway | 0.51% | 0.077%(+0.432)#13 | 0.037%(+0.472)#142 |
| 14. | Union | 0.47% | 0.077%(+0.394)#14 | 0.037%(+0.434)#146 |
| 15. | Somerset | 0.46% | 0.077%(+0.385)#15 | 0.037%(+0.425)#148 |
| 16. | Spotswood Borough | 0.45% | 0.077%(+0.378)#16 | 0.037%(+0.418)#151 |
| 17. | Absecon | 0.45% | 0.077%(+0.375)#17 | 0.037%(+0.415)#156 |
| 18. | Plainfield | 0.42% | 0.077%(+0.345)#18 | 0.037%(+0.385)#163 |
| 19. | Magnolia Borough | 0.41% | 0.077%(+0.338)#19 | 0.037%(+0.378)#166 |
| 20. | Brownville | 0.41% | 0.077%(+0.336)#20 | 0.037%(+0.376)#167 |
| 21. | Perth Amboy | 0.41% | 0.077%(+0.331)#21 | 0.037%(+0.371)#170 |
| 22. | Vauxhall | 0.39% | 0.077%(+0.317)#22 | 0.037%(+0.357)#175 |
| 23. | Ridgefield Borough | 0.35% | 0.077%(+0.272)#23 | 0.037%(+0.312)#195 |
| 24. | Hackensack | 0.35% | 0.077%(+0.269)#24 | 0.037%(+0.309)#198 |
| 25. | North Plainfield Borough | 0.34% | 0.077%(+0.267)#25 | 0.037%(+0.307)#200 |
| 26. | Washington Borough | 0.30% | 0.077%(+0.227)#26 | 0.037%(+0.267)#221 |
| 27. | Pemberton Borough | 0.30% | 0.077%(+0.222)#27 | 0.037%(+0.262)#225 |
| 28. | Roselle Borough | 0.28% | 0.077%(+0.203)#28 | 0.037%(+0.243)#240 |
| 29. | Twin Rivers | 0.25% | 0.077%(+0.169)#29 | 0.037%(+0.209)#260 |
| 30. | Upper Montclair | 0.23% | 0.077%(+0.156)#30 | 0.037%(+0.197)#270 |
| 31. | Closter Borough | 0.22% | 0.077%(+0.145)#31 | 0.037%(+0.186)#282 |
| 32. | Newark | 0.21% | 0.077%(+0.132)#32 | 0.037%(+0.172)#294 |
| 33. | Jersey City | 0.21% | 0.077%(+0.131)#33 | 0.037%(+0.172)#297 |
| 34. | Elmwood Park Borough | 0.17% | 0.077%(+0.097)#34 | 0.037%(+0.137)#330 |
| 35. | Madison Park | 0.17% | 0.077%(+0.092)#35 | 0.037%(+0.132)#337 |
| 36. | Holiday City Berkeley | 0.17% | 0.077%(+0.089)#36 | 0.037%(+0.130)#345 |
| 37. | Burlington | 0.16% | 0.077%(+0.086)#37 | 0.037%(+0.126)#350 |
| 38. | West New York | 0.15% | 0.077%(+0.078)#38 | 0.037%(+0.118)#360 |
| 39. | Chester Borough | 0.14% | 0.077%(+0.058)#39 | 0.037%(+0.099)#388 |
| 40. | Garfield | 0.12% | 0.077%(+0.046)#40 | 0.037%(+0.087)#406 |
| 41. | Strathmore | 0.12% | 0.077%(+0.039)#41 | 0.037%(+0.079)#421 |
| 42. | Fort Dix | 0.12% | 0.077%(+0.039)#42 | 0.037%(+0.079)#423 |
| 43. | Kearny | 0.100% | 0.077%(+0.023)#43 | 0.037%(+0.063)#459 |
| 44. | Paterson | 0.098% | 0.077%(+0.021)#44 | 0.037%(+0.061)#468 |
| 45. | Rutherford Borough | 0.096% | 0.077%(+0.019)#45 | 0.037%(+0.059)#472 |
| 46. | South Plainfield Borough | 0.091% | 0.077%(+0.014)#46 | 0.037%(+0.054)#489 |
| 47. | Carneys Point | 0.086% | 0.077%(+0.009)#47 | 0.037%(+0.049)#497 |
| 48. | Union City | 0.079% | 0.077%(+0.002)#48 | 0.037%(+0.042)#521 |
| 49. | Trenton | 0.074% | 0.077%(-0.002)#49 | 0.037%(+0.038)#534 |
| 50. | Camden | 0.072% | 0.077%(-0.004)#50 | 0.037%(+0.036)#543 |
| 51. | Springdale | 0.072% | 0.077%(-0.005)#51 | 0.037%(+0.036)#545 |
| 52. | Brookdale | 0.068% | 0.077%(-0.009)#52 | 0.037%(+0.031)#559 |
| 53. | Colonia | 0.065% | 0.077%(-0.012)#53 | 0.037%(+0.028)#578 |
| 54. | Toms River | 0.064% | 0.077%(-0.013)#54 | 0.037%(+0.027)#582 |
| 55. | Englewood | 0.055% | 0.077%(-0.022)#55 | 0.037%(+0.018)#607 |
| 56. | Lindenwold Borough | 0.047% | 0.077%(-0.030)#56 | 0.037%(+0.010)#647 |
| 57. | Sayreville Borough | 0.047% | 0.077%(-0.030)#57 | 0.037%(+0.010)#648 |
| 58. | Old Bridge | 0.043% | 0.077%(-0.034)#58 | 0.037%(+0.006)#665 |
| 59. | Bayonne | 0.040% | 0.077%(-0.037)#59 | 0.037%(+0.003)#679 |
| 60. | New Brunswick | 0.038% | 0.077%(-0.039)#60 | 0.037%(+0.001)#687 |
| 61. | Elizabeth | 0.032% | 0.077%(-0.044)#61 | 0.037%(-0.004)#723 |
| 62. | Atlantic City | 0.031% | 0.077%(-0.046)#62 | 0.037%(-0.005)#729 |
| 63. | Browns Mills | 0.030% | 0.077%(-0.047)#63 | 0.037%(-0.007)#743 |
| 64. | Long Branch | 0.016% | 0.077%(-0.061)#64 | 0.037%(-0.021)#827 |
| 65. | Fort Lee Borough | 0.013% | 0.077%(-0.064)#65 | 0.037%(-0.024)#852 |
Common Questions
What are the Top 10 Cities with the Highest Percentage of British West Indian Population in New Jersey?
Top 10 Cities with the Highest Percentage of British West Indian Population in New Jersey are:
#1
0.96%
#2
0.94%
#3
0.86%
#4
0.73%
#5
0.62%
#6
0.60%
#7
0.51%
#8
0.46%
#9
0.45%
#10
0.42%
What city has the Highest Percentage of British West Indian Population in New Jersey?
East Orange has the Highest Percentage of British West Indian Population in New Jersey with 0.96%.
What is the Percentage of British West Indian Population in the State of New Jersey?
Percentage of British West Indian Population in New Jersey is 0.077%.
What is the Percentage of British West Indian Population in the United States?
Percentage of British West Indian Population in the United States is 0.037%.