Cities with the Largest Asian Community in New Jersey
RELATED REPORTS & OPTIONS
Asian
New Jersey
Compare Cities
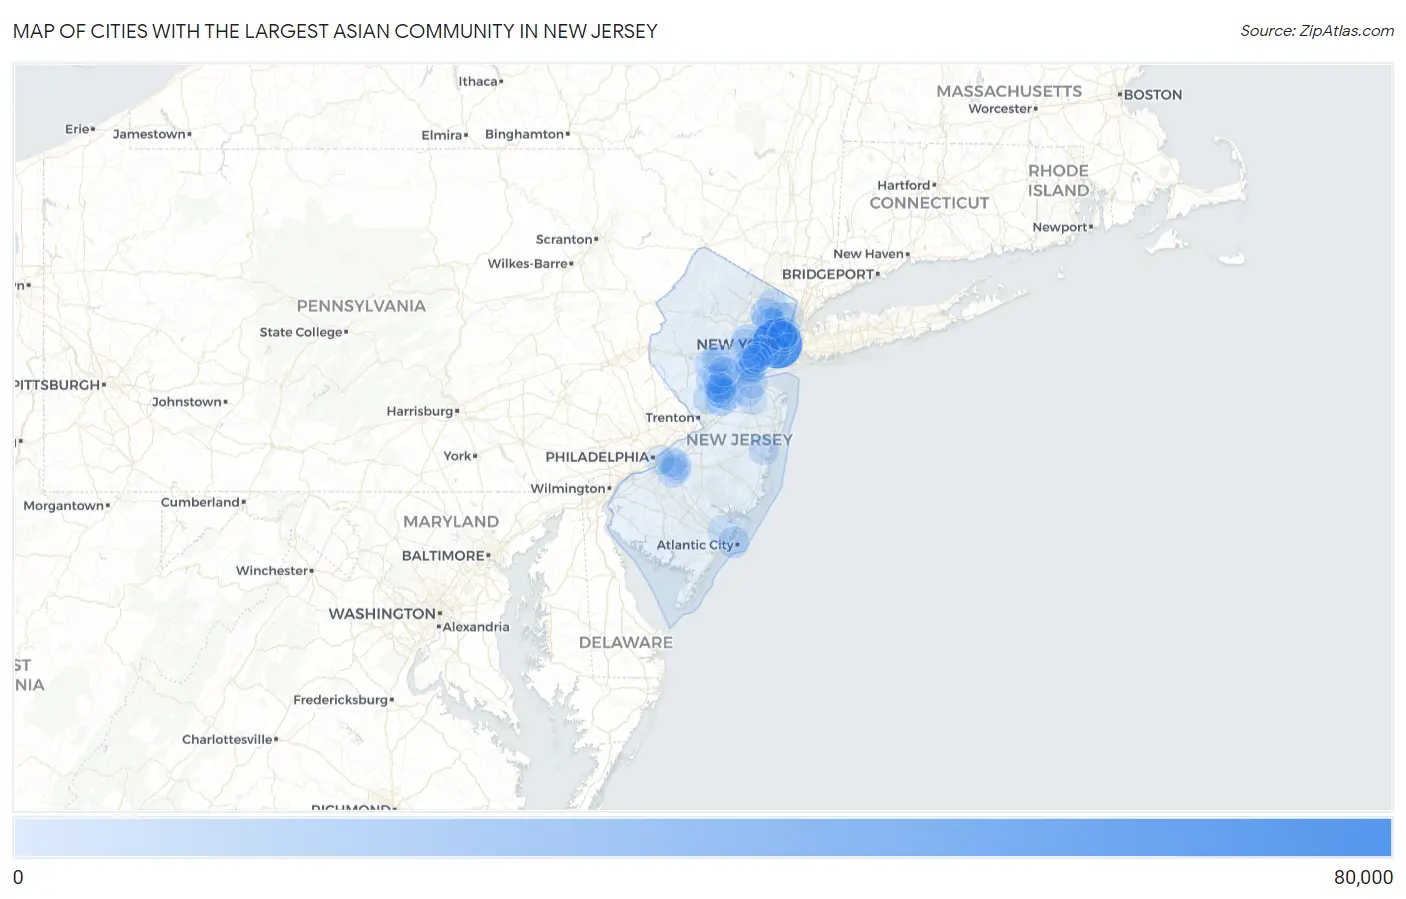
Map of Cities with the Largest Asian Community in New Jersey
0
80,000
Cities with the Largest Asian Community in New Jersey
| City | Asian | vs State | vs National | |
| 1. | Jersey City | 74,223 | 913,364(8.13%)#1 | 19,112,979(0.39%)#17 |
| 2. | Fort Lee Borough | 17,422 | 913,364(1.91%)#2 | 19,112,979(0.09%)#154 |
| 3. | Palisades Park Borough | 12,676 | 913,364(1.39%)#3 | 19,112,979(0.07%)#221 |
| 4. | Parsippany | 9,822 | 913,364(1.08%)#4 | 19,112,979(0.05%)#284 |
| 5. | Princeton Meadows | 9,677 | 913,364(1.06%)#5 | 19,112,979(0.05%)#287 |
| 6. | Iselin | 9,596 | 913,364(1.05%)#6 | 19,112,979(0.05%)#294 |
| 7. | Sayreville Borough | 7,786 | 913,364(0.85%)#7 | 19,112,979(0.04%)#374 |
| 8. | Bergenfield Borough | 7,737 | 913,364(0.85%)#8 | 19,112,979(0.04%)#376 |
| 9. | Clifton | 7,665 | 913,364(0.84%)#9 | 19,112,979(0.04%)#382 |
| 10. | Hoboken | 7,419 | 913,364(0.81%)#10 | 19,112,979(0.04%)#393 |
| 11. | Paterson | 7,369 | 913,364(0.81%)#11 | 19,112,979(0.04%)#398 |
| 12. | Bayonne | 7,349 | 913,364(0.80%)#12 | 19,112,979(0.04%)#401 |
| 13. | Secaucus | 7,090 | 913,364(0.78%)#13 | 19,112,979(0.04%)#419 |
| 14. | Paramus Borough | 6,351 | 913,364(0.70%)#14 | 19,112,979(0.03%)#460 |
| 15. | Carteret Borough | 6,280 | 913,364(0.69%)#15 | 19,112,979(0.03%)#467 |
| 16. | Newark | 6,192 | 913,364(0.68%)#16 | 19,112,979(0.03%)#474 |
| 17. | Atlantic City | 6,182 | 913,364(0.68%)#17 | 19,112,979(0.03%)#477 |
| 18. | Hackensack | 5,976 | 913,364(0.65%)#18 | 19,112,979(0.03%)#491 |
| 19. | Edgewater Borough | 5,966 | 913,364(0.65%)#19 | 19,112,979(0.03%)#492 |
| 20. | Princeton | 5,853 | 913,364(0.64%)#20 | 19,112,979(0.03%)#504 |
| 21. | Bradley Gardens | 5,745 | 913,364(0.63%)#21 | 19,112,979(0.03%)#511 |
| 22. | Short Hills | 5,707 | 913,364(0.62%)#22 | 19,112,979(0.03%)#517 |
| 23. | Monmouth Junction | 5,349 | 913,364(0.59%)#23 | 19,112,979(0.03%)#548 |
| 24. | Somerset | 5,095 | 913,364(0.56%)#24 | 19,112,979(0.03%)#580 |
| 25. | New Brunswick | 4,936 | 913,364(0.54%)#25 | 19,112,979(0.03%)#590 |
| 26. | Tenafly Borough | 4,804 | 913,364(0.53%)#26 | 19,112,979(0.03%)#602 |
| 27. | Dayton | 4,683 | 913,364(0.51%)#27 | 19,112,979(0.02%)#619 |
| 28. | Franklin Park | 4,449 | 913,364(0.49%)#28 | 19,112,979(0.02%)#643 |
| 29. | Fair Lawn Borough | 4,150 | 913,364(0.45%)#29 | 19,112,979(0.02%)#676 |
| 30. | South Plainfield Borough | 4,123 | 913,364(0.45%)#30 | 19,112,979(0.02%)#679 |
| 31. | Hillsborough | 4,110 | 913,364(0.45%)#31 | 19,112,979(0.02%)#681 |
| 32. | Ridgewood | 4,027 | 913,364(0.44%)#32 | 19,112,979(0.02%)#690 |
| 33. | Harrison | 3,841 | 913,364(0.42%)#33 | 19,112,979(0.02%)#720 |
| 34. | Old Bridge | 3,725 | 913,364(0.41%)#34 | 19,112,979(0.02%)#729 |
| 35. | Belle Mead | 3,700 | 913,364(0.41%)#35 | 19,112,979(0.02%)#734 |
| 36. | Woodbridge | 3,669 | 913,364(0.40%)#36 | 19,112,979(0.02%)#747 |
| 37. | Englewood | 3,614 | 913,364(0.40%)#37 | 19,112,979(0.02%)#760 |
| 38. | River Edge Borough | 3,603 | 913,364(0.39%)#38 | 19,112,979(0.02%)#761 |
| 39. | The Hills | 3,589 | 913,364(0.39%)#39 | 19,112,979(0.02%)#767 |
| 40. | Heathcote | 3,581 | 913,364(0.39%)#40 | 19,112,979(0.02%)#768 |
| 41. | Avenel | 3,577 | 913,364(0.39%)#41 | 19,112,979(0.02%)#770 |
| 42. | Echelon | 3,558 | 913,364(0.39%)#42 | 19,112,979(0.02%)#772 |
| 43. | Leonia Borough | 3,464 | 913,364(0.38%)#43 | 19,112,979(0.02%)#796 |
| 44. | West New York | 3,435 | 913,364(0.38%)#44 | 19,112,979(0.02%)#801 |
| 45. | Cliffside Park Borough | 3,435 | 913,364(0.38%)#45 | 19,112,979(0.02%)#802 |
| 46. | Ridgefield Borough | 3,417 | 913,364(0.37%)#46 | 19,112,979(0.02%)#805 |
| 47. | New Milford Borough | 3,410 | 913,364(0.37%)#47 | 19,112,979(0.02%)#806 |
| 48. | Lake Hiawatha | 3,309 | 913,364(0.36%)#48 | 19,112,979(0.02%)#822 |
| 49. | Dumont Borough | 3,304 | 913,364(0.36%)#49 | 19,112,979(0.02%)#825 |
| 50. | Kendall Park | 3,283 | 913,364(0.36%)#50 | 19,112,979(0.02%)#832 |
| 51. | Highland Park Borough | 3,263 | 913,364(0.36%)#51 | 19,112,979(0.02%)#835 |
| 52. | Toms River | 3,255 | 913,364(0.36%)#52 | 19,112,979(0.02%)#836 |
| 53. | Elizabeth | 2,988 | 913,364(0.33%)#53 | 19,112,979(0.02%)#890 |
| 54. | Closter Borough | 2,987 | 913,364(0.33%)#54 | 19,112,979(0.02%)#891 |
| 55. | Rutherford Borough | 2,951 | 913,364(0.32%)#55 | 19,112,979(0.02%)#898 |
| 56. | Colonia | 2,896 | 913,364(0.32%)#56 | 19,112,979(0.02%)#909 |
| 57. | Passaic | 2,731 | 913,364(0.30%)#57 | 19,112,979(0.01%)#952 |
| 58. | Greentree | 2,703 | 913,364(0.30%)#58 | 19,112,979(0.01%)#962 |
| 59. | Blackwells Mills | 2,668 | 913,364(0.29%)#59 | 19,112,979(0.01%)#968 |
| 60. | Cresskill Borough | 2,663 | 913,364(0.29%)#60 | 19,112,979(0.01%)#969 |
| 61. | East Rutherford Borough | 2,516 | 913,364(0.28%)#61 | 19,112,979(0.01%)#1,018 |
| 62. | Westfield | 2,499 | 913,364(0.27%)#62 | 19,112,979(0.01%)#1,026 |
| 63. | Troy Hills | 2,439 | 913,364(0.27%)#63 | 19,112,979(0.01%)#1,047 |
| 64. | Little Ferry Borough | 2,359 | 913,364(0.26%)#64 | 19,112,979(0.01%)#1,076 |
| 65. | Preakness | 2,337 | 913,364(0.26%)#65 | 19,112,979(0.01%)#1,083 |
| 66. | Metuchen Borough | 2,304 | 913,364(0.25%)#66 | 19,112,979(0.01%)#1,095 |
| 67. | Englewood Cliffs Borough | 2,303 | 913,364(0.25%)#67 | 19,112,979(0.01%)#1,096 |
| 68. | Fords | 2,266 | 913,364(0.25%)#68 | 19,112,979(0.01%)#1,107 |
| 69. | New Providence Borough | 2,238 | 913,364(0.25%)#69 | 19,112,979(0.01%)#1,118 |
| 70. | Old Tappan Borough | 2,111 | 913,364(0.23%)#70 | 19,112,979(0.01%)#1,174 |
| 71. | Union City | 2,088 | 913,364(0.23%)#71 | 19,112,979(0.01%)#1,182 |
| 72. | Summit | 2,088 | 913,364(0.23%)#72 | 19,112,979(0.01%)#1,185 |
| 73. | Elmwood Park Borough | 2,046 | 913,364(0.22%)#73 | 19,112,979(0.01%)#1,207 |
| 74. | Springdale | 1,961 | 913,364(0.21%)#74 | 19,112,979(0.01%)#1,240 |
| 75. | Rahway | 1,936 | 913,364(0.21%)#75 | 19,112,979(0.01%)#1,250 |
| 76. | Monroe Manor | 1,925 | 913,364(0.21%)#76 | 19,112,979(0.01%)#1,257 |
| 77. | Martinsville | 1,919 | 913,364(0.21%)#77 | 19,112,979(0.01%)#1,261 |
| 78. | Wood Ridge Borough | 1,849 | 913,364(0.20%)#78 | 19,112,979(0.01%)#1,292 |
| 79. | Sicklerville | 1,834 | 913,364(0.20%)#79 | 19,112,979(0.01%)#1,300 |
| 80. | Glen Rock Borough | 1,810 | 913,364(0.20%)#80 | 19,112,979(0.01%)#1,311 |
| 81. | Robertsville | 1,802 | 913,364(0.20%)#81 | 19,112,979(0.01%)#1,313 |
| 82. | Lodi Borough | 1,798 | 913,364(0.20%)#82 | 19,112,979(0.01%)#1,315 |
| 83. | Norwood Borough | 1,785 | 913,364(0.20%)#83 | 19,112,979(0.01%)#1,324 |
| 84. | Madison Park | 1,757 | 913,364(0.19%)#84 | 19,112,979(0.01%)#1,334 |
| 85. | Maywood Borough | 1,743 | 913,364(0.19%)#85 | 19,112,979(0.01%)#1,342 |
| 86. | Pomona | 1,714 | 913,364(0.19%)#86 | 19,112,979(0.01%)#1,356 |
| 87. | Northvale Borough | 1,698 | 913,364(0.19%)#87 | 19,112,979(0.01%)#1,364 |
| 88. | Rutgers University-Busch Campus | 1,677 | 913,364(0.18%)#88 | 19,112,979(0.01%)#1,375 |
| 89. | Roselle Park Borough | 1,670 | 913,364(0.18%)#89 | 19,112,979(0.01%)#1,382 |
| 90. | Forsgate | 1,621 | 913,364(0.18%)#90 | 19,112,979(0.01%)#1,408 |
| 91. | Green Knoll | 1,619 | 913,364(0.18%)#91 | 19,112,979(0.01%)#1,410 |
| 92. | Franklin Center | 1,603 | 913,364(0.18%)#92 | 19,112,979(0.01%)#1,419 |
| 93. | Middlesex Borough | 1,549 | 913,364(0.17%)#93 | 19,112,979(0.01%)#1,454 |
| 94. | Somerville Borough | 1,544 | 913,364(0.17%)#94 | 19,112,979(0.01%)#1,458 |
| 95. | Camden | 1,508 | 913,364(0.17%)#95 | 19,112,979(0.01%)#1,476 |
| 96. | Pine Brook | 1,466 | 913,364(0.16%)#96 | 19,112,979(0.01%)#1,499 |
| 97. | Glassboro Borough | 1,460 | 913,364(0.16%)#97 | 19,112,979(0.01%)#1,501 |
| 98. | Linden | 1,438 | 913,364(0.16%)#98 | 19,112,979(0.01%)#1,518 |
| 99. | Ten Mile Run | 1,413 | 913,364(0.15%)#99 | 19,112,979(0.01%)#1,533 |
| 100. | Kingston Estates | 1,411 | 913,364(0.15%)#100 | 19,112,979(0.01%)#1,534 |
Common Questions
What are the Top 10 Cities with the Largest Asian Community in New Jersey?
Top 10 Cities with the Largest Asian Community in New Jersey are:
#1
74,223
#2
9,677
#3
9,596
#4
7,665
#5
7,419
#6
7,369
#7
7,349
#8
7,090
#9
6,192
#10
6,182
What city has the Largest Asian Community in New Jersey?
Jersey City has the Largest Asian Community in New Jersey with 74,223.
What is the Total Asian Population in the State of New Jersey?
Total Asian Population in New Jersey is 913,364.
What is the Total Asian Population in the United States?
Total Asian Population in the United States is 19,112,979.