Echelon, NJ
Echelon Map
Echelon Overview
13,553
TOTAL POPULATION
6,649
MALE POPULATION
6,904
FEMALE POPULATION
96.31
MALES / 100 FEMALES
103.84
FEMALES / 100 MALES
33.7
MEDIAN AGE
3.2
AVG FAMILY SIZE
2.2
AVG HOUSEHOLD SIZE
$39,593
PER CAPITA INCOME
$109,526
AVG FAMILY INCOME
$75,874
AVG HOUSEHOLD INCOME
30.1%
WAGE / INCOME GAP [ % ]
69.9¢/ $1
WAGE / INCOME GAP [ $ ]
0.46
INEQUALITY / GINI INDEX
7,626
LABOR FORCE [ PEOPLE ]
69.5%
PERCENT IN LABOR FORCE
6.6%
UNEMPLOYMENT RATE
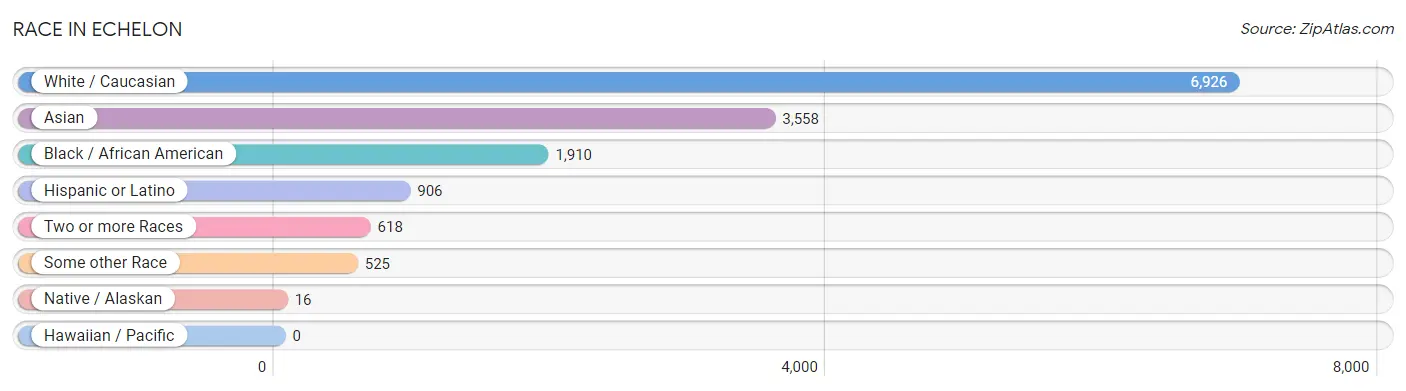
Race in Echelon
The most populous races in Echelon are White / Caucasian (6,926 | 51.1%), Asian (3,558 | 26.3%), and Black / African American (1,910 | 14.1%).
| Race | # Population | % Population |
| Asian | 3,558 | 26.3% |
| Black / African American | 1,910 | 14.1% |
| Hawaiian / Pacific | 0 | 0.0% |
| Hispanic or Latino | 906 | 6.7% |
| Native / Alaskan | 16 | 0.1% |
| White / Caucasian | 6,926 | 51.1% |
| Two or more Races | 618 | 4.6% |
| Some other Race | 525 | 3.9% |
| Total | 13,553 | 100.0% |
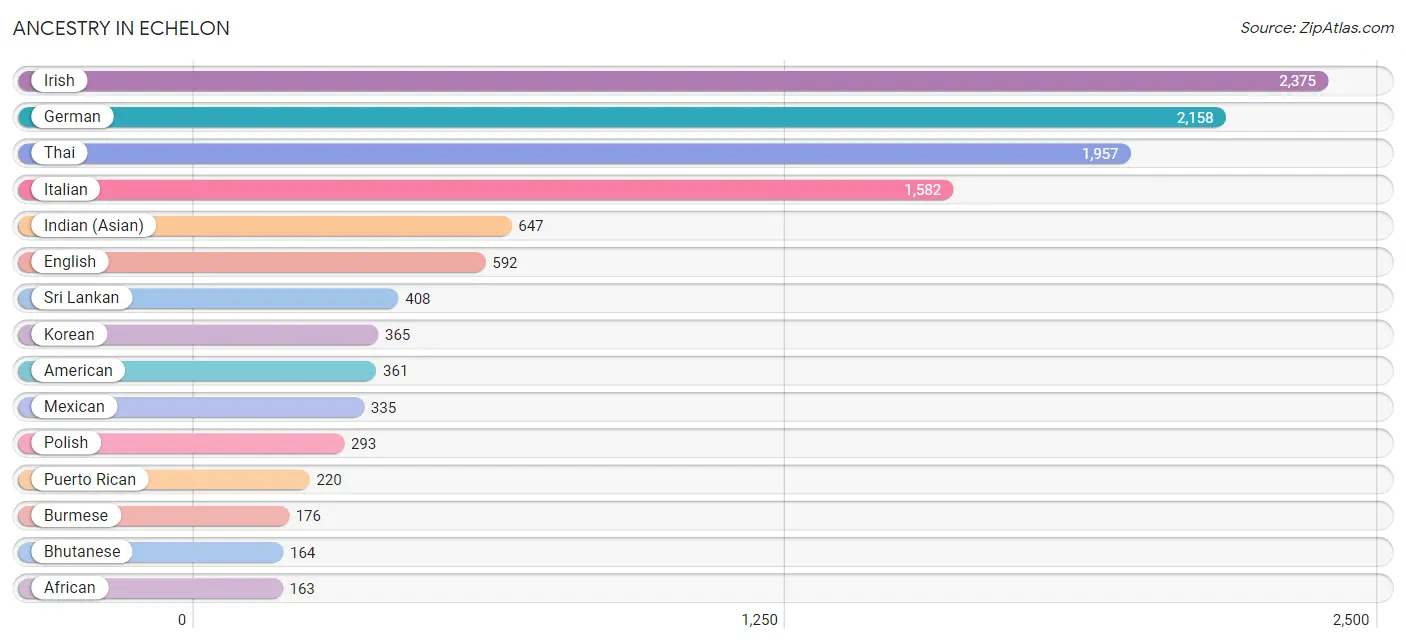
Ancestry in Echelon
The most populous ancestries reported in Echelon are Irish (2,375 | 17.5%), German (2,158 | 15.9%), Thai (1,957 | 14.4%), Italian (1,582 | 11.7%), and Indian (Asian) (647 | 4.8%), together accounting for 64.3% of all Echelon residents.
| Ancestry | # Population | % Population |
| Afghan | 13 | 0.1% |
| African | 163 | 1.2% |
| American | 361 | 2.7% |
| Armenian | 10 | 0.1% |
| Austrian | 20 | 0.2% |
| Belgian | 47 | 0.4% |
| Bhutanese | 164 | 1.2% |
| Brazilian | 154 | 1.1% |
| British | 37 | 0.3% |
| Burmese | 176 | 1.3% |
| Central American | 31 | 0.2% |
| Central American Indian | 43 | 0.3% |
| Cherokee | 23 | 0.2% |
| Colombian | 57 | 0.4% |
| Costa Rican | 26 | 0.2% |
| Cuban | 73 | 0.5% |
| Dominican | 119 | 0.9% |
| Dutch | 45 | 0.3% |
| Eastern European | 27 | 0.2% |
| Ecuadorian | 24 | 0.2% |
| English | 592 | 4.4% |
| European | 49 | 0.4% |
| French | 160 | 1.2% |
| French Canadian | 2 | 0.0% |
| German | 2,158 | 15.9% |
| Greek | 16 | 0.1% |
| Guamanian / Chamorro | 7 | 0.1% |
| Hungarian | 36 | 0.3% |
| Indian (Asian) | 647 | 4.8% |
| Iranian | 13 | 0.1% |
| Irish | 2,375 | 17.5% |
| Italian | 1,582 | 11.7% |
| Japanese | 16 | 0.1% |
| Korean | 365 | 2.7% |
| Lithuanian | 7 | 0.1% |
| Mexican | 335 | 2.5% |
| Native Hawaiian | 20 | 0.2% |
| Norwegian | 13 | 0.1% |
| Peruvian | 6 | 0.0% |
| Polish | 293 | 2.2% |
| Portuguese | 36 | 0.3% |
| Puerto Rican | 220 | 1.6% |
| Romanian | 54 | 0.4% |
| Russian | 122 | 0.9% |
| Salvadoran | 5 | 0.0% |
| Scotch-Irish | 157 | 1.2% |
| Scottish | 81 | 0.6% |
| Slovak | 88 | 0.6% |
| South American | 107 | 0.8% |
| Spanish | 14 | 0.1% |
| Sri Lankan | 408 | 3.0% |
| Subsaharan African | 163 | 1.2% |
| Swedish | 34 | 0.3% |
| Thai | 1,957 | 14.4% |
| Turkish | 70 | 0.5% |
| Ukrainian | 77 | 0.6% |
| Venezuelan | 20 | 0.2% |
| Welsh | 98 | 0.7% | View All 58 Rows |
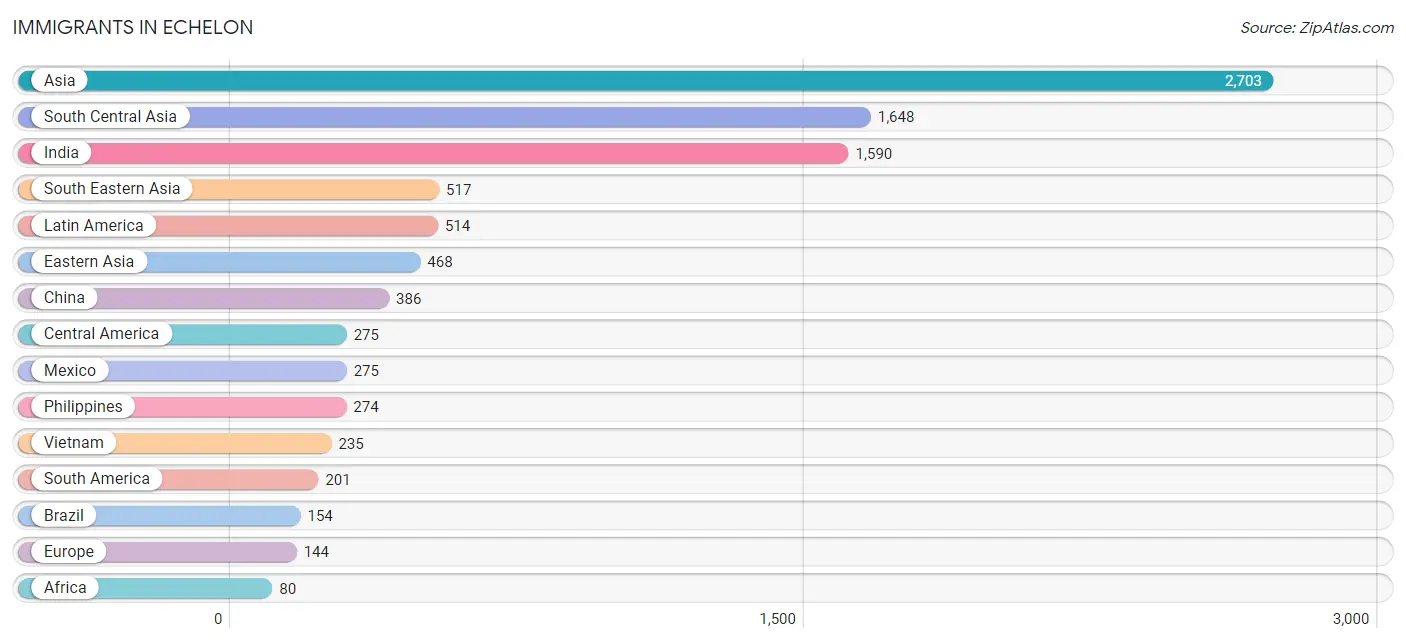
Immigrants in Echelon
The most numerous immigrant groups reported in Echelon came from Asia (2,703 | 19.9%), South Central Asia (1,648 | 12.2%), India (1,590 | 11.7%), South Eastern Asia (517 | 3.8%), and Latin America (514 | 3.8%), together accounting for 51.4% of all Echelon residents.
| Immigration Origin | # Population | % Population |
| Afghanistan | 5 | 0.0% |
| Africa | 80 | 0.6% |
| Asia | 2,703 | 19.9% |
| Brazil | 154 | 1.1% |
| Canada | 35 | 0.3% |
| Caribbean | 38 | 0.3% |
| Central America | 275 | 2.0% |
| China | 386 | 2.9% |
| Colombia | 27 | 0.2% |
| Dominican Republic | 38 | 0.3% |
| Eastern Asia | 468 | 3.5% |
| Eastern Europe | 70 | 0.5% |
| England | 21 | 0.2% |
| Europe | 144 | 1.1% |
| Ghana | 80 | 0.6% |
| Hong Kong | 66 | 0.5% |
| India | 1,590 | 11.7% |
| Japan | 40 | 0.3% |
| Korea | 42 | 0.3% |
| Latin America | 514 | 3.8% |
| Mexico | 275 | 2.0% |
| Northern Europe | 74 | 0.5% |
| Oceania | 7 | 0.1% |
| Pakistan | 53 | 0.4% |
| Philippines | 274 | 2.0% |
| Poland | 1 | 0.0% |
| Russia | 30 | 0.2% |
| South America | 201 | 1.5% |
| South Central Asia | 1,648 | 12.2% |
| South Eastern Asia | 517 | 3.8% |
| Taiwan | 18 | 0.1% |
| Turkey | 70 | 0.5% |
| Ukraine | 39 | 0.3% |
| Venezuela | 20 | 0.2% |
| Vietnam | 235 | 1.7% |
| Western Africa | 80 | 0.6% |
| Western Asia | 70 | 0.5% | View All 37 Rows |
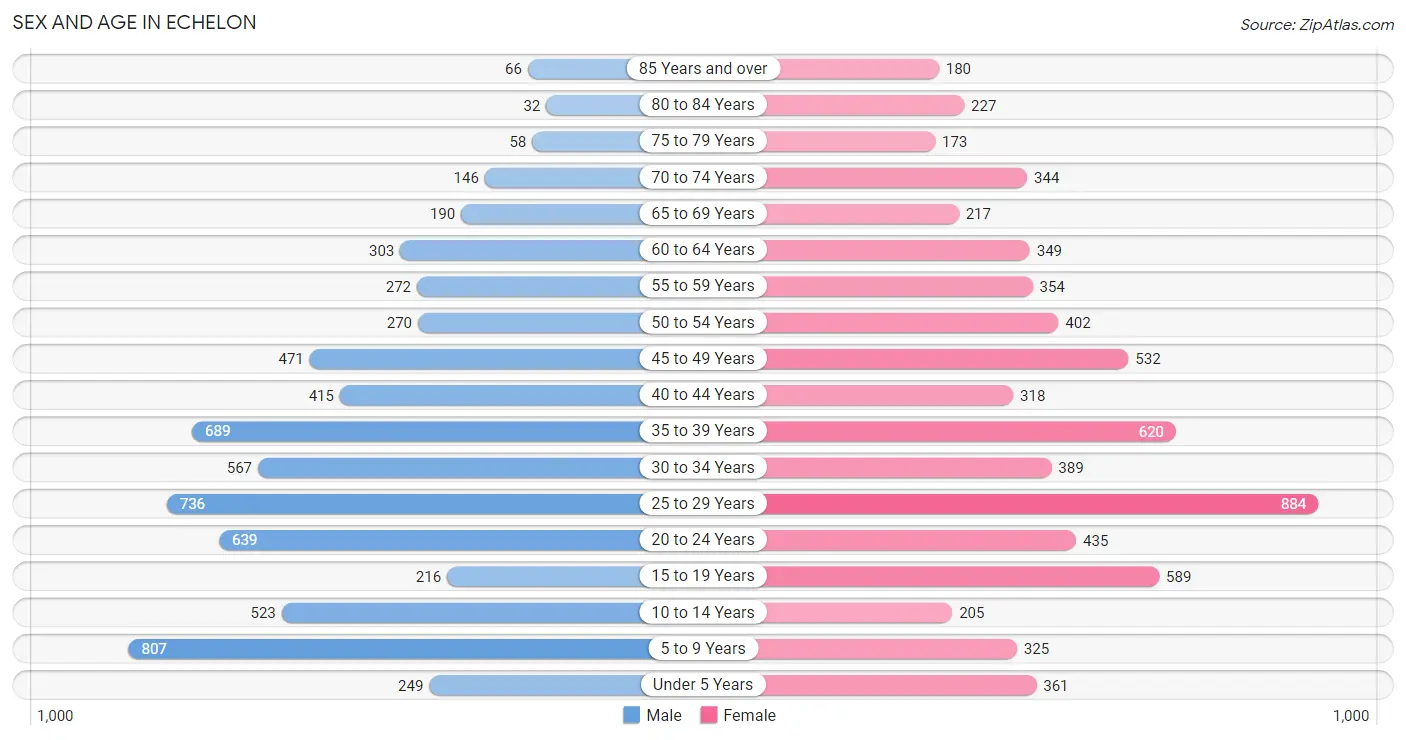
Sex and Age in Echelon
Sex and Age in Echelon
The most populous age groups in Echelon are 5 to 9 Years (807 | 12.1%) for men and 25 to 29 Years (884 | 12.8%) for women.
| Age Bracket | Male | Female |
| Under 5 Years | 249 (3.7%) | 361 (5.2%) |
| 5 to 9 Years | 807 (12.1%) | 325 (4.7%) |
| 10 to 14 Years | 523 (7.9%) | 205 (3.0%) |
| 15 to 19 Years | 216 (3.3%) | 589 (8.5%) |
| 20 to 24 Years | 639 (9.6%) | 435 (6.3%) |
| 25 to 29 Years | 736 (11.1%) | 884 (12.8%) |
| 30 to 34 Years | 567 (8.5%) | 389 (5.6%) |
| 35 to 39 Years | 689 (10.4%) | 620 (9.0%) |
| 40 to 44 Years | 415 (6.2%) | 318 (4.6%) |
| 45 to 49 Years | 471 (7.1%) | 532 (7.7%) |
| 50 to 54 Years | 270 (4.1%) | 402 (5.8%) |
| 55 to 59 Years | 272 (4.1%) | 354 (5.1%) |
| 60 to 64 Years | 303 (4.6%) | 349 (5.1%) |
| 65 to 69 Years | 190 (2.9%) | 217 (3.1%) |
| 70 to 74 Years | 146 (2.2%) | 344 (5.0%) |
| 75 to 79 Years | 58 (0.9%) | 173 (2.5%) |
| 80 to 84 Years | 32 (0.5%) | 227 (3.3%) |
| 85 Years and over | 66 (1.0%) | 180 (2.6%) |
| Total | 6,649 (100.0%) | 6,904 (100.0%) |
Families and Households in Echelon
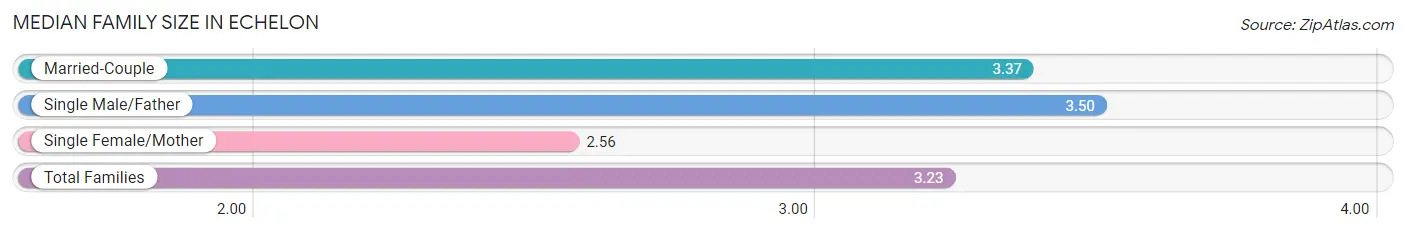
Median Family Size in Echelon
The median family size in Echelon is 3.23 persons per family, with single male/father families (251 | 8.6%) accounting for the largest median family size of 3.5 persons per family. On the other hand, single female/mother families (554 | 19.1%) represent the smallest median family size with 2.56 persons per family.
| Family Type | # Families | Family Size |
| Married-Couple | 2,102 (72.3%) | 3.37 |
| Single Male/Father | 251 (8.6%) | 3.50 |
| Single Female/Mother | 554 (19.1%) | 2.56 |
| Total Families | 2,907 (100.0%) | 3.23 |
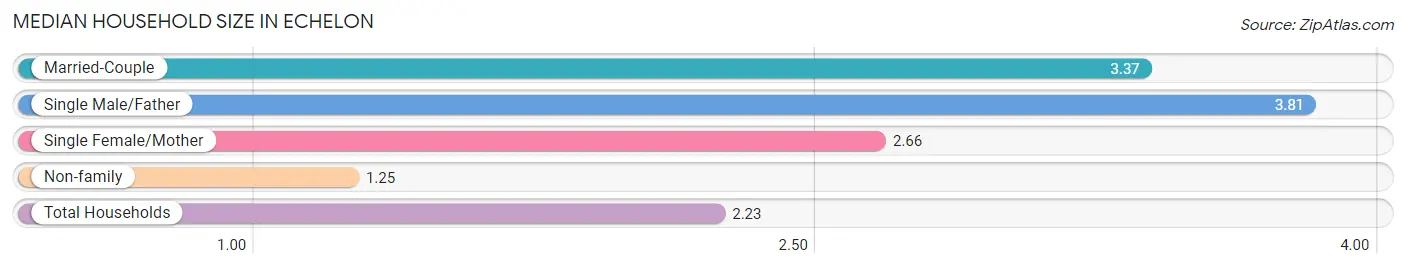
Median Household Size in Echelon
The median household size in Echelon is 2.23 persons per household, with single male/father households (251 | 4.2%) accounting for the largest median household size of 3.81 persons per household. non-family households (3,098 | 51.6%) represent the smallest median household size with 1.25 persons per household.
| Household Type | # Households | Household Size |
| Married-Couple | 2,102 (35.0%) | 3.37 |
| Single Male/Father | 251 (4.2%) | 3.81 |
| Single Female/Mother | 554 (9.2%) | 2.66 |
| Non-family | 3,098 (51.6%) | 1.25 |
| Total Households | 6,005 (100.0%) | 2.23 |
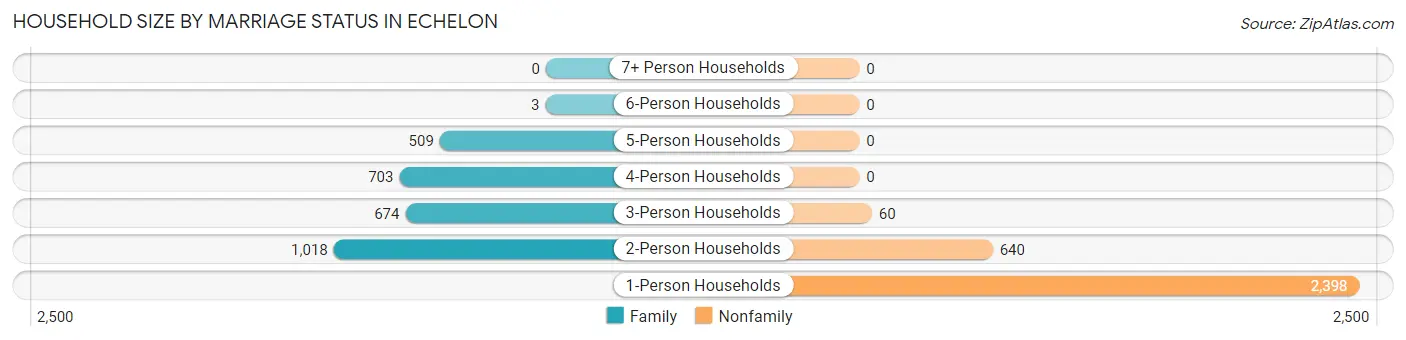
Household Size by Marriage Status in Echelon
Out of a total of 6,005 households in Echelon, 2,907 (48.4%) are family households, while 3,098 (51.6%) are nonfamily households. The most numerous type of family households are 2-person households, comprising 1,018, and the most common type of nonfamily households are 1-person households, comprising 2,398.
| Household Size | Family Households | Nonfamily Households |
| 1-Person Households | - | 2,398 (39.9%) |
| 2-Person Households | 1,018 (17.0%) | 640 (10.7%) |
| 3-Person Households | 674 (11.2%) | 60 (1.0%) |
| 4-Person Households | 703 (11.7%) | 0 (0.0%) |
| 5-Person Households | 509 (8.5%) | 0 (0.0%) |
| 6-Person Households | 3 (0.1%) | 0 (0.0%) |
| 7+ Person Households | 0 (0.0%) | 0 (0.0%) |
| Total | 2,907 (48.4%) | 3,098 (51.6%) |
Female Fertility in Echelon
Fertility by Age in Echelon
Average fertility rate in Echelon is 54.0 births per 1,000 women. Women in the age bracket of 35 to 50 years have the highest fertility rate with 95.0 births per 1,000 women. Women in the age bracket of 35 to 50 years acount for 70.5% of all women with births.
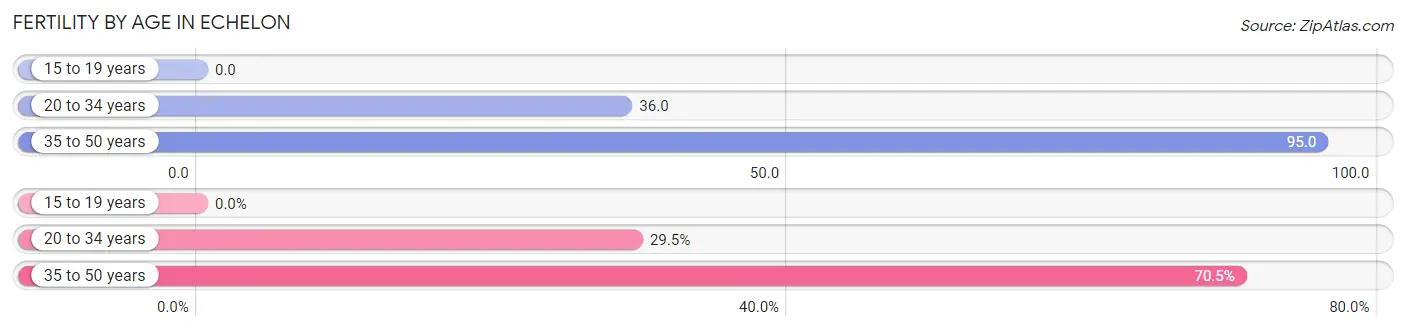
| Age Bracket | Women with Births | Births / 1,000 Women |
| 15 to 19 years | 0 (0.0%) | 0.0 |
| 20 to 34 years | 62 (29.5%) | 36.0 |
| 35 to 50 years | 148 (70.5%) | 95.0 |
| Total | 210 (100.0%) | 54.0 |
Fertility by Age by Marriage Status in Echelon
82.9% of women with births (210) in Echelon are married. The highest percentage of unmarried women with births falls into 20 to 34 years age bracket with 58.1% of them unmarried at the time of birth, while the lowest percentage of unmarried women with births belong to 35 to 50 years age bracket with 0.0% of them unmarried.
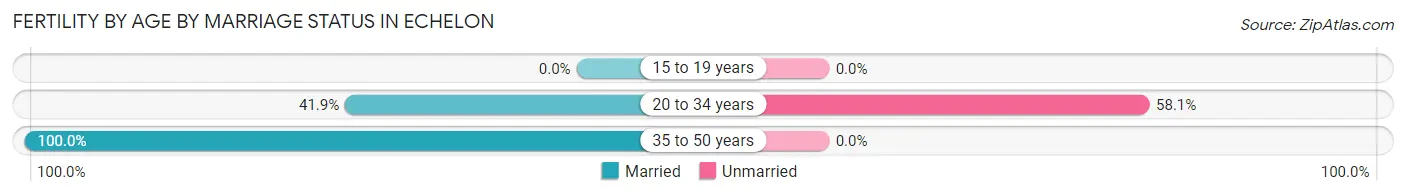
| Age Bracket | Married | Unmarried |
| 15 to 19 years | 0 (0.0%) | 0 (0.0%) |
| 20 to 34 years | 26 (41.9%) | 36 (58.1%) |
| 35 to 50 years | 148 (100.0%) | 0 (0.0%) |
| Total | 174 (82.9%) | 36 (17.1%) |
Fertility by Education in Echelon
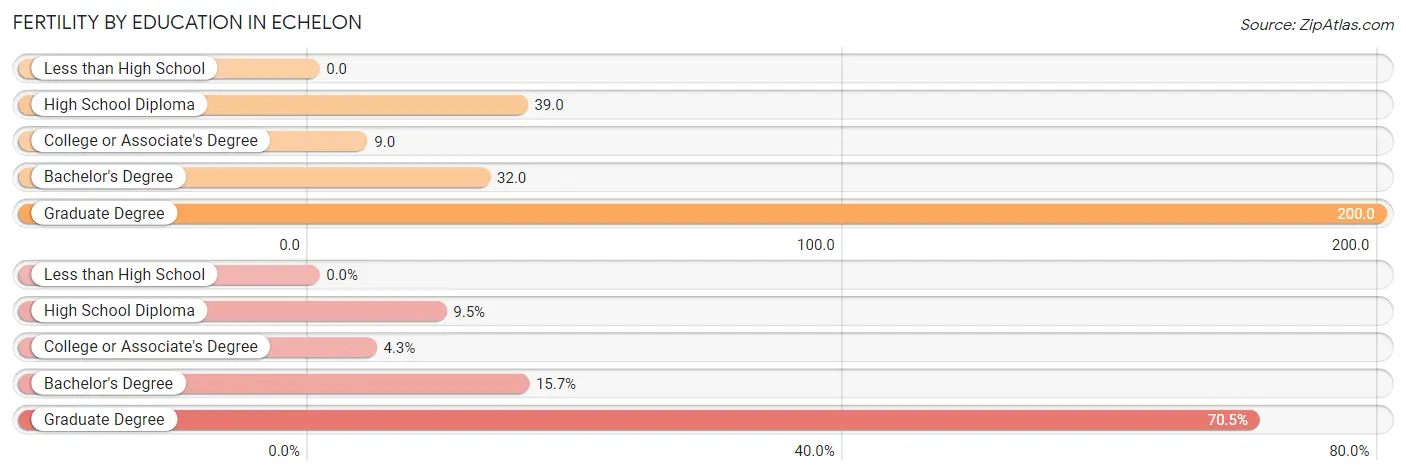
| Educational Attainment | Women with Births | Births / 1,000 Women |
| Less than High School | 0 (0.0%) | 0.0 |
| High School Diploma | 20 (9.5%) | 39.0 |
| College or Associate's Degree | 9 (4.3%) | 9.0 |
| Bachelor's Degree | 33 (15.7%) | 32.0 |
| Graduate Degree | 148 (70.5%) | 200.0 |
| Total | 210 (100.0%) | 54.0 |
Fertility by Education by Marriage Status in Echelon
17.1% of women with births in Echelon are unmarried. Women with the educational attainment of college or associate's degree are most likely to be married with 100.0% of them married at childbirth, while women with the educational attainment of high school diploma are least likely to be married with 100.0% of them unmarried at childbirth.
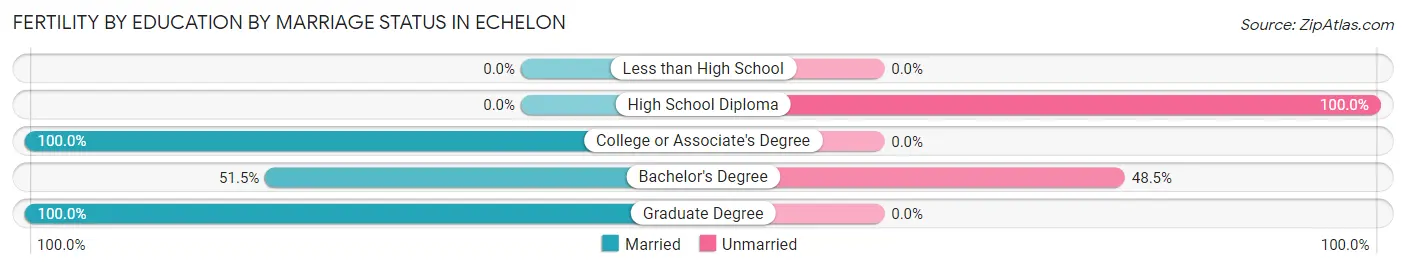
| Educational Attainment | Married | Unmarried |
| Less than High School | 0 (0.0%) | 0 (0.0%) |
| High School Diploma | 0 (0.0%) | 20 (100.0%) |
| College or Associate's Degree | 9 (100.0%) | 0 (0.0%) |
| Bachelor's Degree | 17 (51.5%) | 16 (48.5%) |
| Graduate Degree | 148 (100.0%) | 0 (0.0%) |
| Total | 174 (82.9%) | 36 (17.1%) |
Income in Echelon
Income Overview in Echelon
Per Capita Income in Echelon is $39,593, while median incomes of families and households are $109,526 and $75,874 respectively.
| Characteristic | Number | Measure |
| Per Capita Income | 13,553 | $39,593 |
| Median Family Income | 2,907 | $109,526 |
| Mean Family Income | 2,907 | $130,518 |
| Median Household Income | 6,005 | $75,874 |
| Mean Household Income | 6,005 | $87,972 |
| Income Deficit | 2,907 | $0 |
| Wage / Income Gap (%) | 13,553 | 30.13% |
| Wage / Income Gap ($) | 13,553 | 69.87¢ per $1 |
| Gini / Inequality Index | 13,553 | 0.46 |
Earnings by Sex in Echelon
Average Earnings in Echelon are $46,541, $58,646 for men and $40,975 for women, a difference of 30.1%.
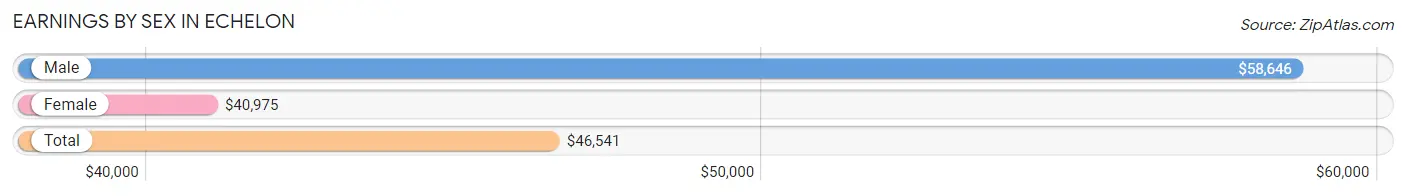
| Sex | Number | Average Earnings |
| Male | 4,146 (52.1%) | $58,646 |
| Female | 3,805 (47.9%) | $40,975 |
| Total | 7,951 (100.0%) | $46,541 |
Earnings by Sex by Income Bracket in Echelon
The most common earnings brackets in Echelon are $100,000+ for men (1,026 | 24.7%) and $75,000 to $99,999 for women (437 | 11.5%).
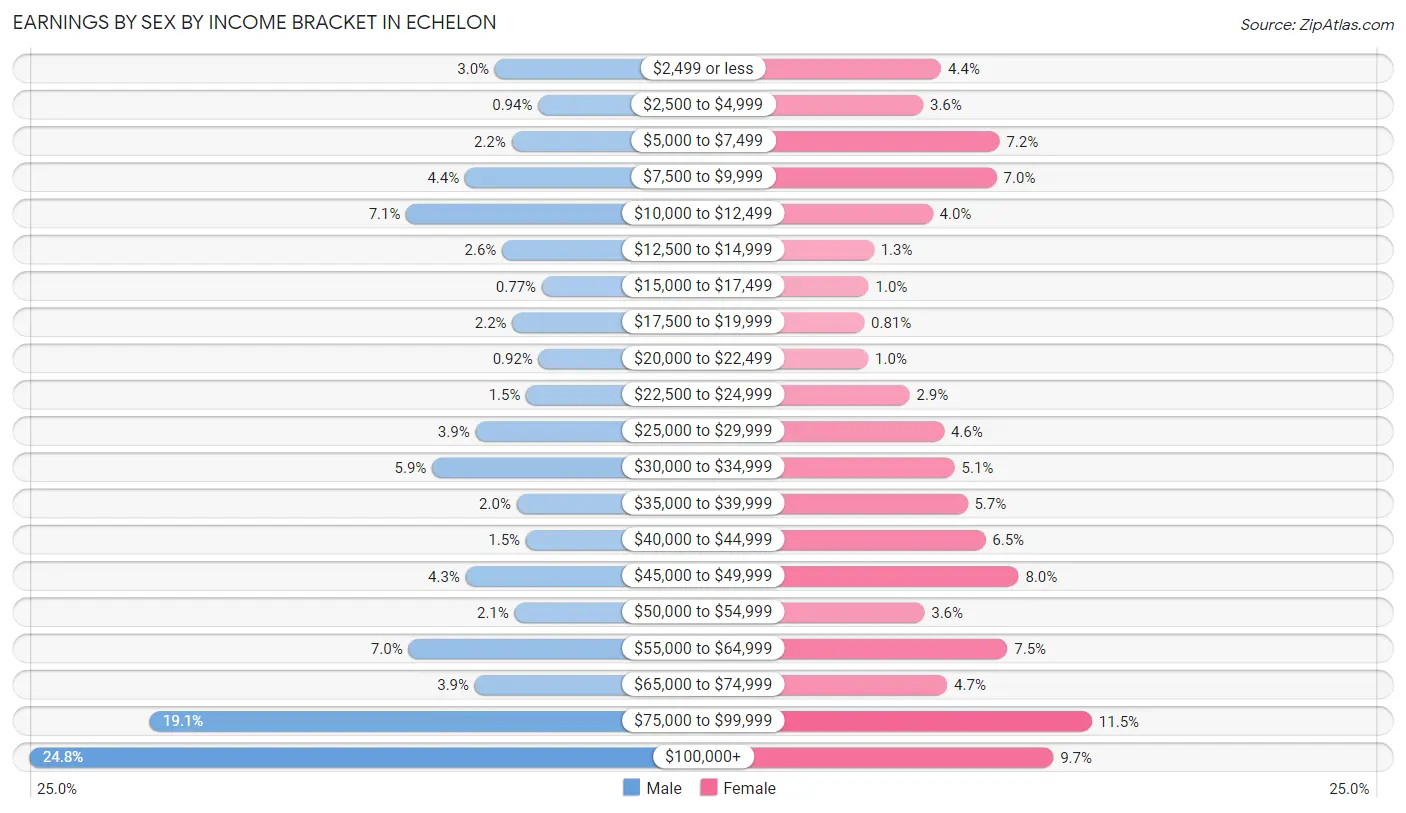
| Income | Male | Female |
| $2,499 or less | 123 (3.0%) | 168 (4.4%) |
| $2,500 to $4,999 | 39 (0.9%) | 136 (3.6%) |
| $5,000 to $7,499 | 91 (2.2%) | 272 (7.1%) |
| $7,500 to $9,999 | 181 (4.4%) | 267 (7.0%) |
| $10,000 to $12,499 | 295 (7.1%) | 153 (4.0%) |
| $12,500 to $14,999 | 109 (2.6%) | 48 (1.3%) |
| $15,000 to $17,499 | 32 (0.8%) | 39 (1.0%) |
| $17,500 to $19,999 | 89 (2.1%) | 31 (0.8%) |
| $20,000 to $22,499 | 38 (0.9%) | 38 (1.0%) |
| $22,500 to $24,999 | 62 (1.5%) | 112 (2.9%) |
| $25,000 to $29,999 | 161 (3.9%) | 173 (4.5%) |
| $30,000 to $34,999 | 245 (5.9%) | 192 (5.1%) |
| $35,000 to $39,999 | 81 (1.9%) | 215 (5.7%) |
| $40,000 to $44,999 | 63 (1.5%) | 247 (6.5%) |
| $45,000 to $49,999 | 180 (4.3%) | 306 (8.0%) |
| $50,000 to $54,999 | 85 (2.1%) | 138 (3.6%) |
| $55,000 to $64,999 | 291 (7.0%) | 286 (7.5%) |
| $65,000 to $74,999 | 162 (3.9%) | 179 (4.7%) |
| $75,000 to $99,999 | 793 (19.1%) | 437 (11.5%) |
| $100,000+ | 1,026 (24.7%) | 368 (9.7%) |
| Total | 4,146 (100.0%) | 3,805 (100.0%) |
Earnings by Sex by Educational Attainment in Echelon
Average earnings in Echelon are $75,738 for men and $45,614 for women, a difference of 39.8%. Men with an educational attainment of bachelor's degree enjoy the highest average annual earnings of $88,947, while those with college or associate's degree education earn the least with $45,377. Women with an educational attainment of bachelor's degree earn the most with the average annual earnings of $55,562, while those with high school diploma education have the smallest earnings of $37,000.
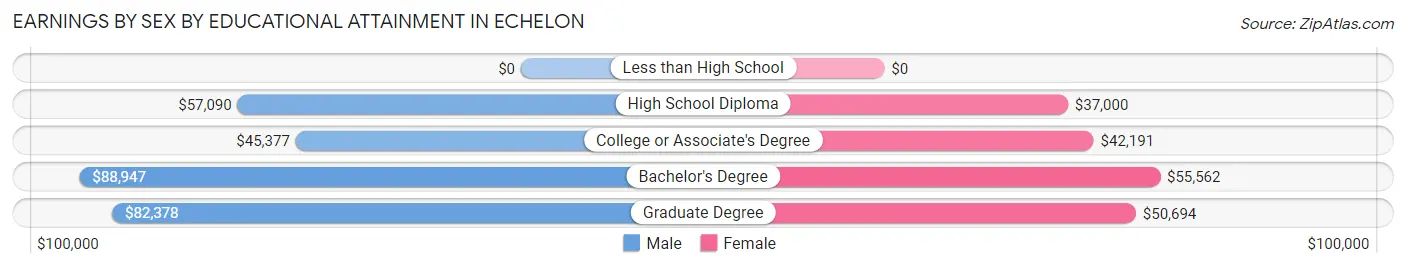
| Educational Attainment | Male Income | Female Income |
| Less than High School | - | - |
| High School Diploma | $57,090 | $37,000 |
| College or Associate's Degree | $45,377 | $42,191 |
| Bachelor's Degree | $88,947 | $55,562 |
| Graduate Degree | $82,378 | $50,694 |
| Total | $75,738 | $45,614 |
Family Income in Echelon
Family Income Brackets in Echelon
According to the Echelon family income data, there are 753 families falling into the $100,000 to $149,999 income range, which is the most common income bracket and makes up 25.9% of all families.
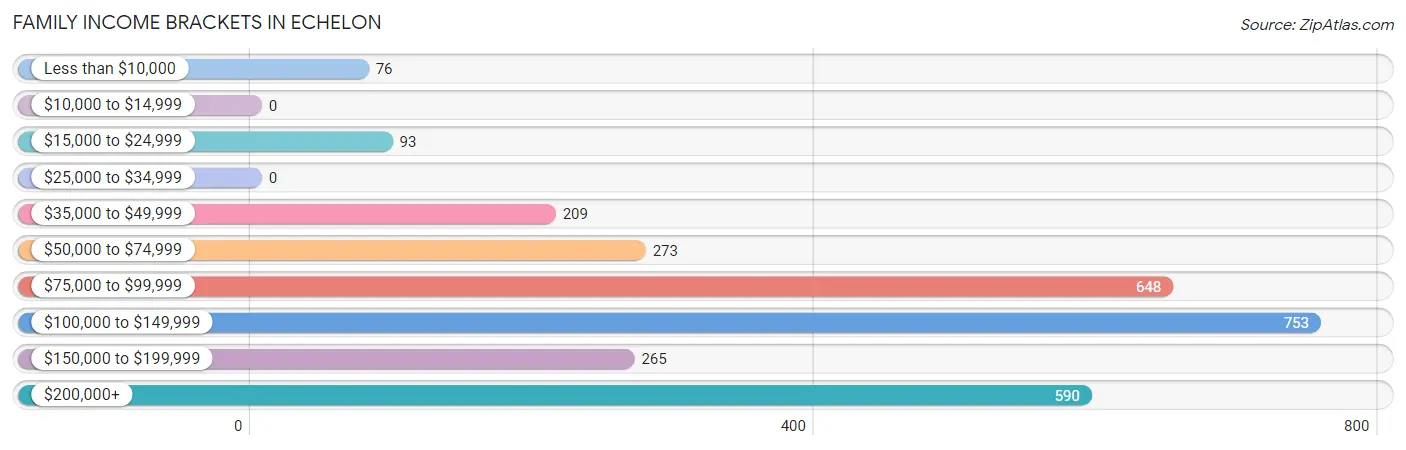
| Income Bracket | # Families | % Families |
| Less than $10,000 | 76 | 2.6% |
| $10,000 to $14,999 | 0 | 0.0% |
| $15,000 to $24,999 | 93 | 3.2% |
| $25,000 to $34,999 | 0 | 0.0% |
| $35,000 to $49,999 | 209 | 7.2% |
| $50,000 to $74,999 | 273 | 9.4% |
| $75,000 to $99,999 | 648 | 22.3% |
| $100,000 to $149,999 | 753 | 25.9% |
| $150,000 to $199,999 | 265 | 9.1% |
| $200,000+ | 590 | 20.3% |
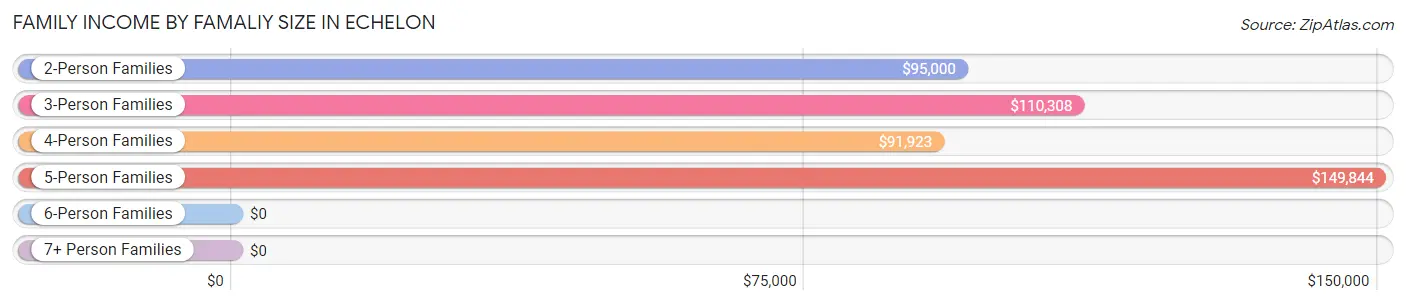
Family Income by Famaliy Size in Echelon
5-person families (445 | 15.3%) account for the highest median family income in Echelon with $149,844 per family, while 2-person families (1,034 | 35.6%) have the highest median income of $47,500 per family member.
| Income Bracket | # Families | Median Income |
| 2-Person Families | 1,034 (35.6%) | $95,000 |
| 3-Person Families | 711 (24.5%) | $110,308 |
| 4-Person Families | 714 (24.6%) | $91,923 |
| 5-Person Families | 445 (15.3%) | $149,844 |
| 6-Person Families | 3 (0.1%) | $0 |
| 7+ Person Families | 0 (0.0%) | $0 |
| Total | 2,907 (100.0%) | $109,526 |
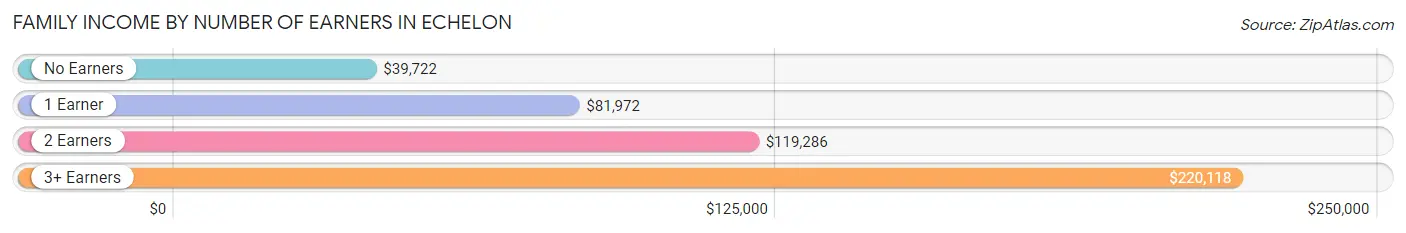
Family Income by Number of Earners in Echelon
The median family income in Echelon is $109,526, with families comprising 3+ earners (559) having the highest median family income of $220,118, while families with no earners (146) have the lowest median family income of $39,722, accounting for 19.2% and 5.0% of families, respectively.
| Number of Earners | # Families | Median Income |
| No Earners | 146 (5.0%) | $39,722 |
| 1 Earner | 1,040 (35.8%) | $81,972 |
| 2 Earners | 1,162 (40.0%) | $119,286 |
| 3+ Earners | 559 (19.2%) | $220,118 |
| Total | 2,907 (100.0%) | $109,526 |
Household Income in Echelon
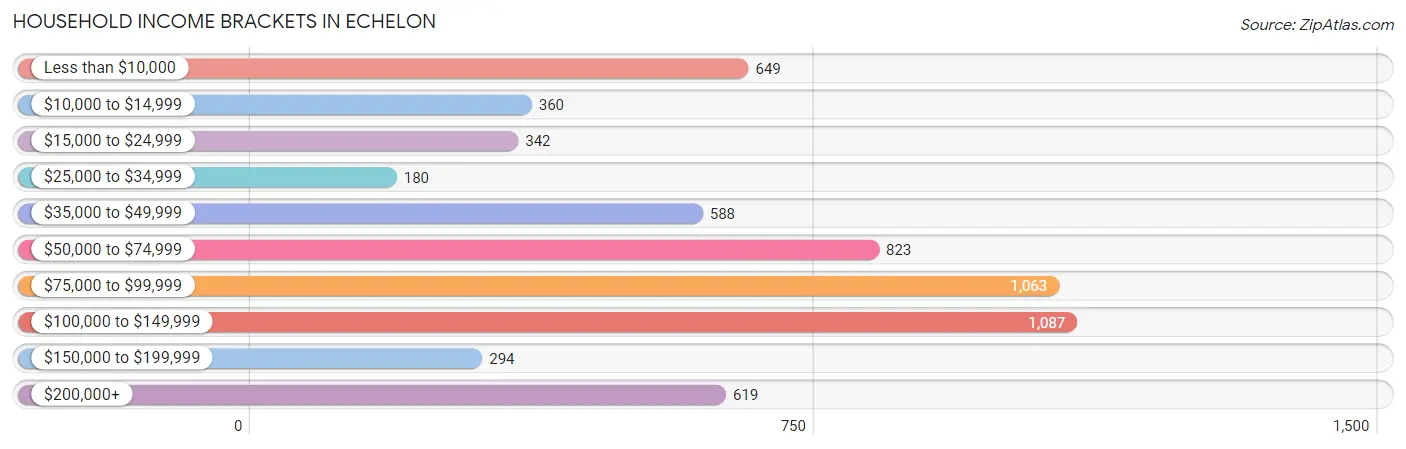
Household Income Brackets in Echelon
With 1,087 households falling in the category, the $100,000 to $149,999 income range is the most frequent in Echelon, accounting for 18.1% of all households. In contrast, only 180 households (3.0%) fall into the $25,000 to $34,999 income bracket, making it the least populous group.
| Income Bracket | # Households | % Households |
| Less than $10,000 | 649 | 10.8% |
| $10,000 to $14,999 | 360 | 6.0% |
| $15,000 to $24,999 | 342 | 5.7% |
| $25,000 to $34,999 | 180 | 3.0% |
| $35,000 to $49,999 | 588 | 9.8% |
| $50,000 to $74,999 | 823 | 13.7% |
| $75,000 to $99,999 | 1,063 | 17.7% |
| $100,000 to $149,999 | 1,087 | 18.1% |
| $150,000 to $199,999 | 294 | 4.9% |
| $200,000+ | 619 | 10.3% |
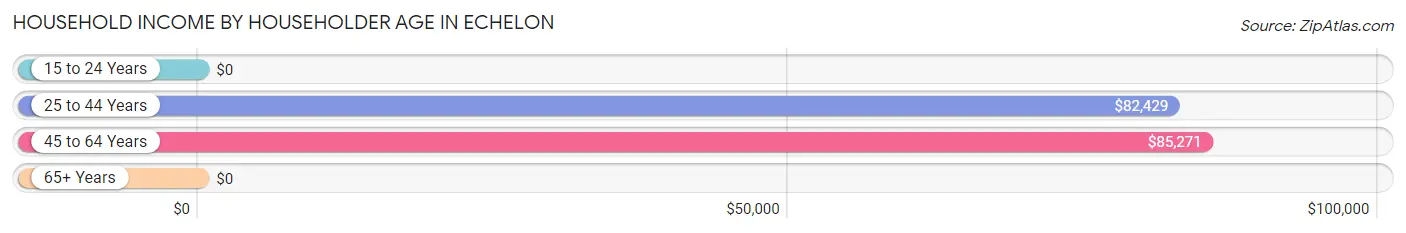
Household Income by Householder Age in Echelon
The median household income in Echelon is $75,874, with the highest median household income of $85,271 found in the 45 to 64 years age bracket for the primary householder. A total of 1,947 households (32.4%) fall into this category. Meanwhile, the 15 to 24 years age bracket for the primary householder has the lowest median household income of $0, with 329 households (5.5%) in this group.
| Income Bracket | # Households | Median Income |
| 15 to 24 Years | 329 (5.5%) | $0 |
| 25 to 44 Years | 2,533 (42.2%) | $82,429 |
| 45 to 64 Years | 1,947 (32.4%) | $85,271 |
| 65+ Years | 1,196 (19.9%) | $0 |
| Total | 6,005 (100.0%) | $75,874 |
Poverty in Echelon
Income Below Poverty by Sex and Age in Echelon
With 12.2% poverty level for males and 13.7% for females among the residents of Echelon, 18 to 24 year old males and 75 year old and over females are the most vulnerable to poverty, with 291 males (37.6%) and 251 females (46.0%) in their respective age groups living below the poverty level.
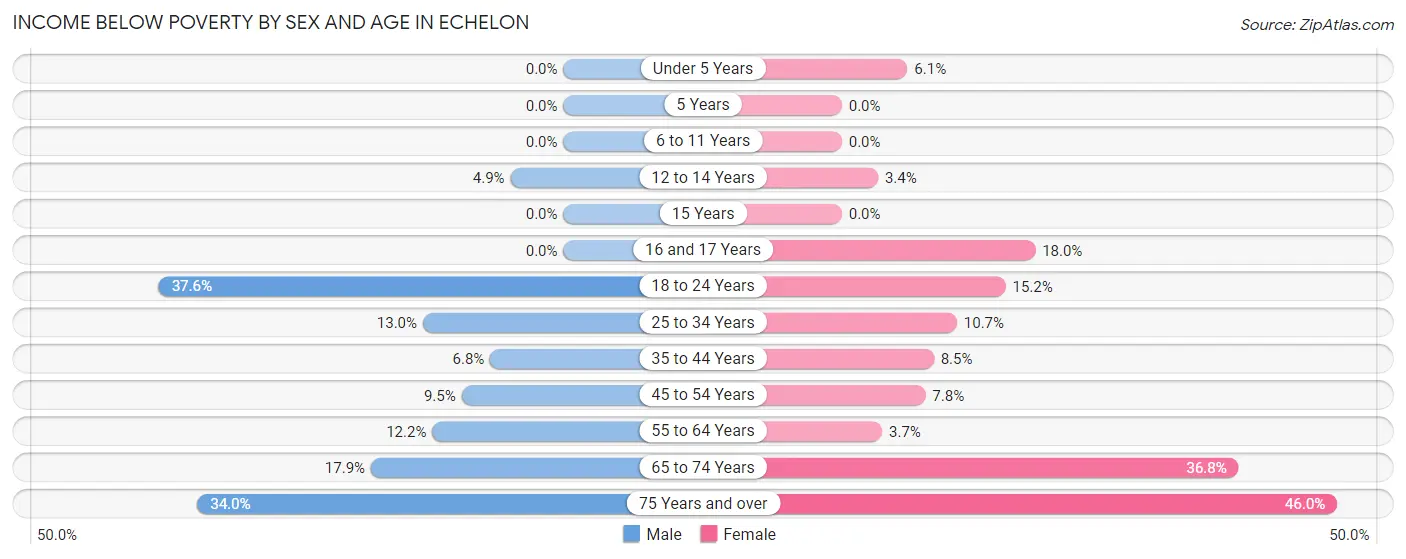
| Age Bracket | Male | Female |
| Under 5 Years | 0 (0.0%) | 22 (6.1%) |
| 5 Years | 0 (0.0%) | 0 (0.0%) |
| 6 to 11 Years | 0 (0.0%) | 0 (0.0%) |
| 12 to 14 Years | 19 (4.9%) | 5 (3.4%) |
| 15 Years | 0 (0.0%) | 0 (0.0%) |
| 16 and 17 Years | 0 (0.0%) | 35 (17.9%) |
| 18 to 24 Years | 291 (37.6%) | 109 (15.2%) |
| 25 to 34 Years | 169 (13.0%) | 136 (10.7%) |
| 35 to 44 Years | 75 (6.8%) | 80 (8.5%) |
| 45 to 54 Years | 70 (9.5%) | 71 (7.8%) |
| 55 to 64 Years | 69 (12.2%) | 26 (3.7%) |
| 65 to 74 Years | 60 (17.9%) | 204 (36.8%) |
| 75 Years and over | 53 (34.0%) | 251 (46.0%) |
| Total | 806 (12.2%) | 939 (13.7%) |
Income Above Poverty by Sex and Age in Echelon
According to the poverty statistics in Echelon, males aged under 5 years and females aged 5 years are the age groups that are most secure financially, with 100.0% of males and 100.0% of females in these age groups living above the poverty line.
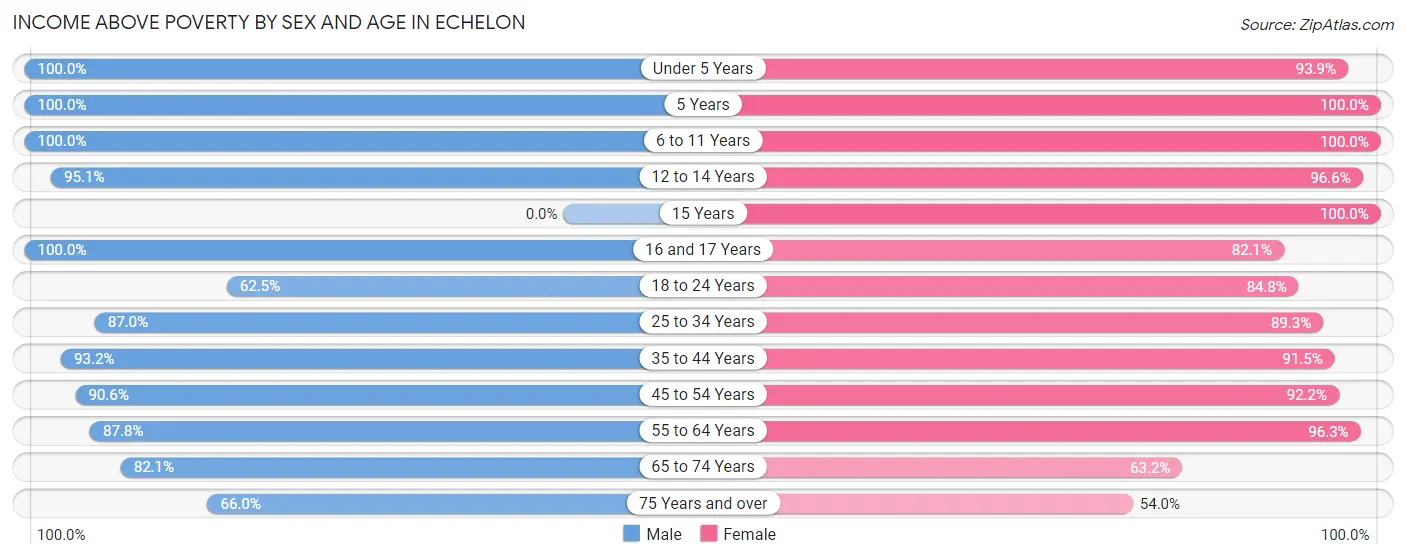
| Age Bracket | Male | Female |
| Under 5 Years | 249 (100.0%) | 339 (93.9%) |
| 5 Years | 78 (100.0%) | 50 (100.0%) |
| 6 to 11 Years | 865 (100.0%) | 331 (100.0%) |
| 12 to 14 Years | 368 (95.1%) | 144 (96.6%) |
| 15 Years | 0 (0.0%) | 110 (100.0%) |
| 16 and 17 Years | 75 (100.0%) | 160 (82.1%) |
| 18 to 24 Years | 484 (62.5%) | 608 (84.8%) |
| 25 to 34 Years | 1,127 (87.0%) | 1,137 (89.3%) |
| 35 to 44 Years | 1,029 (93.2%) | 858 (91.5%) |
| 45 to 54 Years | 671 (90.5%) | 844 (92.2%) |
| 55 to 64 Years | 498 (87.8%) | 669 (96.3%) |
| 65 to 74 Years | 276 (82.1%) | 350 (63.2%) |
| 75 Years and over | 103 (66.0%) | 295 (54.0%) |
| Total | 5,823 (87.8%) | 5,895 (86.3%) |
Income Below Poverty Among Married-Couple Families in Echelon
The poverty statistics for married-couple families in Echelon show that 1.2% or 25 of the total 2,102 families live below the poverty line. Families with 1 or 2 children have the highest poverty rate of 1.3%, comprising of 15 families. On the other hand, families with 3 or 4 children have the lowest poverty rate of 0.0%, which includes 0 families.
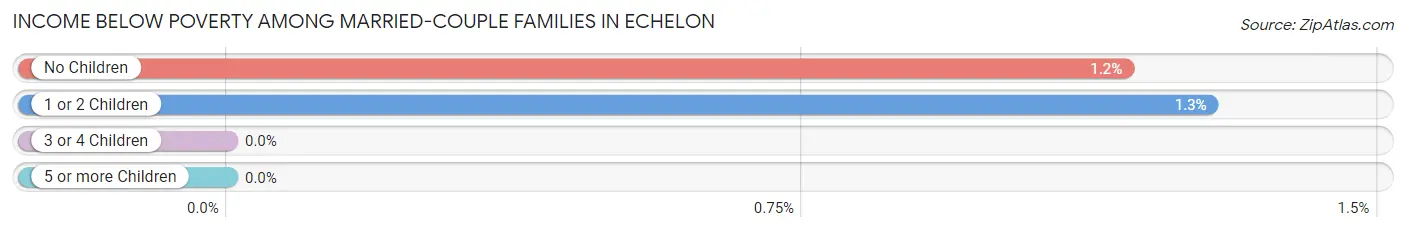
| Children | Above Poverty | Below Poverty |
| No Children | 842 (98.8%) | 10 (1.2%) |
| 1 or 2 Children | 1,154 (98.7%) | 15 (1.3%) |
| 3 or 4 Children | 81 (100.0%) | 0 (0.0%) |
| 5 or more Children | 0 (0.0%) | 0 (0.0%) |
| Total | 2,077 (98.8%) | 25 (1.2%) |
Income Below Poverty Among Single-Parent Households in Echelon
According to the poverty data in Echelon, 10.4% or 26 single-father households and 5.4% or 30 single-mother households are living below the poverty line. Among single-father households, those with 1 or 2 children have the highest poverty rate, with 26 households (14.2%) experiencing poverty. Likewise, among single-mother households, those with 1 or 2 children have the highest poverty rate, with 30 households (11.8%) falling below the poverty line.
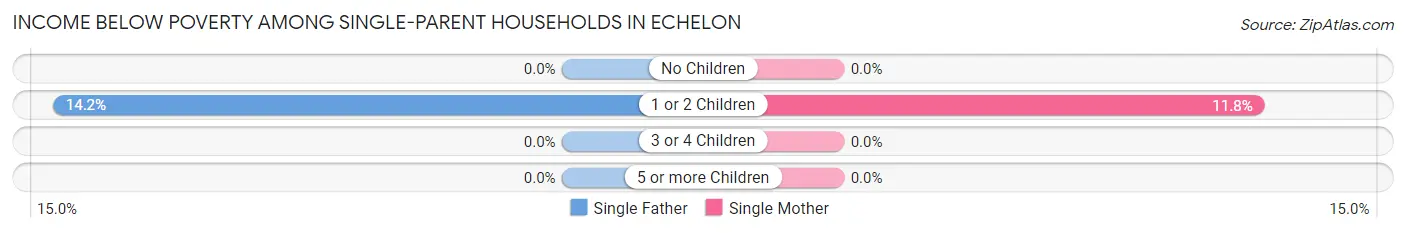
| Children | Single Father | Single Mother |
| No Children | 0 (0.0%) | 0 (0.0%) |
| 1 or 2 Children | 26 (14.2%) | 30 (11.8%) |
| 3 or 4 Children | 0 (0.0%) | 0 (0.0%) |
| 5 or more Children | 0 (0.0%) | 0 (0.0%) |
| Total | 26 (10.4%) | 30 (5.4%) |
Income Below Poverty Among Married-Couple vs Single-Parent Households in Echelon
The poverty data for Echelon shows that 25 of the married-couple family households (1.2%) and 56 of the single-parent households (7.0%) are living below the poverty level. Within the married-couple family households, those with 1 or 2 children have the highest poverty rate, with 15 households (1.3%) falling below the poverty line. Among the single-parent households, those with 1 or 2 children have the highest poverty rate, with 56 household (12.8%) living below poverty.
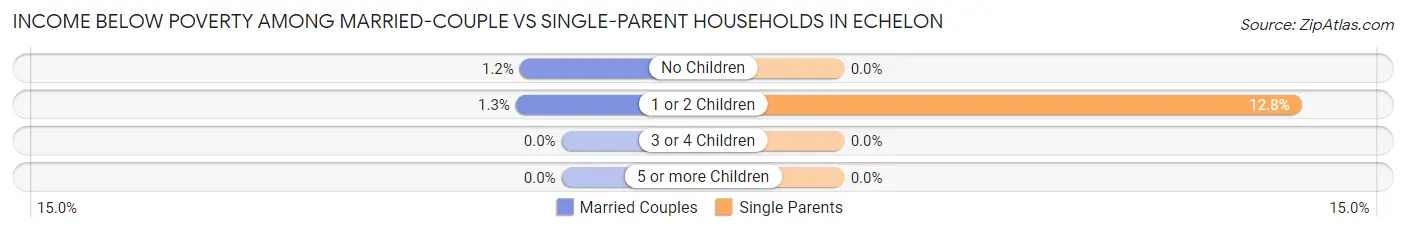
| Children | Married-Couple Families | Single-Parent Households |
| No Children | 10 (1.2%) | 0 (0.0%) |
| 1 or 2 Children | 15 (1.3%) | 56 (12.8%) |
| 3 or 4 Children | 0 (0.0%) | 0 (0.0%) |
| 5 or more Children | 0 (0.0%) | 0 (0.0%) |
| Total | 25 (1.2%) | 56 (7.0%) |
Employment Characteristics in Echelon
Employment by Class of Employer in Echelon
Among the 7,001 employed individuals in Echelon, private company employees (4,567 | 65.2%), not-for-profit organizations (693 | 9.9%), and local government employees (492 | 7.0%) make up the most common classes of employment.
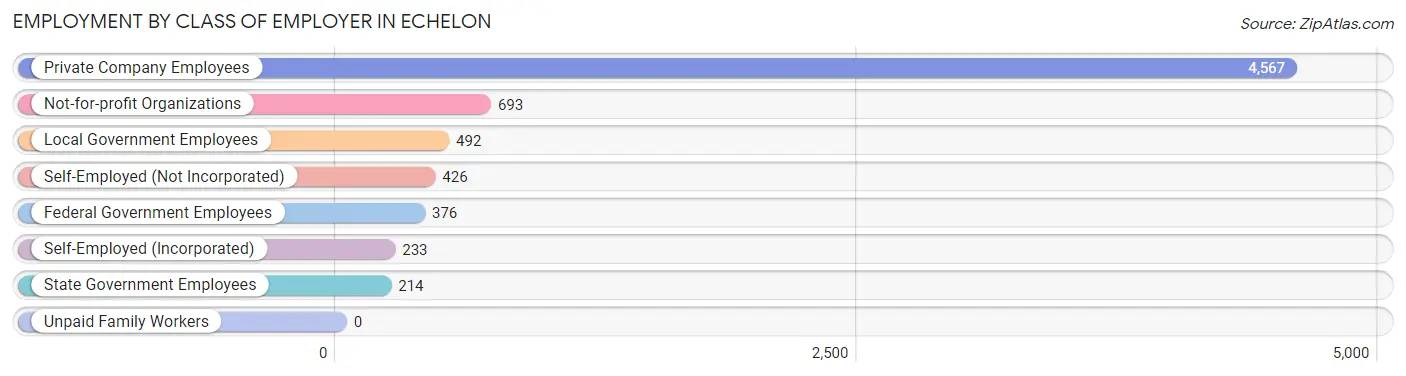
| Employer Class | # Employees | % Employees |
| Private Company Employees | 4,567 | 65.2% |
| Self-Employed (Incorporated) | 233 | 3.3% |
| Self-Employed (Not Incorporated) | 426 | 6.1% |
| Not-for-profit Organizations | 693 | 9.9% |
| Local Government Employees | 492 | 7.0% |
| State Government Employees | 214 | 3.1% |
| Federal Government Employees | 376 | 5.4% |
| Unpaid Family Workers | 0 | 0.0% |
| Total | 7,001 | 100.0% |
Employment Status by Age in Echelon
According to the labor force statistics for Echelon, out of the total population over 16 years of age (10,973), 69.5% or 7,626 individuals are in the labor force, with 6.6% or 503 of them unemployed. The age group with the highest labor force participation rate is 45 to 54 years, with 93.6% or 1,568 individuals in the labor force. Within the labor force, the 65 to 74 years age range has the highest percentage of unemployed individuals, with 20.4% or 65 of them being unemployed.
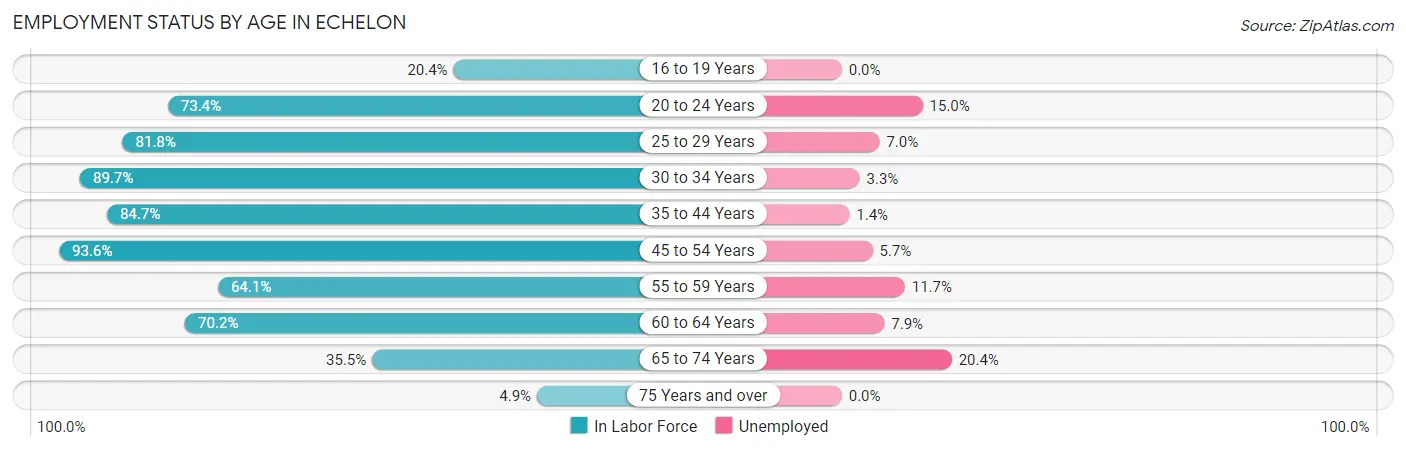
| Age Bracket | In Labor Force | Unemployed |
| 16 to 19 Years | 142 (20.4%) | 0 (0.0%) |
| 20 to 24 Years | 788 (73.4%) | 118 (15.0%) |
| 25 to 29 Years | 1,325 (81.8%) | 93 (7.0%) |
| 30 to 34 Years | 858 (89.7%) | 28 (3.3%) |
| 35 to 44 Years | 1,730 (84.7%) | 24 (1.4%) |
| 45 to 54 Years | 1,568 (93.6%) | 89 (5.7%) |
| 55 to 59 Years | 401 (64.1%) | 47 (11.7%) |
| 60 to 64 Years | 458 (70.2%) | 36 (7.9%) |
| 65 to 74 Years | 318 (35.5%) | 65 (20.4%) |
| 75 Years and over | 36 (4.9%) | 0 (0.0%) |
| Total | 7,626 (69.5%) | 503 (6.6%) |
Employment Status by Educational Attainment in Echelon
According to labor force statistics for Echelon, 83.7% of individuals (6,337) out of the total population between 25 and 64 years of age (7,571) are in the labor force, with 5.0% or 317 of them being unemployed. The group with the highest labor force participation rate are those with the educational attainment of college / associate degree, with 86.5% or 1,662 individuals in the labor force. Within the labor force, individuals with less than high school education have the highest percentage of unemployment, with 26.9% or 81 of them being unemployed.
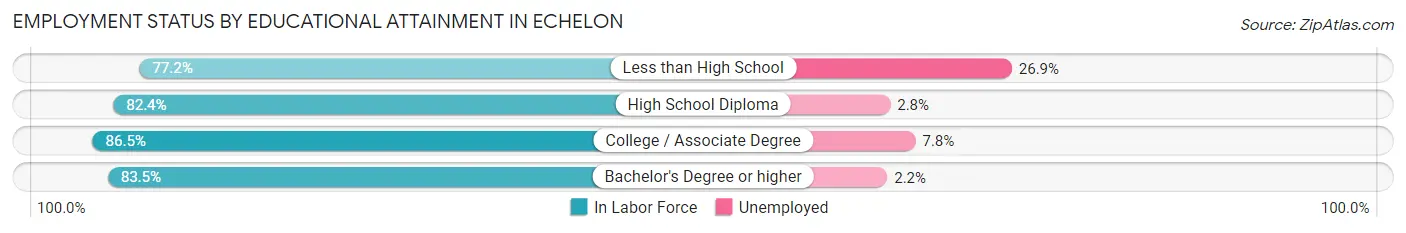
| Educational Attainment | In Labor Force | Unemployed |
| Less than High School | 301 (77.2%) | 105 (26.9%) |
| High School Diploma | 1,065 (82.4%) | 36 (2.8%) |
| College / Associate Degree | 1,662 (86.5%) | 150 (7.8%) |
| Bachelor's Degree or higher | 3,313 (83.5%) | 87 (2.2%) |
| Total | 6,337 (83.7%) | 379 (5.0%) |
Employment Occupations by Sex in Echelon
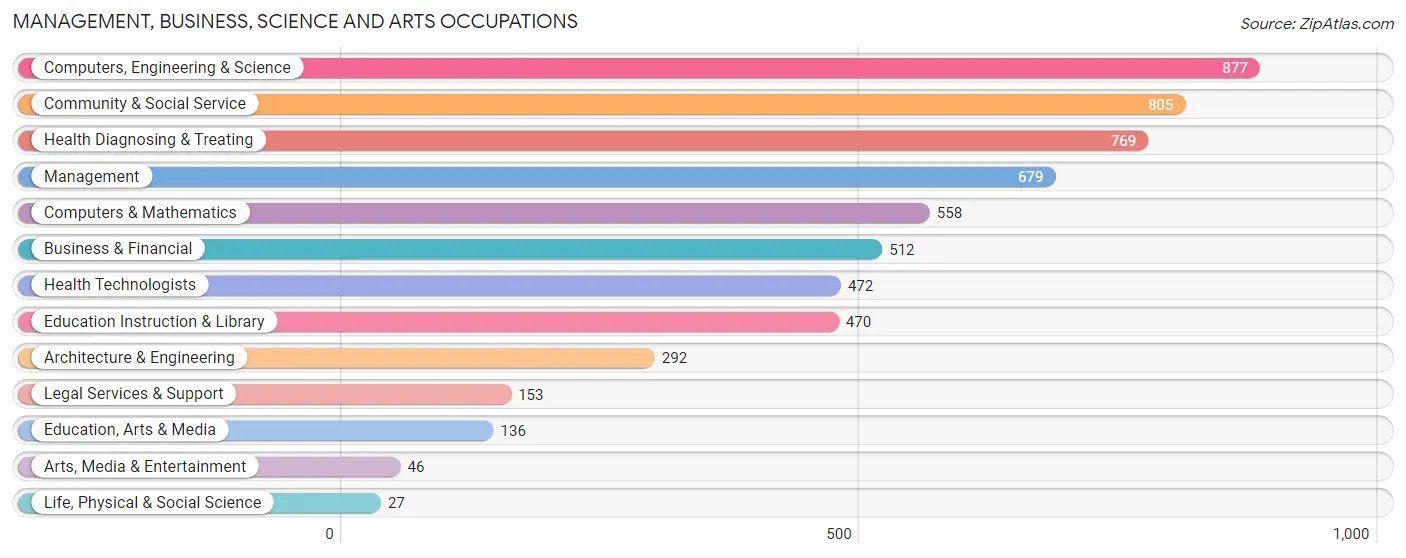
Management, Business, Science and Arts Occupations
The most common Management, Business, Science and Arts occupations in Echelon are Computers, Engineering & Science (877 | 12.5%), Community & Social Service (805 | 11.5%), Health Diagnosing & Treating (769 | 11.0%), Management (679 | 9.7%), and Computers & Mathematics (558 | 7.9%).
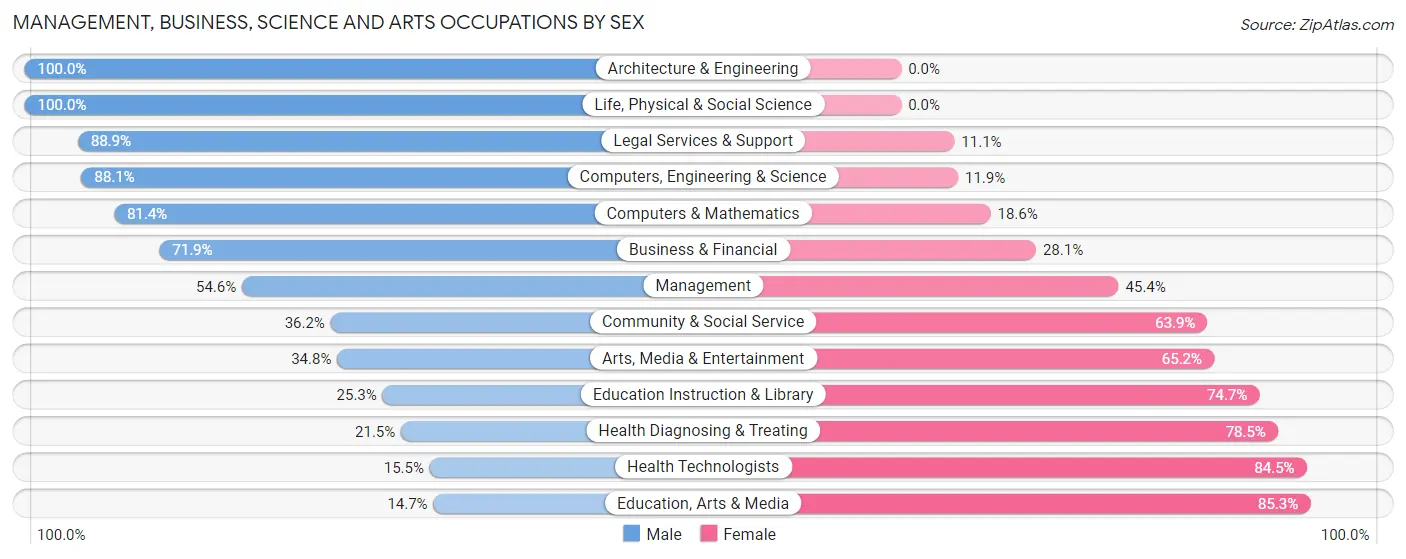
Management, Business, Science and Arts Occupations by Sex
Within the Management, Business, Science and Arts occupations in Echelon, the most male-oriented occupations are Architecture & Engineering (100.0%), Life, Physical & Social Science (100.0%), and Legal Services & Support (88.9%), while the most female-oriented occupations are Education, Arts & Media (85.3%), Health Technologists (84.5%), and Health Diagnosing & Treating (78.5%).
| Occupation | Male | Female |
| Management | 371 (54.6%) | 308 (45.4%) |
| Business & Financial | 368 (71.9%) | 144 (28.1%) |
| Computers, Engineering & Science | 773 (88.1%) | 104 (11.9%) |
| Computers & Mathematics | 454 (81.4%) | 104 (18.6%) |
| Architecture & Engineering | 292 (100.0%) | 0 (0.0%) |
| Life, Physical & Social Science | 27 (100.0%) | 0 (0.0%) |
| Community & Social Service | 291 (36.1%) | 514 (63.8%) |
| Education, Arts & Media | 20 (14.7%) | 116 (85.3%) |
| Legal Services & Support | 136 (88.9%) | 17 (11.1%) |
| Education Instruction & Library | 119 (25.3%) | 351 (74.7%) |
| Arts, Media & Entertainment | 16 (34.8%) | 30 (65.2%) |
| Health Diagnosing & Treating | 165 (21.5%) | 604 (78.5%) |
| Health Technologists | 73 (15.5%) | 399 (84.5%) |
| Total (Category) | 1,968 (54.0%) | 1,674 (46.0%) |
| Total (Overall) | 3,705 (52.7%) | 3,321 (47.3%) |
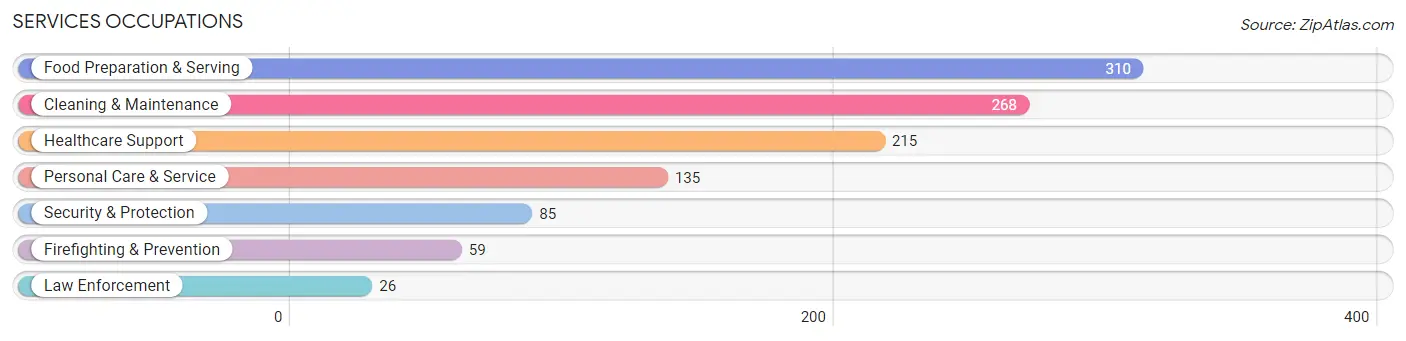
Services Occupations
The most common Services occupations in Echelon are Food Preparation & Serving (310 | 4.4%), Cleaning & Maintenance (268 | 3.8%), Healthcare Support (215 | 3.1%), Personal Care & Service (135 | 1.9%), and Security & Protection (85 | 1.2%).
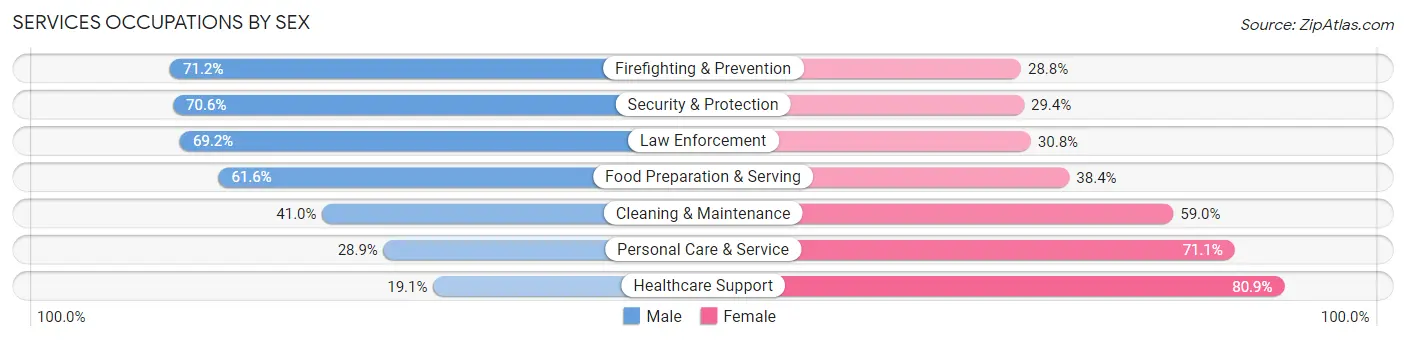
Services Occupations by Sex
Within the Services occupations in Echelon, the most male-oriented occupations are Firefighting & Prevention (71.2%), Security & Protection (70.6%), and Law Enforcement (69.2%), while the most female-oriented occupations are Healthcare Support (80.9%), Personal Care & Service (71.1%), and Cleaning & Maintenance (59.0%).
| Occupation | Male | Female |
| Healthcare Support | 41 (19.1%) | 174 (80.9%) |
| Security & Protection | 60 (70.6%) | 25 (29.4%) |
| Firefighting & Prevention | 42 (71.2%) | 17 (28.8%) |
| Law Enforcement | 18 (69.2%) | 8 (30.8%) |
| Food Preparation & Serving | 191 (61.6%) | 119 (38.4%) |
| Cleaning & Maintenance | 110 (41.0%) | 158 (59.0%) |
| Personal Care & Service | 39 (28.9%) | 96 (71.1%) |
| Total (Category) | 441 (43.5%) | 572 (56.5%) |
| Total (Overall) | 3,705 (52.7%) | 3,321 (47.3%) |
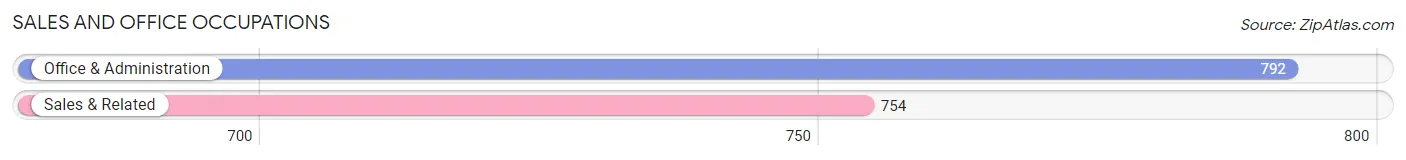
Sales and Office Occupations
The most common Sales and Office occupations in Echelon are Office & Administration (792 | 11.3%), and Sales & Related (754 | 10.7%).
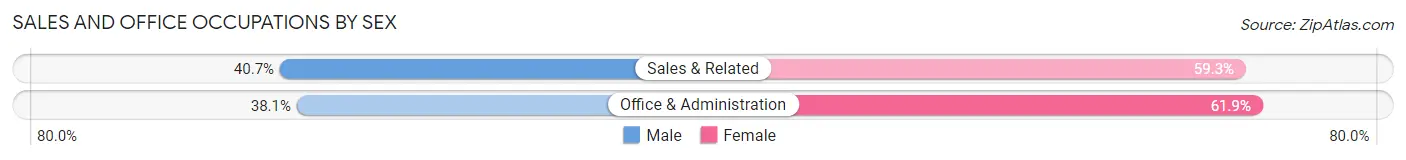
Sales and Office Occupations by Sex
| Occupation | Male | Female |
| Sales & Related | 307 (40.7%) | 447 (59.3%) |
| Office & Administration | 302 (38.1%) | 490 (61.9%) |
| Total (Category) | 609 (39.4%) | 937 (60.6%) |
| Total (Overall) | 3,705 (52.7%) | 3,321 (47.3%) |
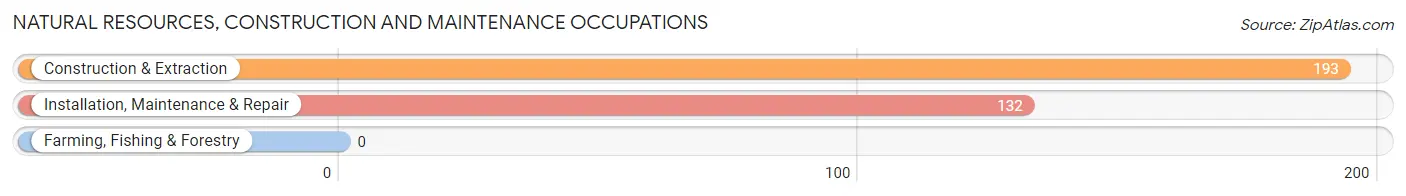
Natural Resources, Construction and Maintenance Occupations
The most common Natural Resources, Construction and Maintenance occupations in Echelon are Construction & Extraction (193 | 2.8%), and Installation, Maintenance & Repair (132 | 1.9%).
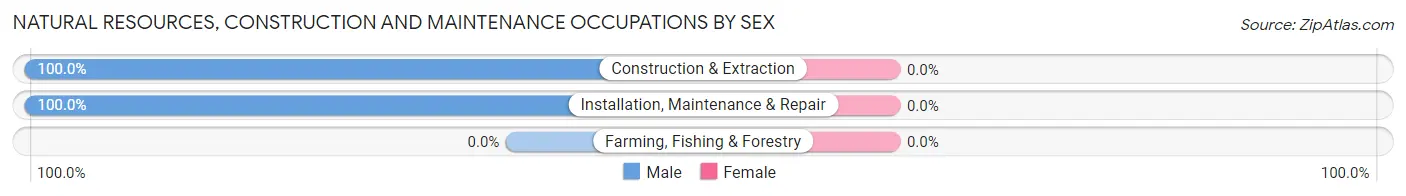
Natural Resources, Construction and Maintenance Occupations by Sex
| Occupation | Male | Female |
| Farming, Fishing & Forestry | 0 (0.0%) | 0 (0.0%) |
| Construction & Extraction | 193 (100.0%) | 0 (0.0%) |
| Installation, Maintenance & Repair | 132 (100.0%) | 0 (0.0%) |
| Total (Category) | 325 (100.0%) | 0 (0.0%) |
| Total (Overall) | 3,705 (52.7%) | 3,321 (47.3%) |
Production, Transportation and Moving Occupations
The most common Production, Transportation and Moving occupations in Echelon are Material Moving (204 | 2.9%), Production (191 | 2.7%), and Transportation (105 | 1.5%).
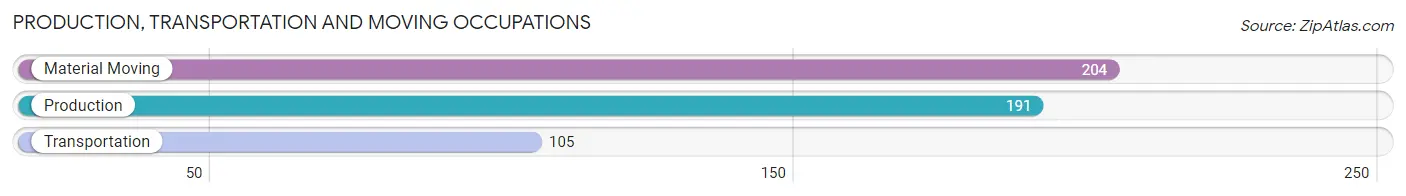
Production, Transportation and Moving Occupations by Sex
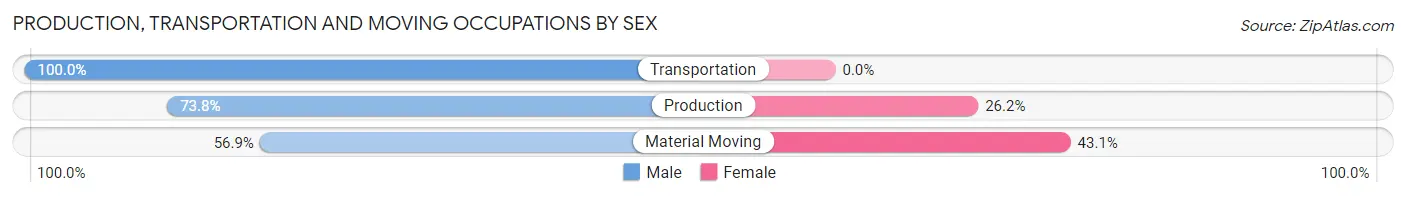
| Occupation | Male | Female |
| Production | 141 (73.8%) | 50 (26.2%) |
| Transportation | 105 (100.0%) | 0 (0.0%) |
| Material Moving | 116 (56.9%) | 88 (43.1%) |
| Total (Category) | 362 (72.4%) | 138 (27.6%) |
| Total (Overall) | 3,705 (52.7%) | 3,321 (47.3%) |
Employment Industries by Sex in Echelon
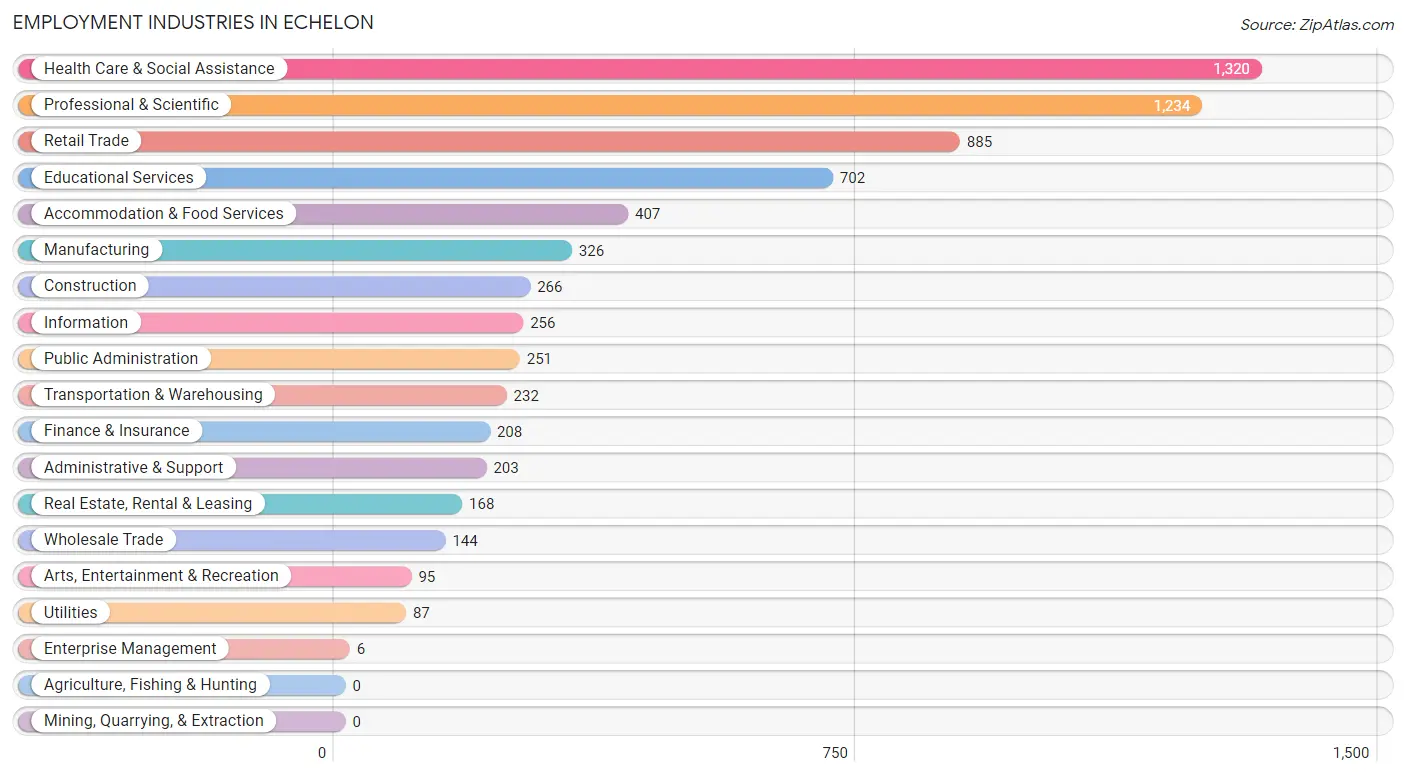
Employment Industries in Echelon
The major employment industries in Echelon include Health Care & Social Assistance (1,320 | 18.8%), Professional & Scientific (1,234 | 17.6%), Retail Trade (885 | 12.6%), Educational Services (702 | 10.0%), and Accommodation & Food Services (407 | 5.8%).
Employment Industries by Sex in Echelon
The Echelon industries that see more men than women are Construction (94.0%), Transportation & Warehousing (91.4%), and Professional & Scientific (82.8%), whereas the industries that tend to have a higher number of women are Enterprise Management (100.0%), Health Care & Social Assistance (85.8%), and Real Estate, Rental & Leasing (75.6%).
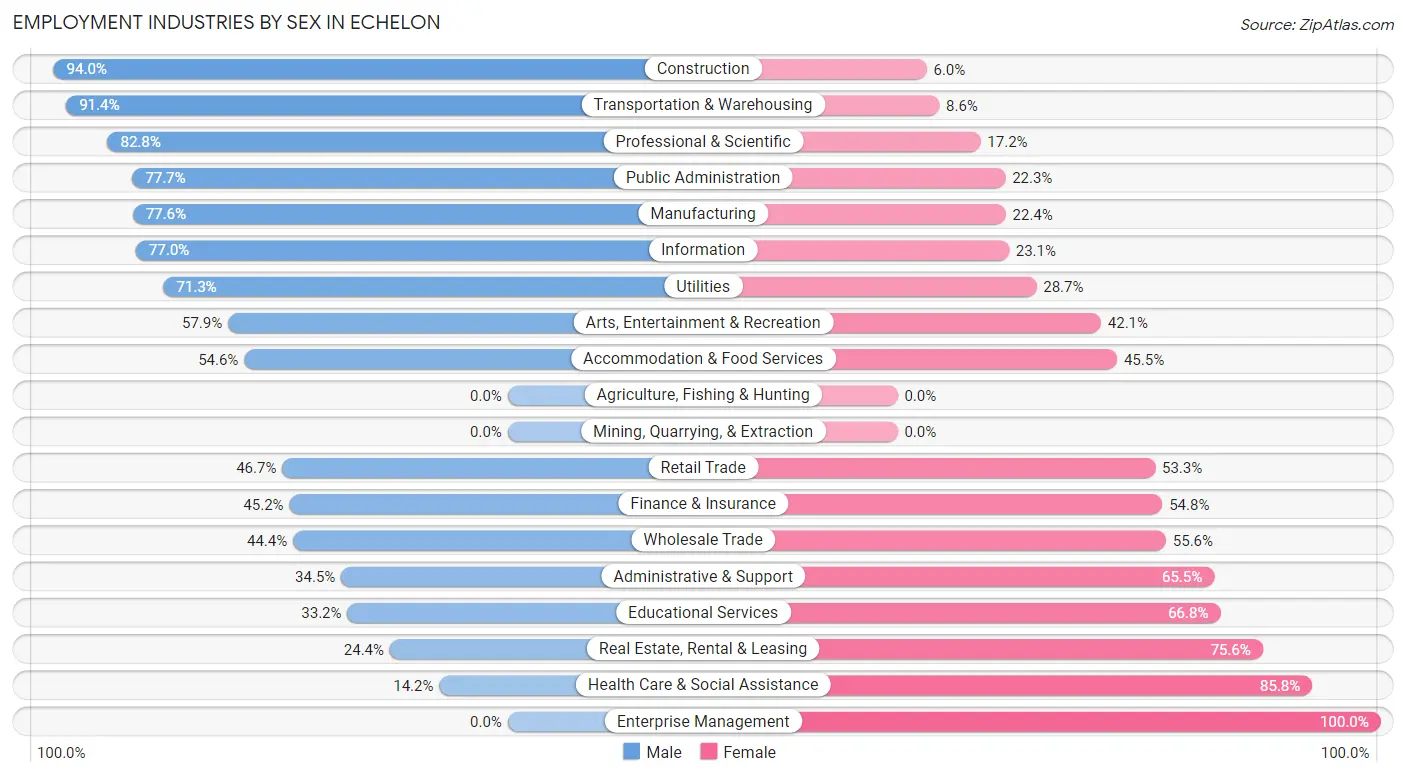
| Industry | Male | Female |
| Agriculture, Fishing & Hunting | 0 (0.0%) | 0 (0.0%) |
| Mining, Quarrying, & Extraction | 0 (0.0%) | 0 (0.0%) |
| Construction | 250 (94.0%) | 16 (6.0%) |
| Manufacturing | 253 (77.6%) | 73 (22.4%) |
| Wholesale Trade | 64 (44.4%) | 80 (55.6%) |
| Retail Trade | 413 (46.7%) | 472 (53.3%) |
| Transportation & Warehousing | 212 (91.4%) | 20 (8.6%) |
| Utilities | 62 (71.3%) | 25 (28.7%) |
| Information | 197 (76.9%) | 59 (23.1%) |
| Finance & Insurance | 94 (45.2%) | 114 (54.8%) |
| Real Estate, Rental & Leasing | 41 (24.4%) | 127 (75.6%) |
| Professional & Scientific | 1,022 (82.8%) | 212 (17.2%) |
| Enterprise Management | 0 (0.0%) | 6 (100.0%) |
| Administrative & Support | 70 (34.5%) | 133 (65.5%) |
| Educational Services | 233 (33.2%) | 469 (66.8%) |
| Health Care & Social Assistance | 187 (14.2%) | 1,133 (85.8%) |
| Arts, Entertainment & Recreation | 55 (57.9%) | 40 (42.1%) |
| Accommodation & Food Services | 222 (54.5%) | 185 (45.5%) |
| Public Administration | 195 (77.7%) | 56 (22.3%) |
| Total | 3,705 (52.7%) | 3,321 (47.3%) |
Education in Echelon
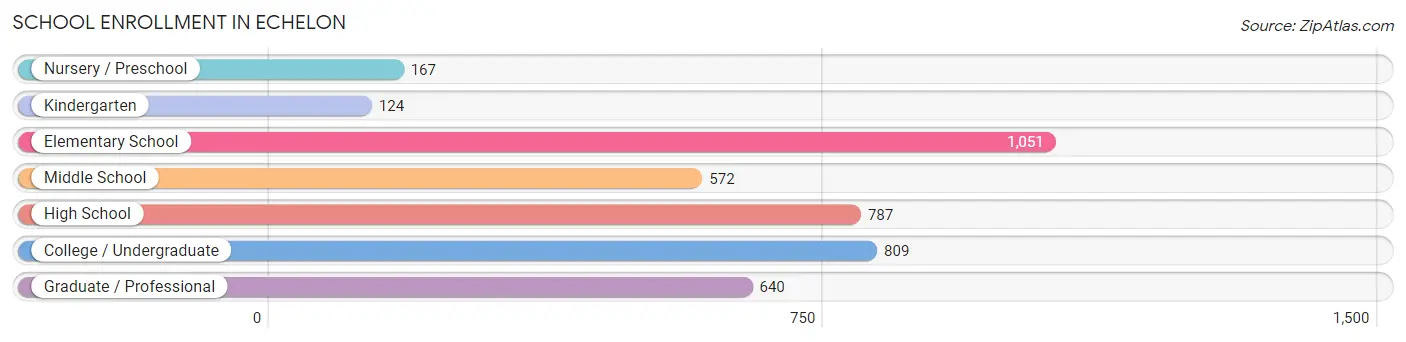
School Enrollment in Echelon
The most common levels of schooling among the 4,150 students in Echelon are elementary school (1,051 | 25.3%), college / undergraduate (809 | 19.5%), and high school (787 | 19.0%).
| School Level | # Students | % Students |
| Nursery / Preschool | 167 | 4.0% |
| Kindergarten | 124 | 3.0% |
| Elementary School | 1,051 | 25.3% |
| Middle School | 572 | 13.8% |
| High School | 787 | 19.0% |
| College / Undergraduate | 809 | 19.5% |
| Graduate / Professional | 640 | 15.4% |
| Total | 4,150 | 100.0% |
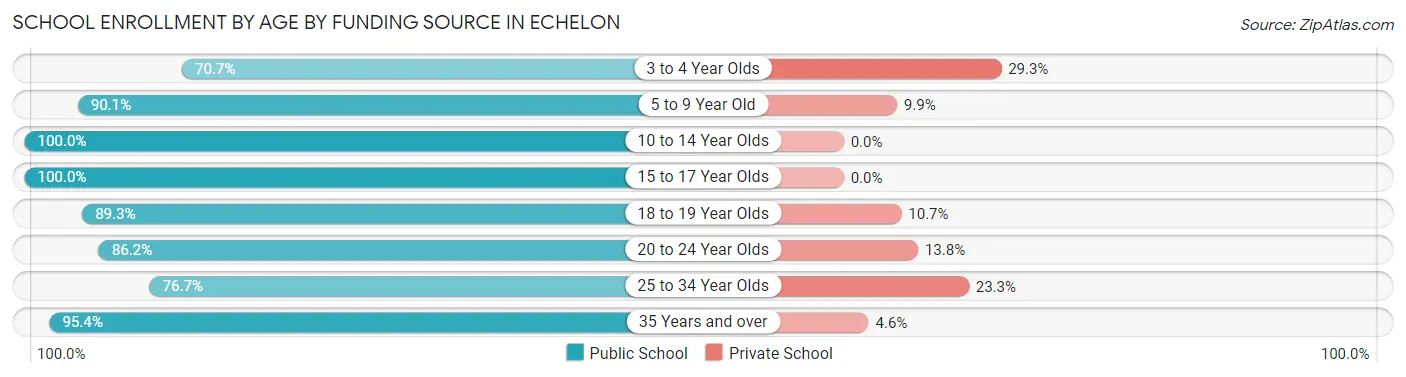
School Enrollment by Age by Funding Source in Echelon
Out of a total of 4,150 students who are enrolled in schools in Echelon, 427 (10.3%) attend a private institution, while the remaining 3,723 (89.7%) are enrolled in public schools. The age group of 3 to 4 year olds has the highest likelihood of being enrolled in private schools, with 49 (29.3% in the age bracket) enrolled. Conversely, the age group of 10 to 14 year olds has the lowest likelihood of being enrolled in a private school, with 728 (100.0% in the age bracket) attending a public institution.
| Age Bracket | Public School | Private School |
| 3 to 4 Year Olds | 118 (70.7%) | 49 (29.3%) |
| 5 to 9 Year Old | 972 (90.1%) | 107 (9.9%) |
| 10 to 14 Year Olds | 728 (100.0%) | 0 (0.0%) |
| 15 to 17 Year Olds | 382 (100.0%) | 0 (0.0%) |
| 18 to 19 Year Olds | 374 (89.3%) | 45 (10.7%) |
| 20 to 24 Year Olds | 585 (86.2%) | 94 (13.8%) |
| 25 to 34 Year Olds | 418 (76.7%) | 127 (23.3%) |
| 35 Years and over | 144 (95.4%) | 7 (4.6%) |
| Total | 3,723 (89.7%) | 427 (10.3%) |
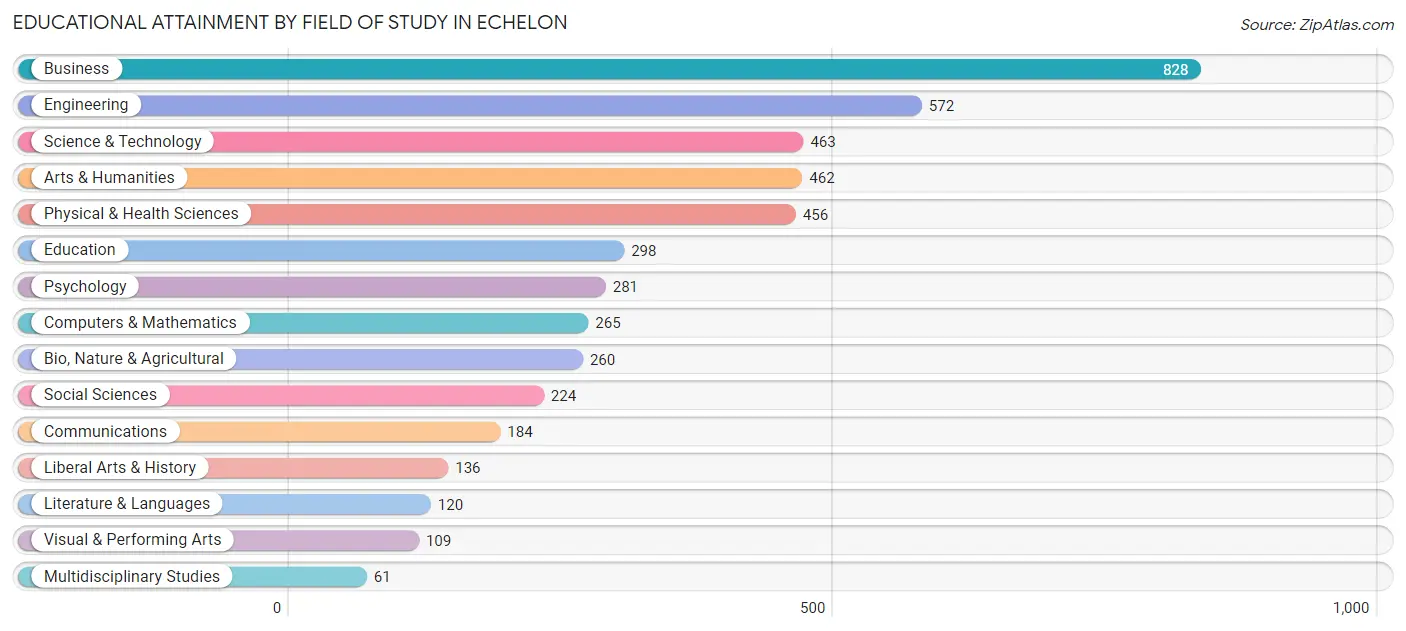
Educational Attainment by Field of Study in Echelon
Business (828 | 17.5%), engineering (572 | 12.1%), science & technology (463 | 9.8%), arts & humanities (462 | 9.8%), and physical & health sciences (456 | 9.7%) are the most common fields of study among 4,719 individuals in Echelon who have obtained a bachelor's degree or higher.
| Field of Study | # Graduates | % Graduates |
| Computers & Mathematics | 265 | 5.6% |
| Bio, Nature & Agricultural | 260 | 5.5% |
| Physical & Health Sciences | 456 | 9.7% |
| Psychology | 281 | 5.9% |
| Social Sciences | 224 | 4.8% |
| Engineering | 572 | 12.1% |
| Multidisciplinary Studies | 61 | 1.3% |
| Science & Technology | 463 | 9.8% |
| Business | 828 | 17.5% |
| Education | 298 | 6.3% |
| Literature & Languages | 120 | 2.5% |
| Liberal Arts & History | 136 | 2.9% |
| Visual & Performing Arts | 109 | 2.3% |
| Communications | 184 | 3.9% |
| Arts & Humanities | 462 | 9.8% |
| Total | 4,719 | 100.0% |
Transportation & Commute in Echelon
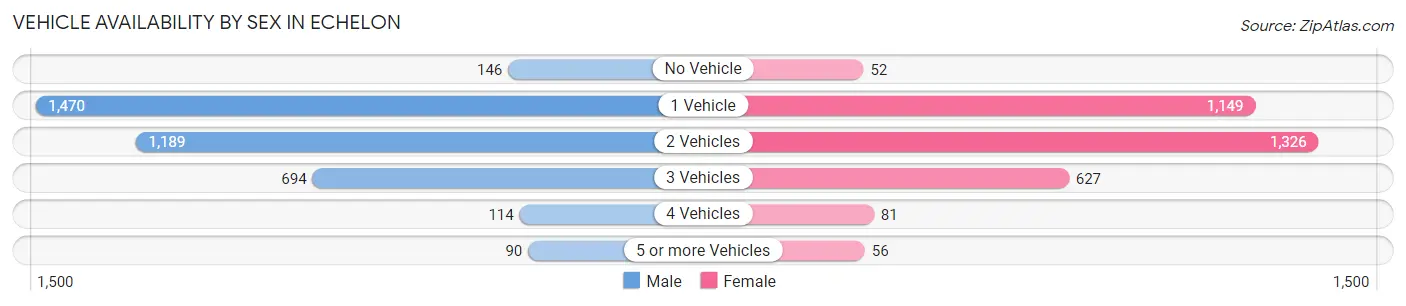
Vehicle Availability by Sex in Echelon
The most prevalent vehicle ownership categories in Echelon are males with 1 vehicle (1,470, accounting for 39.7%) and females with 1 vehicle (1,149, making up 44.7%).
| Vehicles Available | Male | Female |
| No Vehicle | 146 (3.9%) | 52 (1.6%) |
| 1 Vehicle | 1,470 (39.7%) | 1,149 (34.9%) |
| 2 Vehicles | 1,189 (32.1%) | 1,326 (40.3%) |
| 3 Vehicles | 694 (18.7%) | 627 (19.1%) |
| 4 Vehicles | 114 (3.1%) | 81 (2.5%) |
| 5 or more Vehicles | 90 (2.4%) | 56 (1.7%) |
| Total | 3,703 (100.0%) | 3,291 (100.0%) |
Commute Time in Echelon
The most frequently occuring commute durations in Echelon are 30 to 34 minutes (1,159 commuters, 19.4%), 20 to 24 minutes (864 commuters, 14.5%), and 10 to 14 minutes (752 commuters, 12.6%).
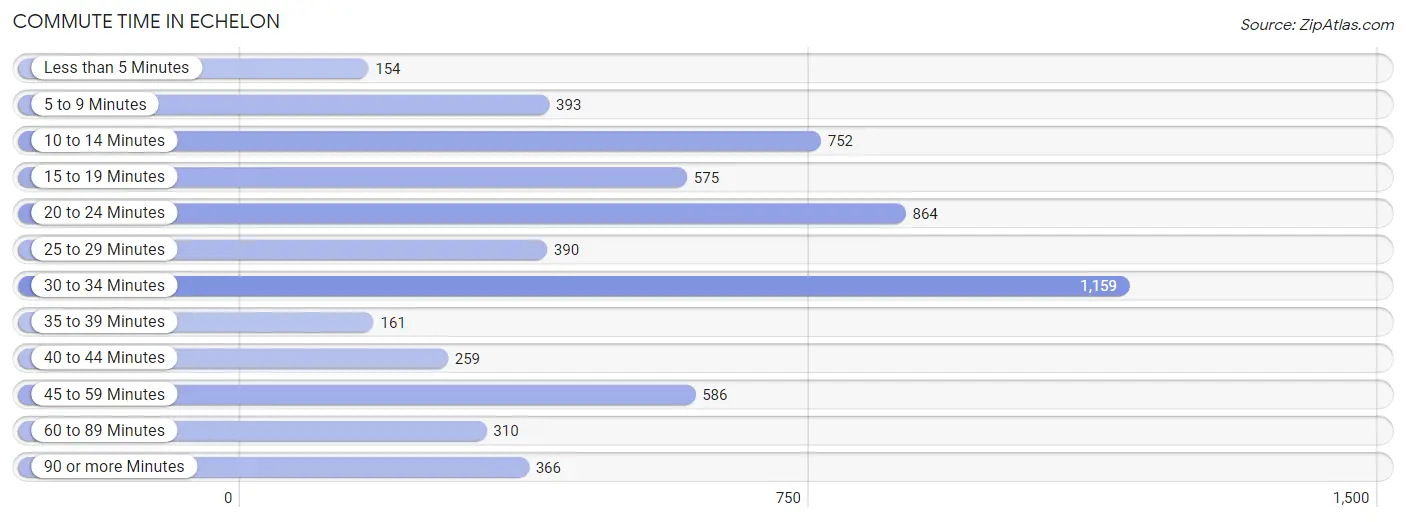
| Commute Time | # Commuters | % Commuters |
| Less than 5 Minutes | 154 | 2.6% |
| 5 to 9 Minutes | 393 | 6.6% |
| 10 to 14 Minutes | 752 | 12.6% |
| 15 to 19 Minutes | 575 | 9.6% |
| 20 to 24 Minutes | 864 | 14.5% |
| 25 to 29 Minutes | 390 | 6.5% |
| 30 to 34 Minutes | 1,159 | 19.4% |
| 35 to 39 Minutes | 161 | 2.7% |
| 40 to 44 Minutes | 259 | 4.3% |
| 45 to 59 Minutes | 586 | 9.8% |
| 60 to 89 Minutes | 310 | 5.2% |
| 90 or more Minutes | 366 | 6.1% |
Commute Time by Sex in Echelon
The most common commute times in Echelon are 20 to 24 minutes (567 commuters, 18.0%) for males and 30 to 34 minutes (672 commuters, 23.9%) for females.
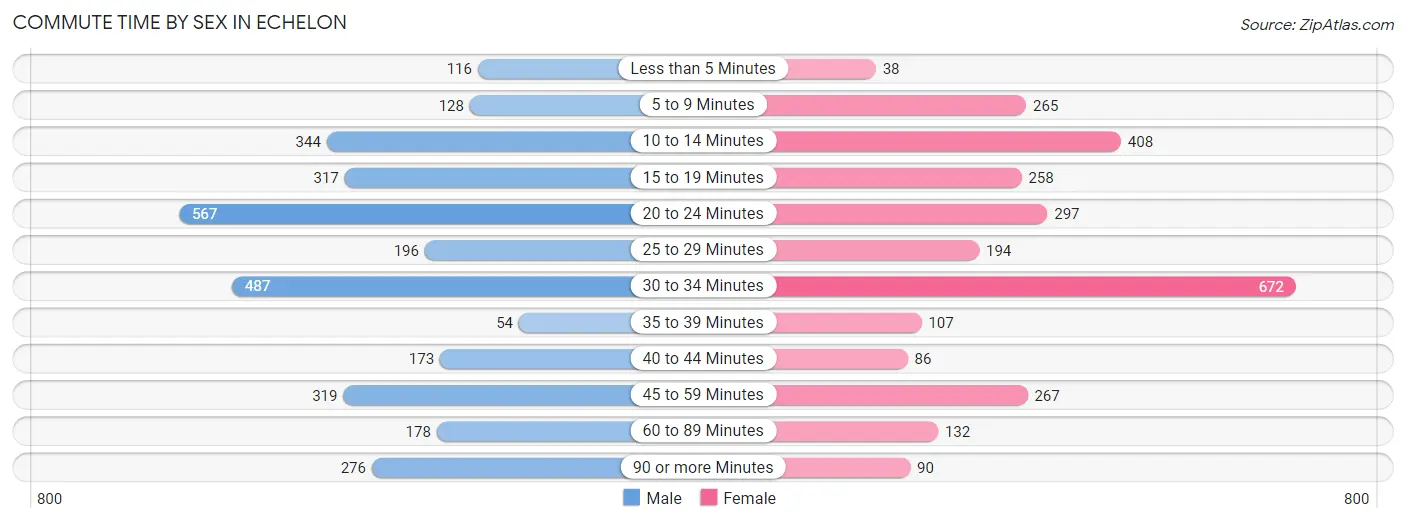
| Commute Time | Male | Female |
| Less than 5 Minutes | 116 (3.7%) | 38 (1.3%) |
| 5 to 9 Minutes | 128 (4.1%) | 265 (9.4%) |
| 10 to 14 Minutes | 344 (10.9%) | 408 (14.5%) |
| 15 to 19 Minutes | 317 (10.1%) | 258 (9.2%) |
| 20 to 24 Minutes | 567 (18.0%) | 297 (10.5%) |
| 25 to 29 Minutes | 196 (6.2%) | 194 (6.9%) |
| 30 to 34 Minutes | 487 (15.4%) | 672 (23.9%) |
| 35 to 39 Minutes | 54 (1.7%) | 107 (3.8%) |
| 40 to 44 Minutes | 173 (5.5%) | 86 (3.1%) |
| 45 to 59 Minutes | 319 (10.1%) | 267 (9.5%) |
| 60 to 89 Minutes | 178 (5.6%) | 132 (4.7%) |
| 90 or more Minutes | 276 (8.7%) | 90 (3.2%) |
Time of Departure to Work by Sex in Echelon
The most frequent times of departure to work in Echelon are 7:30 AM to 7:59 AM (624, 19.8%) for males and 8:00 AM to 8:29 AM (517, 18.4%) for females.
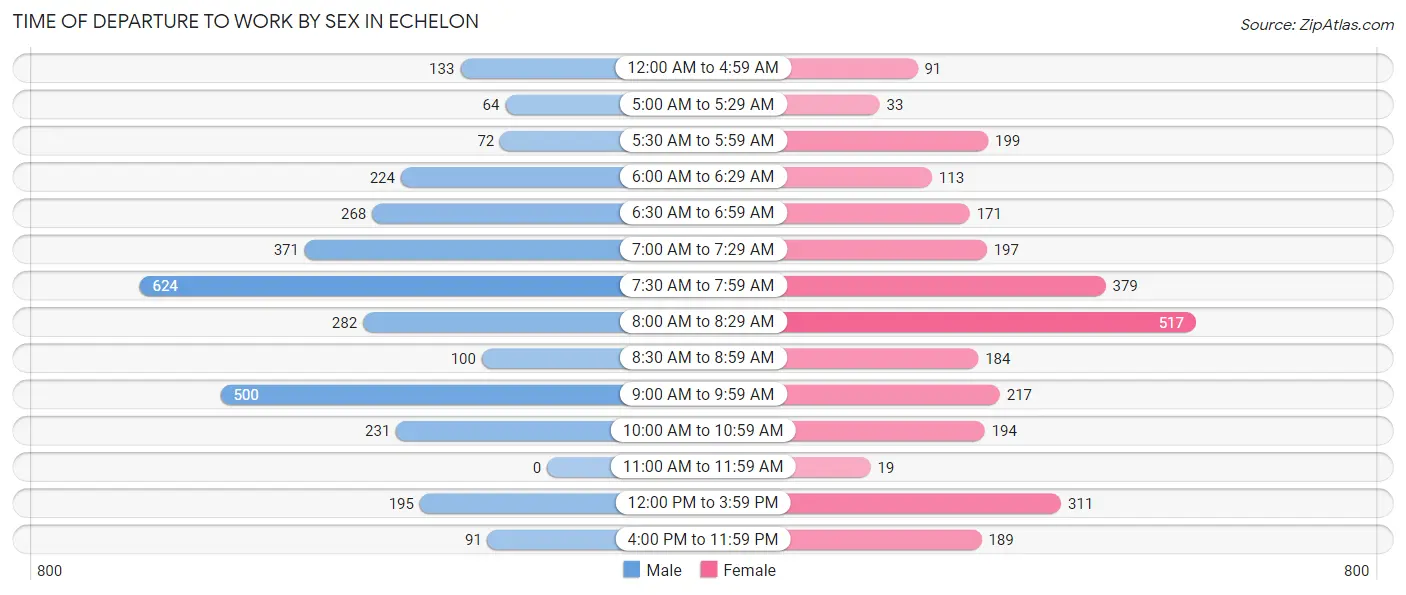
| Time of Departure | Male | Female |
| 12:00 AM to 4:59 AM | 133 (4.2%) | 91 (3.2%) |
| 5:00 AM to 5:29 AM | 64 (2.0%) | 33 (1.2%) |
| 5:30 AM to 5:59 AM | 72 (2.3%) | 199 (7.1%) |
| 6:00 AM to 6:29 AM | 224 (7.1%) | 113 (4.0%) |
| 6:30 AM to 6:59 AM | 268 (8.5%) | 171 (6.1%) |
| 7:00 AM to 7:29 AM | 371 (11.8%) | 197 (7.0%) |
| 7:30 AM to 7:59 AM | 624 (19.8%) | 379 (13.5%) |
| 8:00 AM to 8:29 AM | 282 (8.9%) | 517 (18.4%) |
| 8:30 AM to 8:59 AM | 100 (3.2%) | 184 (6.5%) |
| 9:00 AM to 9:59 AM | 500 (15.9%) | 217 (7.7%) |
| 10:00 AM to 10:59 AM | 231 (7.3%) | 194 (6.9%) |
| 11:00 AM to 11:59 AM | 0 (0.0%) | 19 (0.7%) |
| 12:00 PM to 3:59 PM | 195 (6.2%) | 311 (11.1%) |
| 4:00 PM to 11:59 PM | 91 (2.9%) | 189 (6.7%) |
| Total | 3,155 (100.0%) | 2,814 (100.0%) |
Housing Occupancy in Echelon
Occupancy by Ownership in Echelon
Of the total 6,005 dwellings in Echelon, owner-occupied units account for 2,239 (37.3%), while renter-occupied units make up 3,766 (62.7%).
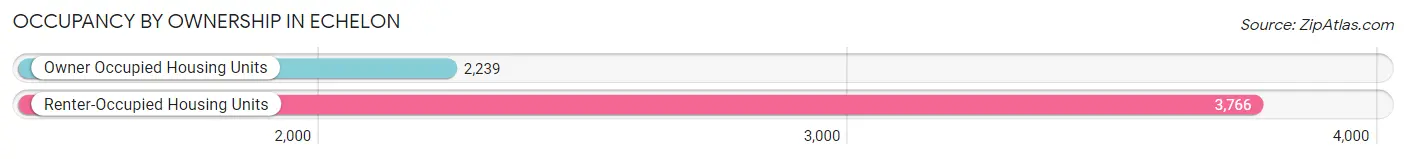
| Occupancy | # Housing Units | % Housing Units |
| Owner Occupied Housing Units | 2,239 | 37.3% |
| Renter-Occupied Housing Units | 3,766 | 62.7% |
| Total Occupied Housing Units | 6,005 | 100.0% |
Occupancy by Household Size in Echelon
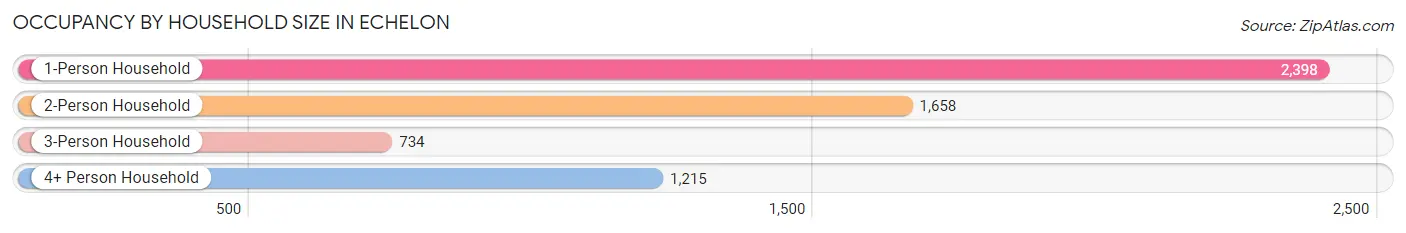
| Household Size | # Housing Units | % Housing Units |
| 1-Person Household | 2,398 | 39.9% |
| 2-Person Household | 1,658 | 27.6% |
| 3-Person Household | 734 | 12.2% |
| 4+ Person Household | 1,215 | 20.2% |
| Total Housing Units | 6,005 | 100.0% |
Occupancy by Ownership by Household Size in Echelon
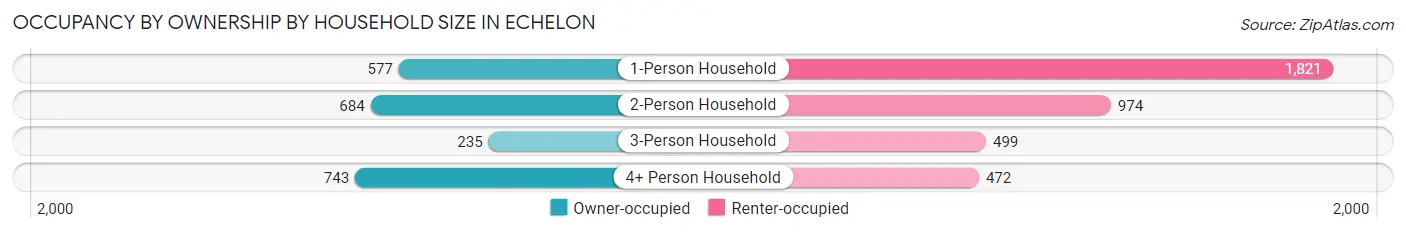
| Household Size | Owner-occupied | Renter-occupied |
| 1-Person Household | 577 (24.1%) | 1,821 (75.9%) |
| 2-Person Household | 684 (41.2%) | 974 (58.8%) |
| 3-Person Household | 235 (32.0%) | 499 (68.0%) |
| 4+ Person Household | 743 (61.2%) | 472 (38.9%) |
| Total Housing Units | 2,239 (37.3%) | 3,766 (62.7%) |
Occupancy by Educational Attainment in Echelon
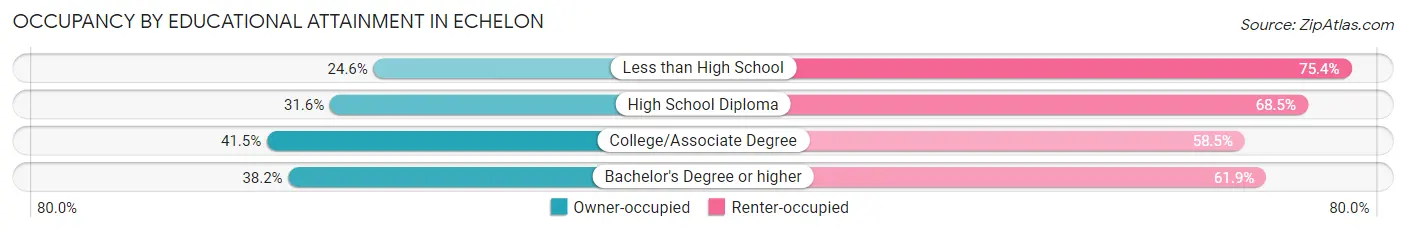
| Household Size | Owner-occupied | Renter-occupied |
| Less than High School | 51 (24.6%) | 156 (75.4%) |
| High School Diploma | 377 (31.6%) | 818 (68.4%) |
| College/Associate Degree | 673 (41.5%) | 947 (58.5%) |
| Bachelor's Degree or higher | 1,138 (38.2%) | 1,845 (61.9%) |
Occupancy by Age of Householder in Echelon
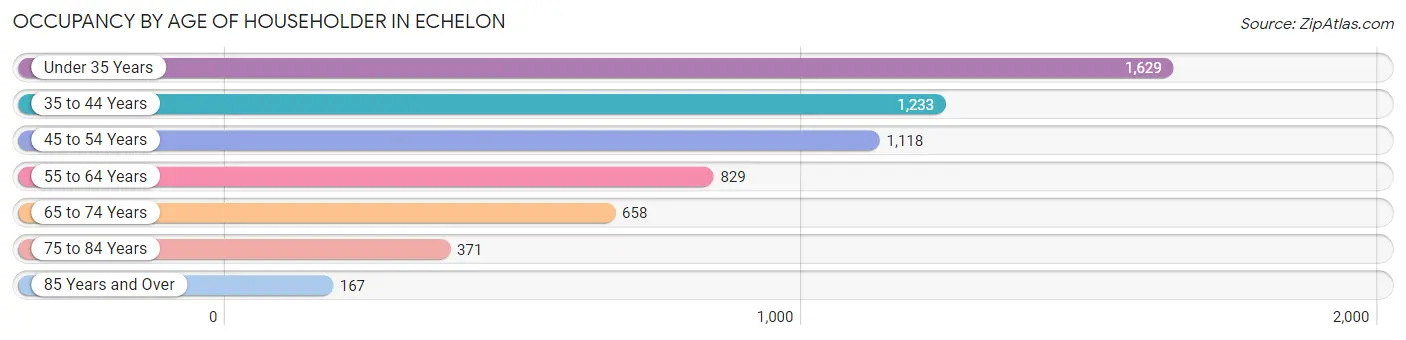
| Age Bracket | # Households | % Households |
| Under 35 Years | 1,629 | 27.1% |
| 35 to 44 Years | 1,233 | 20.5% |
| 45 to 54 Years | 1,118 | 18.6% |
| 55 to 64 Years | 829 | 13.8% |
| 65 to 74 Years | 658 | 11.0% |
| 75 to 84 Years | 371 | 6.2% |
| 85 Years and Over | 167 | 2.8% |
| Total | 6,005 | 100.0% |
Housing Finances in Echelon
Median Income by Occupancy in Echelon
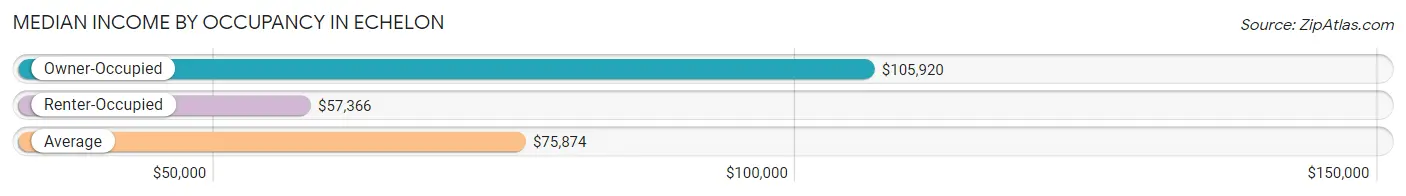
| Occupancy Type | # Households | Median Income |
| Owner-Occupied | 2,239 (37.3%) | $105,920 |
| Renter-Occupied | 3,766 (62.7%) | $57,366 |
| Average | 6,005 (100.0%) | $75,874 |
Occupancy by Householder Income Bracket in Echelon
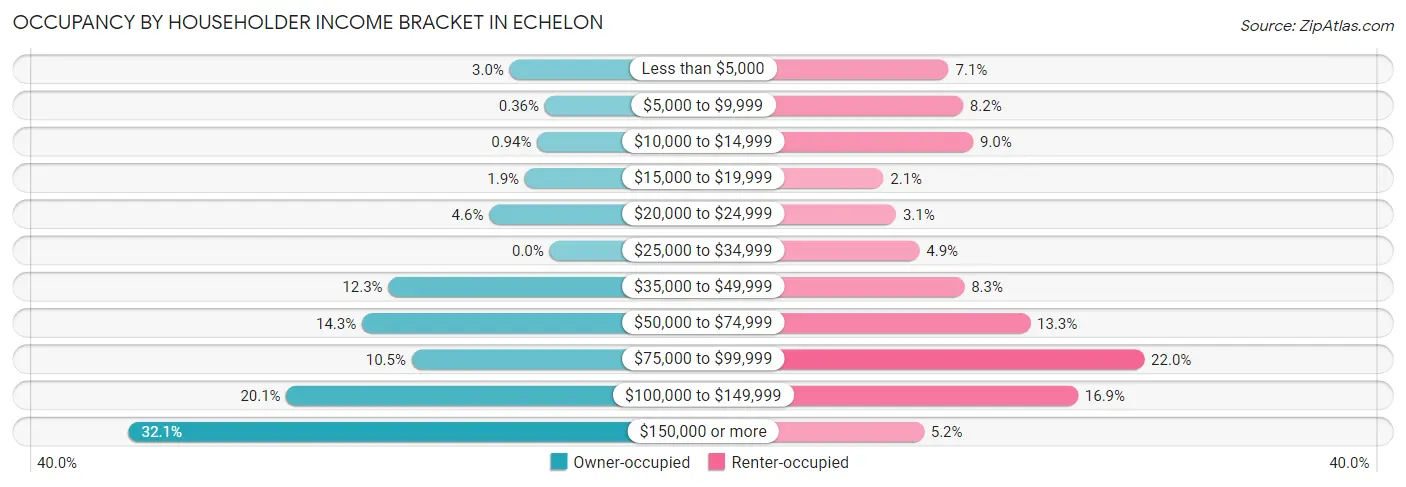
| Income Bracket | Owner-occupied | Renter-occupied |
| Less than $5,000 | 68 (3.0%) | 267 (7.1%) |
| $5,000 to $9,999 | 8 (0.4%) | 308 (8.2%) |
| $10,000 to $14,999 | 21 (0.9%) | 337 (8.9%) |
| $15,000 to $19,999 | 42 (1.9%) | 80 (2.1%) |
| $20,000 to $24,999 | 103 (4.6%) | 116 (3.1%) |
| $25,000 to $34,999 | 0 (0.0%) | 183 (4.9%) |
| $35,000 to $49,999 | 275 (12.3%) | 312 (8.3%) |
| $50,000 to $74,999 | 320 (14.3%) | 501 (13.3%) |
| $75,000 to $99,999 | 235 (10.5%) | 828 (22.0%) |
| $100,000 to $149,999 | 449 (20.1%) | 638 (16.9%) |
| $150,000 or more | 718 (32.1%) | 196 (5.2%) |
| Total | 2,239 (100.0%) | 3,766 (100.0%) |
Monthly Housing Cost Tiers in Echelon
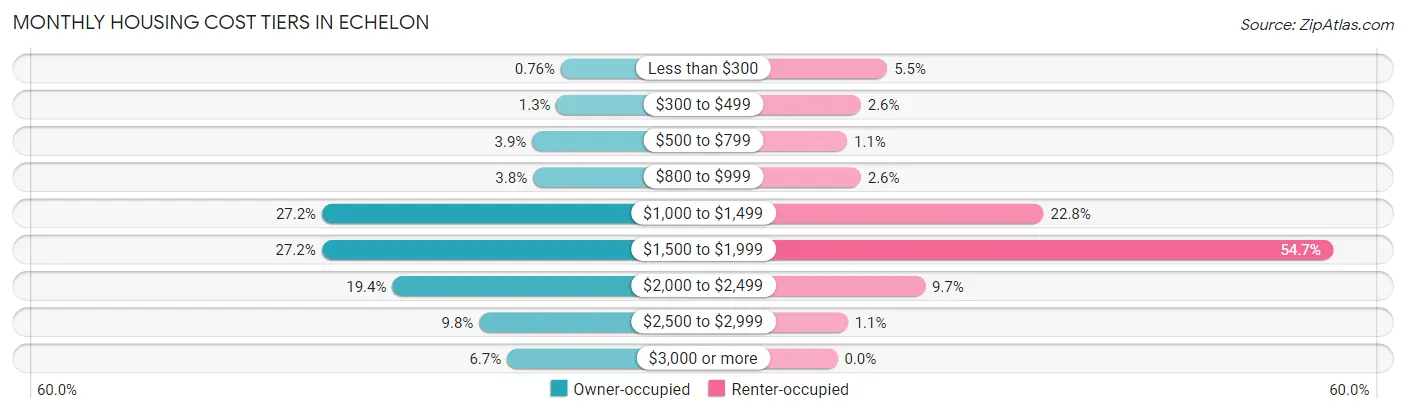
| Monthly Cost | Owner-occupied | Renter-occupied |
| Less than $300 | 17 (0.8%) | 207 (5.5%) |
| $300 to $499 | 28 (1.3%) | 97 (2.6%) |
| $500 to $799 | 88 (3.9%) | 40 (1.1%) |
| $800 to $999 | 86 (3.8%) | 97 (2.6%) |
| $1,000 to $1,499 | 608 (27.2%) | 858 (22.8%) |
| $1,500 to $1,999 | 609 (27.2%) | 2,060 (54.7%) |
| $2,000 to $2,499 | 434 (19.4%) | 364 (9.7%) |
| $2,500 to $2,999 | 219 (9.8%) | 43 (1.1%) |
| $3,000 or more | 150 (6.7%) | 0 (0.0%) |
| Total | 2,239 (100.0%) | 3,766 (100.0%) |
Physical Housing Characteristics in Echelon
Housing Structures in Echelon
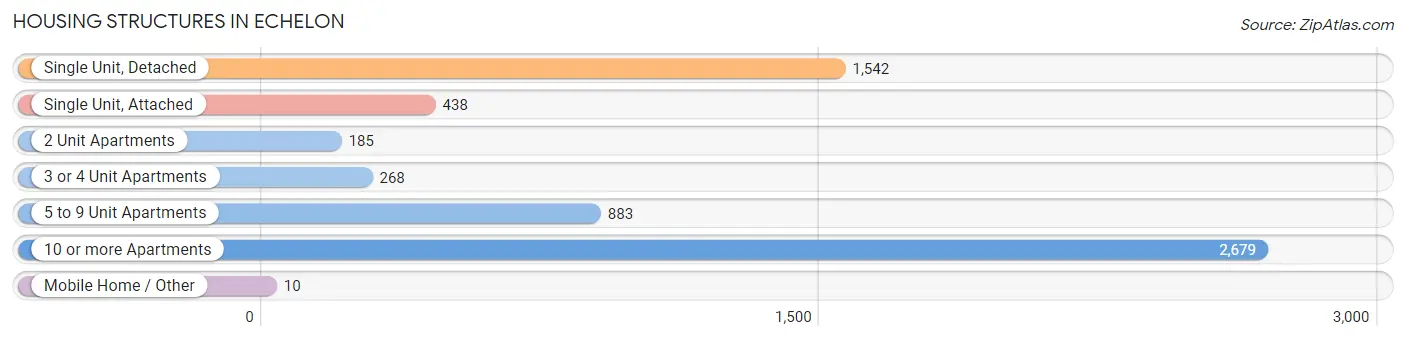
| Structure Type | # Housing Units | % Housing Units |
| Single Unit, Detached | 1,542 | 25.7% |
| Single Unit, Attached | 438 | 7.3% |
| 2 Unit Apartments | 185 | 3.1% |
| 3 or 4 Unit Apartments | 268 | 4.5% |
| 5 to 9 Unit Apartments | 883 | 14.7% |
| 10 or more Apartments | 2,679 | 44.6% |
| Mobile Home / Other | 10 | 0.2% |
| Total | 6,005 | 100.0% |
Housing Structures by Occupancy in Echelon
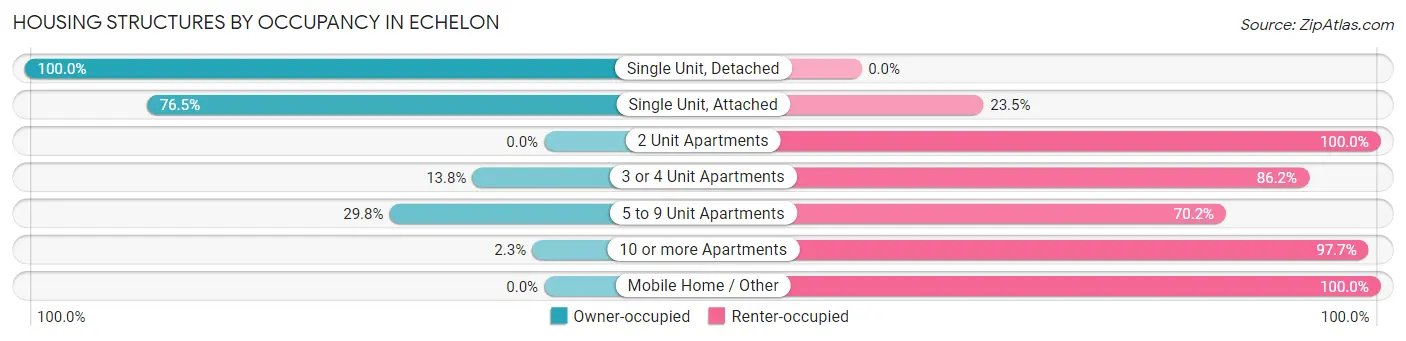
| Structure Type | Owner-occupied | Renter-occupied |
| Single Unit, Detached | 1,542 (100.0%) | 0 (0.0%) |
| Single Unit, Attached | 335 (76.5%) | 103 (23.5%) |
| 2 Unit Apartments | 0 (0.0%) | 185 (100.0%) |
| 3 or 4 Unit Apartments | 37 (13.8%) | 231 (86.2%) |
| 5 to 9 Unit Apartments | 263 (29.8%) | 620 (70.2%) |
| 10 or more Apartments | 62 (2.3%) | 2,617 (97.7%) |
| Mobile Home / Other | 0 (0.0%) | 10 (100.0%) |
| Total | 2,239 (37.3%) | 3,766 (62.7%) |
Housing Structures by Number of Rooms in Echelon
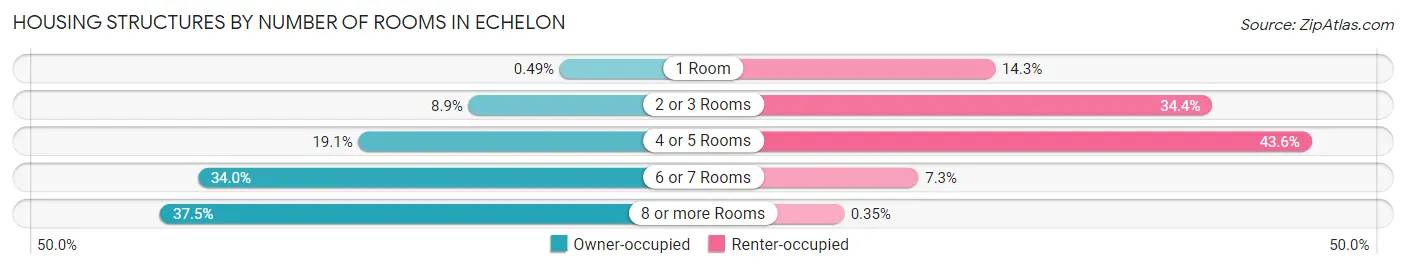
| Number of Rooms | Owner-occupied | Renter-occupied |
| 1 Room | 11 (0.5%) | 540 (14.3%) |
| 2 or 3 Rooms | 200 (8.9%) | 1,297 (34.4%) |
| 4 or 5 Rooms | 428 (19.1%) | 1,643 (43.6%) |
| 6 or 7 Rooms | 761 (34.0%) | 273 (7.2%) |
| 8 or more Rooms | 839 (37.5%) | 13 (0.4%) |
| Total | 2,239 (100.0%) | 3,766 (100.0%) |
Housing Structure by Heating Type in Echelon
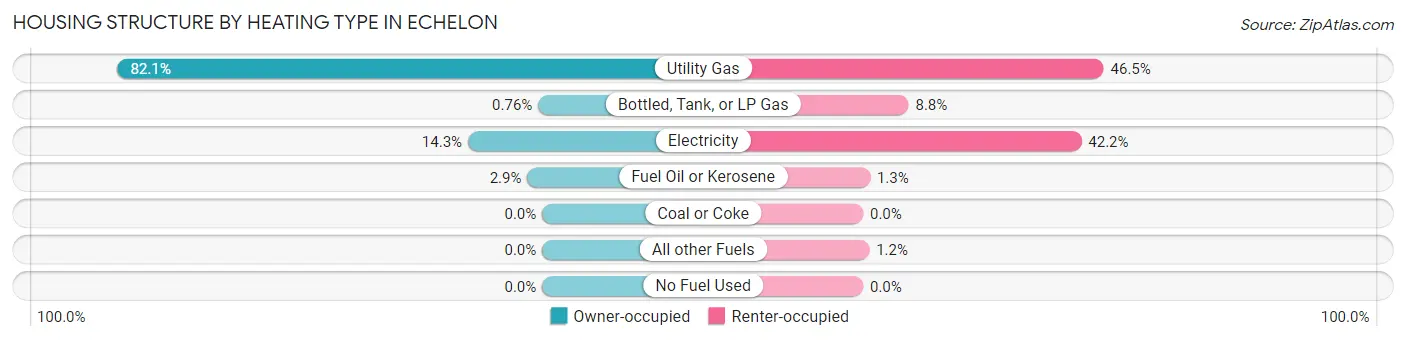
| Heating Type | Owner-occupied | Renter-occupied |
| Utility Gas | 1,837 (82.1%) | 1,751 (46.5%) |
| Bottled, Tank, or LP Gas | 17 (0.8%) | 331 (8.8%) |
| Electricity | 321 (14.3%) | 1,589 (42.2%) |
| Fuel Oil or Kerosene | 64 (2.9%) | 50 (1.3%) |
| Coal or Coke | 0 (0.0%) | 0 (0.0%) |
| All other Fuels | 0 (0.0%) | 45 (1.2%) |
| No Fuel Used | 0 (0.0%) | 0 (0.0%) |
| Total | 2,239 (100.0%) | 3,766 (100.0%) |
Household Vehicle Usage in Echelon
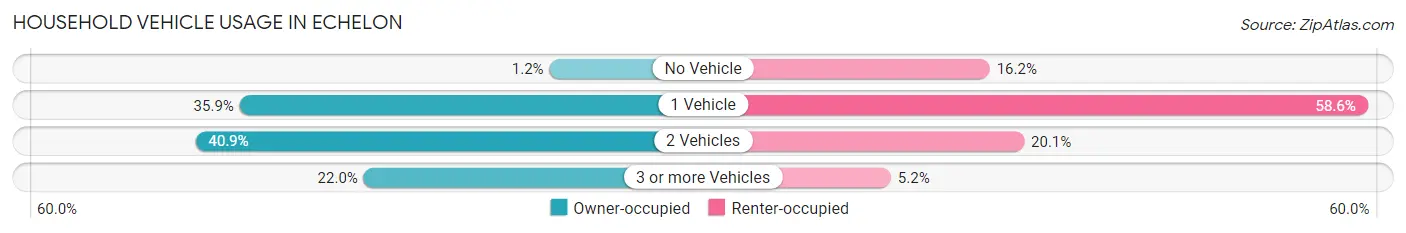
| Vehicles per Household | Owner-occupied | Renter-occupied |
| No Vehicle | 27 (1.2%) | 611 (16.2%) |
| 1 Vehicle | 804 (35.9%) | 2,205 (58.6%) |
| 2 Vehicles | 915 (40.9%) | 756 (20.1%) |
| 3 or more Vehicles | 493 (22.0%) | 194 (5.1%) |
| Total | 2,239 (100.0%) | 3,766 (100.0%) |
Real Estate & Mortgages in Echelon
Real Estate and Mortgage Overview in Echelon
| Characteristic | Without Mortgage | With Mortgage |
| Housing Units | 821 | 1,418 |
| Median Property Value | $311,800 | $254,400 |
| Median Household Income | $120,221 | $361 |
| Monthly Housing Costs | $1,299 | $150 |
| Real Estate Taxes | $10,001 | $24 |
Property Value by Mortgage Status in Echelon
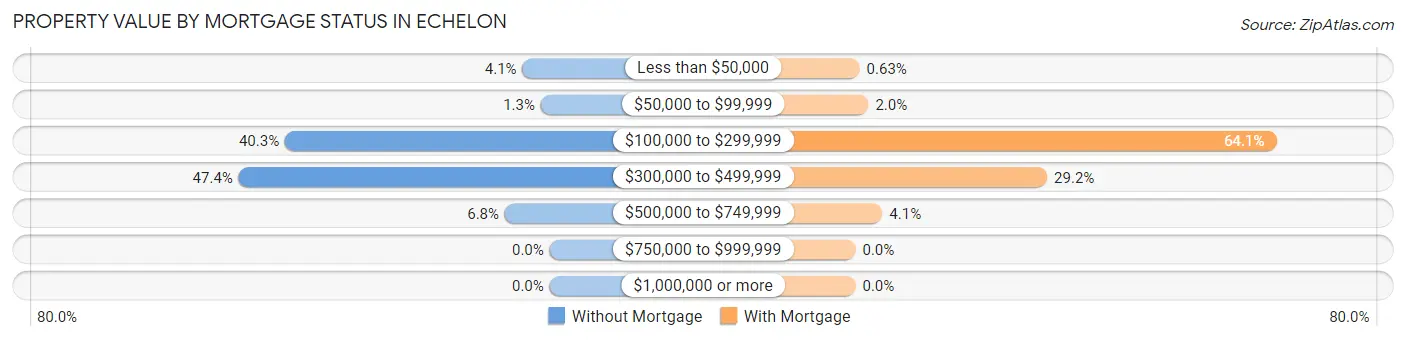
| Property Value | Without Mortgage | With Mortgage |
| Less than $50,000 | 34 (4.1%) | 9 (0.6%) |
| $50,000 to $99,999 | 11 (1.3%) | 28 (2.0%) |
| $100,000 to $299,999 | 331 (40.3%) | 909 (64.1%) |
| $300,000 to $499,999 | 389 (47.4%) | 414 (29.2%) |
| $500,000 to $749,999 | 56 (6.8%) | 58 (4.1%) |
| $750,000 to $999,999 | 0 (0.0%) | 0 (0.0%) |
| $1,000,000 or more | 0 (0.0%) | 0 (0.0%) |
| Total | 821 (100.0%) | 1,418 (100.0%) |
Household Income by Mortgage Status in Echelon
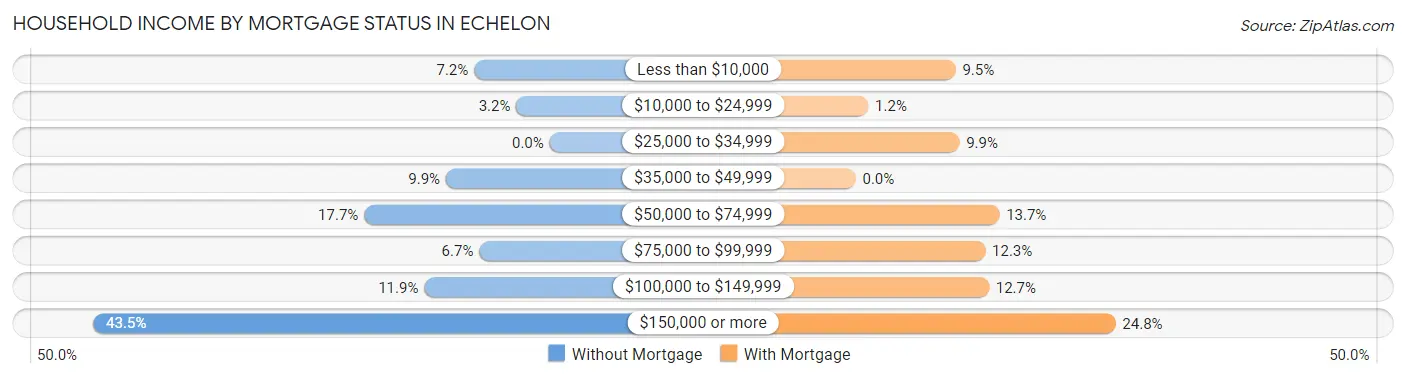
| Household Income | Without Mortgage | With Mortgage |
| Less than $10,000 | 59 (7.2%) | 135 (9.5%) |
| $10,000 to $24,999 | 26 (3.2%) | 17 (1.2%) |
| $25,000 to $34,999 | 0 (0.0%) | 140 (9.9%) |
| $35,000 to $49,999 | 81 (9.9%) | 0 (0.0%) |
| $50,000 to $74,999 | 145 (17.7%) | 194 (13.7%) |
| $75,000 to $99,999 | 55 (6.7%) | 175 (12.3%) |
| $100,000 to $149,999 | 98 (11.9%) | 180 (12.7%) |
| $150,000 or more | 357 (43.5%) | 351 (24.7%) |
| Total | 821 (100.0%) | 1,418 (100.0%) |
Property Value to Household Income Ratio in Echelon
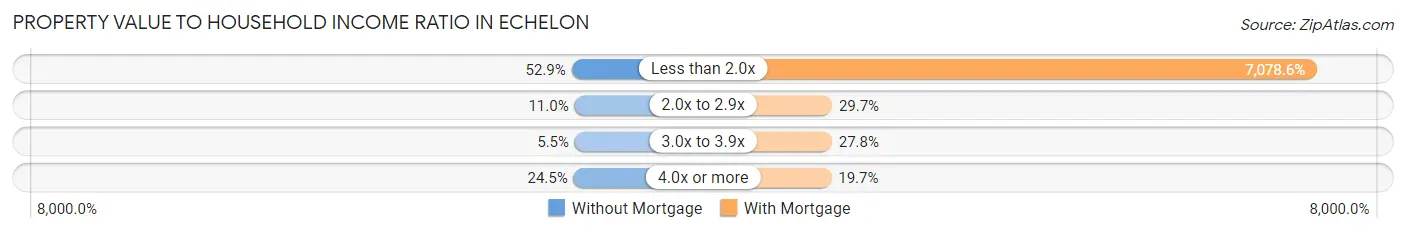
| Value-to-Income Ratio | Without Mortgage | With Mortgage |
| Less than 2.0x | 434 (52.9%) | 100,375 (7,078.6%) |
| 2.0x to 2.9x | 90 (11.0%) | 421 (29.7%) |
| 3.0x to 3.9x | 45 (5.5%) | 394 (27.8%) |
| 4.0x or more | 201 (24.5%) | 279 (19.7%) |
| Total | 821 (100.0%) | 1,418 (100.0%) |
Real Estate Taxes by Mortgage Status in Echelon
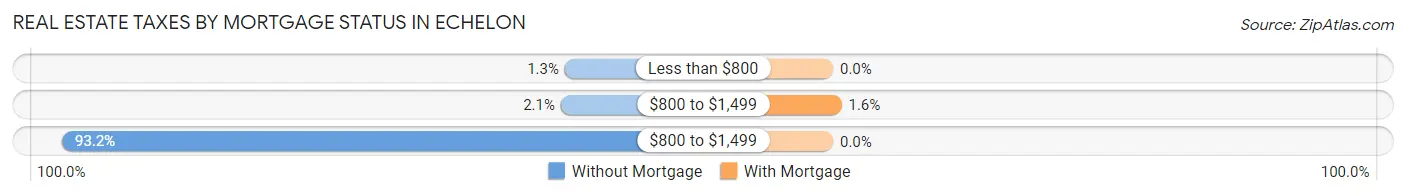
| Property Taxes | Without Mortgage | With Mortgage |
| Less than $800 | 11 (1.3%) | 0 (0.0%) |
| $800 to $1,499 | 17 (2.1%) | 22 (1.5%) |
| $800 to $1,499 | 765 (93.2%) | 0 (0.0%) |
| Total | 821 (100.0%) | 1,418 (100.0%) |
Health & Disability in Echelon
Health Insurance Coverage by Age in Echelon
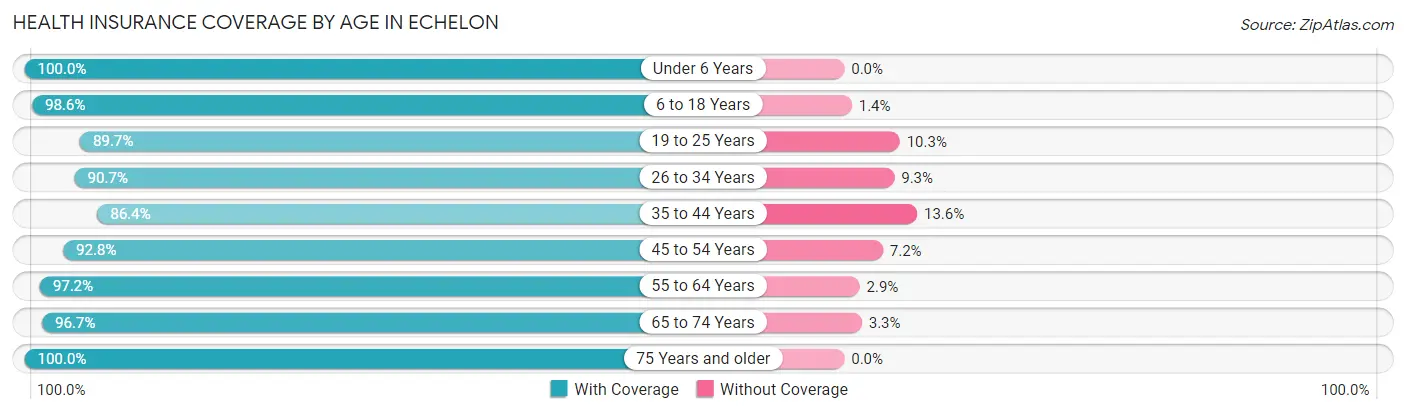
| Age Bracket | With Coverage | Without Coverage |
| Under 6 Years | 738 (100.0%) | 0 (0.0%) |
| 6 to 18 Years | 2,331 (98.6%) | 33 (1.4%) |
| 19 to 25 Years | 1,361 (89.7%) | 157 (10.3%) |
| 26 to 34 Years | 1,984 (90.7%) | 204 (9.3%) |
| 35 to 44 Years | 1,765 (86.4%) | 277 (13.6%) |
| 45 to 54 Years | 1,537 (92.8%) | 119 (7.2%) |
| 55 to 64 Years | 1,226 (97.2%) | 36 (2.9%) |
| 65 to 74 Years | 861 (96.7%) | 29 (3.3%) |
| 75 Years and older | 702 (100.0%) | 0 (0.0%) |
| Total | 12,505 (93.6%) | 855 (6.4%) |
Health Insurance Coverage by Citizenship Status in Echelon
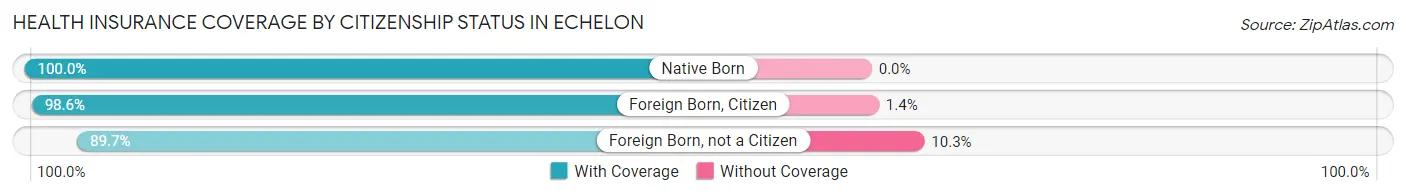
| Citizenship Status | With Coverage | Without Coverage |
| Native Born | 738 (100.0%) | 0 (0.0%) |
| Foreign Born, Citizen | 2,331 (98.6%) | 33 (1.4%) |
| Foreign Born, not a Citizen | 1,361 (89.7%) | 157 (10.3%) |
Health Insurance Coverage by Household Income in Echelon
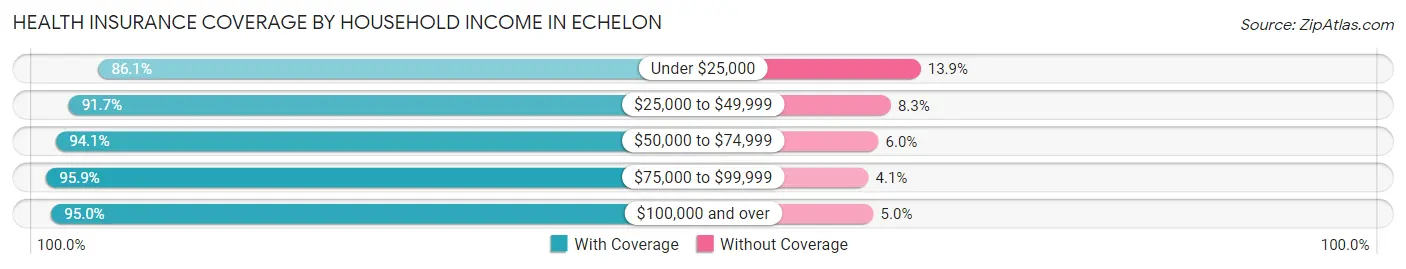
| Household Income | With Coverage | Without Coverage |
| Under $25,000 | 1,560 (86.1%) | 251 (13.9%) |
| $25,000 to $49,999 | 1,064 (91.7%) | 96 (8.3%) |
| $50,000 to $74,999 | 1,265 (94.1%) | 80 (5.9%) |
| $75,000 to $99,999 | 2,343 (95.9%) | 100 (4.1%) |
| $100,000 and over | 6,198 (95.0%) | 328 (5.0%) |
Public vs Private Health Insurance Coverage by Age in Echelon
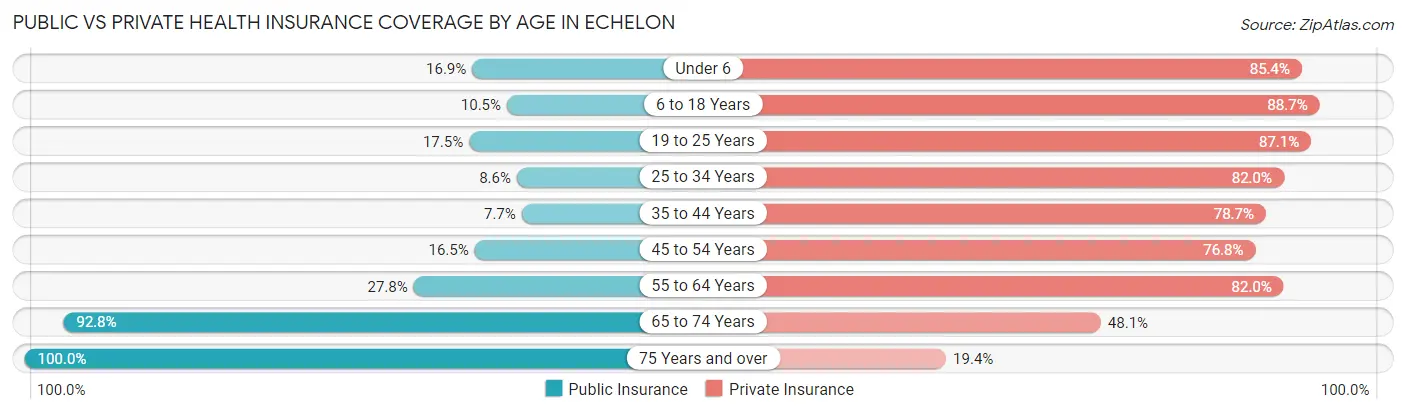
| Age Bracket | Public Insurance | Private Insurance |
| Under 6 | 125 (16.9%) | 630 (85.4%) |
| 6 to 18 Years | 248 (10.5%) | 2,096 (88.7%) |
| 19 to 25 Years | 266 (17.5%) | 1,322 (87.1%) |
| 25 to 34 Years | 189 (8.6%) | 1,795 (82.0%) |
| 35 to 44 Years | 158 (7.7%) | 1,607 (78.7%) |
| 45 to 54 Years | 273 (16.5%) | 1,271 (76.7%) |
| 55 to 64 Years | 351 (27.8%) | 1,035 (82.0%) |
| 65 to 74 Years | 826 (92.8%) | 428 (48.1%) |
| 75 Years and over | 702 (100.0%) | 136 (19.4%) |
| Total | 3,138 (23.5%) | 10,320 (77.2%) |
Disability Status by Sex by Age in Echelon
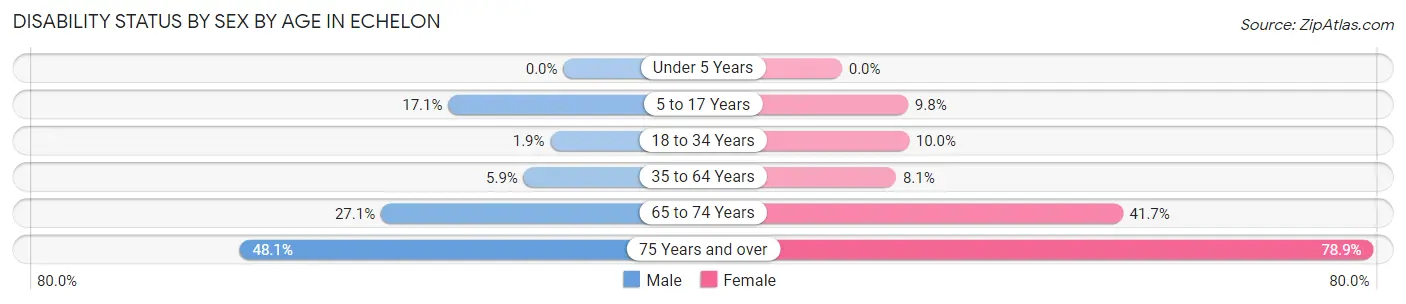
| Age Bracket | Male | Female |
| Under 5 Years | 0 (0.0%) | 0 (0.0%) |
| 5 to 17 Years | 240 (17.1%) | 82 (9.8%) |
| 18 to 34 Years | 38 (1.9%) | 198 (10.0%) |
| 35 to 64 Years | 142 (5.9%) | 205 (8.1%) |
| 65 to 74 Years | 91 (27.1%) | 231 (41.7%) |
| 75 Years and over | 75 (48.1%) | 431 (78.9%) |
Disability Class by Sex by Age in Echelon
Disability Class: Hearing Difficulty
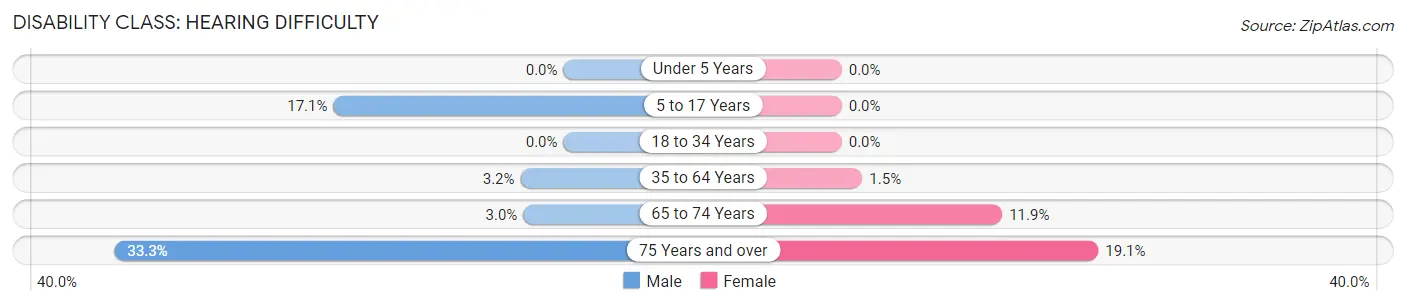
| Age Bracket | Male | Female |
| Under 5 Years | 0 (0.0%) | 0 (0.0%) |
| 5 to 17 Years | 240 (17.1%) | 0 (0.0%) |
| 18 to 34 Years | 0 (0.0%) | 0 (0.0%) |
| 35 to 64 Years | 77 (3.2%) | 39 (1.5%) |
| 65 to 74 Years | 10 (3.0%) | 66 (11.9%) |
| 75 Years and over | 52 (33.3%) | 104 (19.1%) |
Disability Class: Vision Difficulty
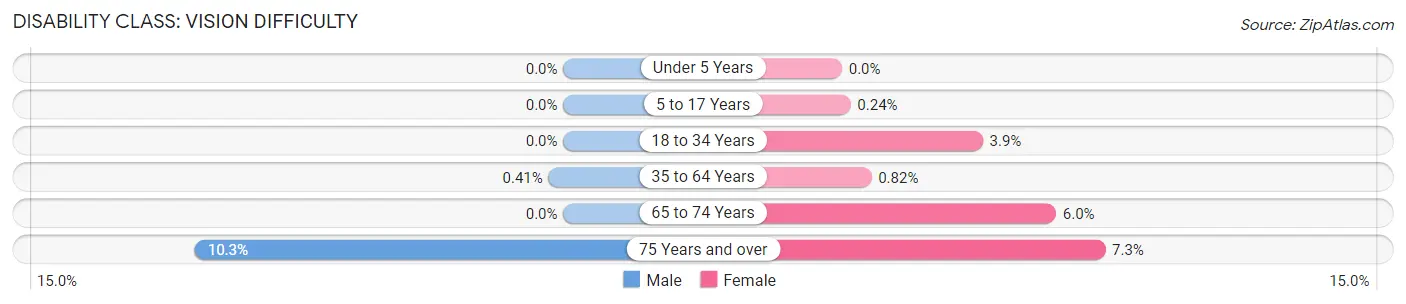
| Age Bracket | Male | Female |
| Under 5 Years | 0 (0.0%) | 0 (0.0%) |
| 5 to 17 Years | 0 (0.0%) | 2 (0.2%) |
| 18 to 34 Years | 0 (0.0%) | 78 (3.9%) |
| 35 to 64 Years | 10 (0.4%) | 21 (0.8%) |
| 65 to 74 Years | 0 (0.0%) | 33 (6.0%) |
| 75 Years and over | 16 (10.3%) | 40 (7.3%) |
Disability Class: Cognitive Difficulty
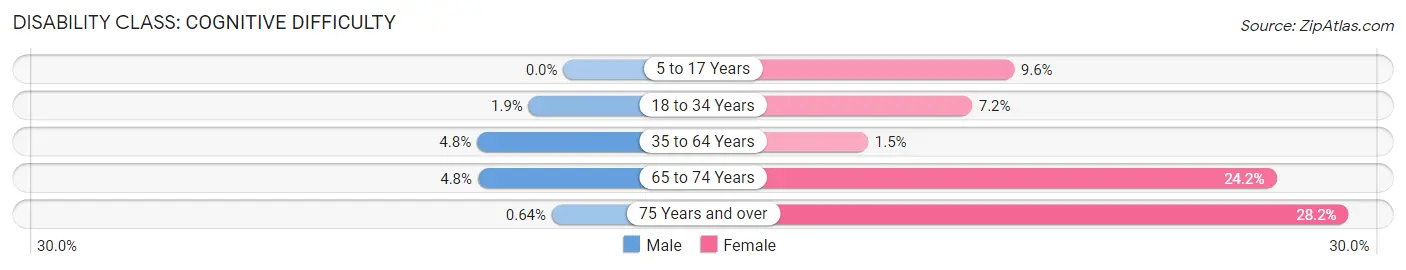
| Age Bracket | Male | Female |
| 5 to 17 Years | 0 (0.0%) | 80 (9.6%) |
| 18 to 34 Years | 38 (1.9%) | 144 (7.2%) |
| 35 to 64 Years | 116 (4.8%) | 37 (1.5%) |
| 65 to 74 Years | 16 (4.8%) | 134 (24.2%) |
| 75 Years and over | 1 (0.6%) | 154 (28.2%) |
Disability Class: Ambulatory Difficulty
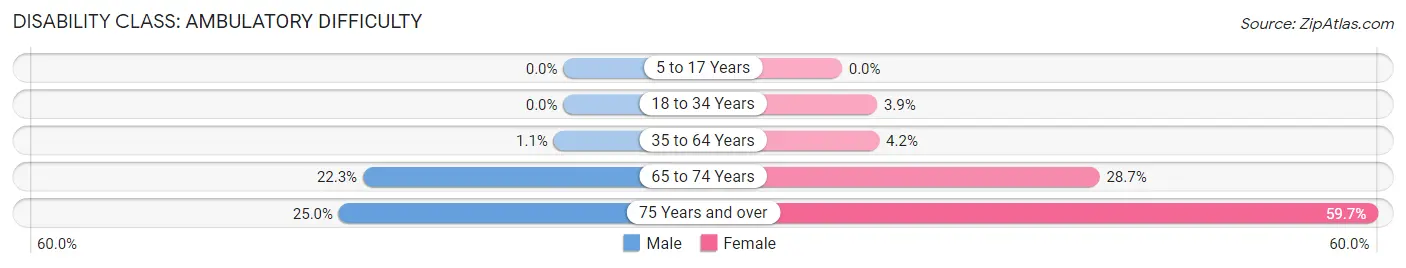
| Age Bracket | Male | Female |
| 5 to 17 Years | 0 (0.0%) | 0 (0.0%) |
| 18 to 34 Years | 0 (0.0%) | 78 (3.9%) |
| 35 to 64 Years | 26 (1.1%) | 106 (4.2%) |
| 65 to 74 Years | 75 (22.3%) | 159 (28.7%) |
| 75 Years and over | 39 (25.0%) | 326 (59.7%) |
Disability Class: Self-Care Difficulty
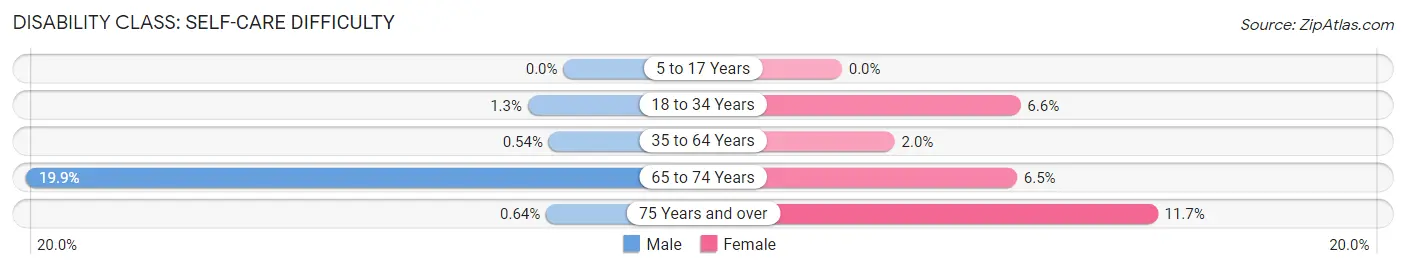
| Age Bracket | Male | Female |
| 5 to 17 Years | 0 (0.0%) | 0 (0.0%) |
| 18 to 34 Years | 26 (1.3%) | 132 (6.6%) |
| 35 to 64 Years | 13 (0.5%) | 50 (2.0%) |
| 65 to 74 Years | 67 (19.9%) | 36 (6.5%) |
| 75 Years and over | 1 (0.6%) | 64 (11.7%) |
Technology Access in Echelon
Computing Device Access in Echelon
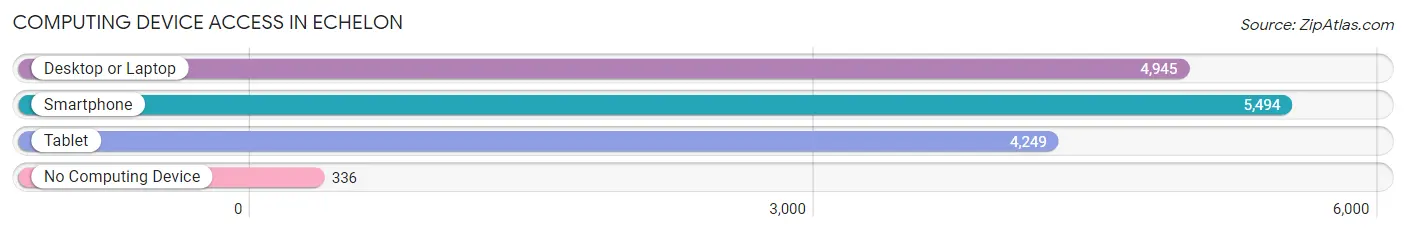
| Device Type | # Households | % Households |
| Desktop or Laptop | 4,945 | 82.4% |
| Smartphone | 5,494 | 91.5% |
| Tablet | 4,249 | 70.8% |
| No Computing Device | 336 | 5.6% |
| Total | 6,005 | 100.0% |
Internet Access in Echelon
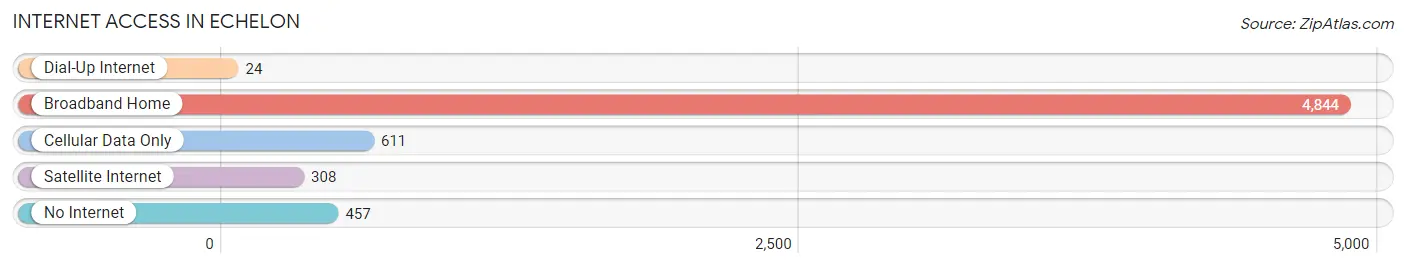
| Internet Type | # Households | % Households |
| Dial-Up Internet | 24 | 0.4% |
| Broadband Home | 4,844 | 80.7% |
| Cellular Data Only | 611 | 10.2% |
| Satellite Internet | 308 | 5.1% |
| No Internet | 457 | 7.6% |
| Total | 6,005 | 100.0% |
Echelon Summary
Echelon is a small borough located in Camden County, New Jersey. It is situated on the eastern side of the Delaware River, just south of Philadelphia. The borough was incorporated in 1894 and is home to a population of approximately 2,000 people.
Geography
Echelon is located in the eastern part of Camden County, New Jersey. It is situated on the eastern side of the Delaware River, just south of Philadelphia. The borough is bordered by the townships of Voorhees, Berlin, and Gibbsboro. The total area of Echelon is 0.9 square miles, all of which is land. The borough is located in the humid subtropical climate zone, with hot, humid summers and cold, wet winters.
Economy
Echelon’s economy is largely based on small businesses and services. The borough is home to a variety of small businesses, including restaurants, retail stores, and professional services. The borough also has a few larger employers, such as the Echelon Mall and the Echelon Business Park. The Echelon Mall is a shopping center that features a variety of stores and restaurants. The Echelon Business Park is a business park that is home to a variety of businesses, including a hotel, a medical center, and a fitness center.
Demographics
As of the 2010 census, the population of Echelon was 2,000 people. The racial makeup of the borough was 94.2% White, 2.2% African American, 0.7% Asian, 0.3% from other races, and 2.6% from two or more races. Hispanic or Latino of any race were 1.7% of the population.
The median income for a household in Echelon was $50,000, and the median income for a family was $60,000. The per capita income for the borough was $25,000. About 8.3% of families and 10.2% of the population were below the poverty line, including 14.3% of those under age 18 and 6.7% of those age 65 or over.
Education
Echelon is served by the Echelon School District, which consists of two elementary schools, one middle school, and one high school. The district also offers a variety of extracurricular activities, including sports, clubs, and after-school programs. The district is also home to a number of private schools, including a Catholic school and a Montessori school.
Conclusion
Echelon is a small borough located in Camden County, New Jersey. It is situated on the eastern side of the Delaware River, just south of Philadelphia. The borough was incorporated in 1894 and is home to a population of approximately 2,000 people. The economy of Echelon is largely based on small businesses and services, and the borough is served by the Echelon School District. The racial makeup of the borough is 94.2% White, 2.2% African American, 0.7% Asian, 0.3% from other races, and 2.6% from two or more races. The median income for a household in Echelon was $50,000, and the median income for a family was $60,000.
Common Questions
What is the Total Population of Echelon?
Total Population of Echelon is 13,553.
What is the Total Male Population of Echelon?
Total Male Population of Echelon is 6,649.
What is the Total Female Population of Echelon?
Total Female Population of Echelon is 6,904.
What is the Ratio of Males per 100 Females in Echelon?
There are 96.31 Males per 100 Females in Echelon.
What is the Ratio of Females per 100 Males in Echelon?
There are 103.84 Females per 100 Males in Echelon.
What is the Median Population Age in Echelon?
Median Population Age in Echelon is 33.7 Years.
What is the Average Family Size in Echelon
Average Family Size in Echelon is 3.2 People.
What is the Average Household Size in Echelon
Average Household Size in Echelon is 2.2 People.
What is Per Capita Income in Echelon?
Per Capita income in Echelon is $39,593.
What is the Median Family Income in Echelon?
Median Family Income in Echelon is $109,526.
What is the Median Household income in Echelon?
Median Household Income in Echelon is $75,874.
What is Income or Wage Gap in Echelon?
Income or Wage Gap in Echelon is 30.1%.
Women in Echelon earn 69.9 cents for every dollar earned by a man.
What is Inequality or Gini Index in Echelon?
Inequality or Gini Index in Echelon is 0.46.
How Large is the Labor Force in Echelon?
There are 7,626 People in the Labor Forcein in Echelon.
What is the Percentage of People in the Labor Force in Echelon?
69.5% of People are in the Labor Force in Echelon.
What is the Unemployment Rate in Echelon?
Unemployment Rate in Echelon is 6.6%.