Maywood borough, NJ
Maywood borough Overview
10,040
TOTAL POPULATION
5,030
MALE POPULATION
5,010
FEMALE POPULATION
100.40
MALES / 100 FEMALES
99.60
FEMALES / 100 MALES
44.7
MEDIAN AGE
3.3
AVG FAMILY SIZE
2.7
AVG HOUSEHOLD SIZE
$49,808
PER CAPITA INCOME
$137,905
AVG FAMILY INCOME
$119,057
AVG HOUSEHOLD INCOME
3.9%
WAGE / INCOME GAP [ % ]
96.1¢/ $1
WAGE / INCOME GAP [ $ ]
$4,893
FAMILY INCOME DEFICIT
0.38
INEQUALITY / GINI INDEX
5,566
LABOR FORCE [ PEOPLE ]
65.5%
PERCENT IN LABOR FORCE
8.0%
UNEMPLOYMENT RATE
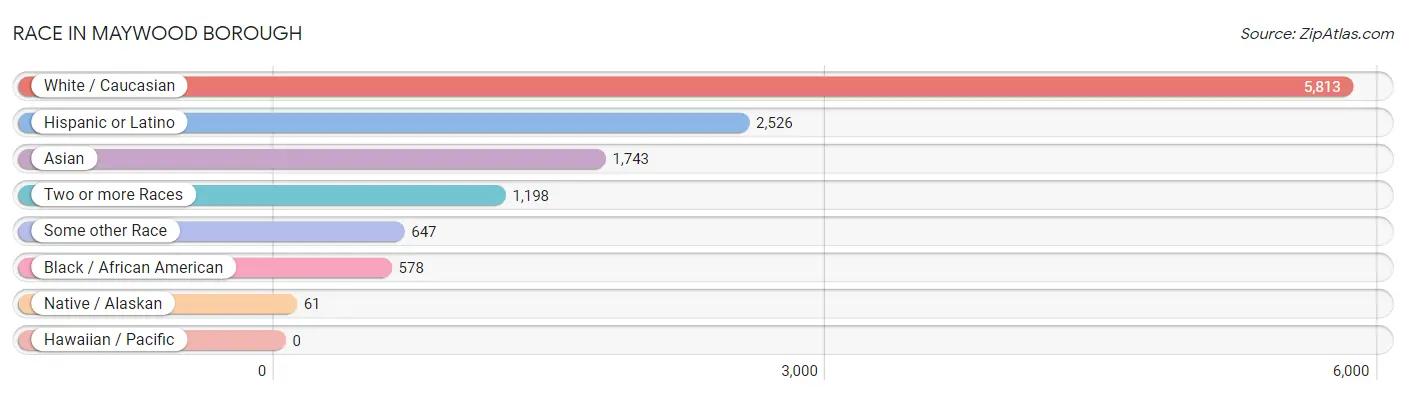
Race in Maywood borough
The most populous races in Maywood borough are White / Caucasian (5,813 | 57.9%), Hispanic or Latino (2,526 | 25.2%), and Asian (1,743 | 17.4%).
| Race | # Population | % Population |
| Asian | 1,743 | 17.4% |
| Black / African American | 578 | 5.8% |
| Hawaiian / Pacific | 0 | 0.0% |
| Hispanic or Latino | 2,526 | 25.2% |
| Native / Alaskan | 61 | 0.6% |
| White / Caucasian | 5,813 | 57.9% |
| Two or more Races | 1,198 | 11.9% |
| Some other Race | 647 | 6.4% |
| Total | 10,040 | 100.0% |
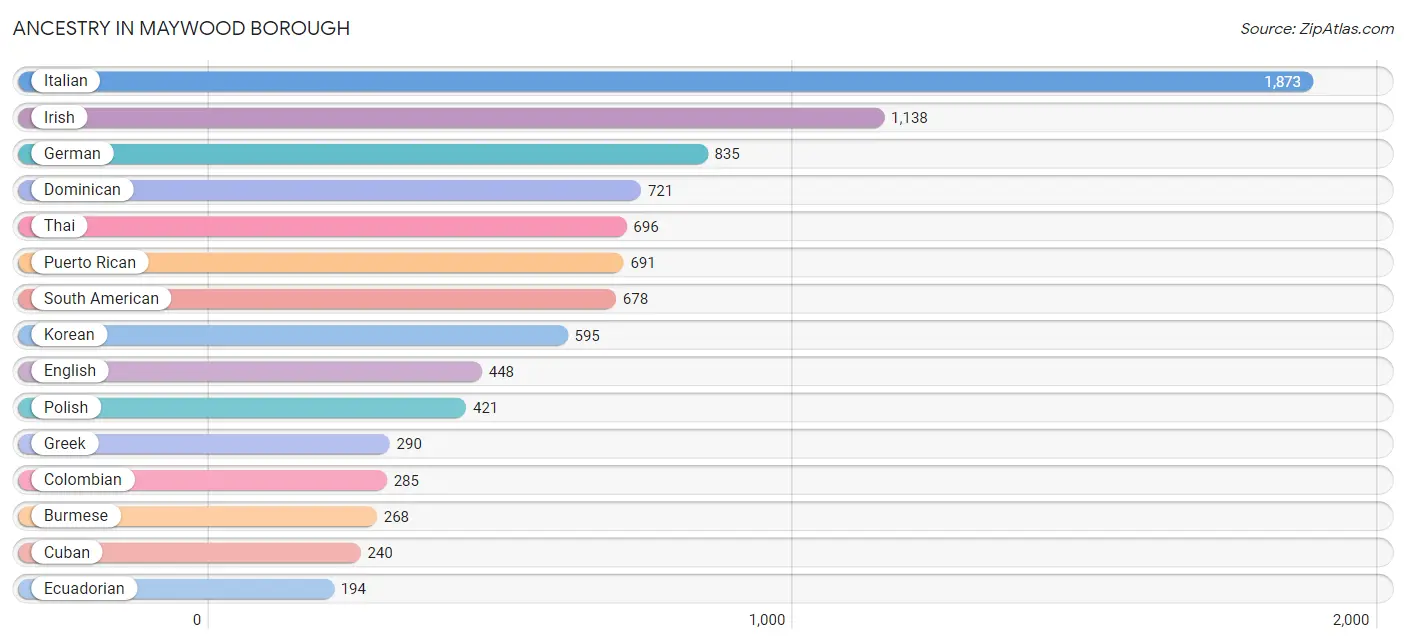
Ancestry in Maywood borough
The most populous ancestries reported in Maywood borough are Italian (1,873 | 18.7%), Irish (1,138 | 11.3%), German (835 | 8.3%), Dominican (721 | 7.2%), and Thai (696 | 6.9%), together accounting for 52.4% of all Maywood borough residents.
| Ancestry | # Population | % Population |
| African | 13 | 0.1% |
| American | 189 | 1.9% |
| Arab | 114 | 1.1% |
| Argentinean | 53 | 0.5% |
| Armenian | 84 | 0.8% |
| Australian | 10 | 0.1% |
| Austrian | 3 | 0.0% |
| Bhutanese | 79 | 0.8% |
| Brazilian | 37 | 0.4% |
| British | 14 | 0.1% |
| Burmese | 268 | 2.7% |
| Central American | 62 | 0.6% |
| Colombian | 285 | 2.8% |
| Croatian | 98 | 1.0% |
| Cuban | 240 | 2.4% |
| Danish | 15 | 0.2% |
| Dominican | 721 | 7.2% |
| Dutch | 97 | 1.0% |
| Eastern European | 15 | 0.2% |
| Ecuadorian | 194 | 1.9% |
| Egyptian | 36 | 0.4% |
| English | 448 | 4.5% |
| European | 52 | 0.5% |
| Filipino | 35 | 0.4% |
| Finnish | 17 | 0.2% |
| French | 108 | 1.1% |
| German | 835 | 8.3% |
| Ghanaian | 10 | 0.1% |
| Greek | 290 | 2.9% |
| Guyanese | 12 | 0.1% |
| Honduran | 13 | 0.1% |
| Hungarian | 5 | 0.1% |
| Indian (Asian) | 115 | 1.1% |
| Irish | 1,138 | 11.3% |
| Iroquois | 21 | 0.2% |
| Italian | 1,873 | 18.7% |
| Jamaican | 107 | 1.1% |
| Jordanian | 12 | 0.1% |
| Kenyan | 30 | 0.3% |
| Korean | 595 | 5.9% |
| Laotian | 24 | 0.2% |
| Latvian | 10 | 0.1% |
| Lebanese | 15 | 0.2% |
| Lithuanian | 11 | 0.1% |
| Mexican | 14 | 0.1% |
| Norwegian | 31 | 0.3% |
| Pakistani | 22 | 0.2% |
| Palestinian | 7 | 0.1% |
| Peruvian | 88 | 0.9% |
| Polish | 421 | 4.2% |
| Puerto Rican | 691 | 6.9% |
| Romanian | 8 | 0.1% |
| Russian | 95 | 0.9% |
| Salvadoran | 49 | 0.5% |
| Scotch-Irish | 25 | 0.3% |
| Scottish | 142 | 1.4% |
| Slovak | 22 | 0.2% |
| South American | 678 | 6.8% |
| South American Indian | 20 | 0.2% |
| Spaniard | 79 | 0.8% |
| Sri Lankan | 18 | 0.2% |
| Subsaharan African | 53 | 0.5% |
| Swedish | 18 | 0.2% |
| Swiss | 26 | 0.3% |
| Syrian | 27 | 0.3% |
| Thai | 696 | 6.9% |
| Turkish | 66 | 0.7% |
| Ukrainian | 55 | 0.5% |
| Uruguayan | 48 | 0.5% |
| Venezuelan | 10 | 0.1% |
| West Indian | 31 | 0.3% | View All 71 Rows |
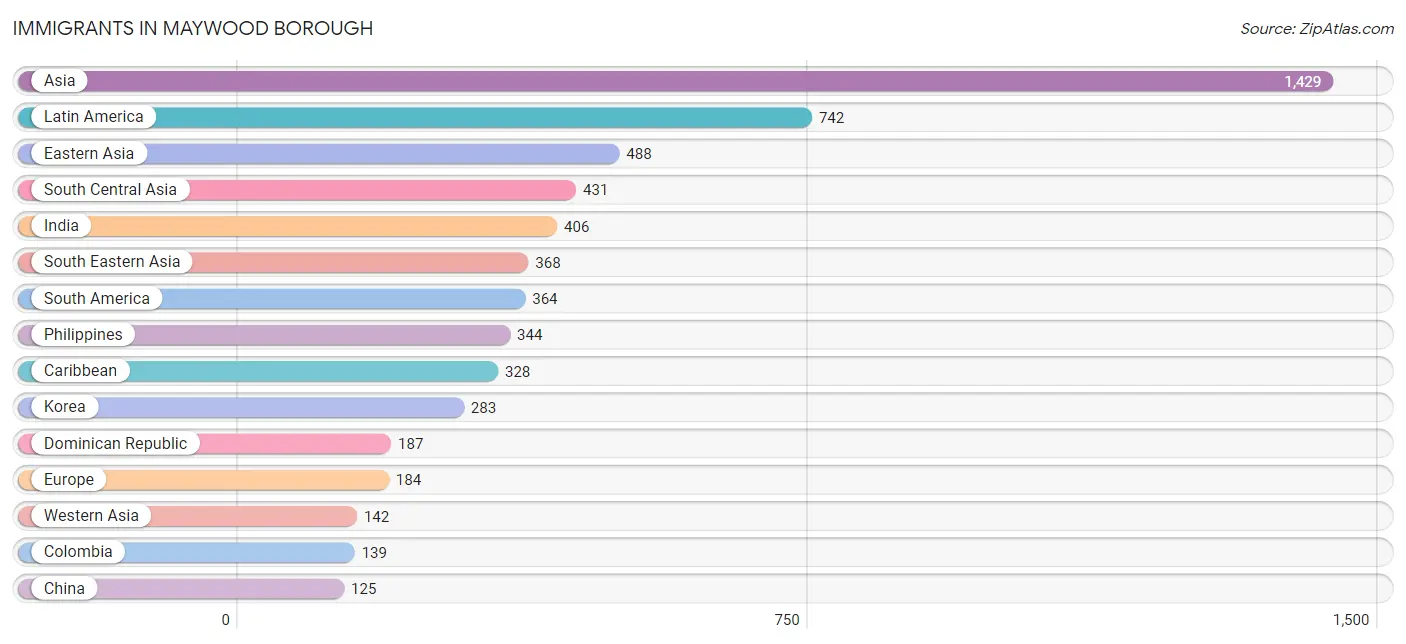
Immigrants in Maywood borough
The most numerous immigrant groups reported in Maywood borough came from Asia (1,429 | 14.2%), Latin America (742 | 7.4%), Eastern Asia (488 | 4.9%), South Central Asia (431 | 4.3%), and India (406 | 4.0%), together accounting for 34.8% of all Maywood borough residents.
| Immigration Origin | # Population | % Population |
| Africa | 73 | 0.7% |
| Armenia | 29 | 0.3% |
| Asia | 1,429 | 14.2% |
| Australia | 10 | 0.1% |
| Brazil | 37 | 0.4% |
| Canada | 15 | 0.2% |
| Caribbean | 328 | 3.3% |
| Central America | 50 | 0.5% |
| China | 125 | 1.3% |
| Colombia | 139 | 1.4% |
| Cuba | 33 | 0.3% |
| Dominican Republic | 187 | 1.9% |
| Eastern Africa | 32 | 0.3% |
| Eastern Asia | 488 | 4.9% |
| Eastern Europe | 119 | 1.2% |
| Ecuador | 115 | 1.1% |
| Egypt | 13 | 0.1% |
| El Salvador | 20 | 0.2% |
| England | 12 | 0.1% |
| Europe | 184 | 1.8% |
| Ghana | 10 | 0.1% |
| Greece | 7 | 0.1% |
| Honduras | 20 | 0.2% |
| Hong Kong | 15 | 0.2% |
| India | 406 | 4.0% |
| Iran | 11 | 0.1% |
| Italy | 3 | 0.0% |
| Jamaica | 83 | 0.8% |
| Japan | 80 | 0.8% |
| Jordan | 7 | 0.1% |
| Kenya | 32 | 0.3% |
| Korea | 283 | 2.8% |
| Kuwait | 11 | 0.1% |
| Latin America | 742 | 7.4% |
| Lebanon | 15 | 0.2% |
| Mexico | 10 | 0.1% |
| Nigeria | 5 | 0.1% |
| Northern Africa | 13 | 0.1% |
| Northern Europe | 30 | 0.3% |
| Oceania | 10 | 0.1% |
| Pakistan | 14 | 0.1% |
| Peru | 50 | 0.5% |
| Philippines | 344 | 3.4% |
| Poland | 55 | 0.5% |
| Romania | 16 | 0.2% |
| Russia | 34 | 0.3% |
| Scotland | 8 | 0.1% |
| South Africa | 13 | 0.1% |
| South America | 364 | 3.6% |
| South Central Asia | 431 | 4.3% |
| South Eastern Asia | 368 | 3.7% |
| Southern Europe | 35 | 0.4% |
| Spain | 25 | 0.3% |
| St. Vincent and the Grenadines | 6 | 0.1% |
| Syria | 27 | 0.3% |
| Taiwan | 18 | 0.2% |
| Thailand | 15 | 0.2% |
| Trinidad and Tobago | 19 | 0.2% |
| Turkey | 53 | 0.5% |
| Ukraine | 10 | 0.1% |
| Venezuela | 23 | 0.2% |
| Vietnam | 9 | 0.1% |
| Western Africa | 15 | 0.2% |
| Western Asia | 142 | 1.4% | View All 64 Rows |
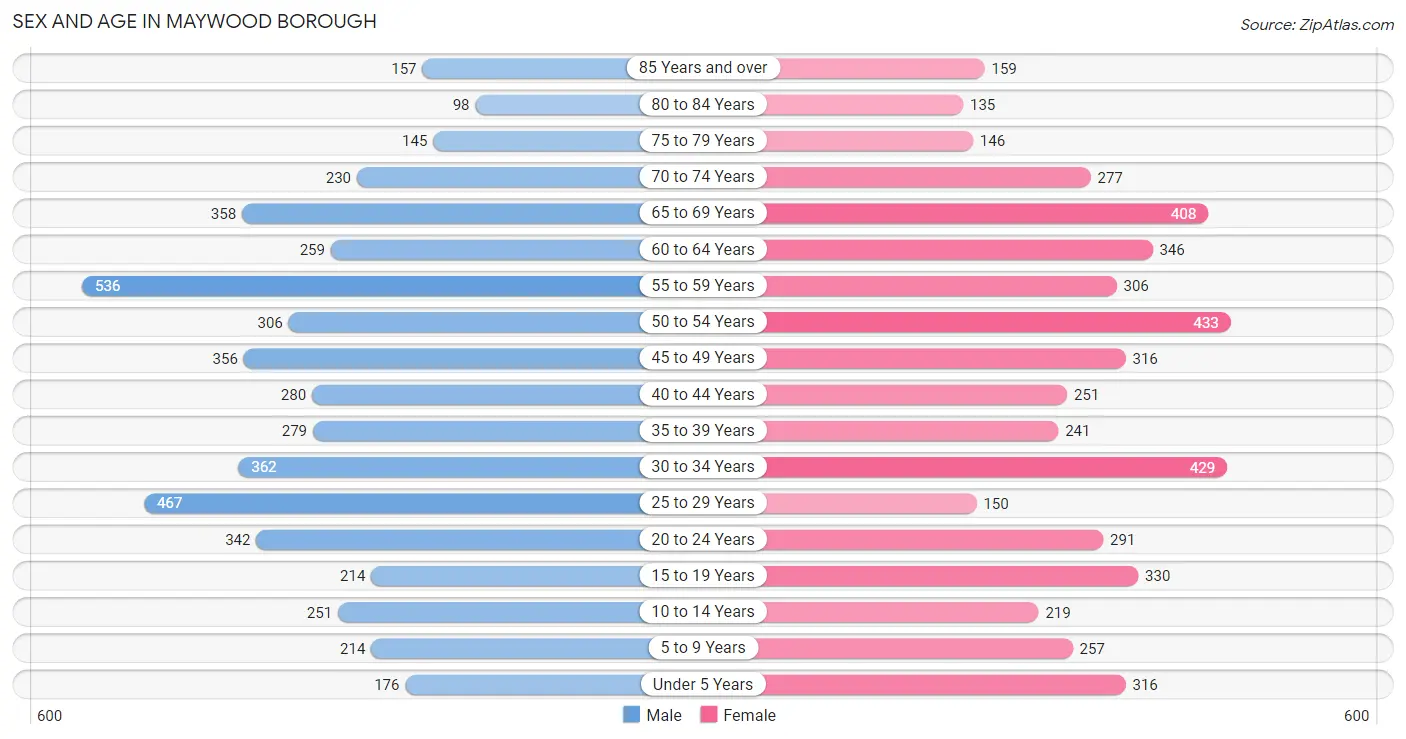
Sex and Age in Maywood borough
Sex and Age in Maywood borough
The most populous age groups in Maywood borough are 55 to 59 Years (536 | 10.7%) for men and 50 to 54 Years (433 | 8.6%) for women.
| Age Bracket | Male | Female |
| Under 5 Years | 176 (3.5%) | 316 (6.3%) |
| 5 to 9 Years | 214 (4.3%) | 257 (5.1%) |
| 10 to 14 Years | 251 (5.0%) | 219 (4.4%) |
| 15 to 19 Years | 214 (4.3%) | 330 (6.6%) |
| 20 to 24 Years | 342 (6.8%) | 291 (5.8%) |
| 25 to 29 Years | 467 (9.3%) | 150 (3.0%) |
| 30 to 34 Years | 362 (7.2%) | 429 (8.6%) |
| 35 to 39 Years | 279 (5.6%) | 241 (4.8%) |
| 40 to 44 Years | 280 (5.6%) | 251 (5.0%) |
| 45 to 49 Years | 356 (7.1%) | 316 (6.3%) |
| 50 to 54 Years | 306 (6.1%) | 433 (8.6%) |
| 55 to 59 Years | 536 (10.7%) | 306 (6.1%) |
| 60 to 64 Years | 259 (5.1%) | 346 (6.9%) |
| 65 to 69 Years | 358 (7.1%) | 408 (8.1%) |
| 70 to 74 Years | 230 (4.6%) | 277 (5.5%) |
| 75 to 79 Years | 145 (2.9%) | 146 (2.9%) |
| 80 to 84 Years | 98 (1.9%) | 135 (2.7%) |
| 85 Years and over | 157 (3.1%) | 159 (3.2%) |
| Total | 5,030 (100.0%) | 5,010 (100.0%) |
Families and Households in Maywood borough
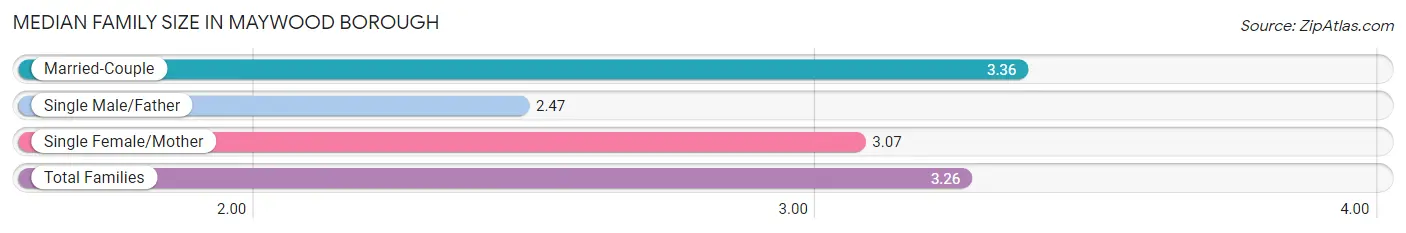
Median Family Size in Maywood borough
The median family size in Maywood borough is 3.26 persons per family, with married-couple families (2,127 | 80.7%) accounting for the largest median family size of 3.36 persons per family. On the other hand, single male/father families (174 | 6.6%) represent the smallest median family size with 2.47 persons per family.
| Family Type | # Families | Family Size |
| Married-Couple | 2,127 (80.7%) | 3.36 |
| Single Male/Father | 174 (6.6%) | 2.47 |
| Single Female/Mother | 336 (12.7%) | 3.07 |
| Total Families | 2,637 (100.0%) | 3.26 |
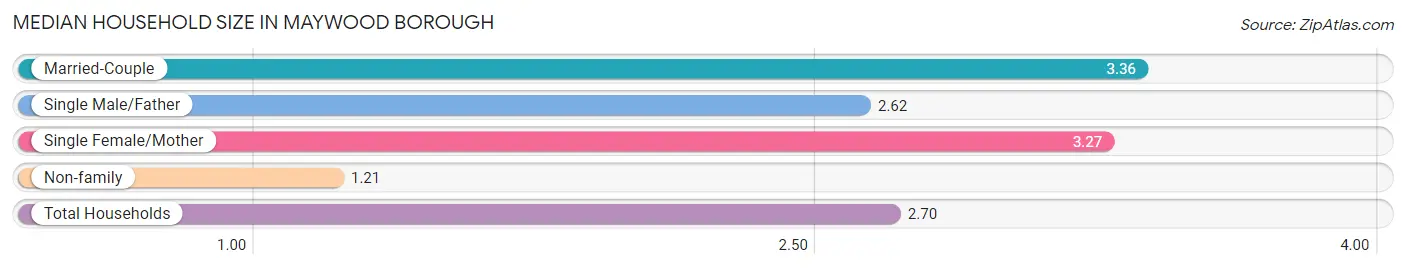
Median Household Size in Maywood borough
The median household size in Maywood borough is 2.70 persons per household, with married-couple households (2,127 | 57.5%) accounting for the largest median household size of 3.36 persons per household. non-family households (1,065 | 28.8%) represent the smallest median household size with 1.21 persons per household.
| Household Type | # Households | Household Size |
| Married-Couple | 2,127 (57.5%) | 3.36 |
| Single Male/Father | 174 (4.7%) | 2.62 |
| Single Female/Mother | 336 (9.1%) | 3.27 |
| Non-family | 1,065 (28.8%) | 1.21 |
| Total Households | 3,702 (100.0%) | 2.70 |
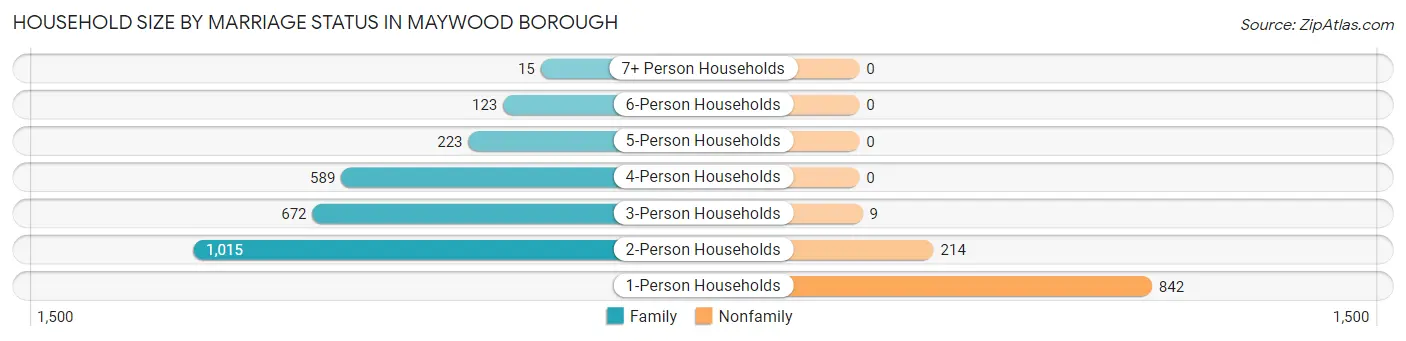
Household Size by Marriage Status in Maywood borough
Out of a total of 3,702 households in Maywood borough, 2,637 (71.2%) are family households, while 1,065 (28.8%) are nonfamily households. The most numerous type of family households are 2-person households, comprising 1,015, and the most common type of nonfamily households are 1-person households, comprising 842.
| Household Size | Family Households | Nonfamily Households |
| 1-Person Households | - | 842 (22.7%) |
| 2-Person Households | 1,015 (27.4%) | 214 (5.8%) |
| 3-Person Households | 672 (18.1%) | 9 (0.2%) |
| 4-Person Households | 589 (15.9%) | 0 (0.0%) |
| 5-Person Households | 223 (6.0%) | 0 (0.0%) |
| 6-Person Households | 123 (3.3%) | 0 (0.0%) |
| 7+ Person Households | 15 (0.4%) | 0 (0.0%) |
| Total | 2,637 (71.2%) | 1,065 (28.8%) |
Female Fertility in Maywood borough
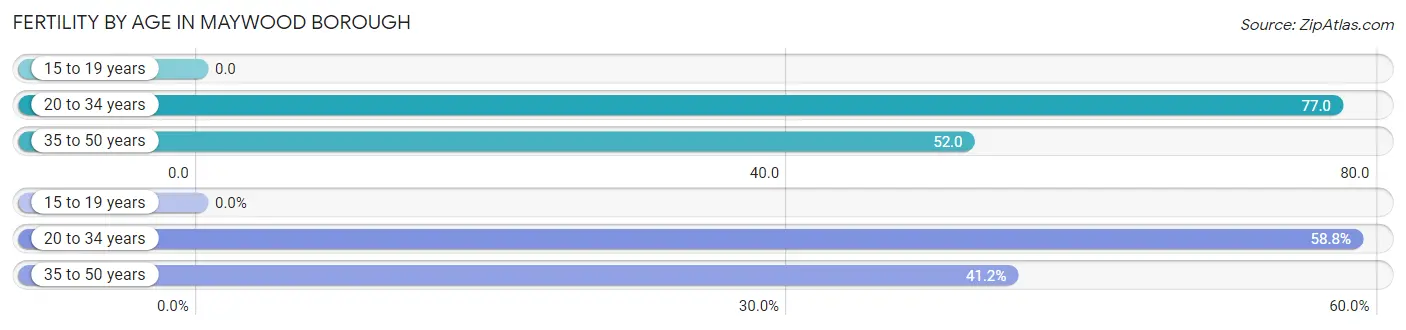
Fertility by Age in Maywood borough
Average fertility rate in Maywood borough is 54.0 births per 1,000 women. Women in the age bracket of 20 to 34 years have the highest fertility rate with 77.0 births per 1,000 women. Women in the age bracket of 20 to 34 years acount for 58.8% of all women with births.
| Age Bracket | Women with Births | Births / 1,000 Women |
| 15 to 19 years | 0 (0.0%) | 0.0 |
| 20 to 34 years | 67 (58.8%) | 77.0 |
| 35 to 50 years | 47 (41.2%) | 52.0 |
| Total | 114 (100.0%) | 54.0 |
Fertility by Age by Marriage Status in Maywood borough
93.9% of women with births (114) in Maywood borough are married. The highest percentage of unmarried women with births falls into 35 to 50 years age bracket with 14.9% of them unmarried at the time of birth, while the lowest percentage of unmarried women with births belong to 20 to 34 years age bracket with 0.0% of them unmarried.
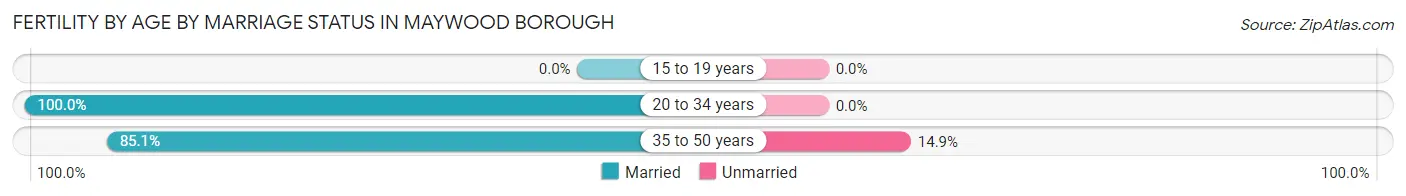
| Age Bracket | Married | Unmarried |
| 15 to 19 years | 0 (0.0%) | 0 (0.0%) |
| 20 to 34 years | 67 (100.0%) | 0 (0.0%) |
| 35 to 50 years | 40 (85.1%) | 7 (14.9%) |
| Total | 107 (93.9%) | 7 (6.1%) |
Fertility by Education in Maywood borough
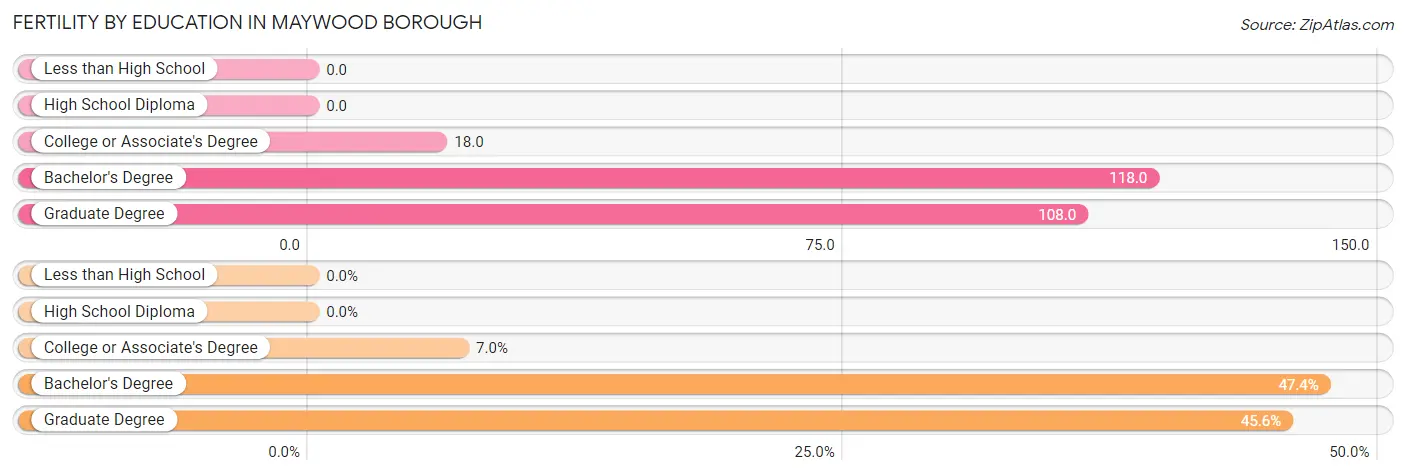
| Educational Attainment | Women with Births | Births / 1,000 Women |
| Less than High School | 0 (0.0%) | 0.0 |
| High School Diploma | 0 (0.0%) | 0.0 |
| College or Associate's Degree | 8 (7.0%) | 18.0 |
| Bachelor's Degree | 54 (47.4%) | 118.0 |
| Graduate Degree | 52 (45.6%) | 108.0 |
| Total | 114 (100.0%) | 54.0 |
Fertility by Education by Marriage Status in Maywood borough
6.1% of women with births in Maywood borough are unmarried. Women with the educational attainment of college or associate's degree are most likely to be married with 100.0% of them married at childbirth, while women with the educational attainment of graduate degree are least likely to be married with 13.5% of them unmarried at childbirth.
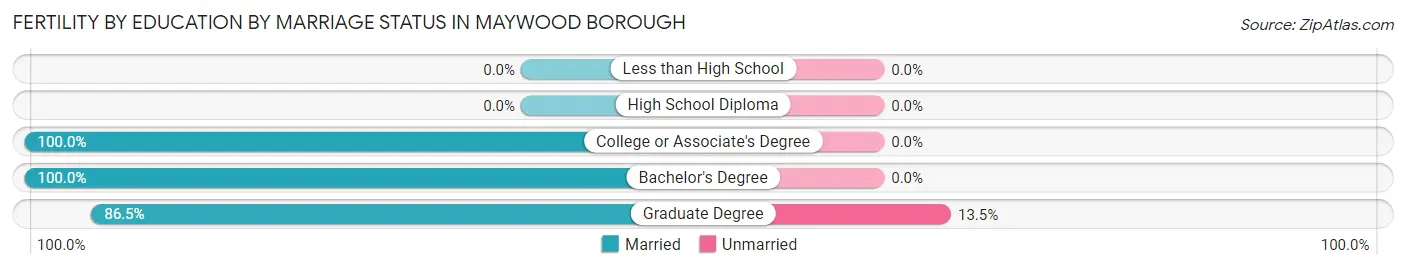
| Educational Attainment | Married | Unmarried |
| Less than High School | 0 (0.0%) | 0 (0.0%) |
| High School Diploma | 0 (0.0%) | 0 (0.0%) |
| College or Associate's Degree | 8 (100.0%) | 0 (0.0%) |
| Bachelor's Degree | 54 (100.0%) | 0 (0.0%) |
| Graduate Degree | 45 (86.5%) | 7 (13.5%) |
| Total | 107 (93.9%) | 7 (6.1%) |
Income in Maywood borough
Income Overview in Maywood borough
Per Capita Income in Maywood borough is $49,808, while median incomes of families and households are $137,905 and $119,057 respectively.
| Characteristic | Number | Measure |
| Per Capita Income | 10,040 | $49,808 |
| Median Family Income | 2,637 | $137,905 |
| Mean Family Income | 2,637 | $153,685 |
| Median Household Income | 3,702 | $119,057 |
| Mean Household Income | 3,702 | $132,831 |
| Income Deficit | 2,637 | $4,893 |
| Wage / Income Gap (%) | 10,040 | 3.90% |
| Wage / Income Gap ($) | 10,040 | 96.10¢ per $1 |
| Gini / Inequality Index | 10,040 | 0.38 |
Earnings by Sex in Maywood borough
Average Earnings in Maywood borough are $58,252, $59,323 for men and $57,007 for women, a difference of 3.9%.
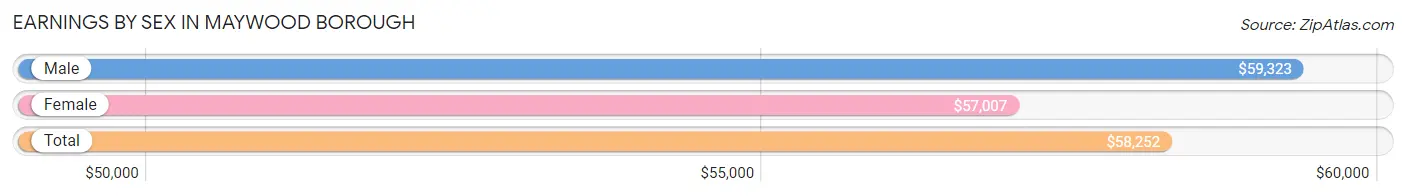
| Sex | Number | Average Earnings |
| Male | 3,056 (54.5%) | $59,323 |
| Female | 2,553 (45.5%) | $57,007 |
| Total | 5,609 (100.0%) | $58,252 |
Earnings by Sex by Income Bracket in Maywood borough
The most common earnings brackets in Maywood borough are $100,000+ for men (918 | 30.0%) and $100,000+ for women (450 | 17.6%).
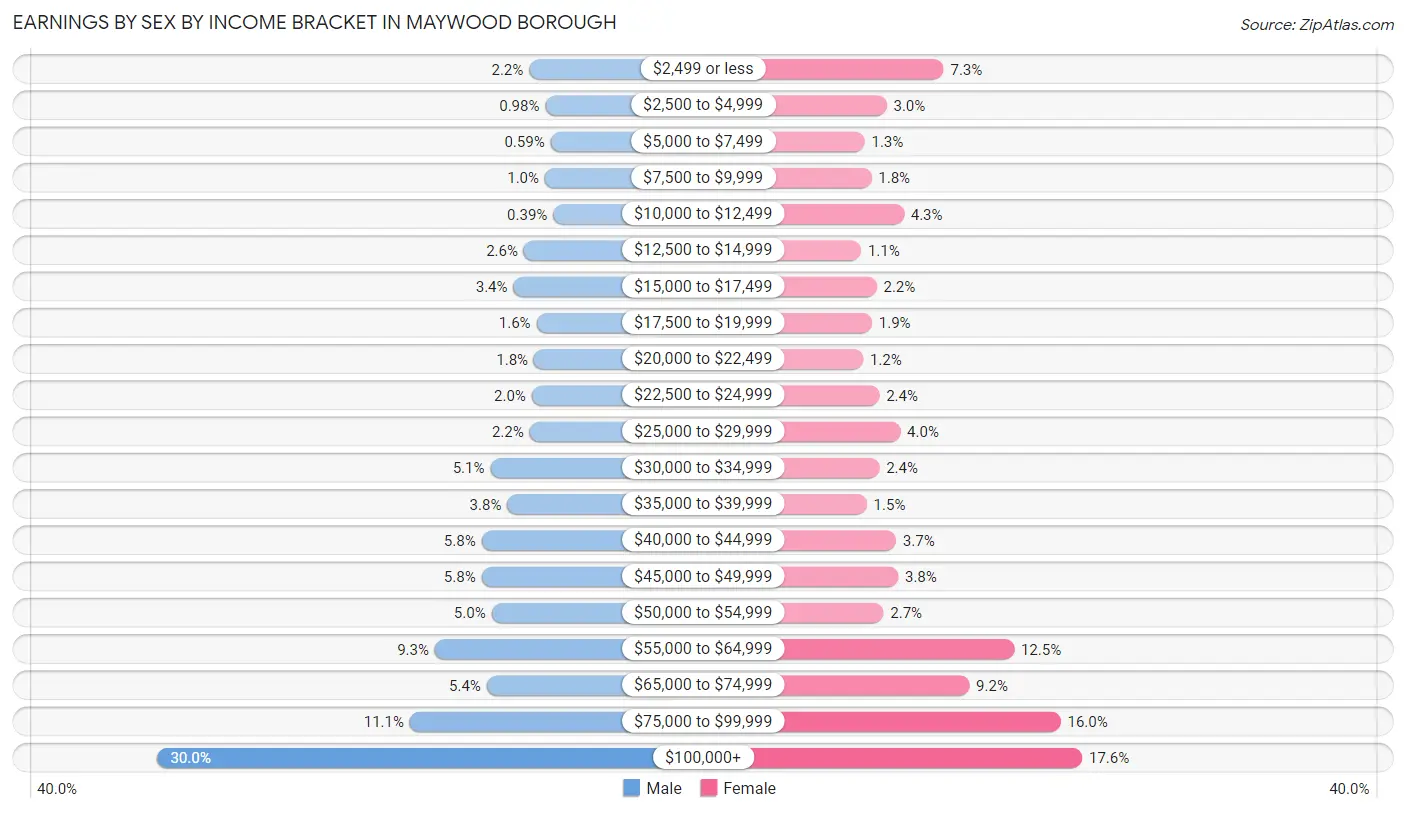
| Income | Male | Female |
| $2,499 or less | 67 (2.2%) | 185 (7.2%) |
| $2,500 to $4,999 | 30 (1.0%) | 76 (3.0%) |
| $5,000 to $7,499 | 18 (0.6%) | 34 (1.3%) |
| $7,500 to $9,999 | 31 (1.0%) | 47 (1.8%) |
| $10,000 to $12,499 | 12 (0.4%) | 109 (4.3%) |
| $12,500 to $14,999 | 79 (2.6%) | 27 (1.1%) |
| $15,000 to $17,499 | 103 (3.4%) | 57 (2.2%) |
| $17,500 to $19,999 | 50 (1.6%) | 48 (1.9%) |
| $20,000 to $22,499 | 56 (1.8%) | 31 (1.2%) |
| $22,500 to $24,999 | 61 (2.0%) | 62 (2.4%) |
| $25,000 to $29,999 | 66 (2.2%) | 102 (4.0%) |
| $30,000 to $34,999 | 156 (5.1%) | 62 (2.4%) |
| $35,000 to $39,999 | 117 (3.8%) | 38 (1.5%) |
| $40,000 to $44,999 | 176 (5.8%) | 94 (3.7%) |
| $45,000 to $49,999 | 176 (5.8%) | 98 (3.8%) |
| $50,000 to $54,999 | 153 (5.0%) | 70 (2.7%) |
| $55,000 to $64,999 | 283 (9.3%) | 320 (12.5%) |
| $65,000 to $74,999 | 164 (5.4%) | 234 (9.2%) |
| $75,000 to $99,999 | 340 (11.1%) | 409 (16.0%) |
| $100,000+ | 918 (30.0%) | 450 (17.6%) |
| Total | 3,056 (100.0%) | 2,553 (100.0%) |
Earnings by Sex by Educational Attainment in Maywood borough
Average earnings in Maywood borough are $68,671 for men and $63,983 for women, a difference of 6.8%. Men with an educational attainment of graduate degree enjoy the highest average annual earnings of $94,306, while those with less than high school education earn the least with $42,123. Women with an educational attainment of bachelor's degree earn the most with the average annual earnings of $73,289, while those with high school diploma education have the smallest earnings of $54,886.
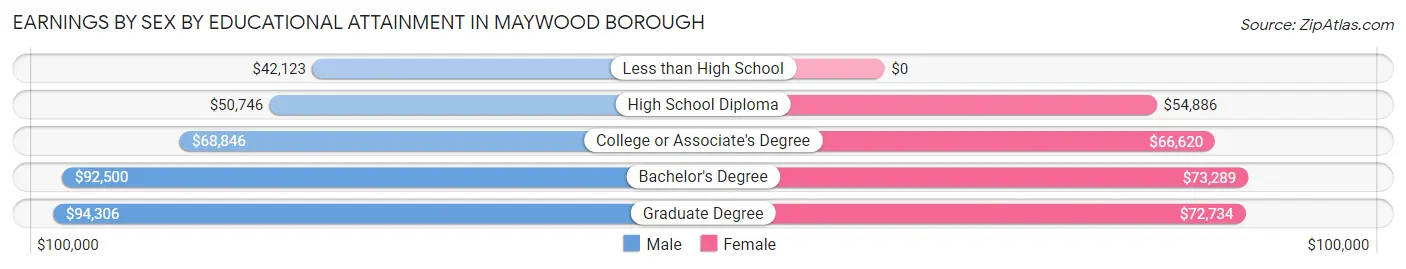
| Educational Attainment | Male Income | Female Income |
| Less than High School | $42,123 | $0 |
| High School Diploma | $50,746 | $54,886 |
| College or Associate's Degree | $68,846 | $66,620 |
| Bachelor's Degree | $92,500 | $73,289 |
| Graduate Degree | $94,306 | $72,734 |
| Total | $68,671 | $63,983 |
Family Income in Maywood borough
Family Income Brackets in Maywood borough
According to the Maywood borough family income data, there are 825 families falling into the $100,000 to $149,999 income range, which is the most common income bracket and makes up 31.3% of all families. Conversely, the $10,000 to $14,999 income bracket is the least frequent group with only 8 families (0.3%) belonging to this category.
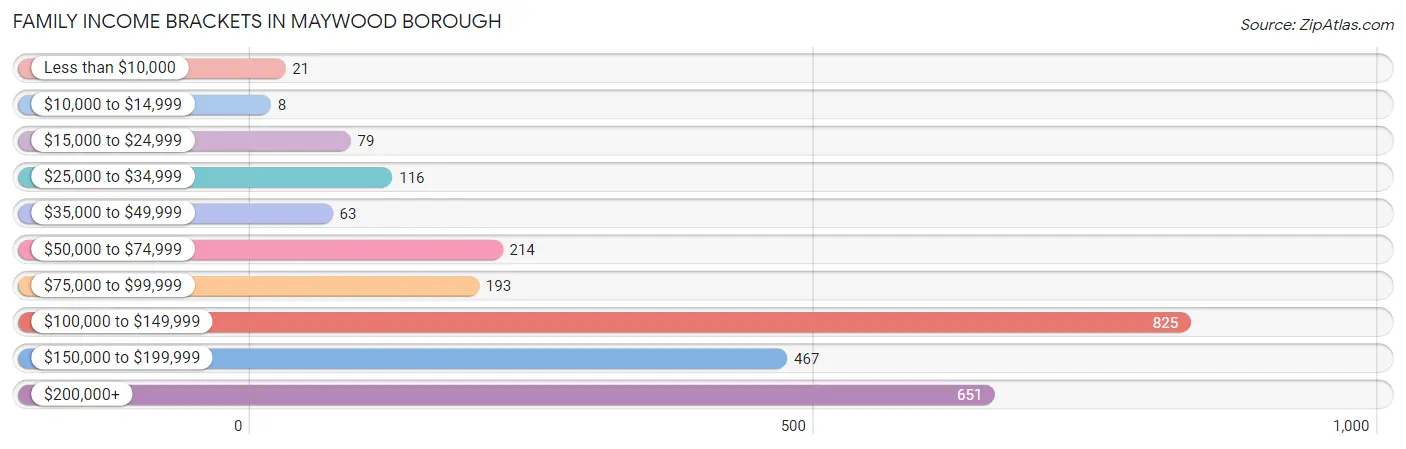
| Income Bracket | # Families | % Families |
| Less than $10,000 | 21 | 0.8% |
| $10,000 to $14,999 | 8 | 0.3% |
| $15,000 to $24,999 | 79 | 3.0% |
| $25,000 to $34,999 | 116 | 4.4% |
| $35,000 to $49,999 | 63 | 2.4% |
| $50,000 to $74,999 | 214 | 8.1% |
| $75,000 to $99,999 | 193 | 7.3% |
| $100,000 to $149,999 | 825 | 31.3% |
| $150,000 to $199,999 | 467 | 17.7% |
| $200,000+ | 651 | 24.7% |
Family Income by Famaliy Size in Maywood borough
7+ person families (15 | 0.6%) account for the highest median family income in Maywood borough with $250,001 per family, while 2-person families (1,083 | 41.1%) have the highest median income of $55,548 per family member.
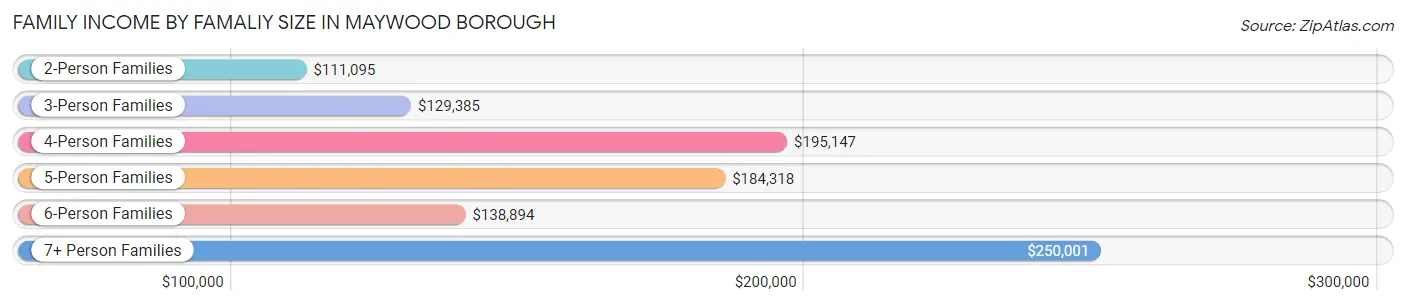
| Income Bracket | # Families | Median Income |
| 2-Person Families | 1,083 (41.1%) | $111,095 |
| 3-Person Families | 610 (23.1%) | $129,385 |
| 4-Person Families | 606 (23.0%) | $195,147 |
| 5-Person Families | 200 (7.6%) | $184,318 |
| 6-Person Families | 123 (4.7%) | $138,894 |
| 7+ Person Families | 15 (0.6%) | $250,001 |
| Total | 2,637 (100.0%) | $137,905 |
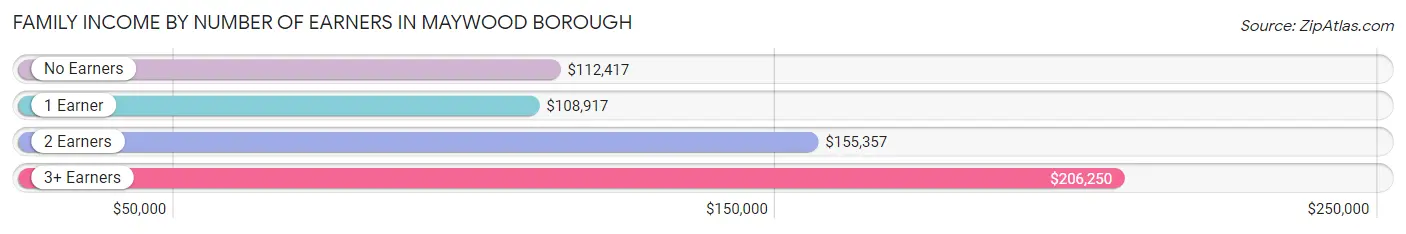
Family Income by Number of Earners in Maywood borough
The median family income in Maywood borough is $137,905, with families comprising 3+ earners (490) having the highest median family income of $206,250, while families with 1 earner (570) have the lowest median family income of $108,917, accounting for 18.6% and 21.6% of families, respectively.
| Number of Earners | # Families | Median Income |
| No Earners | 399 (15.1%) | $112,417 |
| 1 Earner | 570 (21.6%) | $108,917 |
| 2 Earners | 1,178 (44.7%) | $155,357 |
| 3+ Earners | 490 (18.6%) | $206,250 |
| Total | 2,637 (100.0%) | $137,905 |
Household Income in Maywood borough
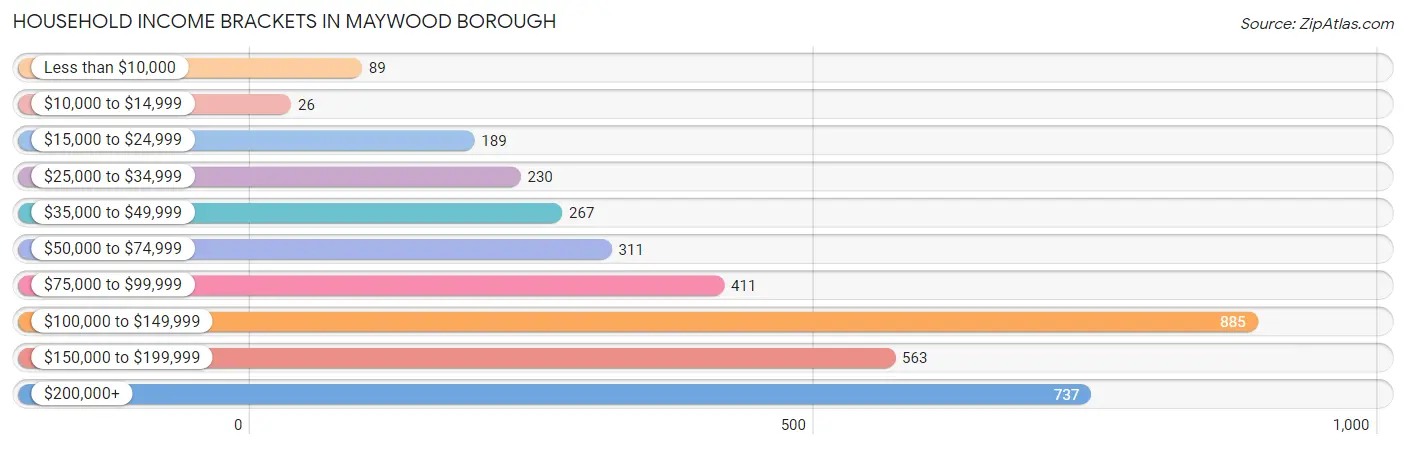
Household Income Brackets in Maywood borough
With 885 households falling in the category, the $100,000 to $149,999 income range is the most frequent in Maywood borough, accounting for 23.9% of all households. In contrast, only 26 households (0.7%) fall into the $10,000 to $14,999 income bracket, making it the least populous group.
| Income Bracket | # Households | % Households |
| Less than $10,000 | 89 | 2.4% |
| $10,000 to $14,999 | 26 | 0.7% |
| $15,000 to $24,999 | 189 | 5.1% |
| $25,000 to $34,999 | 230 | 6.2% |
| $35,000 to $49,999 | 267 | 7.2% |
| $50,000 to $74,999 | 311 | 8.4% |
| $75,000 to $99,999 | 411 | 11.1% |
| $100,000 to $149,999 | 885 | 23.9% |
| $150,000 to $199,999 | 563 | 15.2% |
| $200,000+ | 737 | 19.9% |
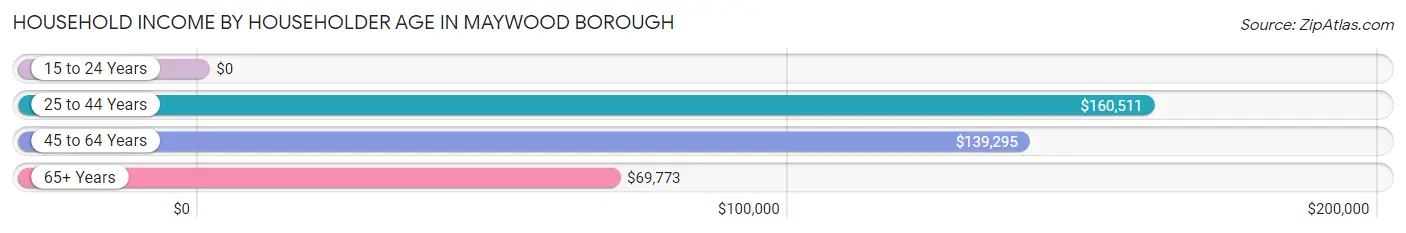
Household Income by Householder Age in Maywood borough
The median household income in Maywood borough is $119,057, with the highest median household income of $160,511 found in the 25 to 44 years age bracket for the primary householder. A total of 866 households (23.4%) fall into this category. Meanwhile, the 15 to 24 years age bracket for the primary householder has the lowest median household income of $0, with 49 households (1.3%) in this group.
| Income Bracket | # Households | Median Income |
| 15 to 24 Years | 49 (1.3%) | $0 |
| 25 to 44 Years | 866 (23.4%) | $160,511 |
| 45 to 64 Years | 1,601 (43.2%) | $139,295 |
| 65+ Years | 1,186 (32.0%) | $69,773 |
| Total | 3,702 (100.0%) | $119,057 |
Poverty in Maywood borough
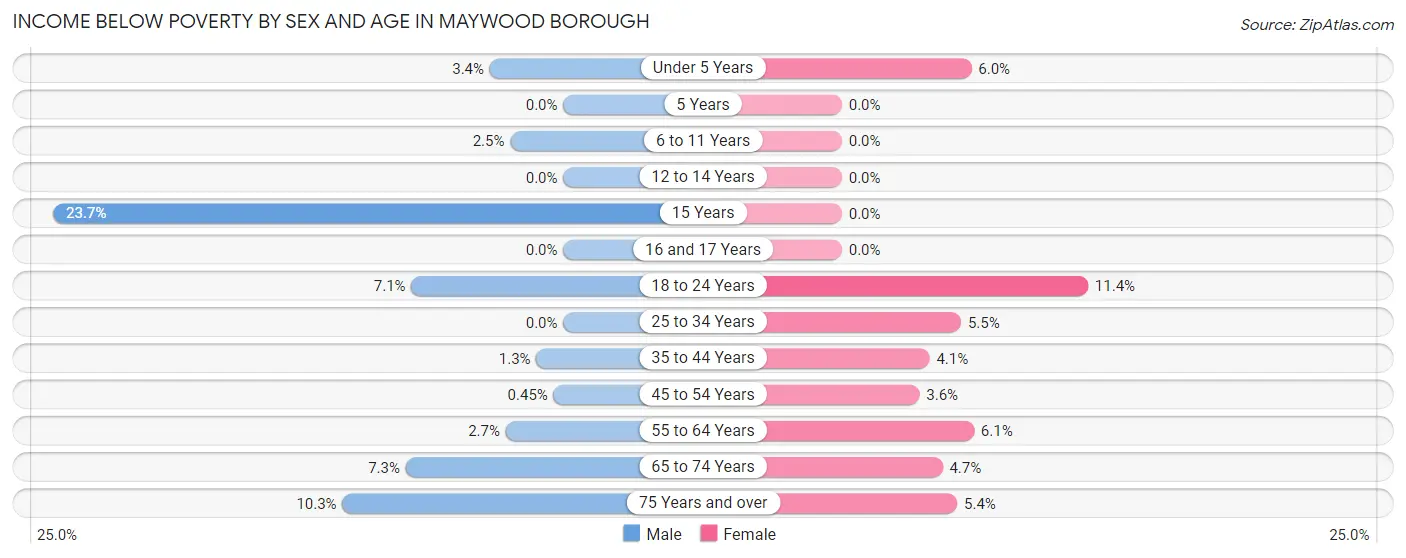
Income Below Poverty by Sex and Age in Maywood borough
With 3.4% poverty level for males and 4.8% for females among the residents of Maywood borough, 15 year old males and 18 to 24 year old females are the most vulnerable to poverty, with 9 males (23.7%) and 49 females (11.4%) in their respective age groups living below the poverty level.
| Age Bracket | Male | Female |
| Under 5 Years | 6 (3.4%) | 19 (6.0%) |
| 5 Years | 0 (0.0%) | 0 (0.0%) |
| 6 to 11 Years | 7 (2.5%) | 0 (0.0%) |
| 12 to 14 Years | 0 (0.0%) | 0 (0.0%) |
| 15 Years | 9 (23.7%) | 0 (0.0%) |
| 16 and 17 Years | 0 (0.0%) | 0 (0.0%) |
| 18 to 24 Years | 31 (7.0%) | 49 (11.4%) |
| 25 to 34 Years | 0 (0.0%) | 32 (5.5%) |
| 35 to 44 Years | 7 (1.3%) | 20 (4.1%) |
| 45 to 54 Years | 3 (0.4%) | 27 (3.6%) |
| 55 to 64 Years | 21 (2.7%) | 40 (6.1%) |
| 65 to 74 Years | 43 (7.3%) | 32 (4.7%) |
| 75 Years and over | 41 (10.2%) | 23 (5.3%) |
| Total | 168 (3.4%) | 242 (4.8%) |
Income Above Poverty by Sex and Age in Maywood borough
According to the poverty statistics in Maywood borough, males aged 5 years and females aged 5 years are the age groups that are most secure financially, with 100.0% of males and 100.0% of females in these age groups living above the poverty line.
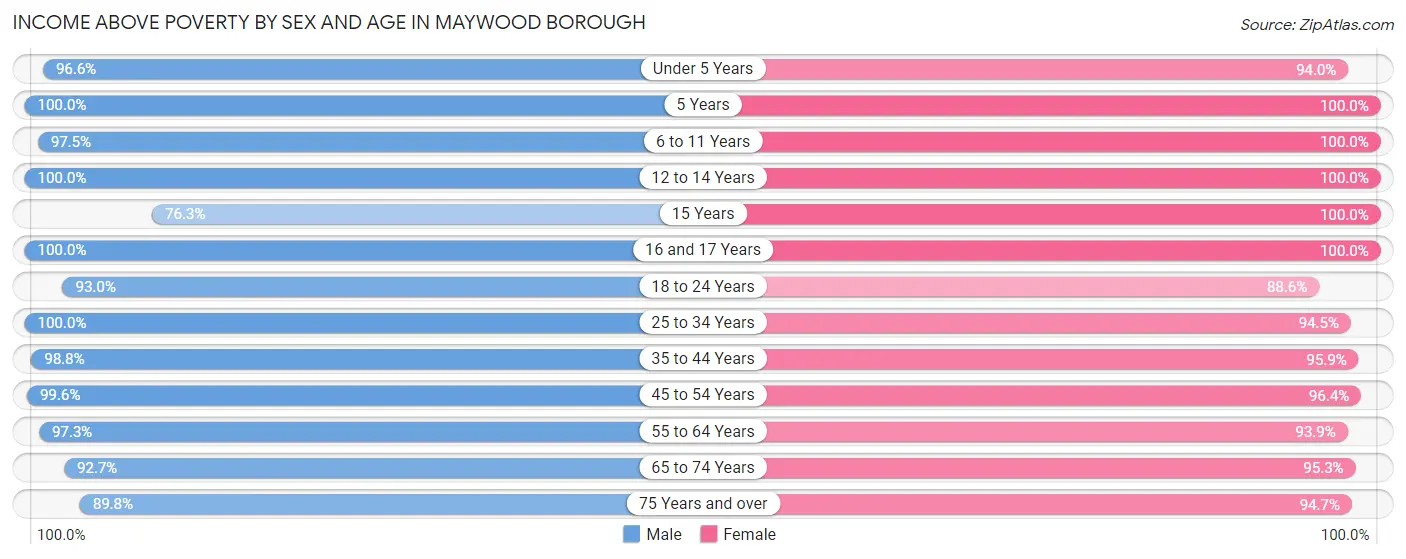
| Age Bracket | Male | Female |
| Under 5 Years | 170 (96.6%) | 297 (94.0%) |
| 5 Years | 37 (100.0%) | 24 (100.0%) |
| 6 to 11 Years | 278 (97.5%) | 374 (100.0%) |
| 12 to 14 Years | 143 (100.0%) | 78 (100.0%) |
| 15 Years | 29 (76.3%) | 71 (100.0%) |
| 16 and 17 Years | 78 (100.0%) | 121 (100.0%) |
| 18 to 24 Years | 409 (92.9%) | 380 (88.6%) |
| 25 to 34 Years | 829 (100.0%) | 547 (94.5%) |
| 35 to 44 Years | 552 (98.8%) | 472 (95.9%) |
| 45 to 54 Years | 659 (99.6%) | 722 (96.4%) |
| 55 to 64 Years | 765 (97.3%) | 612 (93.9%) |
| 65 to 74 Years | 545 (92.7%) | 653 (95.3%) |
| 75 Years and over | 359 (89.7%) | 407 (94.7%) |
| Total | 4,853 (96.7%) | 4,758 (95.2%) |
Income Below Poverty Among Married-Couple Families in Maywood borough
The poverty statistics for married-couple families in Maywood borough show that 2.3% or 49 of the total 2,127 families live below the poverty line. Families with no children have the highest poverty rate of 3.4%, comprising of 45 families. On the other hand, families with 3 or 4 children have the lowest poverty rate of 0.0%, which includes 0 families.
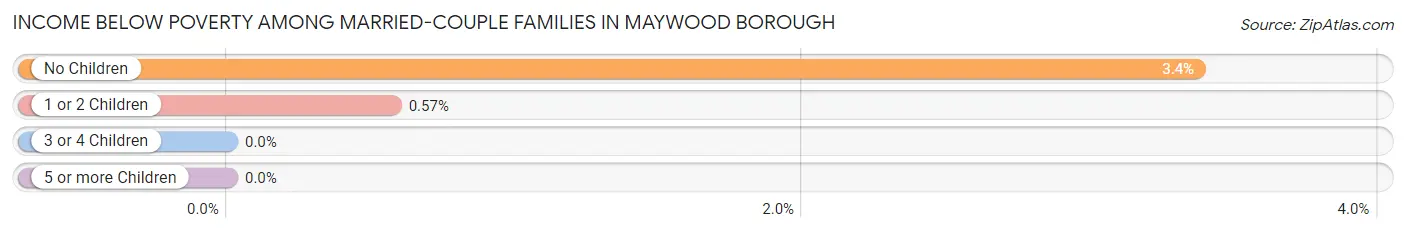
| Children | Above Poverty | Below Poverty |
| No Children | 1,290 (96.6%) | 45 (3.4%) |
| 1 or 2 Children | 702 (99.4%) | 4 (0.6%) |
| 3 or 4 Children | 86 (100.0%) | 0 (0.0%) |
| 5 or more Children | 0 (0.0%) | 0 (0.0%) |
| Total | 2,078 (97.7%) | 49 (2.3%) |
Income Below Poverty Among Single-Parent Households in Maywood borough
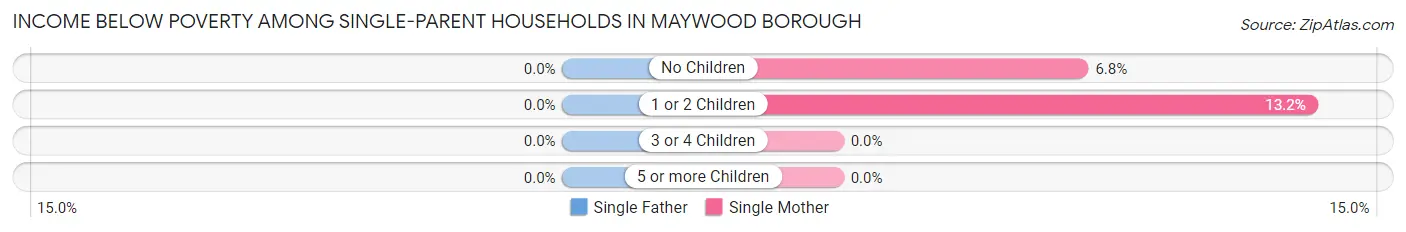
| Children | Single Father | Single Mother |
| No Children | 0 (0.0%) | 8 (6.8%) |
| 1 or 2 Children | 0 (0.0%) | 29 (13.2%) |
| 3 or 4 Children | 0 (0.0%) | 0 (0.0%) |
| 5 or more Children | 0 (0.0%) | 0 (0.0%) |
| Total | 0 (0.0%) | 37 (11.0%) |
Income Below Poverty Among Married-Couple vs Single-Parent Households in Maywood borough
The poverty data for Maywood borough shows that 49 of the married-couple family households (2.3%) and 37 of the single-parent households (7.2%) are living below the poverty level. Within the married-couple family households, those with no children have the highest poverty rate, with 45 households (3.4%) falling below the poverty line. Among the single-parent households, those with 1 or 2 children have the highest poverty rate, with 29 household (11.7%) living below poverty.
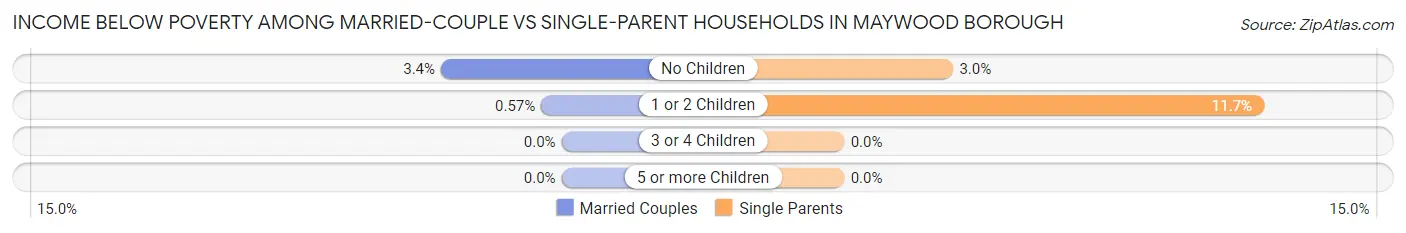
| Children | Married-Couple Families | Single-Parent Households |
| No Children | 45 (3.4%) | 8 (3.0%) |
| 1 or 2 Children | 4 (0.6%) | 29 (11.7%) |
| 3 or 4 Children | 0 (0.0%) | 0 (0.0%) |
| 5 or more Children | 0 (0.0%) | 0 (0.0%) |
| Total | 49 (2.3%) | 37 (7.2%) |
Employment Characteristics in Maywood borough
Employment by Class of Employer in Maywood borough
Among the 4,975 employed individuals in Maywood borough, private company employees (3,251 | 65.3%), local government employees (577 | 11.6%), and self-employed (incorporated) (334 | 6.7%) make up the most common classes of employment.
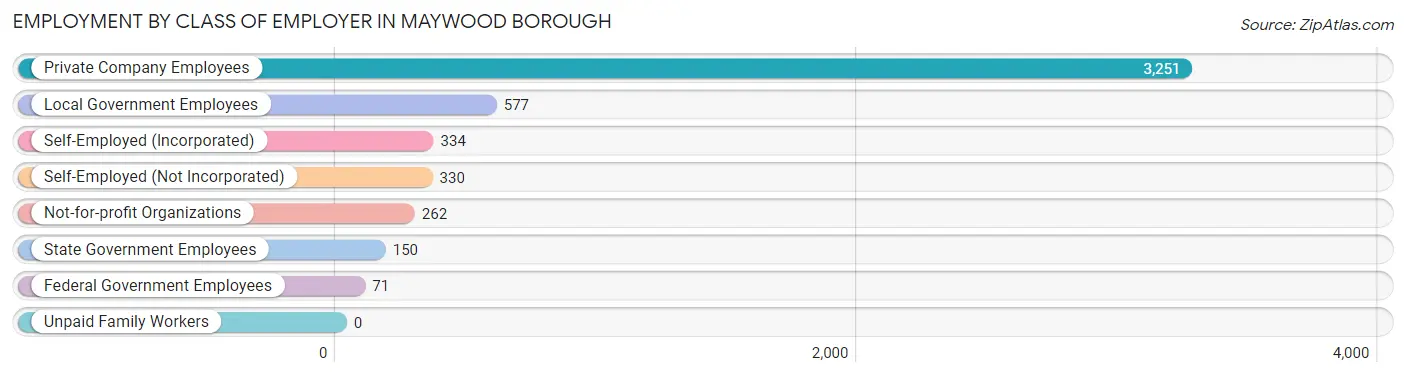
| Employer Class | # Employees | % Employees |
| Private Company Employees | 3,251 | 65.3% |
| Self-Employed (Incorporated) | 334 | 6.7% |
| Self-Employed (Not Incorporated) | 330 | 6.6% |
| Not-for-profit Organizations | 262 | 5.3% |
| Local Government Employees | 577 | 11.6% |
| State Government Employees | 150 | 3.0% |
| Federal Government Employees | 71 | 1.4% |
| Unpaid Family Workers | 0 | 0.0% |
| Total | 4,975 | 100.0% |
Employment Status by Age in Maywood borough
According to the labor force statistics for Maywood borough, out of the total population over 16 years of age (8,498), 65.5% or 5,566 individuals are in the labor force, with 8.0% or 445 of them unemployed. The age group with the highest labor force participation rate is 25 to 29 years, with 93.5% or 577 individuals in the labor force. Within the labor force, the 20 to 24 years age range has the highest percentage of unemployed individuals, with 27.3% or 117 of them being unemployed.
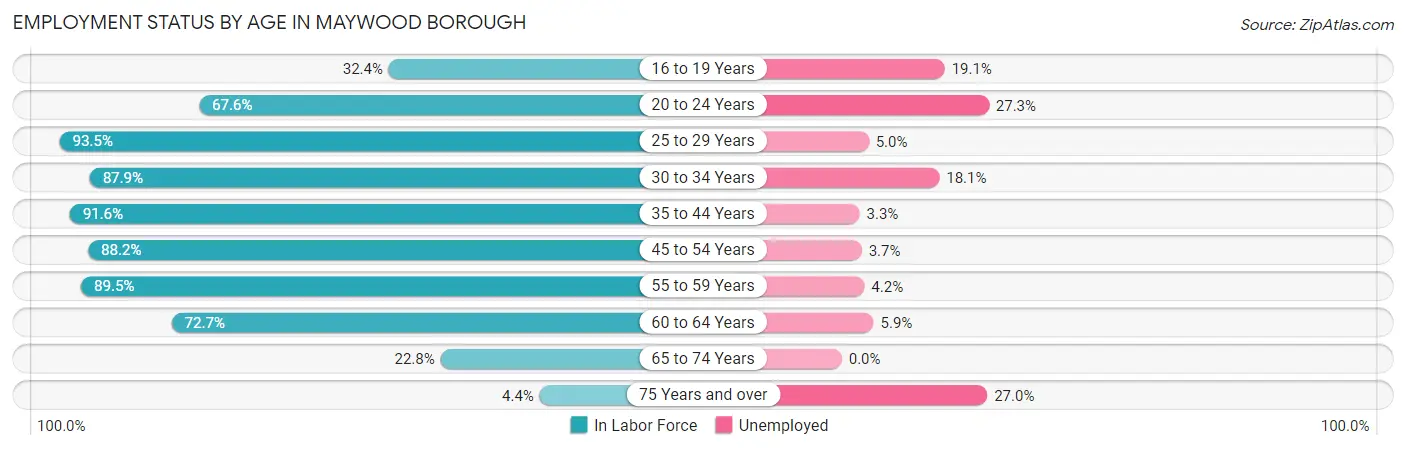
| Age Bracket | In Labor Force | Unemployed |
| 16 to 19 Years | 141 (32.4%) | 27 (19.1%) |
| 20 to 24 Years | 428 (67.6%) | 117 (27.3%) |
| 25 to 29 Years | 577 (93.5%) | 29 (5.0%) |
| 30 to 34 Years | 695 (87.9%) | 126 (18.1%) |
| 35 to 44 Years | 963 (91.6%) | 32 (3.3%) |
| 45 to 54 Years | 1,245 (88.2%) | 46 (3.7%) |
| 55 to 59 Years | 754 (89.5%) | 32 (4.2%) |
| 60 to 64 Years | 440 (72.7%) | 26 (5.9%) |
| 65 to 74 Years | 290 (22.8%) | 0 (0.0%) |
| 75 Years and over | 37 (4.4%) | 10 (27.0%) |
| Total | 5,566 (65.5%) | 445 (8.0%) |
Employment Status by Educational Attainment in Maywood borough
According to labor force statistics for Maywood borough, 87.9% of individuals (4,674) out of the total population between 25 and 64 years of age (5,317) are in the labor force, with 6.2% or 290 of them being unemployed. The group with the highest labor force participation rate are those with the educational attainment of bachelor's degree or higher, with 93.3% or 2,350 individuals in the labor force. Within the labor force, individuals with less than high school education have the highest percentage of unemployment, with 11.0% or 24 of them being unemployed.
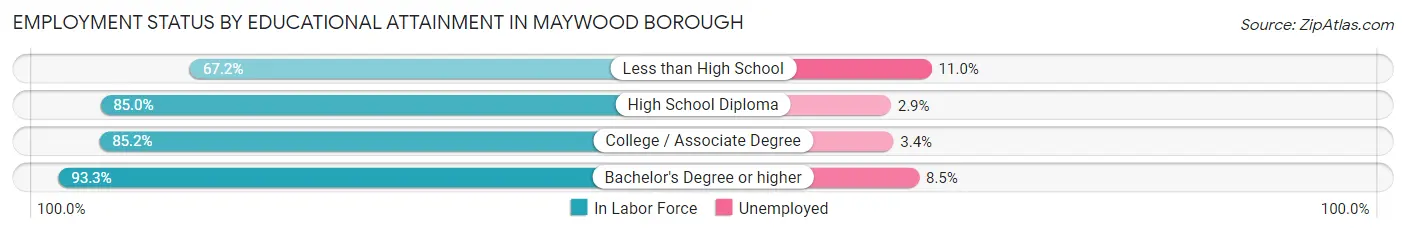
| Educational Attainment | In Labor Force | Unemployed |
| Less than High School | 219 (67.2%) | 36 (11.0%) |
| High School Diploma | 944 (85.0%) | 32 (2.9%) |
| College / Associate Degree | 1,160 (85.2%) | 46 (3.4%) |
| Bachelor's Degree or higher | 2,350 (93.3%) | 214 (8.5%) |
| Total | 4,674 (87.9%) | 330 (6.2%) |
Employment Occupations by Sex in Maywood borough
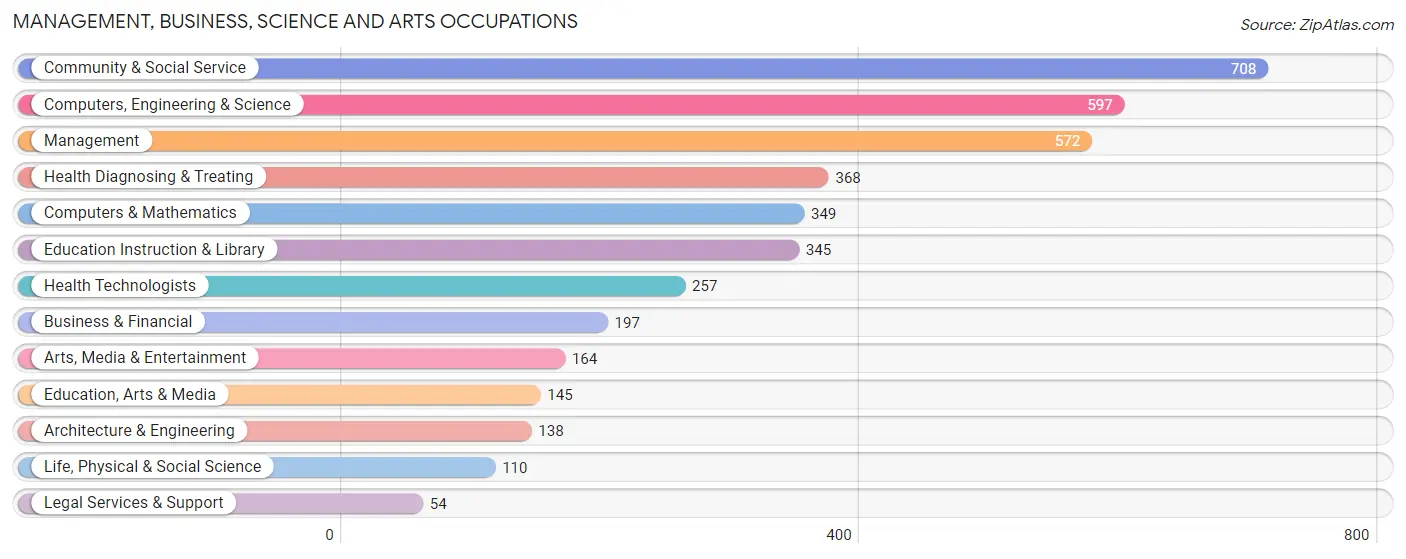
Management, Business, Science and Arts Occupations
The most common Management, Business, Science and Arts occupations in Maywood borough are Community & Social Service (708 | 13.8%), Computers, Engineering & Science (597 | 11.7%), Management (572 | 11.2%), Health Diagnosing & Treating (368 | 7.2%), and Computers & Mathematics (349 | 6.8%).
Management, Business, Science and Arts Occupations by Sex
Within the Management, Business, Science and Arts occupations in Maywood borough, the most male-oriented occupations are Architecture & Engineering (86.2%), Life, Physical & Social Science (77.3%), and Management (76.7%), while the most female-oriented occupations are Health Technologists (74.3%), Education Instruction & Library (73.9%), and Health Diagnosing & Treating (70.1%).
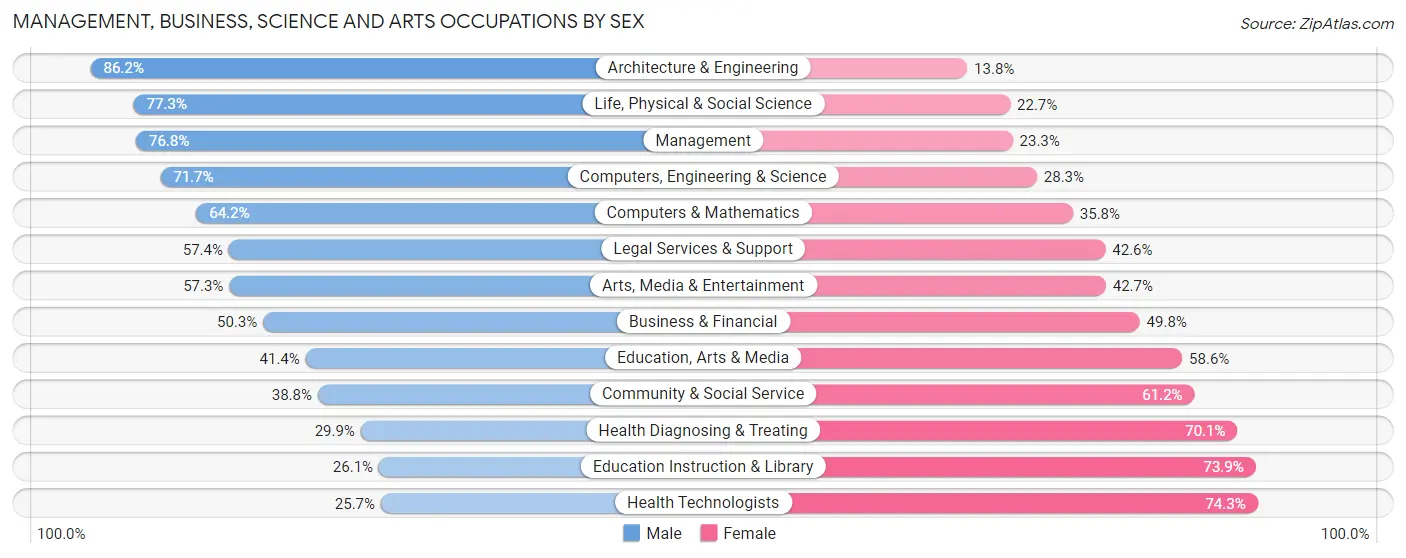
| Occupation | Male | Female |
| Management | 439 (76.7%) | 133 (23.3%) |
| Business & Financial | 99 (50.2%) | 98 (49.7%) |
| Computers, Engineering & Science | 428 (71.7%) | 169 (28.3%) |
| Computers & Mathematics | 224 (64.2%) | 125 (35.8%) |
| Architecture & Engineering | 119 (86.2%) | 19 (13.8%) |
| Life, Physical & Social Science | 85 (77.3%) | 25 (22.7%) |
| Community & Social Service | 275 (38.8%) | 433 (61.2%) |
| Education, Arts & Media | 60 (41.4%) | 85 (58.6%) |
| Legal Services & Support | 31 (57.4%) | 23 (42.6%) |
| Education Instruction & Library | 90 (26.1%) | 255 (73.9%) |
| Arts, Media & Entertainment | 94 (57.3%) | 70 (42.7%) |
| Health Diagnosing & Treating | 110 (29.9%) | 258 (70.1%) |
| Health Technologists | 66 (25.7%) | 191 (74.3%) |
| Total (Category) | 1,351 (55.3%) | 1,091 (44.7%) |
| Total (Overall) | 2,833 (55.3%) | 2,291 (44.7%) |
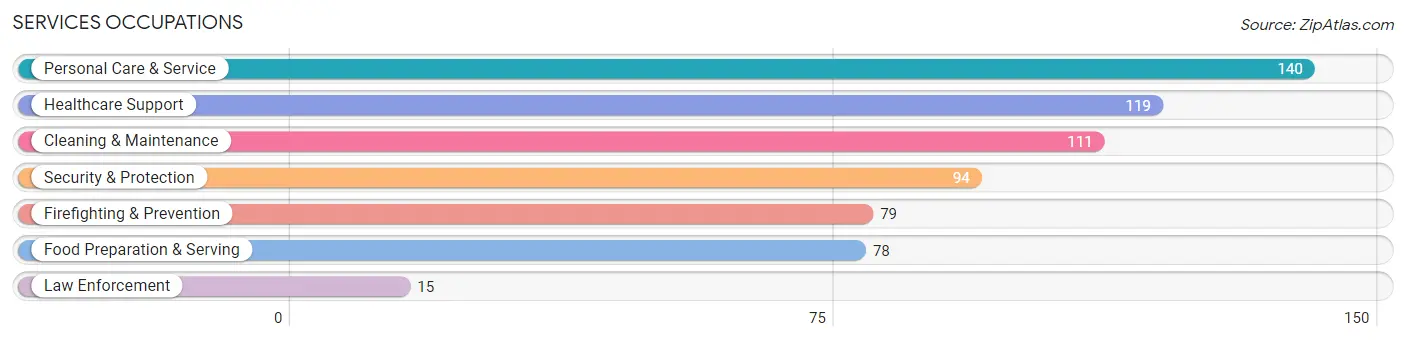
Services Occupations
The most common Services occupations in Maywood borough are Personal Care & Service (140 | 2.7%), Healthcare Support (119 | 2.3%), Cleaning & Maintenance (111 | 2.2%), Security & Protection (94 | 1.8%), and Firefighting & Prevention (79 | 1.5%).
Services Occupations by Sex
Within the Services occupations in Maywood borough, the most male-oriented occupations are Law Enforcement (100.0%), Security & Protection (72.3%), and Firefighting & Prevention (67.1%), while the most female-oriented occupations are Healthcare Support (90.8%), Personal Care & Service (81.4%), and Food Preparation & Serving (73.1%).
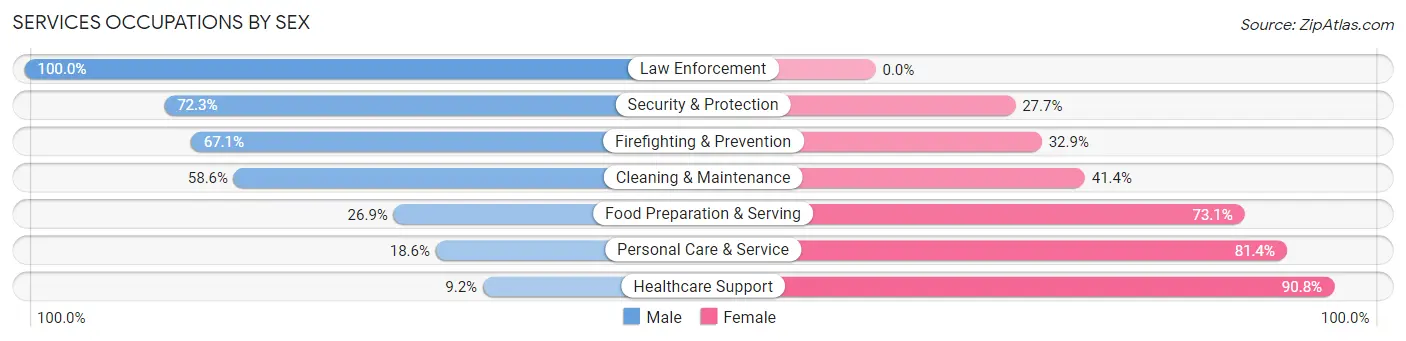
| Occupation | Male | Female |
| Healthcare Support | 11 (9.2%) | 108 (90.8%) |
| Security & Protection | 68 (72.3%) | 26 (27.7%) |
| Firefighting & Prevention | 53 (67.1%) | 26 (32.9%) |
| Law Enforcement | 15 (100.0%) | 0 (0.0%) |
| Food Preparation & Serving | 21 (26.9%) | 57 (73.1%) |
| Cleaning & Maintenance | 65 (58.6%) | 46 (41.4%) |
| Personal Care & Service | 26 (18.6%) | 114 (81.4%) |
| Total (Category) | 191 (35.2%) | 351 (64.8%) |
| Total (Overall) | 2,833 (55.3%) | 2,291 (44.7%) |
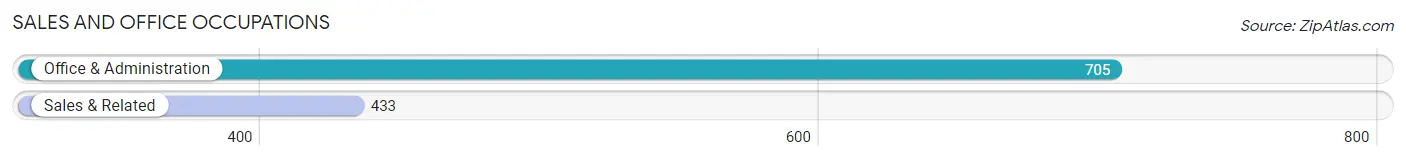
Sales and Office Occupations
The most common Sales and Office occupations in Maywood borough are Office & Administration (705 | 13.8%), and Sales & Related (433 | 8.5%).
Sales and Office Occupations by Sex

| Occupation | Male | Female |
| Sales & Related | 231 (53.3%) | 202 (46.7%) |
| Office & Administration | 116 (16.5%) | 589 (83.6%) |
| Total (Category) | 347 (30.5%) | 791 (69.5%) |
| Total (Overall) | 2,833 (55.3%) | 2,291 (44.7%) |
Natural Resources, Construction and Maintenance Occupations
The most common Natural Resources, Construction and Maintenance occupations in Maywood borough are Installation, Maintenance & Repair (231 | 4.5%), and Construction & Extraction (180 | 3.5%).
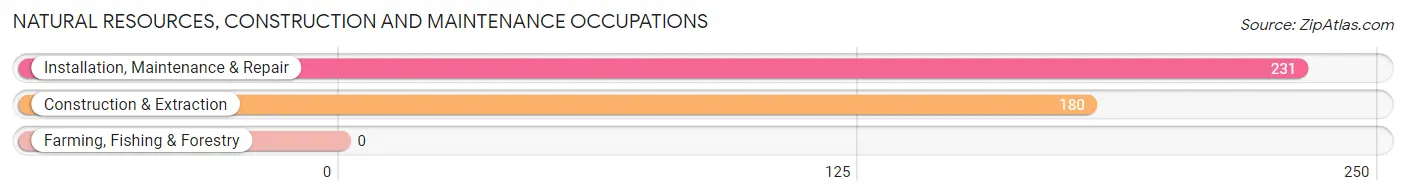
Natural Resources, Construction and Maintenance Occupations by Sex
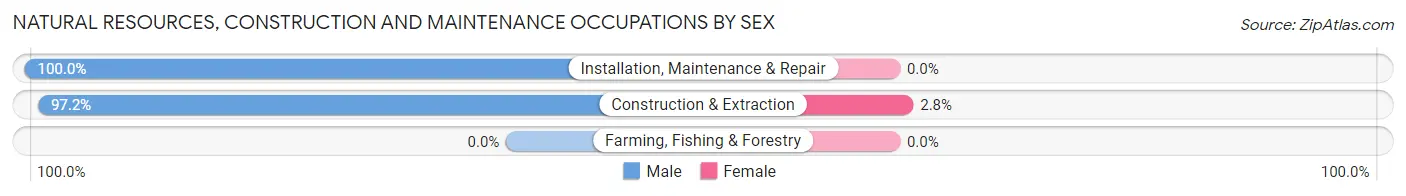
| Occupation | Male | Female |
| Farming, Fishing & Forestry | 0 (0.0%) | 0 (0.0%) |
| Construction & Extraction | 175 (97.2%) | 5 (2.8%) |
| Installation, Maintenance & Repair | 231 (100.0%) | 0 (0.0%) |
| Total (Category) | 406 (98.8%) | 5 (1.2%) |
| Total (Overall) | 2,833 (55.3%) | 2,291 (44.7%) |
Production, Transportation and Moving Occupations
The most common Production, Transportation and Moving occupations in Maywood borough are Transportation (267 | 5.2%), Production (173 | 3.4%), and Material Moving (151 | 2.9%).
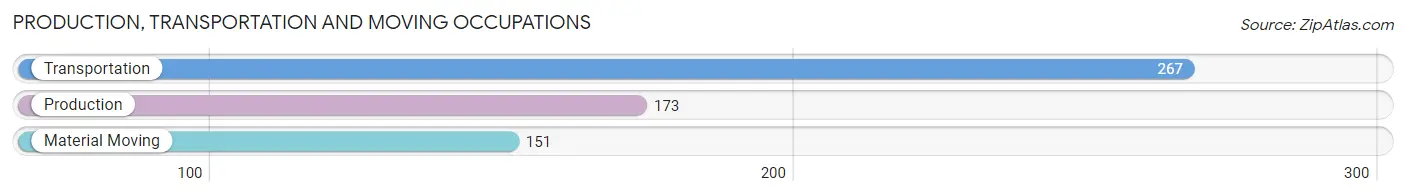
Production, Transportation and Moving Occupations by Sex
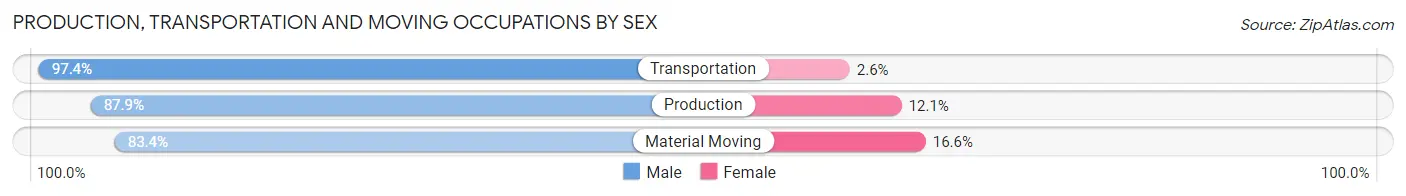
| Occupation | Male | Female |
| Production | 152 (87.9%) | 21 (12.1%) |
| Transportation | 260 (97.4%) | 7 (2.6%) |
| Material Moving | 126 (83.4%) | 25 (16.6%) |
| Total (Category) | 538 (91.0%) | 53 (9.0%) |
| Total (Overall) | 2,833 (55.3%) | 2,291 (44.7%) |
Employment Industries by Sex in Maywood borough
Employment Industries in Maywood borough
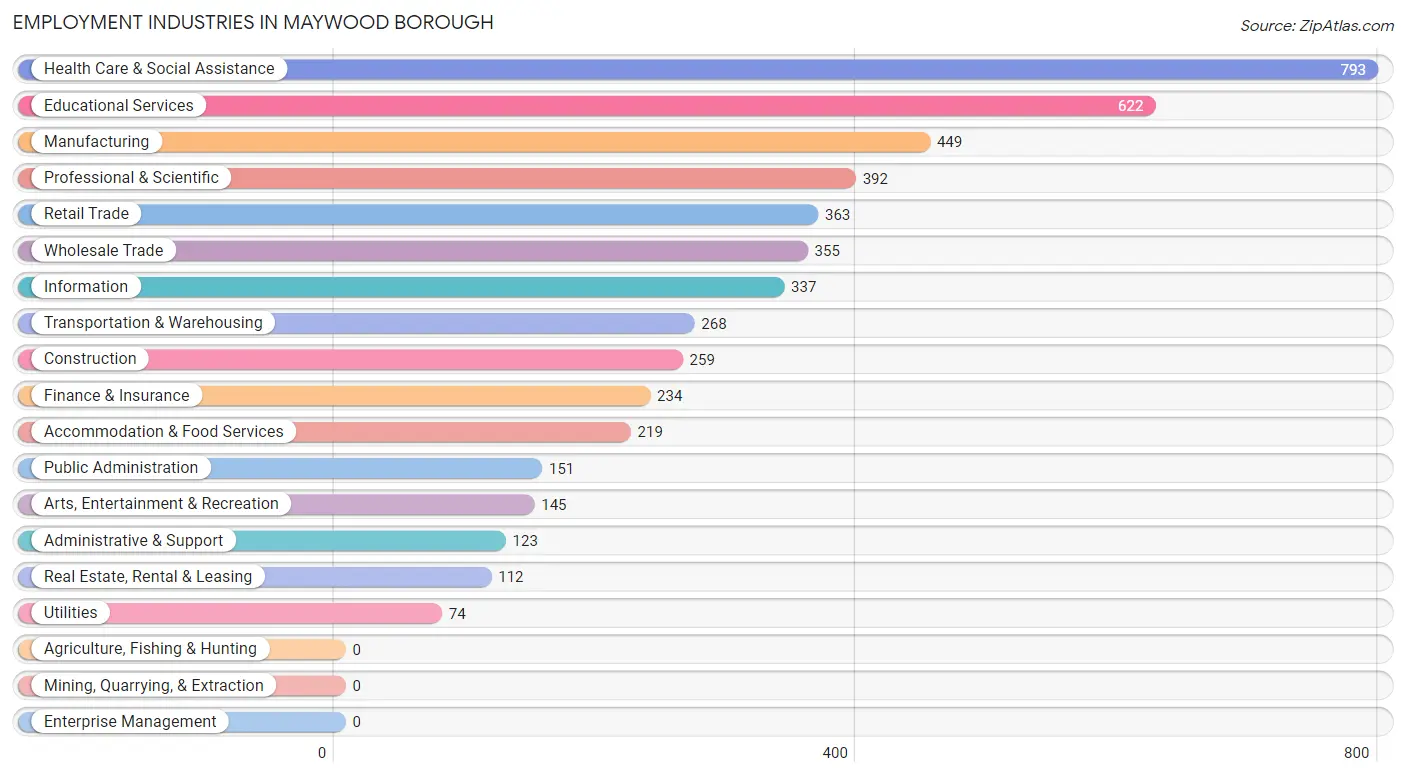
The major employment industries in Maywood borough include Health Care & Social Assistance (793 | 15.5%), Educational Services (622 | 12.1%), Manufacturing (449 | 8.8%), Professional & Scientific (392 | 7.6%), and Retail Trade (363 | 7.1%).
Employment Industries by Sex in Maywood borough
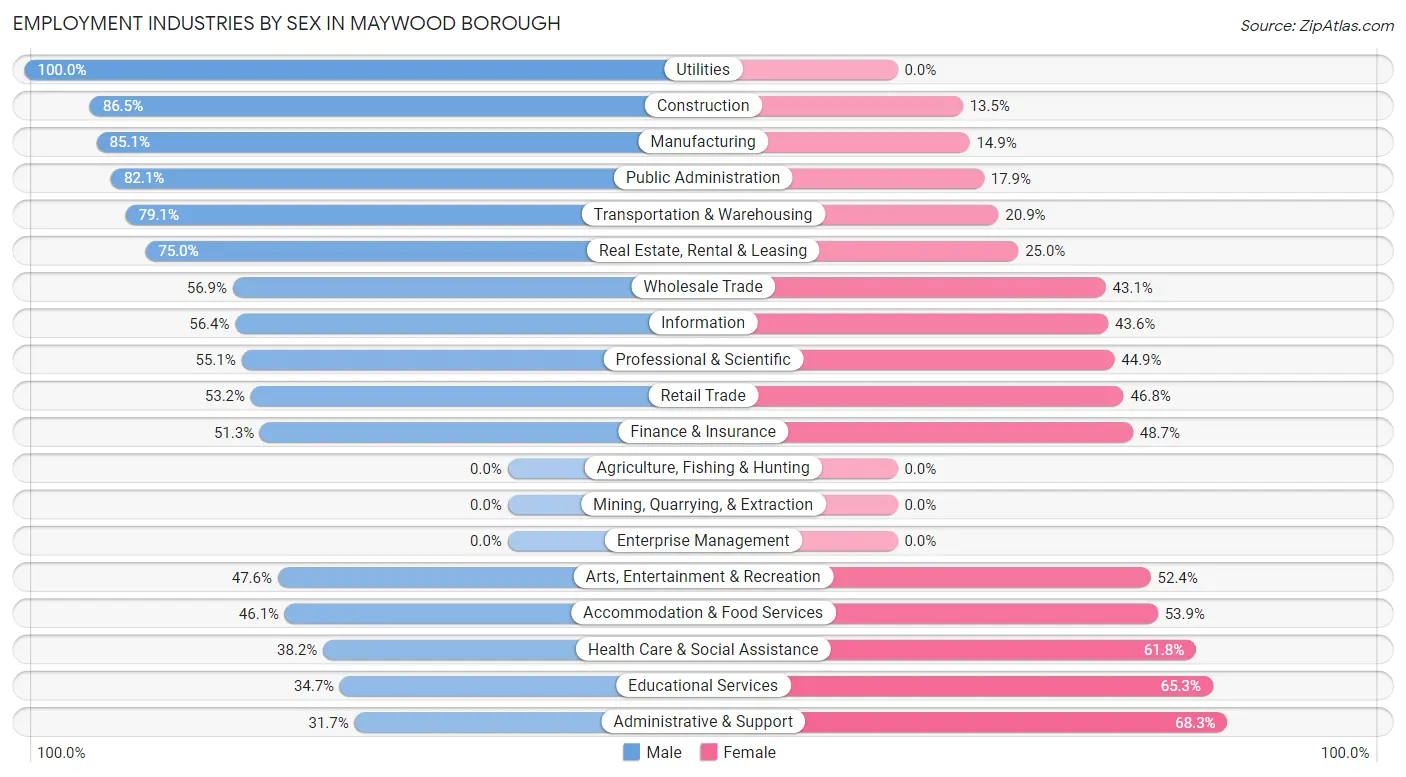
The Maywood borough industries that see more men than women are Utilities (100.0%), Construction (86.5%), and Manufacturing (85.1%), whereas the industries that tend to have a higher number of women are Administrative & Support (68.3%), Educational Services (65.3%), and Health Care & Social Assistance (61.8%).
| Industry | Male | Female |
| Agriculture, Fishing & Hunting | 0 (0.0%) | 0 (0.0%) |
| Mining, Quarrying, & Extraction | 0 (0.0%) | 0 (0.0%) |
| Construction | 224 (86.5%) | 35 (13.5%) |
| Manufacturing | 382 (85.1%) | 67 (14.9%) |
| Wholesale Trade | 202 (56.9%) | 153 (43.1%) |
| Retail Trade | 193 (53.2%) | 170 (46.8%) |
| Transportation & Warehousing | 212 (79.1%) | 56 (20.9%) |
| Utilities | 74 (100.0%) | 0 (0.0%) |
| Information | 190 (56.4%) | 147 (43.6%) |
| Finance & Insurance | 120 (51.3%) | 114 (48.7%) |
| Real Estate, Rental & Leasing | 84 (75.0%) | 28 (25.0%) |
| Professional & Scientific | 216 (55.1%) | 176 (44.9%) |
| Enterprise Management | 0 (0.0%) | 0 (0.0%) |
| Administrative & Support | 39 (31.7%) | 84 (68.3%) |
| Educational Services | 216 (34.7%) | 406 (65.3%) |
| Health Care & Social Assistance | 303 (38.2%) | 490 (61.8%) |
| Arts, Entertainment & Recreation | 69 (47.6%) | 76 (52.4%) |
| Accommodation & Food Services | 101 (46.1%) | 118 (53.9%) |
| Public Administration | 124 (82.1%) | 27 (17.9%) |
| Total | 2,833 (55.3%) | 2,291 (44.7%) |
Education in Maywood borough
School Enrollment in Maywood borough
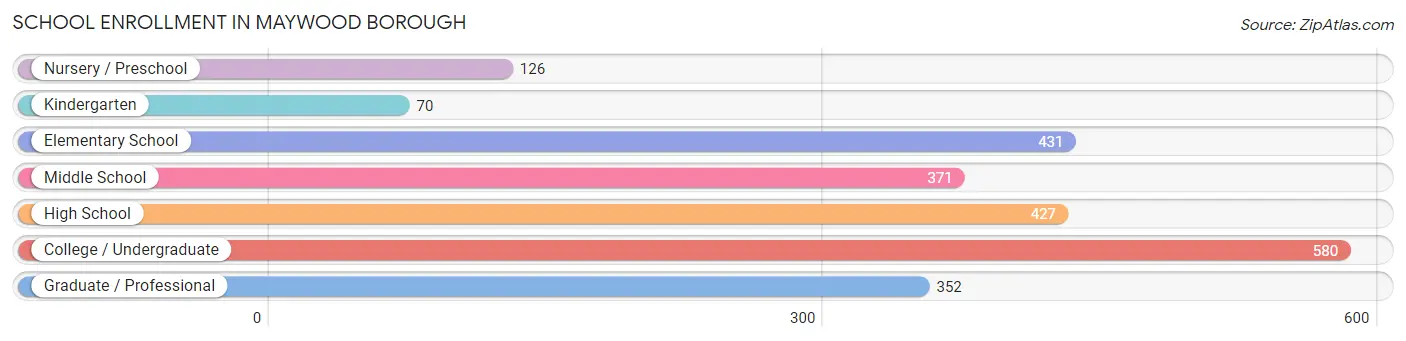
The most common levels of schooling among the 2,357 students in Maywood borough are college / undergraduate (580 | 24.6%), elementary school (431 | 18.3%), and high school (427 | 18.1%).
| School Level | # Students | % Students |
| Nursery / Preschool | 126 | 5.3% |
| Kindergarten | 70 | 3.0% |
| Elementary School | 431 | 18.3% |
| Middle School | 371 | 15.7% |
| High School | 427 | 18.1% |
| College / Undergraduate | 580 | 24.6% |
| Graduate / Professional | 352 | 14.9% |
| Total | 2,357 | 100.0% |
School Enrollment by Age by Funding Source in Maywood borough
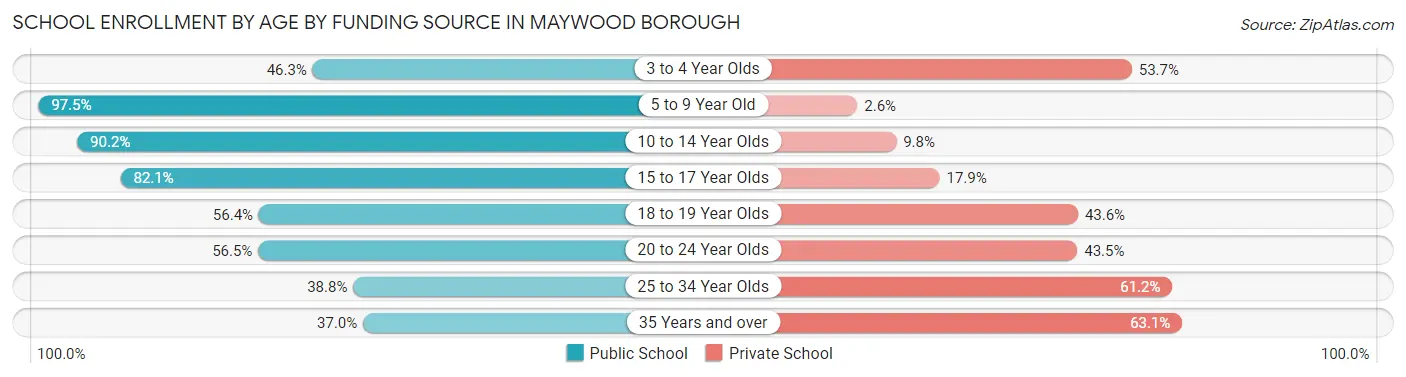
Out of a total of 2,357 students who are enrolled in schools in Maywood borough, 705 (29.9%) attend a private institution, while the remaining 1,652 (70.1%) are enrolled in public schools. The age group of 35 years and over has the highest likelihood of being enrolled in private schools, with 128 (63.0% in the age bracket) enrolled. Conversely, the age group of 5 to 9 year old has the lowest likelihood of being enrolled in a private school, with 459 (97.5% in the age bracket) attending a public institution.
| Age Bracket | Public School | Private School |
| 3 to 4 Year Olds | 38 (46.3%) | 44 (53.7%) |
| 5 to 9 Year Old | 459 (97.5%) | 12 (2.5%) |
| 10 to 14 Year Olds | 424 (90.2%) | 46 (9.8%) |
| 15 to 17 Year Olds | 253 (82.1%) | 55 (17.9%) |
| 18 to 19 Year Olds | 133 (56.4%) | 103 (43.6%) |
| 20 to 24 Year Olds | 135 (56.5%) | 104 (43.5%) |
| 25 to 34 Year Olds | 135 (38.8%) | 213 (61.2%) |
| 35 Years and over | 75 (36.9%) | 128 (63.0%) |
| Total | 1,652 (70.1%) | 705 (29.9%) |
Educational Attainment by Field of Study in Maywood borough
Science & technology (666 | 18.9%), business (616 | 17.5%), education (384 | 10.9%), social sciences (303 | 8.6%), and bio, nature & agricultural (234 | 6.6%) are the most common fields of study among 3,522 individuals in Maywood borough who have obtained a bachelor's degree or higher.
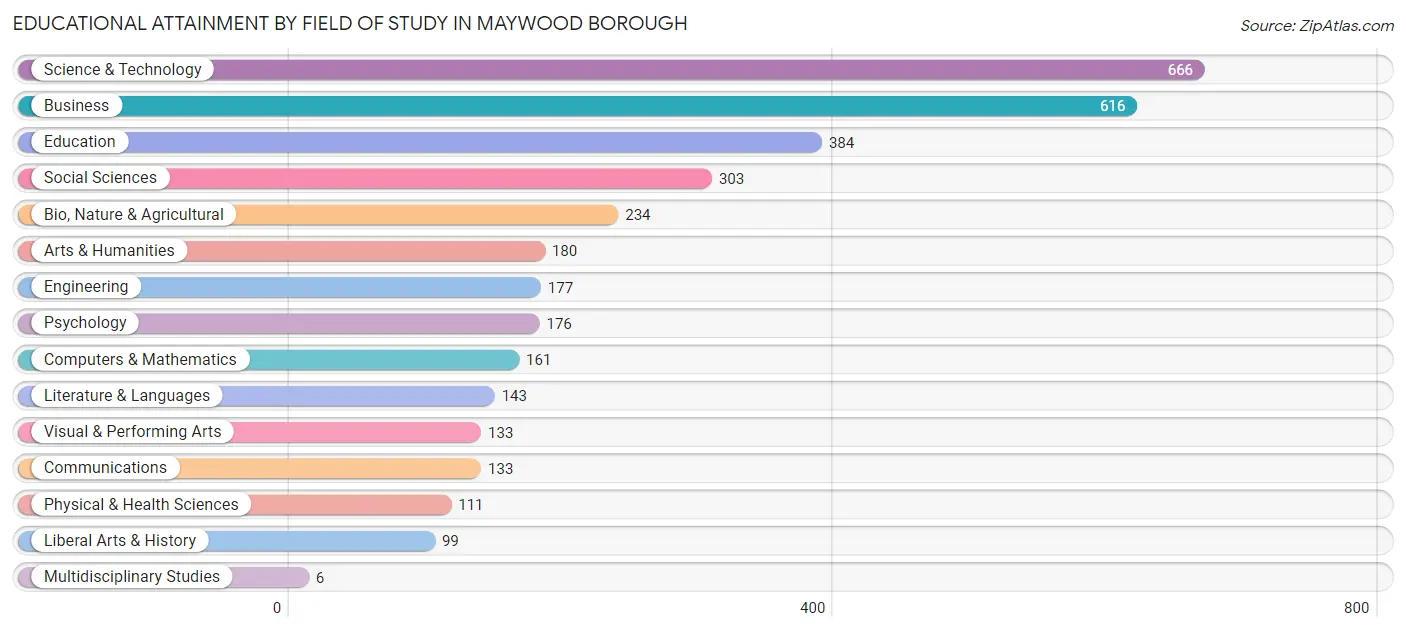
| Field of Study | # Graduates | % Graduates |
| Computers & Mathematics | 161 | 4.6% |
| Bio, Nature & Agricultural | 234 | 6.6% |
| Physical & Health Sciences | 111 | 3.2% |
| Psychology | 176 | 5.0% |
| Social Sciences | 303 | 8.6% |
| Engineering | 177 | 5.0% |
| Multidisciplinary Studies | 6 | 0.2% |
| Science & Technology | 666 | 18.9% |
| Business | 616 | 17.5% |
| Education | 384 | 10.9% |
| Literature & Languages | 143 | 4.1% |
| Liberal Arts & History | 99 | 2.8% |
| Visual & Performing Arts | 133 | 3.8% |
| Communications | 133 | 3.8% |
| Arts & Humanities | 180 | 5.1% |
| Total | 3,522 | 100.0% |
Transportation & Commute in Maywood borough
Vehicle Availability by Sex in Maywood borough
The most prevalent vehicle ownership categories in Maywood borough are males with 2 vehicles (1,114, accounting for 40.3%) and females with 2 vehicles (766, making up 50.4%).
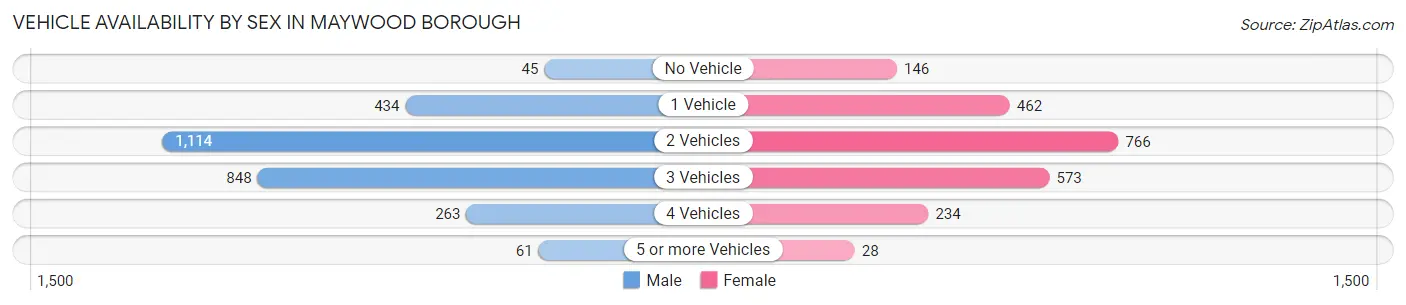
| Vehicles Available | Male | Female |
| No Vehicle | 45 (1.6%) | 146 (6.6%) |
| 1 Vehicle | 434 (15.7%) | 462 (20.9%) |
| 2 Vehicles | 1,114 (40.3%) | 766 (34.7%) |
| 3 Vehicles | 848 (30.7%) | 573 (25.9%) |
| 4 Vehicles | 263 (9.5%) | 234 (10.6%) |
| 5 or more Vehicles | 61 (2.2%) | 28 (1.3%) |
| Total | 2,765 (100.0%) | 2,209 (100.0%) |
Commute Time in Maywood borough
The most frequently occuring commute durations in Maywood borough are 10 to 14 minutes (848 commuters, 19.2%), 15 to 19 minutes (811 commuters, 18.4%), and 20 to 24 minutes (501 commuters, 11.3%).
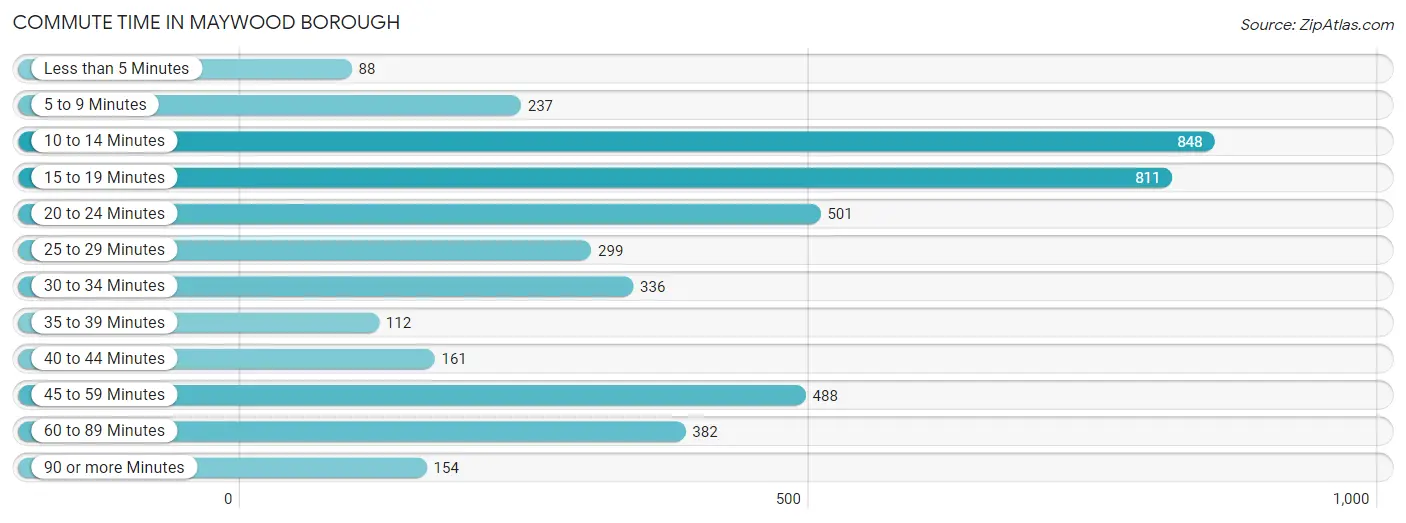
| Commute Time | # Commuters | % Commuters |
| Less than 5 Minutes | 88 | 2.0% |
| 5 to 9 Minutes | 237 | 5.4% |
| 10 to 14 Minutes | 848 | 19.2% |
| 15 to 19 Minutes | 811 | 18.4% |
| 20 to 24 Minutes | 501 | 11.3% |
| 25 to 29 Minutes | 299 | 6.8% |
| 30 to 34 Minutes | 336 | 7.6% |
| 35 to 39 Minutes | 112 | 2.5% |
| 40 to 44 Minutes | 161 | 3.6% |
| 45 to 59 Minutes | 488 | 11.1% |
| 60 to 89 Minutes | 382 | 8.6% |
| 90 or more Minutes | 154 | 3.5% |
Commute Time by Sex in Maywood borough
The most common commute times in Maywood borough are 10 to 14 minutes (554 commuters, 22.6%) for males and 15 to 19 minutes (381 commuters, 19.4%) for females.
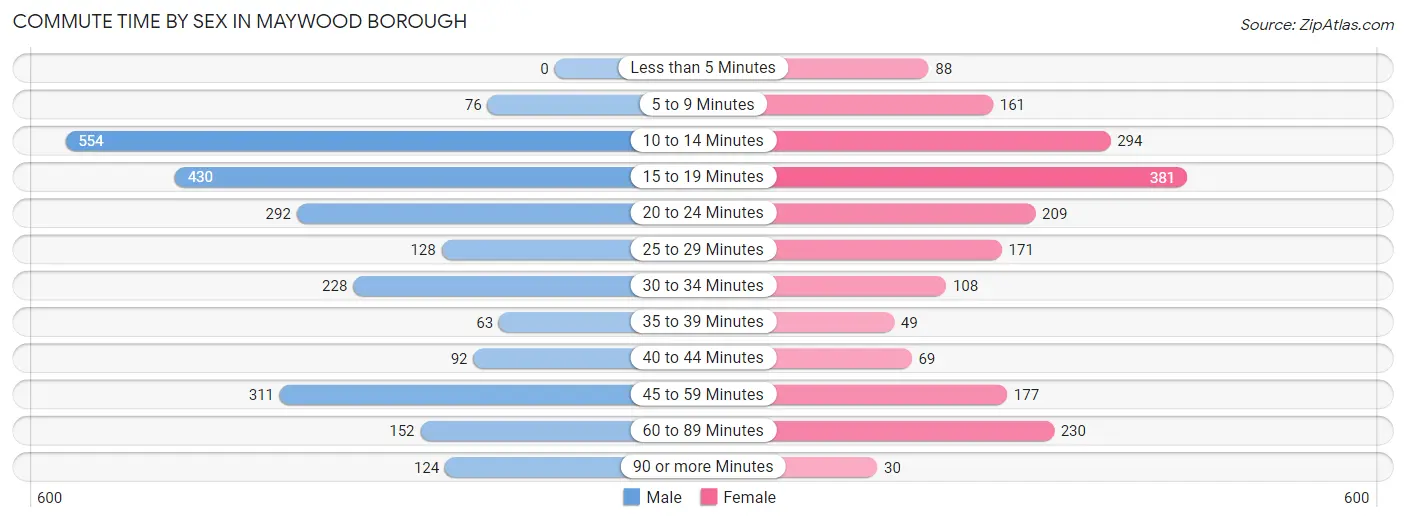
| Commute Time | Male | Female |
| Less than 5 Minutes | 0 (0.0%) | 88 (4.5%) |
| 5 to 9 Minutes | 76 (3.1%) | 161 (8.2%) |
| 10 to 14 Minutes | 554 (22.6%) | 294 (14.9%) |
| 15 to 19 Minutes | 430 (17.5%) | 381 (19.4%) |
| 20 to 24 Minutes | 292 (11.9%) | 209 (10.6%) |
| 25 to 29 Minutes | 128 (5.2%) | 171 (8.7%) |
| 30 to 34 Minutes | 228 (9.3%) | 108 (5.5%) |
| 35 to 39 Minutes | 63 (2.6%) | 49 (2.5%) |
| 40 to 44 Minutes | 92 (3.8%) | 69 (3.5%) |
| 45 to 59 Minutes | 311 (12.7%) | 177 (9.0%) |
| 60 to 89 Minutes | 152 (6.2%) | 230 (11.7%) |
| 90 or more Minutes | 124 (5.1%) | 30 (1.5%) |
Time of Departure to Work by Sex in Maywood borough
The most frequent times of departure to work in Maywood borough are 8:00 AM to 8:29 AM (361, 14.7%) for males and 8:00 AM to 8:29 AM (425, 21.6%) for females.
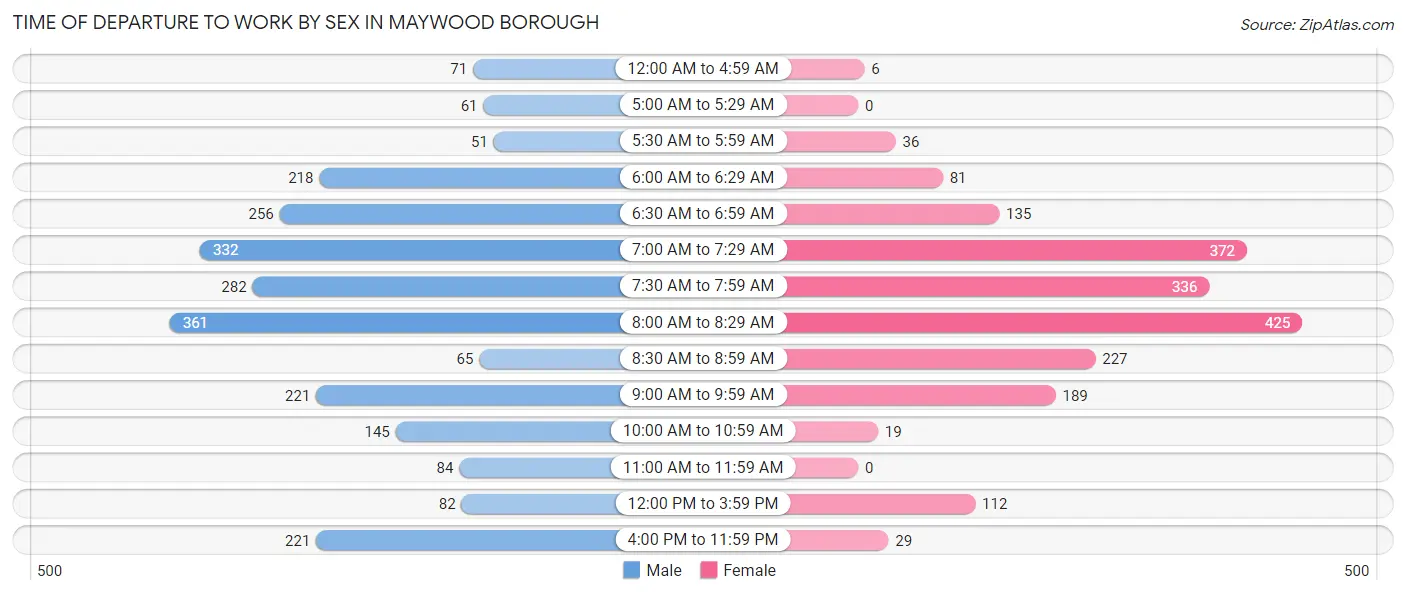
| Time of Departure | Male | Female |
| 12:00 AM to 4:59 AM | 71 (2.9%) | 6 (0.3%) |
| 5:00 AM to 5:29 AM | 61 (2.5%) | 0 (0.0%) |
| 5:30 AM to 5:59 AM | 51 (2.1%) | 36 (1.8%) |
| 6:00 AM to 6:29 AM | 218 (8.9%) | 81 (4.1%) |
| 6:30 AM to 6:59 AM | 256 (10.4%) | 135 (6.9%) |
| 7:00 AM to 7:29 AM | 332 (13.6%) | 372 (18.9%) |
| 7:30 AM to 7:59 AM | 282 (11.5%) | 336 (17.1%) |
| 8:00 AM to 8:29 AM | 361 (14.7%) | 425 (21.6%) |
| 8:30 AM to 8:59 AM | 65 (2.6%) | 227 (11.5%) |
| 9:00 AM to 9:59 AM | 221 (9.0%) | 189 (9.6%) |
| 10:00 AM to 10:59 AM | 145 (5.9%) | 19 (1.0%) |
| 11:00 AM to 11:59 AM | 84 (3.4%) | 0 (0.0%) |
| 12:00 PM to 3:59 PM | 82 (3.4%) | 112 (5.7%) |
| 4:00 PM to 11:59 PM | 221 (9.0%) | 29 (1.5%) |
| Total | 2,450 (100.0%) | 1,967 (100.0%) |
Housing Occupancy in Maywood borough
Occupancy by Ownership in Maywood borough
Of the total 3,702 dwellings in Maywood borough, owner-occupied units account for 2,593 (70.0%), while renter-occupied units make up 1,109 (30.0%).
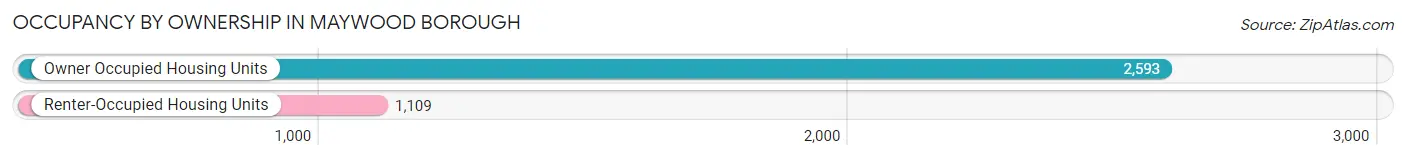
| Occupancy | # Housing Units | % Housing Units |
| Owner Occupied Housing Units | 2,593 | 70.0% |
| Renter-Occupied Housing Units | 1,109 | 30.0% |
| Total Occupied Housing Units | 3,702 | 100.0% |
Occupancy by Household Size in Maywood borough
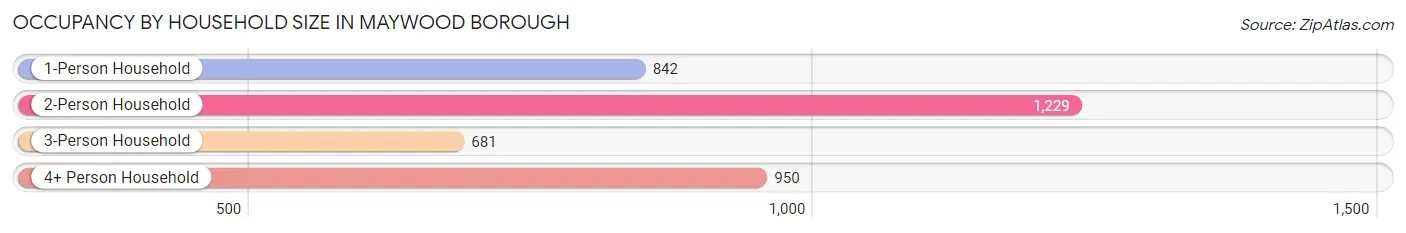
| Household Size | # Housing Units | % Housing Units |
| 1-Person Household | 842 | 22.7% |
| 2-Person Household | 1,229 | 33.2% |
| 3-Person Household | 681 | 18.4% |
| 4+ Person Household | 950 | 25.7% |
| Total Housing Units | 3,702 | 100.0% |
Occupancy by Ownership by Household Size in Maywood borough
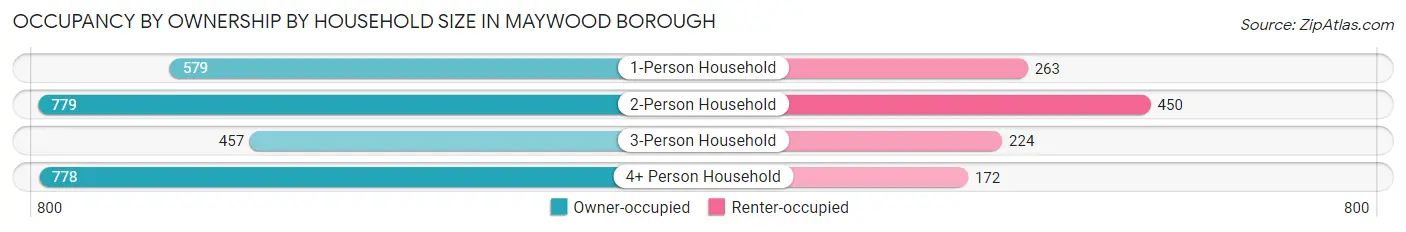
| Household Size | Owner-occupied | Renter-occupied |
| 1-Person Household | 579 (68.8%) | 263 (31.2%) |
| 2-Person Household | 779 (63.4%) | 450 (36.6%) |
| 3-Person Household | 457 (67.1%) | 224 (32.9%) |
| 4+ Person Household | 778 (81.9%) | 172 (18.1%) |
| Total Housing Units | 2,593 (70.0%) | 1,109 (30.0%) |
Occupancy by Educational Attainment in Maywood borough
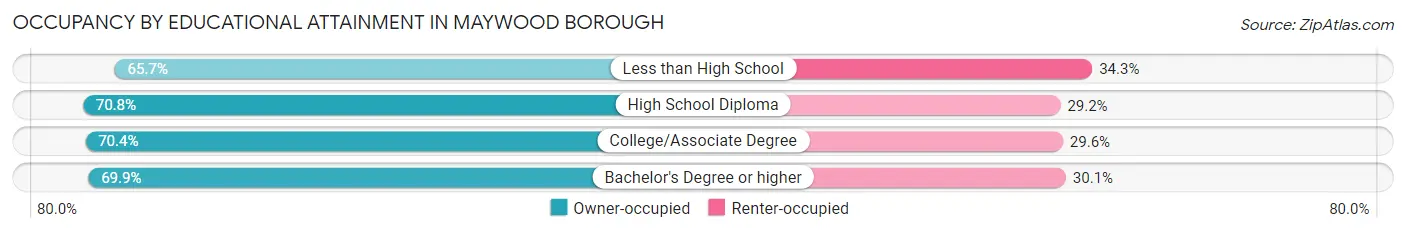
| Household Size | Owner-occupied | Renter-occupied |
| Less than High School | 117 (65.7%) | 61 (34.3%) |
| High School Diploma | 586 (70.8%) | 242 (29.2%) |
| College/Associate Degree | 770 (70.4%) | 324 (29.6%) |
| Bachelor's Degree or higher | 1,120 (69.9%) | 482 (30.1%) |
Occupancy by Age of Householder in Maywood borough
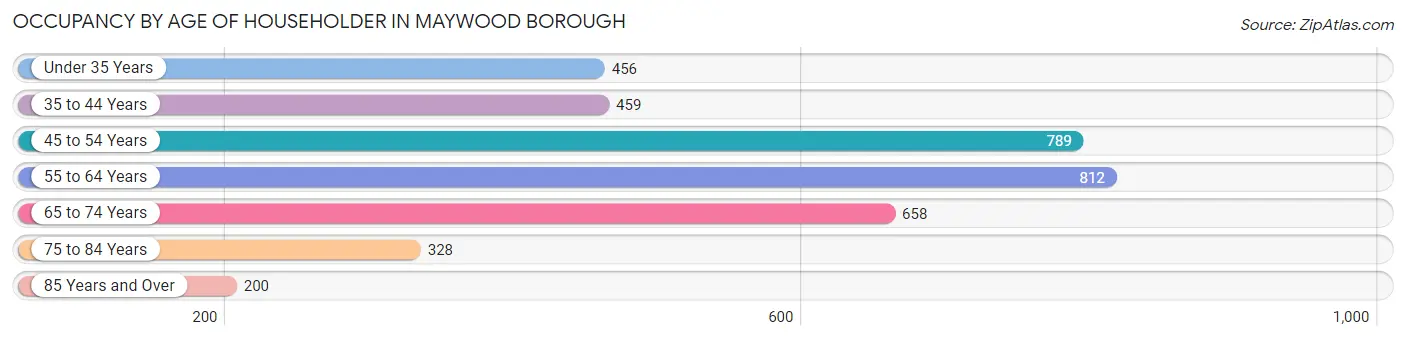
| Age Bracket | # Households | % Households |
| Under 35 Years | 456 | 12.3% |
| 35 to 44 Years | 459 | 12.4% |
| 45 to 54 Years | 789 | 21.3% |
| 55 to 64 Years | 812 | 21.9% |
| 65 to 74 Years | 658 | 17.8% |
| 75 to 84 Years | 328 | 8.9% |
| 85 Years and Over | 200 | 5.4% |
| Total | 3,702 | 100.0% |
Housing Finances in Maywood borough
Median Income by Occupancy in Maywood borough
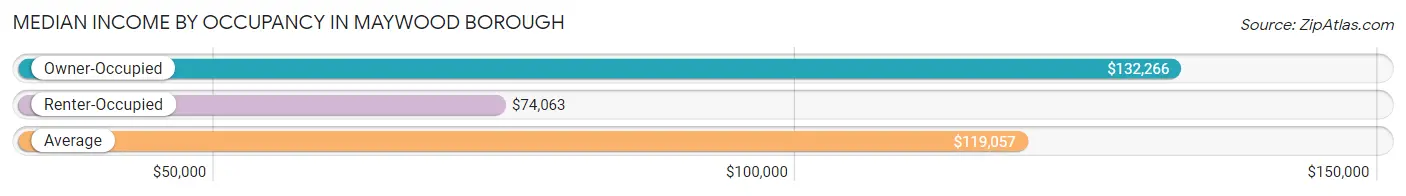
| Occupancy Type | # Households | Median Income |
| Owner-Occupied | 2,593 (70.0%) | $132,266 |
| Renter-Occupied | 1,109 (30.0%) | $74,063 |
| Average | 3,702 (100.0%) | $119,057 |
Occupancy by Householder Income Bracket in Maywood borough
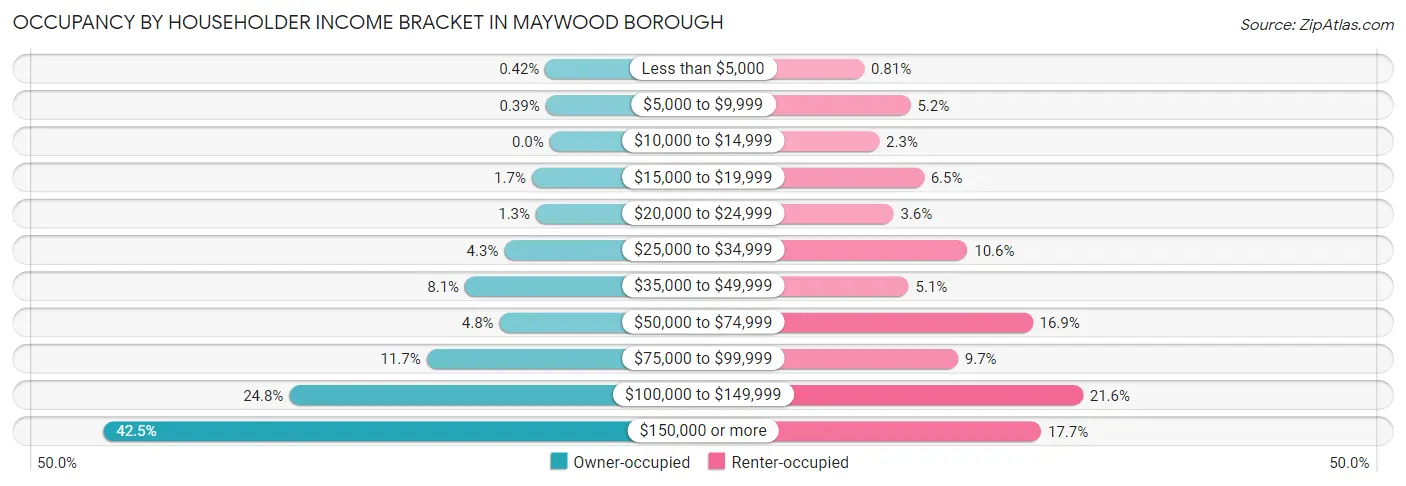
| Income Bracket | Owner-occupied | Renter-occupied |
| Less than $5,000 | 11 (0.4%) | 9 (0.8%) |
| $5,000 to $9,999 | 10 (0.4%) | 58 (5.2%) |
| $10,000 to $14,999 | 0 (0.0%) | 25 (2.2%) |
| $15,000 to $19,999 | 44 (1.7%) | 72 (6.5%) |
| $20,000 to $24,999 | 34 (1.3%) | 40 (3.6%) |
| $25,000 to $34,999 | 112 (4.3%) | 118 (10.6%) |
| $35,000 to $49,999 | 209 (8.1%) | 56 (5.1%) |
| $50,000 to $74,999 | 124 (4.8%) | 187 (16.9%) |
| $75,000 to $99,999 | 304 (11.7%) | 108 (9.7%) |
| $100,000 to $149,999 | 643 (24.8%) | 240 (21.6%) |
| $150,000 or more | 1,102 (42.5%) | 196 (17.7%) |
| Total | 2,593 (100.0%) | 1,109 (100.0%) |
Monthly Housing Cost Tiers in Maywood borough
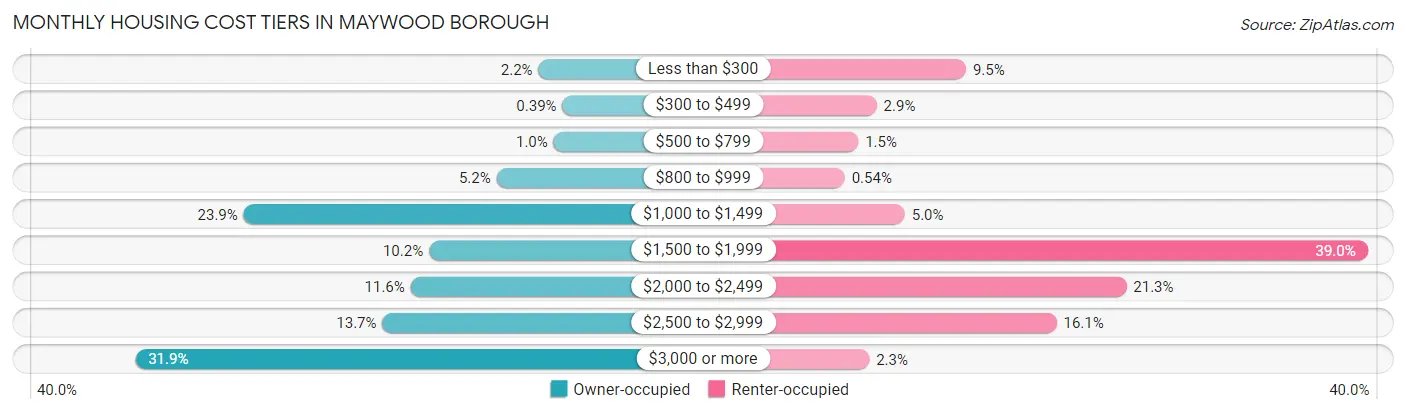
| Monthly Cost | Owner-occupied | Renter-occupied |
| Less than $300 | 56 (2.2%) | 105 (9.5%) |
| $300 to $499 | 10 (0.4%) | 32 (2.9%) |
| $500 to $799 | 27 (1.0%) | 17 (1.5%) |
| $800 to $999 | 136 (5.2%) | 6 (0.5%) |
| $1,000 to $1,499 | 619 (23.9%) | 55 (5.0%) |
| $1,500 to $1,999 | 265 (10.2%) | 433 (39.0%) |
| $2,000 to $2,499 | 300 (11.6%) | 236 (21.3%) |
| $2,500 to $2,999 | 354 (13.7%) | 179 (16.1%) |
| $3,000 or more | 826 (31.9%) | 26 (2.3%) |
| Total | 2,593 (100.0%) | 1,109 (100.0%) |
Physical Housing Characteristics in Maywood borough
Housing Structures in Maywood borough
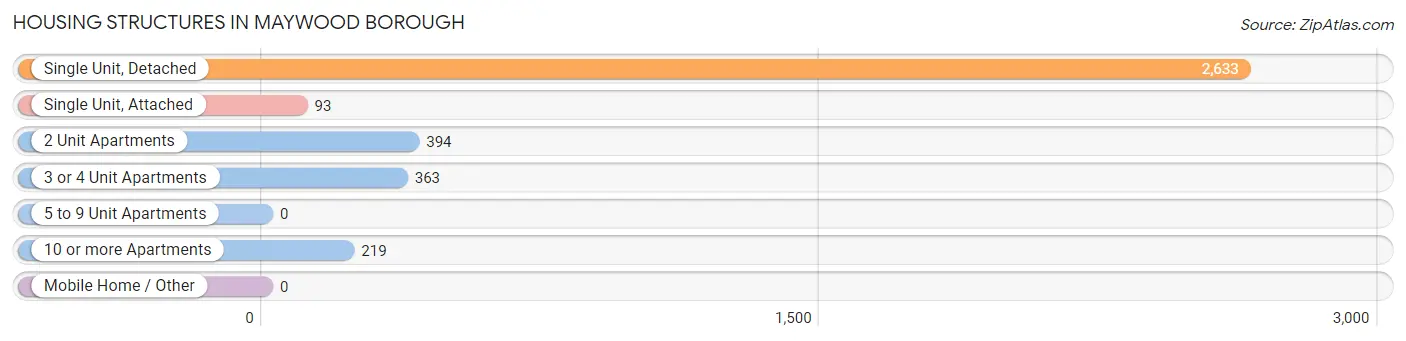
| Structure Type | # Housing Units | % Housing Units |
| Single Unit, Detached | 2,633 | 71.1% |
| Single Unit, Attached | 93 | 2.5% |
| 2 Unit Apartments | 394 | 10.6% |
| 3 or 4 Unit Apartments | 363 | 9.8% |
| 5 to 9 Unit Apartments | 0 | 0.0% |
| 10 or more Apartments | 219 | 5.9% |
| Mobile Home / Other | 0 | 0.0% |
| Total | 3,702 | 100.0% |
Housing Structures by Occupancy in Maywood borough
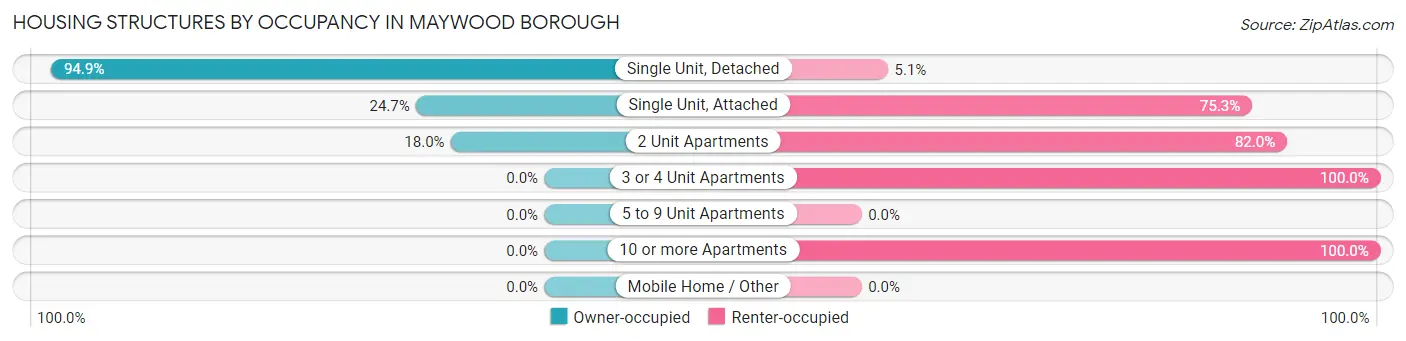
| Structure Type | Owner-occupied | Renter-occupied |
| Single Unit, Detached | 2,499 (94.9%) | 134 (5.1%) |
| Single Unit, Attached | 23 (24.7%) | 70 (75.3%) |
| 2 Unit Apartments | 71 (18.0%) | 323 (82.0%) |
| 3 or 4 Unit Apartments | 0 (0.0%) | 363 (100.0%) |
| 5 to 9 Unit Apartments | 0 (0.0%) | 0 (0.0%) |
| 10 or more Apartments | 0 (0.0%) | 219 (100.0%) |
| Mobile Home / Other | 0 (0.0%) | 0 (0.0%) |
| Total | 2,593 (70.0%) | 1,109 (30.0%) |
Housing Structures by Number of Rooms in Maywood borough
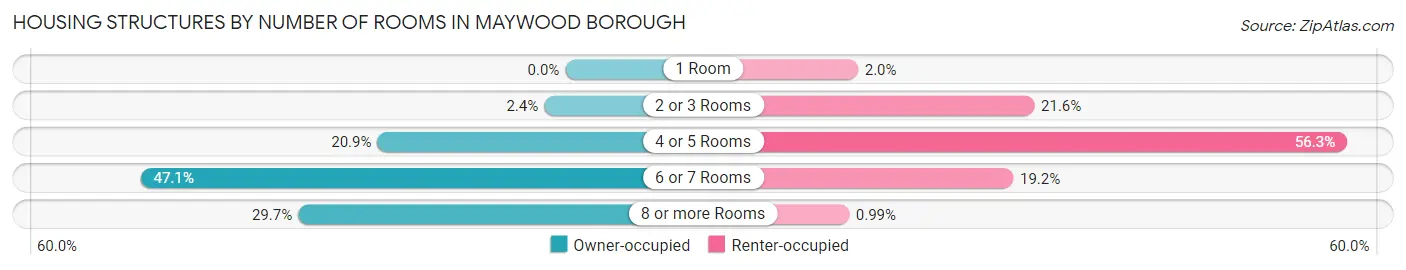
| Number of Rooms | Owner-occupied | Renter-occupied |
| 1 Room | 0 (0.0%) | 22 (2.0%) |
| 2 or 3 Rooms | 61 (2.4%) | 239 (21.5%) |
| 4 or 5 Rooms | 541 (20.9%) | 624 (56.3%) |
| 6 or 7 Rooms | 1,222 (47.1%) | 213 (19.2%) |
| 8 or more Rooms | 769 (29.7%) | 11 (1.0%) |
| Total | 2,593 (100.0%) | 1,109 (100.0%) |
Housing Structure by Heating Type in Maywood borough
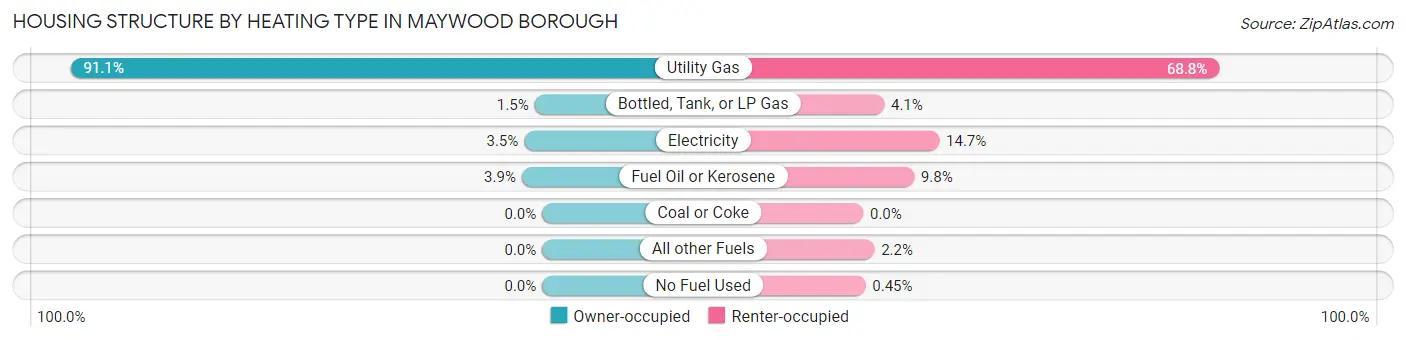
| Heating Type | Owner-occupied | Renter-occupied |
| Utility Gas | 2,363 (91.1%) | 763 (68.8%) |
| Bottled, Tank, or LP Gas | 38 (1.5%) | 45 (4.1%) |
| Electricity | 90 (3.5%) | 163 (14.7%) |
| Fuel Oil or Kerosene | 102 (3.9%) | 109 (9.8%) |
| Coal or Coke | 0 (0.0%) | 0 (0.0%) |
| All other Fuels | 0 (0.0%) | 24 (2.2%) |
| No Fuel Used | 0 (0.0%) | 5 (0.4%) |
| Total | 2,593 (100.0%) | 1,109 (100.0%) |
Household Vehicle Usage in Maywood borough
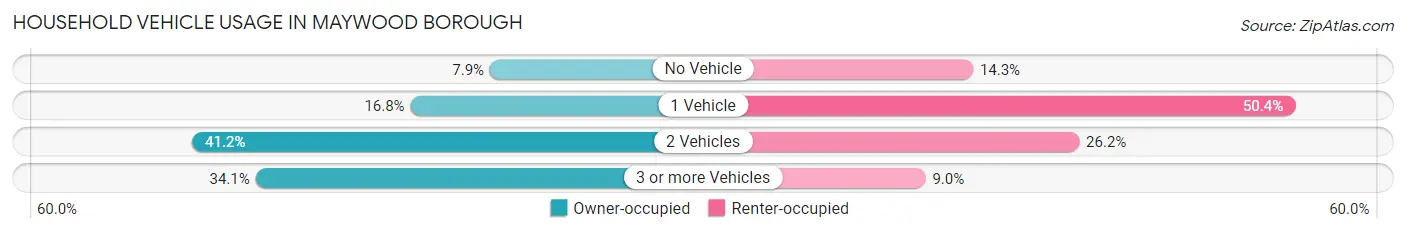
| Vehicles per Household | Owner-occupied | Renter-occupied |
| No Vehicle | 204 (7.9%) | 159 (14.3%) |
| 1 Vehicle | 435 (16.8%) | 559 (50.4%) |
| 2 Vehicles | 1,069 (41.2%) | 291 (26.2%) |
| 3 or more Vehicles | 885 (34.1%) | 100 (9.0%) |
| Total | 2,593 (100.0%) | 1,109 (100.0%) |
Real Estate & Mortgages in Maywood borough
Real Estate and Mortgage Overview in Maywood borough
| Characteristic | Without Mortgage | With Mortgage |
| Housing Units | 1,001 | 1,592 |
| Median Property Value | $449,800 | $480,000 |
| Median Household Income | $110,250 | $841 |
| Monthly Housing Costs | $1,195 | $826 |
| Real Estate Taxes | $10,001 | $6 |
Property Value by Mortgage Status in Maywood borough
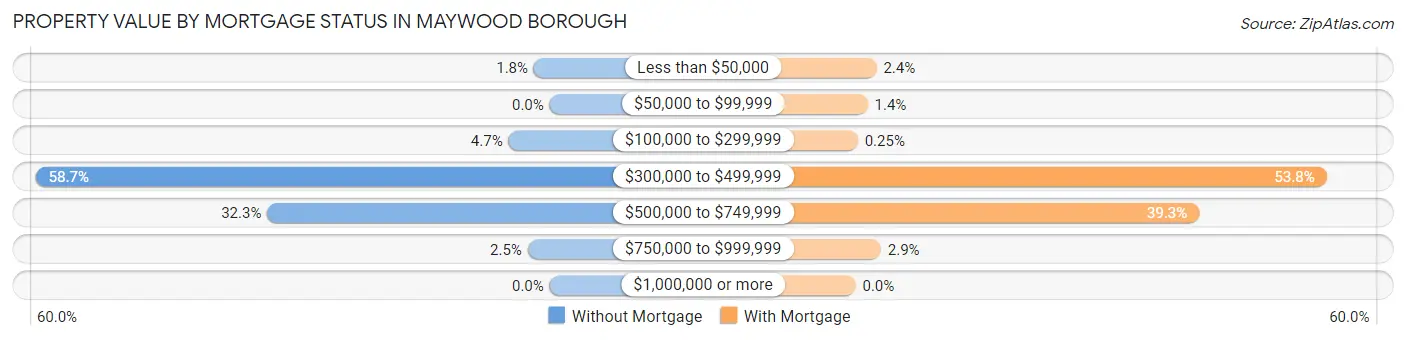
| Property Value | Without Mortgage | With Mortgage |
| Less than $50,000 | 18 (1.8%) | 38 (2.4%) |
| $50,000 to $99,999 | 0 (0.0%) | 22 (1.4%) |
| $100,000 to $299,999 | 47 (4.7%) | 4 (0.3%) |
| $300,000 to $499,999 | 588 (58.7%) | 857 (53.8%) |
| $500,000 to $749,999 | 323 (32.3%) | 625 (39.3%) |
| $750,000 to $999,999 | 25 (2.5%) | 46 (2.9%) |
| $1,000,000 or more | 0 (0.0%) | 0 (0.0%) |
| Total | 1,001 (100.0%) | 1,592 (100.0%) |
Household Income by Mortgage Status in Maywood borough
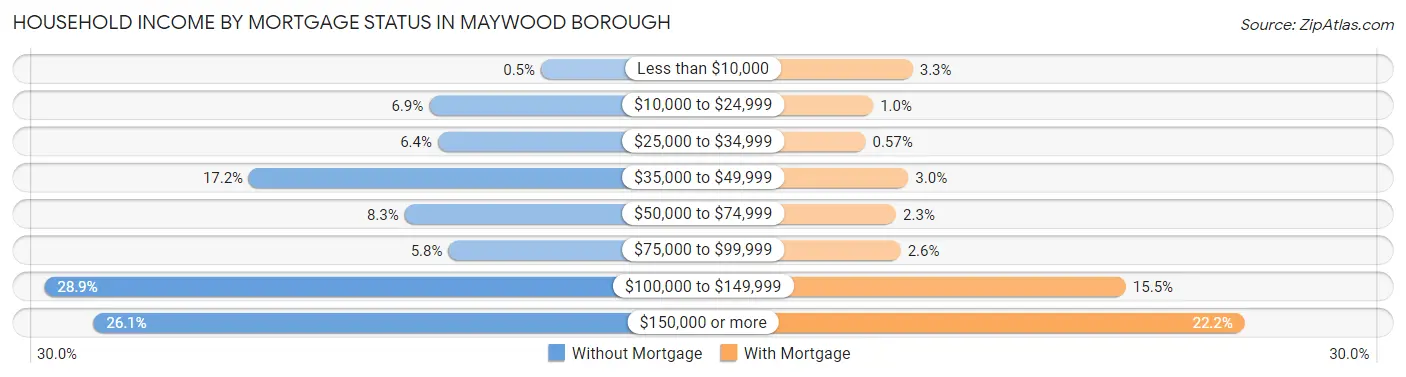
| Household Income | Without Mortgage | With Mortgage |
| Less than $10,000 | 5 (0.5%) | 52 (3.3%) |
| $10,000 to $24,999 | 69 (6.9%) | 16 (1.0%) |
| $25,000 to $34,999 | 64 (6.4%) | 9 (0.6%) |
| $35,000 to $49,999 | 172 (17.2%) | 48 (3.0%) |
| $50,000 to $74,999 | 83 (8.3%) | 37 (2.3%) |
| $75,000 to $99,999 | 58 (5.8%) | 41 (2.6%) |
| $100,000 to $149,999 | 289 (28.9%) | 246 (15.4%) |
| $150,000 or more | 261 (26.1%) | 354 (22.2%) |
| Total | 1,001 (100.0%) | 1,592 (100.0%) |
Property Value to Household Income Ratio in Maywood borough
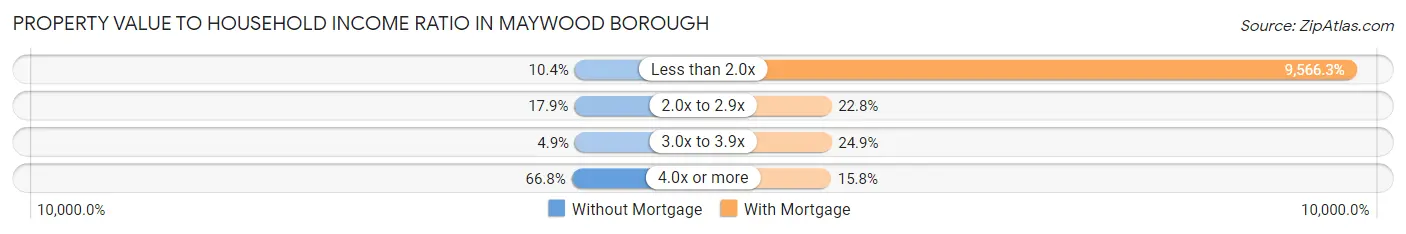
| Value-to-Income Ratio | Without Mortgage | With Mortgage |
| Less than 2.0x | 104 (10.4%) | 152,296 (9,566.3%) |
| 2.0x to 2.9x | 179 (17.9%) | 363 (22.8%) |
| 3.0x to 3.9x | 49 (4.9%) | 396 (24.9%) |
| 4.0x or more | 669 (66.8%) | 252 (15.8%) |
| Total | 1,001 (100.0%) | 1,592 (100.0%) |
Real Estate Taxes by Mortgage Status in Maywood borough
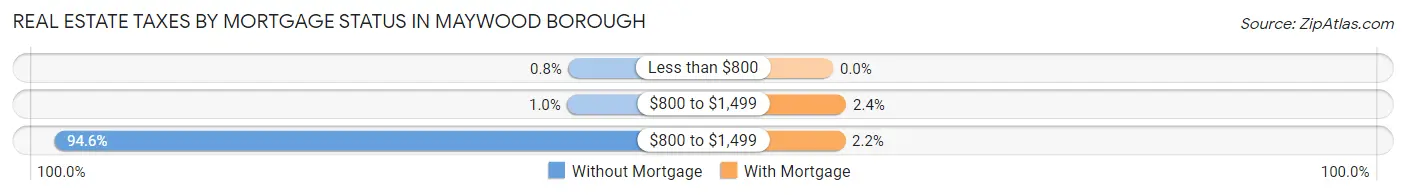
| Property Taxes | Without Mortgage | With Mortgage |
| Less than $800 | 8 (0.8%) | 0 (0.0%) |
| $800 to $1,499 | 10 (1.0%) | 38 (2.4%) |
| $800 to $1,499 | 947 (94.6%) | 35 (2.2%) |
| Total | 1,001 (100.0%) | 1,592 (100.0%) |
Health & Disability in Maywood borough
Health Insurance Coverage by Age in Maywood borough
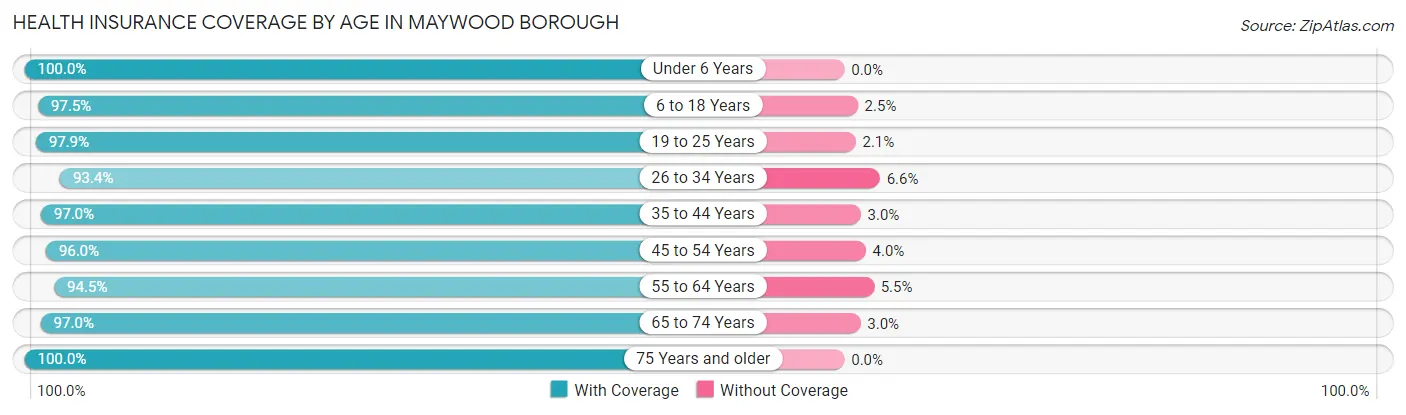
| Age Bracket | With Coverage | Without Coverage |
| Under 6 Years | 553 (100.0%) | 0 (0.0%) |
| 6 to 18 Years | 1,293 (97.5%) | 33 (2.5%) |
| 19 to 25 Years | 791 (97.9%) | 17 (2.1%) |
| 26 to 34 Years | 1,243 (93.4%) | 88 (6.6%) |
| 35 to 44 Years | 1,019 (97.0%) | 32 (3.0%) |
| 45 to 54 Years | 1,355 (96.0%) | 56 (4.0%) |
| 55 to 64 Years | 1,359 (94.5%) | 79 (5.5%) |
| 65 to 74 Years | 1,235 (97.0%) | 38 (3.0%) |
| 75 Years and older | 830 (100.0%) | 0 (0.0%) |
| Total | 9,678 (96.6%) | 343 (3.4%) |
Health Insurance Coverage by Citizenship Status in Maywood borough
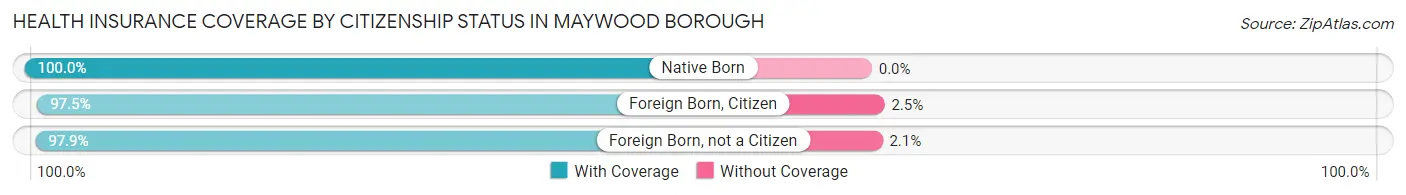
| Citizenship Status | With Coverage | Without Coverage |
| Native Born | 553 (100.0%) | 0 (0.0%) |
| Foreign Born, Citizen | 1,293 (97.5%) | 33 (2.5%) |
| Foreign Born, not a Citizen | 791 (97.9%) | 17 (2.1%) |
Health Insurance Coverage by Household Income in Maywood borough
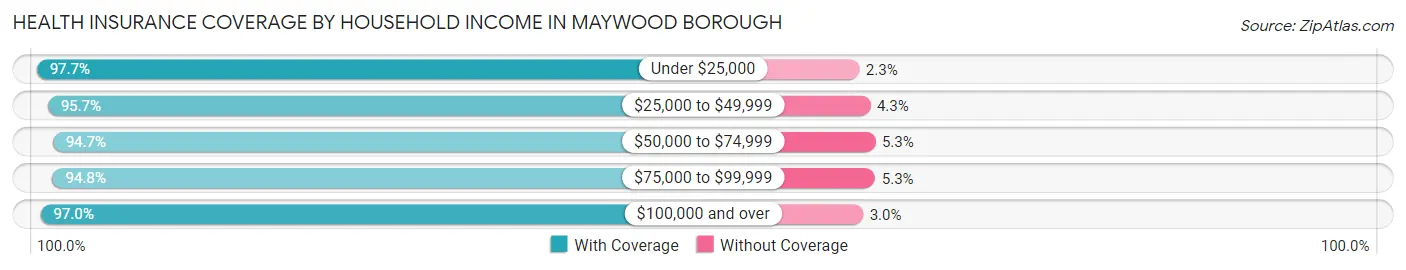
| Household Income | With Coverage | Without Coverage |
| Under $25,000 | 388 (97.7%) | 9 (2.3%) |
| $25,000 to $49,999 | 860 (95.7%) | 39 (4.3%) |
| $50,000 to $74,999 | 629 (94.7%) | 35 (5.3%) |
| $75,000 to $99,999 | 776 (94.8%) | 43 (5.2%) |
| $100,000 and over | 7,007 (97.0%) | 215 (3.0%) |
Public vs Private Health Insurance Coverage by Age in Maywood borough
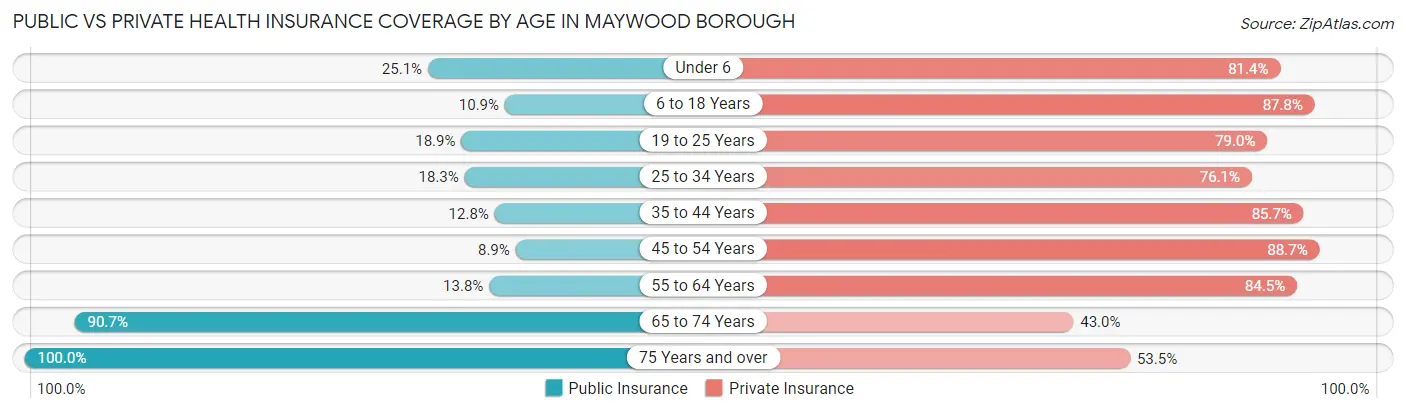
| Age Bracket | Public Insurance | Private Insurance |
| Under 6 | 139 (25.1%) | 450 (81.4%) |
| 6 to 18 Years | 144 (10.9%) | 1,164 (87.8%) |
| 19 to 25 Years | 153 (18.9%) | 638 (79.0%) |
| 25 to 34 Years | 244 (18.3%) | 1,013 (76.1%) |
| 35 to 44 Years | 134 (12.8%) | 901 (85.7%) |
| 45 to 54 Years | 125 (8.9%) | 1,251 (88.7%) |
| 55 to 64 Years | 198 (13.8%) | 1,215 (84.5%) |
| 65 to 74 Years | 1,155 (90.7%) | 547 (43.0%) |
| 75 Years and over | 830 (100.0%) | 444 (53.5%) |
| Total | 3,122 (31.1%) | 7,623 (76.1%) |
Disability Status by Sex by Age in Maywood borough
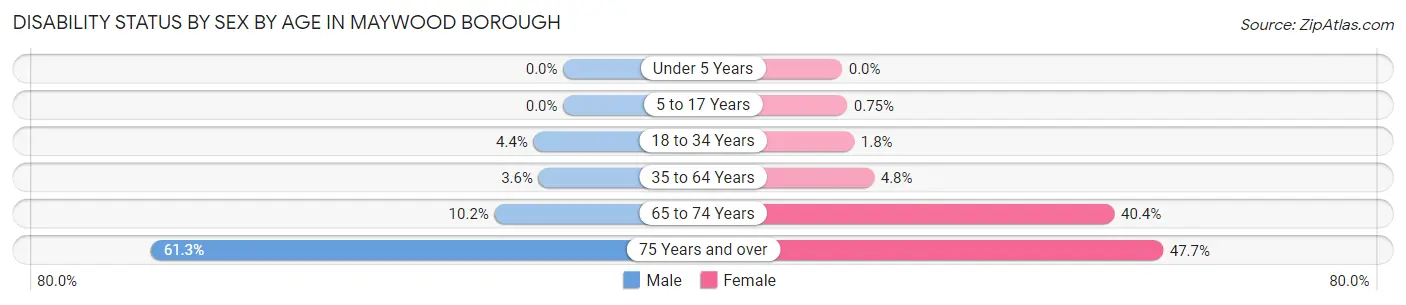
| Age Bracket | Male | Female |
| Under 5 Years | 0 (0.0%) | 0 (0.0%) |
| 5 to 17 Years | 0 (0.0%) | 5 (0.7%) |
| 18 to 34 Years | 56 (4.4%) | 18 (1.8%) |
| 35 to 64 Years | 73 (3.6%) | 90 (4.8%) |
| 65 to 74 Years | 60 (10.2%) | 277 (40.4%) |
| 75 Years and over | 245 (61.3%) | 205 (47.7%) |
Disability Class by Sex by Age in Maywood borough
Disability Class: Hearing Difficulty
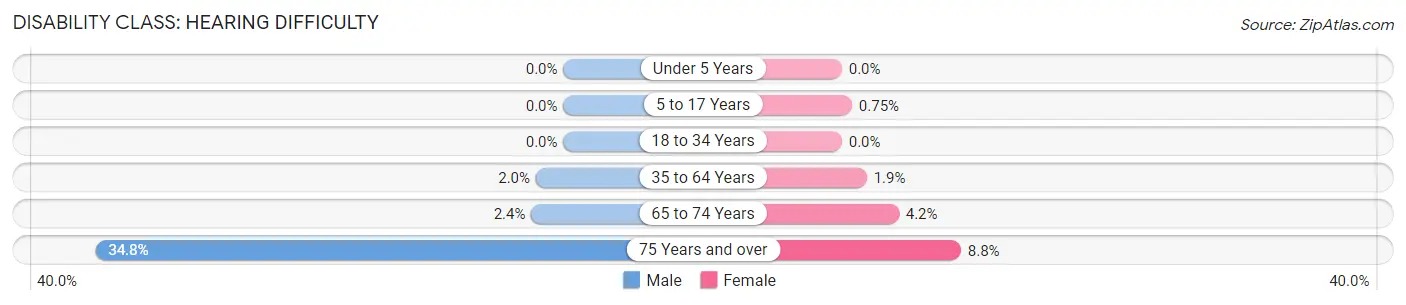
| Age Bracket | Male | Female |
| Under 5 Years | 0 (0.0%) | 0 (0.0%) |
| 5 to 17 Years | 0 (0.0%) | 5 (0.7%) |
| 18 to 34 Years | 0 (0.0%) | 0 (0.0%) |
| 35 to 64 Years | 41 (2.0%) | 35 (1.8%) |
| 65 to 74 Years | 14 (2.4%) | 29 (4.2%) |
| 75 Years and over | 139 (34.7%) | 38 (8.8%) |
Disability Class: Vision Difficulty
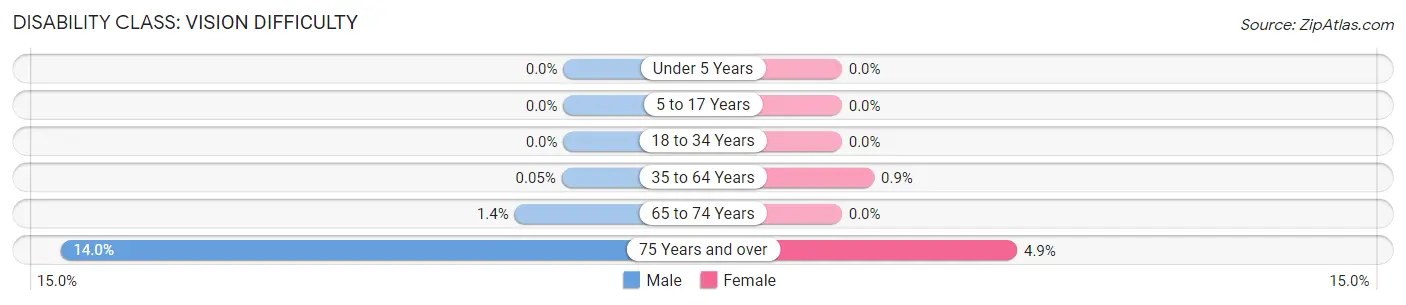
| Age Bracket | Male | Female |
| Under 5 Years | 0 (0.0%) | 0 (0.0%) |
| 5 to 17 Years | 0 (0.0%) | 0 (0.0%) |
| 18 to 34 Years | 0 (0.0%) | 0 (0.0%) |
| 35 to 64 Years | 1 (0.1%) | 17 (0.9%) |
| 65 to 74 Years | 8 (1.4%) | 0 (0.0%) |
| 75 Years and over | 56 (14.0%) | 21 (4.9%) |
Disability Class: Cognitive Difficulty
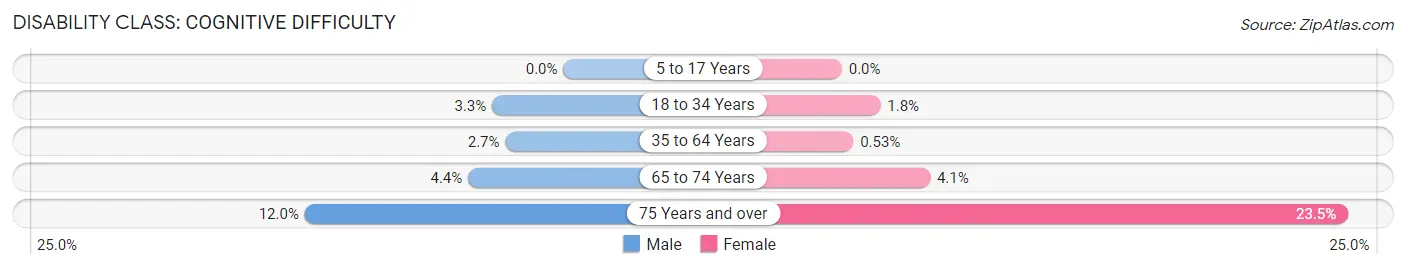
| Age Bracket | Male | Female |
| 5 to 17 Years | 0 (0.0%) | 0 (0.0%) |
| 18 to 34 Years | 42 (3.3%) | 18 (1.8%) |
| 35 to 64 Years | 54 (2.7%) | 10 (0.5%) |
| 65 to 74 Years | 26 (4.4%) | 28 (4.1%) |
| 75 Years and over | 48 (12.0%) | 101 (23.5%) |
Disability Class: Ambulatory Difficulty
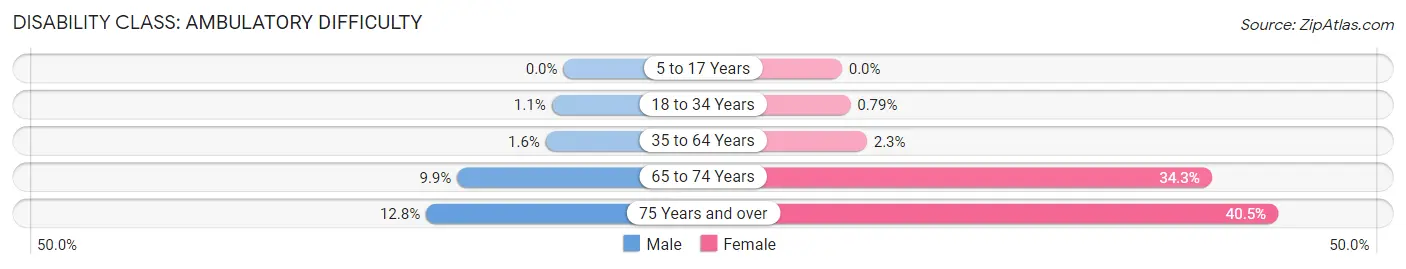
| Age Bracket | Male | Female |
| 5 to 17 Years | 0 (0.0%) | 0 (0.0%) |
| 18 to 34 Years | 14 (1.1%) | 8 (0.8%) |
| 35 to 64 Years | 33 (1.6%) | 44 (2.3%) |
| 65 to 74 Years | 58 (9.9%) | 235 (34.3%) |
| 75 Years and over | 51 (12.8%) | 174 (40.5%) |
Disability Class: Self-Care Difficulty
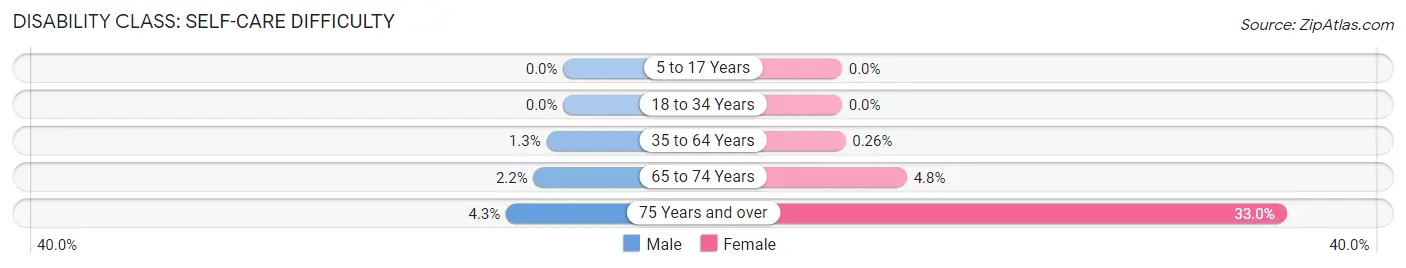
| Age Bracket | Male | Female |
| 5 to 17 Years | 0 (0.0%) | 0 (0.0%) |
| 18 to 34 Years | 0 (0.0%) | 0 (0.0%) |
| 35 to 64 Years | 25 (1.3%) | 5 (0.3%) |
| 65 to 74 Years | 13 (2.2%) | 33 (4.8%) |
| 75 Years and over | 17 (4.3%) | 142 (33.0%) |
Technology Access in Maywood borough
Computing Device Access in Maywood borough
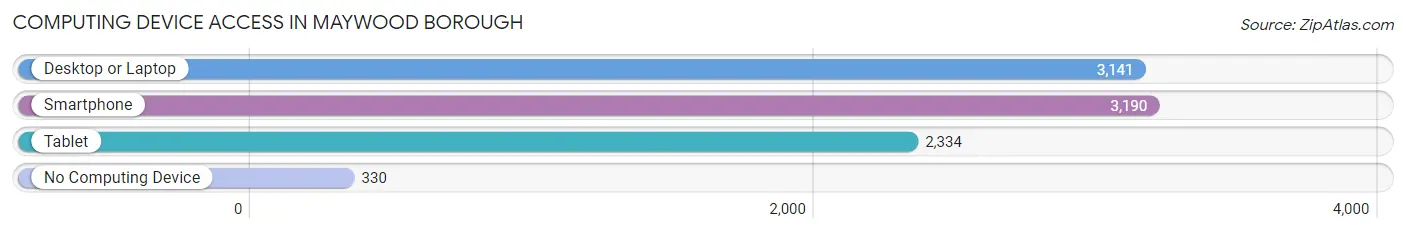
| Device Type | # Households | % Households |
| Desktop or Laptop | 3,141 | 84.9% |
| Smartphone | 3,190 | 86.2% |
| Tablet | 2,334 | 63.0% |
| No Computing Device | 330 | 8.9% |
| Total | 3,702 | 100.0% |
Internet Access in Maywood borough
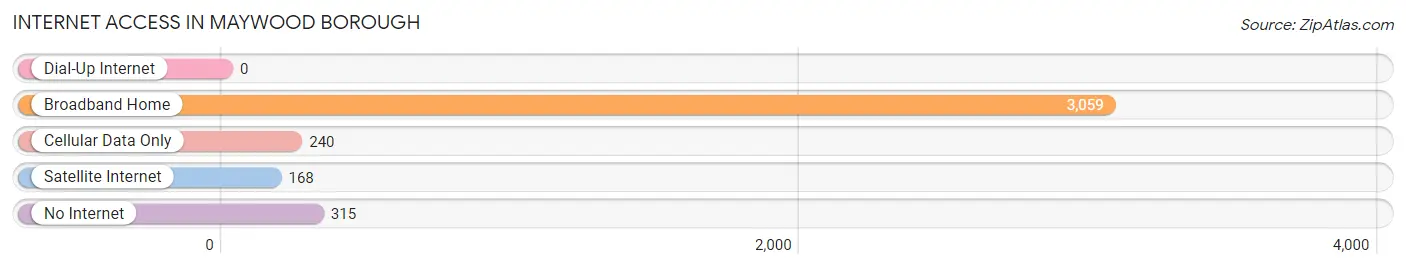
| Internet Type | # Households | % Households |
| Dial-Up Internet | 0 | 0.0% |
| Broadband Home | 3,059 | 82.6% |
| Cellular Data Only | 240 | 6.5% |
| Satellite Internet | 168 | 4.5% |
| No Internet | 315 | 8.5% |
| Total | 3,702 | 100.0% |
Maywood borough Summary
Maywood Borough is a small borough located in Bergen County, New Jersey. It is situated in the northeastern part of the state, just west of the Hudson River and north of the Hackensack River. The borough is bordered by the towns of Rochelle Park, Paramus, Hackensack, and Lodi. As of the 2010 United States Census, the borough had a total population of 9,555.
History
The area that is now Maywood was originally inhabited by the Lenni Lenape Native Americans. The first European settlers arrived in the area in the late 17th century. The area was part of the English Province of New Jersey and was known as the English Neighborhood. In 1710, the area was officially incorporated as the Borough of Maywood. The name was chosen to honor the May family, who were among the first settlers in the area.
The borough was originally an agricultural community, with many farms and orchards. In the late 19th century, the area began to develop into a residential community. The borough was connected to the rest of the state by the Hackensack and Passaic Railroad in 1872. The railroad allowed for the development of the borough's commercial district, which included a variety of stores and businesses.
In the early 20th century, the borough experienced a period of rapid growth. The population increased from 1,000 in 1900 to over 10,000 by the 1950s. The borough was also home to a variety of industries, including a paper mill, a brickyard, and a steel mill.
Geography
Maywood is located at 40°53'N 74°04'W (40.88, -74.07). According to the United States Census Bureau, the borough has a total area of 2.2 square miles (5.7 km2), all of which is land.
The borough is located in the Hackensack River watershed. The borough is bordered by the towns of Rochelle Park, Paramus, Hackensack, and Lodi. The borough is located approximately 10 miles (16 km) northwest of Newark and 25 miles (40 km) northwest of New York City.
Economy
Maywood is a primarily residential community, with a small commercial district. The borough is home to a variety of businesses, including restaurants, retail stores, and professional services. The borough is also home to a number of industrial businesses, including a paper mill, a brickyard, and a steel mill.
Demographics
As of the 2010 United States Census, there were 9,555 people, 3,717 households, and 2,541 families residing in the borough. The population density was 4,323.3 people per square mile (1,668.2/km2). There were 3,919 housing units at an average density of 1,764.2 per square mile (683.2/km2). The racial makeup of the borough was 79.2% White, 5.2% African American, 0.2% Native American, 8.7% Asian, 0.1% Pacific Islander, 4.2% from other races, and 2.6% from two or more races. Hispanic or Latino of any race were 14.3% of the population.
There were 3,717 households, out of which 28.7% had children under the age of 18 living with them, 53.2% were married couples living together, 11.2% had a female householder with no husband present, and 30.7% were non-families. 25.2% of all households were made up of individuals, and 11.2% had someone living alone who was 65 years of age or older. The average household size was 2.56 and the average family size was 3.09.
In the borough, the population was spread out, with 21.2% under the age of 18, 7.2% from 18 to 24, 28.2% from 25 to 44, 27.2% from 45 to 64, and 16.2% who were 65 years of age or older. The median age was 40 years. For every 100 females, there were 93.2 males. For every 100 females age 18 and over, there were 90.2 males.
The median income for a household in the borough was $62,813, and the median income for a family was $76,923. Males had a median income of $51,945 versus $41,813 for females. The per capita income for the borough was $30,945. About 4.2% of families and 5.7% of the population were below the poverty line, including 6.7% of those under age 18 and 6.2% of those age 65 or over.
Common Questions
What is the Total Population of Maywood borough?
Total Population of Maywood borough is 10,040.
What is the Total Male Population of Maywood borough?
Total Male Population of Maywood borough is 5,030.
What is the Total Female Population of Maywood borough?
Total Female Population of Maywood borough is 5,010.
What is the Ratio of Males per 100 Females in Maywood borough?
There are 100.40 Males per 100 Females in Maywood borough.
What is the Ratio of Females per 100 Males in Maywood borough?
There are 99.60 Females per 100 Males in Maywood borough.
What is the Median Population Age in Maywood borough?
Median Population Age in Maywood borough is 44.7 Years.
What is the Average Family Size in Maywood borough
Average Family Size in Maywood borough is 3.3 People.
What is the Average Household Size in Maywood borough
Average Household Size in Maywood borough is 2.7 People.
What is Per Capita Income in Maywood borough?
Per Capita income in Maywood borough is $49,808.
What is the Median Family Income in Maywood borough?
Median Family Income in Maywood borough is $137,905.
What is the Median Household income in Maywood borough?
Median Household Income in Maywood borough is $119,057.
What is Income or Wage Gap in Maywood borough?
Income or Wage Gap in Maywood borough is 3.9%.
Women in Maywood borough earn 96.1 cents for every dollar earned by a man.
What is Family Income Deficit in Maywood borough?
Family Income Deficit in Maywood borough is $4,893.
Families that are below poverty line in Maywood borough earn $4,893 less on average than the poverty threshold level.
What is Inequality or Gini Index in Maywood borough?
Inequality or Gini Index in Maywood borough is 0.38.
How Large is the Labor Force in Maywood borough?
There are 5,566 People in the Labor Forcein in Maywood borough.
What is the Percentage of People in the Labor Force in Maywood borough?
65.5% of People are in the Labor Force in Maywood borough.
What is the Unemployment Rate in Maywood borough?
Unemployment Rate in Maywood borough is 8.0%.