Highland Park borough, NJ
Highland Park borough Overview
14,996
TOTAL POPULATION
7,291
MALE POPULATION
7,705
FEMALE POPULATION
94.63
MALES / 100 FEMALES
105.68
FEMALES / 100 MALES
34.3
MEDIAN AGE
3.1
AVG FAMILY SIZE
2.3
AVG HOUSEHOLD SIZE
$52,912
PER CAPITA INCOME
$127,697
AVG FAMILY INCOME
$93,927
AVG HOUSEHOLD INCOME
18.5%
WAGE / INCOME GAP [ % ]
81.5¢/ $1
WAGE / INCOME GAP [ $ ]
0.42
INEQUALITY / GINI INDEX
9,146
LABOR FORCE [ PEOPLE ]
72.4%
PERCENT IN LABOR FORCE
6.1%
UNEMPLOYMENT RATE
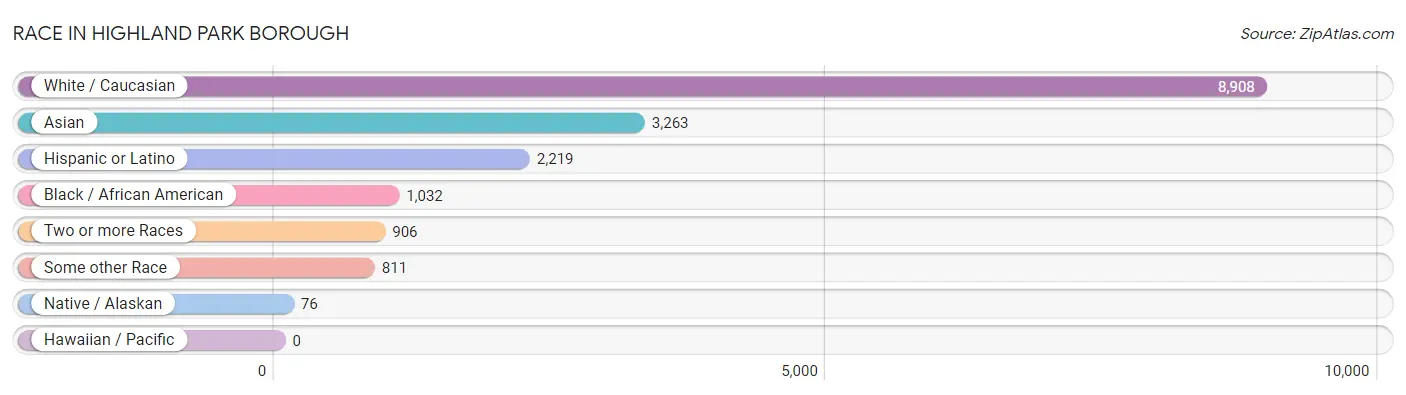
Race in Highland Park borough
The most populous races in Highland Park borough are White / Caucasian (8,908 | 59.4%), Asian (3,263 | 21.8%), and Hispanic or Latino (2,219 | 14.8%).
| Race | # Population | % Population |
| Asian | 3,263 | 21.8% |
| Black / African American | 1,032 | 6.9% |
| Hawaiian / Pacific | 0 | 0.0% |
| Hispanic or Latino | 2,219 | 14.8% |
| Native / Alaskan | 76 | 0.5% |
| White / Caucasian | 8,908 | 59.4% |
| Two or more Races | 906 | 6.0% |
| Some other Race | 811 | 5.4% |
| Total | 14,996 | 100.0% |
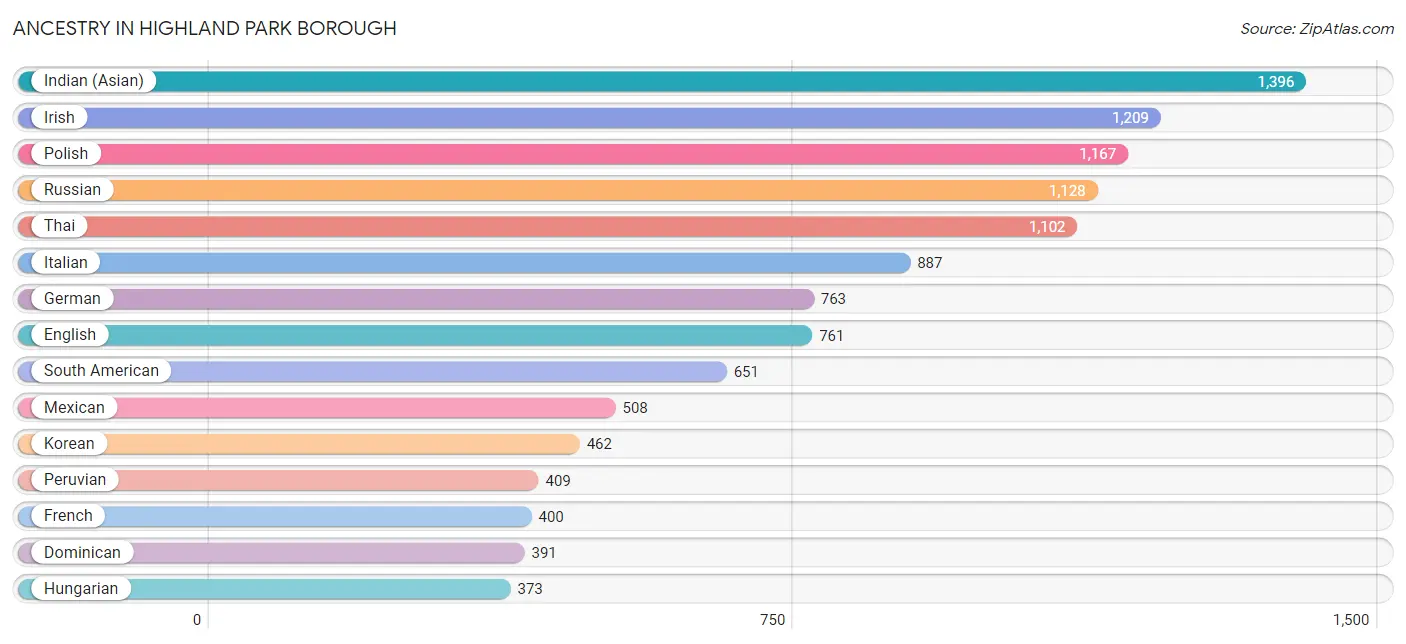
Ancestry in Highland Park borough
The most populous ancestries reported in Highland Park borough are Indian (Asian) (1,396 | 9.3%), Irish (1,209 | 8.1%), Polish (1,167 | 7.8%), Russian (1,128 | 7.5%), and Thai (1,102 | 7.3%), together accounting for 40.0% of all Highland Park borough residents.
| Ancestry | # Population | % Population |
| Afghan | 12 | 0.1% |
| African | 20 | 0.1% |
| American | 221 | 1.5% |
| Apache | 60 | 0.4% |
| Arab | 197 | 1.3% |
| Austrian | 104 | 0.7% |
| Belgian | 50 | 0.3% |
| Bhutanese | 9 | 0.1% |
| Bolivian | 16 | 0.1% |
| Brazilian | 19 | 0.1% |
| British | 81 | 0.5% |
| Burmese | 266 | 1.8% |
| Canadian | 9 | 0.1% |
| Central American | 264 | 1.8% |
| Central American Indian | 18 | 0.1% |
| Cherokee | 30 | 0.2% |
| Chilean | 97 | 0.6% |
| Choctaw | 39 | 0.3% |
| Colombian | 84 | 0.6% |
| Costa Rican | 62 | 0.4% |
| Cuban | 35 | 0.2% |
| Czech | 77 | 0.5% |
| Czechoslovakian | 8 | 0.1% |
| Danish | 66 | 0.4% |
| Dominican | 391 | 2.6% |
| Dutch | 26 | 0.2% |
| Eastern European | 294 | 2.0% |
| Ecuadorian | 45 | 0.3% |
| Egyptian | 45 | 0.3% |
| English | 761 | 5.1% |
| European | 156 | 1.0% |
| Filipino | 34 | 0.2% |
| French | 400 | 2.7% |
| French Canadian | 68 | 0.4% |
| German | 763 | 5.1% |
| Ghanaian | 33 | 0.2% |
| Greek | 74 | 0.5% |
| Guatemalan | 43 | 0.3% |
| Hungarian | 373 | 2.5% |
| Indian (Asian) | 1,396 | 9.3% |
| Iranian | 28 | 0.2% |
| Iraqi | 31 | 0.2% |
| Irish | 1,209 | 8.1% |
| Iroquois | 9 | 0.1% |
| Israeli | 65 | 0.4% |
| Italian | 887 | 5.9% |
| Jamaican | 162 | 1.1% |
| Korean | 462 | 3.1% |
| Lebanese | 22 | 0.2% |
| Lithuanian | 34 | 0.2% |
| Mexican | 508 | 3.4% |
| Mexican American Indian | 68 | 0.4% |
| Moroccan | 6 | 0.0% |
| Nigerian | 43 | 0.3% |
| Northern European | 66 | 0.4% |
| Norwegian | 218 | 1.5% |
| Peruvian | 409 | 2.7% |
| Polish | 1,167 | 7.8% |
| Portuguese | 108 | 0.7% |
| Puerto Rican | 294 | 2.0% |
| Romanian | 21 | 0.1% |
| Russian | 1,128 | 7.5% |
| Salvadoran | 159 | 1.1% |
| Scandinavian | 83 | 0.5% |
| Scotch-Irish | 41 | 0.3% |
| Scottish | 214 | 1.4% |
| Slovak | 10 | 0.1% |
| South American | 651 | 4.3% |
| Spaniard | 24 | 0.2% |
| Spanish | 22 | 0.2% |
| Subsaharan African | 96 | 0.6% |
| Swedish | 115 | 0.8% |
| Syrian | 41 | 0.3% |
| Thai | 1,102 | 7.3% |
| Turkish | 42 | 0.3% |
| Ukrainian | 161 | 1.1% |
| Vietnamese | 83 | 0.5% |
| Welsh | 157 | 1.1% | View All 78 Rows |
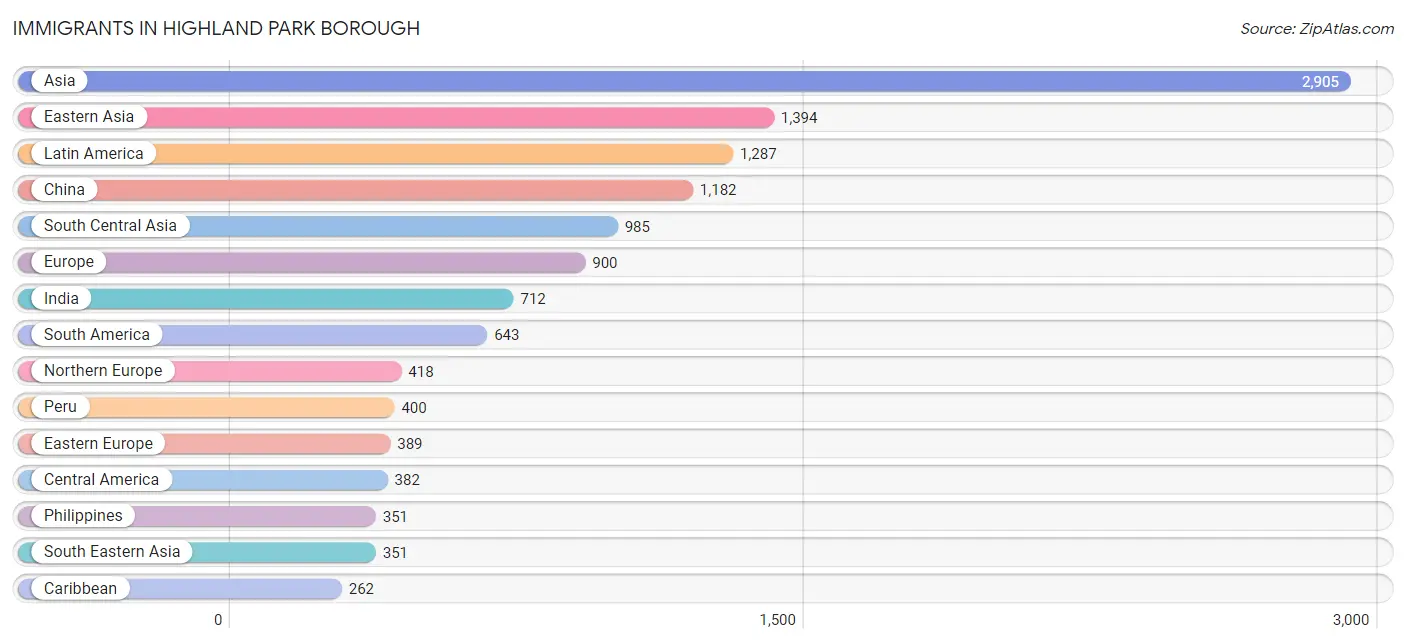
Immigrants in Highland Park borough
The most numerous immigrant groups reported in Highland Park borough came from Asia (2,905 | 19.4%), Eastern Asia (1,394 | 9.3%), Latin America (1,287 | 8.6%), China (1,182 | 7.9%), and South Central Asia (985 | 6.6%), together accounting for 51.7% of all Highland Park borough residents.
| Immigration Origin | # Population | % Population |
| Africa | 239 | 1.6% |
| Asia | 2,905 | 19.4% |
| Bangladesh | 83 | 0.5% |
| Brazil | 19 | 0.1% |
| Canada | 154 | 1.0% |
| Caribbean | 262 | 1.8% |
| Central America | 382 | 2.5% |
| Chile | 97 | 0.6% |
| China | 1,182 | 7.9% |
| Colombia | 74 | 0.5% |
| Costa Rica | 25 | 0.2% |
| Cuba | 28 | 0.2% |
| Czechoslovakia | 15 | 0.1% |
| Denmark | 13 | 0.1% |
| Dominican Republic | 222 | 1.5% |
| Eastern Africa | 64 | 0.4% |
| Eastern Asia | 1,394 | 9.3% |
| Eastern Europe | 389 | 2.6% |
| Ecuador | 30 | 0.2% |
| Egypt | 45 | 0.3% |
| El Salvador | 87 | 0.6% |
| England | 39 | 0.3% |
| Europe | 900 | 6.0% |
| Ghana | 68 | 0.4% |
| Greece | 29 | 0.2% |
| Guatemala | 18 | 0.1% |
| Hong Kong | 37 | 0.3% |
| Hungary | 56 | 0.4% |
| India | 712 | 4.8% |
| Iran | 28 | 0.2% |
| Ireland | 52 | 0.4% |
| Israel | 35 | 0.2% |
| Italy | 29 | 0.2% |
| Jamaica | 12 | 0.1% |
| Japan | 9 | 0.1% |
| Korea | 203 | 1.3% |
| Latin America | 1,287 | 8.6% |
| Latvia | 7 | 0.1% |
| Lebanon | 32 | 0.2% |
| Mexico | 252 | 1.7% |
| Morocco | 20 | 0.1% |
| Nepal | 45 | 0.3% |
| Nigeria | 30 | 0.2% |
| Northern Africa | 77 | 0.5% |
| Northern Europe | 418 | 2.8% |
| Pakistan | 117 | 0.8% |
| Peru | 400 | 2.7% |
| Philippines | 351 | 2.3% |
| Poland | 49 | 0.3% |
| Portugal | 17 | 0.1% |
| Romania | 28 | 0.2% |
| Russia | 94 | 0.6% |
| Scotland | 65 | 0.4% |
| South America | 643 | 4.3% |
| South Central Asia | 985 | 6.6% |
| South Eastern Asia | 351 | 2.3% |
| Southern Europe | 93 | 0.6% |
| Spain | 18 | 0.1% |
| Syria | 13 | 0.1% |
| Taiwan | 65 | 0.4% |
| Turkey | 53 | 0.4% |
| Uganda | 64 | 0.4% |
| Ukraine | 121 | 0.8% |
| Venezuela | 23 | 0.2% |
| Western Africa | 98 | 0.6% |
| Western Asia | 133 | 0.9% | View All 66 Rows |
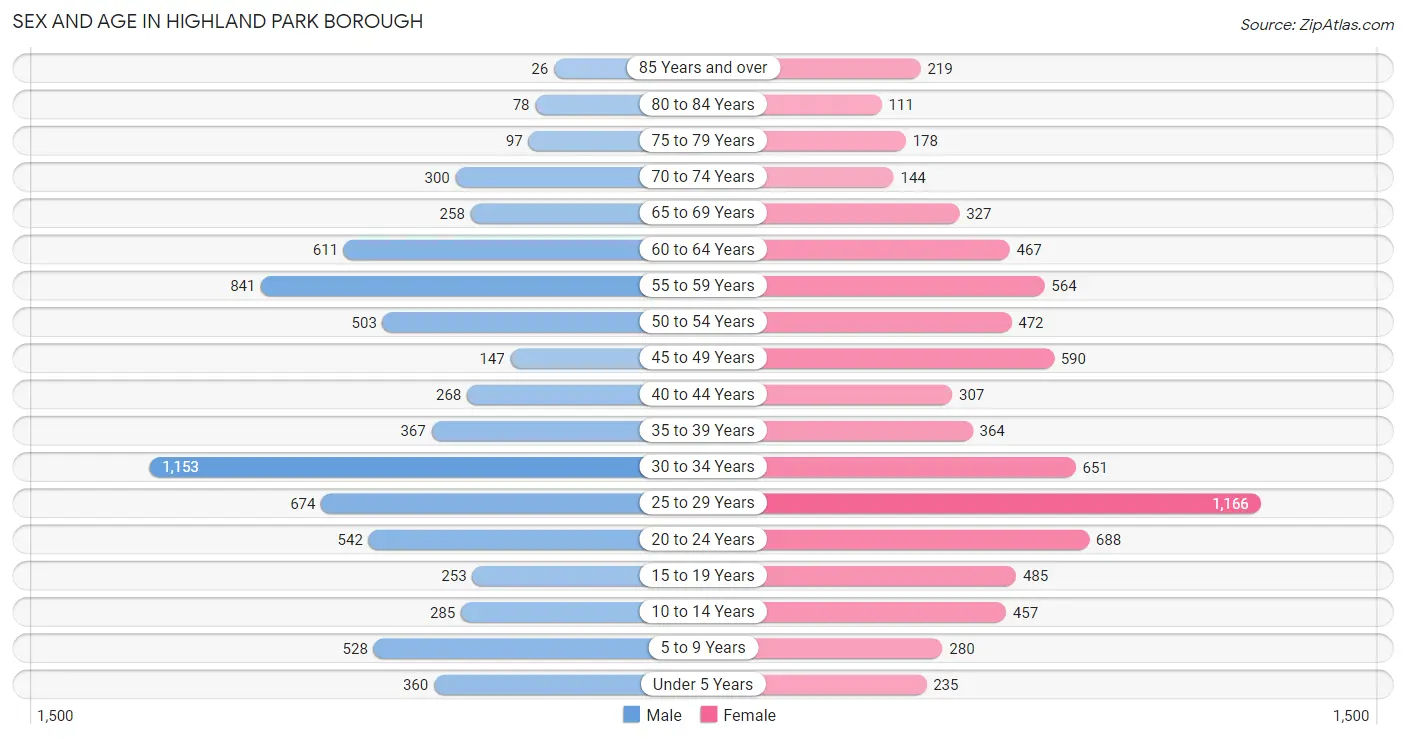
Sex and Age in Highland Park borough
Sex and Age in Highland Park borough
The most populous age groups in Highland Park borough are 30 to 34 Years (1,153 | 15.8%) for men and 25 to 29 Years (1,166 | 15.1%) for women.
| Age Bracket | Male | Female |
| Under 5 Years | 360 (4.9%) | 235 (3.0%) |
| 5 to 9 Years | 528 (7.2%) | 280 (3.6%) |
| 10 to 14 Years | 285 (3.9%) | 457 (5.9%) |
| 15 to 19 Years | 253 (3.5%) | 485 (6.3%) |
| 20 to 24 Years | 542 (7.4%) | 688 (8.9%) |
| 25 to 29 Years | 674 (9.2%) | 1,166 (15.1%) |
| 30 to 34 Years | 1,153 (15.8%) | 651 (8.5%) |
| 35 to 39 Years | 367 (5.0%) | 364 (4.7%) |
| 40 to 44 Years | 268 (3.7%) | 307 (4.0%) |
| 45 to 49 Years | 147 (2.0%) | 590 (7.7%) |
| 50 to 54 Years | 503 (6.9%) | 472 (6.1%) |
| 55 to 59 Years | 841 (11.5%) | 564 (7.3%) |
| 60 to 64 Years | 611 (8.4%) | 467 (6.1%) |
| 65 to 69 Years | 258 (3.5%) | 327 (4.2%) |
| 70 to 74 Years | 300 (4.1%) | 144 (1.9%) |
| 75 to 79 Years | 97 (1.3%) | 178 (2.3%) |
| 80 to 84 Years | 78 (1.1%) | 111 (1.4%) |
| 85 Years and over | 26 (0.4%) | 219 (2.8%) |
| Total | 7,291 (100.0%) | 7,705 (100.0%) |
Families and Households in Highland Park borough
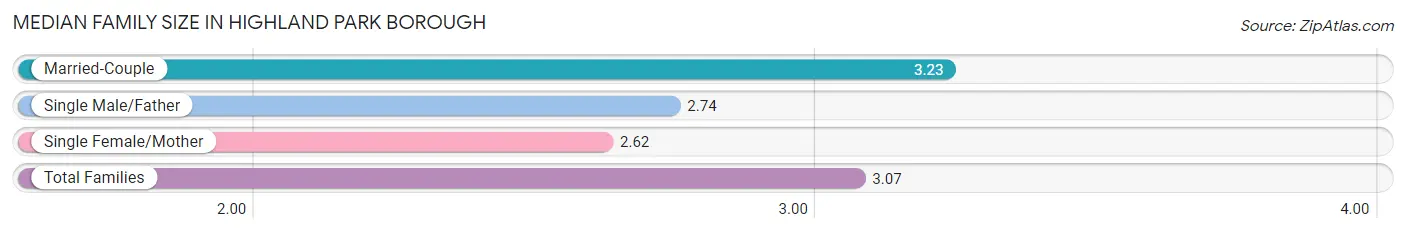
Median Family Size in Highland Park borough
The median family size in Highland Park borough is 3.07 persons per family, with married-couple families (2,560 | 71.7%) accounting for the largest median family size of 3.23 persons per family. On the other hand, single female/mother families (645 | 18.1%) represent the smallest median family size with 2.62 persons per family.
| Family Type | # Families | Family Size |
| Married-Couple | 2,560 (71.7%) | 3.23 |
| Single Male/Father | 367 (10.3%) | 2.74 |
| Single Female/Mother | 645 (18.1%) | 2.62 |
| Total Families | 3,572 (100.0%) | 3.07 |
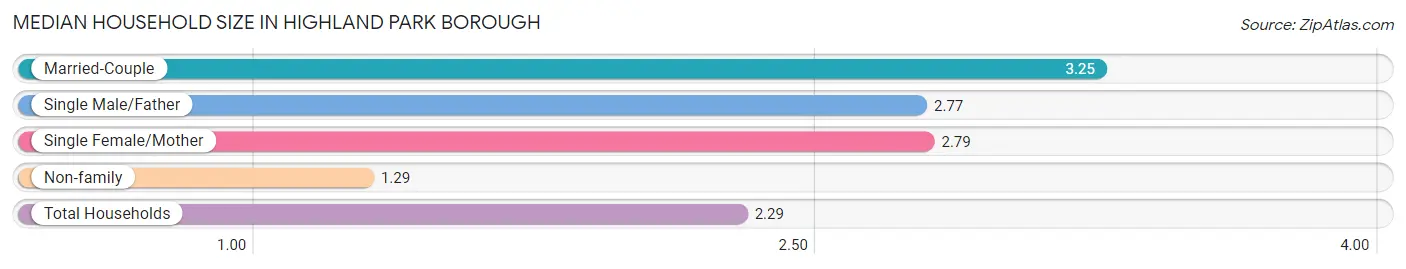
Median Household Size in Highland Park borough
The median household size in Highland Park borough is 2.29 persons per household, with married-couple households (2,560 | 39.1%) accounting for the largest median household size of 3.25 persons per household. non-family households (2,975 | 45.4%) represent the smallest median household size with 1.29 persons per household.
| Household Type | # Households | Household Size |
| Married-Couple | 2,560 (39.1%) | 3.25 |
| Single Male/Father | 367 (5.6%) | 2.77 |
| Single Female/Mother | 645 (9.9%) | 2.79 |
| Non-family | 2,975 (45.4%) | 1.29 |
| Total Households | 6,547 (100.0%) | 2.29 |
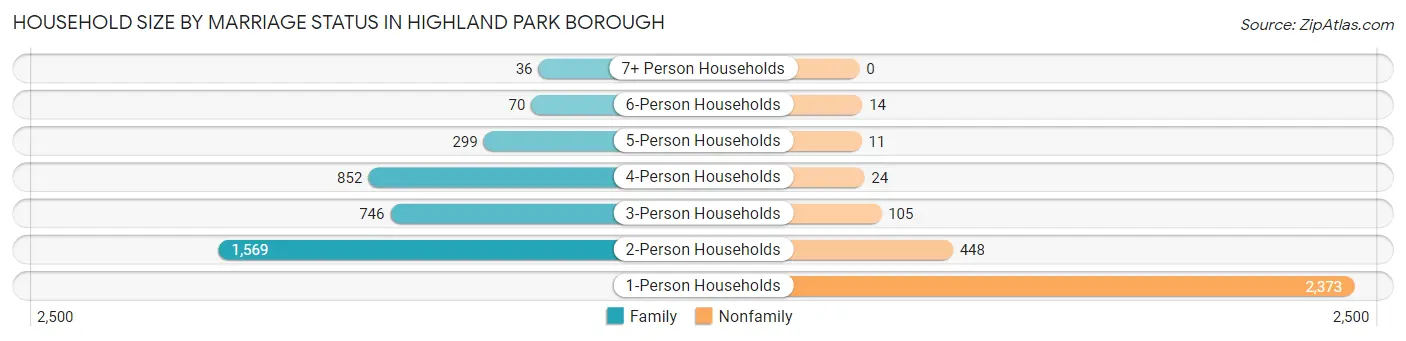
Household Size by Marriage Status in Highland Park borough
Out of a total of 6,547 households in Highland Park borough, 3,572 (54.6%) are family households, while 2,975 (45.4%) are nonfamily households. The most numerous type of family households are 2-person households, comprising 1,569, and the most common type of nonfamily households are 1-person households, comprising 2,373.
| Household Size | Family Households | Nonfamily Households |
| 1-Person Households | - | 2,373 (36.2%) |
| 2-Person Households | 1,569 (24.0%) | 448 (6.8%) |
| 3-Person Households | 746 (11.4%) | 105 (1.6%) |
| 4-Person Households | 852 (13.0%) | 24 (0.4%) |
| 5-Person Households | 299 (4.6%) | 11 (0.2%) |
| 6-Person Households | 70 (1.1%) | 14 (0.2%) |
| 7+ Person Households | 36 (0.5%) | 0 (0.0%) |
| Total | 3,572 (54.6%) | 2,975 (45.4%) |
Female Fertility in Highland Park borough
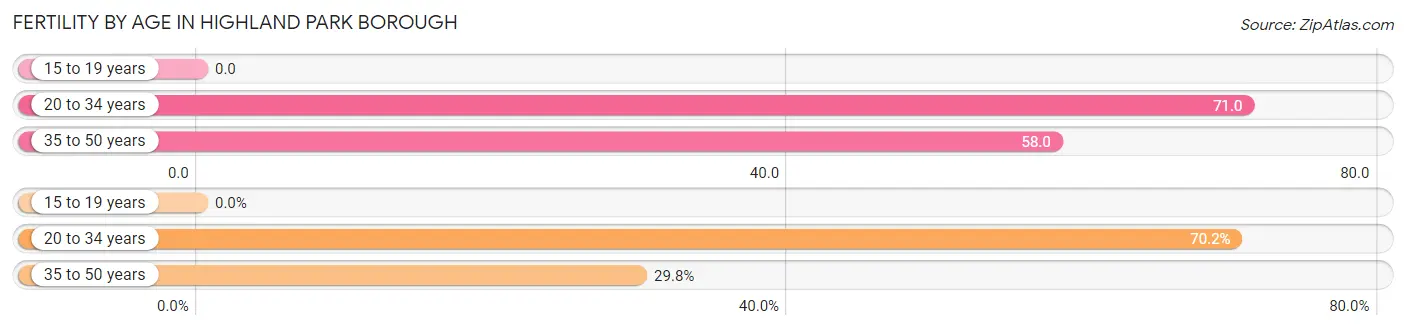
Fertility by Age in Highland Park borough
Average fertility rate in Highland Park borough is 59.0 births per 1,000 women. Women in the age bracket of 20 to 34 years have the highest fertility rate with 71.0 births per 1,000 women. Women in the age bracket of 20 to 34 years acount for 70.2% of all women with births.
| Age Bracket | Women with Births | Births / 1,000 Women |
| 15 to 19 years | 0 (0.0%) | 0.0 |
| 20 to 34 years | 179 (70.2%) | 71.0 |
| 35 to 50 years | 76 (29.8%) | 58.0 |
| Total | 255 (100.0%) | 59.0 |
Fertility by Age by Marriage Status in Highland Park borough
58.4% of women with births (255) in Highland Park borough are married. The highest percentage of unmarried women with births falls into 20 to 34 years age bracket with 59.2% of them unmarried at the time of birth, while the lowest percentage of unmarried women with births belong to 35 to 50 years age bracket with 0.0% of them unmarried.
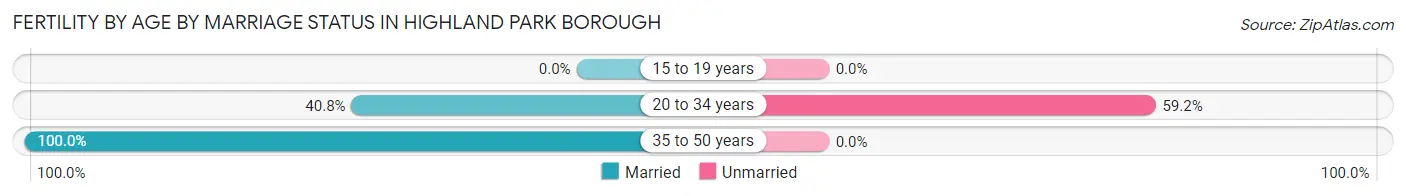
| Age Bracket | Married | Unmarried |
| 15 to 19 years | 0 (0.0%) | 0 (0.0%) |
| 20 to 34 years | 73 (40.8%) | 106 (59.2%) |
| 35 to 50 years | 76 (100.0%) | 0 (0.0%) |
| Total | 149 (58.4%) | 106 (41.6%) |
Fertility by Education in Highland Park borough
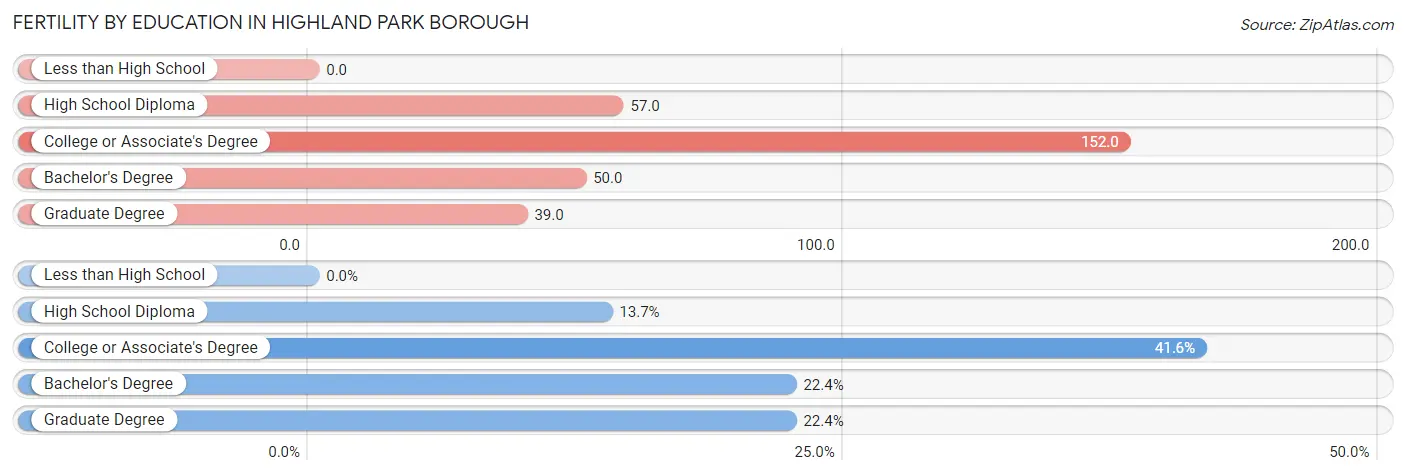
| Educational Attainment | Women with Births | Births / 1,000 Women |
| Less than High School | 0 (0.0%) | 0.0 |
| High School Diploma | 35 (13.7%) | 57.0 |
| College or Associate's Degree | 106 (41.6%) | 152.0 |
| Bachelor's Degree | 57 (22.4%) | 50.0 |
| Graduate Degree | 57 (22.4%) | 39.0 |
| Total | 255 (100.0%) | 59.0 |
Fertility by Education by Marriage Status in Highland Park borough
41.6% of women with births in Highland Park borough are unmarried. Women with the educational attainment of high school diploma are most likely to be married with 100.0% of them married at childbirth, while women with the educational attainment of college or associate's degree are least likely to be married with 100.0% of them unmarried at childbirth.
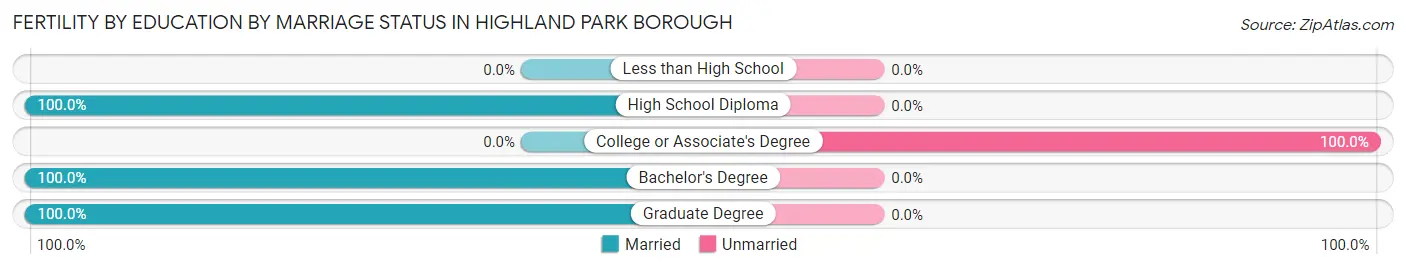
| Educational Attainment | Married | Unmarried |
| Less than High School | 0 (0.0%) | 0 (0.0%) |
| High School Diploma | 35 (100.0%) | 0 (0.0%) |
| College or Associate's Degree | 0 (0.0%) | 106 (100.0%) |
| Bachelor's Degree | 57 (100.0%) | 0 (0.0%) |
| Graduate Degree | 57 (100.0%) | 0 (0.0%) |
| Total | 149 (58.4%) | 106 (41.6%) |
Income in Highland Park borough
Income Overview in Highland Park borough
Per Capita Income in Highland Park borough is $52,912, while median incomes of families and households are $127,697 and $93,927 respectively.
| Characteristic | Number | Measure |
| Per Capita Income | 14,996 | $52,912 |
| Median Family Income | 3,572 | $127,697 |
| Mean Family Income | 3,572 | $144,280 |
| Median Household Income | 6,547 | $93,927 |
| Mean Household Income | 6,547 | $119,021 |
| Income Deficit | 3,572 | $0 |
| Wage / Income Gap (%) | 14,996 | 18.48% |
| Wage / Income Gap ($) | 14,996 | 81.52¢ per $1 |
| Gini / Inequality Index | 14,996 | 0.42 |
Earnings by Sex in Highland Park borough
Average Earnings in Highland Park borough are $51,133, $57,629 for men and $46,981 for women, a difference of 18.5%.
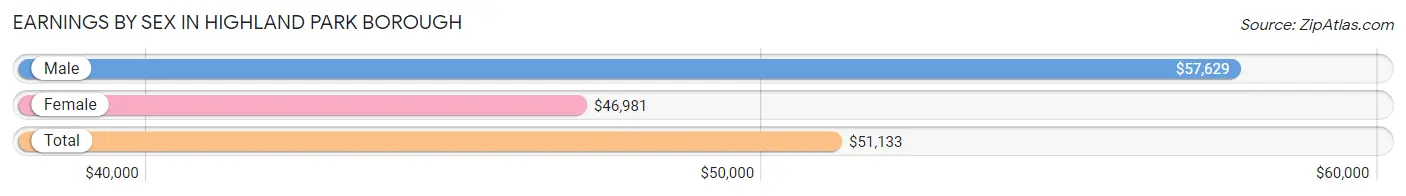
| Sex | Number | Average Earnings |
| Male | 5,043 (52.7%) | $57,629 |
| Female | 4,525 (47.3%) | $46,981 |
| Total | 9,568 (100.0%) | $51,133 |
Earnings by Sex by Income Bracket in Highland Park borough
The most common earnings brackets in Highland Park borough are $100,000+ for men (1,516 | 30.1%) and $100,000+ for women (774 | 17.1%).
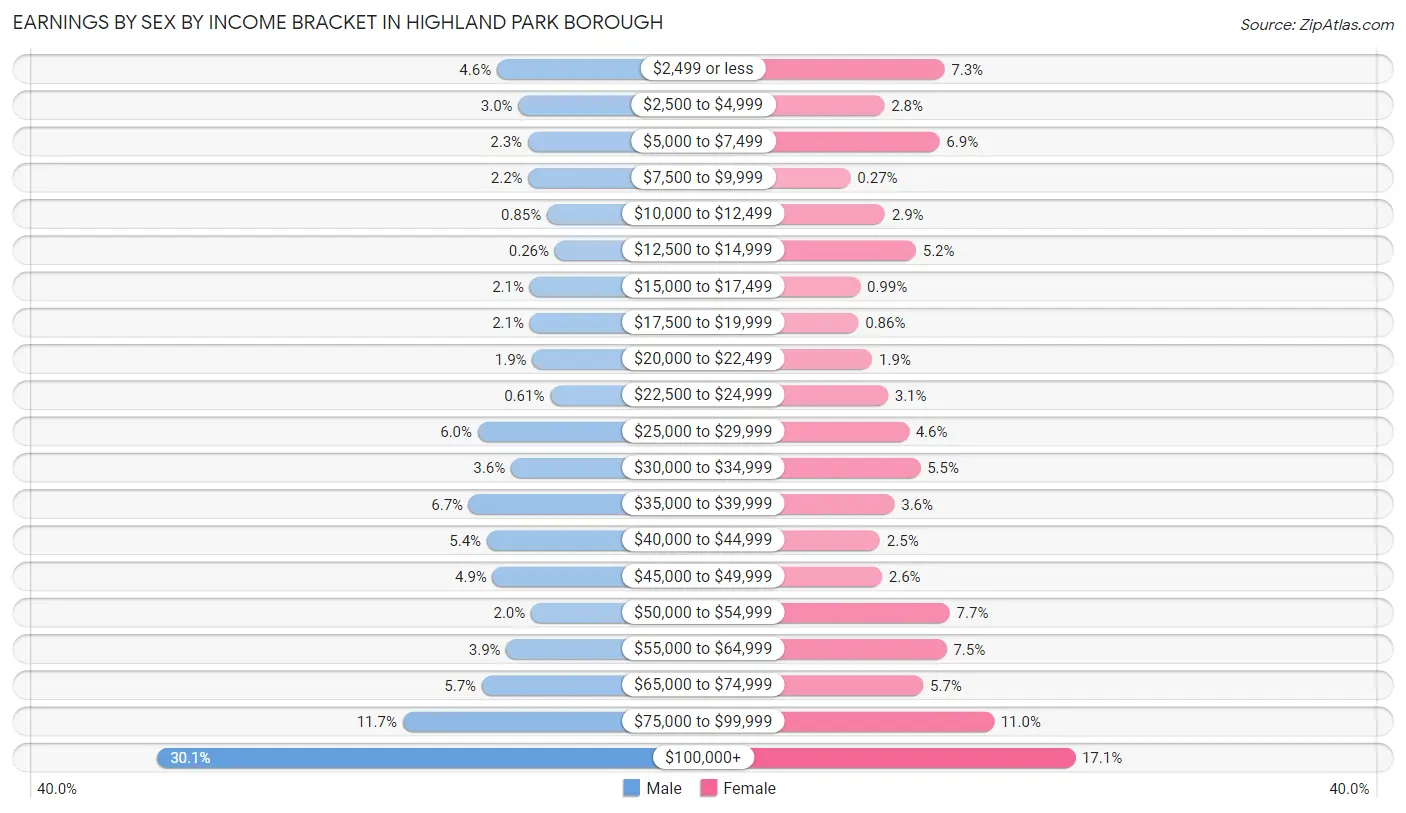
| Income | Male | Female |
| $2,499 or less | 232 (4.6%) | 331 (7.3%) |
| $2,500 to $4,999 | 151 (3.0%) | 127 (2.8%) |
| $5,000 to $7,499 | 115 (2.3%) | 314 (6.9%) |
| $7,500 to $9,999 | 113 (2.2%) | 12 (0.3%) |
| $10,000 to $12,499 | 43 (0.9%) | 129 (2.9%) |
| $12,500 to $14,999 | 13 (0.3%) | 234 (5.2%) |
| $15,000 to $17,499 | 108 (2.1%) | 45 (1.0%) |
| $17,500 to $19,999 | 108 (2.1%) | 39 (0.9%) |
| $20,000 to $22,499 | 98 (1.9%) | 86 (1.9%) |
| $22,500 to $24,999 | 31 (0.6%) | 139 (3.1%) |
| $25,000 to $29,999 | 304 (6.0%) | 210 (4.6%) |
| $30,000 to $34,999 | 179 (3.5%) | 249 (5.5%) |
| $35,000 to $39,999 | 338 (6.7%) | 161 (3.6%) |
| $40,000 to $44,999 | 270 (5.3%) | 112 (2.5%) |
| $45,000 to $49,999 | 248 (4.9%) | 119 (2.6%) |
| $50,000 to $54,999 | 103 (2.0%) | 349 (7.7%) |
| $55,000 to $64,999 | 196 (3.9%) | 338 (7.5%) |
| $65,000 to $74,999 | 289 (5.7%) | 259 (5.7%) |
| $75,000 to $99,999 | 588 (11.7%) | 498 (11.0%) |
| $100,000+ | 1,516 (30.1%) | 774 (17.1%) |
| Total | 5,043 (100.0%) | 4,525 (100.0%) |
Earnings by Sex by Educational Attainment in Highland Park borough
Average earnings in Highland Park borough are $68,507 for men and $52,874 for women, a difference of 22.8%. Men with an educational attainment of graduate degree enjoy the highest average annual earnings of $86,183, while those with college or associate's degree education earn the least with $46,094. Women with an educational attainment of graduate degree earn the most with the average annual earnings of $80,442, while those with high school diploma education have the smallest earnings of $13,846.
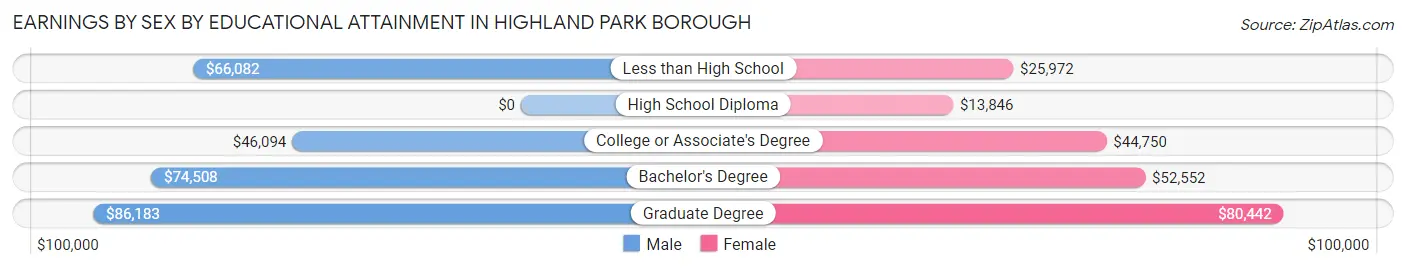
| Educational Attainment | Male Income | Female Income |
| Less than High School | $66,082 | $25,972 |
| High School Diploma | - | - |
| College or Associate's Degree | $46,094 | $44,750 |
| Bachelor's Degree | $74,508 | $52,552 |
| Graduate Degree | $86,183 | $80,442 |
| Total | $68,507 | $52,874 |
Family Income in Highland Park borough
Family Income Brackets in Highland Park borough
According to the Highland Park borough family income data, there are 854 families falling into the $200,000+ income range, which is the most common income bracket and makes up 23.9% of all families. Conversely, the $25,000 to $34,999 income bracket is the least frequent group with only 36 families (1.0%) belonging to this category.
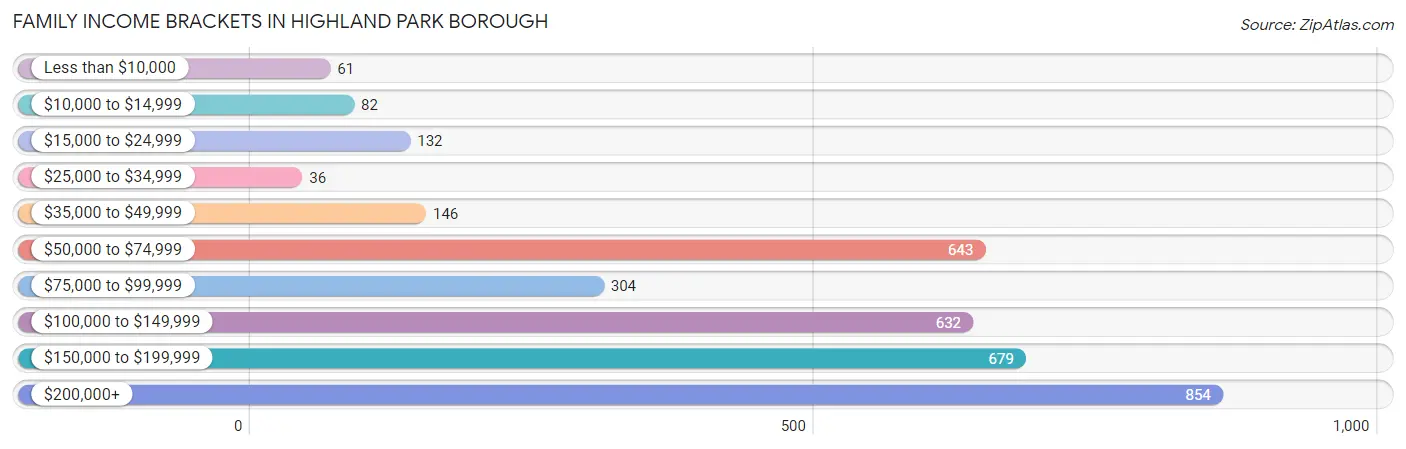
| Income Bracket | # Families | % Families |
| Less than $10,000 | 61 | 1.7% |
| $10,000 to $14,999 | 82 | 2.3% |
| $15,000 to $24,999 | 132 | 3.7% |
| $25,000 to $34,999 | 36 | 1.0% |
| $35,000 to $49,999 | 146 | 4.1% |
| $50,000 to $74,999 | 643 | 18.0% |
| $75,000 to $99,999 | 304 | 8.5% |
| $100,000 to $149,999 | 632 | 17.7% |
| $150,000 to $199,999 | 679 | 19.0% |
| $200,000+ | 854 | 23.9% |
Family Income by Famaliy Size in Highland Park borough
6-person families (70 | 2.0%) account for the highest median family income in Highland Park borough with $250,001 per family, while 2-person families (1,647 | 46.1%) have the highest median income of $58,064 per family member.
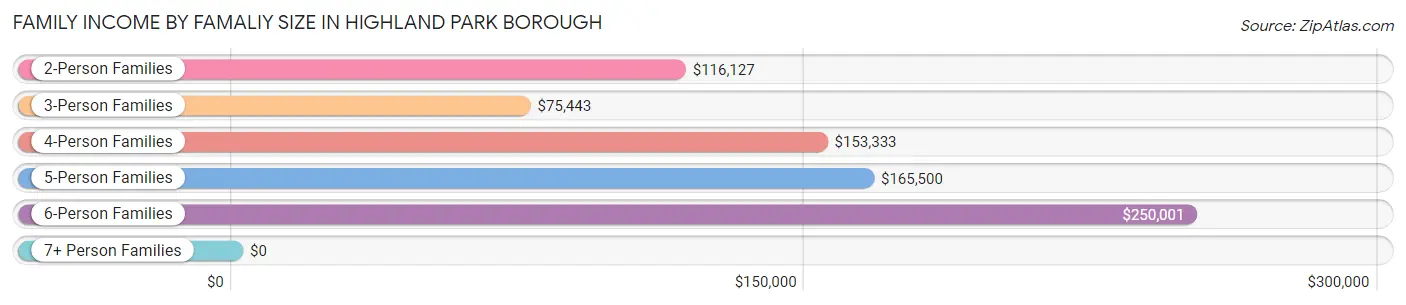
| Income Bracket | # Families | Median Income |
| 2-Person Families | 1,647 (46.1%) | $116,127 |
| 3-Person Families | 779 (21.8%) | $75,443 |
| 4-Person Families | 748 (20.9%) | $153,333 |
| 5-Person Families | 292 (8.2%) | $165,500 |
| 6-Person Families | 70 (2.0%) | $250,001 |
| 7+ Person Families | 36 (1.0%) | $0 |
| Total | 3,572 (100.0%) | $127,697 |
Family Income by Number of Earners in Highland Park borough
The median family income in Highland Park borough is $127,697, with families comprising 3+ earners (440) having the highest median family income of $185,833, while families with 1 earner (1,110) have the lowest median family income of $92,803, accounting for 12.3% and 31.1% of families, respectively.
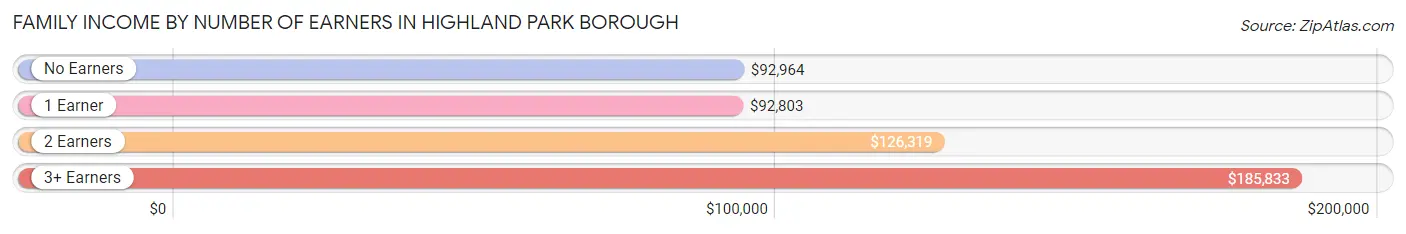
| Number of Earners | # Families | Median Income |
| No Earners | 159 (4.4%) | $92,964 |
| 1 Earner | 1,110 (31.1%) | $92,803 |
| 2 Earners | 1,863 (52.2%) | $126,319 |
| 3+ Earners | 440 (12.3%) | $185,833 |
| Total | 3,572 (100.0%) | $127,697 |
Household Income in Highland Park borough
Household Income Brackets in Highland Park borough
With 1,185 households falling in the category, the $100,000 to $149,999 income range is the most frequent in Highland Park borough, accounting for 18.1% of all households. In contrast, only 210 households (3.2%) fall into the $25,000 to $34,999 income bracket, making it the least populous group.
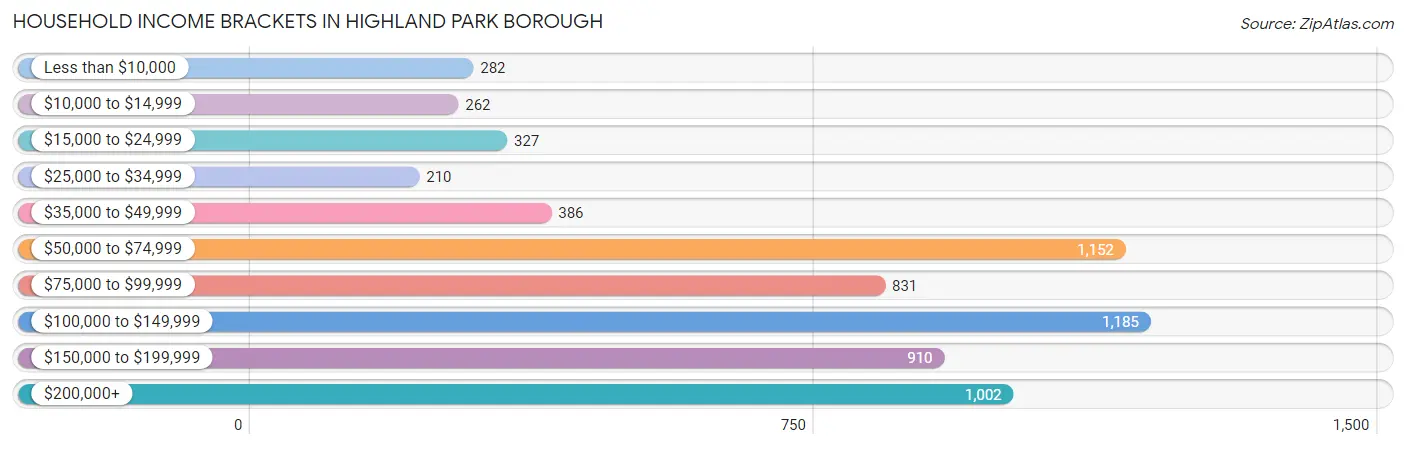
| Income Bracket | # Households | % Households |
| Less than $10,000 | 282 | 4.3% |
| $10,000 to $14,999 | 262 | 4.0% |
| $15,000 to $24,999 | 327 | 5.0% |
| $25,000 to $34,999 | 210 | 3.2% |
| $35,000 to $49,999 | 386 | 5.9% |
| $50,000 to $74,999 | 1,152 | 17.6% |
| $75,000 to $99,999 | 831 | 12.7% |
| $100,000 to $149,999 | 1,185 | 18.1% |
| $150,000 to $199,999 | 910 | 13.9% |
| $200,000+ | 1,002 | 15.3% |
Household Income by Householder Age in Highland Park borough
The median household income in Highland Park borough is $93,927, with the highest median household income of $104,767 found in the 45 to 64 years age bracket for the primary householder. A total of 2,360 households (36.0%) fall into this category. Meanwhile, the 15 to 24 years age bracket for the primary householder has the lowest median household income of $44,659, with 218 households (3.3%) in this group.
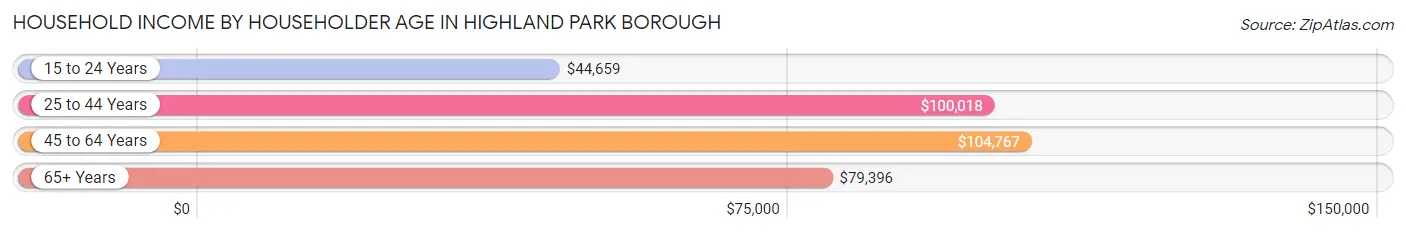
| Income Bracket | # Households | Median Income |
| 15 to 24 Years | 218 (3.3%) | $44,659 |
| 25 to 44 Years | 2,743 (41.9%) | $100,018 |
| 45 to 64 Years | 2,360 (36.0%) | $104,767 |
| 65+ Years | 1,226 (18.7%) | $79,396 |
| Total | 6,547 (100.0%) | $93,927 |
Poverty in Highland Park borough
Income Below Poverty by Sex and Age in Highland Park borough
With 10.6% poverty level for males and 10.5% for females among the residents of Highland Park borough, 6 to 11 year old males and 5 year old females are the most vulnerable to poverty, with 152 males (31.3%) and 48 females (63.2%) in their respective age groups living below the poverty level.
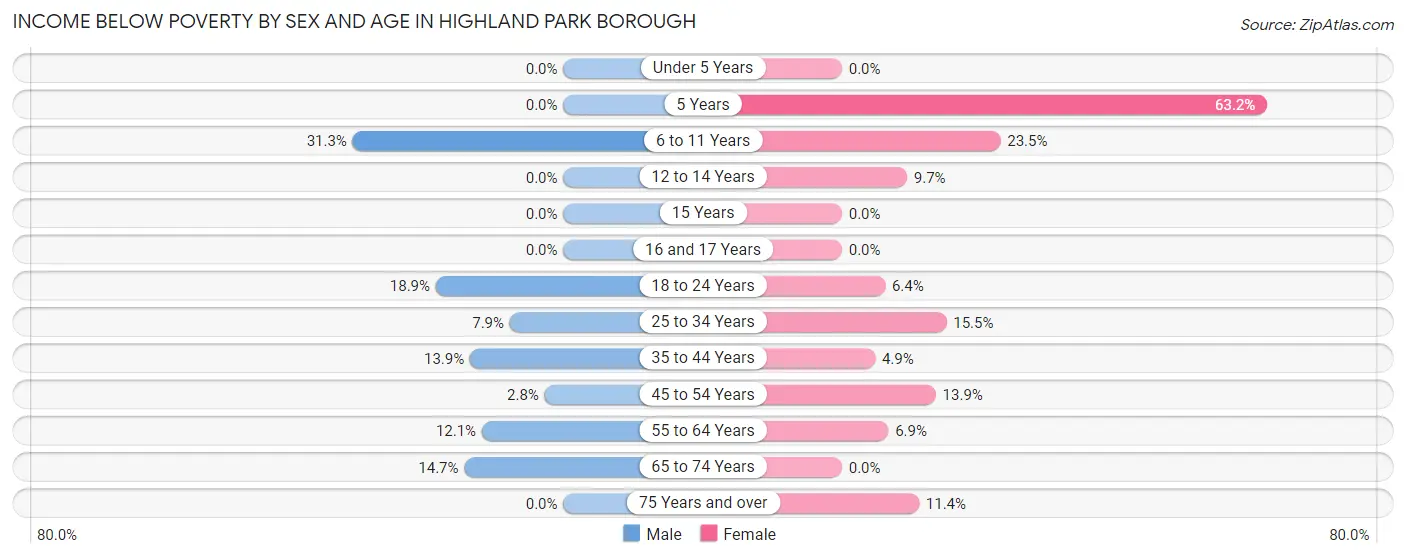
| Age Bracket | Male | Female |
| Under 5 Years | 0 (0.0%) | 0 (0.0%) |
| 5 Years | 0 (0.0%) | 48 (63.2%) |
| 6 to 11 Years | 152 (31.3%) | 80 (23.5%) |
| 12 to 14 Years | 0 (0.0%) | 31 (9.7%) |
| 15 Years | 0 (0.0%) | 0 (0.0%) |
| 16 and 17 Years | 0 (0.0%) | 0 (0.0%) |
| 18 to 24 Years | 110 (18.9%) | 56 (6.4%) |
| 25 to 34 Years | 145 (7.9%) | 282 (15.5%) |
| 35 to 44 Years | 88 (13.9%) | 33 (4.9%) |
| 45 to 54 Years | 18 (2.8%) | 148 (13.9%) |
| 55 to 64 Years | 174 (12.1%) | 71 (6.9%) |
| 65 to 74 Years | 82 (14.7%) | 0 (0.0%) |
| 75 Years and over | 0 (0.0%) | 58 (11.4%) |
| Total | 769 (10.6%) | 807 (10.5%) |
Income Above Poverty by Sex and Age in Highland Park borough
According to the poverty statistics in Highland Park borough, males aged under 5 years and females aged under 5 years are the age groups that are most secure financially, with 100.0% of males and 100.0% of females in these age groups living above the poverty line.
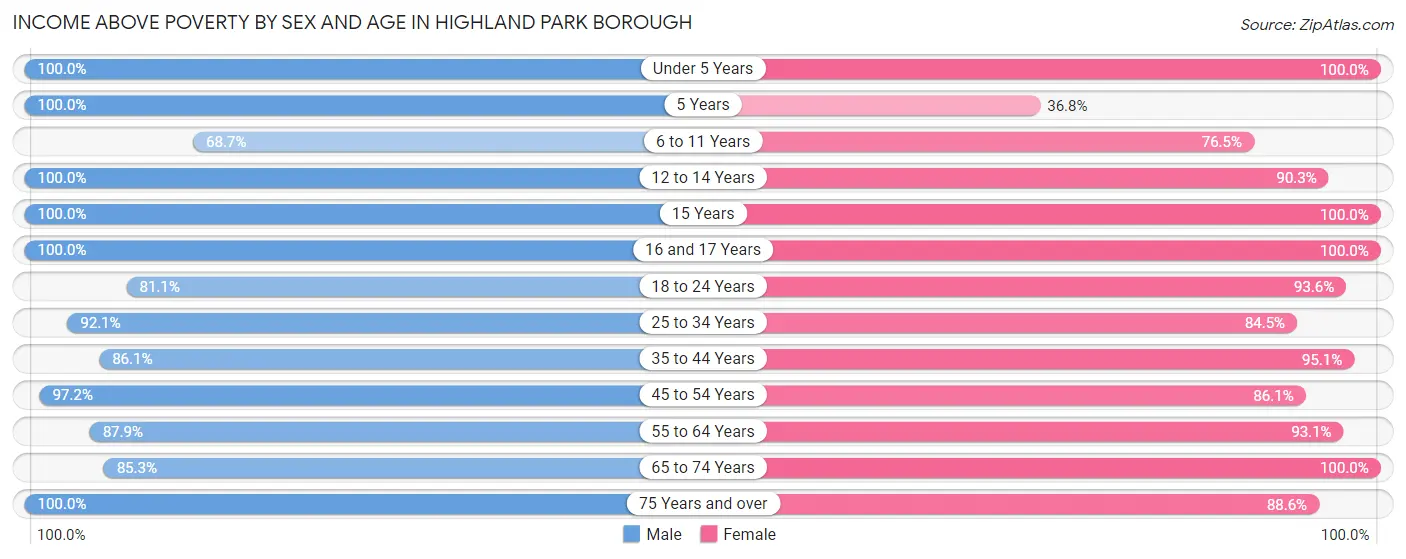
| Age Bracket | Male | Female |
| Under 5 Years | 360 (100.0%) | 235 (100.0%) |
| 5 Years | 88 (100.0%) | 28 (36.8%) |
| 6 to 11 Years | 334 (68.7%) | 260 (76.5%) |
| 12 to 14 Years | 226 (100.0%) | 290 (90.3%) |
| 15 Years | 66 (100.0%) | 152 (100.0%) |
| 16 and 17 Years | 148 (100.0%) | 147 (100.0%) |
| 18 to 24 Years | 471 (81.1%) | 818 (93.6%) |
| 25 to 34 Years | 1,682 (92.1%) | 1,535 (84.5%) |
| 35 to 44 Years | 547 (86.1%) | 638 (95.1%) |
| 45 to 54 Years | 632 (97.2%) | 914 (86.1%) |
| 55 to 64 Years | 1,265 (87.9%) | 960 (93.1%) |
| 65 to 74 Years | 476 (85.3%) | 460 (100.0%) |
| 75 Years and over | 200 (100.0%) | 449 (88.6%) |
| Total | 6,495 (89.4%) | 6,886 (89.5%) |
Income Below Poverty Among Married-Couple Families in Highland Park borough
The poverty statistics for married-couple families in Highland Park borough show that 6.6% or 169 of the total 2,560 families live below the poverty line. Families with 3 or 4 children have the highest poverty rate of 18.7%, comprising of 52 families. On the other hand, families with no children have the lowest poverty rate of 0.4%, which includes 6 families.
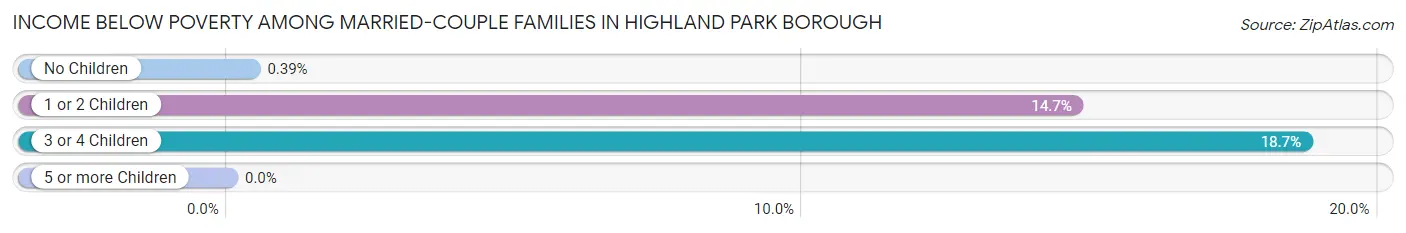
| Children | Above Poverty | Below Poverty |
| No Children | 1,522 (99.6%) | 6 (0.4%) |
| 1 or 2 Children | 643 (85.3%) | 111 (14.7%) |
| 3 or 4 Children | 226 (81.3%) | 52 (18.7%) |
| 5 or more Children | 0 (0.0%) | 0 (0.0%) |
| Total | 2,391 (93.4%) | 169 (6.6%) |
Income Below Poverty Among Single-Parent Households in Highland Park borough
According to the poverty data in Highland Park borough, 13.6% or 50 single-father households and 1.9% or 12 single-mother households are living below the poverty line. Among single-father households, those with no children have the highest poverty rate, with 50 households (20.4%) experiencing poverty. Likewise, among single-mother households, those with no children have the highest poverty rate, with 12 households (4.7%) falling below the poverty line.
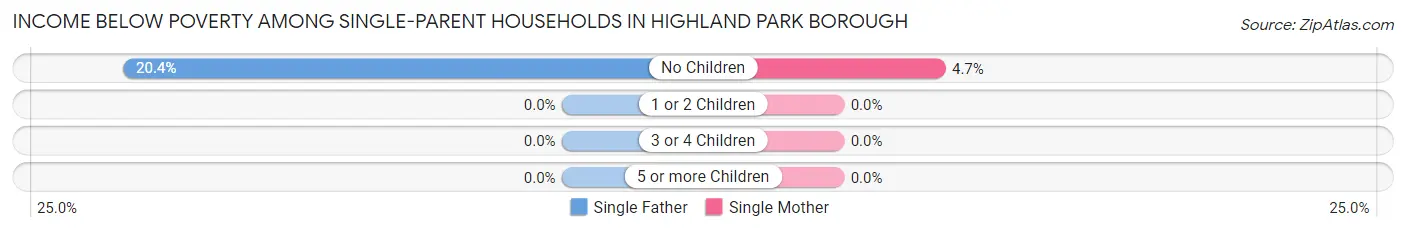
| Children | Single Father | Single Mother |
| No Children | 50 (20.4%) | 12 (4.7%) |
| 1 or 2 Children | 0 (0.0%) | 0 (0.0%) |
| 3 or 4 Children | 0 (0.0%) | 0 (0.0%) |
| 5 or more Children | 0 (0.0%) | 0 (0.0%) |
| Total | 50 (13.6%) | 12 (1.9%) |
Income Below Poverty Among Married-Couple vs Single-Parent Households in Highland Park borough
The poverty data for Highland Park borough shows that 169 of the married-couple family households (6.6%) and 62 of the single-parent households (6.1%) are living below the poverty level. Within the married-couple family households, those with 3 or 4 children have the highest poverty rate, with 52 households (18.7%) falling below the poverty line. Among the single-parent households, those with no children have the highest poverty rate, with 62 household (12.4%) living below poverty.
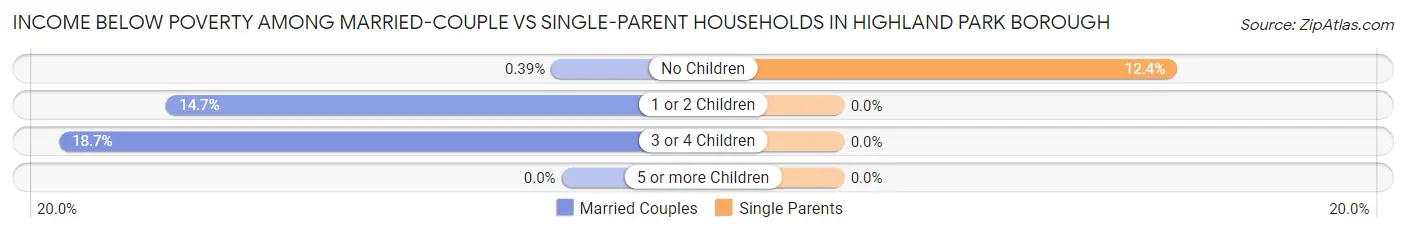
| Children | Married-Couple Families | Single-Parent Households |
| No Children | 6 (0.4%) | 62 (12.4%) |
| 1 or 2 Children | 111 (14.7%) | 0 (0.0%) |
| 3 or 4 Children | 52 (18.7%) | 0 (0.0%) |
| 5 or more Children | 0 (0.0%) | 0 (0.0%) |
| Total | 169 (6.6%) | 62 (6.1%) |
Employment Characteristics in Highland Park borough
Employment by Class of Employer in Highland Park borough
Among the 8,324 employed individuals in Highland Park borough, private company employees (4,476 | 53.8%), state government employees (1,450 | 17.4%), and not-for-profit organizations (1,103 | 13.3%) make up the most common classes of employment.
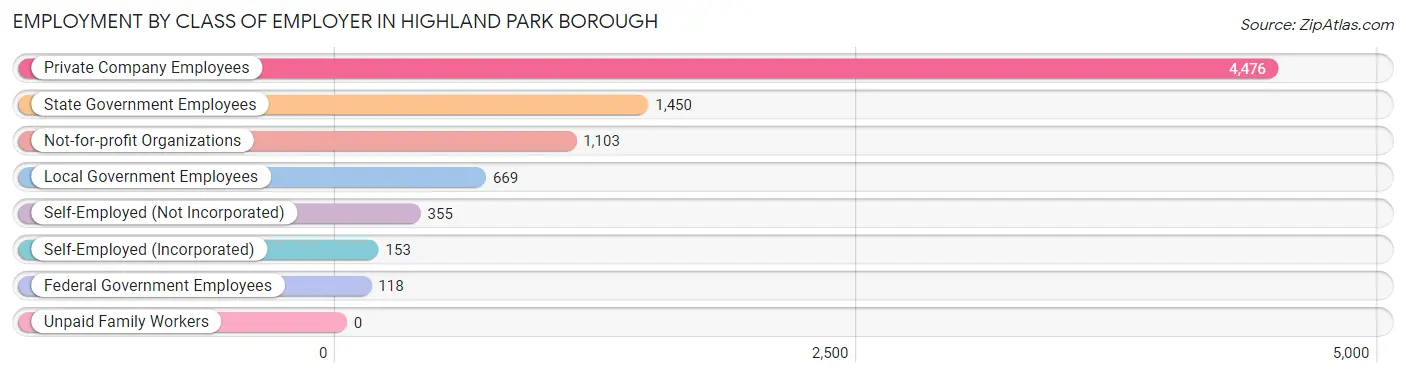
| Employer Class | # Employees | % Employees |
| Private Company Employees | 4,476 | 53.8% |
| Self-Employed (Incorporated) | 153 | 1.8% |
| Self-Employed (Not Incorporated) | 355 | 4.3% |
| Not-for-profit Organizations | 1,103 | 13.3% |
| Local Government Employees | 669 | 8.0% |
| State Government Employees | 1,450 | 17.4% |
| Federal Government Employees | 118 | 1.4% |
| Unpaid Family Workers | 0 | 0.0% |
| Total | 8,324 | 100.0% |
Employment Status by Age in Highland Park borough
According to the labor force statistics for Highland Park borough, out of the total population over 16 years of age (12,633), 72.4% or 9,146 individuals are in the labor force, with 6.1% or 558 of them unemployed. The age group with the highest labor force participation rate is 45 to 54 years, with 89.8% or 1,537 individuals in the labor force. Within the labor force, the 65 to 74 years age range has the highest percentage of unemployed individuals, with 14.7% or 79 of them being unemployed.
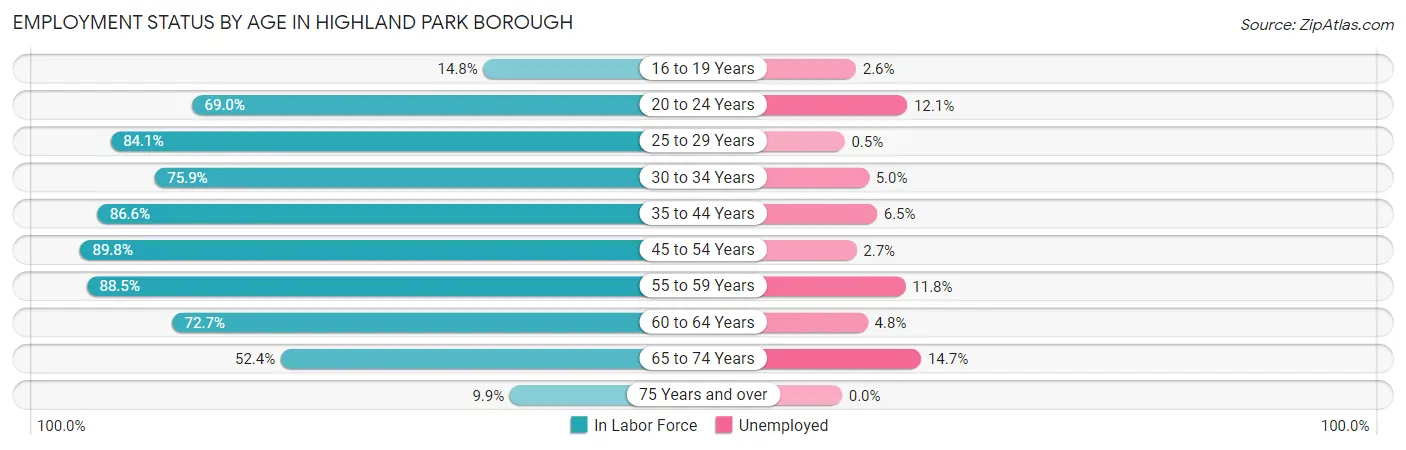
| Age Bracket | In Labor Force | Unemployed |
| 16 to 19 Years | 77 (14.8%) | 2 (2.6%) |
| 20 to 24 Years | 849 (69.0%) | 103 (12.1%) |
| 25 to 29 Years | 1,547 (84.1%) | 8 (0.5%) |
| 30 to 34 Years | 1,369 (75.9%) | 68 (5.0%) |
| 35 to 44 Years | 1,131 (86.6%) | 74 (6.5%) |
| 45 to 54 Years | 1,537 (89.8%) | 41 (2.7%) |
| 55 to 59 Years | 1,243 (88.5%) | 147 (11.8%) |
| 60 to 64 Years | 784 (72.7%) | 38 (4.8%) |
| 65 to 74 Years | 539 (52.4%) | 79 (14.7%) |
| 75 Years and over | 70 (9.9%) | 0 (0.0%) |
| Total | 9,146 (72.4%) | 558 (6.1%) |
Employment Status by Educational Attainment in Highland Park borough
According to labor force statistics for Highland Park borough, 83.2% of individuals (7,609) out of the total population between 25 and 64 years of age (9,145) are in the labor force, with 4.9% or 373 of them being unemployed. The group with the highest labor force participation rate are those with the educational attainment of bachelor's degree or higher, with 87.0% or 5,716 individuals in the labor force. Within the labor force, individuals with college / associate degree education have the highest percentage of unemployment, with 13.0% or 126 of them being unemployed.
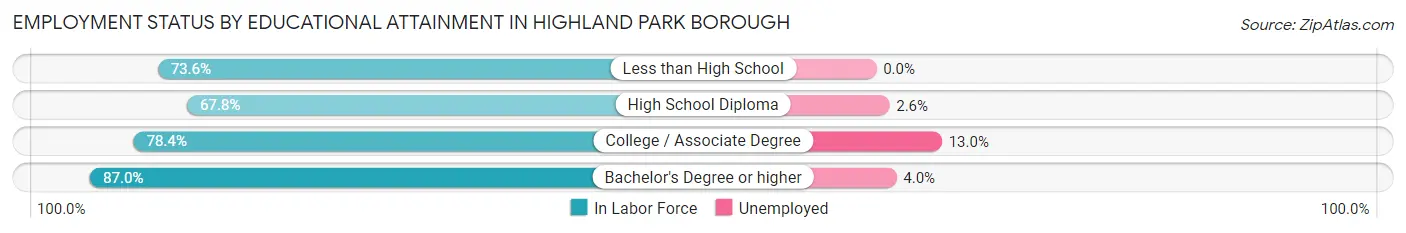
| Educational Attainment | In Labor Force | Unemployed |
| Less than High School | 242 (73.6%) | 0 (0.0%) |
| High School Diploma | 683 (67.8%) | 26 (2.6%) |
| College / Associate Degree | 971 (78.4%) | 161 (13.0%) |
| Bachelor's Degree or higher | 5,716 (87.0%) | 263 (4.0%) |
| Total | 7,609 (83.2%) | 448 (4.9%) |
Employment Occupations by Sex in Highland Park borough
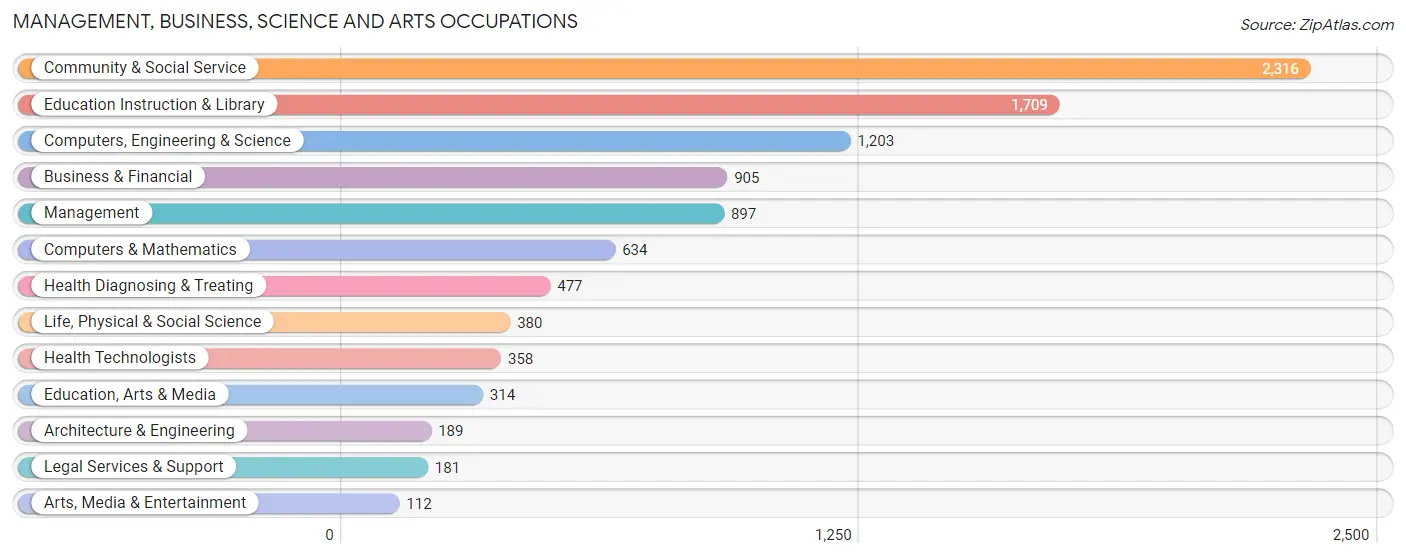
Management, Business, Science and Arts Occupations
The most common Management, Business, Science and Arts occupations in Highland Park borough are Community & Social Service (2,316 | 27.0%), Education Instruction & Library (1,709 | 19.9%), Computers, Engineering & Science (1,203 | 14.0%), Business & Financial (905 | 10.5%), and Management (897 | 10.4%).
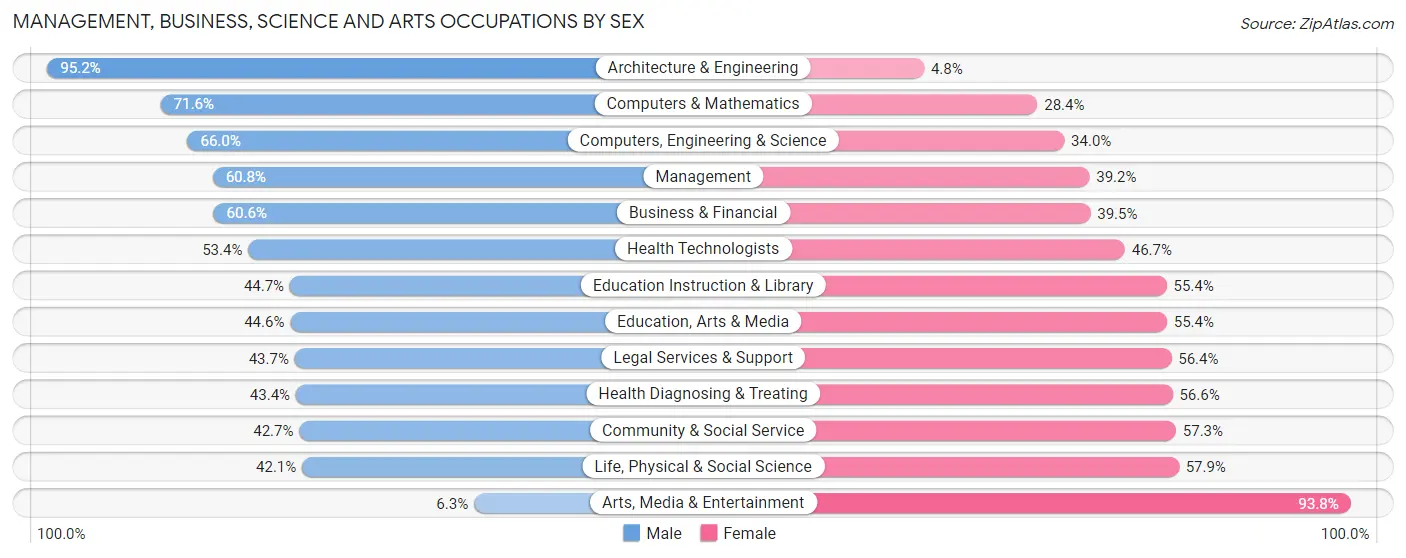
Management, Business, Science and Arts Occupations by Sex
Within the Management, Business, Science and Arts occupations in Highland Park borough, the most male-oriented occupations are Architecture & Engineering (95.2%), Computers & Mathematics (71.6%), and Computers, Engineering & Science (66.0%), while the most female-oriented occupations are Arts, Media & Entertainment (93.8%), Life, Physical & Social Science (57.9%), and Community & Social Service (57.3%).
| Occupation | Male | Female |
| Management | 545 (60.8%) | 352 (39.2%) |
| Business & Financial | 548 (60.6%) | 357 (39.5%) |
| Computers, Engineering & Science | 794 (66.0%) | 409 (34.0%) |
| Computers & Mathematics | 454 (71.6%) | 180 (28.4%) |
| Architecture & Engineering | 180 (95.2%) | 9 (4.8%) |
| Life, Physical & Social Science | 160 (42.1%) | 220 (57.9%) |
| Community & Social Service | 989 (42.7%) | 1,327 (57.3%) |
| Education, Arts & Media | 140 (44.6%) | 174 (55.4%) |
| Legal Services & Support | 79 (43.6%) | 102 (56.4%) |
| Education Instruction & Library | 763 (44.7%) | 946 (55.3%) |
| Arts, Media & Entertainment | 7 (6.2%) | 105 (93.8%) |
| Health Diagnosing & Treating | 207 (43.4%) | 270 (56.6%) |
| Health Technologists | 191 (53.3%) | 167 (46.7%) |
| Total (Category) | 3,083 (53.2%) | 2,715 (46.8%) |
| Total (Overall) | 4,416 (51.4%) | 4,171 (48.6%) |
Services Occupations
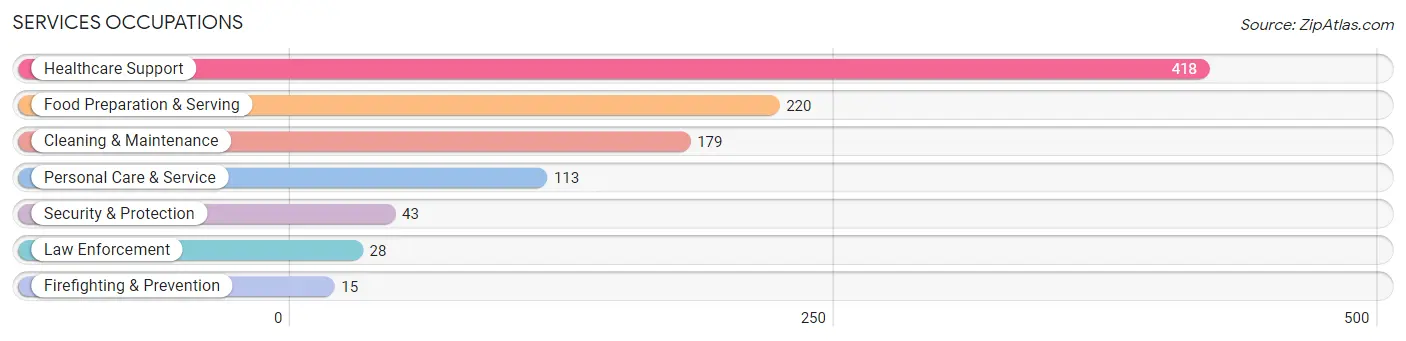
The most common Services occupations in Highland Park borough are Healthcare Support (418 | 4.9%), Food Preparation & Serving (220 | 2.6%), Cleaning & Maintenance (179 | 2.1%), Personal Care & Service (113 | 1.3%), and Security & Protection (43 | 0.5%).
Services Occupations by Sex
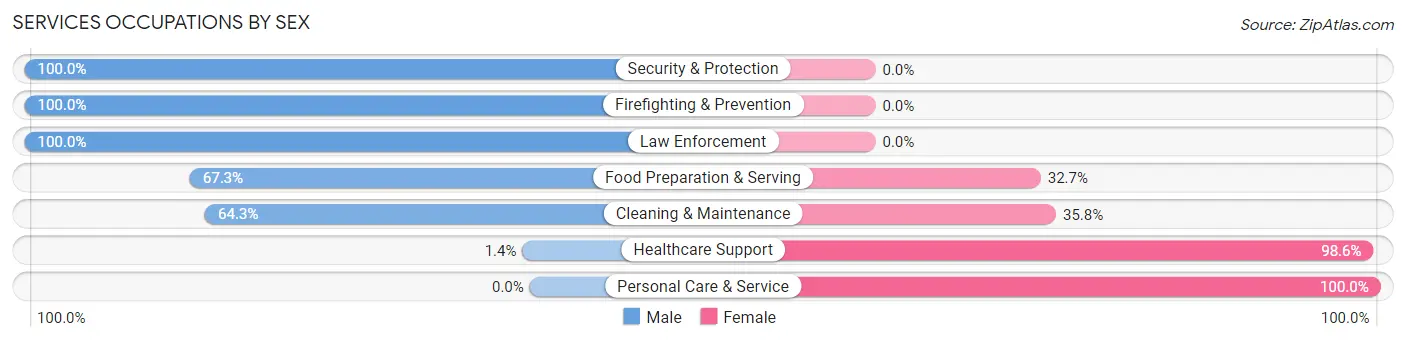
Within the Services occupations in Highland Park borough, the most male-oriented occupations are Security & Protection (100.0%), Firefighting & Prevention (100.0%), and Law Enforcement (100.0%), while the most female-oriented occupations are Personal Care & Service (100.0%), Healthcare Support (98.6%), and Cleaning & Maintenance (35.7%).
| Occupation | Male | Female |
| Healthcare Support | 6 (1.4%) | 412 (98.6%) |
| Security & Protection | 43 (100.0%) | 0 (0.0%) |
| Firefighting & Prevention | 15 (100.0%) | 0 (0.0%) |
| Law Enforcement | 28 (100.0%) | 0 (0.0%) |
| Food Preparation & Serving | 148 (67.3%) | 72 (32.7%) |
| Cleaning & Maintenance | 115 (64.2%) | 64 (35.7%) |
| Personal Care & Service | 0 (0.0%) | 113 (100.0%) |
| Total (Category) | 312 (32.1%) | 661 (67.9%) |
| Total (Overall) | 4,416 (51.4%) | 4,171 (48.6%) |
Sales and Office Occupations
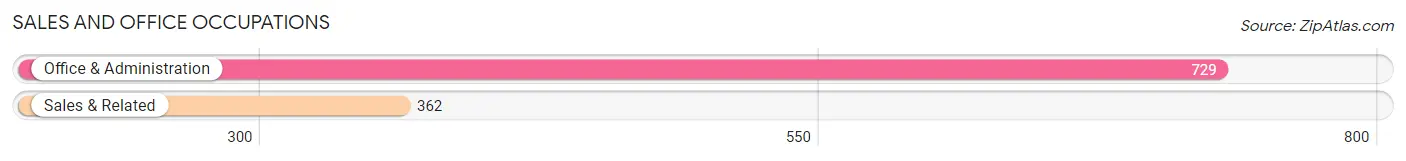
The most common Sales and Office occupations in Highland Park borough are Office & Administration (729 | 8.5%), and Sales & Related (362 | 4.2%).
Sales and Office Occupations by Sex
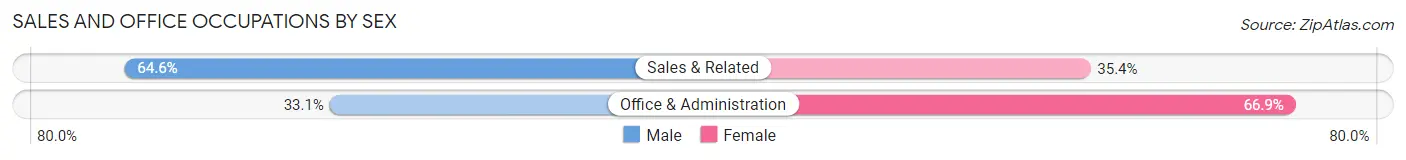
| Occupation | Male | Female |
| Sales & Related | 234 (64.6%) | 128 (35.4%) |
| Office & Administration | 241 (33.1%) | 488 (66.9%) |
| Total (Category) | 475 (43.5%) | 616 (56.5%) |
| Total (Overall) | 4,416 (51.4%) | 4,171 (48.6%) |
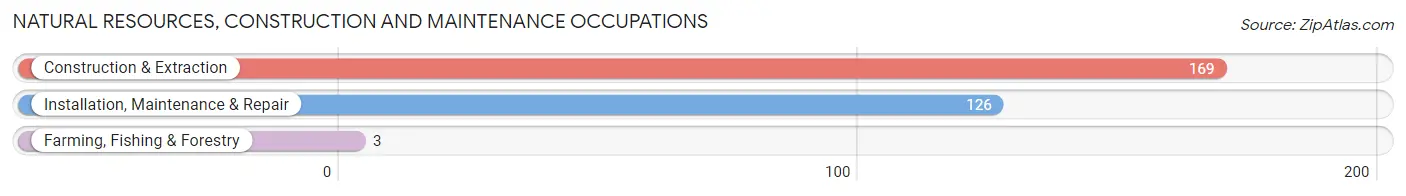
Natural Resources, Construction and Maintenance Occupations
The most common Natural Resources, Construction and Maintenance occupations in Highland Park borough are Construction & Extraction (169 | 2.0%), Installation, Maintenance & Repair (126 | 1.5%), and Farming, Fishing & Forestry (3 | 0.0%).
Natural Resources, Construction and Maintenance Occupations by Sex
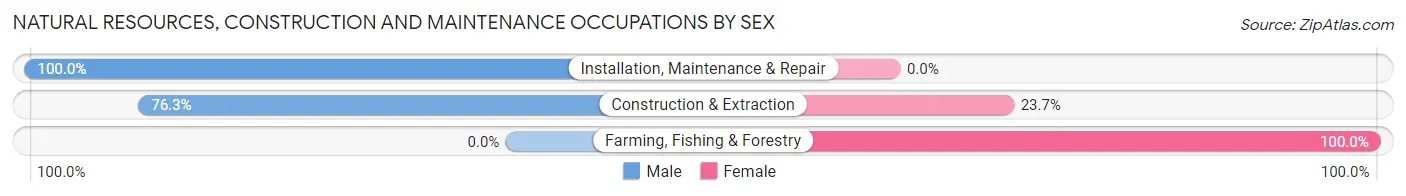
| Occupation | Male | Female |
| Farming, Fishing & Forestry | 0 (0.0%) | 3 (100.0%) |
| Construction & Extraction | 129 (76.3%) | 40 (23.7%) |
| Installation, Maintenance & Repair | 126 (100.0%) | 0 (0.0%) |
| Total (Category) | 255 (85.6%) | 43 (14.4%) |
| Total (Overall) | 4,416 (51.4%) | 4,171 (48.6%) |
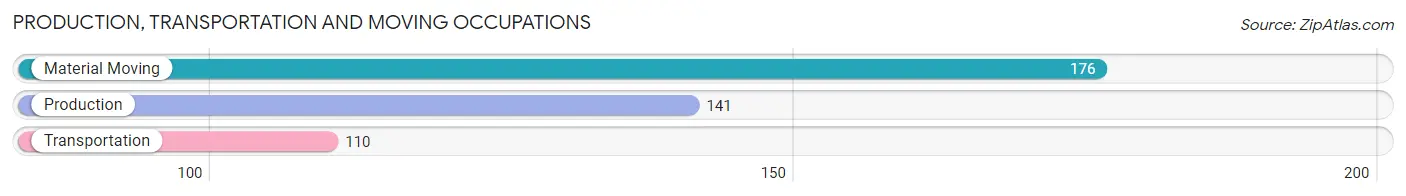
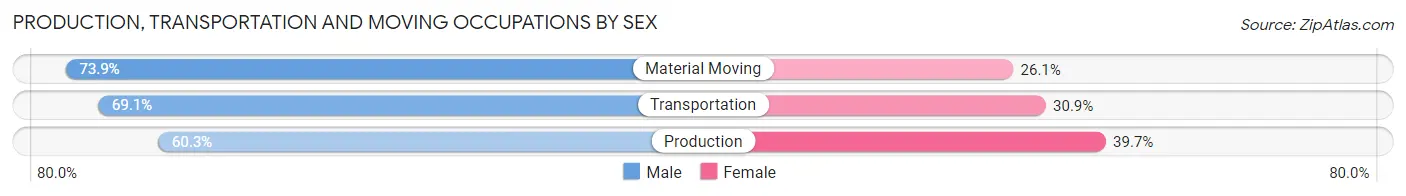
Production, Transportation and Moving Occupations
The most common Production, Transportation and Moving occupations in Highland Park borough are Material Moving (176 | 2.1%), Production (141 | 1.6%), and Transportation (110 | 1.3%).
Production, Transportation and Moving Occupations by Sex
| Occupation | Male | Female |
| Production | 85 (60.3%) | 56 (39.7%) |
| Transportation | 76 (69.1%) | 34 (30.9%) |
| Material Moving | 130 (73.9%) | 46 (26.1%) |
| Total (Category) | 291 (68.1%) | 136 (31.9%) |
| Total (Overall) | 4,416 (51.4%) | 4,171 (48.6%) |
Employment Industries by Sex in Highland Park borough
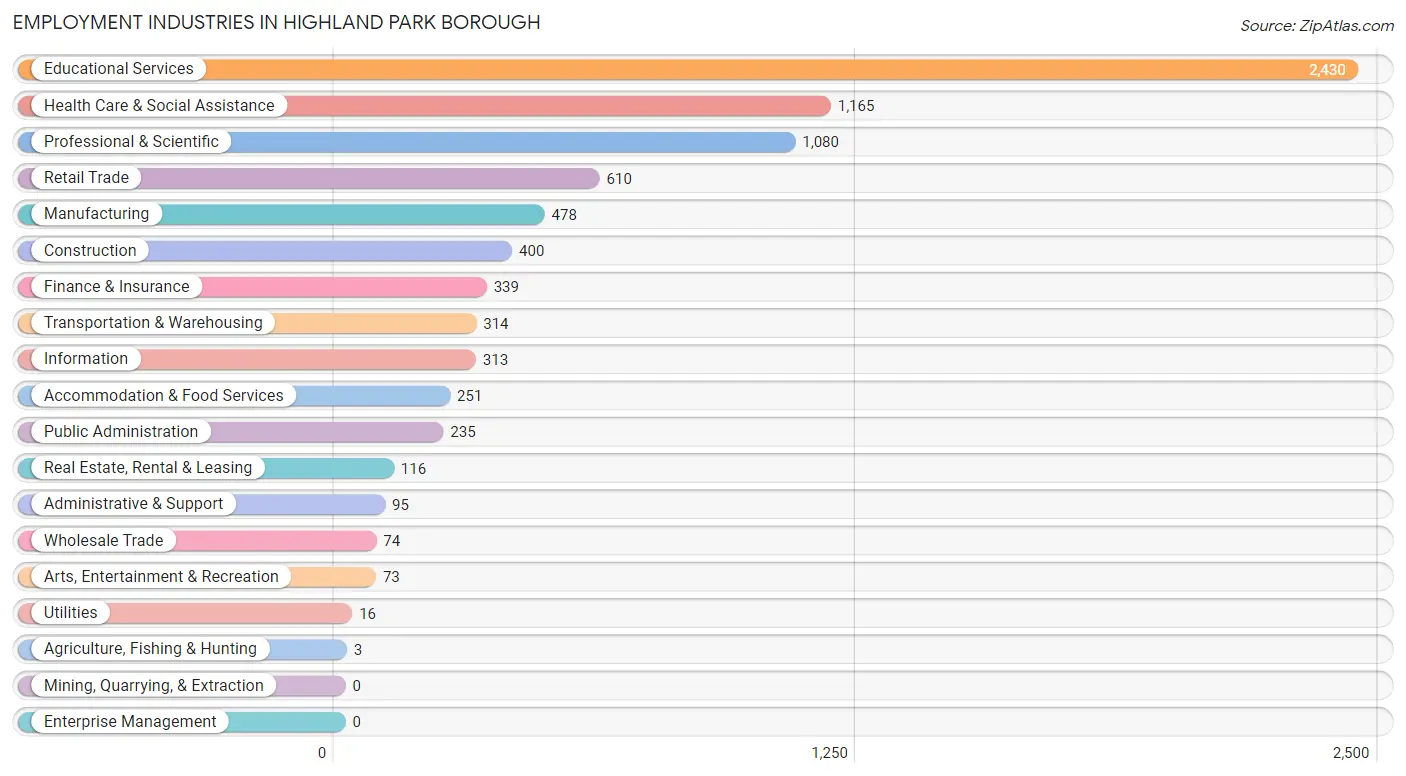
Employment Industries in Highland Park borough
The major employment industries in Highland Park borough include Educational Services (2,430 | 28.3%), Health Care & Social Assistance (1,165 | 13.6%), Professional & Scientific (1,080 | 12.6%), Retail Trade (610 | 7.1%), and Manufacturing (478 | 5.6%).
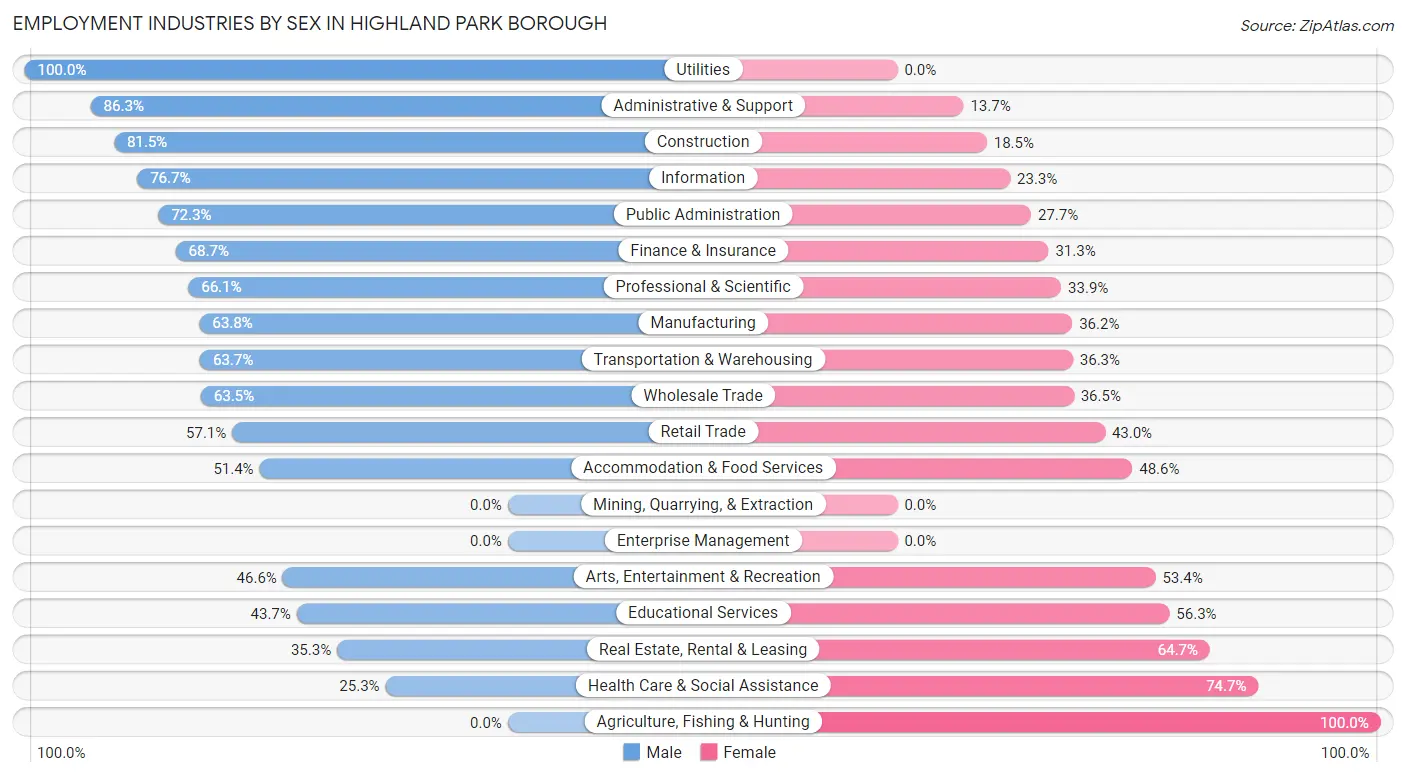
Employment Industries by Sex in Highland Park borough
The Highland Park borough industries that see more men than women are Utilities (100.0%), Administrative & Support (86.3%), and Construction (81.5%), whereas the industries that tend to have a higher number of women are Agriculture, Fishing & Hunting (100.0%), Health Care & Social Assistance (74.7%), and Real Estate, Rental & Leasing (64.7%).
| Industry | Male | Female |
| Agriculture, Fishing & Hunting | 0 (0.0%) | 3 (100.0%) |
| Mining, Quarrying, & Extraction | 0 (0.0%) | 0 (0.0%) |
| Construction | 326 (81.5%) | 74 (18.5%) |
| Manufacturing | 305 (63.8%) | 173 (36.2%) |
| Wholesale Trade | 47 (63.5%) | 27 (36.5%) |
| Retail Trade | 348 (57.1%) | 262 (42.9%) |
| Transportation & Warehousing | 200 (63.7%) | 114 (36.3%) |
| Utilities | 16 (100.0%) | 0 (0.0%) |
| Information | 240 (76.7%) | 73 (23.3%) |
| Finance & Insurance | 233 (68.7%) | 106 (31.3%) |
| Real Estate, Rental & Leasing | 41 (35.3%) | 75 (64.7%) |
| Professional & Scientific | 714 (66.1%) | 366 (33.9%) |
| Enterprise Management | 0 (0.0%) | 0 (0.0%) |
| Administrative & Support | 82 (86.3%) | 13 (13.7%) |
| Educational Services | 1,062 (43.7%) | 1,368 (56.3%) |
| Health Care & Social Assistance | 295 (25.3%) | 870 (74.7%) |
| Arts, Entertainment & Recreation | 34 (46.6%) | 39 (53.4%) |
| Accommodation & Food Services | 129 (51.4%) | 122 (48.6%) |
| Public Administration | 170 (72.3%) | 65 (27.7%) |
| Total | 4,416 (51.4%) | 4,171 (48.6%) |
Education in Highland Park borough
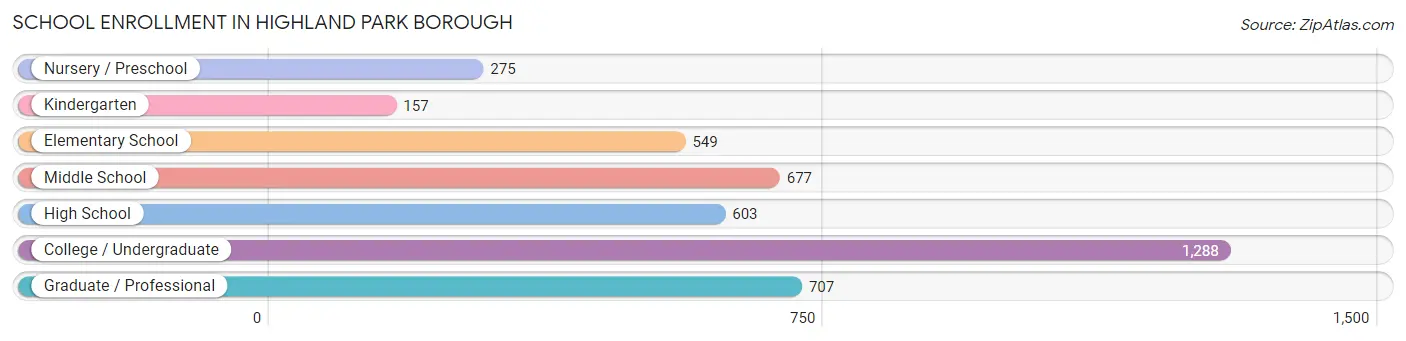
School Enrollment in Highland Park borough
The most common levels of schooling among the 4,256 students in Highland Park borough are college / undergraduate (1,288 | 30.3%), graduate / professional (707 | 16.6%), and middle school (677 | 15.9%).
| School Level | # Students | % Students |
| Nursery / Preschool | 275 | 6.5% |
| Kindergarten | 157 | 3.7% |
| Elementary School | 549 | 12.9% |
| Middle School | 677 | 15.9% |
| High School | 603 | 14.2% |
| College / Undergraduate | 1,288 | 30.3% |
| Graduate / Professional | 707 | 16.6% |
| Total | 4,256 | 100.0% |
School Enrollment by Age by Funding Source in Highland Park borough
Out of a total of 4,256 students who are enrolled in schools in Highland Park borough, 958 (22.5%) attend a private institution, while the remaining 3,298 (77.5%) are enrolled in public schools. The age group of 3 to 4 year olds has the highest likelihood of being enrolled in private schools, with 174 (96.7% in the age bracket) enrolled. Conversely, the age group of 18 to 19 year olds has the lowest likelihood of being enrolled in a private school, with 204 (90.7% in the age bracket) attending a public institution.
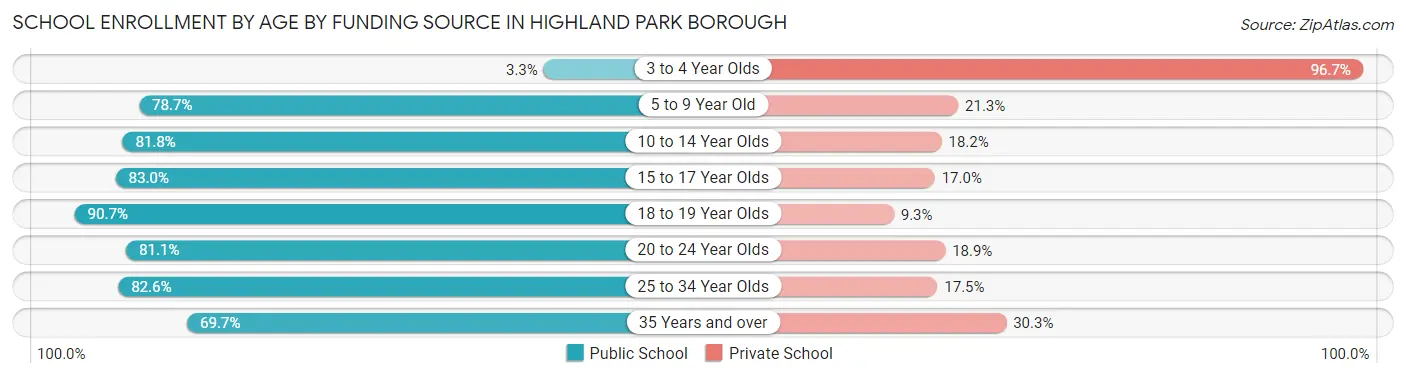
| Age Bracket | Public School | Private School |
| 3 to 4 Year Olds | 6 (3.3%) | 174 (96.7%) |
| 5 to 9 Year Old | 620 (78.7%) | 168 (21.3%) |
| 10 to 14 Year Olds | 601 (81.8%) | 134 (18.2%) |
| 15 to 17 Year Olds | 426 (83.0%) | 87 (17.0%) |
| 18 to 19 Year Olds | 204 (90.7%) | 21 (9.3%) |
| 20 to 24 Year Olds | 742 (81.1%) | 173 (18.9%) |
| 25 to 34 Year Olds | 473 (82.6%) | 100 (17.4%) |
| 35 Years and over | 228 (69.7%) | 99 (30.3%) |
| Total | 3,298 (77.5%) | 958 (22.5%) |
Educational Attainment by Field of Study in Highland Park borough
Psychology (958 | 11.3%), social sciences (944 | 11.1%), business (900 | 10.6%), literature & languages (859 | 10.1%), and computers & mathematics (739 | 8.7%) are the most common fields of study among 8,481 individuals in Highland Park borough who have obtained a bachelor's degree or higher.
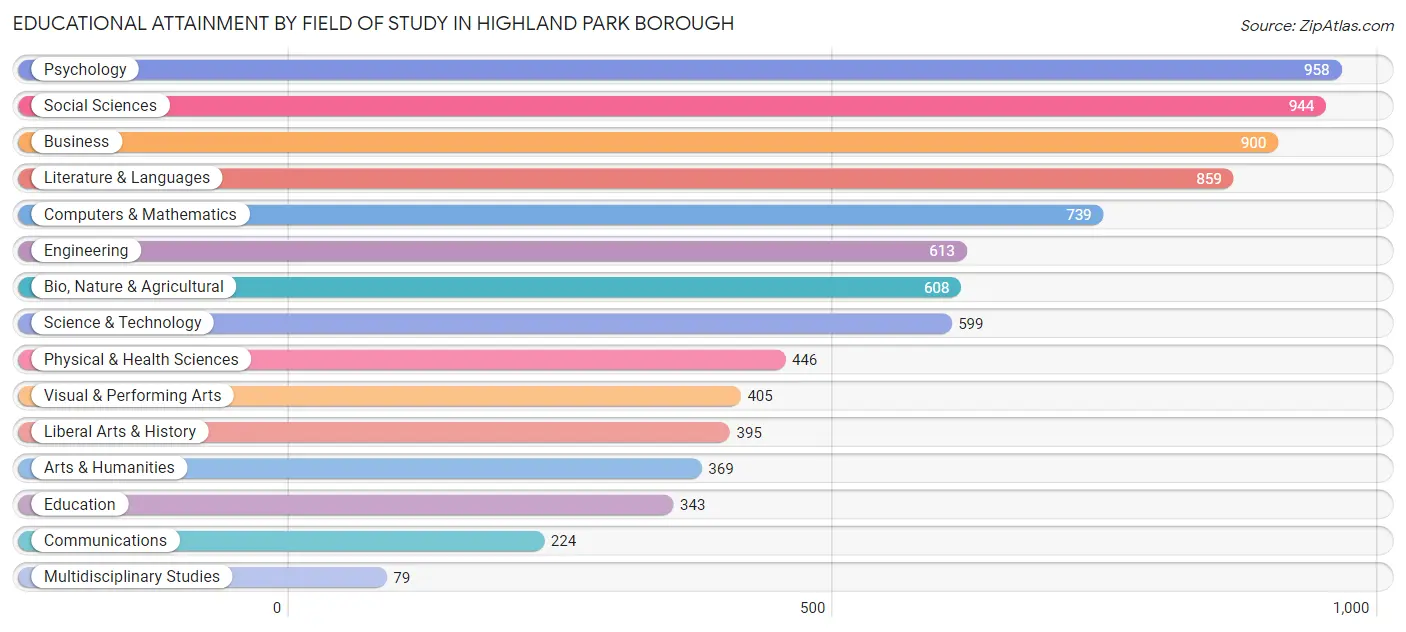
| Field of Study | # Graduates | % Graduates |
| Computers & Mathematics | 739 | 8.7% |
| Bio, Nature & Agricultural | 608 | 7.2% |
| Physical & Health Sciences | 446 | 5.3% |
| Psychology | 958 | 11.3% |
| Social Sciences | 944 | 11.1% |
| Engineering | 613 | 7.2% |
| Multidisciplinary Studies | 79 | 0.9% |
| Science & Technology | 599 | 7.1% |
| Business | 900 | 10.6% |
| Education | 343 | 4.0% |
| Literature & Languages | 859 | 10.1% |
| Liberal Arts & History | 395 | 4.7% |
| Visual & Performing Arts | 405 | 4.8% |
| Communications | 224 | 2.6% |
| Arts & Humanities | 369 | 4.3% |
| Total | 8,481 | 100.0% |
Transportation & Commute in Highland Park borough
Vehicle Availability by Sex in Highland Park borough
The most prevalent vehicle ownership categories in Highland Park borough are males with 2 vehicles (1,941, accounting for 45.4%) and females with 2 vehicles (1,650, making up 48.0%).
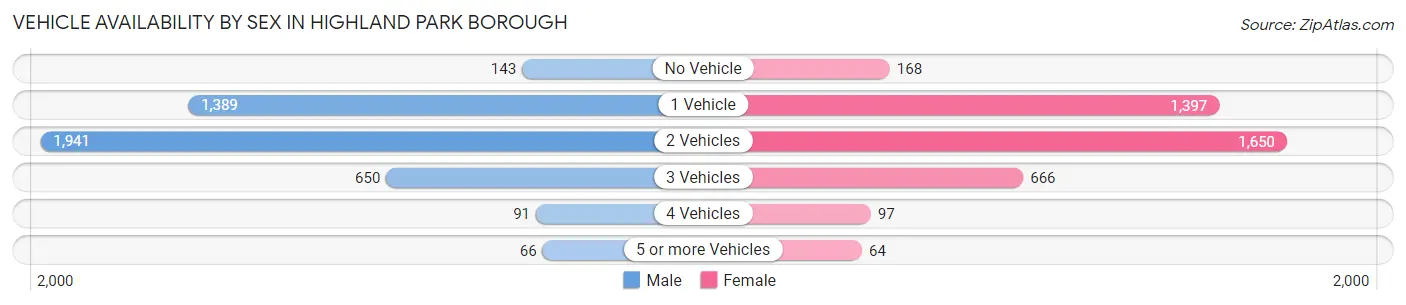
| Vehicles Available | Male | Female |
| No Vehicle | 143 (3.3%) | 168 (4.2%) |
| 1 Vehicle | 1,389 (32.5%) | 1,397 (34.6%) |
| 2 Vehicles | 1,941 (45.4%) | 1,650 (40.8%) |
| 3 Vehicles | 650 (15.2%) | 666 (16.5%) |
| 4 Vehicles | 91 (2.1%) | 97 (2.4%) |
| 5 or more Vehicles | 66 (1.5%) | 64 (1.6%) |
| Total | 4,280 (100.0%) | 4,042 (100.0%) |
Commute Time in Highland Park borough
The most frequently occuring commute durations in Highland Park borough are 15 to 19 minutes (1,353 commuters, 20.2%), 10 to 14 minutes (1,220 commuters, 18.2%), and 5 to 9 minutes (815 commuters, 12.1%).
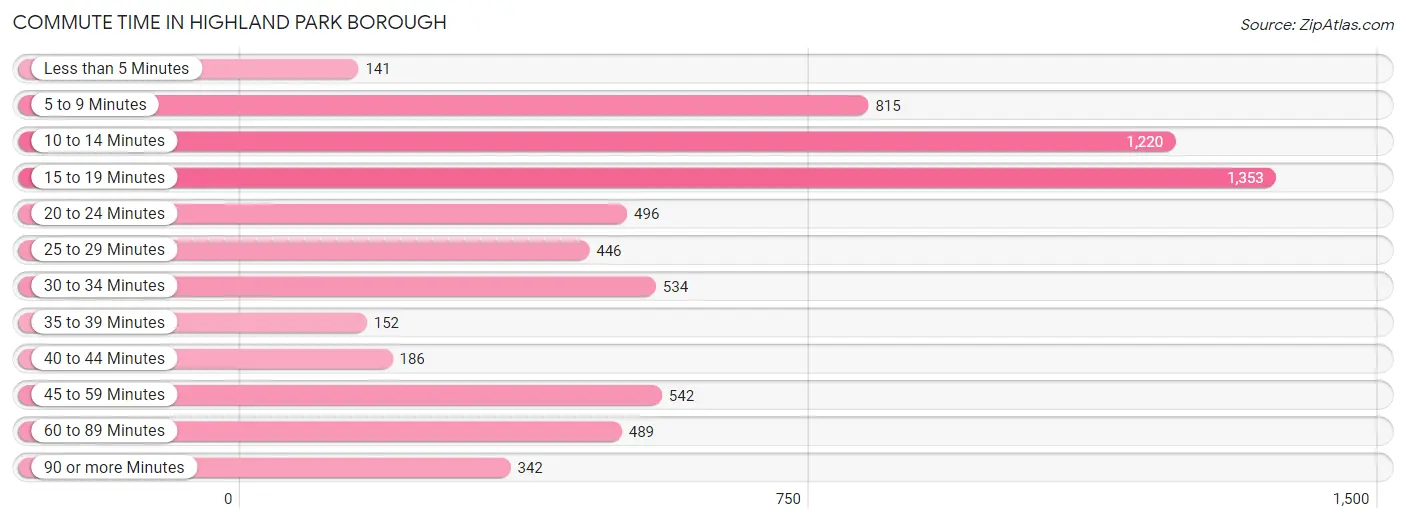
| Commute Time | # Commuters | % Commuters |
| Less than 5 Minutes | 141 | 2.1% |
| 5 to 9 Minutes | 815 | 12.1% |
| 10 to 14 Minutes | 1,220 | 18.2% |
| 15 to 19 Minutes | 1,353 | 20.2% |
| 20 to 24 Minutes | 496 | 7.4% |
| 25 to 29 Minutes | 446 | 6.6% |
| 30 to 34 Minutes | 534 | 8.0% |
| 35 to 39 Minutes | 152 | 2.3% |
| 40 to 44 Minutes | 186 | 2.8% |
| 45 to 59 Minutes | 542 | 8.1% |
| 60 to 89 Minutes | 489 | 7.3% |
| 90 or more Minutes | 342 | 5.1% |
Commute Time by Sex in Highland Park borough
The most common commute times in Highland Park borough are 15 to 19 minutes (903 commuters, 27.5%) for males and 10 to 14 minutes (655 commuters, 19.1%) for females.
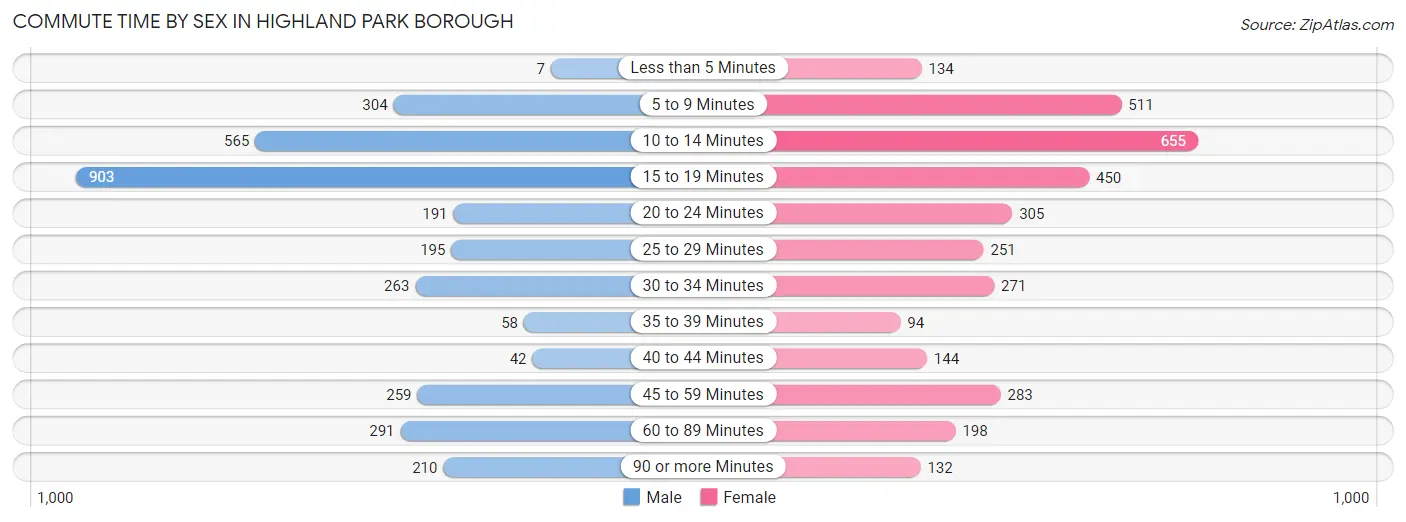
| Commute Time | Male | Female |
| Less than 5 Minutes | 7 (0.2%) | 134 (3.9%) |
| 5 to 9 Minutes | 304 (9.2%) | 511 (14.9%) |
| 10 to 14 Minutes | 565 (17.2%) | 655 (19.1%) |
| 15 to 19 Minutes | 903 (27.5%) | 450 (13.1%) |
| 20 to 24 Minutes | 191 (5.8%) | 305 (8.9%) |
| 25 to 29 Minutes | 195 (5.9%) | 251 (7.3%) |
| 30 to 34 Minutes | 263 (8.0%) | 271 (7.9%) |
| 35 to 39 Minutes | 58 (1.8%) | 94 (2.7%) |
| 40 to 44 Minutes | 42 (1.3%) | 144 (4.2%) |
| 45 to 59 Minutes | 259 (7.9%) | 283 (8.3%) |
| 60 to 89 Minutes | 291 (8.8%) | 198 (5.8%) |
| 90 or more Minutes | 210 (6.4%) | 132 (3.8%) |
Time of Departure to Work by Sex in Highland Park borough
The most frequent times of departure to work in Highland Park borough are 8:00 AM to 8:29 AM (657, 20.0%) for males and 9:00 AM to 9:59 AM (599, 17.5%) for females.
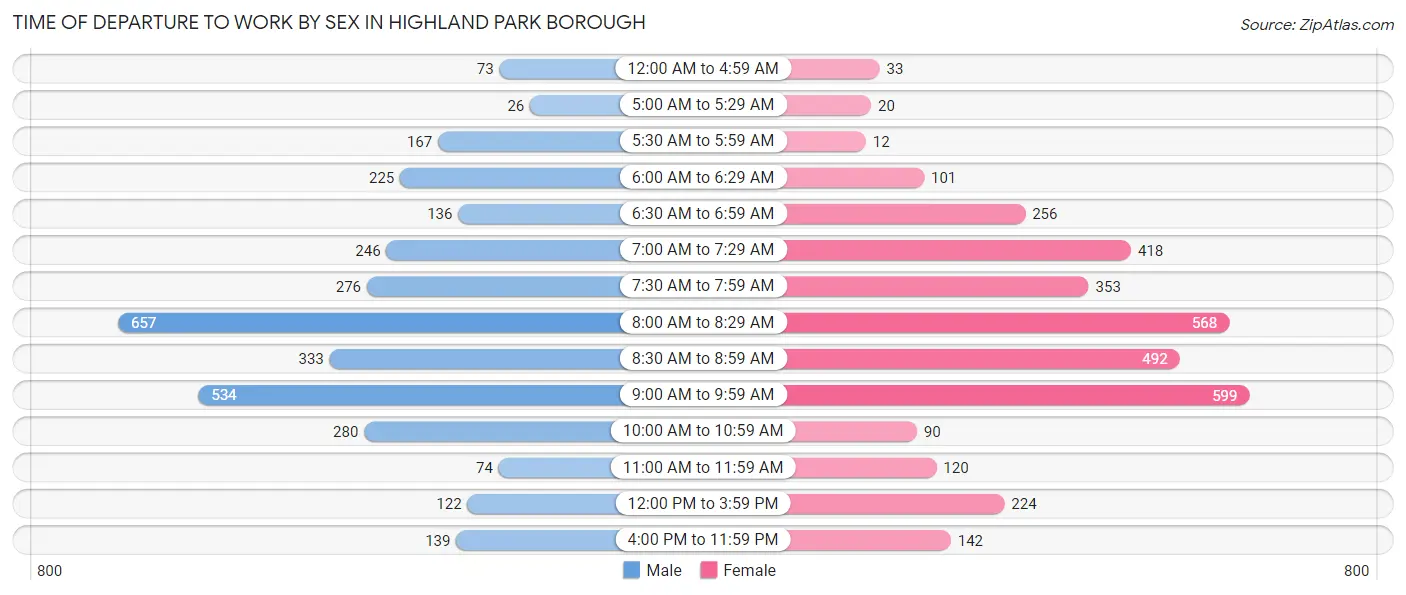
| Time of Departure | Male | Female |
| 12:00 AM to 4:59 AM | 73 (2.2%) | 33 (1.0%) |
| 5:00 AM to 5:29 AM | 26 (0.8%) | 20 (0.6%) |
| 5:30 AM to 5:59 AM | 167 (5.1%) | 12 (0.4%) |
| 6:00 AM to 6:29 AM | 225 (6.8%) | 101 (2.9%) |
| 6:30 AM to 6:59 AM | 136 (4.1%) | 256 (7.5%) |
| 7:00 AM to 7:29 AM | 246 (7.5%) | 418 (12.2%) |
| 7:30 AM to 7:59 AM | 276 (8.4%) | 353 (10.3%) |
| 8:00 AM to 8:29 AM | 657 (20.0%) | 568 (16.6%) |
| 8:30 AM to 8:59 AM | 333 (10.1%) | 492 (14.3%) |
| 9:00 AM to 9:59 AM | 534 (16.2%) | 599 (17.5%) |
| 10:00 AM to 10:59 AM | 280 (8.5%) | 90 (2.6%) |
| 11:00 AM to 11:59 AM | 74 (2.2%) | 120 (3.5%) |
| 12:00 PM to 3:59 PM | 122 (3.7%) | 224 (6.5%) |
| 4:00 PM to 11:59 PM | 139 (4.2%) | 142 (4.1%) |
| Total | 3,288 (100.0%) | 3,428 (100.0%) |
Housing Occupancy in Highland Park borough
Occupancy by Ownership in Highland Park borough
Of the total 6,547 dwellings in Highland Park borough, owner-occupied units account for 2,512 (38.4%), while renter-occupied units make up 4,035 (61.6%).
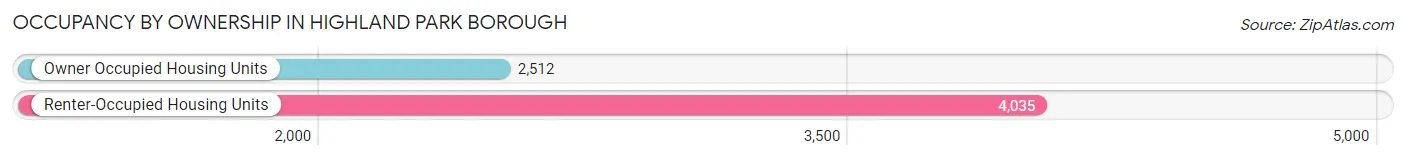
| Occupancy | # Housing Units | % Housing Units |
| Owner Occupied Housing Units | 2,512 | 38.4% |
| Renter-Occupied Housing Units | 4,035 | 61.6% |
| Total Occupied Housing Units | 6,547 | 100.0% |
Occupancy by Household Size in Highland Park borough
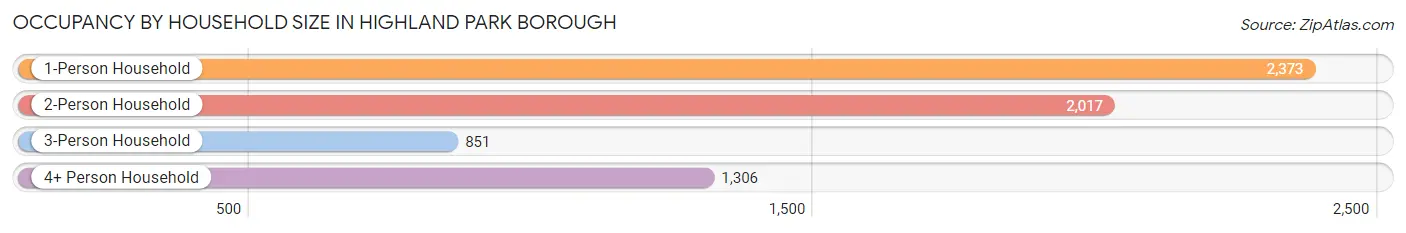
| Household Size | # Housing Units | % Housing Units |
| 1-Person Household | 2,373 | 36.2% |
| 2-Person Household | 2,017 | 30.8% |
| 3-Person Household | 851 | 13.0% |
| 4+ Person Household | 1,306 | 20.0% |
| Total Housing Units | 6,547 | 100.0% |
Occupancy by Ownership by Household Size in Highland Park borough
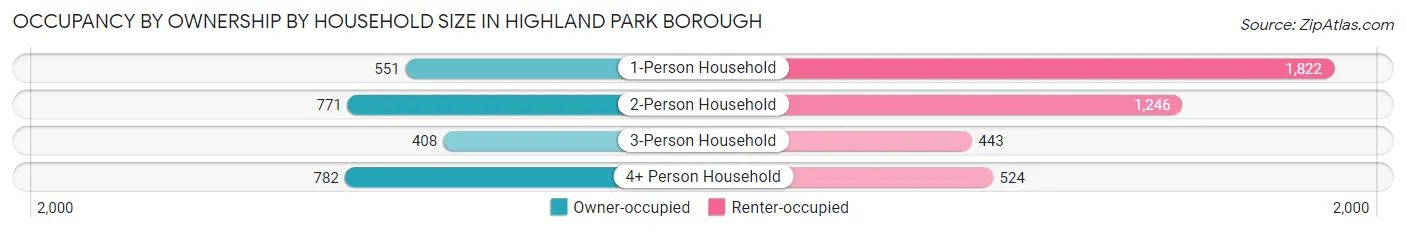
| Household Size | Owner-occupied | Renter-occupied |
| 1-Person Household | 551 (23.2%) | 1,822 (76.8%) |
| 2-Person Household | 771 (38.2%) | 1,246 (61.8%) |
| 3-Person Household | 408 (47.9%) | 443 (52.1%) |
| 4+ Person Household | 782 (59.9%) | 524 (40.1%) |
| Total Housing Units | 2,512 (38.4%) | 4,035 (61.6%) |
Occupancy by Educational Attainment in Highland Park borough
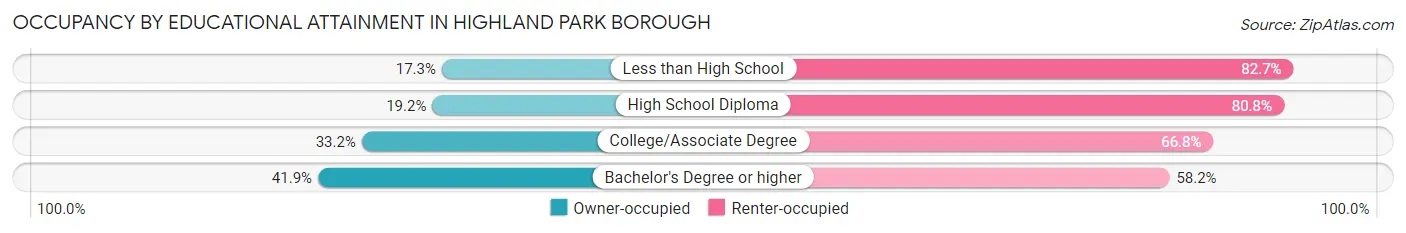
| Household Size | Owner-occupied | Renter-occupied |
| Less than High School | 33 (17.3%) | 158 (82.7%) |
| High School Diploma | 93 (19.2%) | 392 (80.8%) |
| College/Associate Degree | 271 (33.2%) | 546 (66.8%) |
| Bachelor's Degree or higher | 2,115 (41.8%) | 2,939 (58.2%) |
Occupancy by Age of Householder in Highland Park borough
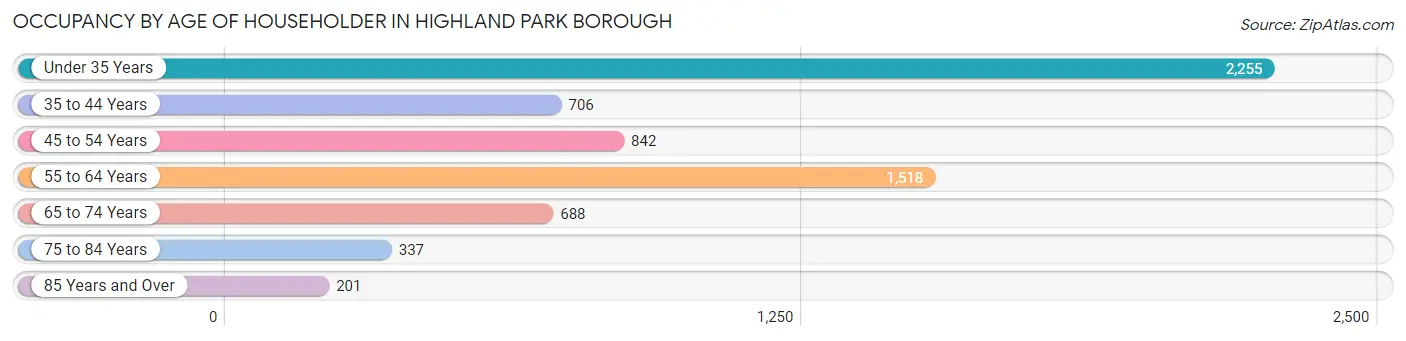
| Age Bracket | # Households | % Households |
| Under 35 Years | 2,255 | 34.4% |
| 35 to 44 Years | 706 | 10.8% |
| 45 to 54 Years | 842 | 12.9% |
| 55 to 64 Years | 1,518 | 23.2% |
| 65 to 74 Years | 688 | 10.5% |
| 75 to 84 Years | 337 | 5.1% |
| 85 Years and Over | 201 | 3.1% |
| Total | 6,547 | 100.0% |
Housing Finances in Highland Park borough
Median Income by Occupancy in Highland Park borough
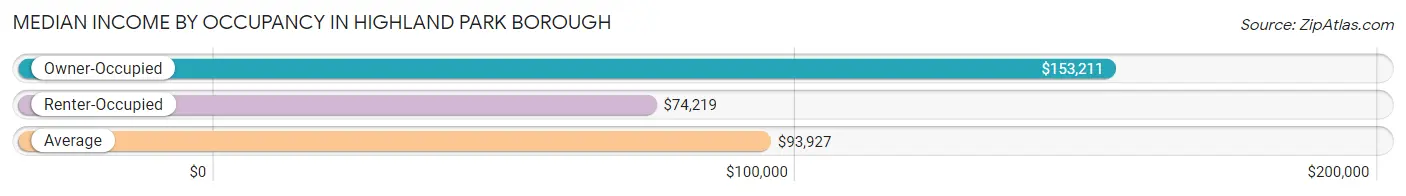
| Occupancy Type | # Households | Median Income |
| Owner-Occupied | 2,512 (38.4%) | $153,211 |
| Renter-Occupied | 4,035 (61.6%) | $74,219 |
| Average | 6,547 (100.0%) | $93,927 |
Occupancy by Householder Income Bracket in Highland Park borough
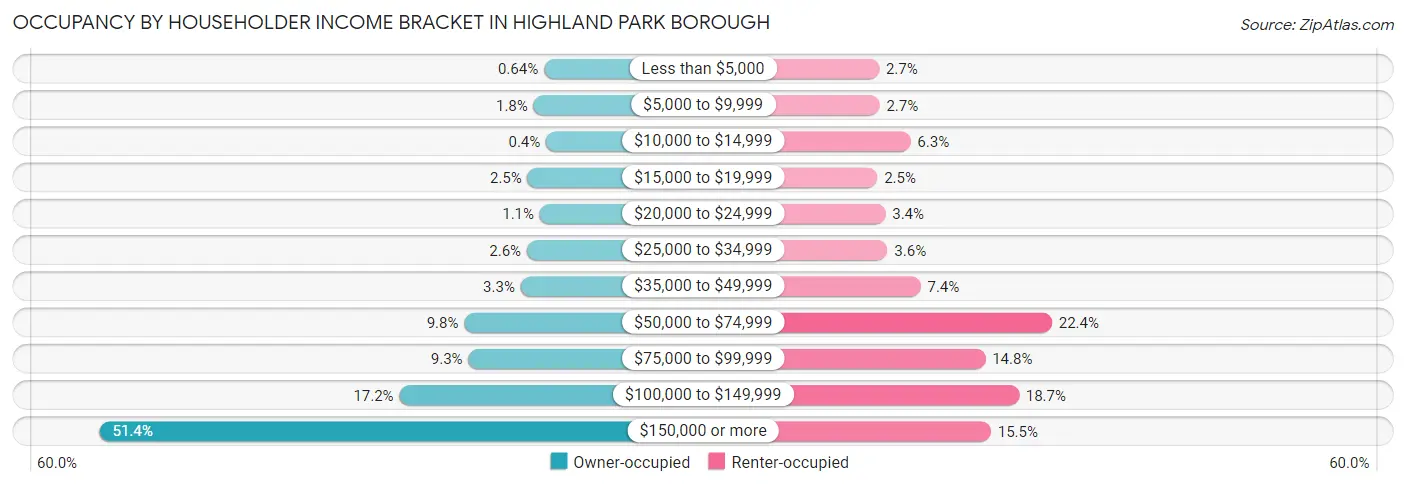
| Income Bracket | Owner-occupied | Renter-occupied |
| Less than $5,000 | 16 (0.6%) | 108 (2.7%) |
| $5,000 to $9,999 | 46 (1.8%) | 110 (2.7%) |
| $10,000 to $14,999 | 10 (0.4%) | 253 (6.3%) |
| $15,000 to $19,999 | 63 (2.5%) | 100 (2.5%) |
| $20,000 to $24,999 | 28 (1.1%) | 137 (3.4%) |
| $25,000 to $34,999 | 65 (2.6%) | 147 (3.6%) |
| $35,000 to $49,999 | 83 (3.3%) | 300 (7.4%) |
| $50,000 to $74,999 | 245 (9.8%) | 905 (22.4%) |
| $75,000 to $99,999 | 233 (9.3%) | 598 (14.8%) |
| $100,000 to $149,999 | 431 (17.2%) | 753 (18.7%) |
| $150,000 or more | 1,292 (51.4%) | 624 (15.5%) |
| Total | 2,512 (100.0%) | 4,035 (100.0%) |
Monthly Housing Cost Tiers in Highland Park borough
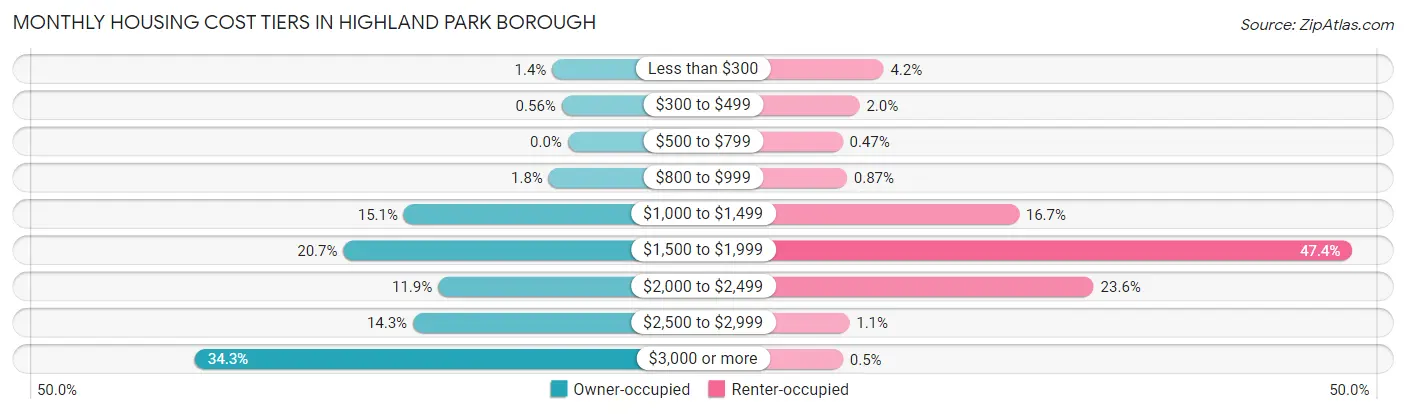
| Monthly Cost | Owner-occupied | Renter-occupied |
| Less than $300 | 36 (1.4%) | 171 (4.2%) |
| $300 to $499 | 14 (0.6%) | 82 (2.0%) |
| $500 to $799 | 0 (0.0%) | 19 (0.5%) |
| $800 to $999 | 44 (1.8%) | 35 (0.9%) |
| $1,000 to $1,499 | 379 (15.1%) | 674 (16.7%) |
| $1,500 to $1,999 | 519 (20.7%) | 1,912 (47.4%) |
| $2,000 to $2,499 | 300 (11.9%) | 952 (23.6%) |
| $2,500 to $2,999 | 358 (14.2%) | 44 (1.1%) |
| $3,000 or more | 862 (34.3%) | 20 (0.5%) |
| Total | 2,512 (100.0%) | 4,035 (100.0%) |
Physical Housing Characteristics in Highland Park borough
Housing Structures in Highland Park borough
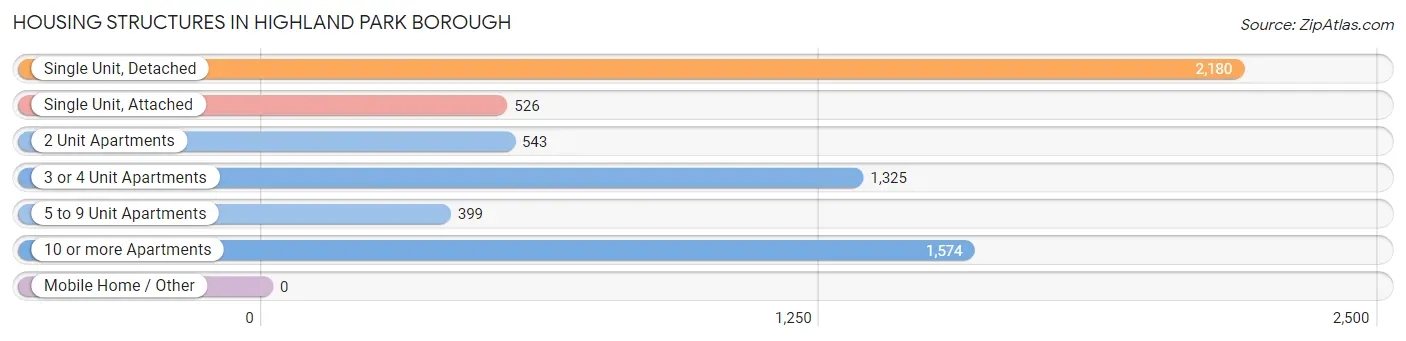
| Structure Type | # Housing Units | % Housing Units |
| Single Unit, Detached | 2,180 | 33.3% |
| Single Unit, Attached | 526 | 8.0% |
| 2 Unit Apartments | 543 | 8.3% |
| 3 or 4 Unit Apartments | 1,325 | 20.2% |
| 5 to 9 Unit Apartments | 399 | 6.1% |
| 10 or more Apartments | 1,574 | 24.0% |
| Mobile Home / Other | 0 | 0.0% |
| Total | 6,547 | 100.0% |
Housing Structures by Occupancy in Highland Park borough
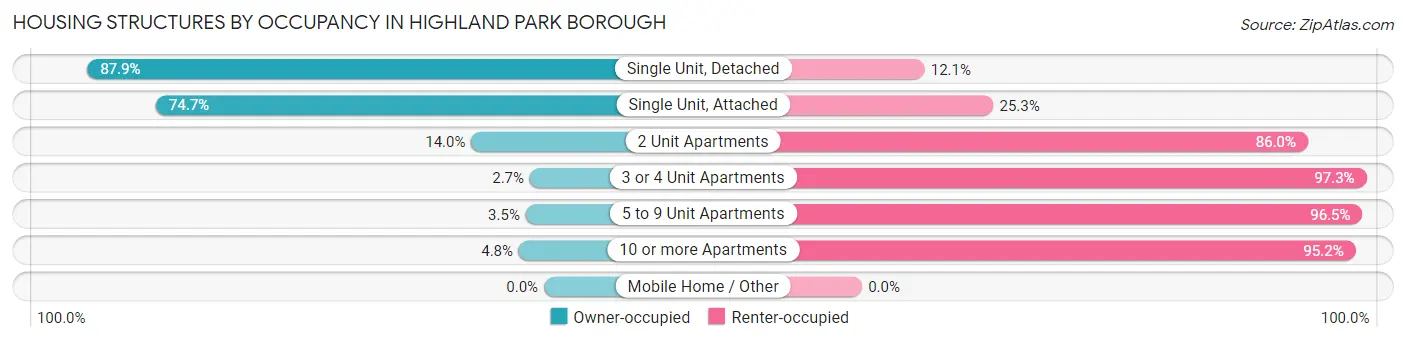
| Structure Type | Owner-occupied | Renter-occupied |
| Single Unit, Detached | 1,917 (87.9%) | 263 (12.1%) |
| Single Unit, Attached | 393 (74.7%) | 133 (25.3%) |
| 2 Unit Apartments | 76 (14.0%) | 467 (86.0%) |
| 3 or 4 Unit Apartments | 36 (2.7%) | 1,289 (97.3%) |
| 5 to 9 Unit Apartments | 14 (3.5%) | 385 (96.5%) |
| 10 or more Apartments | 76 (4.8%) | 1,498 (95.2%) |
| Mobile Home / Other | 0 (0.0%) | 0 (0.0%) |
| Total | 2,512 (38.4%) | 4,035 (61.6%) |
Housing Structures by Number of Rooms in Highland Park borough
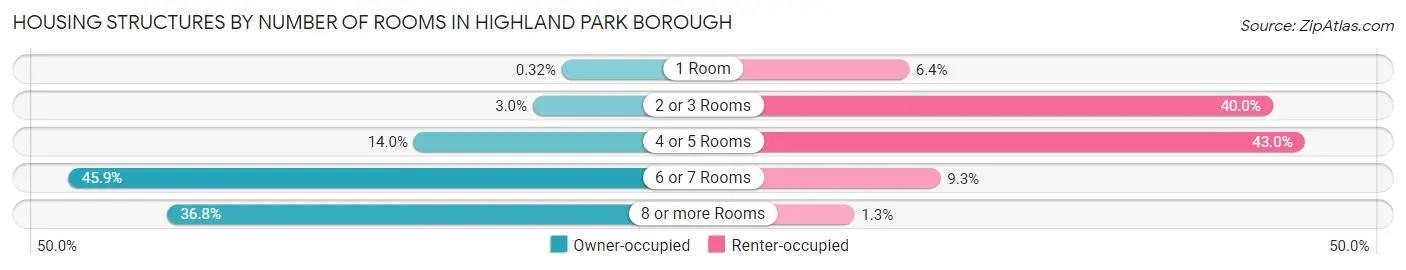
| Number of Rooms | Owner-occupied | Renter-occupied |
| 1 Room | 8 (0.3%) | 257 (6.4%) |
| 2 or 3 Rooms | 75 (3.0%) | 1,615 (40.0%) |
| 4 or 5 Rooms | 352 (14.0%) | 1,734 (43.0%) |
| 6 or 7 Rooms | 1,153 (45.9%) | 375 (9.3%) |
| 8 or more Rooms | 924 (36.8%) | 54 (1.3%) |
| Total | 2,512 (100.0%) | 4,035 (100.0%) |
Housing Structure by Heating Type in Highland Park borough
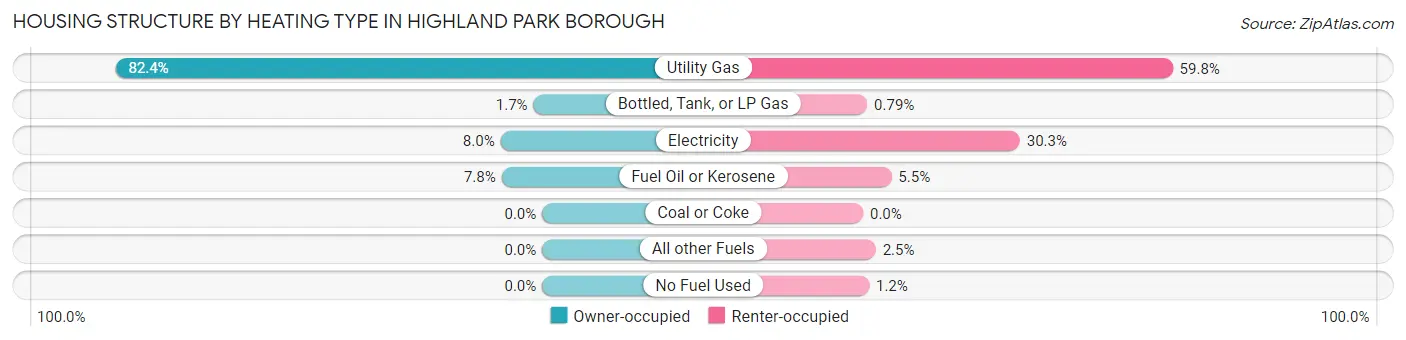
| Heating Type | Owner-occupied | Renter-occupied |
| Utility Gas | 2,071 (82.4%) | 2,414 (59.8%) |
| Bottled, Tank, or LP Gas | 42 (1.7%) | 32 (0.8%) |
| Electricity | 202 (8.0%) | 1,222 (30.3%) |
| Fuel Oil or Kerosene | 197 (7.8%) | 221 (5.5%) |
| Coal or Coke | 0 (0.0%) | 0 (0.0%) |
| All other Fuels | 0 (0.0%) | 99 (2.5%) |
| No Fuel Used | 0 (0.0%) | 47 (1.2%) |
| Total | 2,512 (100.0%) | 4,035 (100.0%) |
Household Vehicle Usage in Highland Park borough
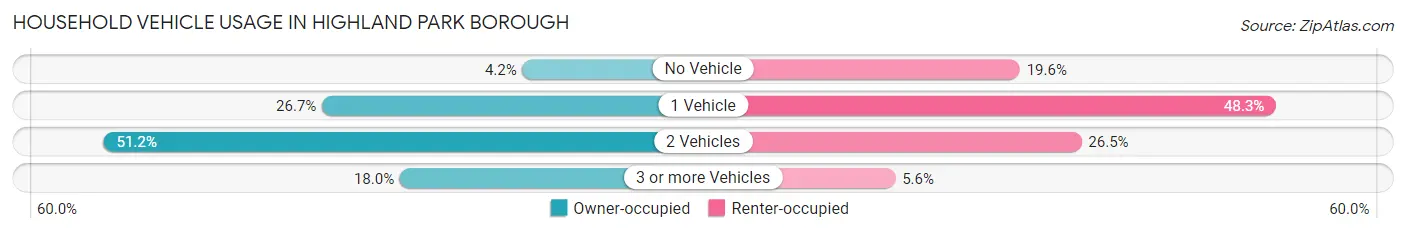
| Vehicles per Household | Owner-occupied | Renter-occupied |
| No Vehicle | 106 (4.2%) | 790 (19.6%) |
| 1 Vehicle | 670 (26.7%) | 1,949 (48.3%) |
| 2 Vehicles | 1,285 (51.1%) | 1,069 (26.5%) |
| 3 or more Vehicles | 451 (17.9%) | 227 (5.6%) |
| Total | 2,512 (100.0%) | 4,035 (100.0%) |
Real Estate & Mortgages in Highland Park borough
Real Estate and Mortgage Overview in Highland Park borough
| Characteristic | Without Mortgage | With Mortgage |
| Housing Units | 899 | 1,613 |
| Median Property Value | $391,400 | $431,700 |
| Median Household Income | $123,854 | $916 |
| Monthly Housing Costs | $1,493 | $856 |
| Real Estate Taxes | $10,001 | $0 |
Property Value by Mortgage Status in Highland Park borough
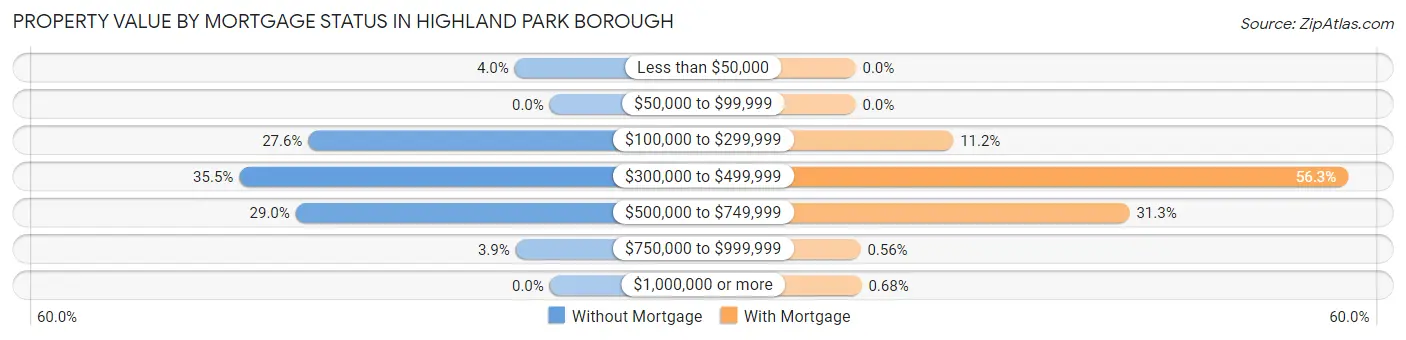
| Property Value | Without Mortgage | With Mortgage |
| Less than $50,000 | 36 (4.0%) | 0 (0.0%) |
| $50,000 to $99,999 | 0 (0.0%) | 0 (0.0%) |
| $100,000 to $299,999 | 248 (27.6%) | 180 (11.2%) |
| $300,000 to $499,999 | 319 (35.5%) | 908 (56.3%) |
| $500,000 to $749,999 | 261 (29.0%) | 505 (31.3%) |
| $750,000 to $999,999 | 35 (3.9%) | 9 (0.6%) |
| $1,000,000 or more | 0 (0.0%) | 11 (0.7%) |
| Total | 899 (100.0%) | 1,613 (100.0%) |
Household Income by Mortgage Status in Highland Park borough
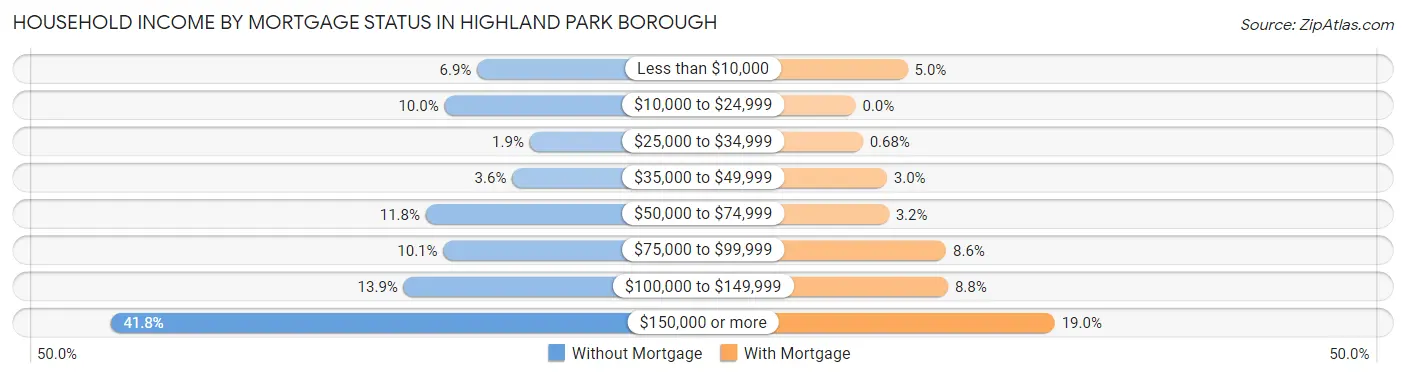
| Household Income | Without Mortgage | With Mortgage |
| Less than $10,000 | 62 (6.9%) | 80 (5.0%) |
| $10,000 to $24,999 | 90 (10.0%) | 0 (0.0%) |
| $25,000 to $34,999 | 17 (1.9%) | 11 (0.7%) |
| $35,000 to $49,999 | 32 (3.6%) | 48 (3.0%) |
| $50,000 to $74,999 | 106 (11.8%) | 51 (3.2%) |
| $75,000 to $99,999 | 91 (10.1%) | 139 (8.6%) |
| $100,000 to $149,999 | 125 (13.9%) | 142 (8.8%) |
| $150,000 or more | 376 (41.8%) | 306 (19.0%) |
| Total | 899 (100.0%) | 1,613 (100.0%) |
Property Value to Household Income Ratio in Highland Park borough
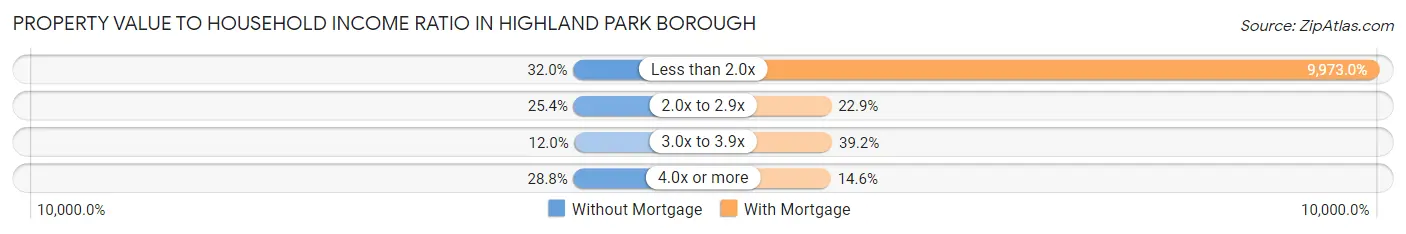
| Value-to-Income Ratio | Without Mortgage | With Mortgage |
| Less than 2.0x | 288 (32.0%) | 160,865 (9,973.0%) |
| 2.0x to 2.9x | 228 (25.4%) | 369 (22.9%) |
| 3.0x to 3.9x | 108 (12.0%) | 632 (39.2%) |
| 4.0x or more | 259 (28.8%) | 235 (14.6%) |
| Total | 899 (100.0%) | 1,613 (100.0%) |
Real Estate Taxes by Mortgage Status in Highland Park borough
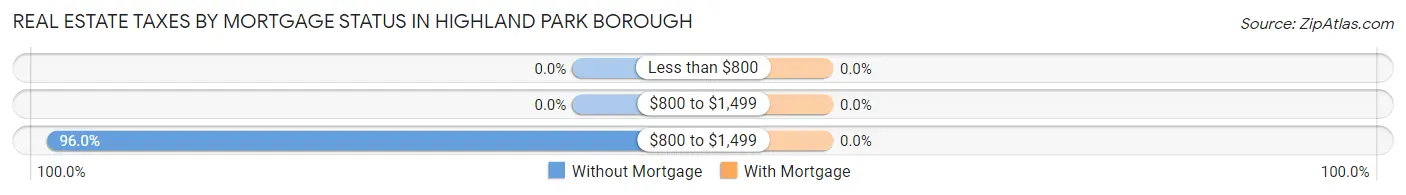
| Property Taxes | Without Mortgage | With Mortgage |
| Less than $800 | 0 (0.0%) | 0 (0.0%) |
| $800 to $1,499 | 0 (0.0%) | 0 (0.0%) |
| $800 to $1,499 | 863 (96.0%) | 0 (0.0%) |
| Total | 899 (100.0%) | 1,613 (100.0%) |
Health & Disability in Highland Park borough
Health Insurance Coverage by Age in Highland Park borough
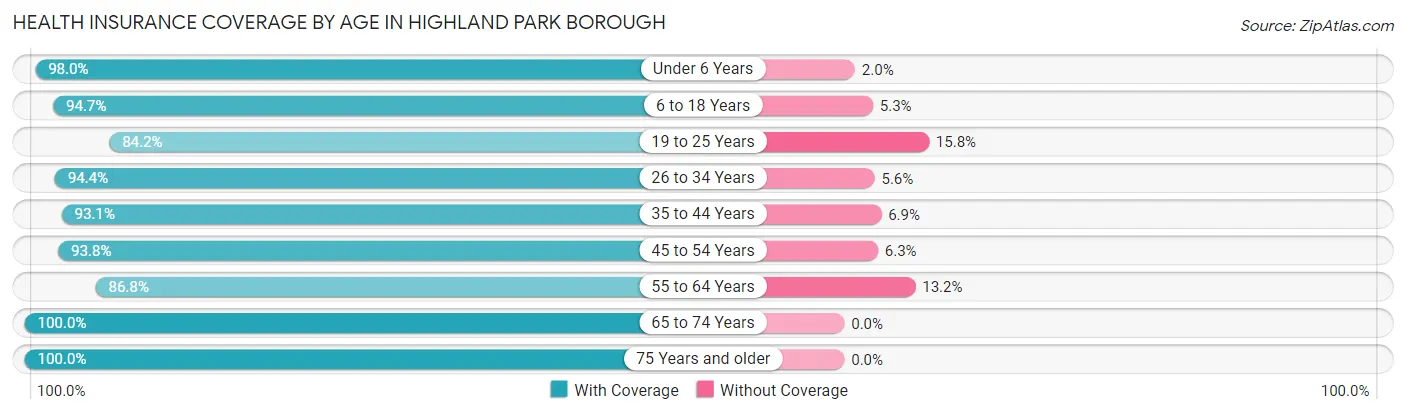
| Age Bracket | With Coverage | Without Coverage |
| Under 6 Years | 744 (98.0%) | 15 (2.0%) |
| 6 to 18 Years | 1,851 (94.7%) | 104 (5.3%) |
| 19 to 25 Years | 1,617 (84.2%) | 303 (15.8%) |
| 26 to 34 Years | 2,947 (94.4%) | 176 (5.6%) |
| 35 to 44 Years | 1,216 (93.1%) | 90 (6.9%) |
| 45 to 54 Years | 1,605 (93.8%) | 107 (6.2%) |
| 55 to 64 Years | 2,143 (86.8%) | 327 (13.2%) |
| 65 to 74 Years | 1,018 (100.0%) | 0 (0.0%) |
| 75 Years and older | 707 (100.0%) | 0 (0.0%) |
| Total | 13,848 (92.5%) | 1,122 (7.5%) |
Health Insurance Coverage by Citizenship Status in Highland Park borough
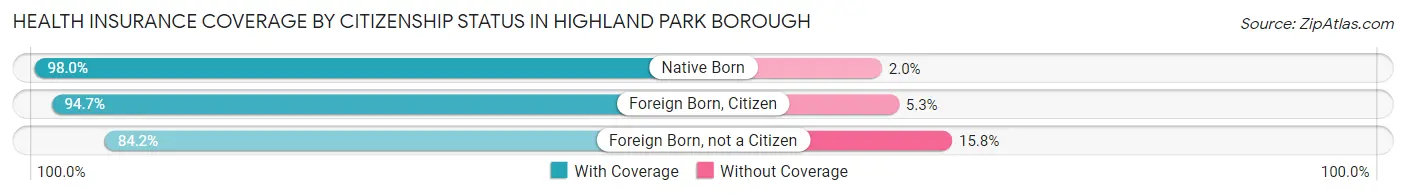
| Citizenship Status | With Coverage | Without Coverage |
| Native Born | 744 (98.0%) | 15 (2.0%) |
| Foreign Born, Citizen | 1,851 (94.7%) | 104 (5.3%) |
| Foreign Born, not a Citizen | 1,617 (84.2%) | 303 (15.8%) |
Health Insurance Coverage by Household Income in Highland Park borough
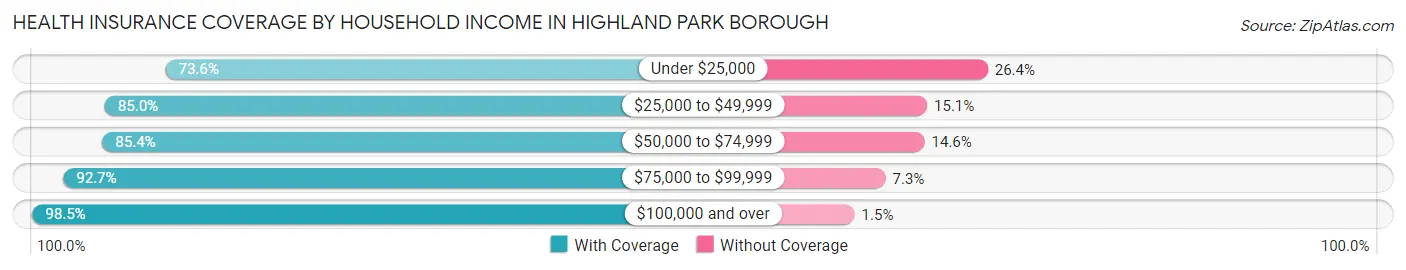
| Household Income | With Coverage | Without Coverage |
| Under $25,000 | 1,190 (73.6%) | 427 (26.4%) |
| $25,000 to $49,999 | 830 (85.0%) | 147 (15.0%) |
| $50,000 to $74,999 | 1,775 (85.4%) | 303 (14.6%) |
| $75,000 to $99,999 | 1,506 (92.7%) | 118 (7.3%) |
| $100,000 and over | 8,538 (98.5%) | 127 (1.5%) |
Public vs Private Health Insurance Coverage by Age in Highland Park borough
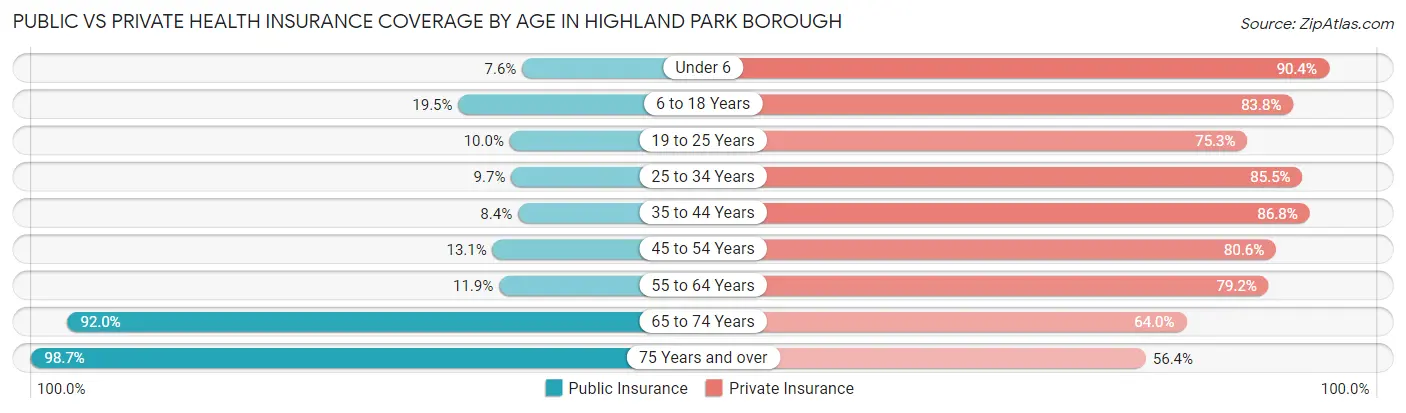
| Age Bracket | Public Insurance | Private Insurance |
| Under 6 | 58 (7.6%) | 686 (90.4%) |
| 6 to 18 Years | 381 (19.5%) | 1,638 (83.8%) |
| 19 to 25 Years | 191 (10.0%) | 1,445 (75.3%) |
| 25 to 34 Years | 302 (9.7%) | 2,670 (85.5%) |
| 35 to 44 Years | 110 (8.4%) | 1,134 (86.8%) |
| 45 to 54 Years | 225 (13.1%) | 1,380 (80.6%) |
| 55 to 64 Years | 295 (11.9%) | 1,957 (79.2%) |
| 65 to 74 Years | 937 (92.0%) | 651 (63.9%) |
| 75 Years and over | 698 (98.7%) | 399 (56.4%) |
| Total | 3,197 (21.4%) | 11,960 (79.9%) |
Disability Status by Sex by Age in Highland Park borough
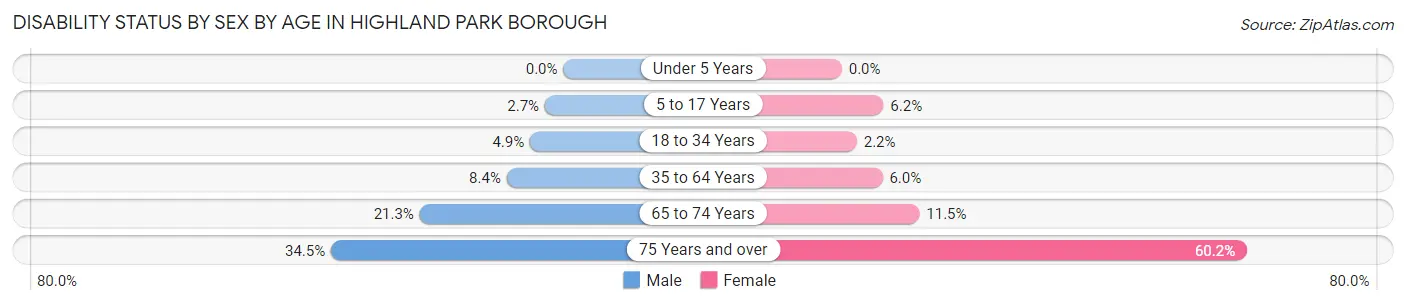
| Age Bracket | Male | Female |
| Under 5 Years | 0 (0.0%) | 0 (0.0%) |
| 5 to 17 Years | 28 (2.7%) | 64 (6.2%) |
| 18 to 34 Years | 119 (4.9%) | 60 (2.2%) |
| 35 to 64 Years | 229 (8.4%) | 167 (6.0%) |
| 65 to 74 Years | 119 (21.3%) | 53 (11.5%) |
| 75 Years and over | 69 (34.5%) | 305 (60.2%) |
Disability Class by Sex by Age in Highland Park borough
Disability Class: Hearing Difficulty
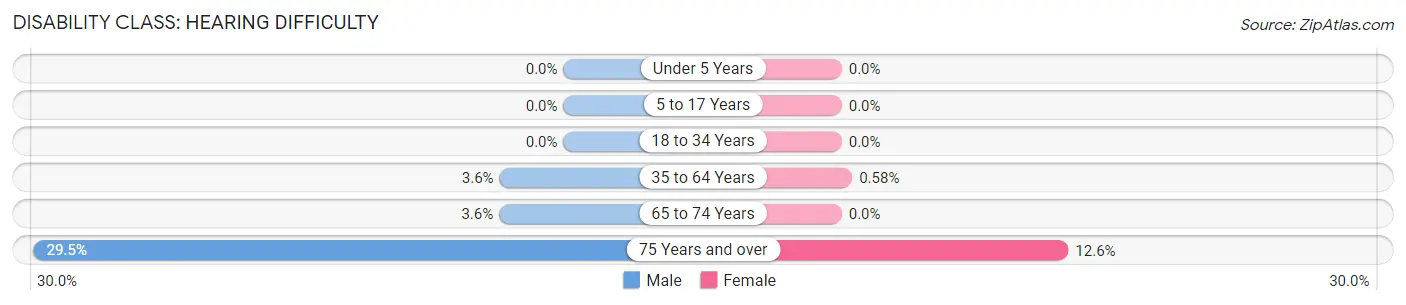
| Age Bracket | Male | Female |
| Under 5 Years | 0 (0.0%) | 0 (0.0%) |
| 5 to 17 Years | 0 (0.0%) | 0 (0.0%) |
| 18 to 34 Years | 0 (0.0%) | 0 (0.0%) |
| 35 to 64 Years | 97 (3.6%) | 16 (0.6%) |
| 65 to 74 Years | 20 (3.6%) | 0 (0.0%) |
| 75 Years and over | 59 (29.5%) | 64 (12.6%) |
Disability Class: Vision Difficulty
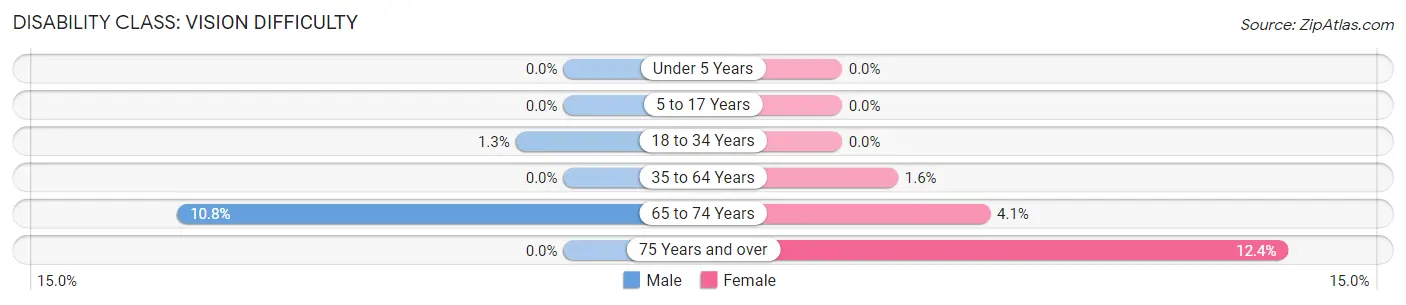
| Age Bracket | Male | Female |
| Under 5 Years | 0 (0.0%) | 0 (0.0%) |
| 5 to 17 Years | 0 (0.0%) | 0 (0.0%) |
| 18 to 34 Years | 32 (1.3%) | 0 (0.0%) |
| 35 to 64 Years | 0 (0.0%) | 43 (1.6%) |
| 65 to 74 Years | 60 (10.7%) | 19 (4.1%) |
| 75 Years and over | 0 (0.0%) | 63 (12.4%) |
Disability Class: Cognitive Difficulty
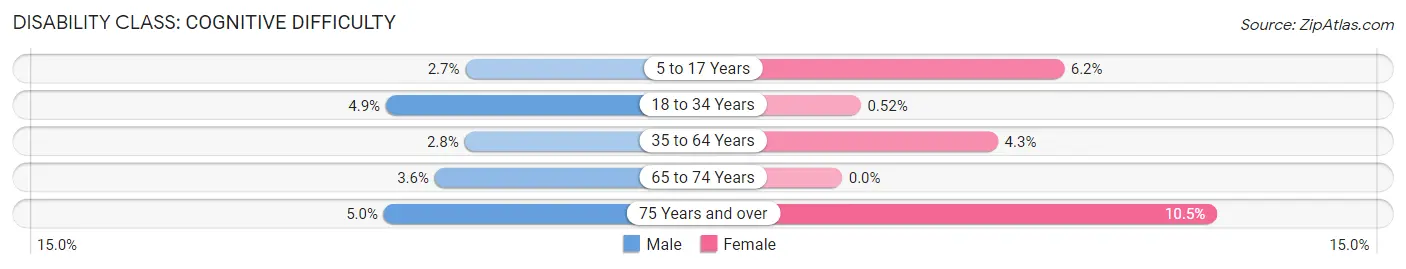
| Age Bracket | Male | Female |
| 5 to 17 Years | 28 (2.7%) | 64 (6.2%) |
| 18 to 34 Years | 119 (4.9%) | 14 (0.5%) |
| 35 to 64 Years | 75 (2.8%) | 120 (4.3%) |
| 65 to 74 Years | 20 (3.6%) | 0 (0.0%) |
| 75 Years and over | 10 (5.0%) | 53 (10.4%) |
Disability Class: Ambulatory Difficulty
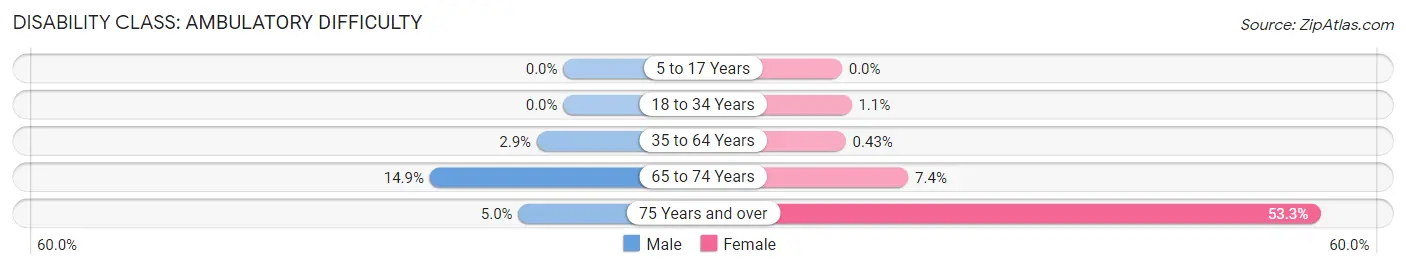
| Age Bracket | Male | Female |
| 5 to 17 Years | 0 (0.0%) | 0 (0.0%) |
| 18 to 34 Years | 0 (0.0%) | 29 (1.1%) |
| 35 to 64 Years | 80 (2.9%) | 12 (0.4%) |
| 65 to 74 Years | 83 (14.9%) | 34 (7.4%) |
| 75 Years and over | 10 (5.0%) | 270 (53.2%) |
Disability Class: Self-Care Difficulty
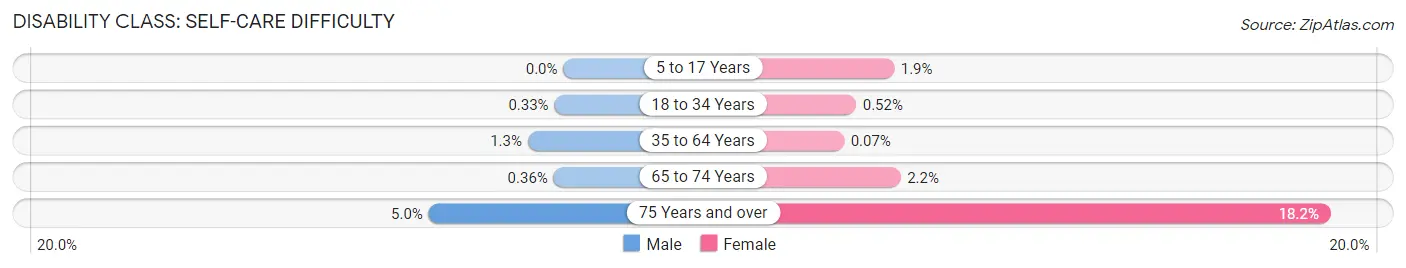
| Age Bracket | Male | Female |
| 5 to 17 Years | 0 (0.0%) | 20 (1.9%) |
| 18 to 34 Years | 8 (0.3%) | 14 (0.5%) |
| 35 to 64 Years | 36 (1.3%) | 2 (0.1%) |
| 65 to 74 Years | 2 (0.4%) | 10 (2.2%) |
| 75 Years and over | 10 (5.0%) | 92 (18.1%) |
Technology Access in Highland Park borough
Computing Device Access in Highland Park borough
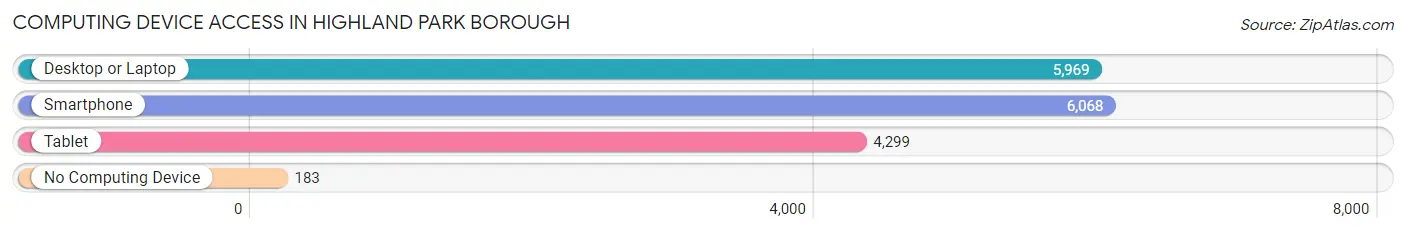
| Device Type | # Households | % Households |
| Desktop or Laptop | 5,969 | 91.2% |
| Smartphone | 6,068 | 92.7% |
| Tablet | 4,299 | 65.7% |
| No Computing Device | 183 | 2.8% |
| Total | 6,547 | 100.0% |
Internet Access in Highland Park borough
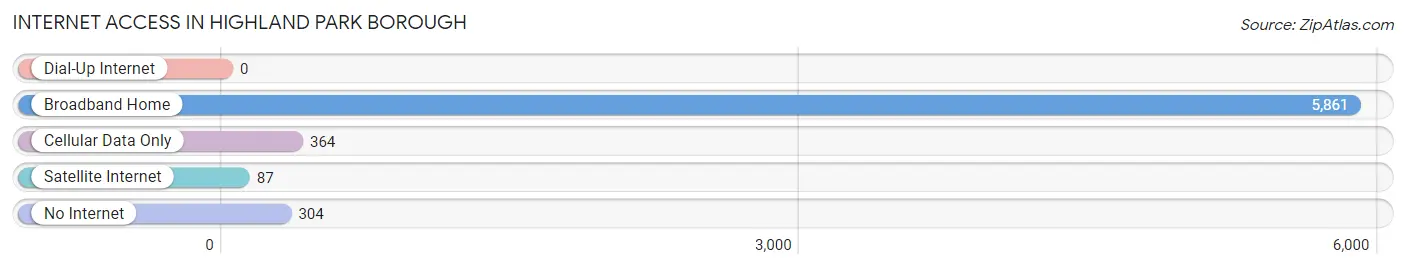
| Internet Type | # Households | % Households |
| Dial-Up Internet | 0 | 0.0% |
| Broadband Home | 5,861 | 89.5% |
| Cellular Data Only | 364 | 5.6% |
| Satellite Internet | 87 | 1.3% |
| No Internet | 304 | 4.6% |
| Total | 6,547 | 100.0% |
Highland Park borough Summary
Highland Park Borough is a small borough located in Middlesex County, New Jersey. It is situated on the Raritan River, just south of New Brunswick and is part of the larger New Brunswick-Highland Park metropolitan area. The borough has a population of approximately 13,000 people and covers an area of 1.7 square miles.
History
Highland Park was originally part of Piscataway Township, which was established in 1666. In 1870, the area was incorporated as the Borough of Highland Park. The name was chosen to reflect the area’s hilly terrain and its proximity to the Raritan River.
The borough was originally a farming community, but by the early 20th century, it had become a popular summer resort destination. The area was known for its many resorts, including the Highland Park Hotel, which was built in 1891. The hotel was a popular destination for wealthy New Yorkers who wanted to escape the city during the summer months.
In the early 20th century, Highland Park began to transition from a resort town to a residential community. The borough was home to a number of prominent families, including the families of industrialist John T. Dorrance and banker J.P. Morgan.
Geography
Highland Park is located in central New Jersey, just south of New Brunswick. It is situated on the Raritan River, which forms the eastern boundary of the borough. The borough is bordered by Edison Township to the north, New Brunswick to the east, Franklin Township to the south, and Piscataway Township to the west.
The borough is mostly flat, with some hills in the northern part of the borough. The highest point in the borough is the summit of Cedar Hill, which is located in the northern part of the borough and has an elevation of approximately 200 feet.
Economy
Highland Park’s economy is largely based on the service industry. The borough is home to a number of restaurants, retail stores, and professional services. The borough is also home to a number of corporate offices, including those of Johnson & Johnson, Merck, and Prudential Financial.
The borough is also home to a number of educational institutions, including Rutgers University, Middlesex County College, and the Robert Wood Johnson Medical School.
Demographics
As of the 2010 census, the population of Highland Park was 13,982. The racial makeup of the borough was 79.3% White, 11.2% African American, 0.3% Native American, 4.2% Asian, and 4.9% from other races. Hispanic or Latino of any race were 11.2% of the population.
The median household income in Highland Park was $68,944, and the median family income was $83,944. The per capita income was $35,944. About 8.2% of families and 10.3% of the population were below the poverty line, including 14.2% of those under age 18 and 8.2% of those age 65 or over.
Highland Park is a diverse community, with a variety of cultures and backgrounds represented. The borough is home to a large Jewish population, as well as a growing Hispanic population. The borough is also home to a number of immigrants from India, China, and other countries.
Common Questions
What is the Total Population of Highland Park borough?
Total Population of Highland Park borough is 14,996.
What is the Total Male Population of Highland Park borough?
Total Male Population of Highland Park borough is 7,291.
What is the Total Female Population of Highland Park borough?
Total Female Population of Highland Park borough is 7,705.
What is the Ratio of Males per 100 Females in Highland Park borough?
There are 94.63 Males per 100 Females in Highland Park borough.
What is the Ratio of Females per 100 Males in Highland Park borough?
There are 105.68 Females per 100 Males in Highland Park borough.
What is the Median Population Age in Highland Park borough?
Median Population Age in Highland Park borough is 34.3 Years.
What is the Average Family Size in Highland Park borough
Average Family Size in Highland Park borough is 3.1 People.
What is the Average Household Size in Highland Park borough
Average Household Size in Highland Park borough is 2.3 People.
What is Per Capita Income in Highland Park borough?
Per Capita income in Highland Park borough is $52,912.
What is the Median Family Income in Highland Park borough?
Median Family Income in Highland Park borough is $127,697.
What is the Median Household income in Highland Park borough?
Median Household Income in Highland Park borough is $93,927.
What is Income or Wage Gap in Highland Park borough?
Income or Wage Gap in Highland Park borough is 18.5%.
Women in Highland Park borough earn 81.5 cents for every dollar earned by a man.
What is Inequality or Gini Index in Highland Park borough?
Inequality or Gini Index in Highland Park borough is 0.42.
How Large is the Labor Force in Highland Park borough?
There are 9,146 People in the Labor Forcein in Highland Park borough.
What is the Percentage of People in the Labor Force in Highland Park borough?
72.4% of People are in the Labor Force in Highland Park borough.
What is the Unemployment Rate in Highland Park borough?
Unemployment Rate in Highland Park borough is 6.1%.