Pine Lake Park, NJ
Pine Lake Park Map
Pine Lake Park Overview
9,711
TOTAL POPULATION
4,654
MALE POPULATION
5,057
FEMALE POPULATION
92.03
MALES / 100 FEMALES
108.66
FEMALES / 100 MALES
37.4
MEDIAN AGE
3.7
AVG FAMILY SIZE
3.1
AVG HOUSEHOLD SIZE
$37,126
PER CAPITA INCOME
$113,551
AVG FAMILY INCOME
$87,358
AVG HOUSEHOLD INCOME
35.0%
WAGE / INCOME GAP [ % ]
65.0¢/ $1
WAGE / INCOME GAP [ $ ]
0.40
INEQUALITY / GINI INDEX
5,017
LABOR FORCE [ PEOPLE ]
66.2%
PERCENT IN LABOR FORCE
3.5%
UNEMPLOYMENT RATE
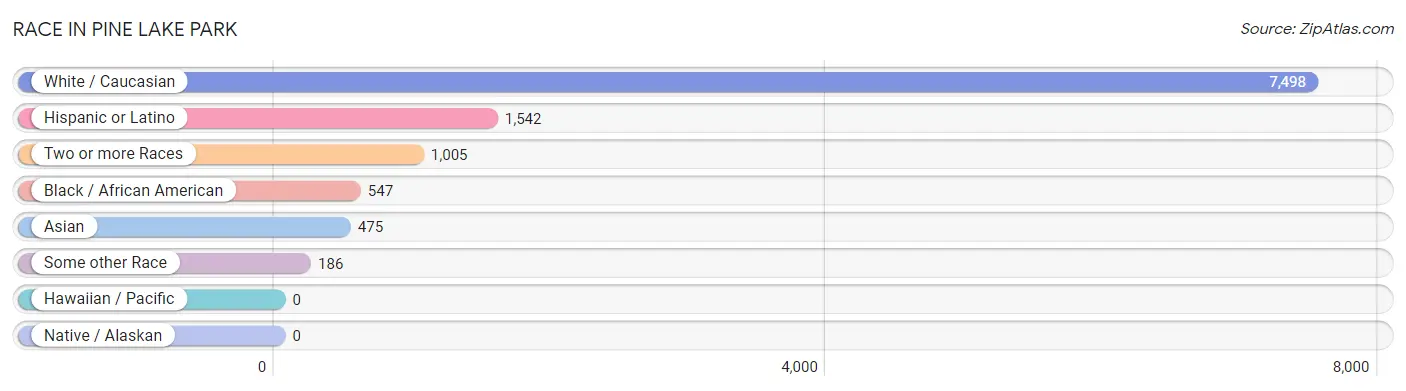
Race in Pine Lake Park
The most populous races in Pine Lake Park are White / Caucasian (7,498 | 77.2%), Hispanic or Latino (1,542 | 15.9%), and Two or more Races (1,005 | 10.3%).
| Race | # Population | % Population |
| Asian | 475 | 4.9% |
| Black / African American | 547 | 5.6% |
| Hawaiian / Pacific | 0 | 0.0% |
| Hispanic or Latino | 1,542 | 15.9% |
| Native / Alaskan | 0 | 0.0% |
| White / Caucasian | 7,498 | 77.2% |
| Two or more Races | 1,005 | 10.3% |
| Some other Race | 186 | 1.9% |
| Total | 9,711 | 100.0% |
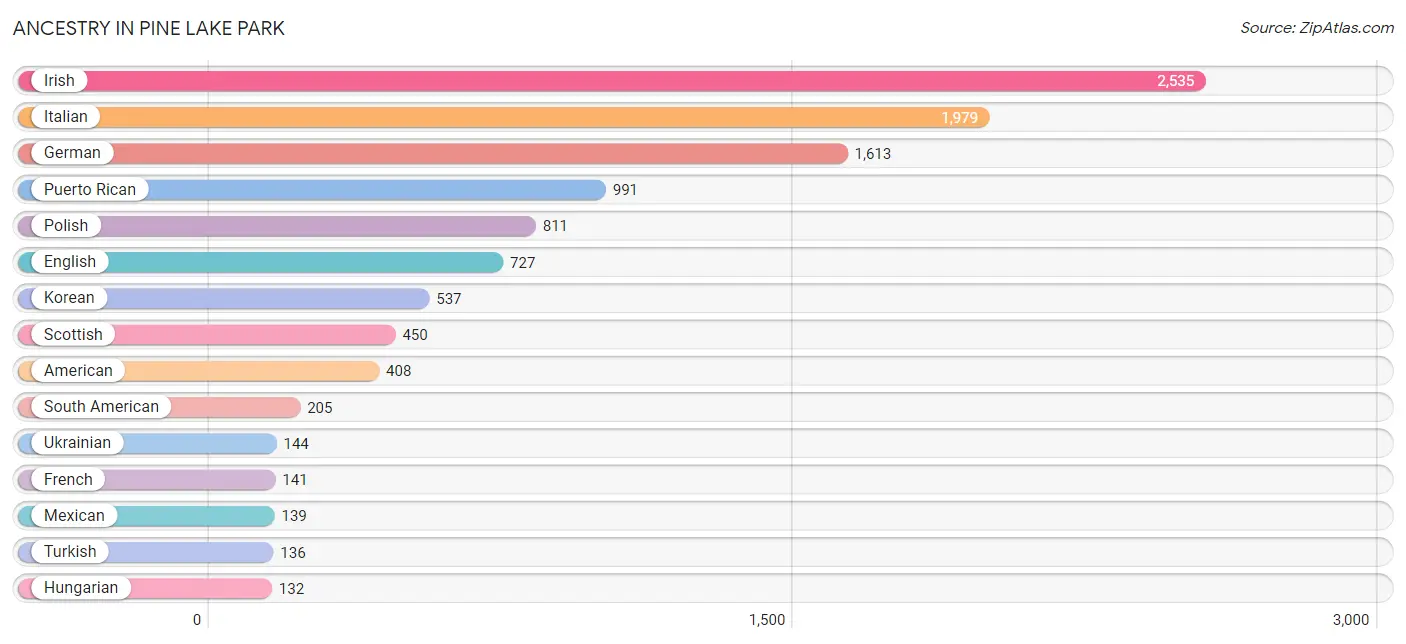
Ancestry in Pine Lake Park
The most populous ancestries reported in Pine Lake Park are Irish (2,535 | 26.1%), Italian (1,979 | 20.4%), German (1,613 | 16.6%), Puerto Rican (991 | 10.2%), and Polish (811 | 8.4%), together accounting for 81.6% of all Pine Lake Park residents.
| Ancestry | # Population | % Population |
| American | 408 | 4.2% |
| Argentinean | 58 | 0.6% |
| Austrian | 23 | 0.2% |
| Basque | 39 | 0.4% |
| Bhutanese | 7 | 0.1% |
| Brazilian | 11 | 0.1% |
| Central American | 111 | 1.1% |
| Colombian | 26 | 0.3% |
| Cuban | 65 | 0.7% |
| Czech | 10 | 0.1% |
| Czechoslovakian | 26 | 0.3% |
| Danish | 7 | 0.1% |
| Dominican | 31 | 0.3% |
| Dutch | 117 | 1.2% |
| Ecuadorian | 121 | 1.3% |
| English | 727 | 7.5% |
| European | 68 | 0.7% |
| Finnish | 8 | 0.1% |
| French | 141 | 1.5% |
| French Canadian | 45 | 0.5% |
| German | 1,613 | 16.6% |
| Ghanaian | 66 | 0.7% |
| Greek | 49 | 0.5% |
| Hungarian | 132 | 1.4% |
| Irish | 2,535 | 26.1% |
| Italian | 1,979 | 20.4% |
| Korean | 537 | 5.5% |
| Latvian | 15 | 0.2% |
| Lithuanian | 15 | 0.2% |
| Mexican | 139 | 1.4% |
| Nicaraguan | 53 | 0.5% |
| Norwegian | 45 | 0.5% |
| Pakistani | 64 | 0.7% |
| Polish | 811 | 8.4% |
| Portuguese | 101 | 1.0% |
| Puerto Rican | 991 | 10.2% |
| Russian | 87 | 0.9% |
| Salvadoran | 58 | 0.6% |
| Scotch-Irish | 9 | 0.1% |
| Scottish | 450 | 4.6% |
| Slovak | 71 | 0.7% |
| South American | 205 | 2.1% |
| Subsaharan African | 66 | 0.7% |
| Swedish | 72 | 0.7% |
| Swiss | 20 | 0.2% |
| Turkish | 136 | 1.4% |
| Ukrainian | 144 | 1.5% |
| Welsh | 29 | 0.3% | View All 48 Rows |
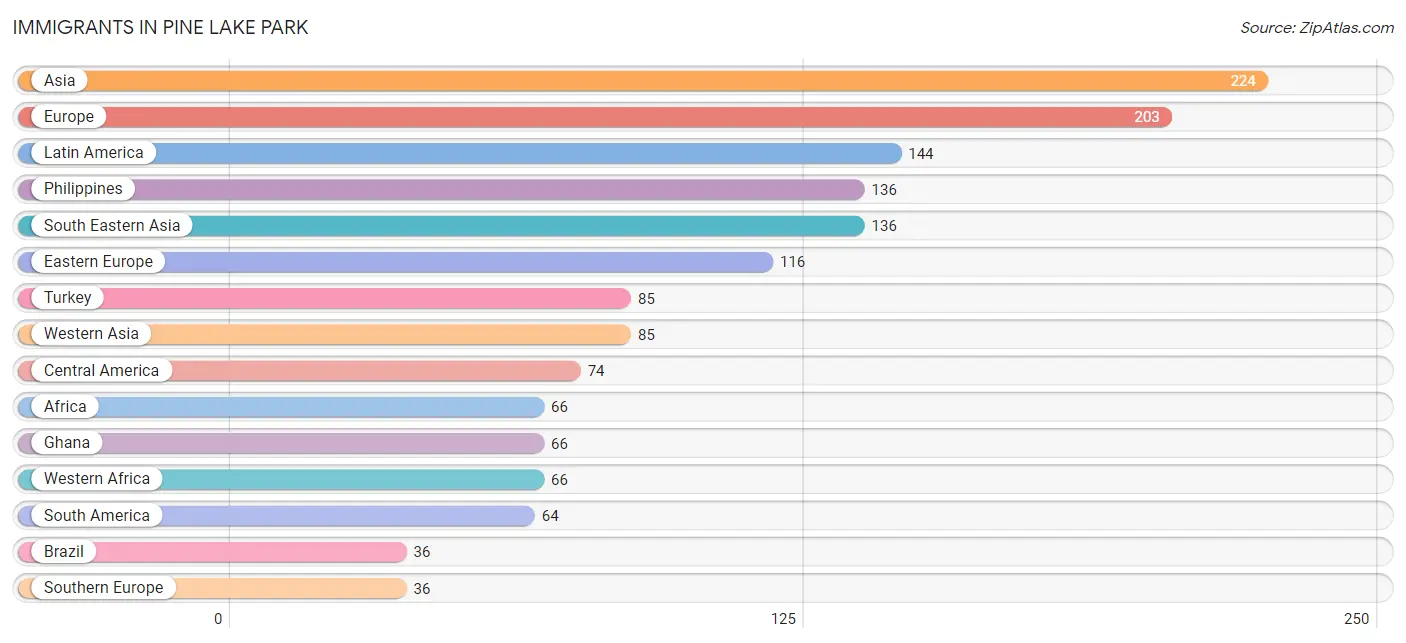
Immigrants in Pine Lake Park
The most numerous immigrant groups reported in Pine Lake Park came from Asia (224 | 2.3%), Europe (203 | 2.1%), Latin America (144 | 1.5%), Philippines (136 | 1.4%), and South Eastern Asia (136 | 1.4%), together accounting for 8.7% of all Pine Lake Park residents.
| Immigration Origin | # Population | % Population |
| Africa | 66 | 0.7% |
| Asia | 224 | 2.3% |
| Belarus | 18 | 0.2% |
| Brazil | 36 | 0.4% |
| Canada | 14 | 0.1% |
| Caribbean | 6 | 0.1% |
| Central America | 74 | 0.8% |
| China | 3 | 0.0% |
| Colombia | 28 | 0.3% |
| Czechoslovakia | 30 | 0.3% |
| Dominican Republic | 6 | 0.1% |
| Eastern Asia | 3 | 0.0% |
| Eastern Europe | 116 | 1.2% |
| El Salvador | 22 | 0.2% |
| England | 10 | 0.1% |
| Europe | 203 | 2.1% |
| Germany | 19 | 0.2% |
| Ghana | 66 | 0.7% |
| Italy | 24 | 0.3% |
| Latin America | 144 | 1.5% |
| Latvia | 5 | 0.1% |
| Mexico | 33 | 0.3% |
| Nicaragua | 19 | 0.2% |
| Northern Europe | 32 | 0.3% |
| Philippines | 136 | 1.4% |
| Poland | 27 | 0.3% |
| Portugal | 12 | 0.1% |
| Russia | 18 | 0.2% |
| Scotland | 22 | 0.2% |
| South America | 64 | 0.7% |
| South Eastern Asia | 136 | 1.4% |
| Southern Europe | 36 | 0.4% |
| Turkey | 85 | 0.9% |
| Ukraine | 18 | 0.2% |
| Western Africa | 66 | 0.7% |
| Western Asia | 85 | 0.9% |
| Western Europe | 19 | 0.2% | View All 37 Rows |
Sex and Age in Pine Lake Park
Sex and Age in Pine Lake Park
The most populous age groups in Pine Lake Park are 60 to 64 Years (423 | 9.1%) for men and Under 5 Years (553 | 10.9%) for women.
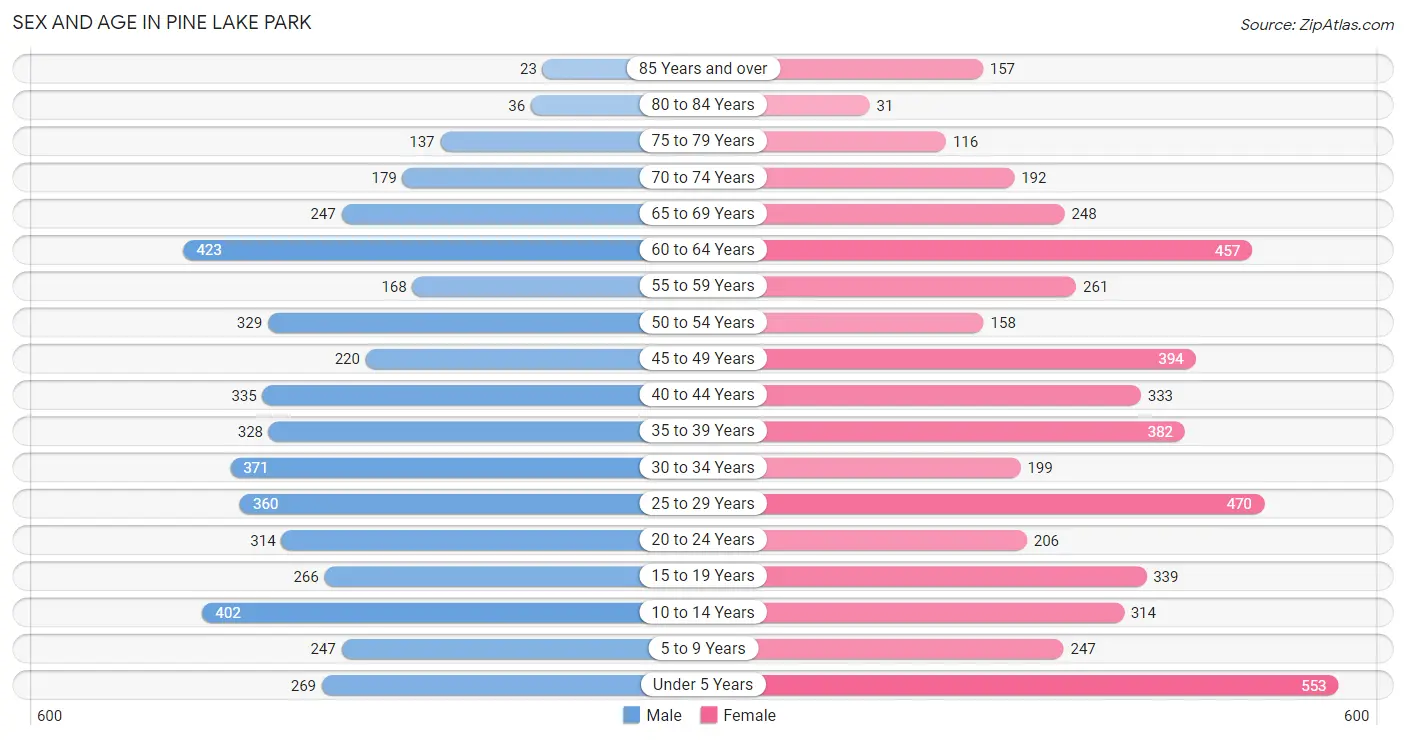
| Age Bracket | Male | Female |
| Under 5 Years | 269 (5.8%) | 553 (10.9%) |
| 5 to 9 Years | 247 (5.3%) | 247 (4.9%) |
| 10 to 14 Years | 402 (8.6%) | 314 (6.2%) |
| 15 to 19 Years | 266 (5.7%) | 339 (6.7%) |
| 20 to 24 Years | 314 (6.8%) | 206 (4.1%) |
| 25 to 29 Years | 360 (7.7%) | 470 (9.3%) |
| 30 to 34 Years | 371 (8.0%) | 199 (3.9%) |
| 35 to 39 Years | 328 (7.0%) | 382 (7.5%) |
| 40 to 44 Years | 335 (7.2%) | 333 (6.6%) |
| 45 to 49 Years | 220 (4.7%) | 394 (7.8%) |
| 50 to 54 Years | 329 (7.1%) | 158 (3.1%) |
| 55 to 59 Years | 168 (3.6%) | 261 (5.2%) |
| 60 to 64 Years | 423 (9.1%) | 457 (9.0%) |
| 65 to 69 Years | 247 (5.3%) | 248 (4.9%) |
| 70 to 74 Years | 179 (3.8%) | 192 (3.8%) |
| 75 to 79 Years | 137 (2.9%) | 116 (2.3%) |
| 80 to 84 Years | 36 (0.8%) | 31 (0.6%) |
| 85 Years and over | 23 (0.5%) | 157 (3.1%) |
| Total | 4,654 (100.0%) | 5,057 (100.0%) |
Families and Households in Pine Lake Park
Median Family Size in Pine Lake Park
The median family size in Pine Lake Park is 3.69 persons per family, with married-couple families (1,787 | 78.4%) accounting for the largest median family size of 3.83 persons per family. On the other hand, single male/father families (203 | 8.9%) represent the smallest median family size with 2.41 persons per family.
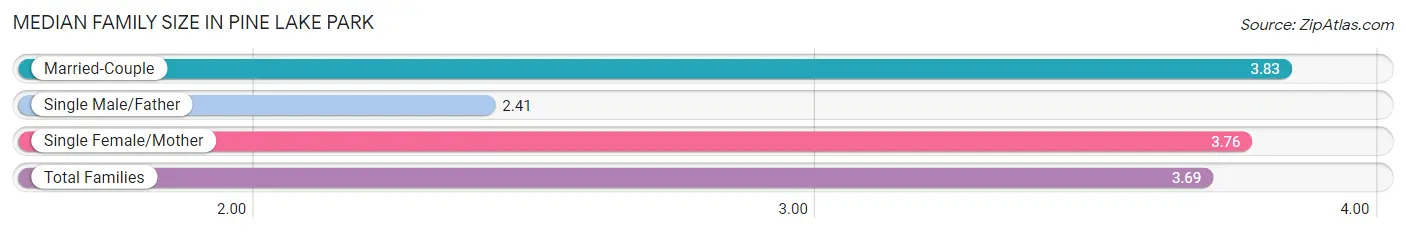
| Family Type | # Families | Family Size |
| Married-Couple | 1,787 (78.4%) | 3.83 |
| Single Male/Father | 203 (8.9%) | 2.41 |
| Single Female/Mother | 290 (12.7%) | 3.76 |
| Total Families | 2,280 (100.0%) | 3.69 |
Median Household Size in Pine Lake Park
The median household size in Pine Lake Park is 3.14 persons per household, with single female/mother households (290 | 9.5%) accounting for the largest median household size of 4.23 persons per household. non-family households (786 | 25.6%) represent the smallest median household size with 1.24 persons per household.
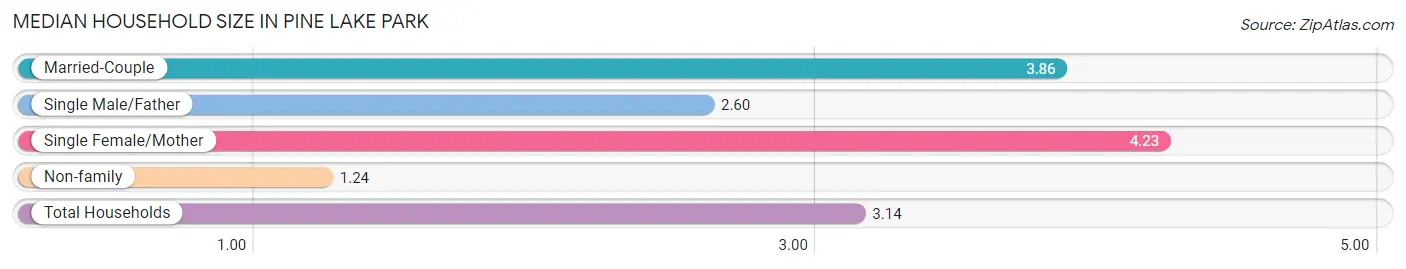
| Household Type | # Households | Household Size |
| Married-Couple | 1,787 (58.3%) | 3.86 |
| Single Male/Father | 203 (6.6%) | 2.60 |
| Single Female/Mother | 290 (9.5%) | 4.23 |
| Non-family | 786 (25.6%) | 1.24 |
| Total Households | 3,066 (100.0%) | 3.14 |
Household Size by Marriage Status in Pine Lake Park
Out of a total of 3,066 households in Pine Lake Park, 2,280 (74.4%) are family households, while 786 (25.6%) are nonfamily households. The most numerous type of family households are 2-person households, comprising 708, and the most common type of nonfamily households are 1-person households, comprising 598.
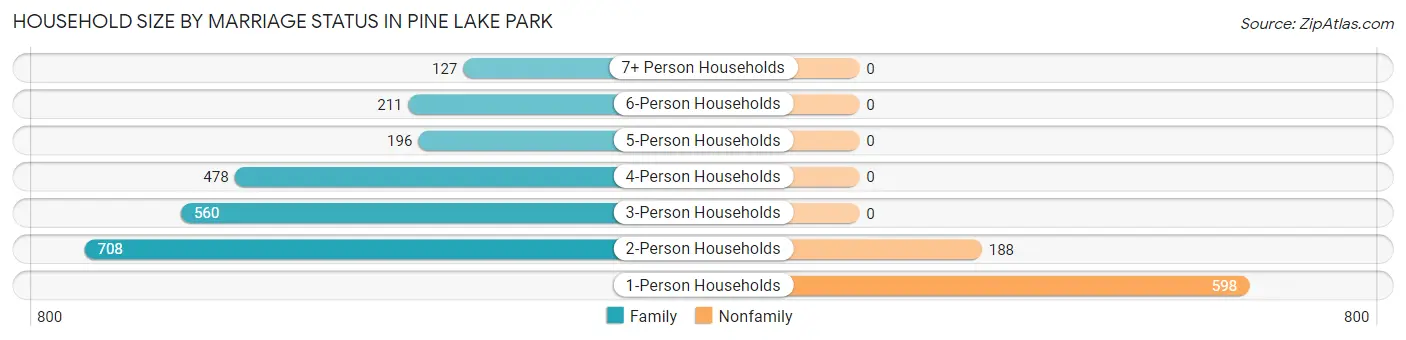
| Household Size | Family Households | Nonfamily Households |
| 1-Person Households | - | 598 (19.5%) |
| 2-Person Households | 708 (23.1%) | 188 (6.1%) |
| 3-Person Households | 560 (18.3%) | 0 (0.0%) |
| 4-Person Households | 478 (15.6%) | 0 (0.0%) |
| 5-Person Households | 196 (6.4%) | 0 (0.0%) |
| 6-Person Households | 211 (6.9%) | 0 (0.0%) |
| 7+ Person Households | 127 (4.1%) | 0 (0.0%) |
| Total | 2,280 (74.4%) | 786 (25.6%) |
Female Fertility in Pine Lake Park
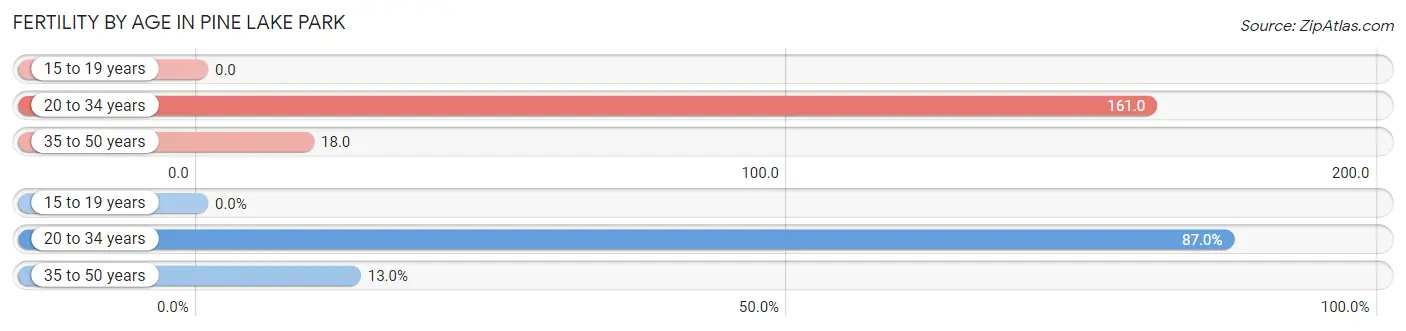
Fertility by Age in Pine Lake Park
Average fertility rate in Pine Lake Park is 69.0 births per 1,000 women. Women in the age bracket of 20 to 34 years have the highest fertility rate with 161.0 births per 1,000 women. Women in the age bracket of 20 to 34 years acount for 87.0% of all women with births.
| Age Bracket | Women with Births | Births / 1,000 Women |
| 15 to 19 years | 0 (0.0%) | 0.0 |
| 20 to 34 years | 141 (87.0%) | 161.0 |
| 35 to 50 years | 21 (13.0%) | 18.0 |
| Total | 162 (100.0%) | 69.0 |
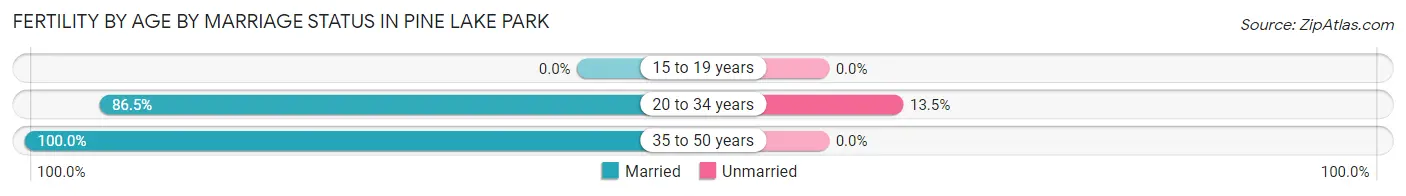
Fertility by Age by Marriage Status in Pine Lake Park
88.3% of women with births (162) in Pine Lake Park are married. The highest percentage of unmarried women with births falls into 20 to 34 years age bracket with 13.5% of them unmarried at the time of birth, while the lowest percentage of unmarried women with births belong to 35 to 50 years age bracket with 0.0% of them unmarried.
| Age Bracket | Married | Unmarried |
| 15 to 19 years | 0 (0.0%) | 0 (0.0%) |
| 20 to 34 years | 122 (86.5%) | 19 (13.5%) |
| 35 to 50 years | 21 (100.0%) | 0 (0.0%) |
| Total | 143 (88.3%) | 19 (11.7%) |
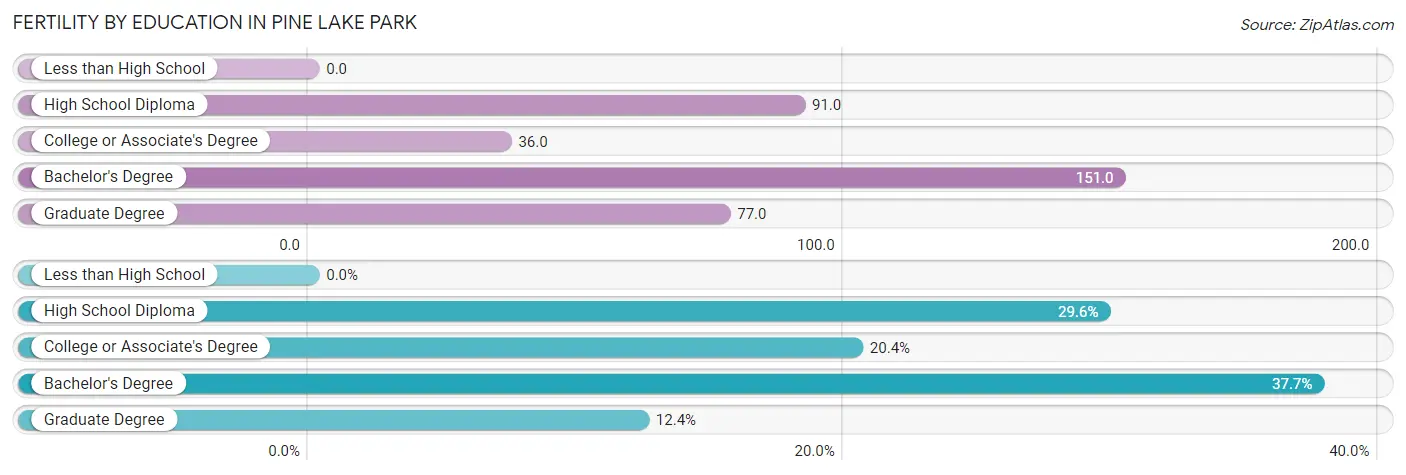
Fertility by Education in Pine Lake Park
| Educational Attainment | Women with Births | Births / 1,000 Women |
| Less than High School | 0 (0.0%) | 0.0 |
| High School Diploma | 48 (29.6%) | 91.0 |
| College or Associate's Degree | 33 (20.4%) | 36.0 |
| Bachelor's Degree | 61 (37.7%) | 151.0 |
| Graduate Degree | 20 (12.3%) | 77.0 |
| Total | 162 (100.0%) | 69.0 |
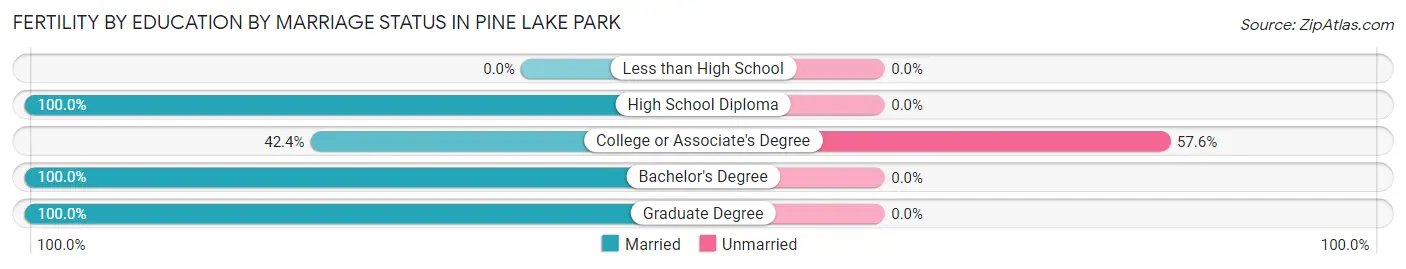
Fertility by Education by Marriage Status in Pine Lake Park
11.7% of women with births in Pine Lake Park are unmarried. Women with the educational attainment of high school diploma are most likely to be married with 100.0% of them married at childbirth, while women with the educational attainment of college or associate's degree are least likely to be married with 57.6% of them unmarried at childbirth.
| Educational Attainment | Married | Unmarried |
| Less than High School | 0 (0.0%) | 0 (0.0%) |
| High School Diploma | 48 (100.0%) | 0 (0.0%) |
| College or Associate's Degree | 14 (42.4%) | 19 (57.6%) |
| Bachelor's Degree | 61 (100.0%) | 0 (0.0%) |
| Graduate Degree | 20 (100.0%) | 0 (0.0%) |
| Total | 143 (88.3%) | 19 (11.7%) |
Income in Pine Lake Park
Income Overview in Pine Lake Park
Per Capita Income in Pine Lake Park is $37,126, while median incomes of families and households are $113,551 and $87,358 respectively.
| Characteristic | Number | Measure |
| Per Capita Income | 9,711 | $37,126 |
| Median Family Income | 2,280 | $113,551 |
| Mean Family Income | 2,280 | $133,942 |
| Median Household Income | 3,066 | $87,358 |
| Mean Household Income | 3,066 | $115,415 |
| Income Deficit | 2,280 | $0 |
| Wage / Income Gap (%) | 9,711 | 34.96% |
| Wage / Income Gap ($) | 9,711 | 65.04¢ per $1 |
| Gini / Inequality Index | 9,711 | 0.40 |
Earnings by Sex in Pine Lake Park
Average Earnings in Pine Lake Park are $44,654, $57,236 for men and $37,228 for women, a difference of 35.0%.
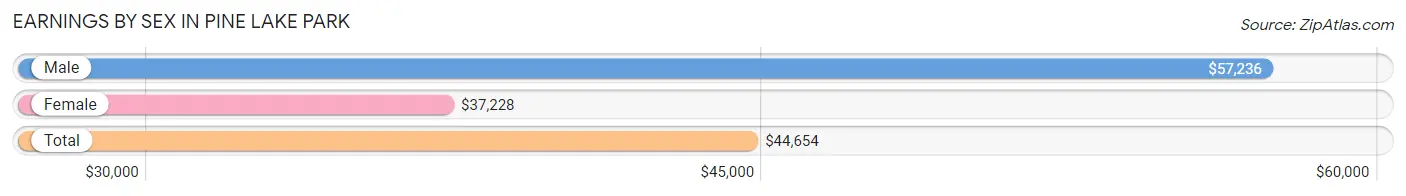
| Sex | Number | Average Earnings |
| Male | 2,657 (51.5%) | $57,236 |
| Female | 2,501 (48.5%) | $37,228 |
| Total | 5,158 (100.0%) | $44,654 |
Earnings by Sex by Income Bracket in Pine Lake Park
The most common earnings brackets in Pine Lake Park are $75,000 to $99,999 for men (585 | 22.0%) and $65,000 to $74,999 for women (258 | 10.3%).
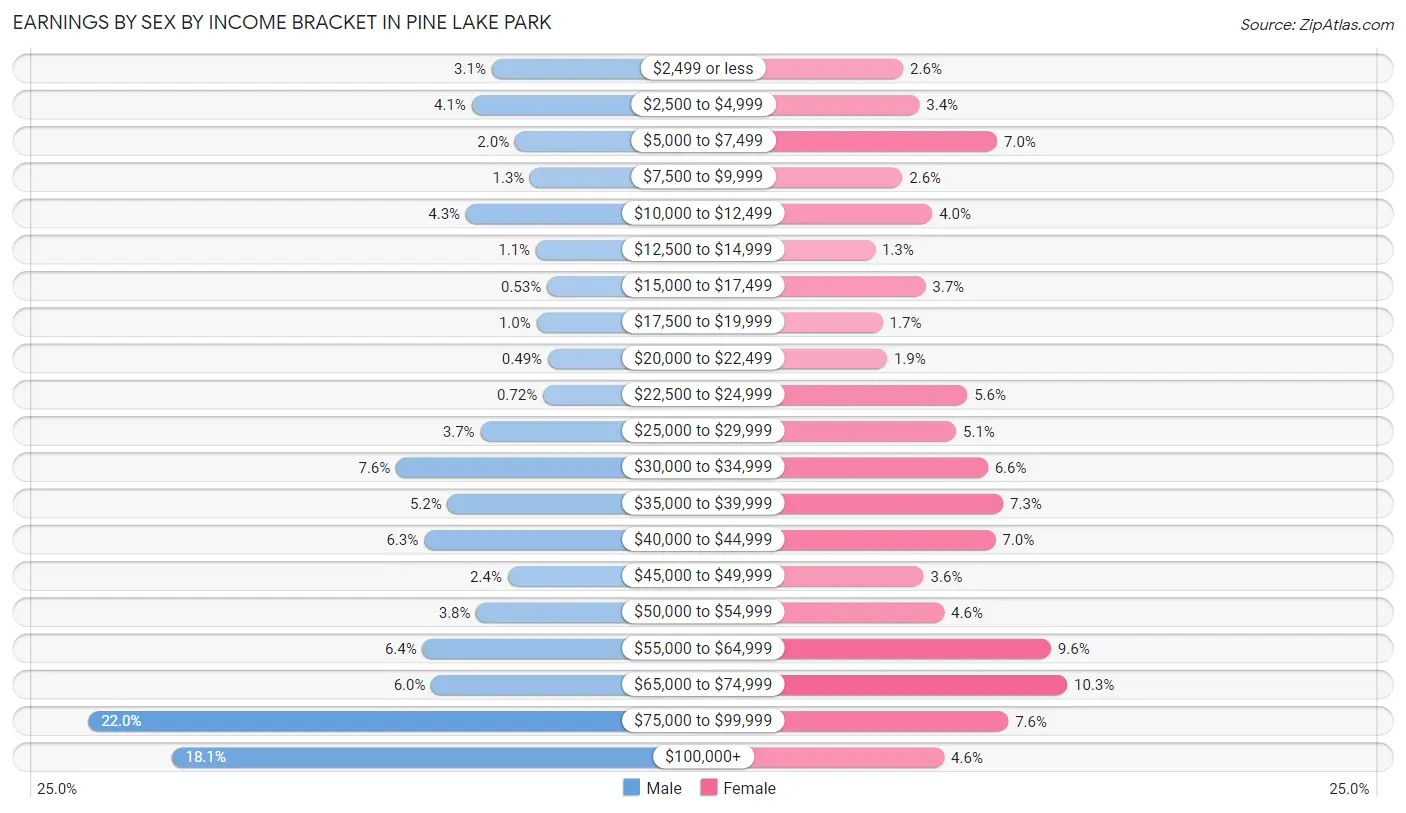
| Income | Male | Female |
| $2,499 or less | 83 (3.1%) | 66 (2.6%) |
| $2,500 to $4,999 | 108 (4.1%) | 85 (3.4%) |
| $5,000 to $7,499 | 54 (2.0%) | 176 (7.0%) |
| $7,500 to $9,999 | 35 (1.3%) | 65 (2.6%) |
| $10,000 to $12,499 | 115 (4.3%) | 100 (4.0%) |
| $12,500 to $14,999 | 28 (1.1%) | 33 (1.3%) |
| $15,000 to $17,499 | 14 (0.5%) | 92 (3.7%) |
| $17,500 to $19,999 | 27 (1.0%) | 42 (1.7%) |
| $20,000 to $22,499 | 13 (0.5%) | 47 (1.9%) |
| $22,500 to $24,999 | 19 (0.7%) | 141 (5.6%) |
| $25,000 to $29,999 | 97 (3.6%) | 128 (5.1%) |
| $30,000 to $34,999 | 202 (7.6%) | 165 (6.6%) |
| $35,000 to $39,999 | 138 (5.2%) | 183 (7.3%) |
| $40,000 to $44,999 | 167 (6.3%) | 174 (7.0%) |
| $45,000 to $49,999 | 63 (2.4%) | 90 (3.6%) |
| $50,000 to $54,999 | 102 (3.8%) | 114 (4.6%) |
| $55,000 to $64,999 | 169 (6.4%) | 239 (9.6%) |
| $65,000 to $74,999 | 158 (5.9%) | 258 (10.3%) |
| $75,000 to $99,999 | 585 (22.0%) | 189 (7.6%) |
| $100,000+ | 480 (18.1%) | 114 (4.6%) |
| Total | 2,657 (100.0%) | 2,501 (100.0%) |
Earnings by Sex by Educational Attainment in Pine Lake Park
Average earnings in Pine Lake Park are $71,159 for men and $42,140 for women, a difference of 40.8%. Men with an educational attainment of graduate degree enjoy the highest average annual earnings of $116,731, while those with less than high school education earn the least with $55,368. Women with an educational attainment of graduate degree earn the most with the average annual earnings of $57,700, while those with less than high school education have the smallest earnings of $24,605.
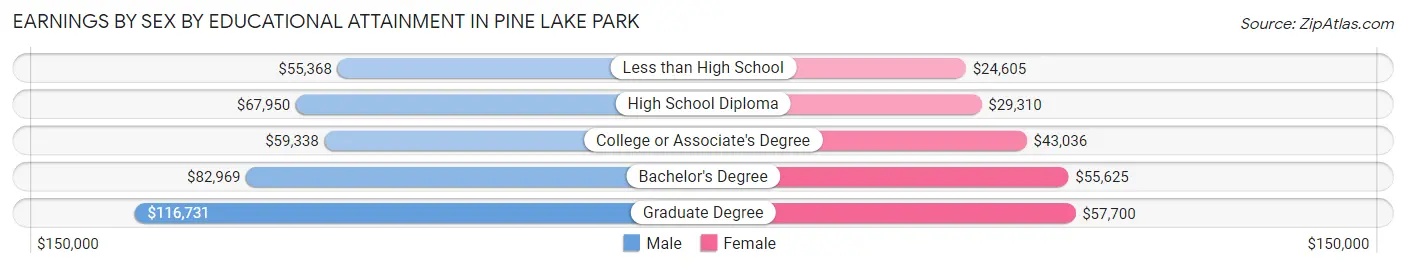
| Educational Attainment | Male Income | Female Income |
| Less than High School | $55,368 | $24,605 |
| High School Diploma | $67,950 | $29,310 |
| College or Associate's Degree | $59,338 | $43,036 |
| Bachelor's Degree | $82,969 | $55,625 |
| Graduate Degree | $116,731 | $57,700 |
| Total | $71,159 | $42,140 |
Family Income in Pine Lake Park
Family Income Brackets in Pine Lake Park
According to the Pine Lake Park family income data, there are 502 families falling into the $100,000 to $149,999 income range, which is the most common income bracket and makes up 22.0% of all families.
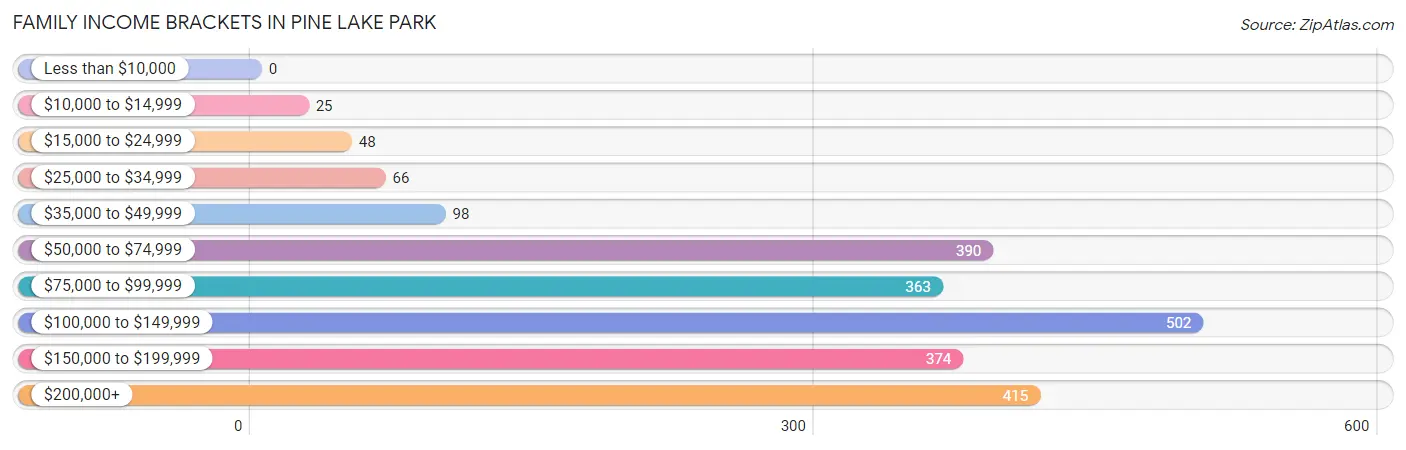
| Income Bracket | # Families | % Families |
| Less than $10,000 | 0 | 0.0% |
| $10,000 to $14,999 | 25 | 1.1% |
| $15,000 to $24,999 | 48 | 2.1% |
| $25,000 to $34,999 | 66 | 2.9% |
| $35,000 to $49,999 | 98 | 4.3% |
| $50,000 to $74,999 | 390 | 17.1% |
| $75,000 to $99,999 | 363 | 15.9% |
| $100,000 to $149,999 | 502 | 22.0% |
| $150,000 to $199,999 | 374 | 16.4% |
| $200,000+ | 415 | 18.2% |
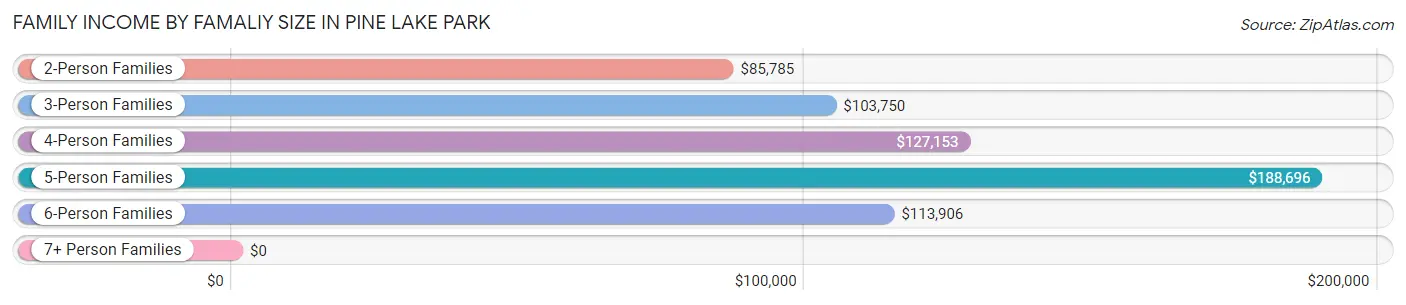
Family Income by Famaliy Size in Pine Lake Park
5-person families (186 | 8.2%) account for the highest median family income in Pine Lake Park with $188,696 per family, while 2-person families (739 | 32.4%) have the highest median income of $42,892 per family member.
| Income Bracket | # Families | Median Income |
| 2-Person Families | 739 (32.4%) | $85,785 |
| 3-Person Families | 630 (27.6%) | $103,750 |
| 4-Person Families | 395 (17.3%) | $127,153 |
| 5-Person Families | 186 (8.2%) | $188,696 |
| 6-Person Families | 203 (8.9%) | $113,906 |
| 7+ Person Families | 127 (5.6%) | $0 |
| Total | 2,280 (100.0%) | $113,551 |
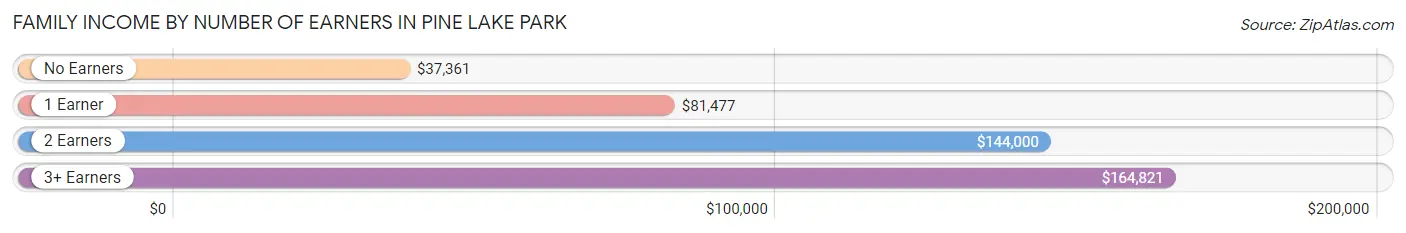
Family Income by Number of Earners in Pine Lake Park
The median family income in Pine Lake Park is $113,551, with families comprising 3+ earners (460) having the highest median family income of $164,821, while families with no earners (201) have the lowest median family income of $37,361, accounting for 20.2% and 8.8% of families, respectively.
| Number of Earners | # Families | Median Income |
| No Earners | 201 (8.8%) | $37,361 |
| 1 Earner | 619 (27.2%) | $81,477 |
| 2 Earners | 1,000 (43.9%) | $144,000 |
| 3+ Earners | 460 (20.2%) | $164,821 |
| Total | 2,280 (100.0%) | $113,551 |
Household Income in Pine Lake Park
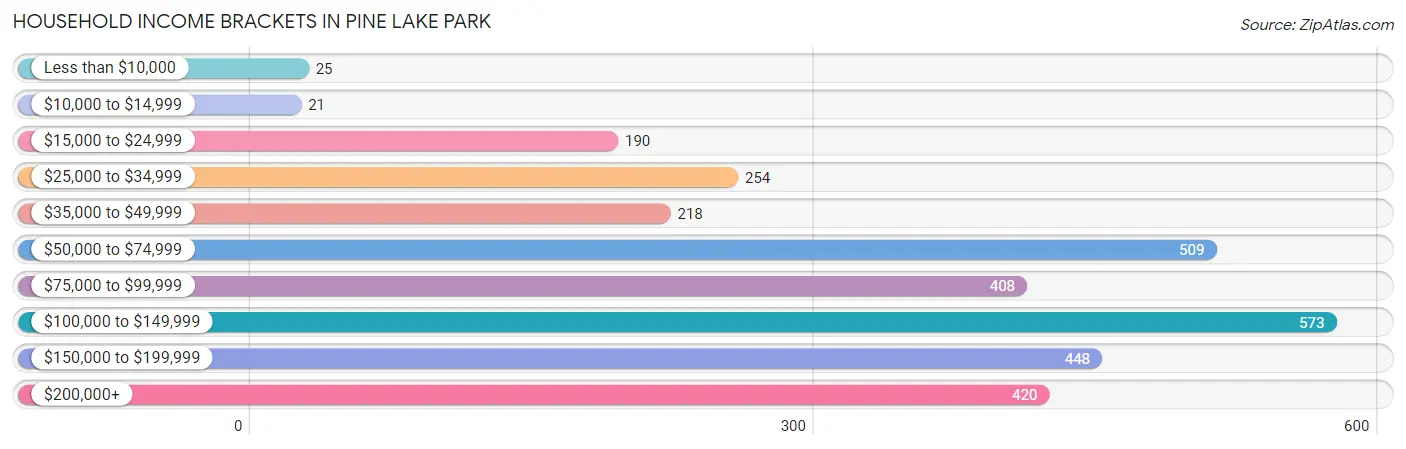
Household Income Brackets in Pine Lake Park
With 573 households falling in the category, the $100,000 to $149,999 income range is the most frequent in Pine Lake Park, accounting for 18.7% of all households. In contrast, only 21 households (0.7%) fall into the $10,000 to $14,999 income bracket, making it the least populous group.
| Income Bracket | # Households | % Households |
| Less than $10,000 | 25 | 0.8% |
| $10,000 to $14,999 | 21 | 0.7% |
| $15,000 to $24,999 | 190 | 6.2% |
| $25,000 to $34,999 | 254 | 8.3% |
| $35,000 to $49,999 | 218 | 7.1% |
| $50,000 to $74,999 | 509 | 16.6% |
| $75,000 to $99,999 | 408 | 13.3% |
| $100,000 to $149,999 | 573 | 18.7% |
| $150,000 to $199,999 | 448 | 14.6% |
| $200,000+ | 420 | 13.7% |
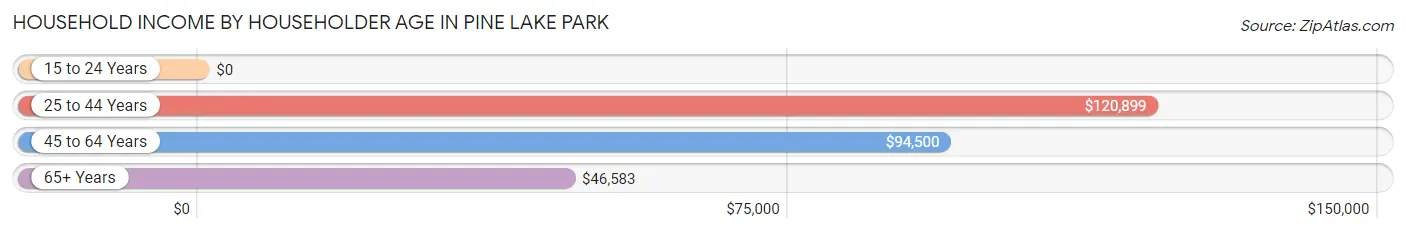
Household Income by Householder Age in Pine Lake Park
The median household income in Pine Lake Park is $87,358, with the highest median household income of $120,899 found in the 25 to 44 years age bracket for the primary householder. A total of 1,013 households (33.0%) fall into this category.
| Income Bracket | # Households | Median Income |
| 15 to 24 Years | 0 (0.0%) | $0 |
| 25 to 44 Years | 1,013 (33.0%) | $120,899 |
| 45 to 64 Years | 1,286 (41.9%) | $94,500 |
| 65+ Years | 767 (25.0%) | $46,583 |
| Total | 3,066 (100.0%) | $87,358 |
Poverty in Pine Lake Park
Income Below Poverty by Sex and Age in Pine Lake Park
With 5.0% poverty level for males and 2.6% for females among the residents of Pine Lake Park, 65 to 74 year old males and 75 year old and over females are the most vulnerable to poverty, with 45 males (10.8%) and 38 females (14.6%) in their respective age groups living below the poverty level.
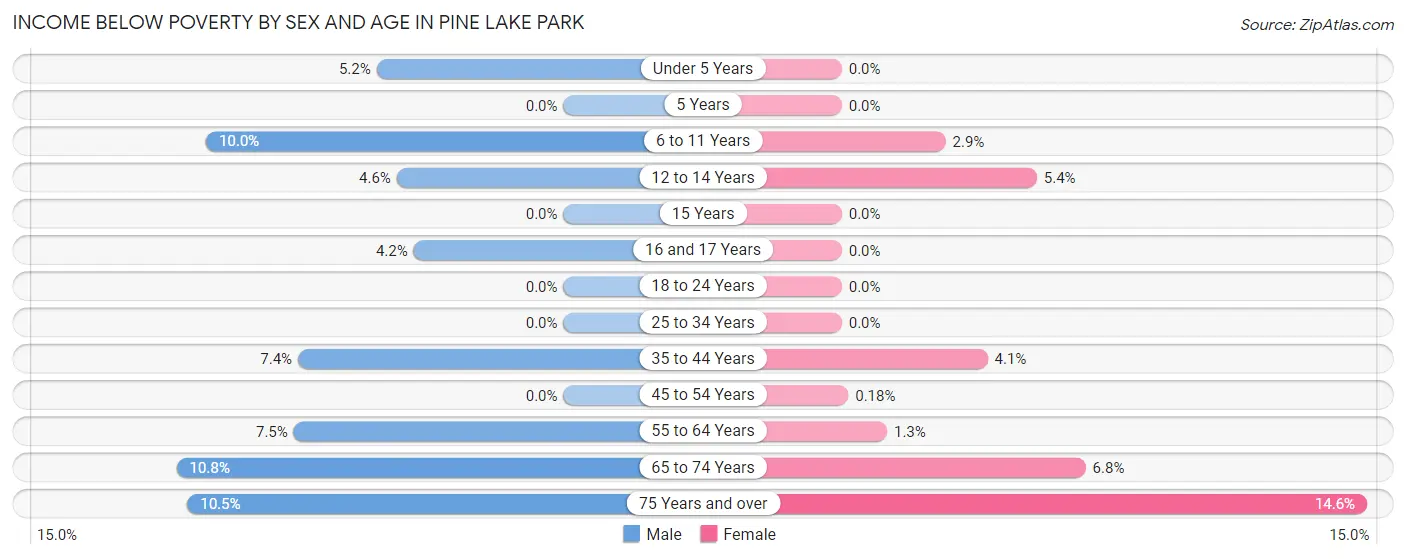
| Age Bracket | Male | Female |
| Under 5 Years | 14 (5.2%) | 0 (0.0%) |
| 5 Years | 0 (0.0%) | 0 (0.0%) |
| 6 to 11 Years | 43 (10.0%) | 8 (2.9%) |
| 12 to 14 Years | 7 (4.6%) | 14 (5.4%) |
| 15 Years | 0 (0.0%) | 0 (0.0%) |
| 16 and 17 Years | 8 (4.2%) | 0 (0.0%) |
| 18 to 24 Years | 0 (0.0%) | 0 (0.0%) |
| 25 to 34 Years | 0 (0.0%) | 0 (0.0%) |
| 35 to 44 Years | 49 (7.4%) | 29 (4.1%) |
| 45 to 54 Years | 0 (0.0%) | 1 (0.2%) |
| 55 to 64 Years | 44 (7.5%) | 9 (1.3%) |
| 65 to 74 Years | 45 (10.8%) | 29 (6.8%) |
| 75 Years and over | 20 (10.5%) | 38 (14.6%) |
| Total | 230 (5.0%) | 128 (2.6%) |
Income Above Poverty by Sex and Age in Pine Lake Park
According to the poverty statistics in Pine Lake Park, males aged 5 years and females aged under 5 years are the age groups that are most secure financially, with 100.0% of males and 100.0% of females in these age groups living above the poverty line.
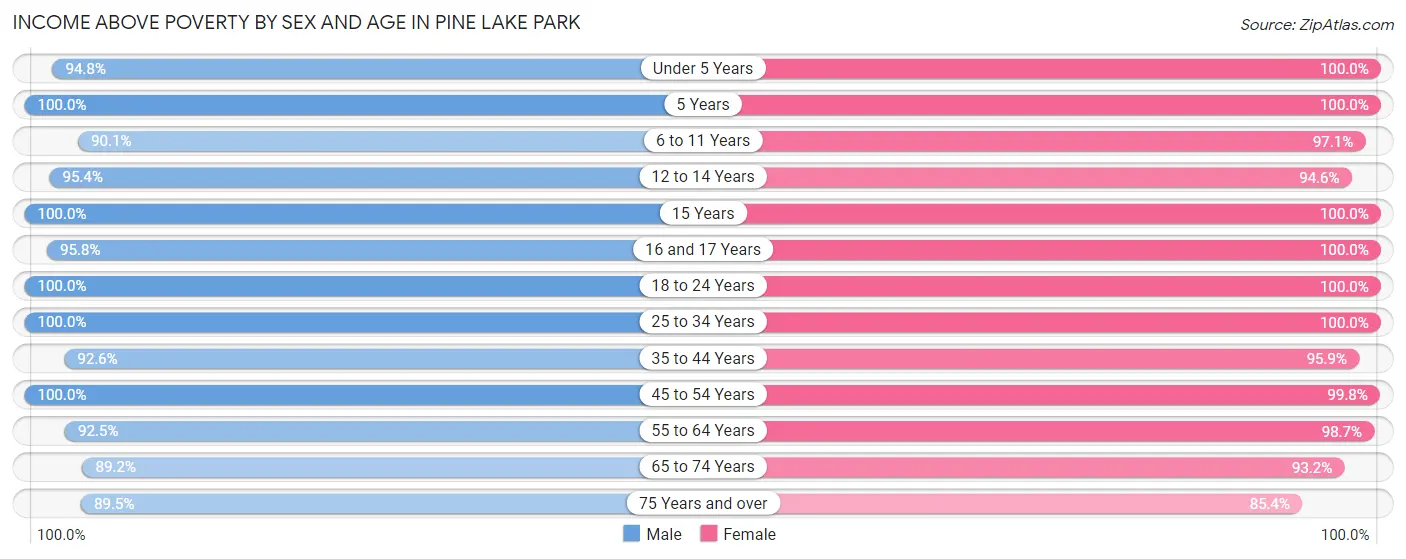
| Age Bracket | Male | Female |
| Under 5 Years | 255 (94.8%) | 553 (100.0%) |
| 5 Years | 66 (100.0%) | 26 (100.0%) |
| 6 to 11 Years | 389 (90.0%) | 269 (97.1%) |
| 12 to 14 Years | 144 (95.4%) | 244 (94.6%) |
| 15 Years | 19 (100.0%) | 82 (100.0%) |
| 16 and 17 Years | 184 (95.8%) | 101 (100.0%) |
| 18 to 24 Years | 369 (100.0%) | 362 (100.0%) |
| 25 to 34 Years | 731 (100.0%) | 669 (100.0%) |
| 35 to 44 Years | 614 (92.6%) | 686 (95.9%) |
| 45 to 54 Years | 549 (100.0%) | 551 (99.8%) |
| 55 to 64 Years | 542 (92.5%) | 704 (98.7%) |
| 65 to 74 Years | 373 (89.2%) | 398 (93.2%) |
| 75 Years and over | 171 (89.5%) | 222 (85.4%) |
| Total | 4,406 (95.0%) | 4,867 (97.4%) |
Income Below Poverty Among Married-Couple Families in Pine Lake Park
The poverty statistics for married-couple families in Pine Lake Park show that 1.5% or 26 of the total 1,787 families live below the poverty line. Families with 3 or 4 children have the highest poverty rate of 6.8%, comprising of 16 families. On the other hand, families with 1 or 2 children have the lowest poverty rate of 0.0%, which includes 0 families.
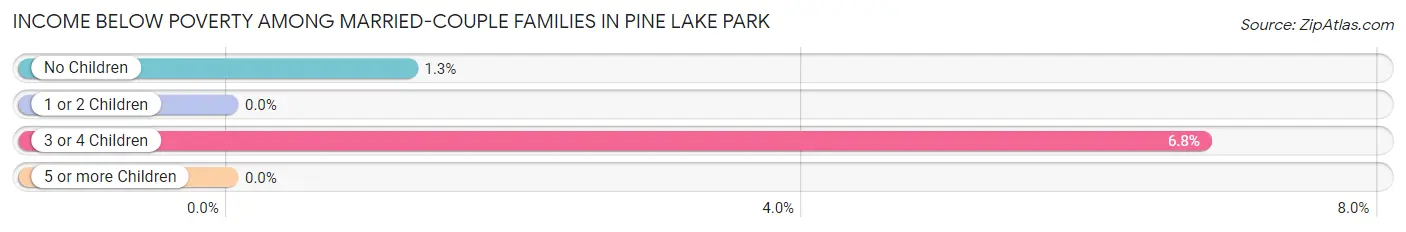
| Children | Above Poverty | Below Poverty |
| No Children | 790 (98.8%) | 10 (1.3%) |
| 1 or 2 Children | 751 (100.0%) | 0 (0.0%) |
| 3 or 4 Children | 220 (93.2%) | 16 (6.8%) |
| 5 or more Children | 0 (0.0%) | 0 (0.0%) |
| Total | 1,761 (98.6%) | 26 (1.5%) |
Income Below Poverty Among Single-Parent Households in Pine Lake Park
According to the poverty data in Pine Lake Park, 8.9% or 18 single-father households and 4.8% or 14 single-mother households are living below the poverty line. Among single-father households, those with no children have the highest poverty rate, with 18 households (12.5%) experiencing poverty. Likewise, among single-mother households, those with 3 or 4 children have the highest poverty rate, with 8 households (23.5%) falling below the poverty line.
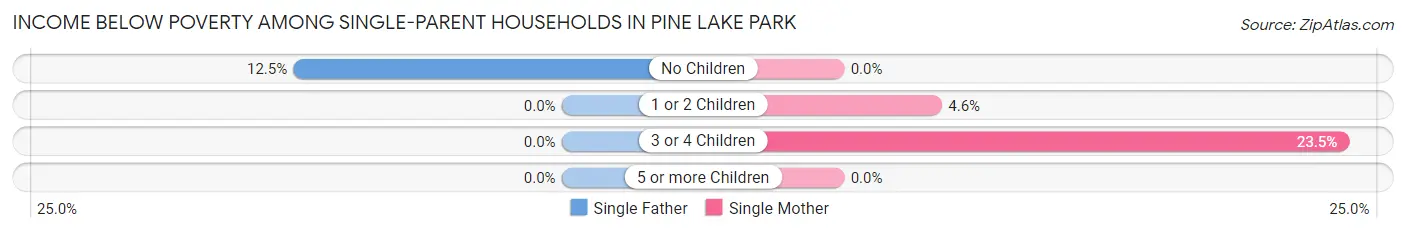
| Children | Single Father | Single Mother |
| No Children | 18 (12.5%) | 0 (0.0%) |
| 1 or 2 Children | 0 (0.0%) | 6 (4.5%) |
| 3 or 4 Children | 0 (0.0%) | 8 (23.5%) |
| 5 or more Children | 0 (0.0%) | 0 (0.0%) |
| Total | 18 (8.9%) | 14 (4.8%) |
Income Below Poverty Among Married-Couple vs Single-Parent Households in Pine Lake Park
The poverty data for Pine Lake Park shows that 26 of the married-couple family households (1.5%) and 32 of the single-parent households (6.5%) are living below the poverty level. Within the married-couple family households, those with 3 or 4 children have the highest poverty rate, with 16 households (6.8%) falling below the poverty line. Among the single-parent households, those with 3 or 4 children have the highest poverty rate, with 8 household (18.6%) living below poverty.
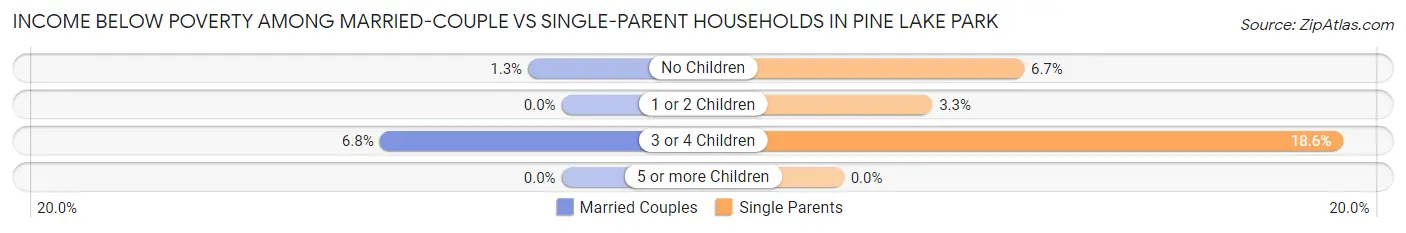
| Children | Married-Couple Families | Single-Parent Households |
| No Children | 10 (1.3%) | 18 (6.7%) |
| 1 or 2 Children | 0 (0.0%) | 6 (3.3%) |
| 3 or 4 Children | 16 (6.8%) | 8 (18.6%) |
| 5 or more Children | 0 (0.0%) | 0 (0.0%) |
| Total | 26 (1.5%) | 32 (6.5%) |
Employment Characteristics in Pine Lake Park
Employment by Class of Employer in Pine Lake Park
Among the 4,680 employed individuals in Pine Lake Park, private company employees (3,232 | 69.1%), not-for-profit organizations (397 | 8.5%), and local government employees (389 | 8.3%) make up the most common classes of employment.
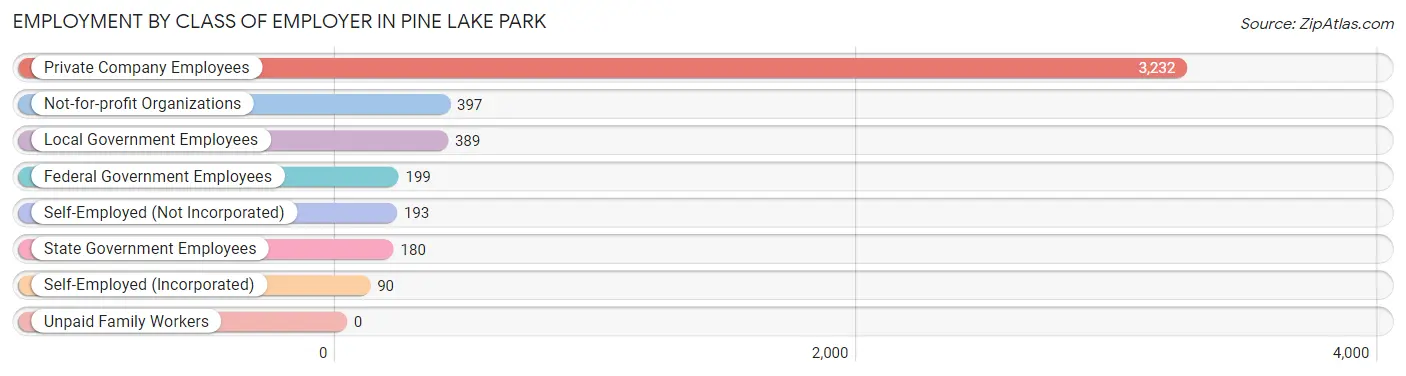
| Employer Class | # Employees | % Employees |
| Private Company Employees | 3,232 | 69.1% |
| Self-Employed (Incorporated) | 90 | 1.9% |
| Self-Employed (Not Incorporated) | 193 | 4.1% |
| Not-for-profit Organizations | 397 | 8.5% |
| Local Government Employees | 389 | 8.3% |
| State Government Employees | 180 | 3.8% |
| Federal Government Employees | 199 | 4.3% |
| Unpaid Family Workers | 0 | 0.0% |
| Total | 4,680 | 100.0% |
Employment Status by Age in Pine Lake Park
According to the labor force statistics for Pine Lake Park, out of the total population over 16 years of age (7,578), 66.2% or 5,017 individuals are in the labor force, with 3.5% or 176 of them unemployed. The age group with the highest labor force participation rate is 25 to 29 years, with 92.5% or 768 individuals in the labor force. Within the labor force, the 35 to 44 years age range has the highest percentage of unemployed individuals, with 7.1% or 79 of them being unemployed.
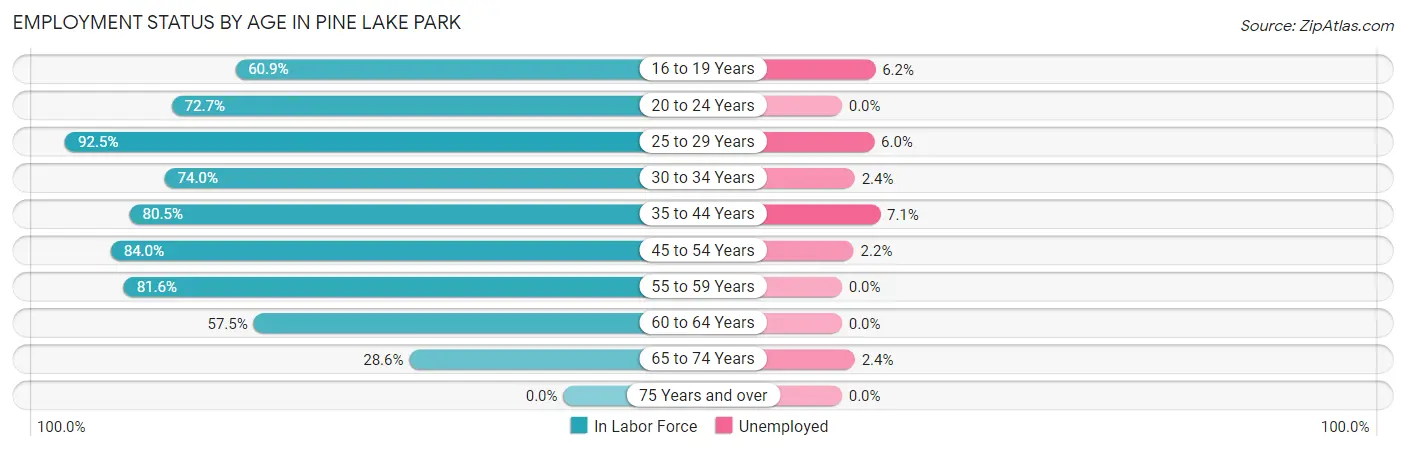
| Age Bracket | In Labor Force | Unemployed |
| 16 to 19 Years | 307 (60.9%) | 19 (6.2%) |
| 20 to 24 Years | 378 (72.7%) | 0 (0.0%) |
| 25 to 29 Years | 768 (92.5%) | 46 (6.0%) |
| 30 to 34 Years | 422 (74.0%) | 10 (2.4%) |
| 35 to 44 Years | 1,109 (80.5%) | 79 (7.1%) |
| 45 to 54 Years | 925 (84.0%) | 20 (2.2%) |
| 55 to 59 Years | 350 (81.6%) | 0 (0.0%) |
| 60 to 64 Years | 506 (57.5%) | 0 (0.0%) |
| 65 to 74 Years | 248 (28.6%) | 6 (2.4%) |
| 75 Years and over | 0 (0.0%) | 0 (0.0%) |
| Total | 5,017 (66.2%) | 176 (3.5%) |
Employment Status by Educational Attainment in Pine Lake Park
According to labor force statistics for Pine Lake Park, 78.6% of individuals (4,078) out of the total population between 25 and 64 years of age (5,188) are in the labor force, with 3.7% or 151 of them being unemployed. The group with the highest labor force participation rate are those with the educational attainment of bachelor's degree or higher, with 87.9% or 1,253 individuals in the labor force. Within the labor force, individuals with less than high school education have the highest percentage of unemployment, with 11.3% or 12 of them being unemployed.
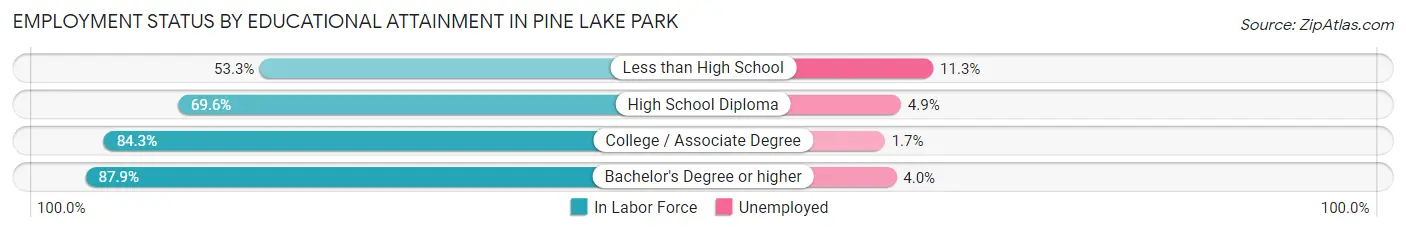
| Educational Attainment | In Labor Force | Unemployed |
| Less than High School | 106 (53.3%) | 22 (11.3%) |
| High School Diploma | 1,347 (69.6%) | 95 (4.9%) |
| College / Associate Degree | 1,372 (84.3%) | 28 (1.7%) |
| Bachelor's Degree or higher | 1,253 (87.9%) | 57 (4.0%) |
| Total | 4,078 (78.6%) | 192 (3.7%) |
Employment Occupations by Sex in Pine Lake Park
Management, Business, Science and Arts Occupations
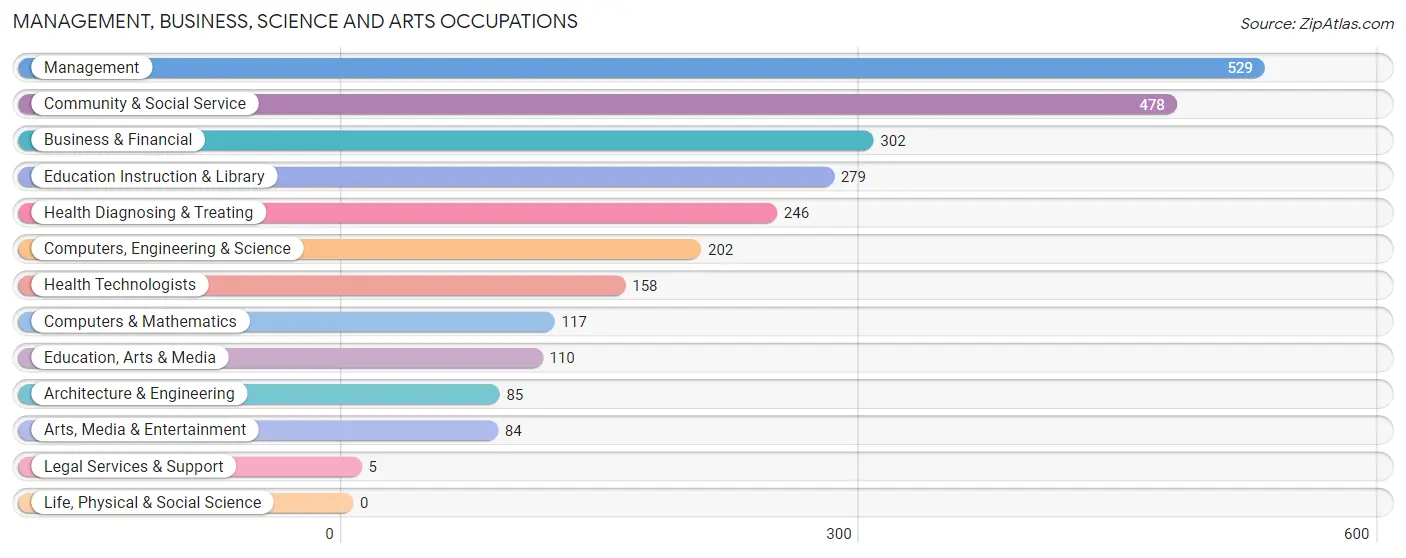
The most common Management, Business, Science and Arts occupations in Pine Lake Park are Management (529 | 11.1%), Community & Social Service (478 | 10.0%), Business & Financial (302 | 6.3%), Education Instruction & Library (279 | 5.8%), and Health Diagnosing & Treating (246 | 5.1%).
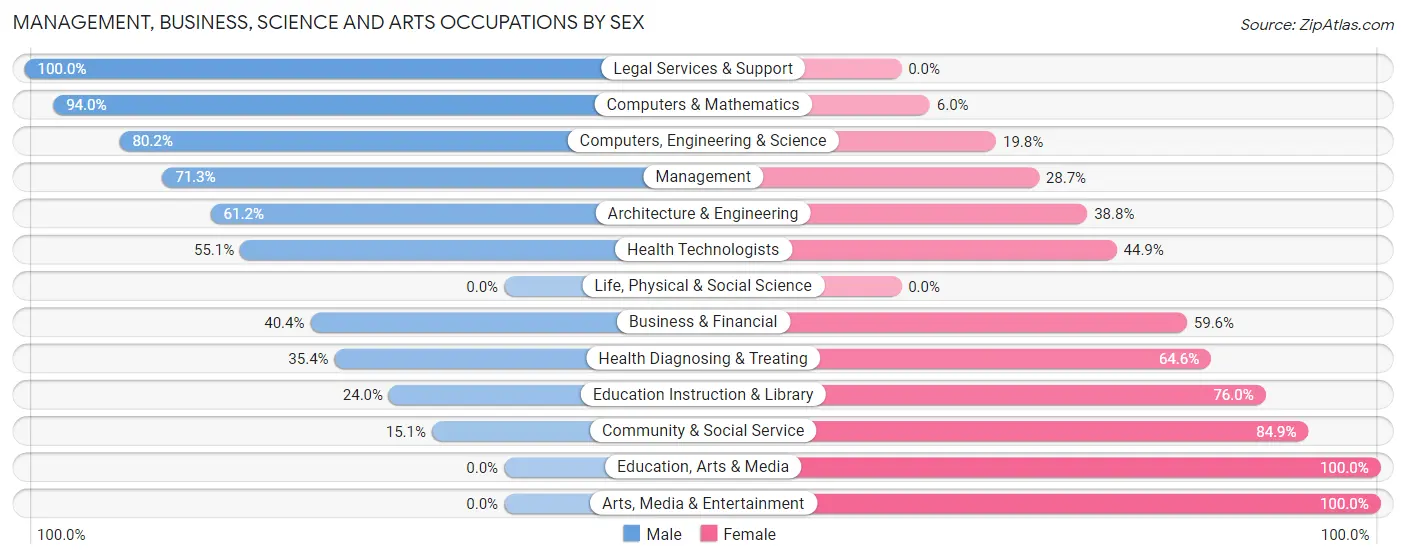
Management, Business, Science and Arts Occupations by Sex
Within the Management, Business, Science and Arts occupations in Pine Lake Park, the most male-oriented occupations are Legal Services & Support (100.0%), Computers & Mathematics (94.0%), and Computers, Engineering & Science (80.2%), while the most female-oriented occupations are Education, Arts & Media (100.0%), Arts, Media & Entertainment (100.0%), and Community & Social Service (84.9%).
| Occupation | Male | Female |
| Management | 377 (71.3%) | 152 (28.7%) |
| Business & Financial | 122 (40.4%) | 180 (59.6%) |
| Computers, Engineering & Science | 162 (80.2%) | 40 (19.8%) |
| Computers & Mathematics | 110 (94.0%) | 7 (6.0%) |
| Architecture & Engineering | 52 (61.2%) | 33 (38.8%) |
| Life, Physical & Social Science | 0 (0.0%) | 0 (0.0%) |
| Community & Social Service | 72 (15.1%) | 406 (84.9%) |
| Education, Arts & Media | 0 (0.0%) | 110 (100.0%) |
| Legal Services & Support | 5 (100.0%) | 0 (0.0%) |
| Education Instruction & Library | 67 (24.0%) | 212 (76.0%) |
| Arts, Media & Entertainment | 0 (0.0%) | 84 (100.0%) |
| Health Diagnosing & Treating | 87 (35.4%) | 159 (64.6%) |
| Health Technologists | 87 (55.1%) | 71 (44.9%) |
| Total (Category) | 820 (46.7%) | 937 (53.3%) |
| Total (Overall) | 2,437 (50.9%) | 2,352 (49.1%) |
Services Occupations
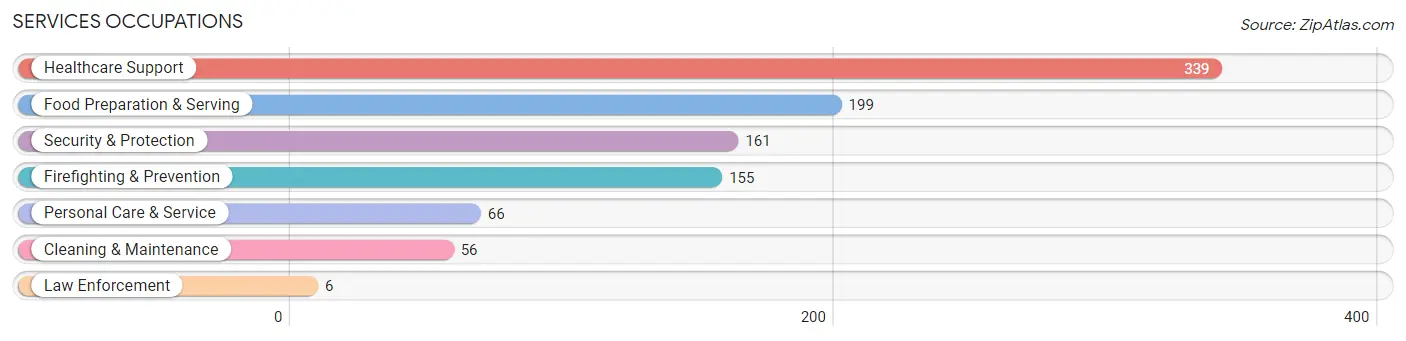
The most common Services occupations in Pine Lake Park are Healthcare Support (339 | 7.1%), Food Preparation & Serving (199 | 4.2%), Security & Protection (161 | 3.4%), Firefighting & Prevention (155 | 3.2%), and Personal Care & Service (66 | 1.4%).
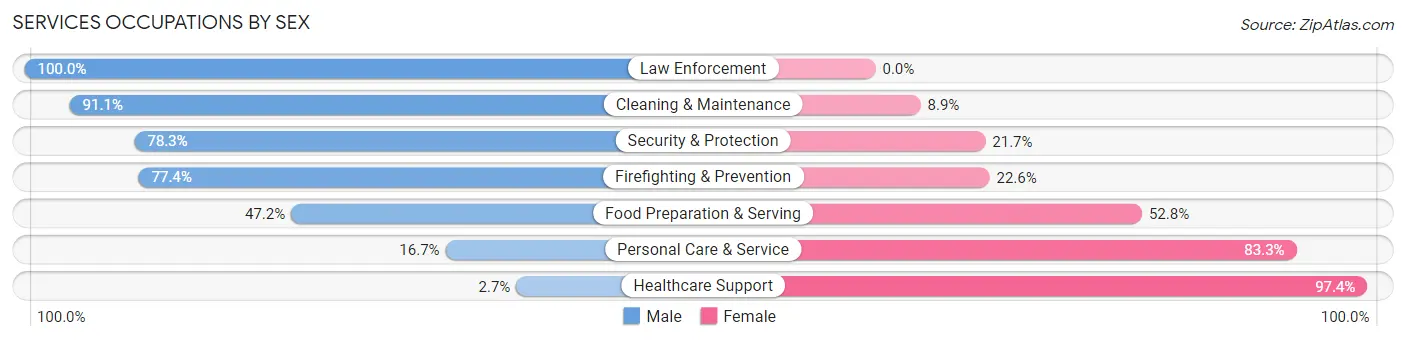
Services Occupations by Sex
Within the Services occupations in Pine Lake Park, the most male-oriented occupations are Law Enforcement (100.0%), Cleaning & Maintenance (91.1%), and Security & Protection (78.3%), while the most female-oriented occupations are Healthcare Support (97.4%), Personal Care & Service (83.3%), and Food Preparation & Serving (52.8%).
| Occupation | Male | Female |
| Healthcare Support | 9 (2.6%) | 330 (97.4%) |
| Security & Protection | 126 (78.3%) | 35 (21.7%) |
| Firefighting & Prevention | 120 (77.4%) | 35 (22.6%) |
| Law Enforcement | 6 (100.0%) | 0 (0.0%) |
| Food Preparation & Serving | 94 (47.2%) | 105 (52.8%) |
| Cleaning & Maintenance | 51 (91.1%) | 5 (8.9%) |
| Personal Care & Service | 11 (16.7%) | 55 (83.3%) |
| Total (Category) | 291 (35.4%) | 530 (64.6%) |
| Total (Overall) | 2,437 (50.9%) | 2,352 (49.1%) |
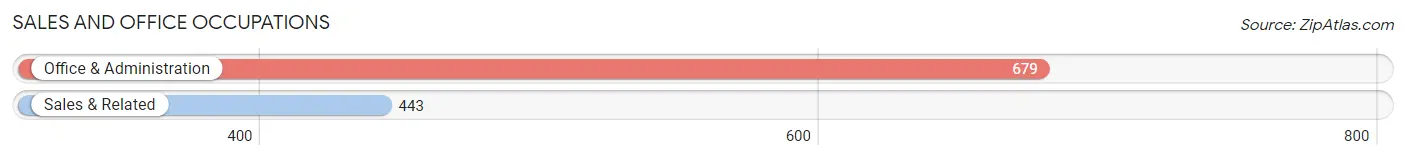
Sales and Office Occupations
The most common Sales and Office occupations in Pine Lake Park are Office & Administration (679 | 14.2%), and Sales & Related (443 | 9.2%).
Sales and Office Occupations by Sex
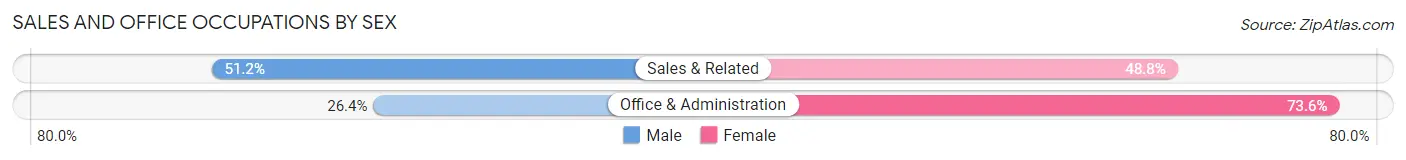
| Occupation | Male | Female |
| Sales & Related | 227 (51.2%) | 216 (48.8%) |
| Office & Administration | 179 (26.4%) | 500 (73.6%) |
| Total (Category) | 406 (36.2%) | 716 (63.8%) |
| Total (Overall) | 2,437 (50.9%) | 2,352 (49.1%) |
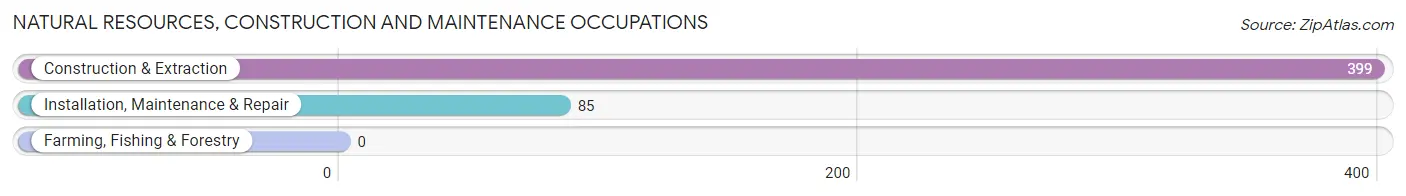
Natural Resources, Construction and Maintenance Occupations
The most common Natural Resources, Construction and Maintenance occupations in Pine Lake Park are Construction & Extraction (399 | 8.3%), and Installation, Maintenance & Repair (85 | 1.8%).
Natural Resources, Construction and Maintenance Occupations by Sex
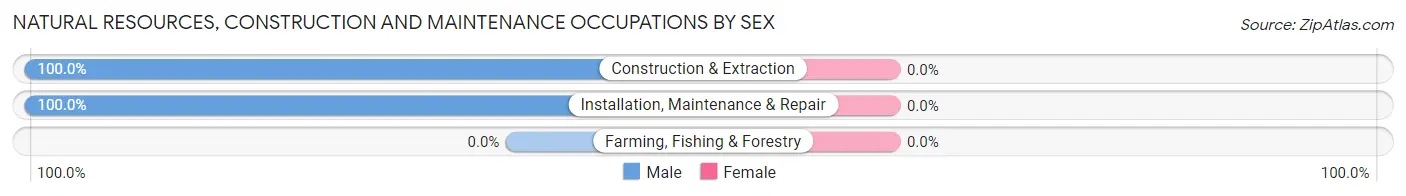
| Occupation | Male | Female |
| Farming, Fishing & Forestry | 0 (0.0%) | 0 (0.0%) |
| Construction & Extraction | 399 (100.0%) | 0 (0.0%) |
| Installation, Maintenance & Repair | 85 (100.0%) | 0 (0.0%) |
| Total (Category) | 484 (100.0%) | 0 (0.0%) |
| Total (Overall) | 2,437 (50.9%) | 2,352 (49.1%) |
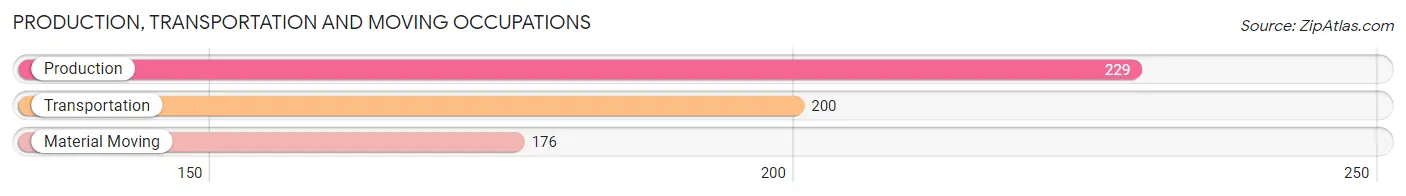
Production, Transportation and Moving Occupations
The most common Production, Transportation and Moving occupations in Pine Lake Park are Production (229 | 4.8%), Transportation (200 | 4.2%), and Material Moving (176 | 3.7%).
Production, Transportation and Moving Occupations by Sex
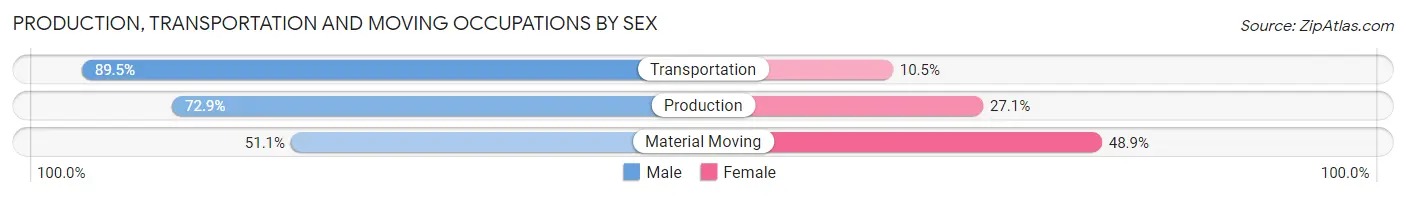
| Occupation | Male | Female |
| Production | 167 (72.9%) | 62 (27.1%) |
| Transportation | 179 (89.5%) | 21 (10.5%) |
| Material Moving | 90 (51.1%) | 86 (48.9%) |
| Total (Category) | 436 (72.1%) | 169 (27.9%) |
| Total (Overall) | 2,437 (50.9%) | 2,352 (49.1%) |
Employment Industries by Sex in Pine Lake Park
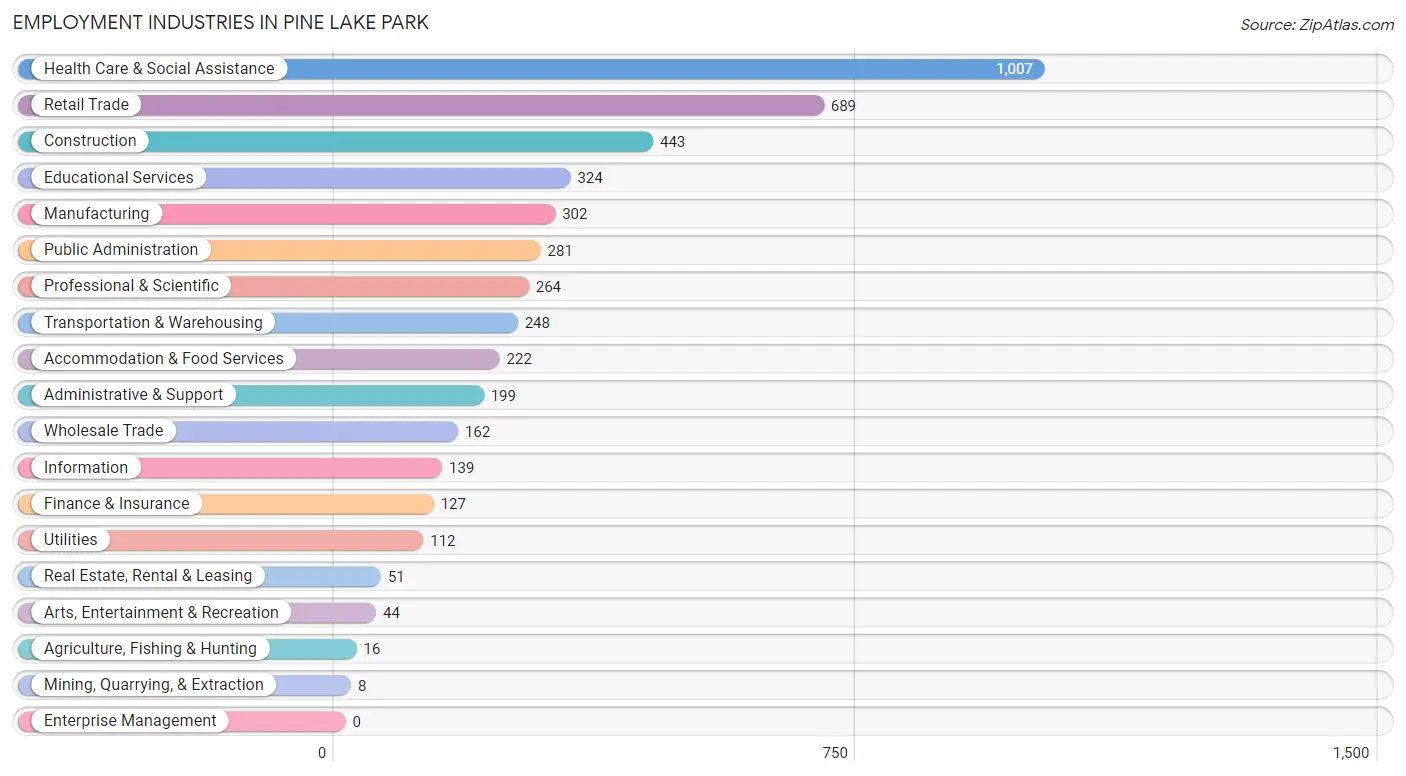
Employment Industries in Pine Lake Park
The major employment industries in Pine Lake Park include Health Care & Social Assistance (1,007 | 21.0%), Retail Trade (689 | 14.4%), Construction (443 | 9.2%), Educational Services (324 | 6.8%), and Manufacturing (302 | 6.3%).
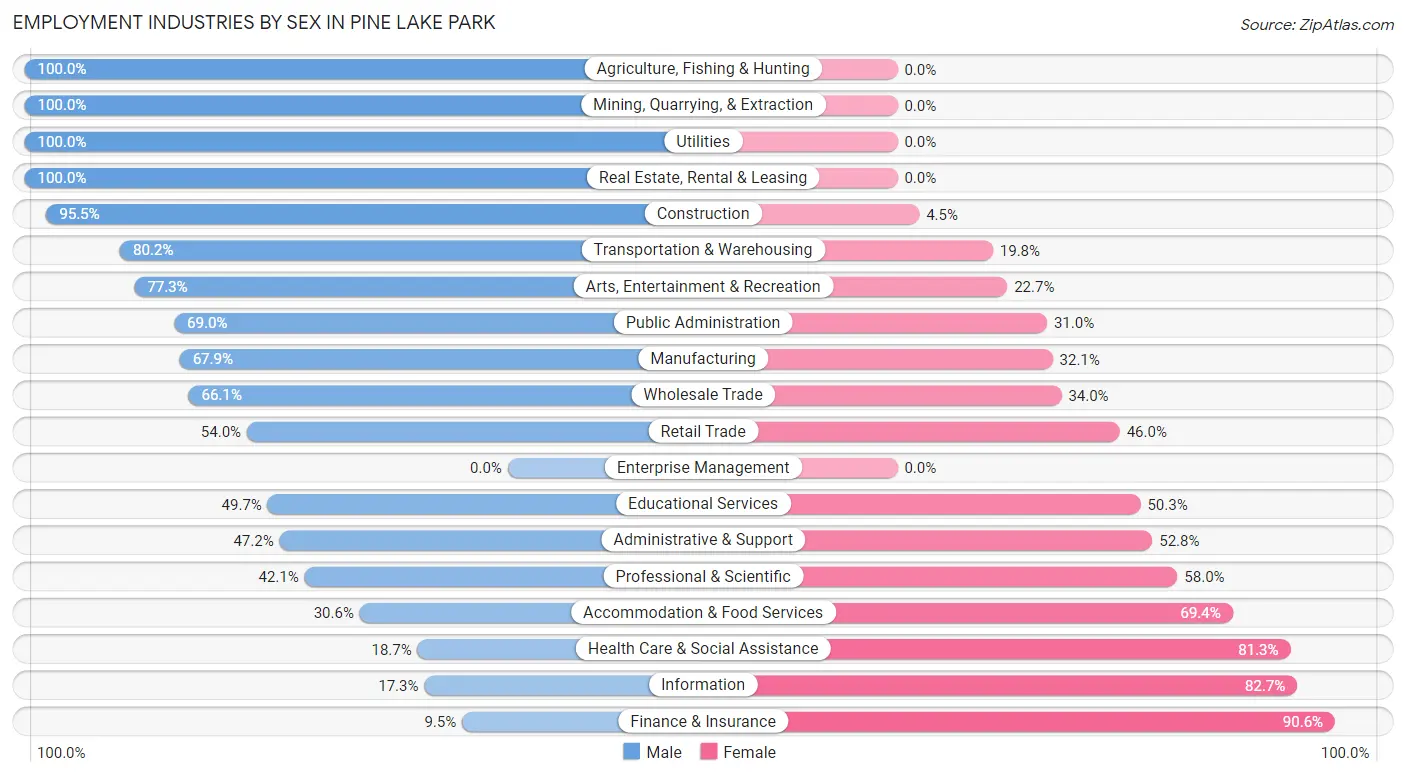
Employment Industries by Sex in Pine Lake Park
The Pine Lake Park industries that see more men than women are Agriculture, Fishing & Hunting (100.0%), Mining, Quarrying, & Extraction (100.0%), and Utilities (100.0%), whereas the industries that tend to have a higher number of women are Finance & Insurance (90.5%), Information (82.7%), and Health Care & Social Assistance (81.3%).
| Industry | Male | Female |
| Agriculture, Fishing & Hunting | 16 (100.0%) | 0 (0.0%) |
| Mining, Quarrying, & Extraction | 8 (100.0%) | 0 (0.0%) |
| Construction | 423 (95.5%) | 20 (4.5%) |
| Manufacturing | 205 (67.9%) | 97 (32.1%) |
| Wholesale Trade | 107 (66.0%) | 55 (34.0%) |
| Retail Trade | 372 (54.0%) | 317 (46.0%) |
| Transportation & Warehousing | 199 (80.2%) | 49 (19.8%) |
| Utilities | 112 (100.0%) | 0 (0.0%) |
| Information | 24 (17.3%) | 115 (82.7%) |
| Finance & Insurance | 12 (9.5%) | 115 (90.5%) |
| Real Estate, Rental & Leasing | 51 (100.0%) | 0 (0.0%) |
| Professional & Scientific | 111 (42.0%) | 153 (58.0%) |
| Enterprise Management | 0 (0.0%) | 0 (0.0%) |
| Administrative & Support | 94 (47.2%) | 105 (52.8%) |
| Educational Services | 161 (49.7%) | 163 (50.3%) |
| Health Care & Social Assistance | 188 (18.7%) | 819 (81.3%) |
| Arts, Entertainment & Recreation | 34 (77.3%) | 10 (22.7%) |
| Accommodation & Food Services | 68 (30.6%) | 154 (69.4%) |
| Public Administration | 194 (69.0%) | 87 (31.0%) |
| Total | 2,437 (50.9%) | 2,352 (49.1%) |
Education in Pine Lake Park
School Enrollment in Pine Lake Park
The most common levels of schooling among the 2,403 students in Pine Lake Park are college / undergraduate (659 | 27.4%), middle school (605 | 25.2%), and high school (482 | 20.1%).
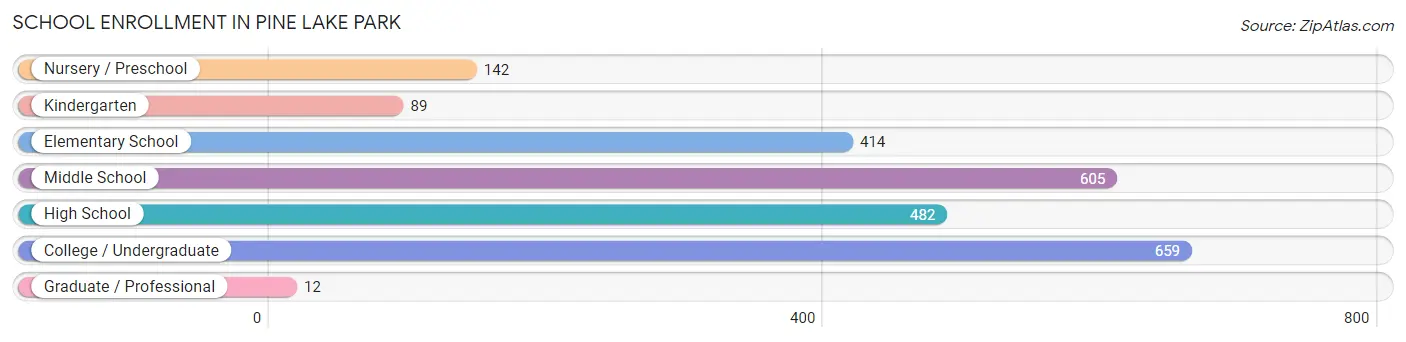
| School Level | # Students | % Students |
| Nursery / Preschool | 142 | 5.9% |
| Kindergarten | 89 | 3.7% |
| Elementary School | 414 | 17.2% |
| Middle School | 605 | 25.2% |
| High School | 482 | 20.1% |
| College / Undergraduate | 659 | 27.4% |
| Graduate / Professional | 12 | 0.5% |
| Total | 2,403 | 100.0% |
School Enrollment by Age by Funding Source in Pine Lake Park
Out of a total of 2,403 students who are enrolled in schools in Pine Lake Park, 476 (19.8%) attend a private institution, while the remaining 1,927 (80.2%) are enrolled in public schools. The age group of 35 years and over has the highest likelihood of being enrolled in private schools, with 75 (60.0% in the age bracket) enrolled. Conversely, the age group of 18 to 19 year olds has the lowest likelihood of being enrolled in a private school, with 105 (100.0% in the age bracket) attending a public institution.
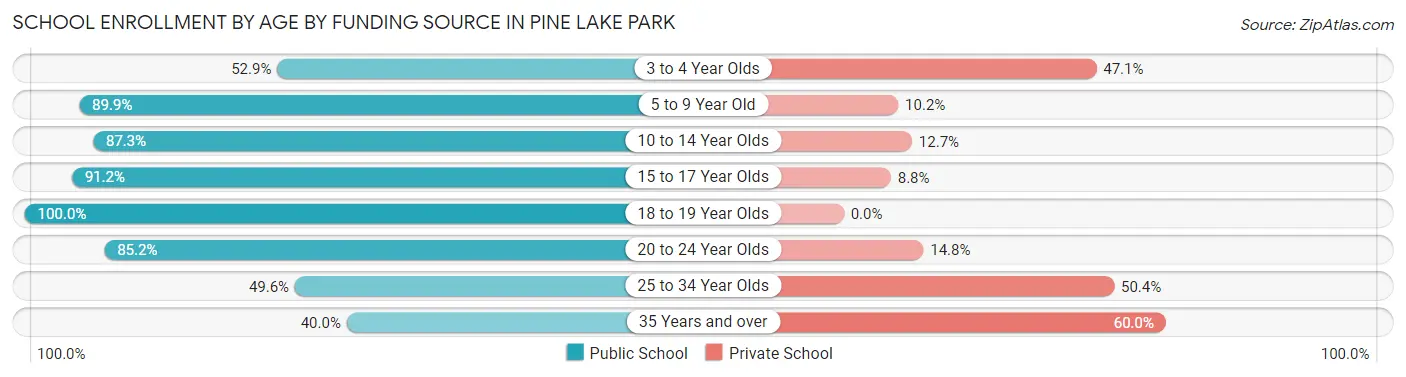
| Age Bracket | Public School | Private School |
| 3 to 4 Year Olds | 63 (52.9%) | 56 (47.1%) |
| 5 to 9 Year Old | 425 (89.8%) | 48 (10.2%) |
| 10 to 14 Year Olds | 625 (87.3%) | 91 (12.7%) |
| 15 to 17 Year Olds | 322 (91.2%) | 31 (8.8%) |
| 18 to 19 Year Olds | 105 (100.0%) | 0 (0.0%) |
| 20 to 24 Year Olds | 201 (85.2%) | 35 (14.8%) |
| 25 to 34 Year Olds | 137 (49.6%) | 139 (50.4%) |
| 35 Years and over | 50 (40.0%) | 75 (60.0%) |
| Total | 1,927 (80.2%) | 476 (19.8%) |
Educational Attainment by Field of Study in Pine Lake Park
Business (299 | 17.0%), education (232 | 13.2%), science & technology (213 | 12.1%), arts & humanities (208 | 11.8%), and liberal arts & history (195 | 11.1%) are the most common fields of study among 1,758 individuals in Pine Lake Park who have obtained a bachelor's degree or higher.
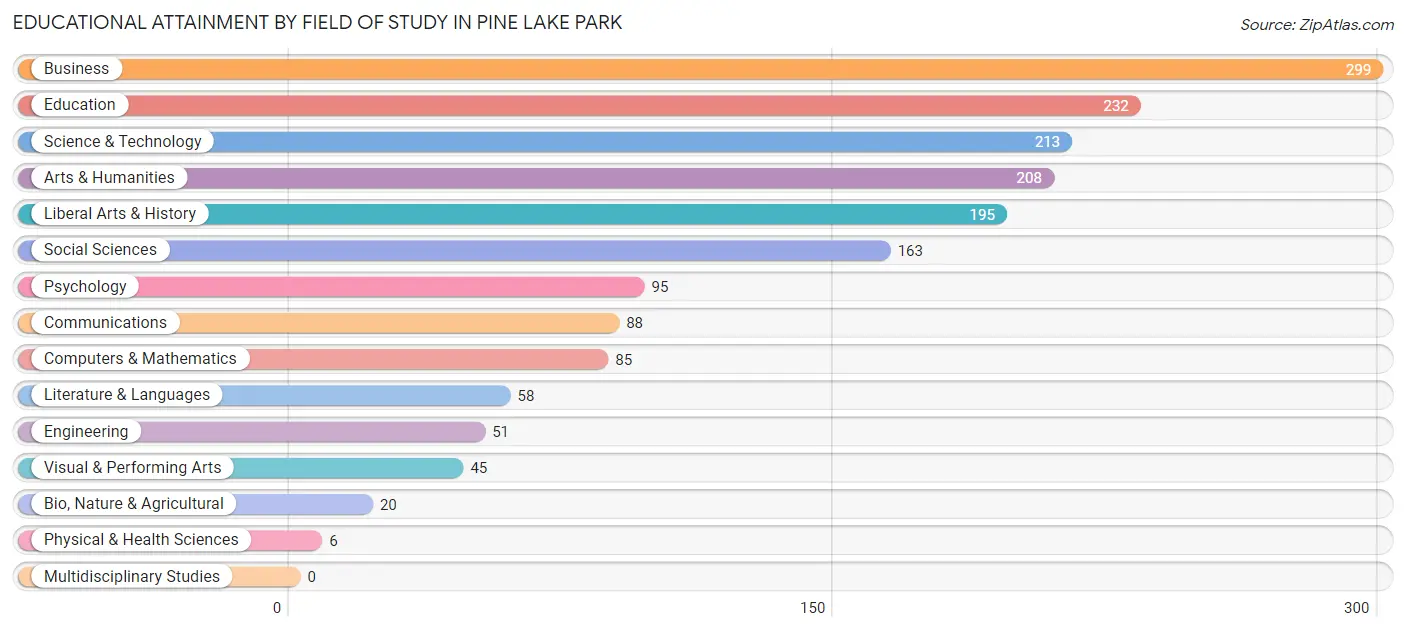
| Field of Study | # Graduates | % Graduates |
| Computers & Mathematics | 85 | 4.8% |
| Bio, Nature & Agricultural | 20 | 1.1% |
| Physical & Health Sciences | 6 | 0.3% |
| Psychology | 95 | 5.4% |
| Social Sciences | 163 | 9.3% |
| Engineering | 51 | 2.9% |
| Multidisciplinary Studies | 0 | 0.0% |
| Science & Technology | 213 | 12.1% |
| Business | 299 | 17.0% |
| Education | 232 | 13.2% |
| Literature & Languages | 58 | 3.3% |
| Liberal Arts & History | 195 | 11.1% |
| Visual & Performing Arts | 45 | 2.6% |
| Communications | 88 | 5.0% |
| Arts & Humanities | 208 | 11.8% |
| Total | 1,758 | 100.0% |
Transportation & Commute in Pine Lake Park
Vehicle Availability by Sex in Pine Lake Park
The most prevalent vehicle ownership categories in Pine Lake Park are males with 2 vehicles (987, accounting for 40.6%) and females with 2 vehicles (945, making up 43.9%).
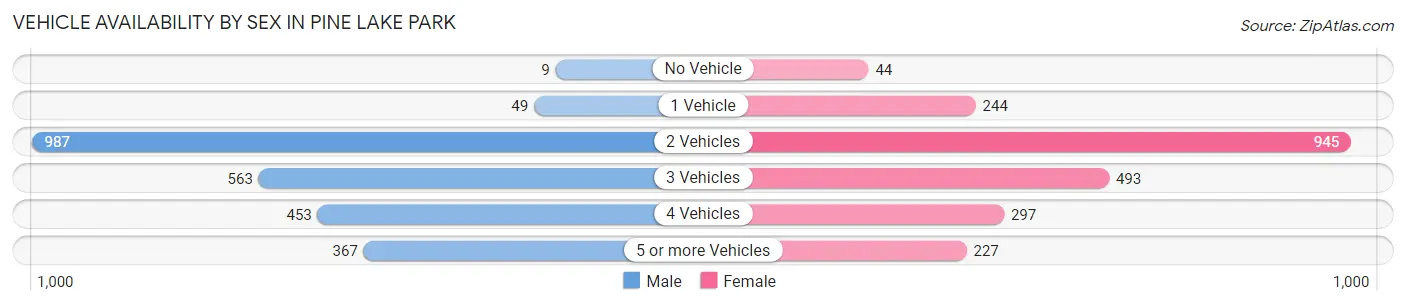
| Vehicles Available | Male | Female |
| No Vehicle | 9 (0.4%) | 44 (2.0%) |
| 1 Vehicle | 49 (2.0%) | 244 (10.8%) |
| 2 Vehicles | 987 (40.6%) | 945 (42.0%) |
| 3 Vehicles | 563 (23.2%) | 493 (21.9%) |
| 4 Vehicles | 453 (18.7%) | 297 (13.2%) |
| 5 or more Vehicles | 367 (15.1%) | 227 (10.1%) |
| Total | 2,428 (100.0%) | 2,250 (100.0%) |
Commute Time in Pine Lake Park
The most frequently occuring commute durations in Pine Lake Park are 60 to 89 minutes (768 commuters, 18.1%), 30 to 34 minutes (568 commuters, 13.4%), and 15 to 19 minutes (518 commuters, 12.2%).
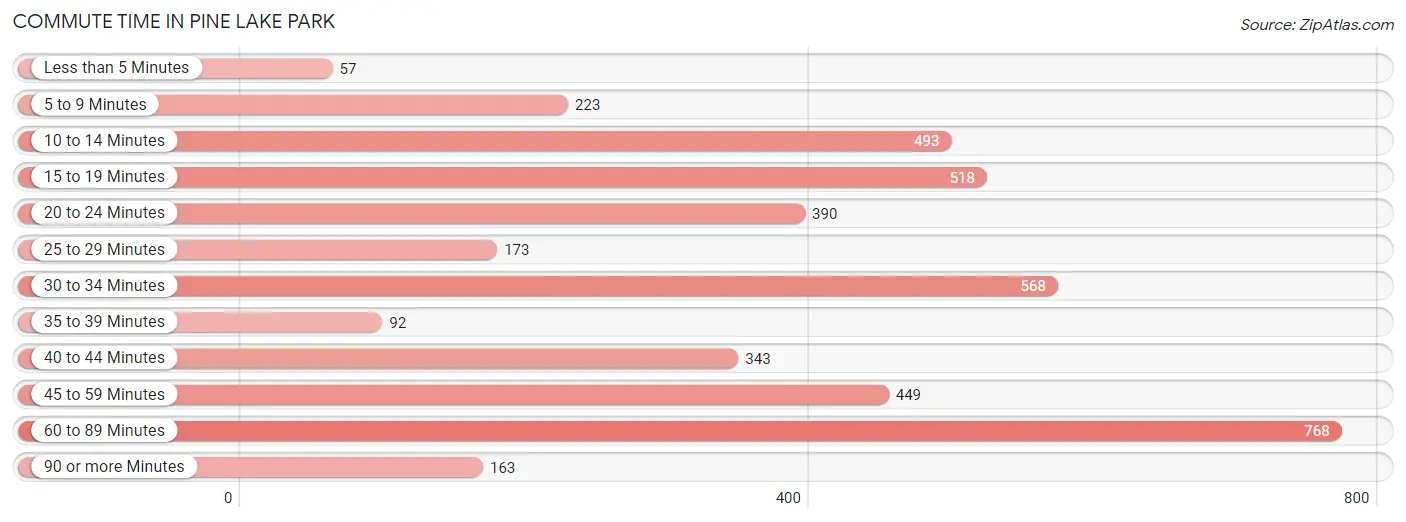
| Commute Time | # Commuters | % Commuters |
| Less than 5 Minutes | 57 | 1.3% |
| 5 to 9 Minutes | 223 | 5.3% |
| 10 to 14 Minutes | 493 | 11.6% |
| 15 to 19 Minutes | 518 | 12.2% |
| 20 to 24 Minutes | 390 | 9.2% |
| 25 to 29 Minutes | 173 | 4.1% |
| 30 to 34 Minutes | 568 | 13.4% |
| 35 to 39 Minutes | 92 | 2.2% |
| 40 to 44 Minutes | 343 | 8.1% |
| 45 to 59 Minutes | 449 | 10.6% |
| 60 to 89 Minutes | 768 | 18.1% |
| 90 or more Minutes | 163 | 3.8% |
Commute Time by Sex in Pine Lake Park
The most common commute times in Pine Lake Park are 60 to 89 minutes (446 commuters, 20.7%) for males and 60 to 89 minutes (322 commuters, 15.4%) for females.
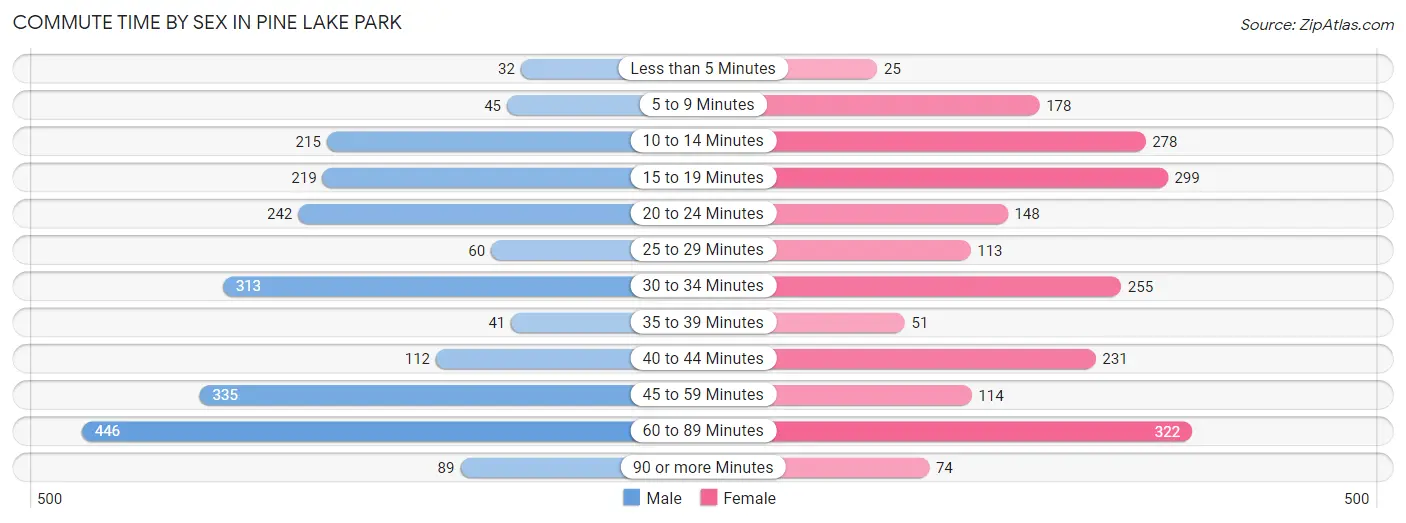
| Commute Time | Male | Female |
| Less than 5 Minutes | 32 (1.5%) | 25 (1.2%) |
| 5 to 9 Minutes | 45 (2.1%) | 178 (8.5%) |
| 10 to 14 Minutes | 215 (10.0%) | 278 (13.3%) |
| 15 to 19 Minutes | 219 (10.2%) | 299 (14.3%) |
| 20 to 24 Minutes | 242 (11.3%) | 148 (7.1%) |
| 25 to 29 Minutes | 60 (2.8%) | 113 (5.4%) |
| 30 to 34 Minutes | 313 (14.6%) | 255 (12.2%) |
| 35 to 39 Minutes | 41 (1.9%) | 51 (2.4%) |
| 40 to 44 Minutes | 112 (5.2%) | 231 (11.1%) |
| 45 to 59 Minutes | 335 (15.6%) | 114 (5.5%) |
| 60 to 89 Minutes | 446 (20.7%) | 322 (15.4%) |
| 90 or more Minutes | 89 (4.1%) | 74 (3.5%) |
Time of Departure to Work by Sex in Pine Lake Park
The most frequent times of departure to work in Pine Lake Park are 6:30 AM to 6:59 AM (392, 18.2%) for males and 7:00 AM to 7:29 AM (343, 16.4%) for females.
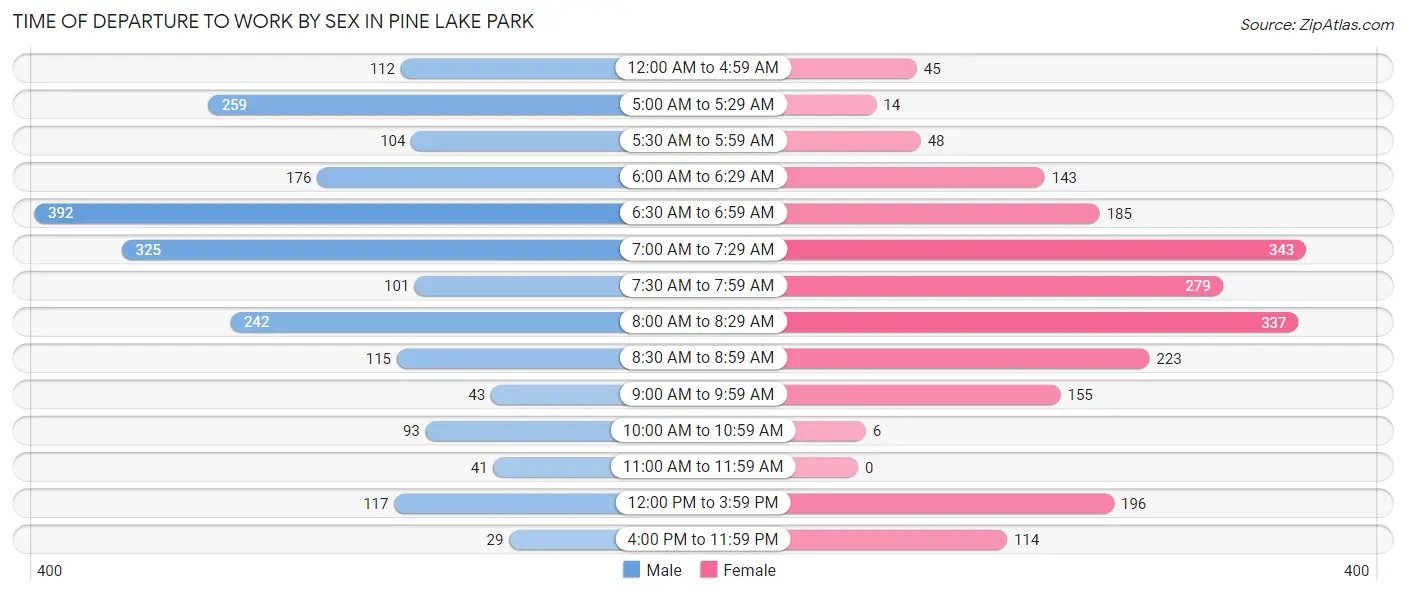
| Time of Departure | Male | Female |
| 12:00 AM to 4:59 AM | 112 (5.2%) | 45 (2.2%) |
| 5:00 AM to 5:29 AM | 259 (12.0%) | 14 (0.7%) |
| 5:30 AM to 5:59 AM | 104 (4.8%) | 48 (2.3%) |
| 6:00 AM to 6:29 AM | 176 (8.2%) | 143 (6.9%) |
| 6:30 AM to 6:59 AM | 392 (18.2%) | 185 (8.9%) |
| 7:00 AM to 7:29 AM | 325 (15.1%) | 343 (16.4%) |
| 7:30 AM to 7:59 AM | 101 (4.7%) | 279 (13.4%) |
| 8:00 AM to 8:29 AM | 242 (11.3%) | 337 (16.1%) |
| 8:30 AM to 8:59 AM | 115 (5.3%) | 223 (10.7%) |
| 9:00 AM to 9:59 AM | 43 (2.0%) | 155 (7.4%) |
| 10:00 AM to 10:59 AM | 93 (4.3%) | 6 (0.3%) |
| 11:00 AM to 11:59 AM | 41 (1.9%) | 0 (0.0%) |
| 12:00 PM to 3:59 PM | 117 (5.4%) | 196 (9.4%) |
| 4:00 PM to 11:59 PM | 29 (1.3%) | 114 (5.5%) |
| Total | 2,149 (100.0%) | 2,088 (100.0%) |
Housing Occupancy in Pine Lake Park
Occupancy by Ownership in Pine Lake Park
Of the total 3,066 dwellings in Pine Lake Park, owner-occupied units account for 2,564 (83.6%), while renter-occupied units make up 502 (16.4%).
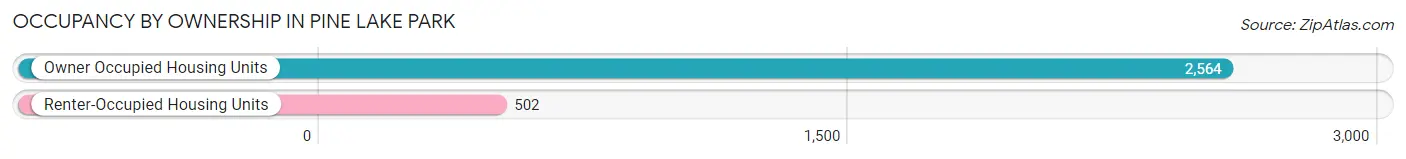
| Occupancy | # Housing Units | % Housing Units |
| Owner Occupied Housing Units | 2,564 | 83.6% |
| Renter-Occupied Housing Units | 502 | 16.4% |
| Total Occupied Housing Units | 3,066 | 100.0% |
Occupancy by Household Size in Pine Lake Park
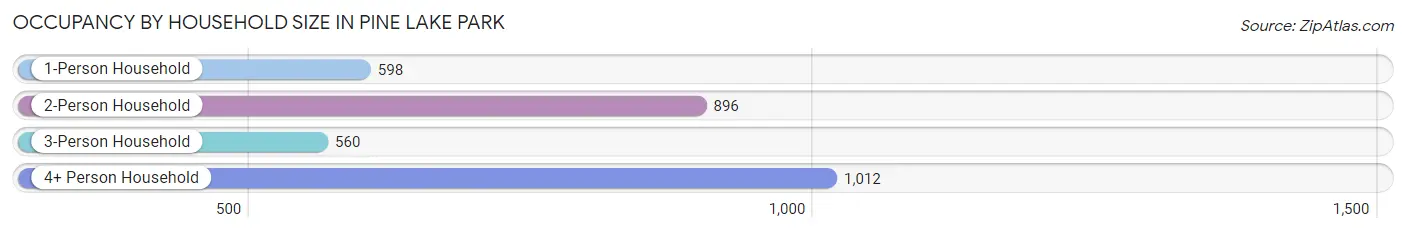
| Household Size | # Housing Units | % Housing Units |
| 1-Person Household | 598 | 19.5% |
| 2-Person Household | 896 | 29.2% |
| 3-Person Household | 560 | 18.3% |
| 4+ Person Household | 1,012 | 33.0% |
| Total Housing Units | 3,066 | 100.0% |
Occupancy by Ownership by Household Size in Pine Lake Park
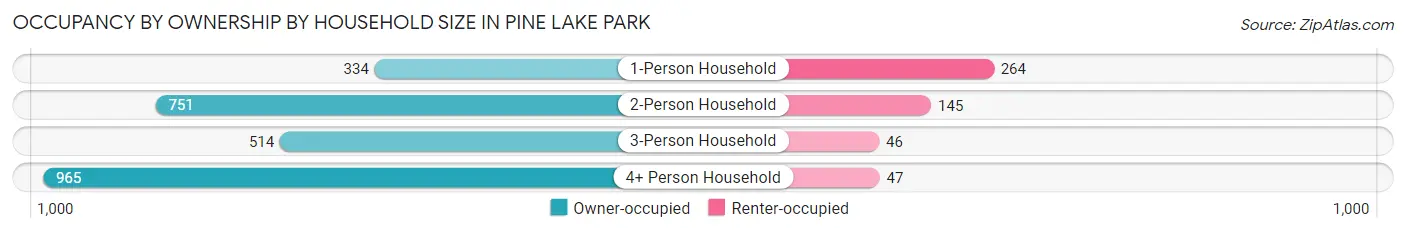
| Household Size | Owner-occupied | Renter-occupied |
| 1-Person Household | 334 (55.8%) | 264 (44.2%) |
| 2-Person Household | 751 (83.8%) | 145 (16.2%) |
| 3-Person Household | 514 (91.8%) | 46 (8.2%) |
| 4+ Person Household | 965 (95.4%) | 47 (4.6%) |
| Total Housing Units | 2,564 (83.6%) | 502 (16.4%) |
Occupancy by Educational Attainment in Pine Lake Park
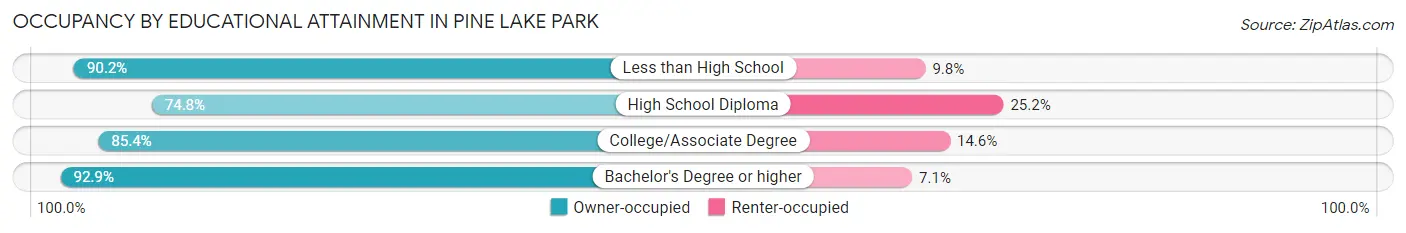
| Household Size | Owner-occupied | Renter-occupied |
| Less than High School | 83 (90.2%) | 9 (9.8%) |
| High School Diploma | 874 (74.8%) | 295 (25.2%) |
| College/Associate Degree | 787 (85.4%) | 135 (14.6%) |
| Bachelor's Degree or higher | 820 (92.9%) | 63 (7.1%) |
Occupancy by Age of Householder in Pine Lake Park
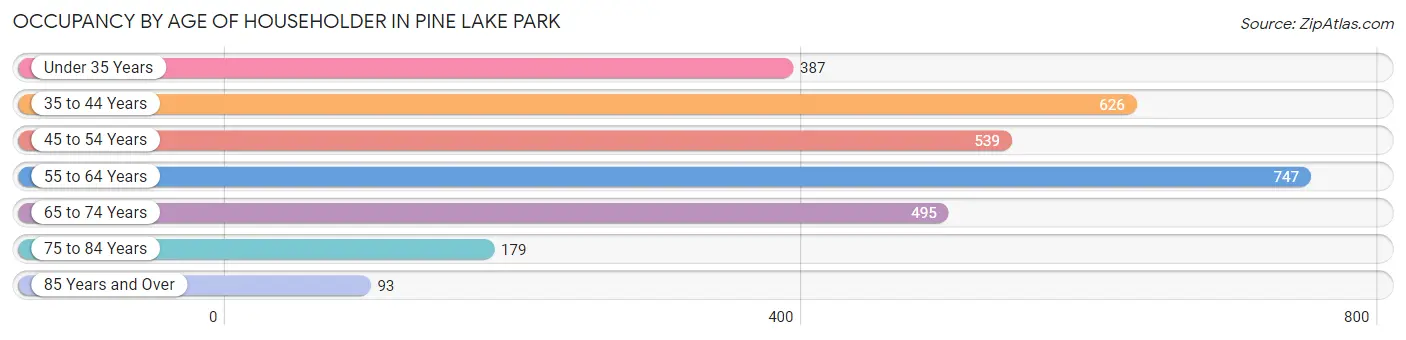
| Age Bracket | # Households | % Households |
| Under 35 Years | 387 | 12.6% |
| 35 to 44 Years | 626 | 20.4% |
| 45 to 54 Years | 539 | 17.6% |
| 55 to 64 Years | 747 | 24.4% |
| 65 to 74 Years | 495 | 16.1% |
| 75 to 84 Years | 179 | 5.8% |
| 85 Years and Over | 93 | 3.0% |
| Total | 3,066 | 100.0% |
Housing Finances in Pine Lake Park
Median Income by Occupancy in Pine Lake Park
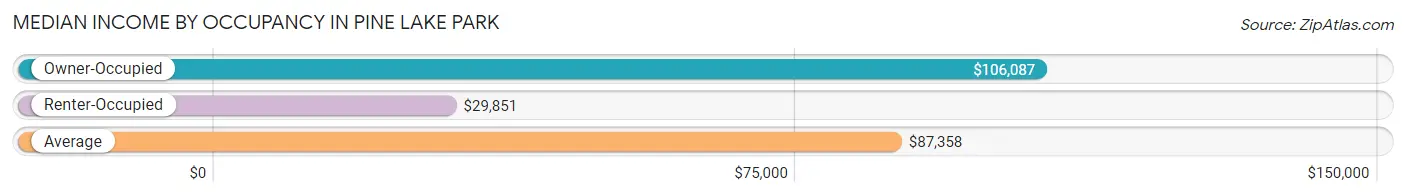
| Occupancy Type | # Households | Median Income |
| Owner-Occupied | 2,564 (83.6%) | $106,087 |
| Renter-Occupied | 502 (16.4%) | $29,851 |
| Average | 3,066 (100.0%) | $87,358 |
Occupancy by Householder Income Bracket in Pine Lake Park
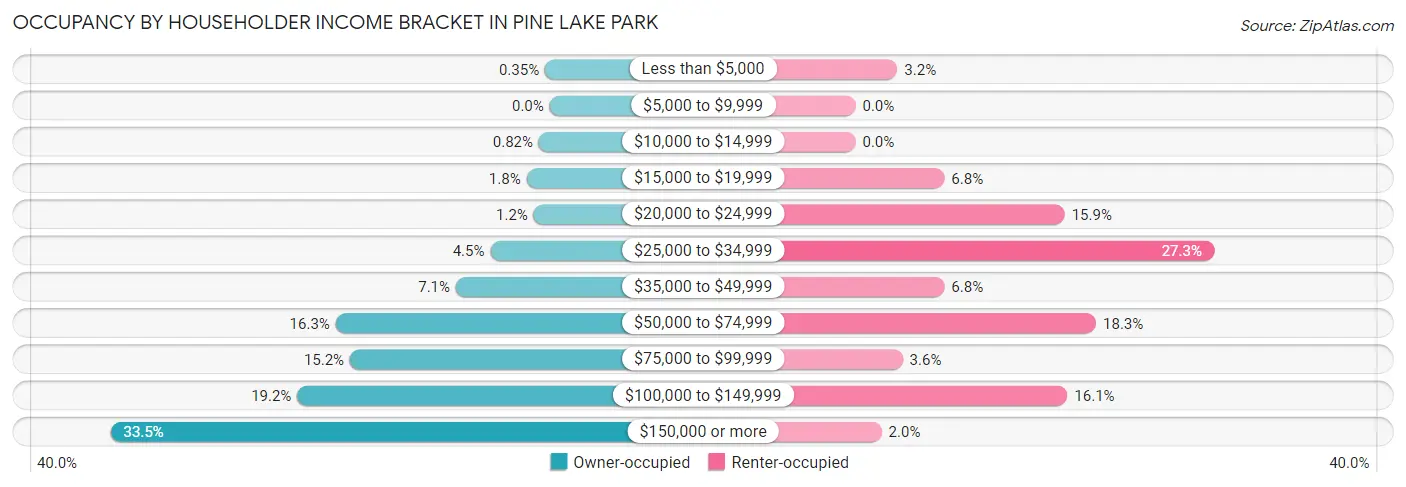
| Income Bracket | Owner-occupied | Renter-occupied |
| Less than $5,000 | 9 (0.4%) | 16 (3.2%) |
| $5,000 to $9,999 | 0 (0.0%) | 0 (0.0%) |
| $10,000 to $14,999 | 21 (0.8%) | 0 (0.0%) |
| $15,000 to $19,999 | 45 (1.8%) | 34 (6.8%) |
| $20,000 to $24,999 | 31 (1.2%) | 80 (15.9%) |
| $25,000 to $34,999 | 116 (4.5%) | 137 (27.3%) |
| $35,000 to $49,999 | 183 (7.1%) | 34 (6.8%) |
| $50,000 to $74,999 | 418 (16.3%) | 92 (18.3%) |
| $75,000 to $99,999 | 390 (15.2%) | 18 (3.6%) |
| $100,000 to $149,999 | 493 (19.2%) | 81 (16.1%) |
| $150,000 or more | 858 (33.5%) | 10 (2.0%) |
| Total | 2,564 (100.0%) | 502 (100.0%) |
Monthly Housing Cost Tiers in Pine Lake Park
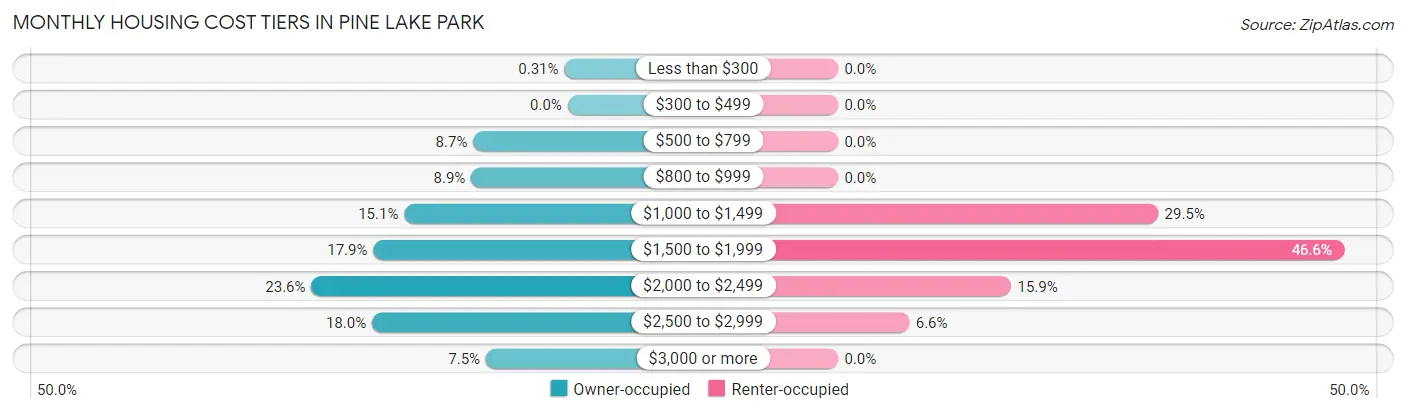
| Monthly Cost | Owner-occupied | Renter-occupied |
| Less than $300 | 8 (0.3%) | 0 (0.0%) |
| $300 to $499 | 0 (0.0%) | 0 (0.0%) |
| $500 to $799 | 223 (8.7%) | 0 (0.0%) |
| $800 to $999 | 228 (8.9%) | 0 (0.0%) |
| $1,000 to $1,499 | 386 (15.0%) | 148 (29.5%) |
| $1,500 to $1,999 | 459 (17.9%) | 234 (46.6%) |
| $2,000 to $2,499 | 605 (23.6%) | 80 (15.9%) |
| $2,500 to $2,999 | 462 (18.0%) | 33 (6.6%) |
| $3,000 or more | 193 (7.5%) | 0 (0.0%) |
| Total | 2,564 (100.0%) | 502 (100.0%) |
Physical Housing Characteristics in Pine Lake Park
Housing Structures in Pine Lake Park
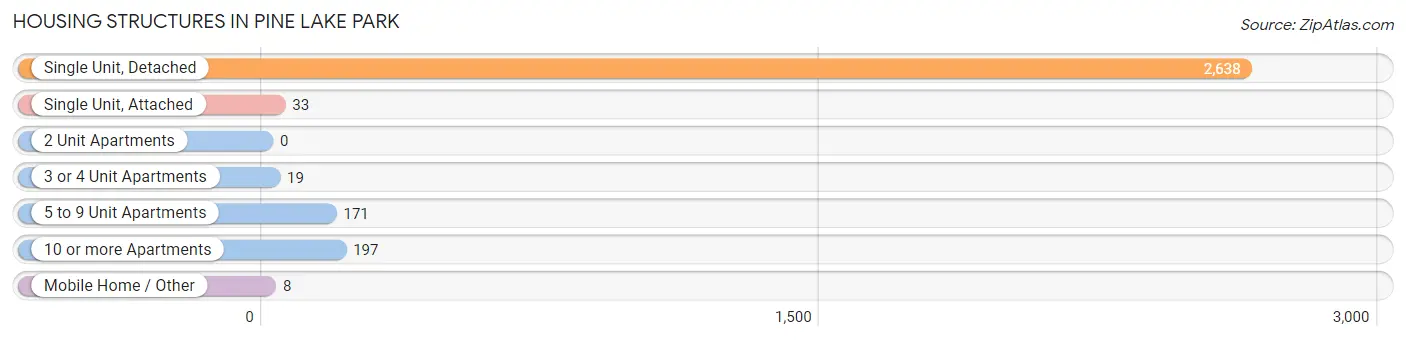
| Structure Type | # Housing Units | % Housing Units |
| Single Unit, Detached | 2,638 | 86.0% |
| Single Unit, Attached | 33 | 1.1% |
| 2 Unit Apartments | 0 | 0.0% |
| 3 or 4 Unit Apartments | 19 | 0.6% |
| 5 to 9 Unit Apartments | 171 | 5.6% |
| 10 or more Apartments | 197 | 6.4% |
| Mobile Home / Other | 8 | 0.3% |
| Total | 3,066 | 100.0% |
Housing Structures by Occupancy in Pine Lake Park
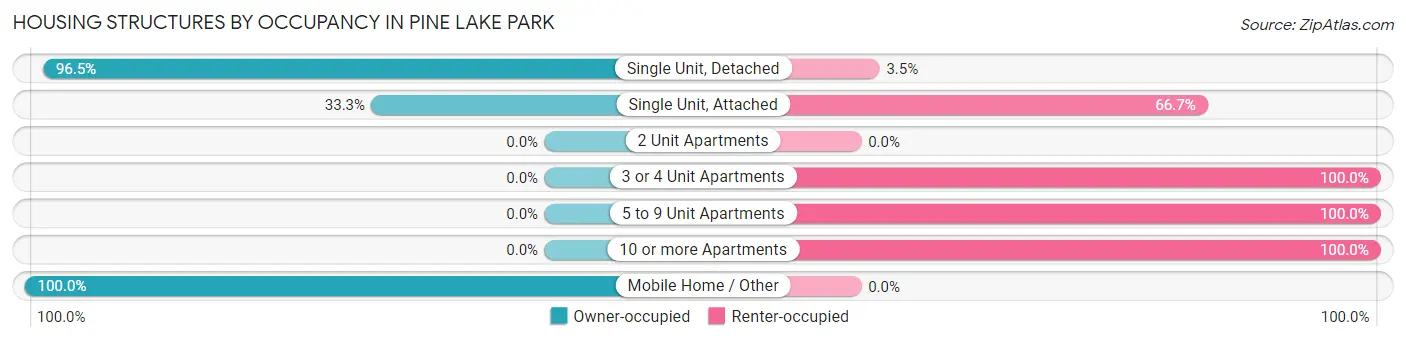
| Structure Type | Owner-occupied | Renter-occupied |
| Single Unit, Detached | 2,545 (96.5%) | 93 (3.5%) |
| Single Unit, Attached | 11 (33.3%) | 22 (66.7%) |
| 2 Unit Apartments | 0 (0.0%) | 0 (0.0%) |
| 3 or 4 Unit Apartments | 0 (0.0%) | 19 (100.0%) |
| 5 to 9 Unit Apartments | 0 (0.0%) | 171 (100.0%) |
| 10 or more Apartments | 0 (0.0%) | 197 (100.0%) |
| Mobile Home / Other | 8 (100.0%) | 0 (0.0%) |
| Total | 2,564 (83.6%) | 502 (16.4%) |
Housing Structures by Number of Rooms in Pine Lake Park
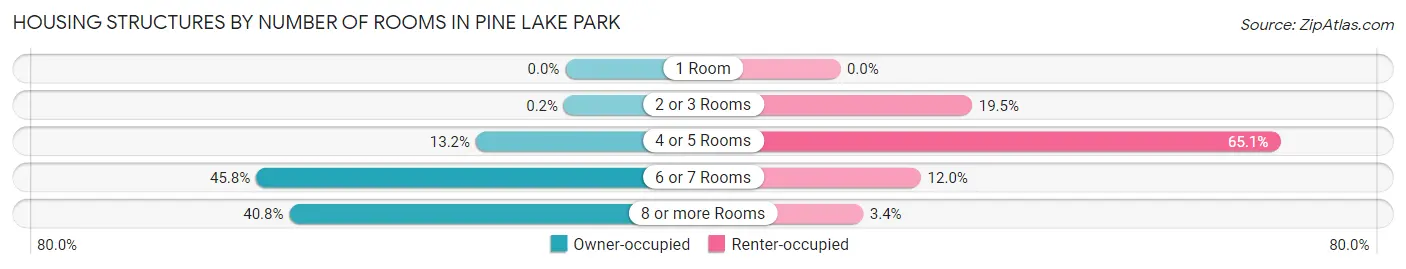
| Number of Rooms | Owner-occupied | Renter-occupied |
| 1 Room | 0 (0.0%) | 0 (0.0%) |
| 2 or 3 Rooms | 5 (0.2%) | 98 (19.5%) |
| 4 or 5 Rooms | 339 (13.2%) | 327 (65.1%) |
| 6 or 7 Rooms | 1,173 (45.8%) | 60 (11.9%) |
| 8 or more Rooms | 1,047 (40.8%) | 17 (3.4%) |
| Total | 2,564 (100.0%) | 502 (100.0%) |
Housing Structure by Heating Type in Pine Lake Park
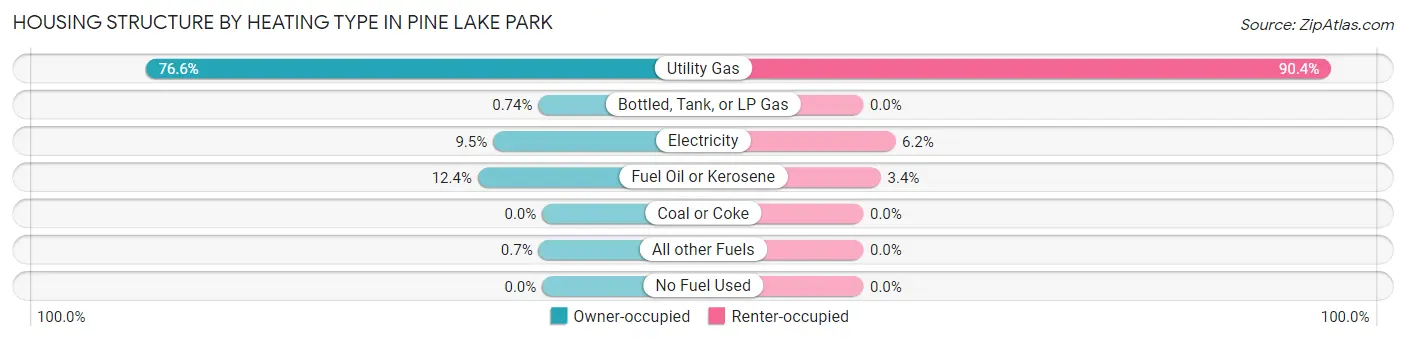
| Heating Type | Owner-occupied | Renter-occupied |
| Utility Gas | 1,965 (76.6%) | 454 (90.4%) |
| Bottled, Tank, or LP Gas | 19 (0.7%) | 0 (0.0%) |
| Electricity | 243 (9.5%) | 31 (6.2%) |
| Fuel Oil or Kerosene | 319 (12.4%) | 17 (3.4%) |
| Coal or Coke | 0 (0.0%) | 0 (0.0%) |
| All other Fuels | 18 (0.7%) | 0 (0.0%) |
| No Fuel Used | 0 (0.0%) | 0 (0.0%) |
| Total | 2,564 (100.0%) | 502 (100.0%) |
Household Vehicle Usage in Pine Lake Park
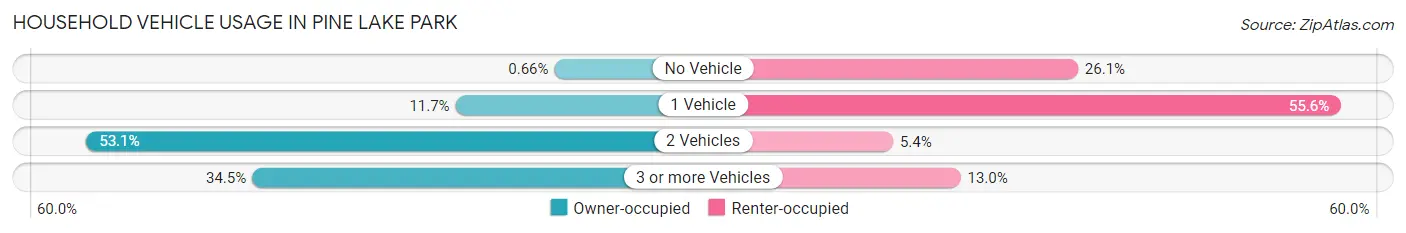
| Vehicles per Household | Owner-occupied | Renter-occupied |
| No Vehicle | 17 (0.7%) | 131 (26.1%) |
| 1 Vehicle | 301 (11.7%) | 279 (55.6%) |
| 2 Vehicles | 1,361 (53.1%) | 27 (5.4%) |
| 3 or more Vehicles | 885 (34.5%) | 65 (13.0%) |
| Total | 2,564 (100.0%) | 502 (100.0%) |
Real Estate & Mortgages in Pine Lake Park
Real Estate and Mortgage Overview in Pine Lake Park
| Characteristic | Without Mortgage | With Mortgage |
| Housing Units | 594 | 1,970 |
| Median Property Value | $348,800 | $318,500 |
| Median Household Income | $82,946 | $749 |
| Monthly Housing Costs | $852 | $193 |
| Real Estate Taxes | $6,428 | $22 |
Property Value by Mortgage Status in Pine Lake Park
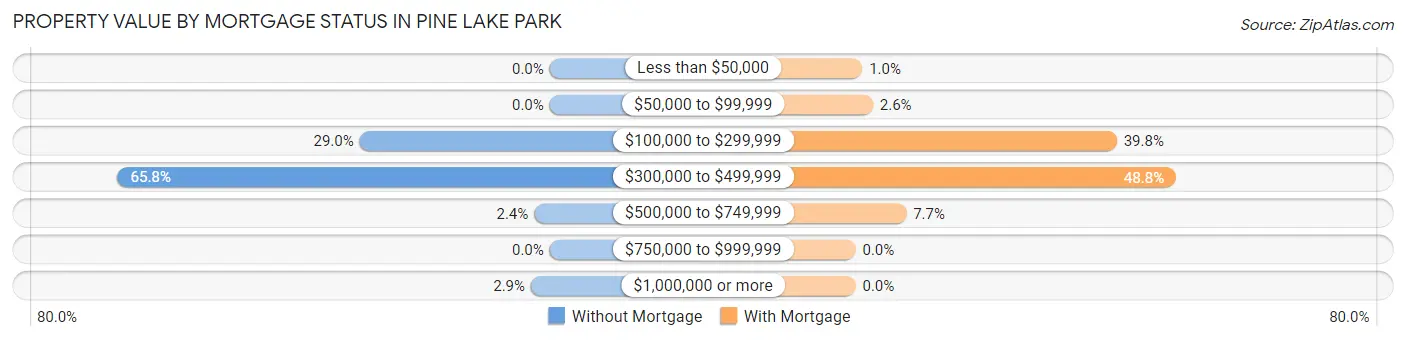
| Property Value | Without Mortgage | With Mortgage |
| Less than $50,000 | 0 (0.0%) | 20 (1.0%) |
| $50,000 to $99,999 | 0 (0.0%) | 52 (2.6%) |
| $100,000 to $299,999 | 172 (29.0%) | 784 (39.8%) |
| $300,000 to $499,999 | 391 (65.8%) | 962 (48.8%) |
| $500,000 to $749,999 | 14 (2.4%) | 152 (7.7%) |
| $750,000 to $999,999 | 0 (0.0%) | 0 (0.0%) |
| $1,000,000 or more | 17 (2.9%) | 0 (0.0%) |
| Total | 594 (100.0%) | 1,970 (100.0%) |
Household Income by Mortgage Status in Pine Lake Park
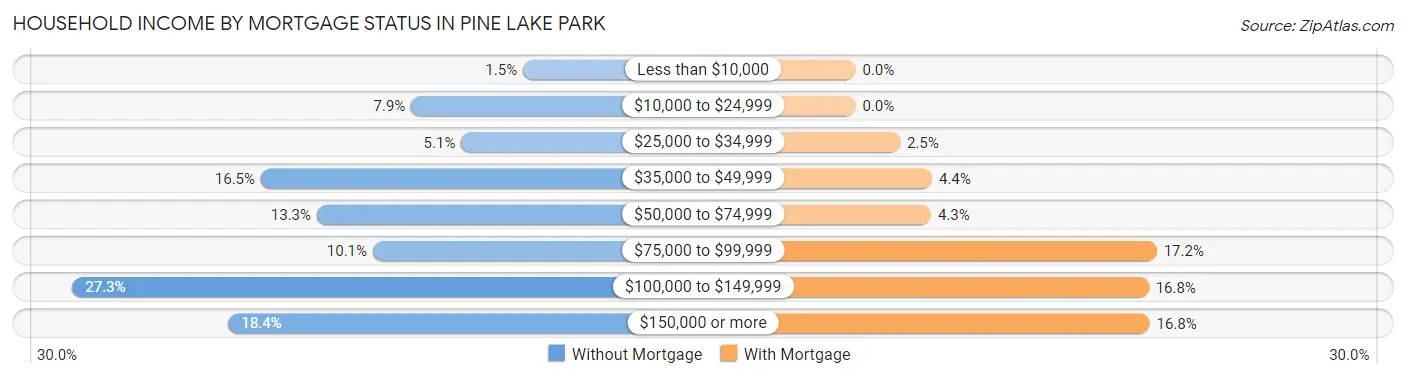
| Household Income | Without Mortgage | With Mortgage |
| Less than $10,000 | 9 (1.5%) | 0 (0.0%) |
| $10,000 to $24,999 | 47 (7.9%) | 0 (0.0%) |
| $25,000 to $34,999 | 30 (5.1%) | 50 (2.5%) |
| $35,000 to $49,999 | 98 (16.5%) | 86 (4.4%) |
| $50,000 to $74,999 | 79 (13.3%) | 85 (4.3%) |
| $75,000 to $99,999 | 60 (10.1%) | 339 (17.2%) |
| $100,000 to $149,999 | 162 (27.3%) | 330 (16.8%) |
| $150,000 or more | 109 (18.3%) | 331 (16.8%) |
| Total | 594 (100.0%) | 1,970 (100.0%) |
Property Value to Household Income Ratio in Pine Lake Park
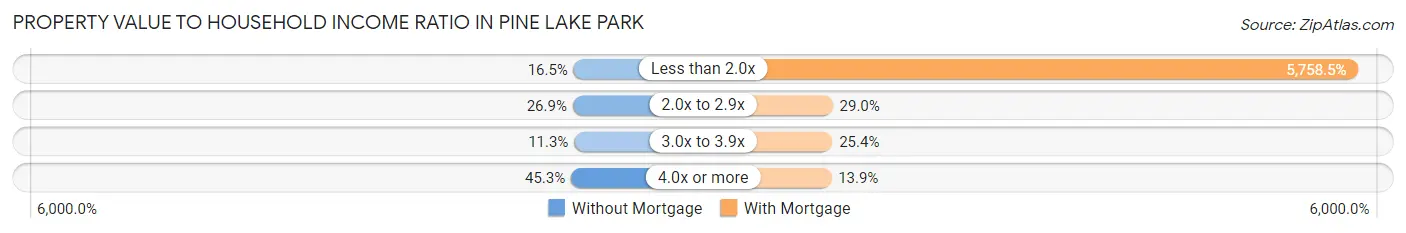
| Value-to-Income Ratio | Without Mortgage | With Mortgage |
| Less than 2.0x | 98 (16.5%) | 113,442 (5,758.5%) |
| 2.0x to 2.9x | 160 (26.9%) | 572 (29.0%) |
| 3.0x to 3.9x | 67 (11.3%) | 501 (25.4%) |
| 4.0x or more | 269 (45.3%) | 273 (13.9%) |
| Total | 594 (100.0%) | 1,970 (100.0%) |
Real Estate Taxes by Mortgage Status in Pine Lake Park
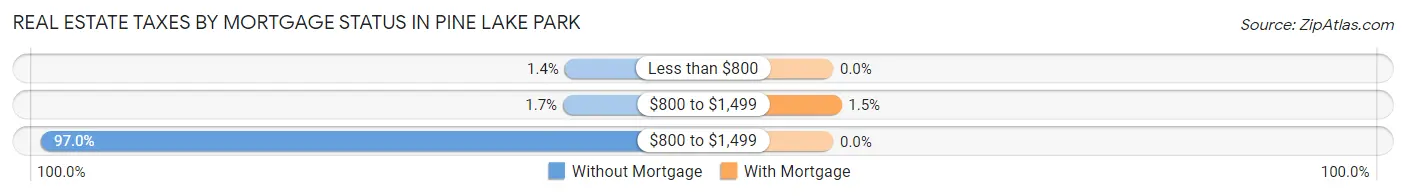
| Property Taxes | Without Mortgage | With Mortgage |
| Less than $800 | 8 (1.3%) | 0 (0.0%) |
| $800 to $1,499 | 10 (1.7%) | 30 (1.5%) |
| $800 to $1,499 | 576 (97.0%) | 0 (0.0%) |
| Total | 594 (100.0%) | 1,970 (100.0%) |
Health & Disability in Pine Lake Park
Health Insurance Coverage by Age in Pine Lake Park
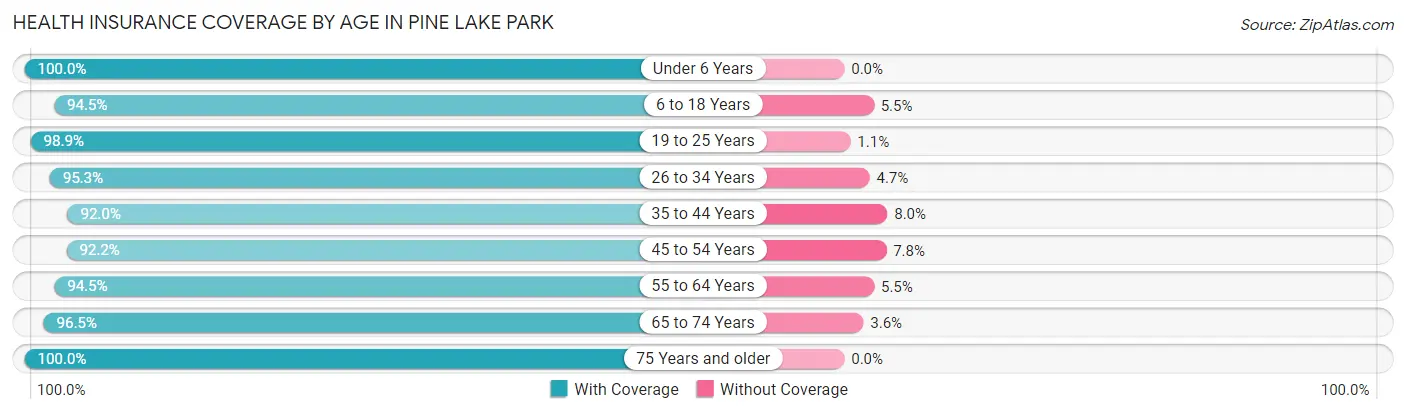
| Age Bracket | With Coverage | Without Coverage |
| Under 6 Years | 914 (100.0%) | 0 (0.0%) |
| 6 to 18 Years | 1,566 (94.5%) | 91 (5.5%) |
| 19 to 25 Years | 696 (98.9%) | 8 (1.1%) |
| 26 to 34 Years | 1,194 (95.3%) | 59 (4.7%) |
| 35 to 44 Years | 1,250 (92.0%) | 109 (8.0%) |
| 45 to 54 Years | 1,015 (92.2%) | 86 (7.8%) |
| 55 to 64 Years | 1,227 (94.5%) | 72 (5.5%) |
| 65 to 74 Years | 815 (96.5%) | 30 (3.5%) |
| 75 Years and older | 451 (100.0%) | 0 (0.0%) |
| Total | 9,128 (95.3%) | 455 (4.8%) |
Health Insurance Coverage by Citizenship Status in Pine Lake Park
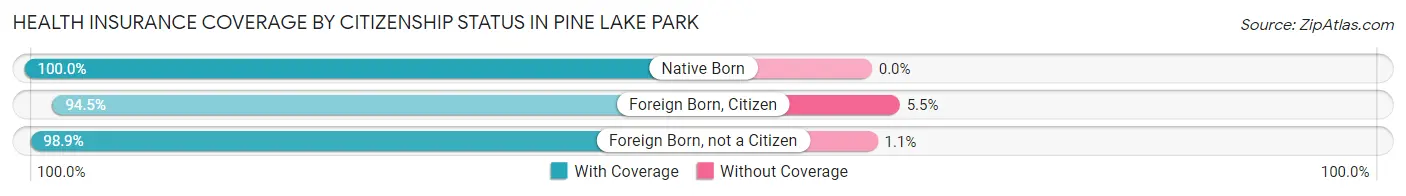
| Citizenship Status | With Coverage | Without Coverage |
| Native Born | 914 (100.0%) | 0 (0.0%) |
| Foreign Born, Citizen | 1,566 (94.5%) | 91 (5.5%) |
| Foreign Born, not a Citizen | 696 (98.9%) | 8 (1.1%) |
Health Insurance Coverage by Household Income in Pine Lake Park
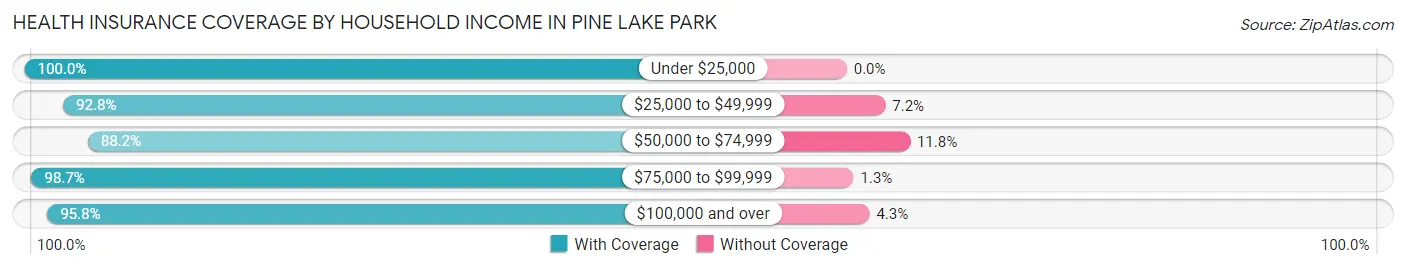
| Household Income | With Coverage | Without Coverage |
| Under $25,000 | 397 (100.0%) | 0 (0.0%) |
| $25,000 to $49,999 | 719 (92.8%) | 56 (7.2%) |
| $50,000 to $74,999 | 1,050 (88.2%) | 141 (11.8%) |
| $75,000 to $99,999 | 1,617 (98.7%) | 21 (1.3%) |
| $100,000 and over | 5,335 (95.8%) | 237 (4.3%) |
Public vs Private Health Insurance Coverage by Age in Pine Lake Park
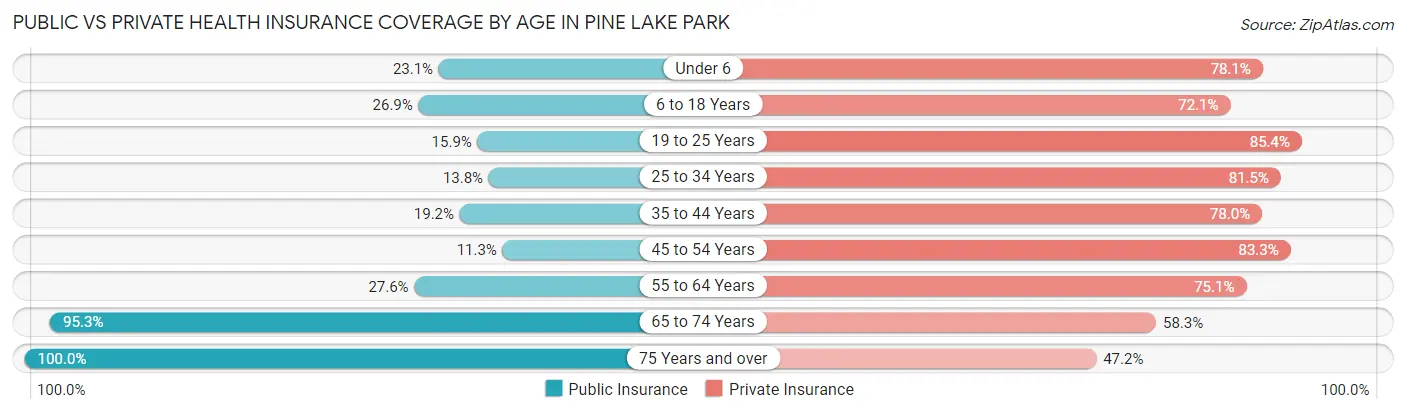
| Age Bracket | Public Insurance | Private Insurance |
| Under 6 | 211 (23.1%) | 714 (78.1%) |
| 6 to 18 Years | 445 (26.9%) | 1,195 (72.1%) |
| 19 to 25 Years | 112 (15.9%) | 601 (85.4%) |
| 25 to 34 Years | 173 (13.8%) | 1,021 (81.5%) |
| 35 to 44 Years | 261 (19.2%) | 1,060 (78.0%) |
| 45 to 54 Years | 124 (11.3%) | 917 (83.3%) |
| 55 to 64 Years | 359 (27.6%) | 975 (75.1%) |
| 65 to 74 Years | 805 (95.3%) | 493 (58.3%) |
| 75 Years and over | 451 (100.0%) | 213 (47.2%) |
| Total | 2,941 (30.7%) | 7,189 (75.0%) |
Disability Status by Sex by Age in Pine Lake Park
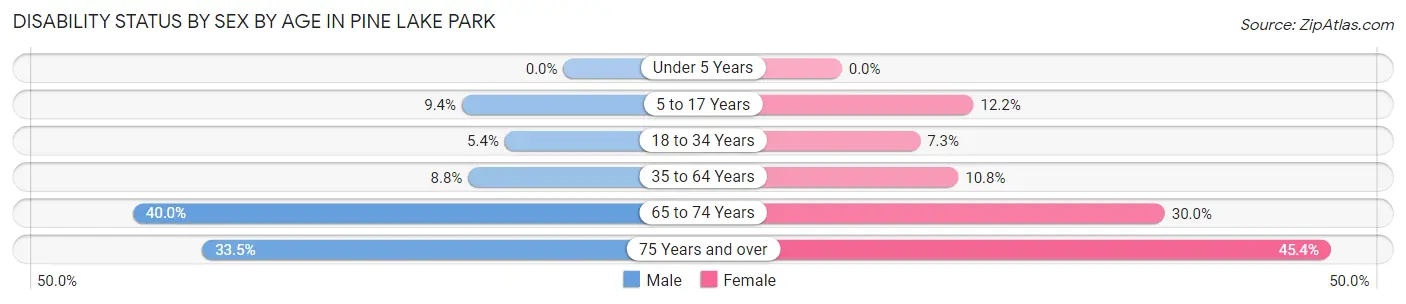
| Age Bracket | Male | Female |
| Under 5 Years | 0 (0.0%) | 0 (0.0%) |
| 5 to 17 Years | 81 (9.4%) | 91 (12.2%) |
| 18 to 34 Years | 59 (5.4%) | 74 (7.3%) |
| 35 to 64 Years | 157 (8.8%) | 214 (10.8%) |
| 65 to 74 Years | 167 (40.0%) | 128 (30.0%) |
| 75 Years and over | 64 (33.5%) | 118 (45.4%) |
Disability Class by Sex by Age in Pine Lake Park
Disability Class: Hearing Difficulty
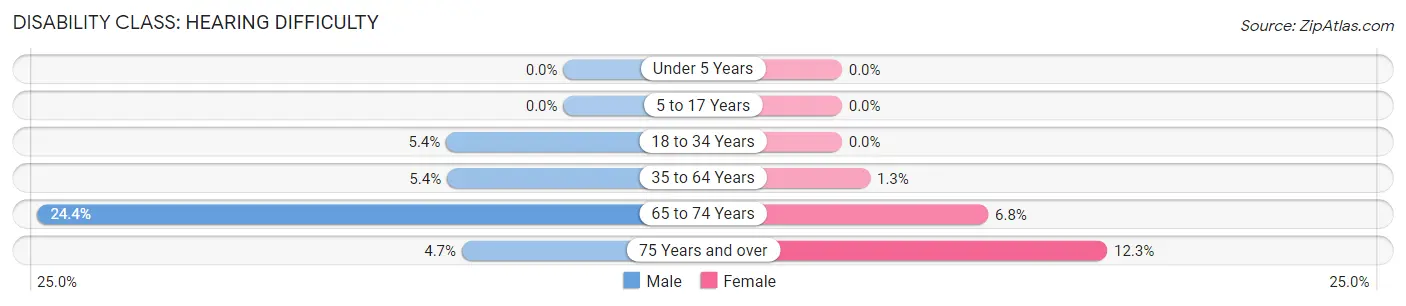
| Age Bracket | Male | Female |
| Under 5 Years | 0 (0.0%) | 0 (0.0%) |
| 5 to 17 Years | 0 (0.0%) | 0 (0.0%) |
| 18 to 34 Years | 59 (5.4%) | 0 (0.0%) |
| 35 to 64 Years | 96 (5.4%) | 26 (1.3%) |
| 65 to 74 Years | 102 (24.4%) | 29 (6.8%) |
| 75 Years and over | 9 (4.7%) | 32 (12.3%) |
Disability Class: Vision Difficulty
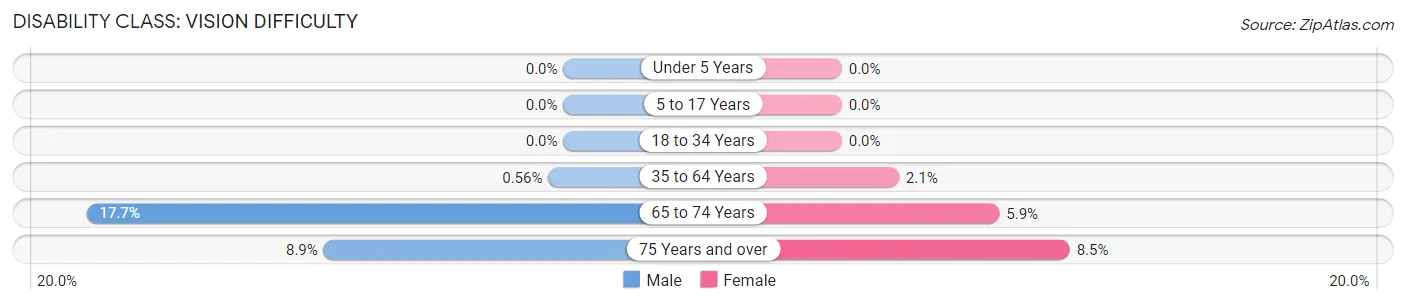
| Age Bracket | Male | Female |
| Under 5 Years | 0 (0.0%) | 0 (0.0%) |
| 5 to 17 Years | 0 (0.0%) | 0 (0.0%) |
| 18 to 34 Years | 0 (0.0%) | 0 (0.0%) |
| 35 to 64 Years | 10 (0.6%) | 42 (2.1%) |
| 65 to 74 Years | 74 (17.7%) | 25 (5.9%) |
| 75 Years and over | 17 (8.9%) | 22 (8.5%) |
Disability Class: Cognitive Difficulty
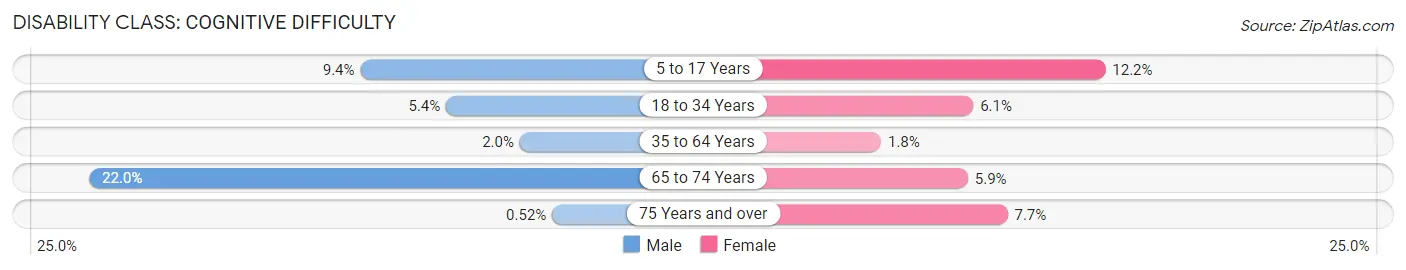
| Age Bracket | Male | Female |
| 5 to 17 Years | 81 (9.4%) | 91 (12.2%) |
| 18 to 34 Years | 59 (5.4%) | 62 (6.1%) |
| 35 to 64 Years | 36 (2.0%) | 36 (1.8%) |
| 65 to 74 Years | 92 (22.0%) | 25 (5.9%) |
| 75 Years and over | 1 (0.5%) | 20 (7.7%) |
Disability Class: Ambulatory Difficulty
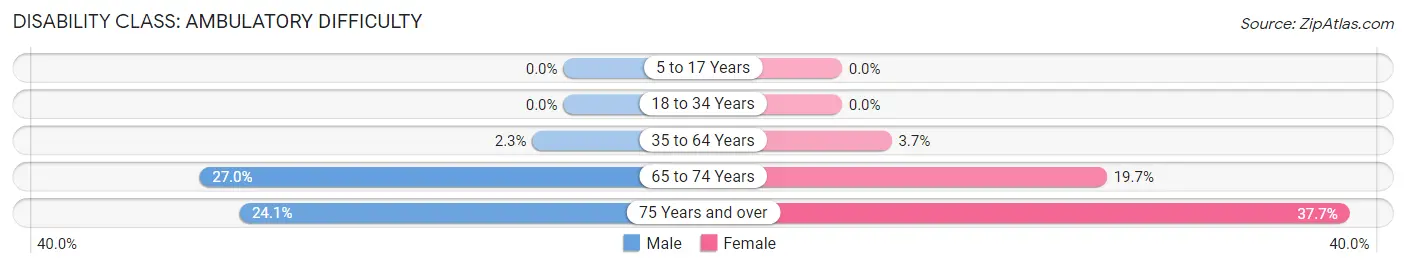
| Age Bracket | Male | Female |
| 5 to 17 Years | 0 (0.0%) | 0 (0.0%) |
| 18 to 34 Years | 0 (0.0%) | 0 (0.0%) |
| 35 to 64 Years | 41 (2.3%) | 73 (3.7%) |
| 65 to 74 Years | 113 (27.0%) | 84 (19.7%) |
| 75 Years and over | 46 (24.1%) | 98 (37.7%) |
Disability Class: Self-Care Difficulty
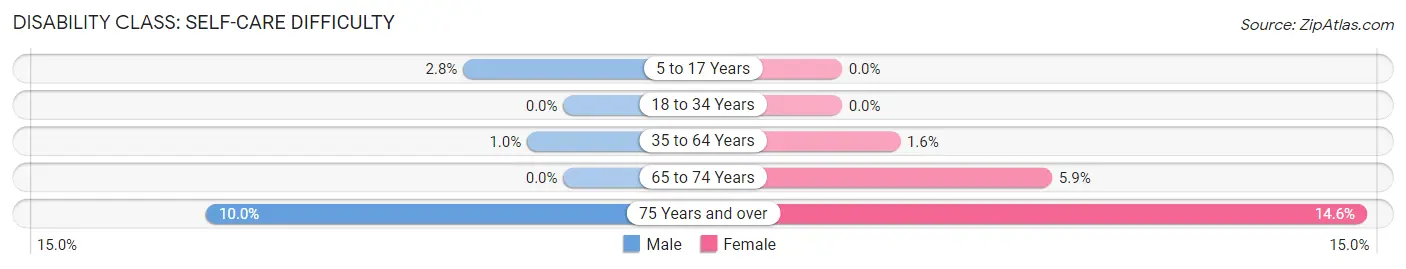
| Age Bracket | Male | Female |
| 5 to 17 Years | 24 (2.8%) | 0 (0.0%) |
| 18 to 34 Years | 0 (0.0%) | 0 (0.0%) |
| 35 to 64 Years | 18 (1.0%) | 32 (1.6%) |
| 65 to 74 Years | 0 (0.0%) | 25 (5.9%) |
| 75 Years and over | 19 (10.0%) | 38 (14.6%) |
Technology Access in Pine Lake Park
Computing Device Access in Pine Lake Park
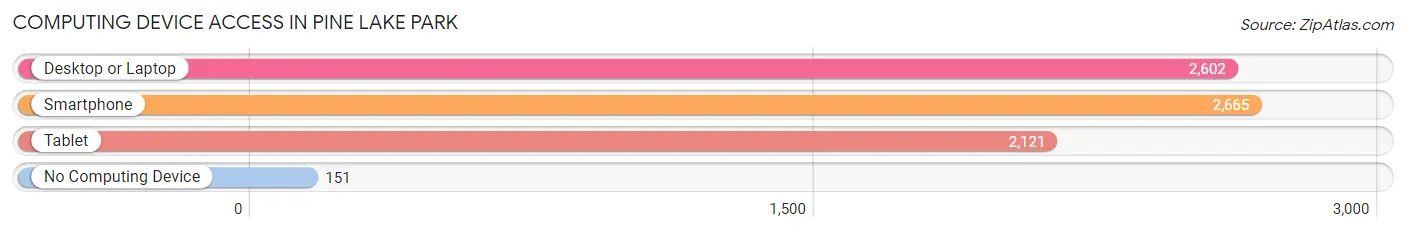
| Device Type | # Households | % Households |
| Desktop or Laptop | 2,602 | 84.9% |
| Smartphone | 2,665 | 86.9% |
| Tablet | 2,121 | 69.2% |
| No Computing Device | 151 | 4.9% |
| Total | 3,066 | 100.0% |
Internet Access in Pine Lake Park
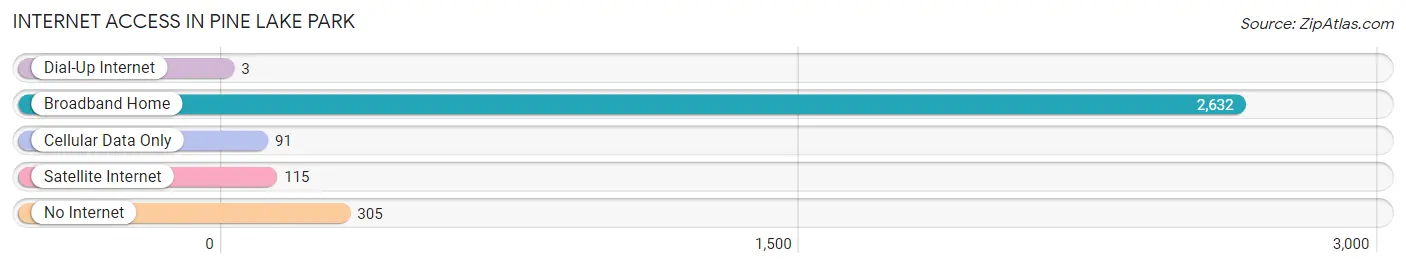
| Internet Type | # Households | % Households |
| Dial-Up Internet | 3 | 0.1% |
| Broadband Home | 2,632 | 85.8% |
| Cellular Data Only | 91 | 3.0% |
| Satellite Internet | 115 | 3.7% |
| No Internet | 305 | 10.0% |
| Total | 3,066 | 100.0% |
Pine Lake Park Summary
Pine Lake Park is a small borough located in Ocean County, New Jersey. It is situated on the Barnegat Bay, and is part of the larger Barnegat Bay region. The borough is bordered by the towns of Berkeley Township, Ocean Gate, and Seaside Heights. The population of Pine Lake Park was 1,845 as of the 2010 census.
History
Pine Lake Park was originally part of Berkeley Township, and was known as the Pine Lake section. The area was first settled in the late 1800s, and was primarily used for farming and fishing. In the early 1900s, the area began to develop as a resort community. The first hotel was built in 1906, and the area quickly became a popular destination for vacationers.
In the 1920s, the area was incorporated as the Borough of Pine Lake Park. The borough was named after the nearby Pine Lake, which was a popular spot for swimming and fishing. The borough was also home to a number of amusement parks, including the Pine Lake Park Amusement Park, which opened in 1927.
Geography
Pine Lake Park is located in Ocean County, New Jersey. It is situated on the Barnegat Bay, and is part of the larger Barnegat Bay region. The borough is bordered by the towns of Berkeley Township, Ocean Gate, and Seaside Heights. The total area of the borough is 0.7 square miles, all of which is land.
The borough is located in a coastal plain, and is characterized by flat terrain. The highest point in the borough is only 25 feet above sea level. The borough is located near the Pine Lake, which is a popular spot for swimming and fishing.
Economy
The economy of Pine Lake Park is largely based on tourism and recreation. The borough is home to a number of hotels, restaurants, and other businesses that cater to tourists. The borough is also home to a number of marinas, which provide access to the Barnegat Bay.
The borough is also home to a number of manufacturing and industrial businesses. These businesses include a number of food processing plants, as well as a number of other businesses that produce a variety of products.
Demographics
As of the 2010 census, the population of Pine Lake Park was 1,845. The racial makeup of the borough was 94.3% White, 2.2% African American, 0.3% Native American, 0.7% Asian, 0.1% Pacific Islander, and 2.4% from other races. Hispanic or Latino of any race were 5.2% of the population.
The median household income in the borough was $50,938, and the median family income was $60,938. The per capita income in the borough was $25,938. About 5.2% of families and 6.7% of the population were below the poverty line.
Common Questions
What is the Total Population of Pine Lake Park?
Total Population of Pine Lake Park is 9,711.
What is the Total Male Population of Pine Lake Park?
Total Male Population of Pine Lake Park is 4,654.
What is the Total Female Population of Pine Lake Park?
Total Female Population of Pine Lake Park is 5,057.
What is the Ratio of Males per 100 Females in Pine Lake Park?
There are 92.03 Males per 100 Females in Pine Lake Park.
What is the Ratio of Females per 100 Males in Pine Lake Park?
There are 108.66 Females per 100 Males in Pine Lake Park.
What is the Median Population Age in Pine Lake Park?
Median Population Age in Pine Lake Park is 37.4 Years.
What is the Average Family Size in Pine Lake Park
Average Family Size in Pine Lake Park is 3.7 People.
What is the Average Household Size in Pine Lake Park
Average Household Size in Pine Lake Park is 3.1 People.
What is Per Capita Income in Pine Lake Park?
Per Capita income in Pine Lake Park is $37,126.
What is the Median Family Income in Pine Lake Park?
Median Family Income in Pine Lake Park is $113,551.
What is the Median Household income in Pine Lake Park?
Median Household Income in Pine Lake Park is $87,358.
What is Income or Wage Gap in Pine Lake Park?
Income or Wage Gap in Pine Lake Park is 35.0%.
Women in Pine Lake Park earn 65.0 cents for every dollar earned by a man.
What is Inequality or Gini Index in Pine Lake Park?
Inequality or Gini Index in Pine Lake Park is 0.40.
How Large is the Labor Force in Pine Lake Park?
There are 5,017 People in the Labor Forcein in Pine Lake Park.
What is the Percentage of People in the Labor Force in Pine Lake Park?
66.2% of People are in the Labor Force in Pine Lake Park.
What is the Unemployment Rate in Pine Lake Park?
Unemployment Rate in Pine Lake Park is 3.5%.