Lindenwold borough, NJ
Lindenwold borough Overview
21,337
TOTAL POPULATION
10,642
MALE POPULATION
10,695
FEMALE POPULATION
99.50
MALES / 100 FEMALES
100.50
FEMALES / 100 MALES
36.6
MEDIAN AGE
3.3
AVG FAMILY SIZE
2.4
AVG HOUSEHOLD SIZE
$28,628
PER CAPITA INCOME
$66,901
AVG FAMILY INCOME
$53,645
AVG HOUSEHOLD INCOME
16.7%
WAGE / INCOME GAP [ % ]
83.3¢/ $1
WAGE / INCOME GAP [ $ ]
0.42
INEQUALITY / GINI INDEX
11,490
LABOR FORCE [ PEOPLE ]
68.7%
PERCENT IN LABOR FORCE
3.5%
UNEMPLOYMENT RATE
Race in Lindenwold borough
The most populous races in Lindenwold borough are White / Caucasian (7,776 | 36.4%), Black / African American (6,958 | 32.6%), and Hispanic or Latino (6,713 | 31.5%).
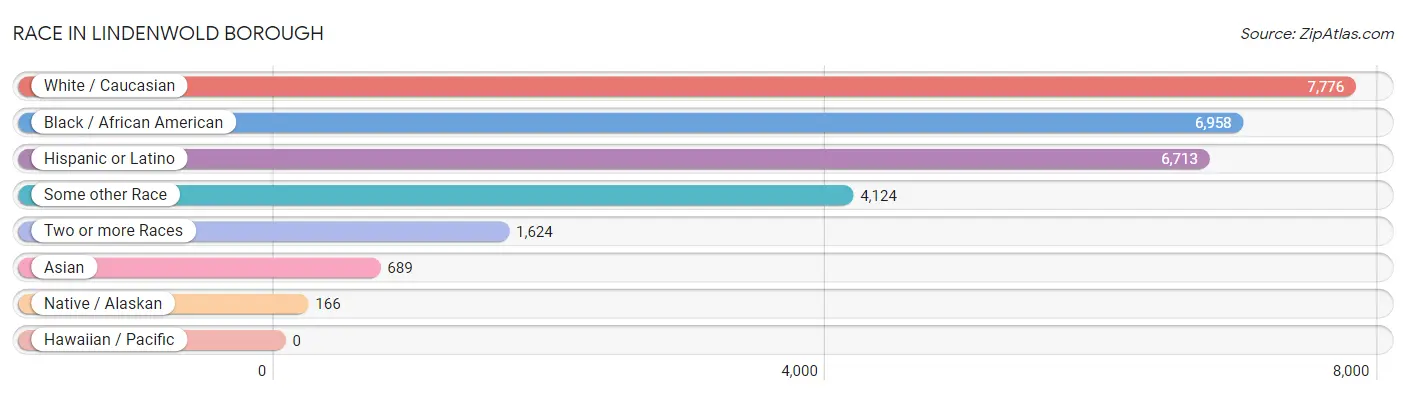
| Race | # Population | % Population |
| Asian | 689 | 3.2% |
| Black / African American | 6,958 | 32.6% |
| Hawaiian / Pacific | 0 | 0.0% |
| Hispanic or Latino | 6,713 | 31.5% |
| Native / Alaskan | 166 | 0.8% |
| White / Caucasian | 7,776 | 36.4% |
| Two or more Races | 1,624 | 7.6% |
| Some other Race | 4,124 | 19.3% |
| Total | 21,337 | 100.0% |
Ancestry in Lindenwold borough
The most populous ancestries reported in Lindenwold borough are Central American (2,787 | 13.1%), Irish (2,062 | 9.7%), German (1,637 | 7.7%), Salvadoran (1,478 | 6.9%), and Italian (1,440 | 6.8%), together accounting for 44.1% of all Lindenwold borough residents.
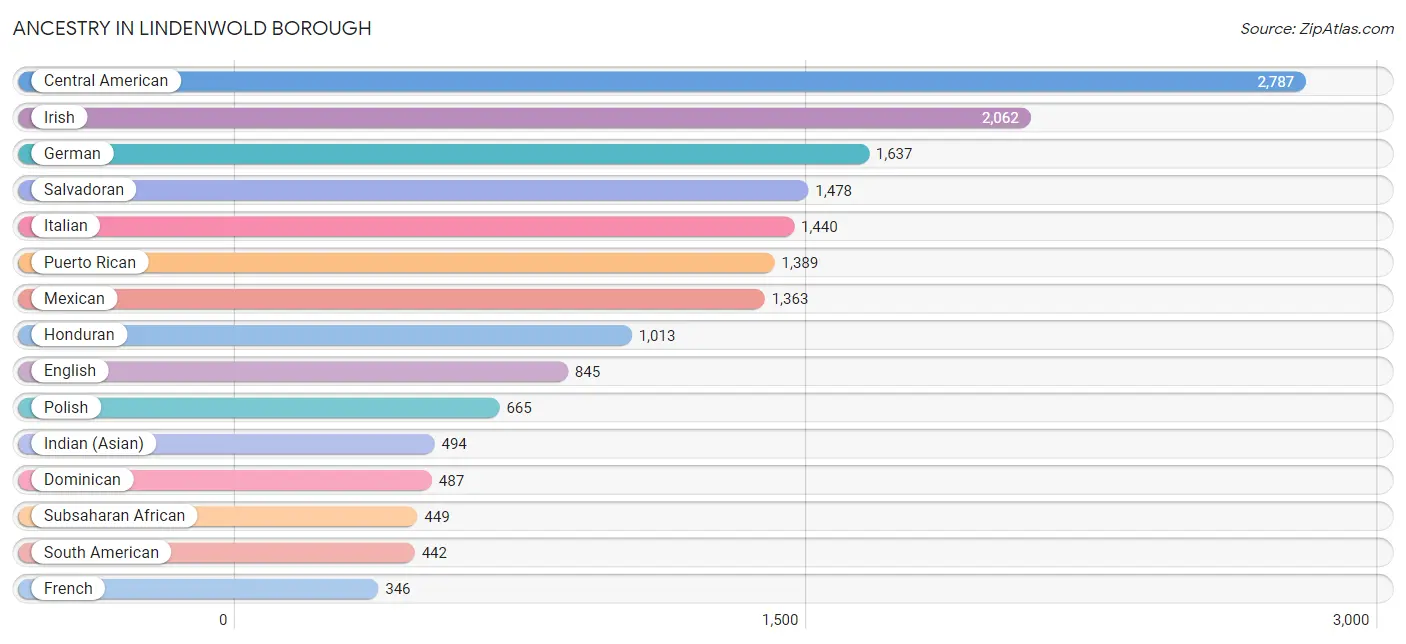
| Ancestry | # Population | % Population |
| African | 247 | 1.2% |
| American | 284 | 1.3% |
| Arab | 39 | 0.2% |
| Argentinean | 30 | 0.1% |
| Armenian | 72 | 0.3% |
| Blackfeet | 9 | 0.0% |
| British | 44 | 0.2% |
| British West Indian | 10 | 0.1% |
| Burmese | 138 | 0.6% |
| Central American | 2,787 | 13.1% |
| Central American Indian | 100 | 0.5% |
| Cherokee | 37 | 0.2% |
| Colombian | 80 | 0.4% |
| Cuban | 25 | 0.1% |
| Czech | 117 | 0.5% |
| Danish | 28 | 0.1% |
| Dominican | 487 | 2.3% |
| Dutch | 98 | 0.5% |
| English | 845 | 4.0% |
| European | 12 | 0.1% |
| French | 346 | 1.6% |
| French Canadian | 10 | 0.1% |
| German | 1,637 | 7.7% |
| Greek | 64 | 0.3% |
| Guatemalan | 12 | 0.1% |
| Guyanese | 50 | 0.2% |
| Haitian | 114 | 0.5% |
| Honduran | 1,013 | 4.8% |
| Hungarian | 57 | 0.3% |
| Indian (Asian) | 494 | 2.3% |
| Irish | 2,062 | 9.7% |
| Italian | 1,440 | 6.8% |
| Jamaican | 273 | 1.3% |
| Korean | 174 | 0.8% |
| Lebanese | 17 | 0.1% |
| Liberian | 66 | 0.3% |
| Lithuanian | 146 | 0.7% |
| Mexican | 1,363 | 6.4% |
| Nicaraguan | 113 | 0.5% |
| Nigerian | 121 | 0.6% |
| Norwegian | 28 | 0.1% |
| Panamanian | 131 | 0.6% |
| Peruvian | 269 | 1.3% |
| Polish | 665 | 3.1% |
| Portuguese | 84 | 0.4% |
| Puerto Rican | 1,389 | 6.5% |
| Russian | 147 | 0.7% |
| Salvadoran | 1,478 | 6.9% |
| Scotch-Irish | 25 | 0.1% |
| Scottish | 67 | 0.3% |
| Serbian | 1 | 0.0% |
| Sierra Leonean | 15 | 0.1% |
| Slovak | 43 | 0.2% |
| South American | 442 | 2.1% |
| Subsaharan African | 449 | 2.1% |
| Swedish | 47 | 0.2% |
| Swiss | 13 | 0.1% |
| Thai | 95 | 0.4% |
| Trinidadian and Tobagonian | 79 | 0.4% |
| Ukrainian | 10 | 0.1% |
| Venezuelan | 63 | 0.3% |
| Vietnamese | 35 | 0.2% |
| Welsh | 81 | 0.4% | View All 63 Rows |
Immigrants in Lindenwold borough
The most numerous immigrant groups reported in Lindenwold borough came from Latin America (3,332 | 15.6%), Central America (2,045 | 9.6%), Caribbean (864 | 4.1%), El Salvador (795 | 3.7%), and Asia (719 | 3.4%), together accounting for 36.3% of all Lindenwold borough residents.
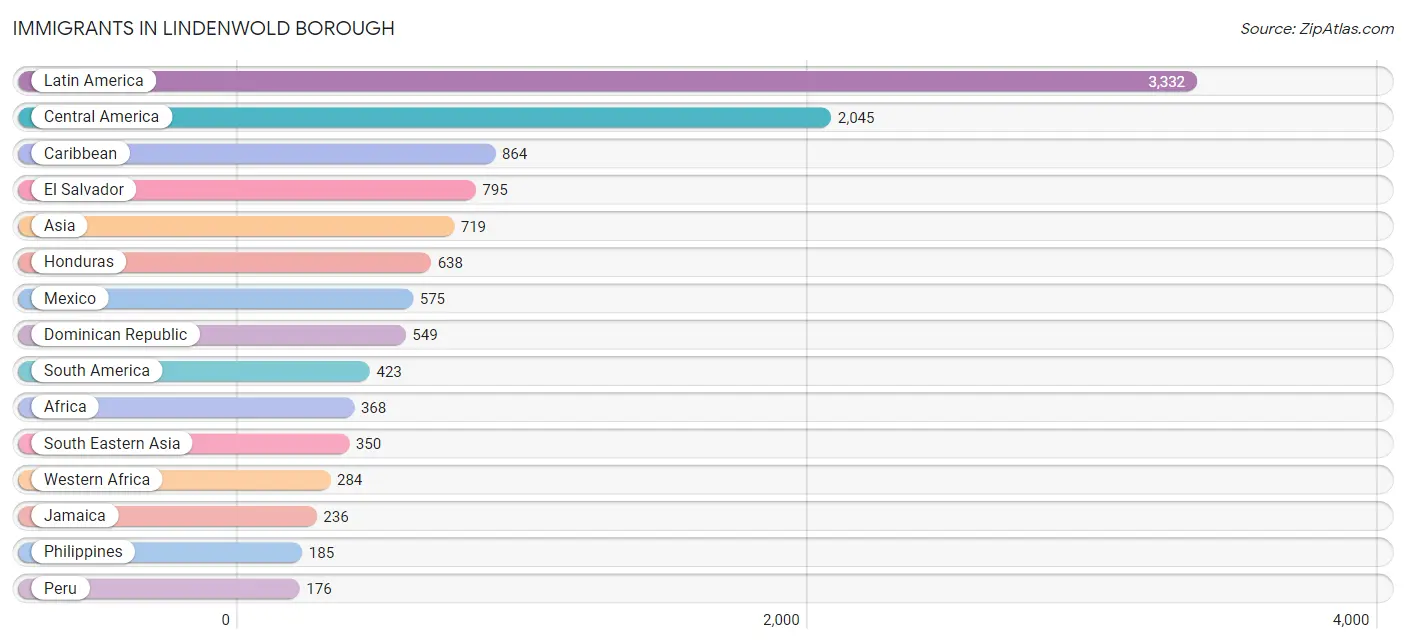
| Immigration Origin | # Population | % Population |
| Africa | 368 | 1.7% |
| Asia | 719 | 3.4% |
| Bangladesh | 35 | 0.2% |
| Belarus | 8 | 0.0% |
| Canada | 30 | 0.1% |
| Caribbean | 864 | 4.1% |
| Central America | 2,045 | 9.6% |
| China | 131 | 0.6% |
| Colombia | 80 | 0.4% |
| Croatia | 1 | 0.0% |
| Dominican Republic | 549 | 2.6% |
| Eastern Asia | 163 | 0.8% |
| Eastern Europe | 9 | 0.0% |
| El Salvador | 795 | 3.7% |
| England | 28 | 0.1% |
| Europe | 119 | 0.6% |
| Greece | 56 | 0.3% |
| Grenada | 66 | 0.3% |
| Guatemala | 12 | 0.1% |
| Guyana | 104 | 0.5% |
| Honduras | 638 | 3.0% |
| India | 82 | 0.4% |
| Iraq | 41 | 0.2% |
| Ireland | 18 | 0.1% |
| Jamaica | 236 | 1.1% |
| Kazakhstan | 48 | 0.2% |
| Korea | 32 | 0.2% |
| Latin America | 3,332 | 15.6% |
| Liberia | 113 | 0.5% |
| Mexico | 575 | 2.7% |
| Nicaragua | 25 | 0.1% |
| Nigeria | 121 | 0.6% |
| Northern Europe | 54 | 0.3% |
| Peru | 176 | 0.8% |
| Philippines | 185 | 0.9% |
| Scotland | 8 | 0.0% |
| Sierra Leone | 15 | 0.1% |
| Singapore | 33 | 0.2% |
| South America | 423 | 2.0% |
| South Central Asia | 165 | 0.8% |
| South Eastern Asia | 350 | 1.6% |
| Southern Europe | 56 | 0.3% |
| Taiwan | 10 | 0.1% |
| Trinidad and Tobago | 13 | 0.1% |
| Venezuela | 63 | 0.3% |
| Vietnam | 132 | 0.6% |
| Western Africa | 284 | 1.3% |
| Western Asia | 41 | 0.2% | View All 48 Rows |
Sex and Age in Lindenwold borough
Sex and Age in Lindenwold borough
The most populous age groups in Lindenwold borough are 30 to 34 Years (946 | 8.9%) for men and 35 to 39 Years (1,059 | 9.9%) for women.
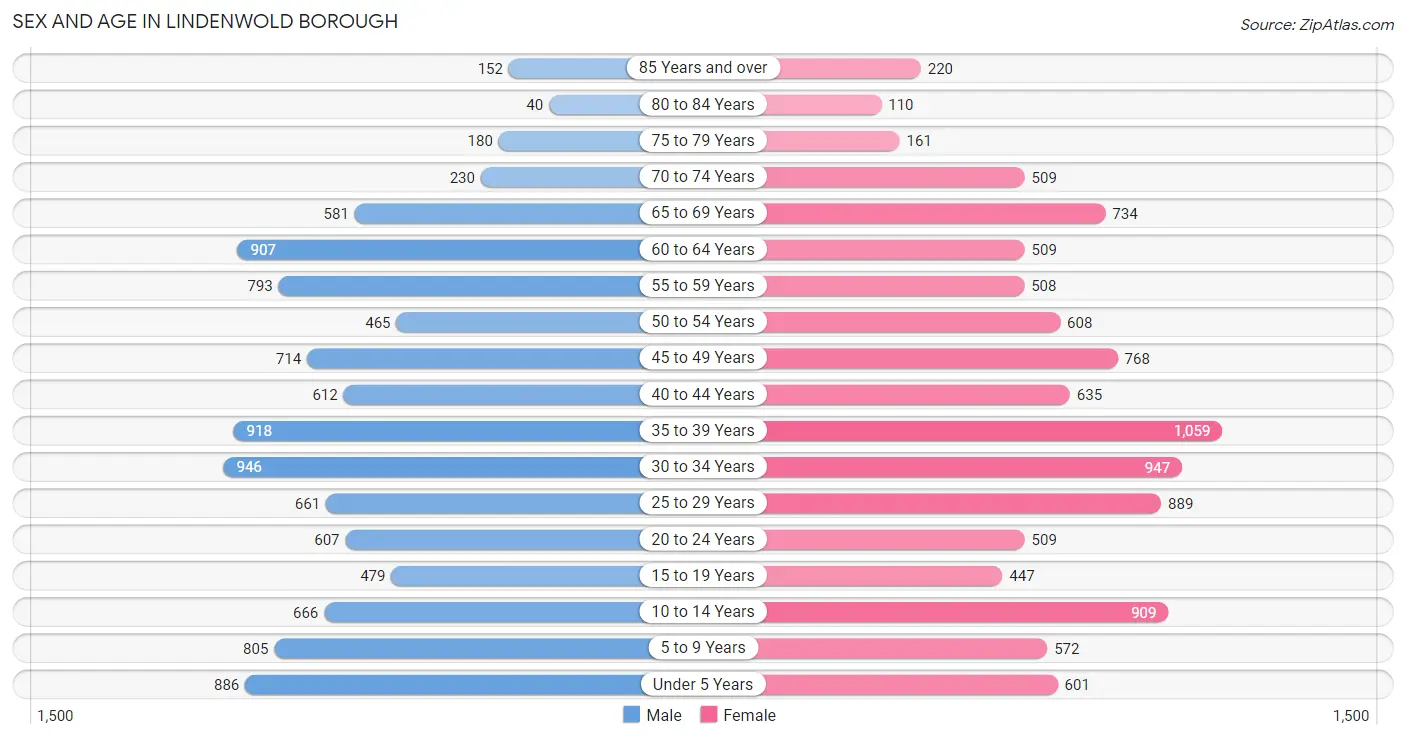
| Age Bracket | Male | Female |
| Under 5 Years | 886 (8.3%) | 601 (5.6%) |
| 5 to 9 Years | 805 (7.6%) | 572 (5.3%) |
| 10 to 14 Years | 666 (6.3%) | 909 (8.5%) |
| 15 to 19 Years | 479 (4.5%) | 447 (4.2%) |
| 20 to 24 Years | 607 (5.7%) | 509 (4.8%) |
| 25 to 29 Years | 661 (6.2%) | 889 (8.3%) |
| 30 to 34 Years | 946 (8.9%) | 947 (8.8%) |
| 35 to 39 Years | 918 (8.6%) | 1,059 (9.9%) |
| 40 to 44 Years | 612 (5.8%) | 635 (5.9%) |
| 45 to 49 Years | 714 (6.7%) | 768 (7.2%) |
| 50 to 54 Years | 465 (4.4%) | 608 (5.7%) |
| 55 to 59 Years | 793 (7.4%) | 508 (4.8%) |
| 60 to 64 Years | 907 (8.5%) | 509 (4.8%) |
| 65 to 69 Years | 581 (5.5%) | 734 (6.9%) |
| 70 to 74 Years | 230 (2.2%) | 509 (4.8%) |
| 75 to 79 Years | 180 (1.7%) | 161 (1.5%) |
| 80 to 84 Years | 40 (0.4%) | 110 (1.0%) |
| 85 Years and over | 152 (1.4%) | 220 (2.1%) |
| Total | 10,642 (100.0%) | 10,695 (100.0%) |
Families and Households in Lindenwold borough
Median Family Size in Lindenwold borough
The median family size in Lindenwold borough is 3.29 persons per family, with married-couple families (2,707 | 58.2%) accounting for the largest median family size of 3.37 persons per family. On the other hand, single male/father families (516 | 11.1%) represent the smallest median family size with 2.92 persons per family.
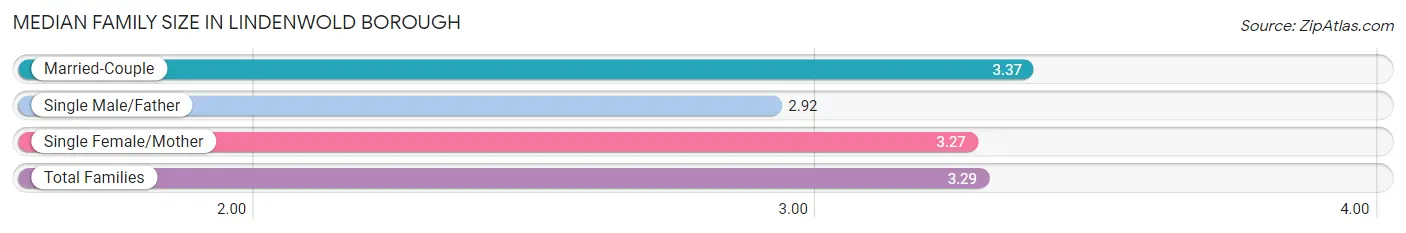
| Family Type | # Families | Family Size |
| Married-Couple | 2,707 (58.2%) | 3.37 |
| Single Male/Father | 516 (11.1%) | 2.92 |
| Single Female/Mother | 1,430 (30.7%) | 3.27 |
| Total Families | 4,653 (100.0%) | 3.29 |
Median Household Size in Lindenwold borough
The median household size in Lindenwold borough is 2.36 persons per household, with single female/mother households (1,430 | 15.8%) accounting for the largest median household size of 3.42 persons per household. non-family households (4,374 | 48.4%) represent the smallest median household size with 1.27 persons per household.
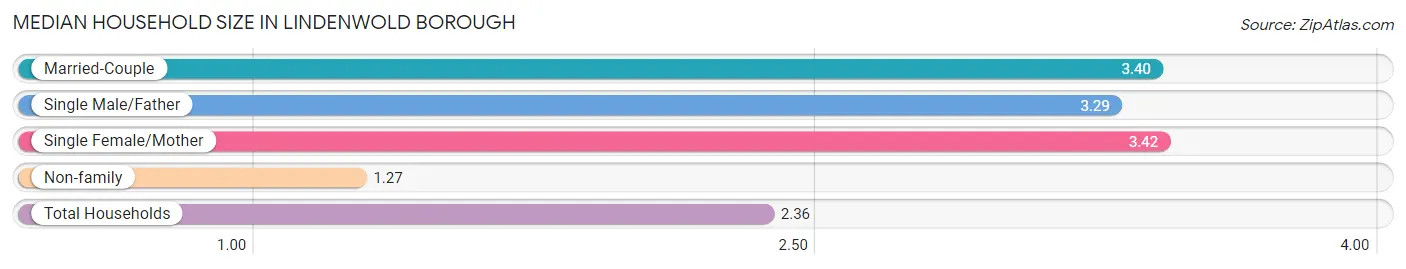
| Household Type | # Households | Household Size |
| Married-Couple | 2,707 (30.0%) | 3.40 |
| Single Male/Father | 516 (5.7%) | 3.29 |
| Single Female/Mother | 1,430 (15.8%) | 3.42 |
| Non-family | 4,374 (48.4%) | 1.27 |
| Total Households | 9,027 (100.0%) | 2.36 |
Household Size by Marriage Status in Lindenwold borough
Out of a total of 9,027 households in Lindenwold borough, 4,653 (51.5%) are family households, while 4,374 (48.4%) are nonfamily households. The most numerous type of family households are 2-person households, comprising 1,987, and the most common type of nonfamily households are 1-person households, comprising 3,213.
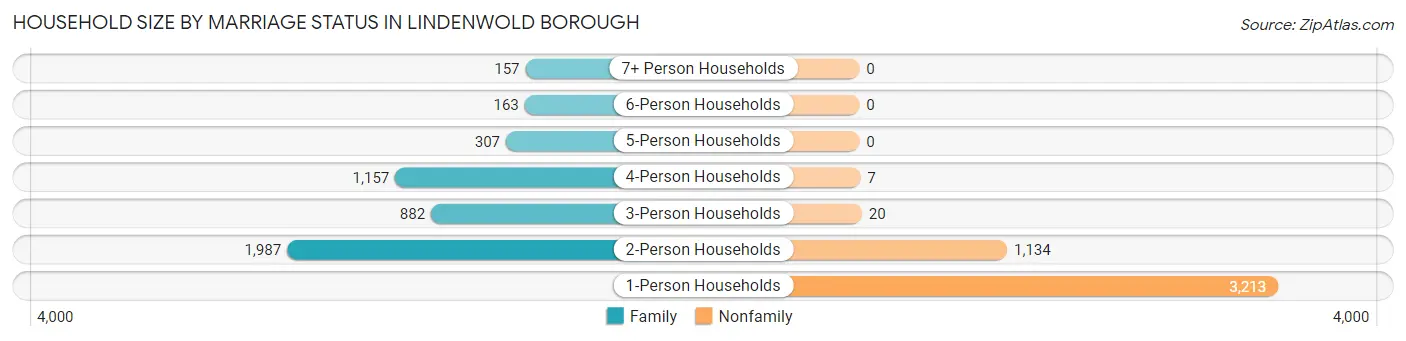
| Household Size | Family Households | Nonfamily Households |
| 1-Person Households | - | 3,213 (35.6%) |
| 2-Person Households | 1,987 (22.0%) | 1,134 (12.6%) |
| 3-Person Households | 882 (9.8%) | 20 (0.2%) |
| 4-Person Households | 1,157 (12.8%) | 7 (0.1%) |
| 5-Person Households | 307 (3.4%) | 0 (0.0%) |
| 6-Person Households | 163 (1.8%) | 0 (0.0%) |
| 7+ Person Households | 157 (1.7%) | 0 (0.0%) |
| Total | 4,653 (51.5%) | 4,374 (48.4%) |
Female Fertility in Lindenwold borough
Fertility by Age in Lindenwold borough
Average fertility rate in Lindenwold borough is 30.0 births per 1,000 women. Women in the age bracket of 15 to 19 years have the highest fertility rate with 60.0 births per 1,000 women. Women in the age bracket of 35 to 50 years acount for 42.6% of all women with births.
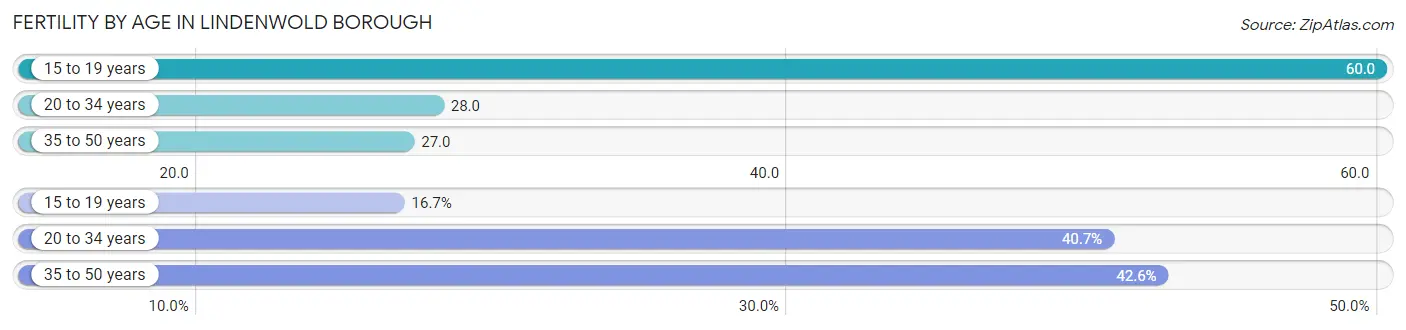
| Age Bracket | Women with Births | Births / 1,000 Women |
| 15 to 19 years | 27 (16.7%) | 60.0 |
| 20 to 34 years | 66 (40.7%) | 28.0 |
| 35 to 50 years | 69 (42.6%) | 27.0 |
| Total | 162 (100.0%) | 30.0 |
Fertility by Age by Marriage Status in Lindenwold borough
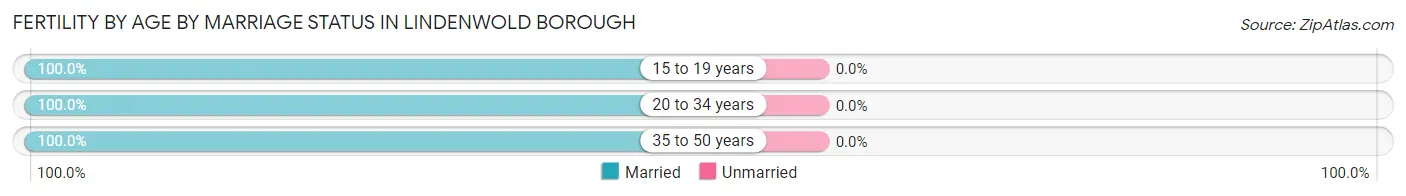
| Age Bracket | Married | Unmarried |
| 15 to 19 years | 27 (100.0%) | 0 (0.0%) |
| 20 to 34 years | 66 (100.0%) | 0 (0.0%) |
| 35 to 50 years | 69 (100.0%) | 0 (0.0%) |
| Total | 162 (100.0%) | 0 (0.0%) |
Fertility by Education in Lindenwold borough
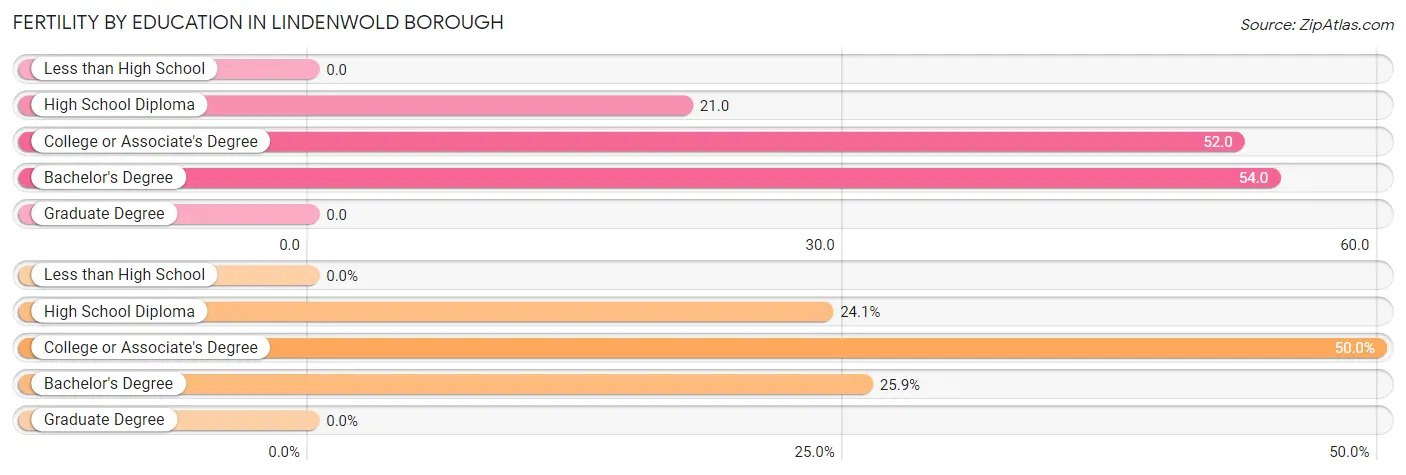
| Educational Attainment | Women with Births | Births / 1,000 Women |
| Less than High School | 0 (0.0%) | 0.0 |
| High School Diploma | 39 (24.1%) | 21.0 |
| College or Associate's Degree | 81 (50.0%) | 52.0 |
| Bachelor's Degree | 42 (25.9%) | 54.0 |
| Graduate Degree | 0 (0.0%) | 0.0 |
| Total | 162 (100.0%) | 30.0 |
Fertility by Education by Marriage Status in Lindenwold borough
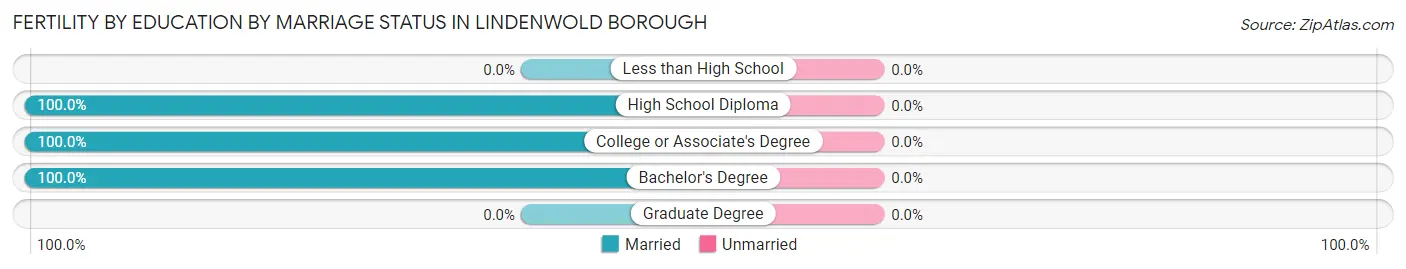
| Educational Attainment | Married | Unmarried |
| Less than High School | 0 (0.0%) | 0 (0.0%) |
| High School Diploma | 39 (100.0%) | 0 (0.0%) |
| College or Associate's Degree | 81 (100.0%) | 0 (0.0%) |
| Bachelor's Degree | 42 (100.0%) | 0 (0.0%) |
| Graduate Degree | 0 (0.0%) | 0 (0.0%) |
| Total | 162 (100.0%) | 0 (0.0%) |
Income in Lindenwold borough
Income Overview in Lindenwold borough
Per Capita Income in Lindenwold borough is $28,628, while median incomes of families and households are $66,901 and $53,645 respectively.
| Characteristic | Number | Measure |
| Per Capita Income | 21,337 | $28,628 |
| Median Family Income | 4,653 | $66,901 |
| Mean Family Income | 4,653 | $78,425 |
| Median Household Income | 9,027 | $53,645 |
| Mean Household Income | 9,027 | $66,378 |
| Income Deficit | 4,653 | $0 |
| Wage / Income Gap (%) | 21,337 | 16.72% |
| Wage / Income Gap ($) | 21,337 | 83.28¢ per $1 |
| Gini / Inequality Index | 21,337 | 0.42 |
Earnings by Sex in Lindenwold borough
Average Earnings in Lindenwold borough are $35,436, $38,825 for men and $32,333 for women, a difference of 16.7%.
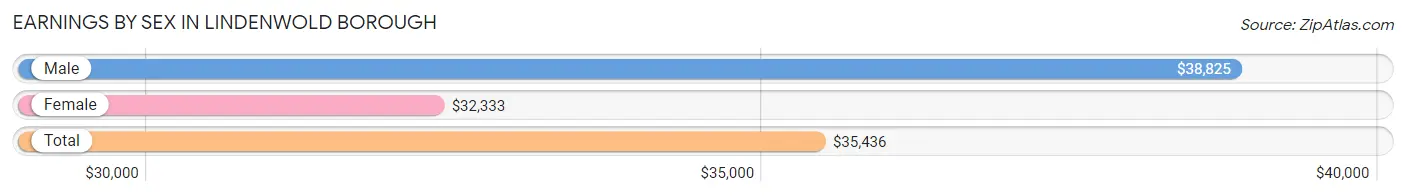
| Sex | Number | Average Earnings |
| Male | 6,232 (51.9%) | $38,825 |
| Female | 5,778 (48.1%) | $32,333 |
| Total | 12,010 (100.0%) | $35,436 |
Earnings by Sex by Income Bracket in Lindenwold borough
The most common earnings brackets in Lindenwold borough are $75,000 to $99,999 for men (736 | 11.8%) and $25,000 to $29,999 for women (734 | 12.7%).
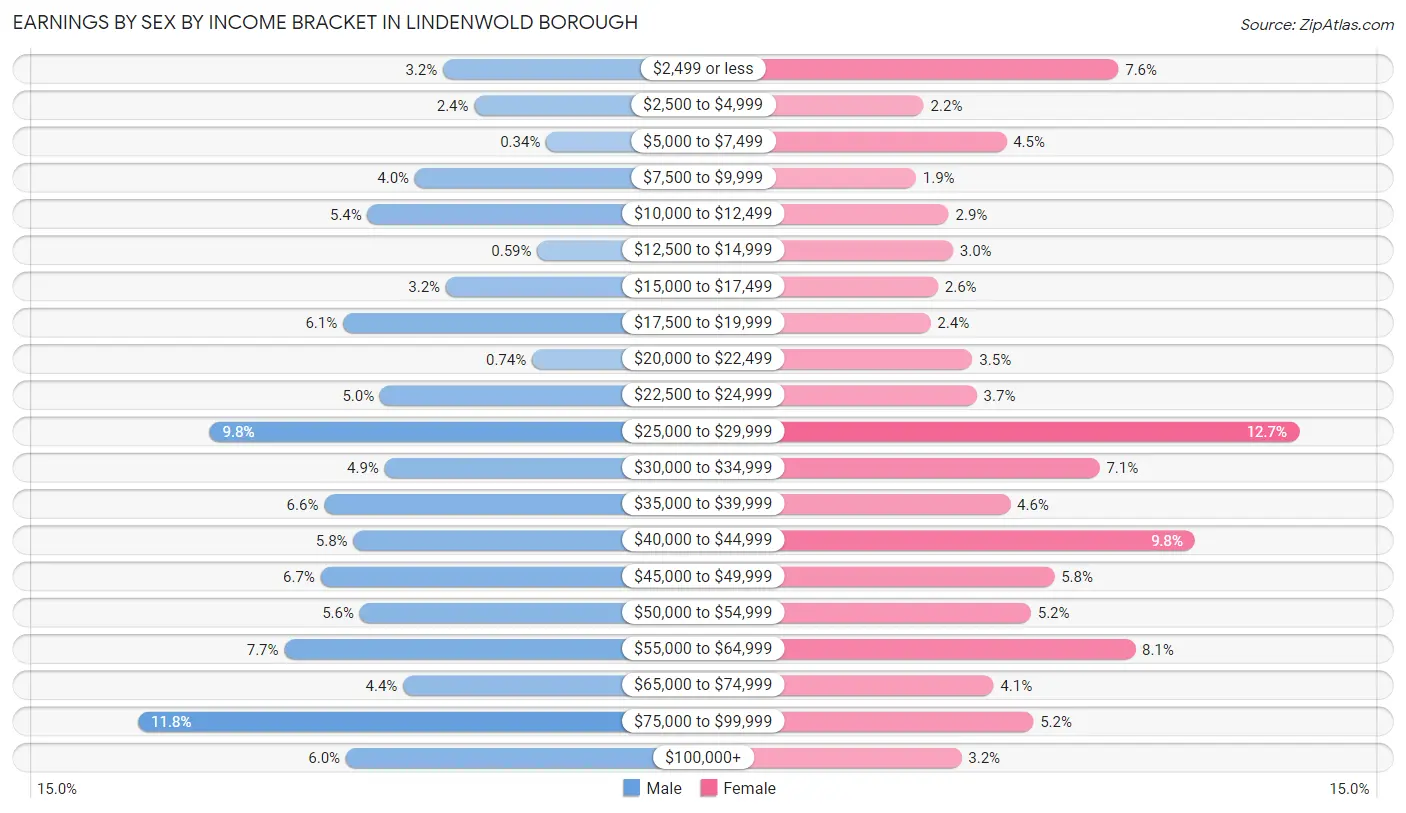
| Income | Male | Female |
| $2,499 or less | 202 (3.2%) | 441 (7.6%) |
| $2,500 to $4,999 | 147 (2.4%) | 125 (2.2%) |
| $5,000 to $7,499 | 21 (0.3%) | 259 (4.5%) |
| $7,500 to $9,999 | 251 (4.0%) | 112 (1.9%) |
| $10,000 to $12,499 | 334 (5.4%) | 165 (2.9%) |
| $12,500 to $14,999 | 37 (0.6%) | 172 (3.0%) |
| $15,000 to $17,499 | 197 (3.2%) | 148 (2.6%) |
| $17,500 to $19,999 | 377 (6.0%) | 136 (2.4%) |
| $20,000 to $22,499 | 46 (0.7%) | 204 (3.5%) |
| $22,500 to $24,999 | 312 (5.0%) | 211 (3.6%) |
| $25,000 to $29,999 | 611 (9.8%) | 734 (12.7%) |
| $30,000 to $34,999 | 304 (4.9%) | 410 (7.1%) |
| $35,000 to $39,999 | 410 (6.6%) | 265 (4.6%) |
| $40,000 to $44,999 | 359 (5.8%) | 565 (9.8%) |
| $45,000 to $49,999 | 416 (6.7%) | 337 (5.8%) |
| $50,000 to $54,999 | 348 (5.6%) | 299 (5.2%) |
| $55,000 to $64,999 | 480 (7.7%) | 468 (8.1%) |
| $65,000 to $74,999 | 272 (4.4%) | 238 (4.1%) |
| $75,000 to $99,999 | 736 (11.8%) | 303 (5.2%) |
| $100,000+ | 372 (6.0%) | 186 (3.2%) |
| Total | 6,232 (100.0%) | 5,778 (100.0%) |
Earnings by Sex by Educational Attainment in Lindenwold borough
Average earnings in Lindenwold borough are $41,948 for men and $33,593 for women, a difference of 19.9%. Men with an educational attainment of graduate degree enjoy the highest average annual earnings of $64,531, while those with less than high school education earn the least with $33,977. Women with an educational attainment of graduate degree earn the most with the average annual earnings of $88,642, while those with less than high school education have the smallest earnings of $26,037.
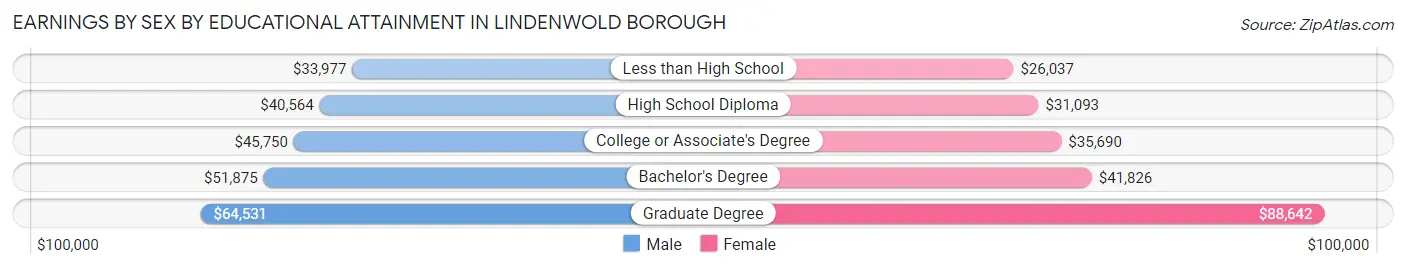
| Educational Attainment | Male Income | Female Income |
| Less than High School | $33,977 | $26,037 |
| High School Diploma | $40,564 | $31,093 |
| College or Associate's Degree | $45,750 | $35,690 |
| Bachelor's Degree | $51,875 | $41,826 |
| Graduate Degree | $64,531 | $88,642 |
| Total | $41,948 | $33,593 |
Family Income in Lindenwold borough
Family Income Brackets in Lindenwold borough
According to the Lindenwold borough family income data, there are 1,024 families falling into the $50,000 to $74,999 income range, which is the most common income bracket and makes up 22.0% of all families. Conversely, the less than $10,000 income bracket is the least frequent group with only 60 families (1.3%) belonging to this category.
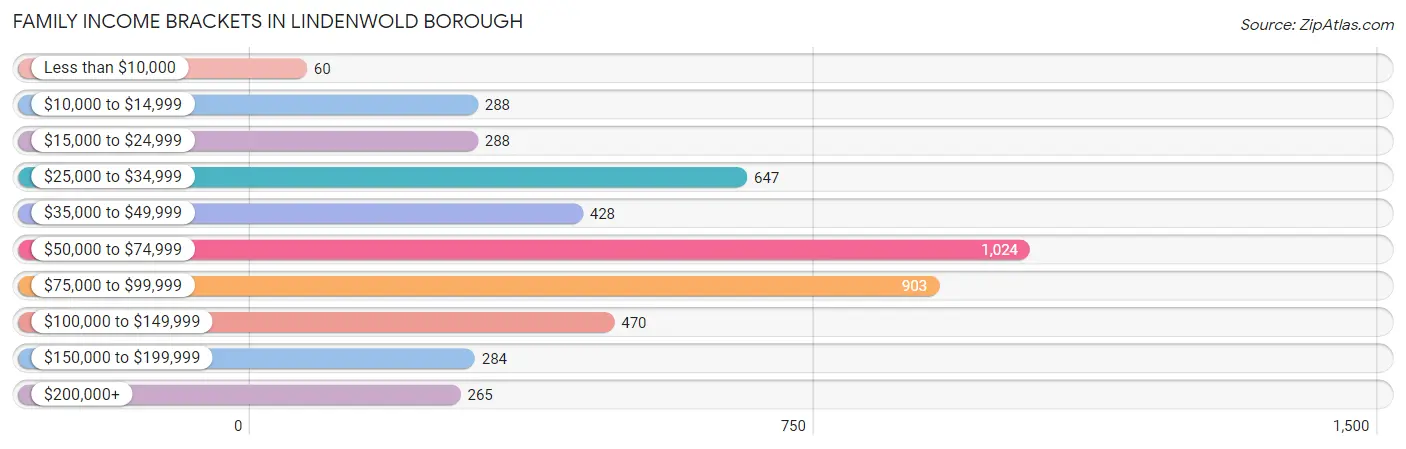
| Income Bracket | # Families | % Families |
| Less than $10,000 | 60 | 1.3% |
| $10,000 to $14,999 | 288 | 6.2% |
| $15,000 to $24,999 | 288 | 6.2% |
| $25,000 to $34,999 | 647 | 13.9% |
| $35,000 to $49,999 | 428 | 9.2% |
| $50,000 to $74,999 | 1,024 | 22.0% |
| $75,000 to $99,999 | 903 | 19.4% |
| $100,000 to $149,999 | 470 | 10.1% |
| $150,000 to $199,999 | 284 | 6.1% |
| $200,000+ | 265 | 5.7% |
Family Income by Famaliy Size in Lindenwold borough
3-person families (707 | 15.2%) account for the highest median family income in Lindenwold borough with $78,011 per family, while 2-person families (2,241 | 48.2%) have the highest median income of $30,364 per family member.
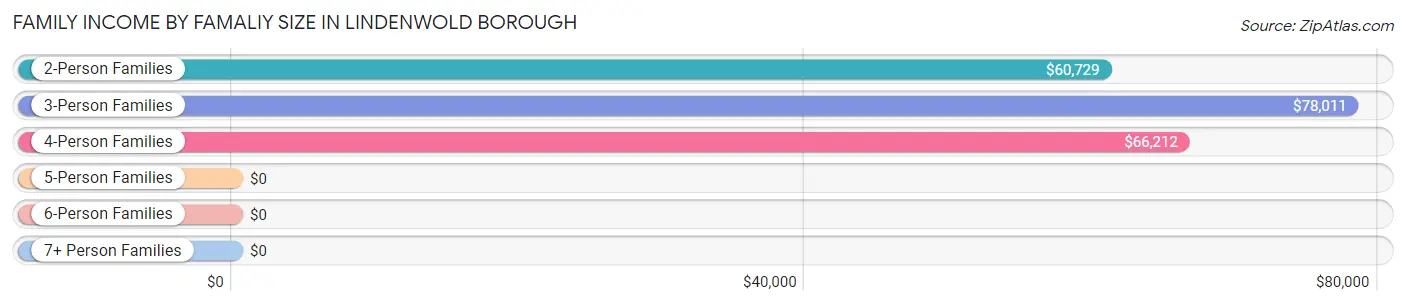
| Income Bracket | # Families | Median Income |
| 2-Person Families | 2,241 (48.2%) | $60,729 |
| 3-Person Families | 707 (15.2%) | $78,011 |
| 4-Person Families | 1,129 (24.3%) | $66,212 |
| 5-Person Families | 305 (6.6%) | $0 |
| 6-Person Families | 150 (3.2%) | $0 |
| 7+ Person Families | 121 (2.6%) | $0 |
| Total | 4,653 (100.0%) | $66,901 |
Family Income by Number of Earners in Lindenwold borough
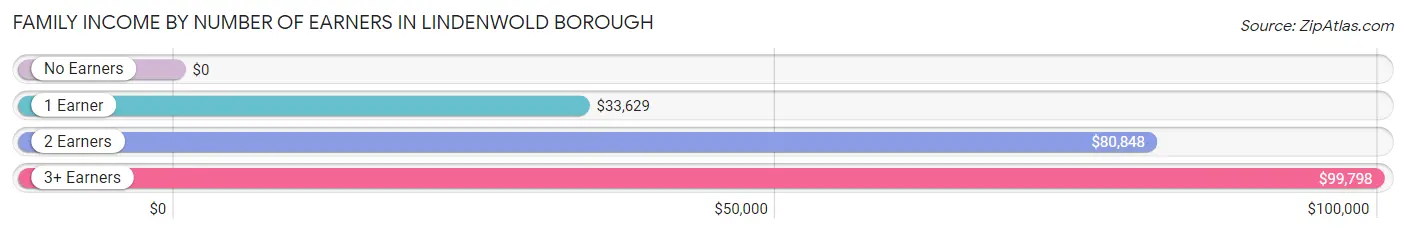
| Number of Earners | # Families | Median Income |
| No Earners | 383 (8.2%) | $0 |
| 1 Earner | 1,716 (36.9%) | $33,629 |
| 2 Earners | 1,875 (40.3%) | $80,848 |
| 3+ Earners | 679 (14.6%) | $99,798 |
| Total | 4,653 (100.0%) | $66,901 |
Household Income in Lindenwold borough
Household Income Brackets in Lindenwold borough
With 1,860 households falling in the category, the $50,000 to $74,999 income range is the most frequent in Lindenwold borough, accounting for 20.6% of all households. In contrast, only 307 households (3.4%) fall into the $200,000+ income bracket, making it the least populous group.
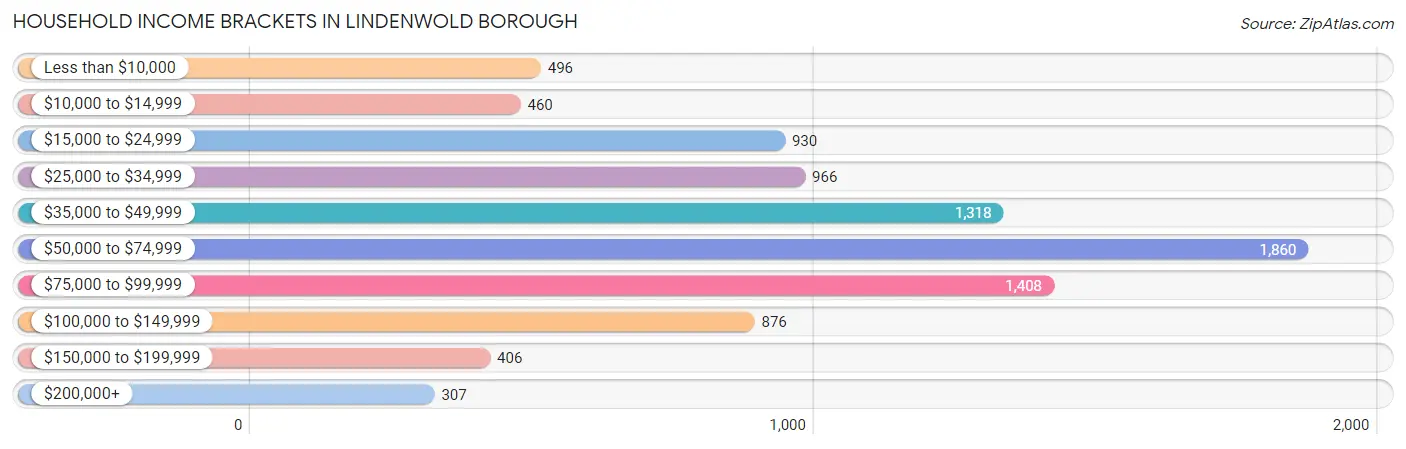
| Income Bracket | # Households | % Households |
| Less than $10,000 | 496 | 5.5% |
| $10,000 to $14,999 | 460 | 5.1% |
| $15,000 to $24,999 | 930 | 10.3% |
| $25,000 to $34,999 | 966 | 10.7% |
| $35,000 to $49,999 | 1,318 | 14.6% |
| $50,000 to $74,999 | 1,860 | 20.6% |
| $75,000 to $99,999 | 1,408 | 15.6% |
| $100,000 to $149,999 | 876 | 9.7% |
| $150,000 to $199,999 | 406 | 4.5% |
| $200,000+ | 307 | 3.4% |
Household Income by Householder Age in Lindenwold borough
The median household income in Lindenwold borough is $53,645, with the highest median household income of $61,728 found in the 45 to 64 years age bracket for the primary householder. A total of 3,360 households (37.2%) fall into this category. Meanwhile, the 15 to 24 years age bracket for the primary householder has the lowest median household income of $0, with 187 households (2.1%) in this group.
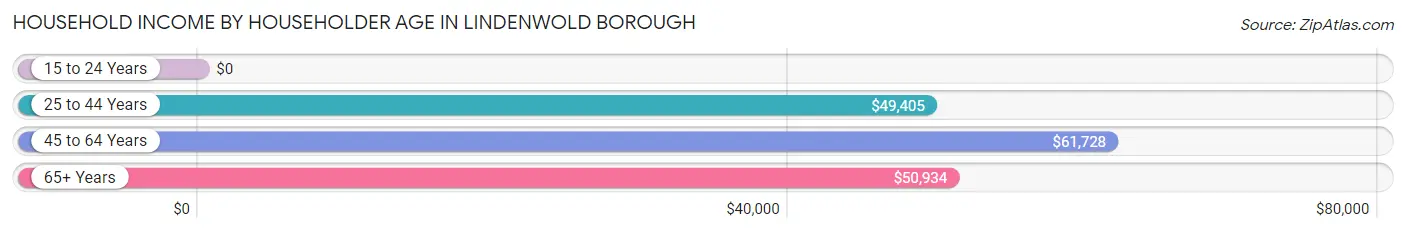
| Income Bracket | # Households | Median Income |
| 15 to 24 Years | 187 (2.1%) | $0 |
| 25 to 44 Years | 3,688 (40.9%) | $49,405 |
| 45 to 64 Years | 3,360 (37.2%) | $61,728 |
| 65+ Years | 1,792 (19.9%) | $50,934 |
| Total | 9,027 (100.0%) | $53,645 |
Poverty in Lindenwold borough
Income Below Poverty by Sex and Age in Lindenwold borough
With 22.4% poverty level for males and 23.3% for females among the residents of Lindenwold borough, 15 year old males and 15 year old females are the most vulnerable to poverty, with 138 males (100.0%) and 35 females (100.0%) in their respective age groups living below the poverty level.
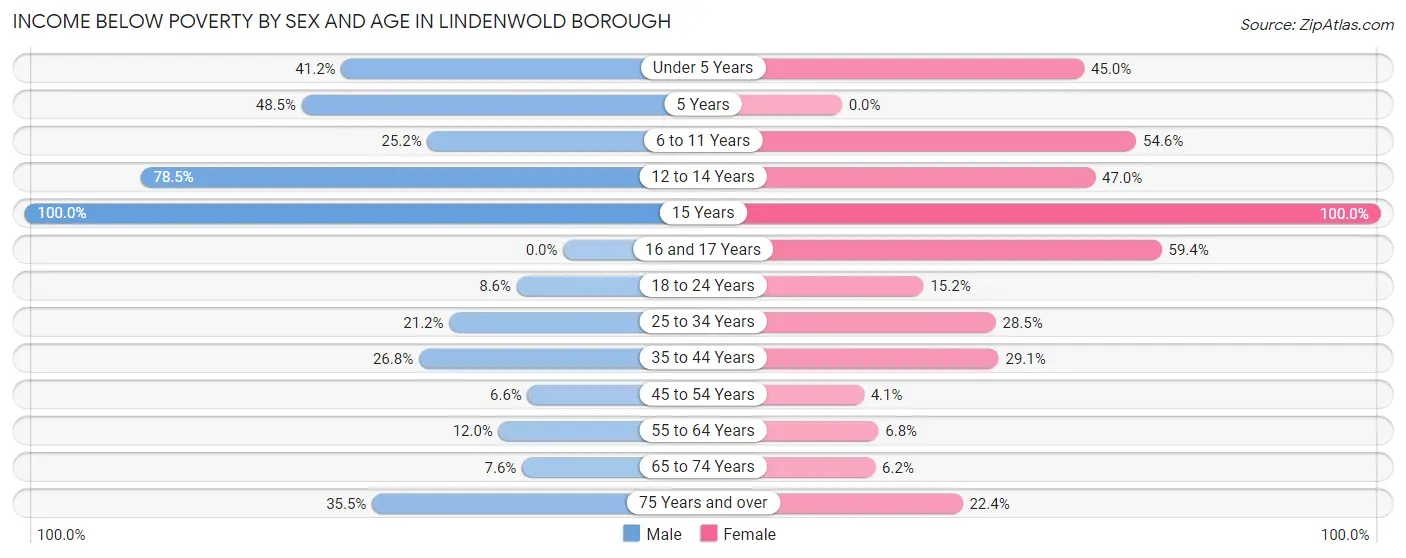
| Age Bracket | Male | Female |
| Under 5 Years | 365 (41.2%) | 255 (45.0%) |
| 5 Years | 133 (48.5%) | 0 (0.0%) |
| 6 to 11 Years | 235 (25.2%) | 360 (54.6%) |
| 12 to 14 Years | 208 (78.5%) | 315 (47.0%) |
| 15 Years | 138 (100.0%) | 35 (100.0%) |
| 16 and 17 Years | 0 (0.0%) | 73 (59.4%) |
| 18 to 24 Years | 75 (8.6%) | 121 (15.2%) |
| 25 to 34 Years | 340 (21.2%) | 524 (28.5%) |
| 35 to 44 Years | 410 (26.8%) | 493 (29.1%) |
| 45 to 54 Years | 78 (6.6%) | 56 (4.1%) |
| 55 to 64 Years | 204 (12.0%) | 69 (6.8%) |
| 65 to 74 Years | 62 (7.6%) | 77 (6.2%) |
| 75 Years and over | 132 (35.5%) | 110 (22.4%) |
| Total | 2,380 (22.4%) | 2,488 (23.3%) |
Income Above Poverty by Sex and Age in Lindenwold borough
According to the poverty statistics in Lindenwold borough, males aged 16 and 17 years and females aged 5 years are the age groups that are most secure financially, with 100.0% of males and 100.0% of females in these age groups living above the poverty line.
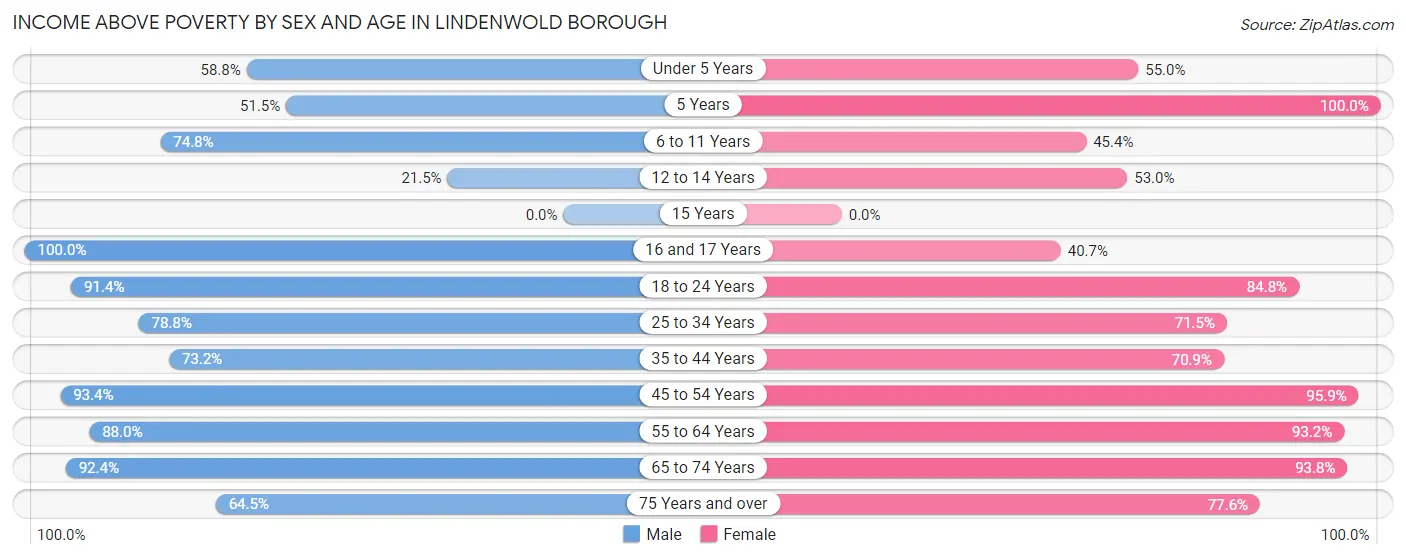
| Age Bracket | Male | Female |
| Under 5 Years | 521 (58.8%) | 312 (55.0%) |
| 5 Years | 141 (51.5%) | 152 (100.0%) |
| 6 to 11 Years | 697 (74.8%) | 299 (45.4%) |
| 12 to 14 Years | 57 (21.5%) | 355 (53.0%) |
| 15 Years | 0 (0.0%) | 0 (0.0%) |
| 16 and 17 Years | 79 (100.0%) | 50 (40.6%) |
| 18 to 24 Years | 794 (91.4%) | 677 (84.8%) |
| 25 to 34 Years | 1,267 (78.8%) | 1,312 (71.5%) |
| 35 to 44 Years | 1,120 (73.2%) | 1,201 (70.9%) |
| 45 to 54 Years | 1,101 (93.4%) | 1,320 (95.9%) |
| 55 to 64 Years | 1,496 (88.0%) | 948 (93.2%) |
| 65 to 74 Years | 749 (92.4%) | 1,166 (93.8%) |
| 75 Years and over | 240 (64.5%) | 381 (77.6%) |
| Total | 8,262 (77.6%) | 8,173 (76.7%) |
Income Below Poverty Among Married-Couple Families in Lindenwold borough
The poverty statistics for married-couple families in Lindenwold borough show that 20.9% or 565 of the total 2,707 families live below the poverty line. Families with 3 or 4 children have the highest poverty rate of 55.9%, comprising of 160 families. On the other hand, families with 5 or more children have the lowest poverty rate of 0.0%, which includes 0 families.
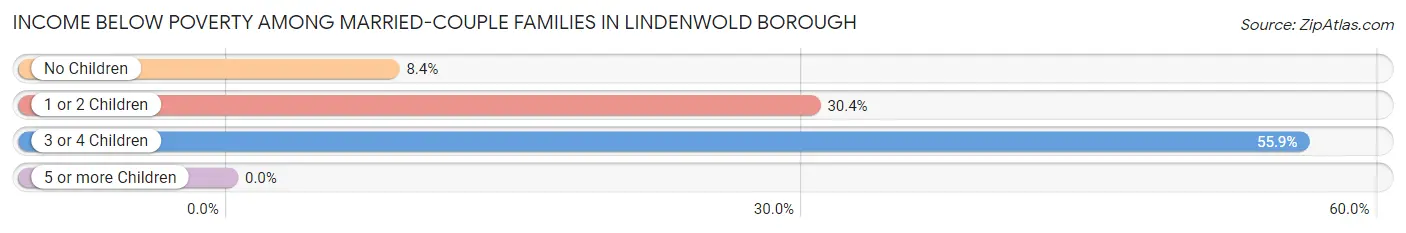
| Children | Above Poverty | Below Poverty |
| No Children | 1,379 (91.6%) | 127 (8.4%) |
| 1 or 2 Children | 636 (69.6%) | 278 (30.4%) |
| 3 or 4 Children | 126 (44.1%) | 160 (55.9%) |
| 5 or more Children | 1 (100.0%) | 0 (0.0%) |
| Total | 2,142 (79.1%) | 565 (20.9%) |
Income Below Poverty Among Single-Parent Households in Lindenwold borough
According to the poverty data in Lindenwold borough, 2.7% or 14 single-father households and 20.2% or 289 single-mother households are living below the poverty line. Among single-father households, those with 1 or 2 children have the highest poverty rate, with 14 households (5.7%) experiencing poverty. Likewise, among single-mother households, those with 5 or more children have the highest poverty rate, with 36 households (100.0%) falling below the poverty line.
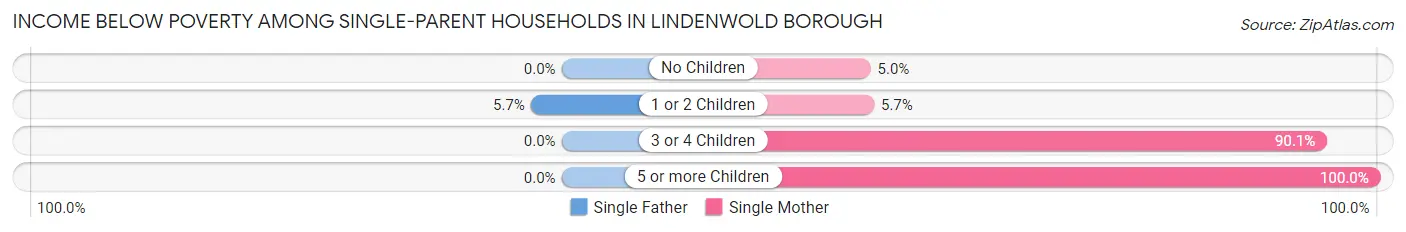
| Children | Single Father | Single Mother |
| No Children | 0 (0.0%) | 31 (5.0%) |
| 1 or 2 Children | 14 (5.7%) | 32 (5.7%) |
| 3 or 4 Children | 0 (0.0%) | 190 (90.0%) |
| 5 or more Children | 0 (0.0%) | 36 (100.0%) |
| Total | 14 (2.7%) | 289 (20.2%) |
Income Below Poverty Among Married-Couple vs Single-Parent Households in Lindenwold borough
The poverty data for Lindenwold borough shows that 565 of the married-couple family households (20.9%) and 303 of the single-parent households (15.6%) are living below the poverty level. Within the married-couple family households, those with 3 or 4 children have the highest poverty rate, with 160 households (55.9%) falling below the poverty line. Among the single-parent households, those with 5 or more children have the highest poverty rate, with 36 household (100.0%) living below poverty.
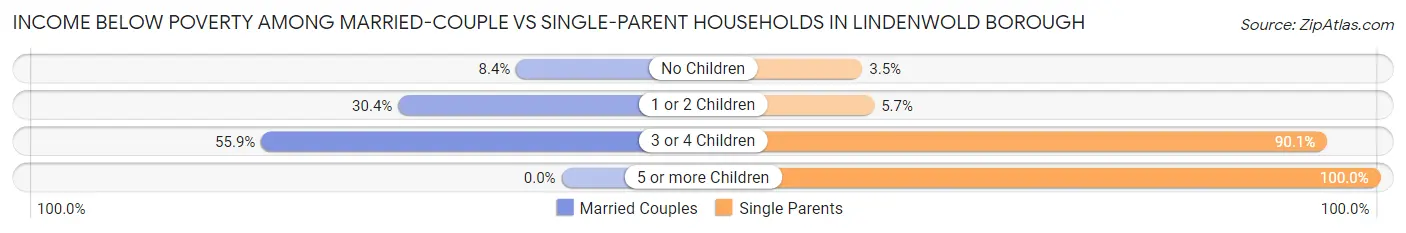
| Children | Married-Couple Families | Single-Parent Households |
| No Children | 127 (8.4%) | 31 (3.5%) |
| 1 or 2 Children | 278 (30.4%) | 46 (5.7%) |
| 3 or 4 Children | 160 (55.9%) | 190 (90.0%) |
| 5 or more Children | 0 (0.0%) | 36 (100.0%) |
| Total | 565 (20.9%) | 303 (15.6%) |
Employment Characteristics in Lindenwold borough
Employment by Class of Employer in Lindenwold borough
Among the 10,883 employed individuals in Lindenwold borough, private company employees (7,987 | 73.4%), not-for-profit organizations (1,142 | 10.5%), and state government employees (536 | 4.9%) make up the most common classes of employment.
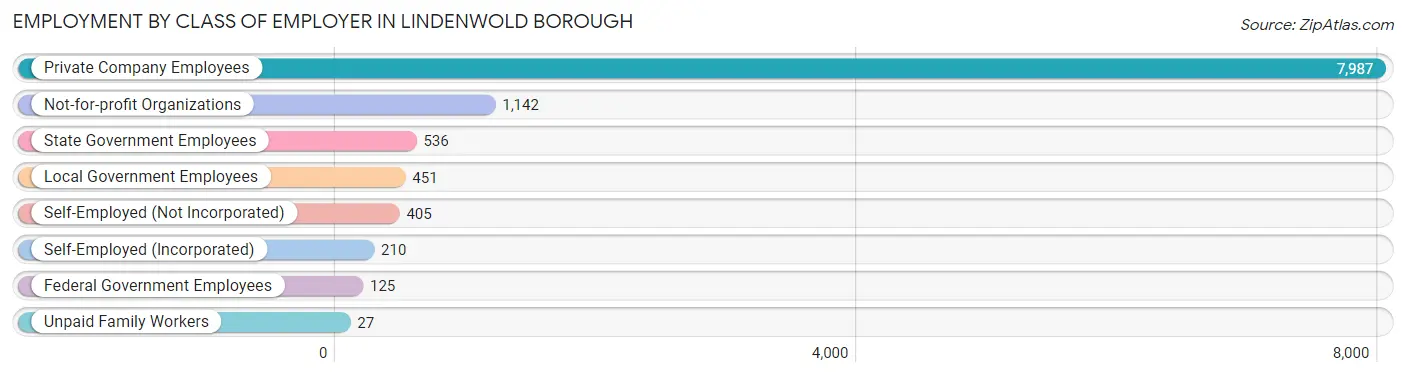
| Employer Class | # Employees | % Employees |
| Private Company Employees | 7,987 | 73.4% |
| Self-Employed (Incorporated) | 210 | 1.9% |
| Self-Employed (Not Incorporated) | 405 | 3.7% |
| Not-for-profit Organizations | 1,142 | 10.5% |
| Local Government Employees | 451 | 4.1% |
| State Government Employees | 536 | 4.9% |
| Federal Government Employees | 125 | 1.1% |
| Unpaid Family Workers | 27 | 0.3% |
| Total | 10,883 | 100.0% |
Employment Status by Age in Lindenwold borough
According to the labor force statistics for Lindenwold borough, out of the total population over 16 years of age (16,725), 68.7% or 11,490 individuals are in the labor force, with 3.5% or 402 of them unemployed. The age group with the highest labor force participation rate is 30 to 34 years, with 92.3% or 1,747 individuals in the labor force. Within the labor force, the 16 to 19 years age range has the highest percentage of unemployed individuals, with 27.3% or 76 of them being unemployed.
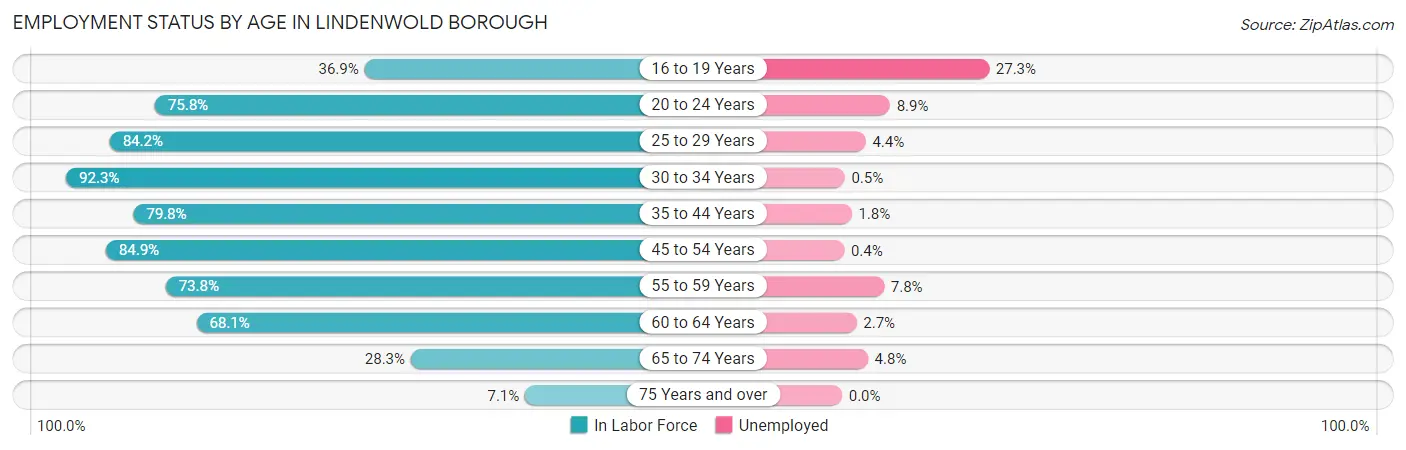
| Age Bracket | In Labor Force | Unemployed |
| 16 to 19 Years | 278 (36.9%) | 76 (27.3%) |
| 20 to 24 Years | 846 (75.8%) | 75 (8.9%) |
| 25 to 29 Years | 1,305 (84.2%) | 57 (4.4%) |
| 30 to 34 Years | 1,747 (92.3%) | 9 (0.5%) |
| 35 to 44 Years | 2,573 (79.8%) | 46 (1.8%) |
| 45 to 54 Years | 2,169 (84.9%) | 9 (0.4%) |
| 55 to 59 Years | 960 (73.8%) | 75 (7.8%) |
| 60 to 64 Years | 964 (68.1%) | 26 (2.7%) |
| 65 to 74 Years | 581 (28.3%) | 28 (4.8%) |
| 75 Years and over | 61 (7.1%) | 0 (0.0%) |
| Total | 11,490 (68.7%) | 402 (3.5%) |
Employment Status by Educational Attainment in Lindenwold borough
According to labor force statistics for Lindenwold borough, 81.4% of individuals (9,718) out of the total population between 25 and 64 years of age (11,939) are in the labor force, with 2.3% or 224 of them being unemployed. The group with the highest labor force participation rate are those with the educational attainment of bachelor's degree or higher, with 87.9% or 2,016 individuals in the labor force. Within the labor force, individuals with college / associate degree education have the highest percentage of unemployment, with 3.9% or 97 of them being unemployed.
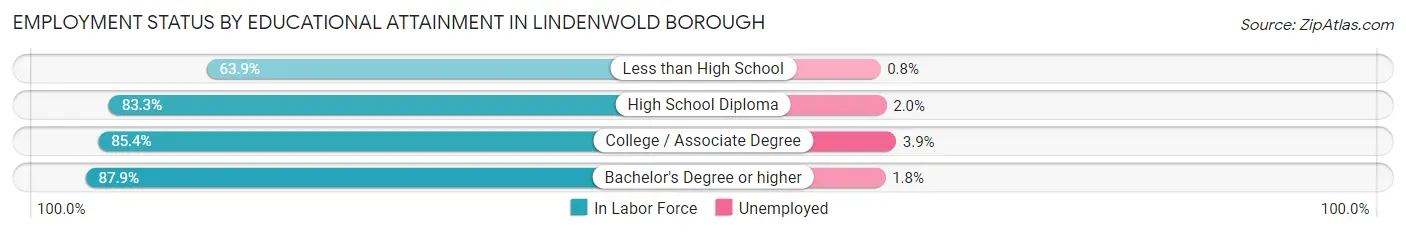
| Educational Attainment | In Labor Force | Unemployed |
| Less than High School | 1,298 (63.9%) | 16 (0.8%) |
| High School Diploma | 3,907 (83.3%) | 94 (2.0%) |
| College / Associate Degree | 2,497 (85.4%) | 114 (3.9%) |
| Bachelor's Degree or higher | 2,016 (87.9%) | 41 (1.8%) |
| Total | 9,718 (81.4%) | 275 (2.3%) |
Employment Occupations by Sex in Lindenwold borough
Management, Business, Science and Arts Occupations
The most common Management, Business, Science and Arts occupations in Lindenwold borough are Community & Social Service (903 | 8.2%), Health Diagnosing & Treating (644 | 5.8%), Management (622 | 5.6%), Education Instruction & Library (352 | 3.2%), and Computers, Engineering & Science (302 | 2.7%).
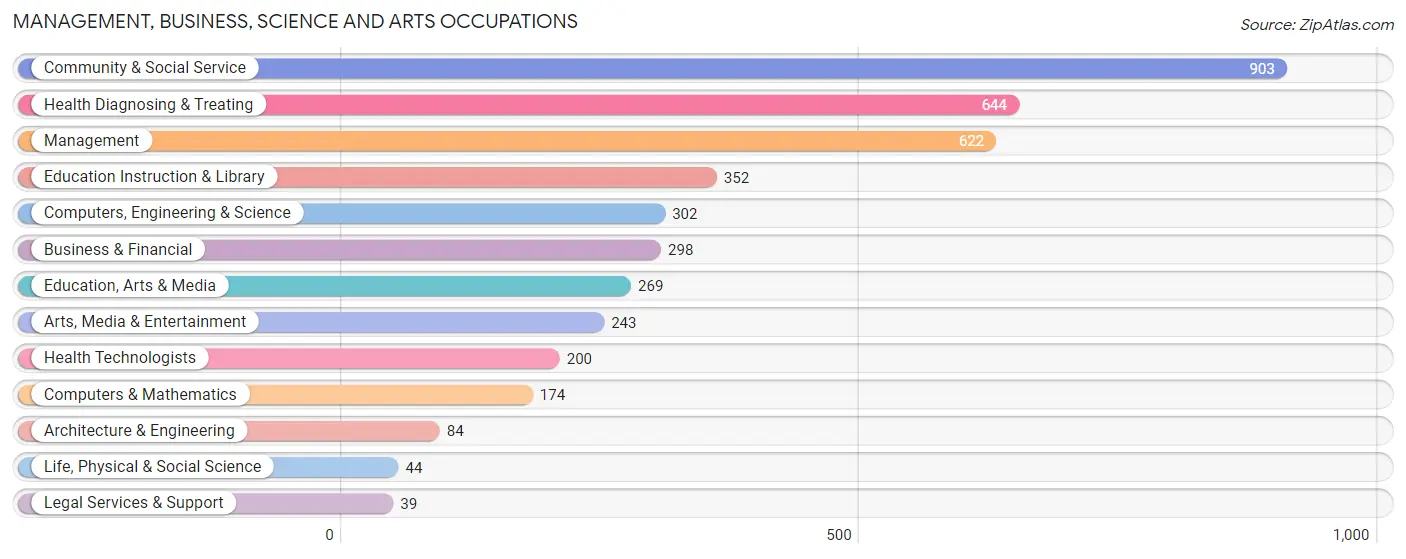
Management, Business, Science and Arts Occupations by Sex
Within the Management, Business, Science and Arts occupations in Lindenwold borough, the most male-oriented occupations are Life, Physical & Social Science (100.0%), Computers & Mathematics (89.7%), and Computers, Engineering & Science (81.1%), while the most female-oriented occupations are Legal Services & Support (100.0%), Education Instruction & Library (75.6%), and Health Diagnosing & Treating (75.2%).
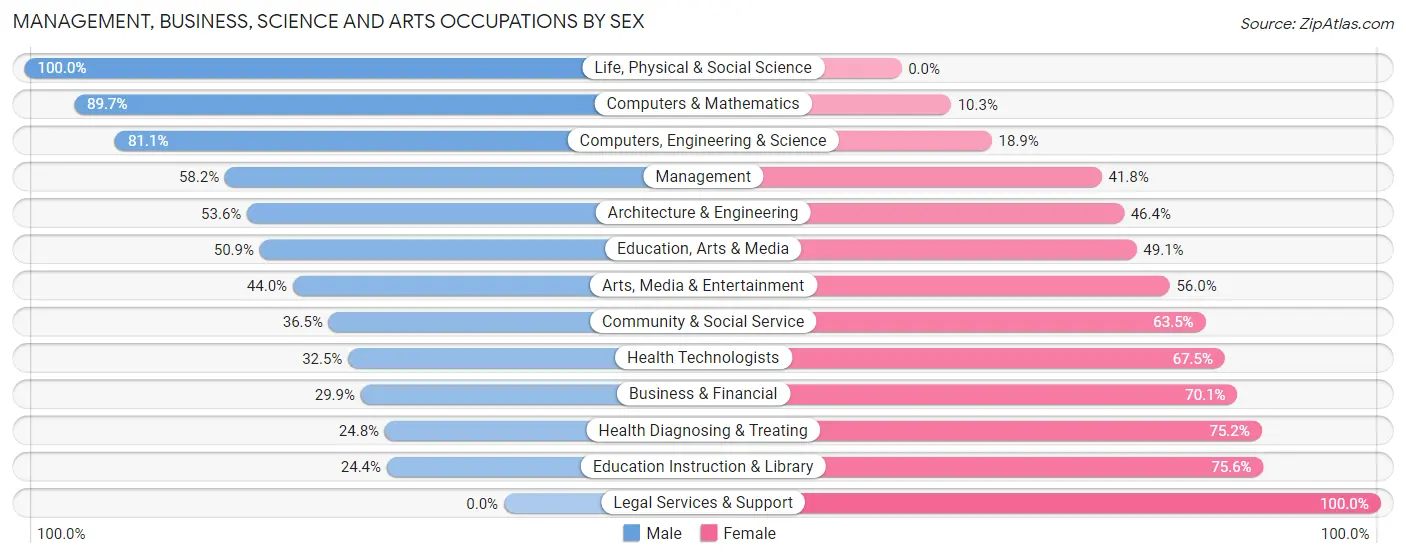
| Occupation | Male | Female |
| Management | 362 (58.2%) | 260 (41.8%) |
| Business & Financial | 89 (29.9%) | 209 (70.1%) |
| Computers, Engineering & Science | 245 (81.1%) | 57 (18.9%) |
| Computers & Mathematics | 156 (89.7%) | 18 (10.3%) |
| Architecture & Engineering | 45 (53.6%) | 39 (46.4%) |
| Life, Physical & Social Science | 44 (100.0%) | 0 (0.0%) |
| Community & Social Service | 330 (36.5%) | 573 (63.5%) |
| Education, Arts & Media | 137 (50.9%) | 132 (49.1%) |
| Legal Services & Support | 0 (0.0%) | 39 (100.0%) |
| Education Instruction & Library | 86 (24.4%) | 266 (75.6%) |
| Arts, Media & Entertainment | 107 (44.0%) | 136 (56.0%) |
| Health Diagnosing & Treating | 160 (24.8%) | 484 (75.2%) |
| Health Technologists | 65 (32.5%) | 135 (67.5%) |
| Total (Category) | 1,186 (42.8%) | 1,583 (57.2%) |
| Total (Overall) | 5,893 (53.2%) | 5,191 (46.8%) |
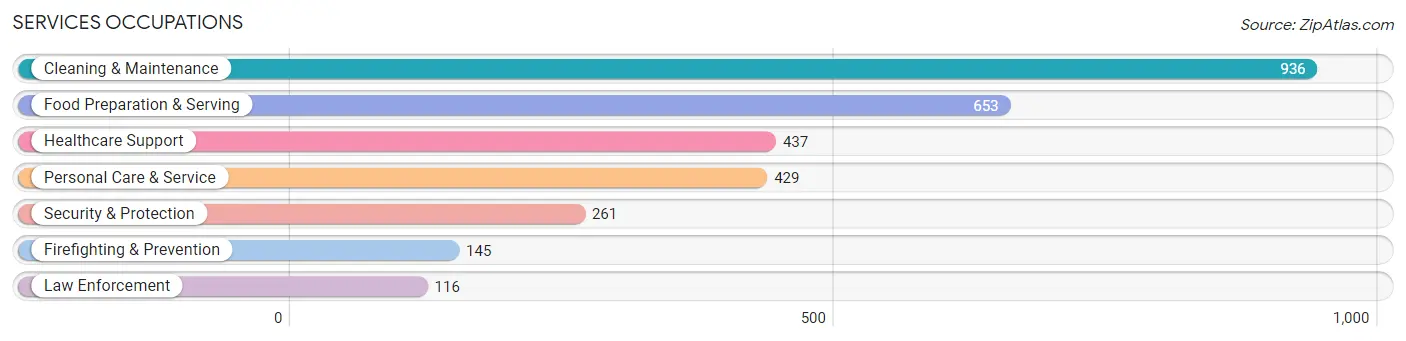
Services Occupations
The most common Services occupations in Lindenwold borough are Cleaning & Maintenance (936 | 8.4%), Food Preparation & Serving (653 | 5.9%), Healthcare Support (437 | 3.9%), Personal Care & Service (429 | 3.9%), and Security & Protection (261 | 2.4%).
Services Occupations by Sex
Within the Services occupations in Lindenwold borough, the most male-oriented occupations are Law Enforcement (92.2%), Security & Protection (91.9%), and Firefighting & Prevention (91.7%), while the most female-oriented occupations are Healthcare Support (82.8%), Personal Care & Service (65.3%), and Food Preparation & Serving (61.1%).
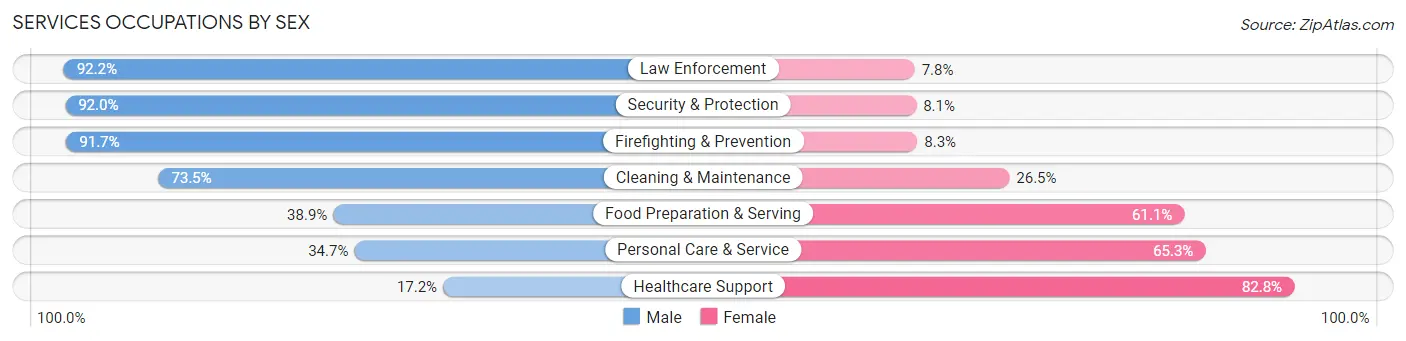
| Occupation | Male | Female |
| Healthcare Support | 75 (17.2%) | 362 (82.8%) |
| Security & Protection | 240 (91.9%) | 21 (8.1%) |
| Firefighting & Prevention | 133 (91.7%) | 12 (8.3%) |
| Law Enforcement | 107 (92.2%) | 9 (7.8%) |
| Food Preparation & Serving | 254 (38.9%) | 399 (61.1%) |
| Cleaning & Maintenance | 688 (73.5%) | 248 (26.5%) |
| Personal Care & Service | 149 (34.7%) | 280 (65.3%) |
| Total (Category) | 1,406 (51.8%) | 1,310 (48.2%) |
| Total (Overall) | 5,893 (53.2%) | 5,191 (46.8%) |
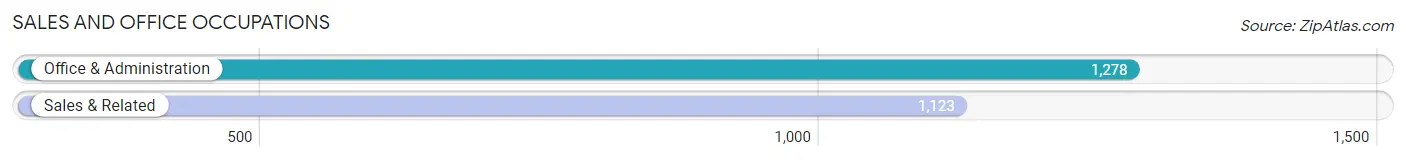
Sales and Office Occupations
The most common Sales and Office occupations in Lindenwold borough are Office & Administration (1,278 | 11.5%), and Sales & Related (1,123 | 10.1%).
Sales and Office Occupations by Sex
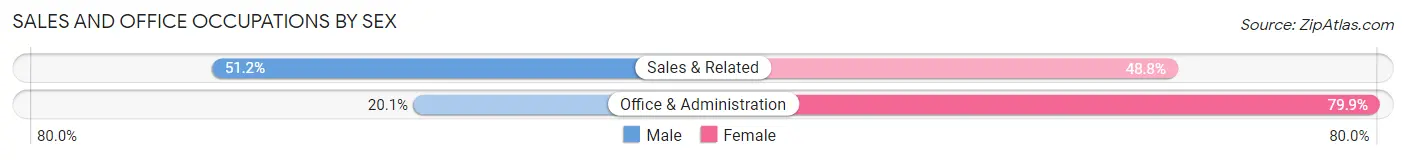
| Occupation | Male | Female |
| Sales & Related | 575 (51.2%) | 548 (48.8%) |
| Office & Administration | 257 (20.1%) | 1,021 (79.9%) |
| Total (Category) | 832 (34.6%) | 1,569 (65.3%) |
| Total (Overall) | 5,893 (53.2%) | 5,191 (46.8%) |
Natural Resources, Construction and Maintenance Occupations
The most common Natural Resources, Construction and Maintenance occupations in Lindenwold borough are Construction & Extraction (820 | 7.4%), Installation, Maintenance & Repair (160 | 1.4%), and Farming, Fishing & Forestry (15 | 0.1%).
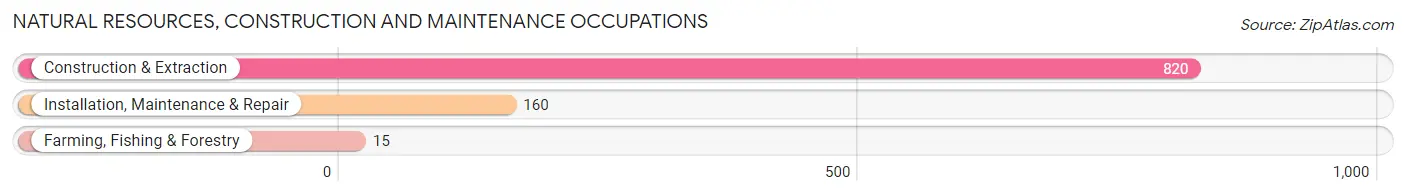
Natural Resources, Construction and Maintenance Occupations by Sex
| Occupation | Male | Female |
| Farming, Fishing & Forestry | 15 (100.0%) | 0 (0.0%) |
| Construction & Extraction | 774 (94.4%) | 46 (5.6%) |
| Installation, Maintenance & Repair | 160 (100.0%) | 0 (0.0%) |
| Total (Category) | 949 (95.4%) | 46 (4.6%) |
| Total (Overall) | 5,893 (53.2%) | 5,191 (46.8%) |
Production, Transportation and Moving Occupations
The most common Production, Transportation and Moving occupations in Lindenwold borough are Transportation (822 | 7.4%), Material Moving (699 | 6.3%), and Production (682 | 6.1%).
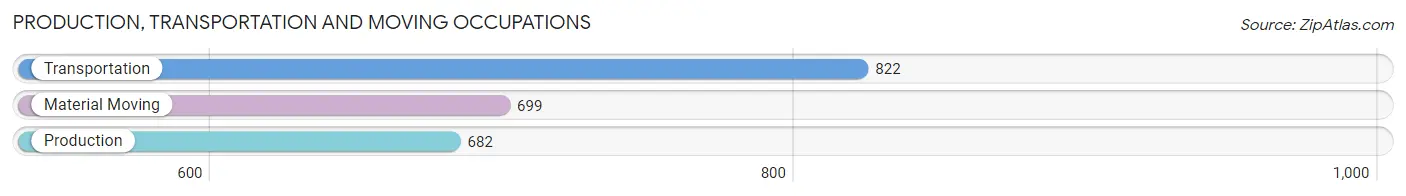
Production, Transportation and Moving Occupations by Sex
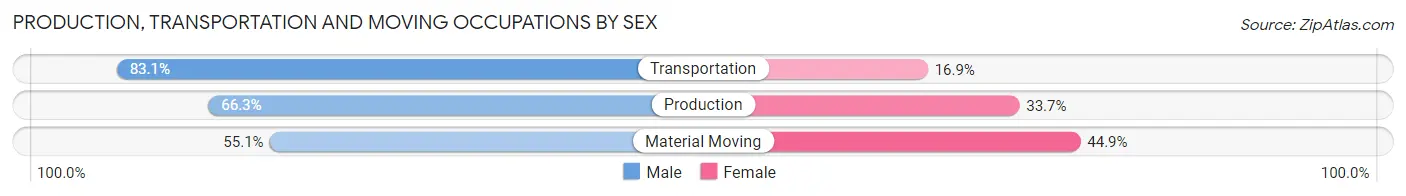
| Occupation | Male | Female |
| Production | 452 (66.3%) | 230 (33.7%) |
| Transportation | 683 (83.1%) | 139 (16.9%) |
| Material Moving | 385 (55.1%) | 314 (44.9%) |
| Total (Category) | 1,520 (69.0%) | 683 (31.0%) |
| Total (Overall) | 5,893 (53.2%) | 5,191 (46.8%) |
Employment Industries by Sex in Lindenwold borough
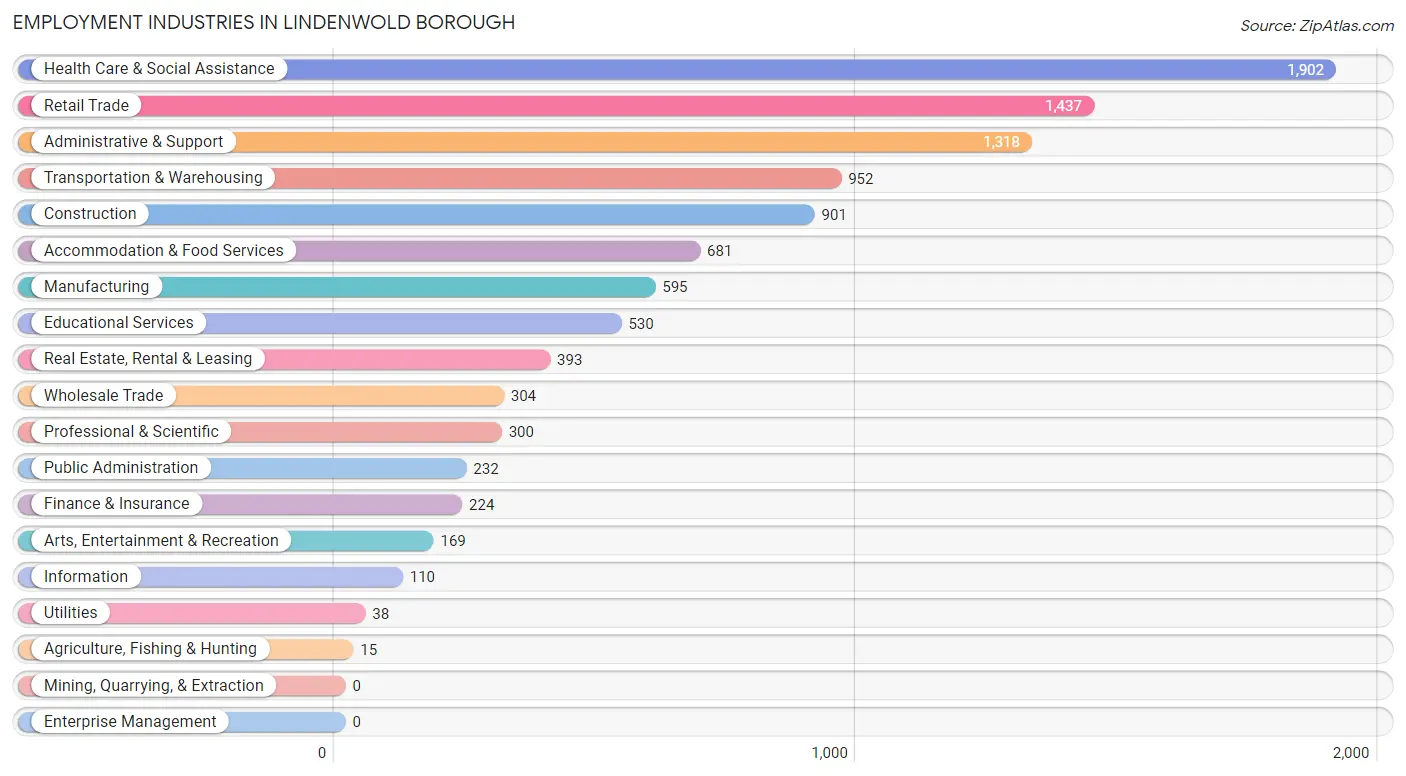
Employment Industries in Lindenwold borough
The major employment industries in Lindenwold borough include Health Care & Social Assistance (1,902 | 17.2%), Retail Trade (1,437 | 13.0%), Administrative & Support (1,318 | 11.9%), Transportation & Warehousing (952 | 8.6%), and Construction (901 | 8.1%).
Employment Industries by Sex in Lindenwold borough
The Lindenwold borough industries that see more men than women are Agriculture, Fishing & Hunting (100.0%), Construction (97.5%), and Real Estate, Rental & Leasing (77.6%), whereas the industries that tend to have a higher number of women are Utilities (89.5%), Health Care & Social Assistance (79.8%), and Educational Services (69.8%).
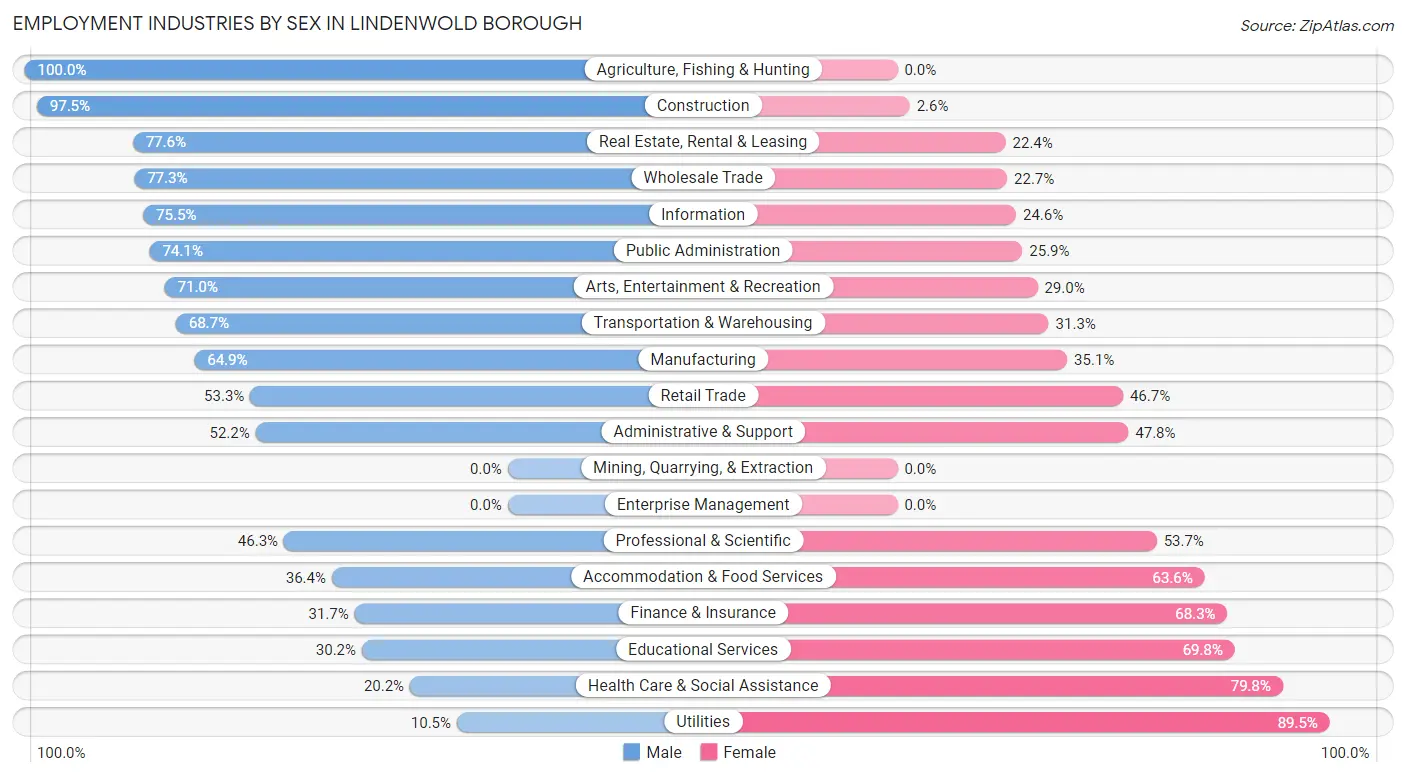
| Industry | Male | Female |
| Agriculture, Fishing & Hunting | 15 (100.0%) | 0 (0.0%) |
| Mining, Quarrying, & Extraction | 0 (0.0%) | 0 (0.0%) |
| Construction | 878 (97.5%) | 23 (2.5%) |
| Manufacturing | 386 (64.9%) | 209 (35.1%) |
| Wholesale Trade | 235 (77.3%) | 69 (22.7%) |
| Retail Trade | 766 (53.3%) | 671 (46.7%) |
| Transportation & Warehousing | 654 (68.7%) | 298 (31.3%) |
| Utilities | 4 (10.5%) | 34 (89.5%) |
| Information | 83 (75.4%) | 27 (24.5%) |
| Finance & Insurance | 71 (31.7%) | 153 (68.3%) |
| Real Estate, Rental & Leasing | 305 (77.6%) | 88 (22.4%) |
| Professional & Scientific | 139 (46.3%) | 161 (53.7%) |
| Enterprise Management | 0 (0.0%) | 0 (0.0%) |
| Administrative & Support | 688 (52.2%) | 630 (47.8%) |
| Educational Services | 160 (30.2%) | 370 (69.8%) |
| Health Care & Social Assistance | 385 (20.2%) | 1,517 (79.8%) |
| Arts, Entertainment & Recreation | 120 (71.0%) | 49 (29.0%) |
| Accommodation & Food Services | 248 (36.4%) | 433 (63.6%) |
| Public Administration | 172 (74.1%) | 60 (25.9%) |
| Total | 5,893 (53.2%) | 5,191 (46.8%) |
Education in Lindenwold borough
School Enrollment in Lindenwold borough
The most common levels of schooling among the 4,461 students in Lindenwold borough are middle school (1,383 | 31.0%), elementary school (974 | 21.8%), and college / undergraduate (675 | 15.1%).
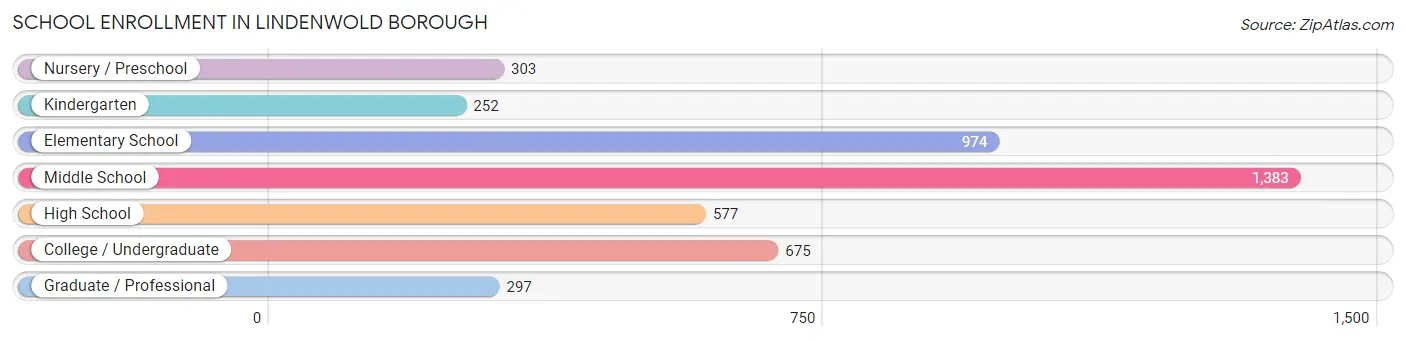
| School Level | # Students | % Students |
| Nursery / Preschool | 303 | 6.8% |
| Kindergarten | 252 | 5.7% |
| Elementary School | 974 | 21.8% |
| Middle School | 1,383 | 31.0% |
| High School | 577 | 12.9% |
| College / Undergraduate | 675 | 15.1% |
| Graduate / Professional | 297 | 6.7% |
| Total | 4,461 | 100.0% |
School Enrollment by Age by Funding Source in Lindenwold borough
Out of a total of 4,461 students who are enrolled in schools in Lindenwold borough, 401 (9.0%) attend a private institution, while the remaining 4,060 (91.0%) are enrolled in public schools. The age group of 18 to 19 year olds has the highest likelihood of being enrolled in private schools, with 131 (43.4% in the age bracket) enrolled. Conversely, the age group of 35 years and over has the lowest likelihood of being enrolled in a private school, with 176 (100.0% in the age bracket) attending a public institution.
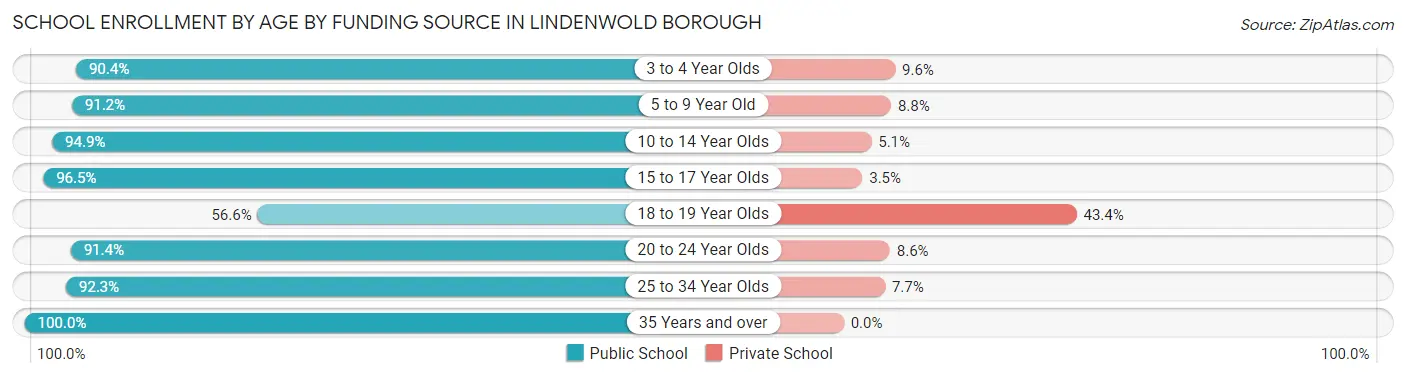
| Age Bracket | Public School | Private School |
| 3 to 4 Year Olds | 151 (90.4%) | 16 (9.6%) |
| 5 to 9 Year Old | 1,139 (91.2%) | 110 (8.8%) |
| 10 to 14 Year Olds | 1,494 (94.9%) | 81 (5.1%) |
| 15 to 17 Year Olds | 362 (96.5%) | 13 (3.5%) |
| 18 to 19 Year Olds | 171 (56.6%) | 131 (43.4%) |
| 20 to 24 Year Olds | 255 (91.4%) | 24 (8.6%) |
| 25 to 34 Year Olds | 312 (92.3%) | 26 (7.7%) |
| 35 Years and over | 176 (100.0%) | 0 (0.0%) |
| Total | 4,060 (91.0%) | 401 (9.0%) |
Educational Attainment by Field of Study in Lindenwold borough
Business (396 | 13.4%), psychology (339 | 11.5%), education (325 | 11.0%), arts & humanities (287 | 9.7%), and social sciences (285 | 9.7%) are the most common fields of study among 2,952 individuals in Lindenwold borough who have obtained a bachelor's degree or higher.
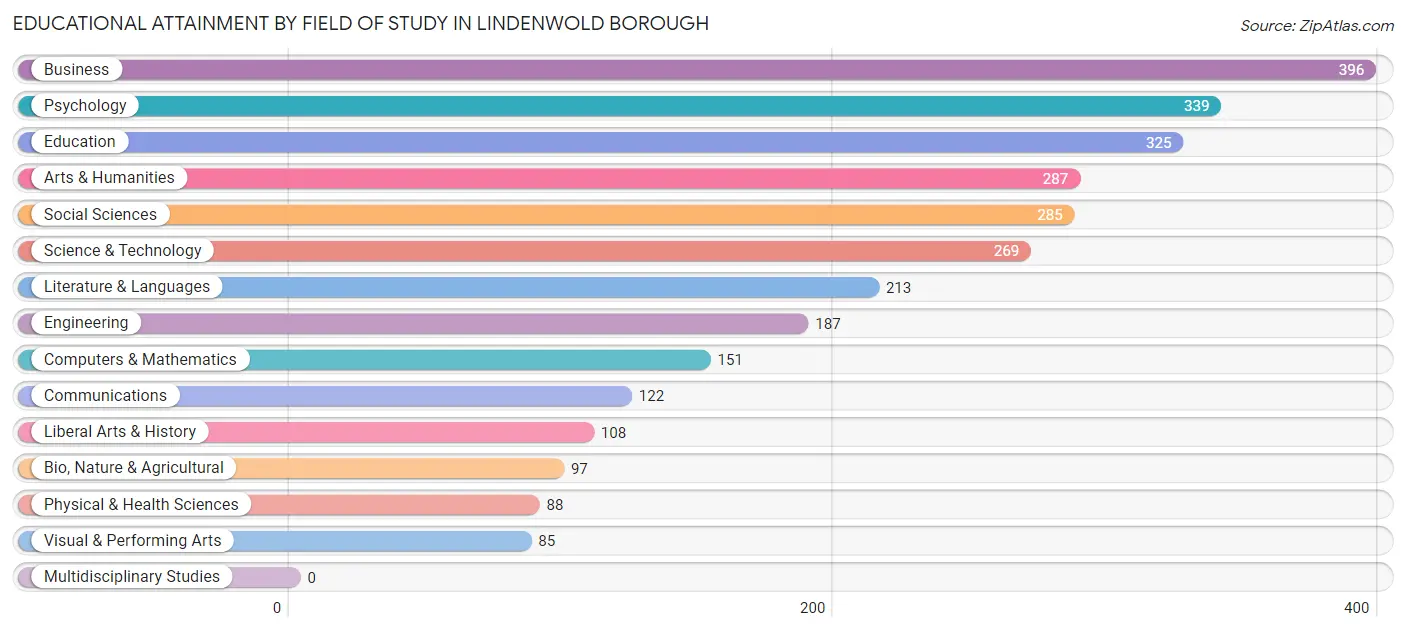
| Field of Study | # Graduates | % Graduates |
| Computers & Mathematics | 151 | 5.1% |
| Bio, Nature & Agricultural | 97 | 3.3% |
| Physical & Health Sciences | 88 | 3.0% |
| Psychology | 339 | 11.5% |
| Social Sciences | 285 | 9.7% |
| Engineering | 187 | 6.3% |
| Multidisciplinary Studies | 0 | 0.0% |
| Science & Technology | 269 | 9.1% |
| Business | 396 | 13.4% |
| Education | 325 | 11.0% |
| Literature & Languages | 213 | 7.2% |
| Liberal Arts & History | 108 | 3.7% |
| Visual & Performing Arts | 85 | 2.9% |
| Communications | 122 | 4.1% |
| Arts & Humanities | 287 | 9.7% |
| Total | 2,952 | 100.0% |
Transportation & Commute in Lindenwold borough
Vehicle Availability by Sex in Lindenwold borough
The most prevalent vehicle ownership categories in Lindenwold borough are males with 2 vehicles (2,424, accounting for 42.2%) and females with 2 vehicles (2,212, making up 47.1%).
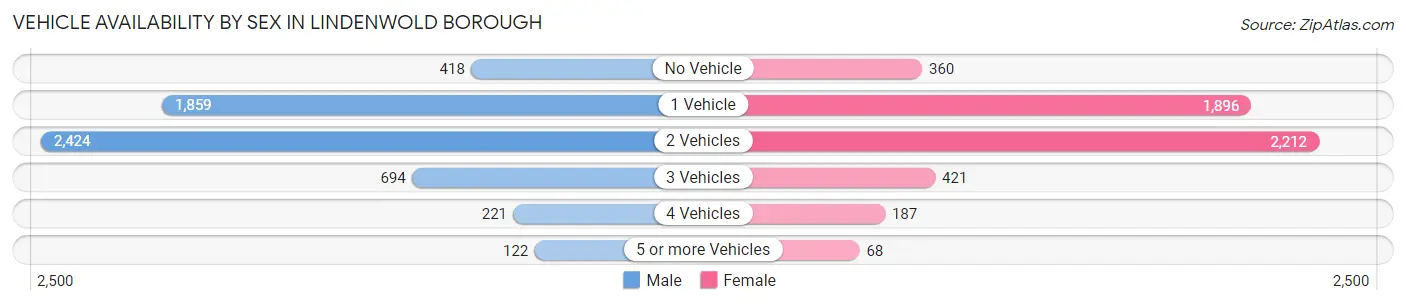
| Vehicles Available | Male | Female |
| No Vehicle | 418 (7.3%) | 360 (7.0%) |
| 1 Vehicle | 1,859 (32.4%) | 1,896 (36.9%) |
| 2 Vehicles | 2,424 (42.2%) | 2,212 (43.0%) |
| 3 Vehicles | 694 (12.1%) | 421 (8.2%) |
| 4 Vehicles | 221 (3.8%) | 187 (3.6%) |
| 5 or more Vehicles | 122 (2.1%) | 68 (1.3%) |
| Total | 5,738 (100.0%) | 5,144 (100.0%) |
Commute Time in Lindenwold borough
The most frequently occuring commute durations in Lindenwold borough are 10 to 14 minutes (2,141 commuters, 20.4%), 30 to 34 minutes (2,032 commuters, 19.4%), and 20 to 24 minutes (1,581 commuters, 15.1%).
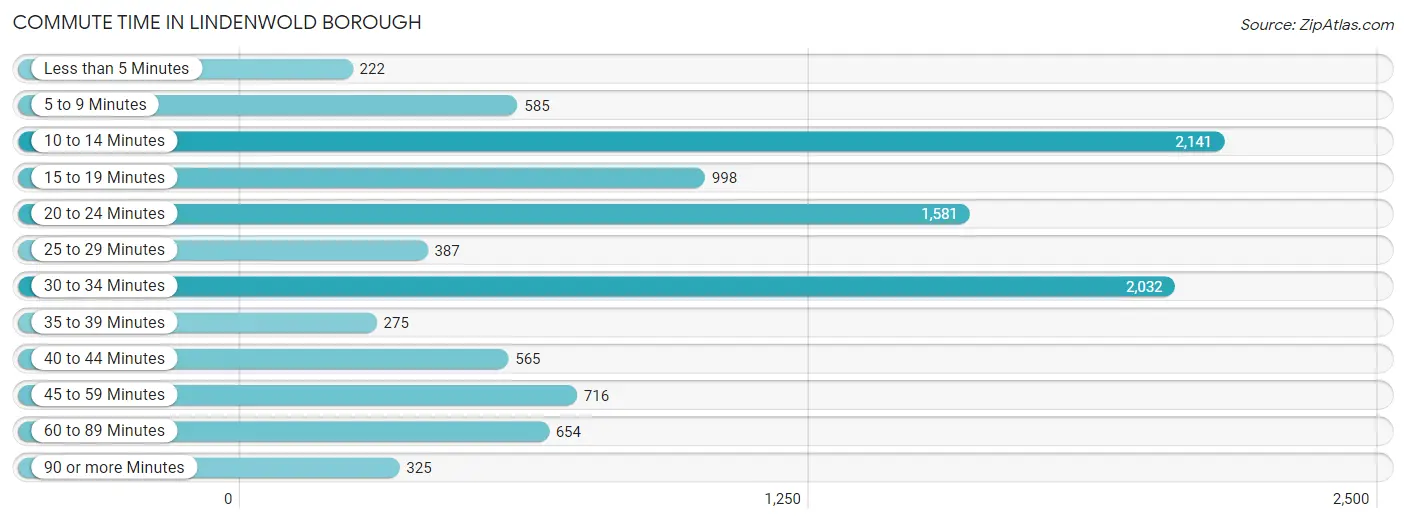
| Commute Time | # Commuters | % Commuters |
| Less than 5 Minutes | 222 | 2.1% |
| 5 to 9 Minutes | 585 | 5.6% |
| 10 to 14 Minutes | 2,141 | 20.4% |
| 15 to 19 Minutes | 998 | 9.5% |
| 20 to 24 Minutes | 1,581 | 15.1% |
| 25 to 29 Minutes | 387 | 3.7% |
| 30 to 34 Minutes | 2,032 | 19.4% |
| 35 to 39 Minutes | 275 | 2.6% |
| 40 to 44 Minutes | 565 | 5.4% |
| 45 to 59 Minutes | 716 | 6.8% |
| 60 to 89 Minutes | 654 | 6.2% |
| 90 or more Minutes | 325 | 3.1% |
Commute Time by Sex in Lindenwold borough
The most common commute times in Lindenwold borough are 10 to 14 minutes (1,311 commuters, 23.3%) for males and 30 to 34 minutes (969 commuters, 20.0%) for females.
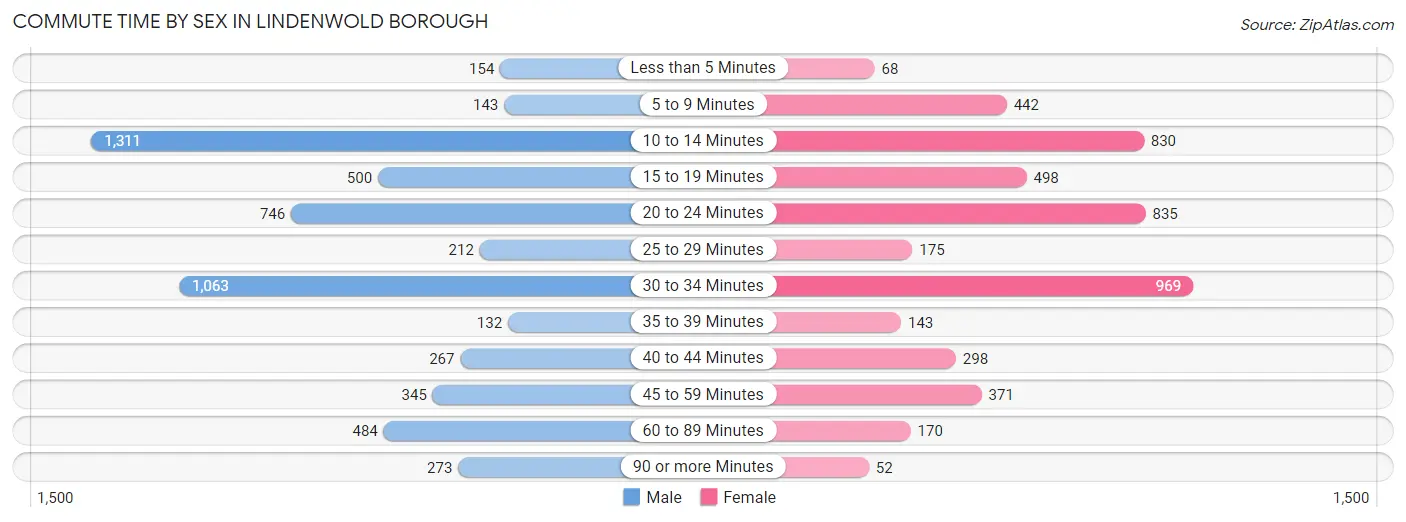
| Commute Time | Male | Female |
| Less than 5 Minutes | 154 (2.7%) | 68 (1.4%) |
| 5 to 9 Minutes | 143 (2.5%) | 442 (9.1%) |
| 10 to 14 Minutes | 1,311 (23.3%) | 830 (17.1%) |
| 15 to 19 Minutes | 500 (8.9%) | 498 (10.3%) |
| 20 to 24 Minutes | 746 (13.3%) | 835 (17.2%) |
| 25 to 29 Minutes | 212 (3.8%) | 175 (3.6%) |
| 30 to 34 Minutes | 1,063 (18.9%) | 969 (20.0%) |
| 35 to 39 Minutes | 132 (2.3%) | 143 (2.9%) |
| 40 to 44 Minutes | 267 (4.7%) | 298 (6.1%) |
| 45 to 59 Minutes | 345 (6.1%) | 371 (7.6%) |
| 60 to 89 Minutes | 484 (8.6%) | 170 (3.5%) |
| 90 or more Minutes | 273 (4.9%) | 52 (1.1%) |
Time of Departure to Work by Sex in Lindenwold borough
The most frequent times of departure to work in Lindenwold borough are 4:00 PM to 11:59 PM (802, 14.2%) for males and 6:30 AM to 6:59 AM (670, 13.8%) for females.
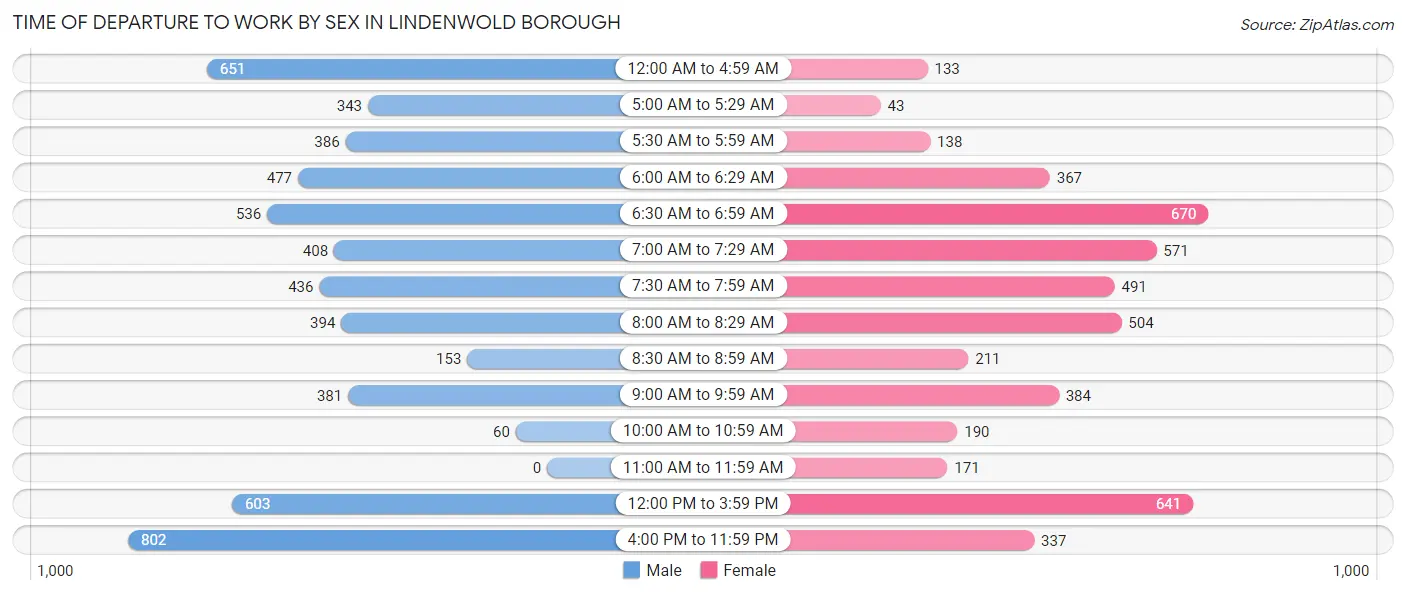
| Time of Departure | Male | Female |
| 12:00 AM to 4:59 AM | 651 (11.6%) | 133 (2.7%) |
| 5:00 AM to 5:29 AM | 343 (6.1%) | 43 (0.9%) |
| 5:30 AM to 5:59 AM | 386 (6.9%) | 138 (2.8%) |
| 6:00 AM to 6:29 AM | 477 (8.5%) | 367 (7.6%) |
| 6:30 AM to 6:59 AM | 536 (9.5%) | 670 (13.8%) |
| 7:00 AM to 7:29 AM | 408 (7.2%) | 571 (11.8%) |
| 7:30 AM to 7:59 AM | 436 (7.7%) | 491 (10.1%) |
| 8:00 AM to 8:29 AM | 394 (7.0%) | 504 (10.4%) |
| 8:30 AM to 8:59 AM | 153 (2.7%) | 211 (4.3%) |
| 9:00 AM to 9:59 AM | 381 (6.8%) | 384 (7.9%) |
| 10:00 AM to 10:59 AM | 60 (1.1%) | 190 (3.9%) |
| 11:00 AM to 11:59 AM | 0 (0.0%) | 171 (3.5%) |
| 12:00 PM to 3:59 PM | 603 (10.7%) | 641 (13.2%) |
| 4:00 PM to 11:59 PM | 802 (14.2%) | 337 (7.0%) |
| Total | 5,630 (100.0%) | 4,851 (100.0%) |
Housing Occupancy in Lindenwold borough
Occupancy by Ownership in Lindenwold borough
Of the total 9,027 dwellings in Lindenwold borough, owner-occupied units account for 3,244 (35.9%), while renter-occupied units make up 5,783 (64.1%).
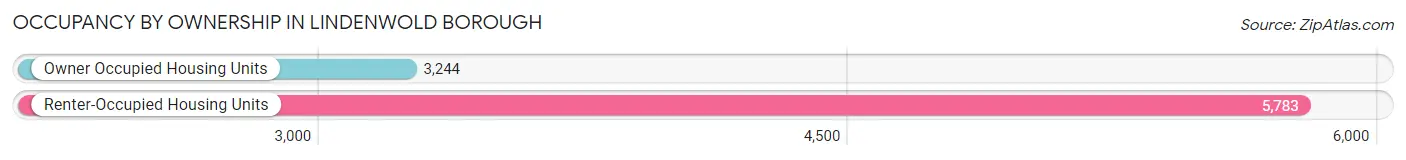
| Occupancy | # Housing Units | % Housing Units |
| Owner Occupied Housing Units | 3,244 | 35.9% |
| Renter-Occupied Housing Units | 5,783 | 64.1% |
| Total Occupied Housing Units | 9,027 | 100.0% |
Occupancy by Household Size in Lindenwold borough
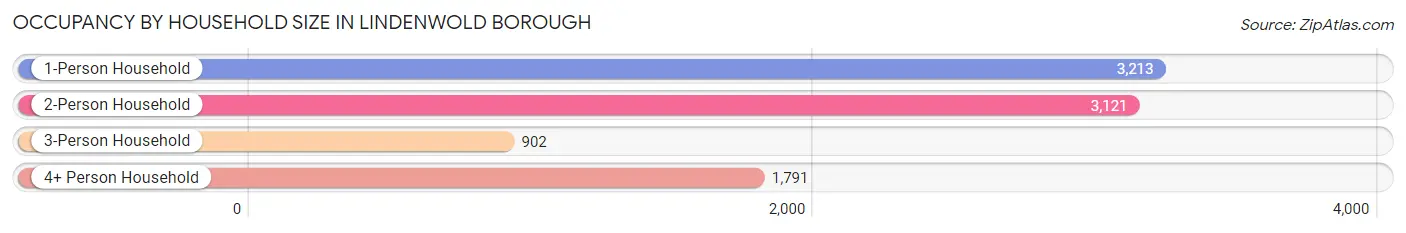
| Household Size | # Housing Units | % Housing Units |
| 1-Person Household | 3,213 | 35.6% |
| 2-Person Household | 3,121 | 34.6% |
| 3-Person Household | 902 | 10.0% |
| 4+ Person Household | 1,791 | 19.8% |
| Total Housing Units | 9,027 | 100.0% |
Occupancy by Ownership by Household Size in Lindenwold borough
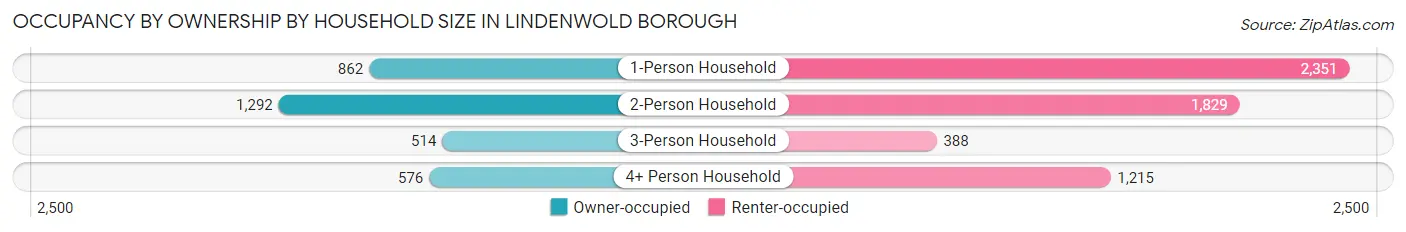
| Household Size | Owner-occupied | Renter-occupied |
| 1-Person Household | 862 (26.8%) | 2,351 (73.2%) |
| 2-Person Household | 1,292 (41.4%) | 1,829 (58.6%) |
| 3-Person Household | 514 (57.0%) | 388 (43.0%) |
| 4+ Person Household | 576 (32.2%) | 1,215 (67.8%) |
| Total Housing Units | 3,244 (35.9%) | 5,783 (64.1%) |
Occupancy by Educational Attainment in Lindenwold borough
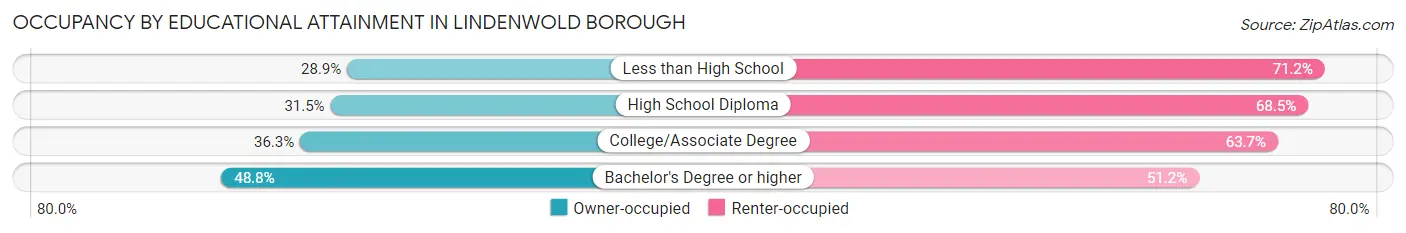
| Household Size | Owner-occupied | Renter-occupied |
| Less than High School | 294 (28.8%) | 725 (71.2%) |
| High School Diploma | 1,205 (31.5%) | 2,622 (68.5%) |
| College/Associate Degree | 858 (36.3%) | 1,505 (63.7%) |
| Bachelor's Degree or higher | 887 (48.8%) | 931 (51.2%) |
Occupancy by Age of Householder in Lindenwold borough
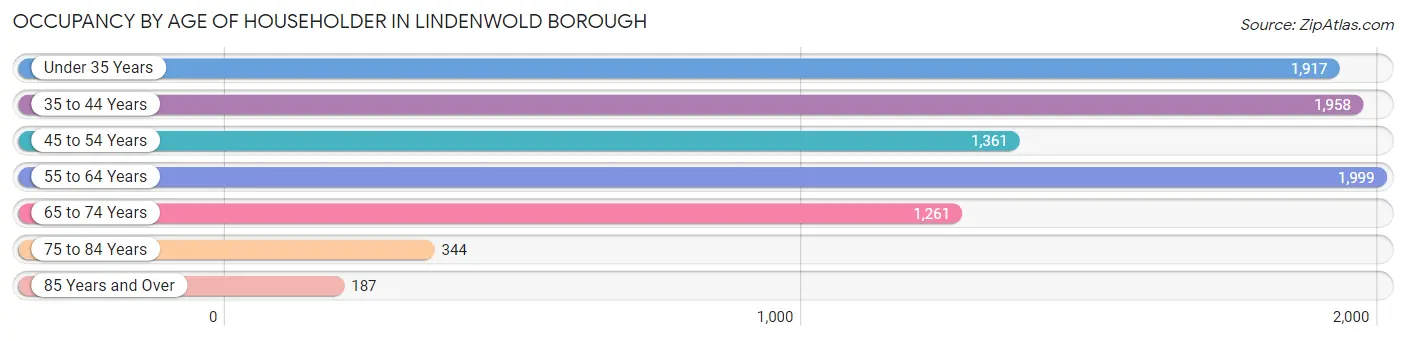
| Age Bracket | # Households | % Households |
| Under 35 Years | 1,917 | 21.2% |
| 35 to 44 Years | 1,958 | 21.7% |
| 45 to 54 Years | 1,361 | 15.1% |
| 55 to 64 Years | 1,999 | 22.1% |
| 65 to 74 Years | 1,261 | 14.0% |
| 75 to 84 Years | 344 | 3.8% |
| 85 Years and Over | 187 | 2.1% |
| Total | 9,027 | 100.0% |
Housing Finances in Lindenwold borough
Median Income by Occupancy in Lindenwold borough
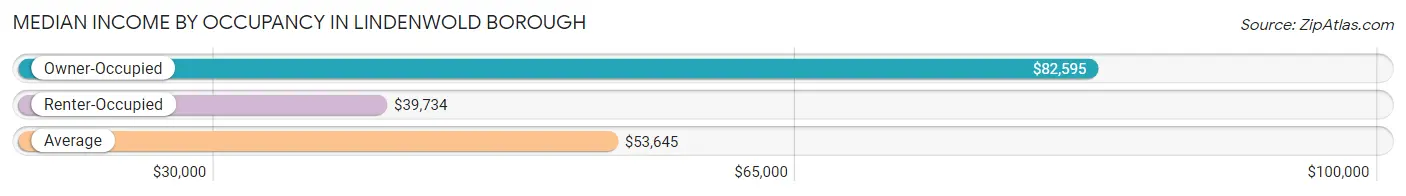
| Occupancy Type | # Households | Median Income |
| Owner-Occupied | 3,244 (35.9%) | $82,595 |
| Renter-Occupied | 5,783 (64.1%) | $39,734 |
| Average | 9,027 (100.0%) | $53,645 |
Occupancy by Householder Income Bracket in Lindenwold borough
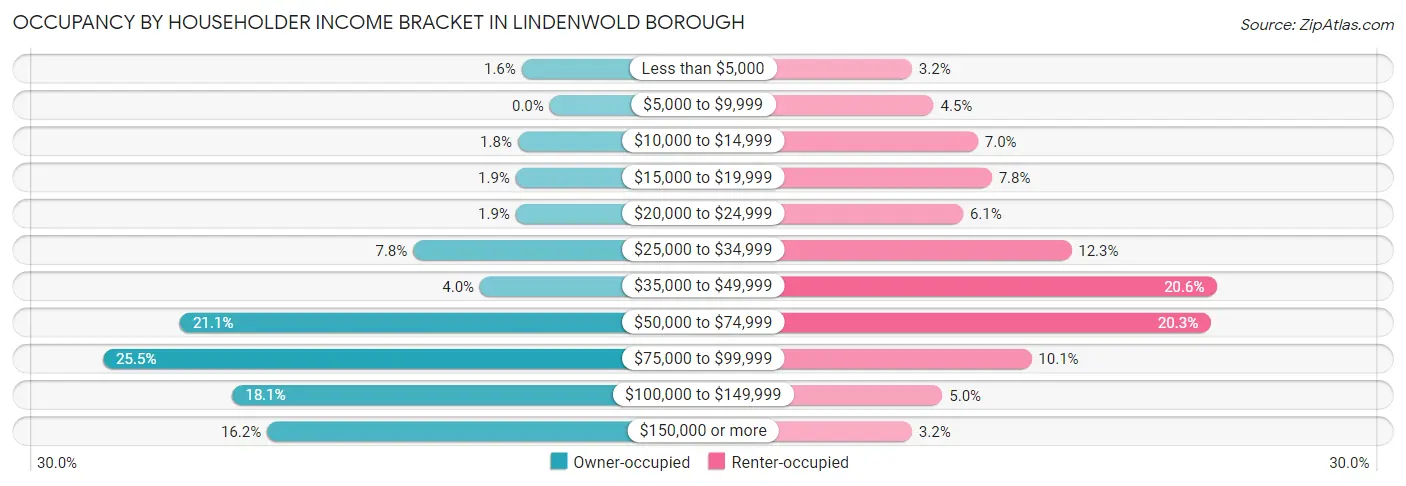
| Income Bracket | Owner-occupied | Renter-occupied |
| Less than $5,000 | 52 (1.6%) | 186 (3.2%) |
| $5,000 to $9,999 | 0 (0.0%) | 258 (4.5%) |
| $10,000 to $14,999 | 59 (1.8%) | 404 (7.0%) |
| $15,000 to $19,999 | 63 (1.9%) | 450 (7.8%) |
| $20,000 to $24,999 | 63 (1.9%) | 355 (6.1%) |
| $25,000 to $34,999 | 253 (7.8%) | 713 (12.3%) |
| $35,000 to $49,999 | 129 (4.0%) | 1,192 (20.6%) |
| $50,000 to $74,999 | 685 (21.1%) | 1,171 (20.3%) |
| $75,000 to $99,999 | 828 (25.5%) | 581 (10.1%) |
| $100,000 to $149,999 | 588 (18.1%) | 287 (5.0%) |
| $150,000 or more | 524 (16.2%) | 186 (3.2%) |
| Total | 3,244 (100.0%) | 5,783 (100.0%) |
Monthly Housing Cost Tiers in Lindenwold borough
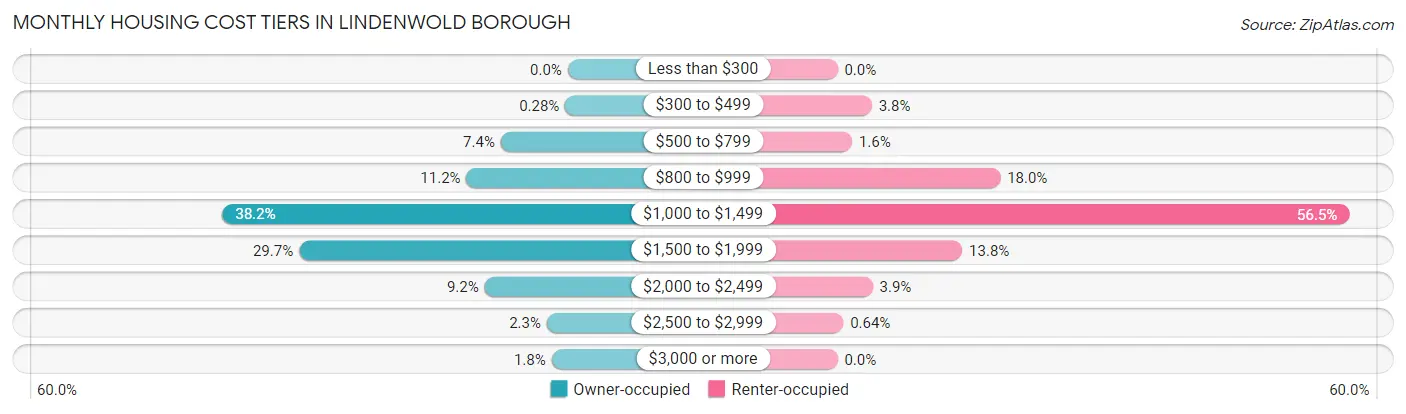
| Monthly Cost | Owner-occupied | Renter-occupied |
| Less than $300 | 0 (0.0%) | 0 (0.0%) |
| $300 to $499 | 9 (0.3%) | 219 (3.8%) |
| $500 to $799 | 240 (7.4%) | 93 (1.6%) |
| $800 to $999 | 363 (11.2%) | 1,040 (18.0%) |
| $1,000 to $1,499 | 1,238 (38.2%) | 3,269 (56.5%) |
| $1,500 to $1,999 | 963 (29.7%) | 797 (13.8%) |
| $2,000 to $2,499 | 298 (9.2%) | 225 (3.9%) |
| $2,500 to $2,999 | 75 (2.3%) | 37 (0.6%) |
| $3,000 or more | 58 (1.8%) | 0 (0.0%) |
| Total | 3,244 (100.0%) | 5,783 (100.0%) |
Physical Housing Characteristics in Lindenwold borough
Housing Structures in Lindenwold borough
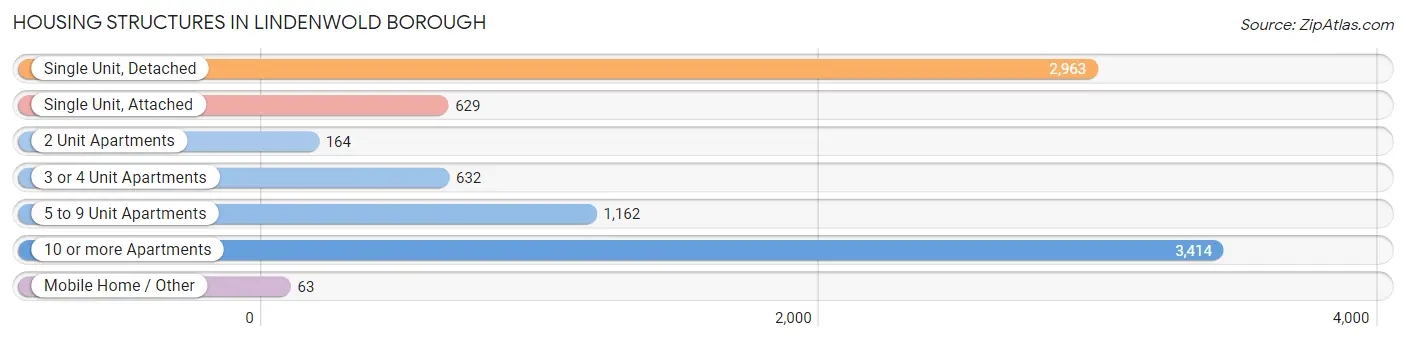
| Structure Type | # Housing Units | % Housing Units |
| Single Unit, Detached | 2,963 | 32.8% |
| Single Unit, Attached | 629 | 7.0% |
| 2 Unit Apartments | 164 | 1.8% |
| 3 or 4 Unit Apartments | 632 | 7.0% |
| 5 to 9 Unit Apartments | 1,162 | 12.9% |
| 10 or more Apartments | 3,414 | 37.8% |
| Mobile Home / Other | 63 | 0.7% |
| Total | 9,027 | 100.0% |
Housing Structures by Occupancy in Lindenwold borough
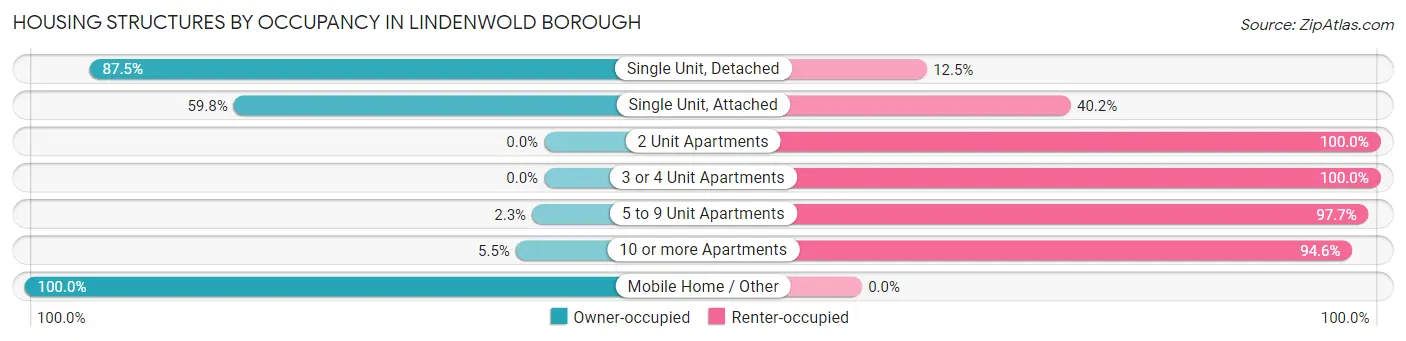
| Structure Type | Owner-occupied | Renter-occupied |
| Single Unit, Detached | 2,592 (87.5%) | 371 (12.5%) |
| Single Unit, Attached | 376 (59.8%) | 253 (40.2%) |
| 2 Unit Apartments | 0 (0.0%) | 164 (100.0%) |
| 3 or 4 Unit Apartments | 0 (0.0%) | 632 (100.0%) |
| 5 to 9 Unit Apartments | 27 (2.3%) | 1,135 (97.7%) |
| 10 or more Apartments | 186 (5.4%) | 3,228 (94.6%) |
| Mobile Home / Other | 63 (100.0%) | 0 (0.0%) |
| Total | 3,244 (35.9%) | 5,783 (64.1%) |
Housing Structures by Number of Rooms in Lindenwold borough
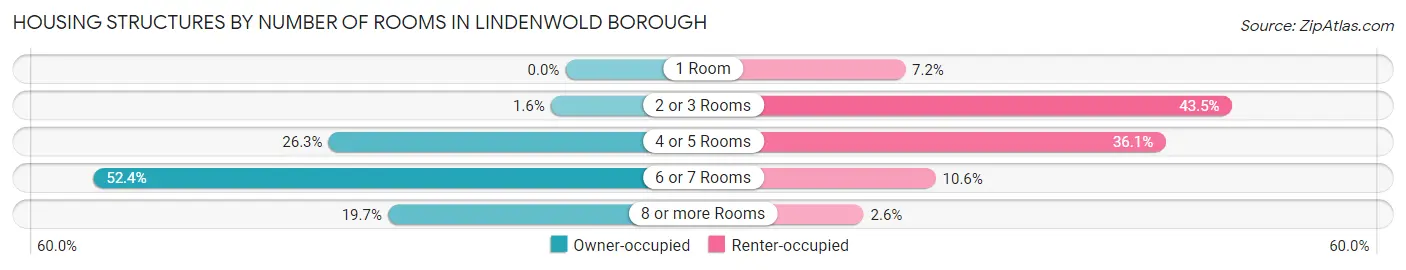
| Number of Rooms | Owner-occupied | Renter-occupied |
| 1 Room | 0 (0.0%) | 418 (7.2%) |
| 2 or 3 Rooms | 53 (1.6%) | 2,513 (43.4%) |
| 4 or 5 Rooms | 853 (26.3%) | 2,086 (36.1%) |
| 6 or 7 Rooms | 1,699 (52.4%) | 614 (10.6%) |
| 8 or more Rooms | 639 (19.7%) | 152 (2.6%) |
| Total | 3,244 (100.0%) | 5,783 (100.0%) |
Housing Structure by Heating Type in Lindenwold borough
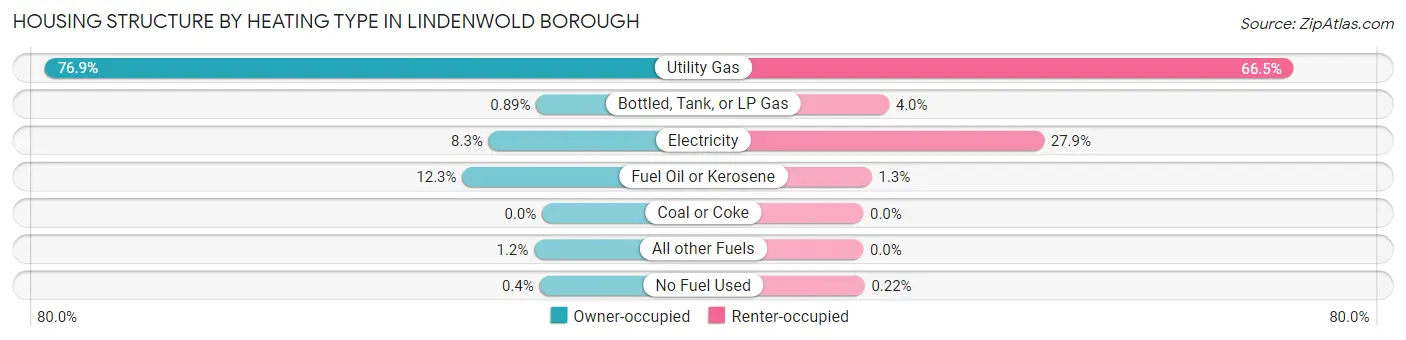
| Heating Type | Owner-occupied | Renter-occupied |
| Utility Gas | 2,494 (76.9%) | 3,848 (66.5%) |
| Bottled, Tank, or LP Gas | 29 (0.9%) | 230 (4.0%) |
| Electricity | 268 (8.3%) | 1,616 (27.9%) |
| Fuel Oil or Kerosene | 400 (12.3%) | 76 (1.3%) |
| Coal or Coke | 0 (0.0%) | 0 (0.0%) |
| All other Fuels | 40 (1.2%) | 0 (0.0%) |
| No Fuel Used | 13 (0.4%) | 13 (0.2%) |
| Total | 3,244 (100.0%) | 5,783 (100.0%) |
Household Vehicle Usage in Lindenwold borough
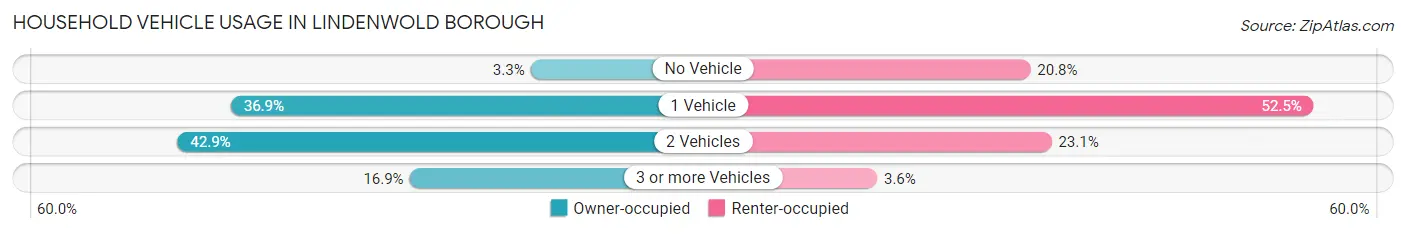
| Vehicles per Household | Owner-occupied | Renter-occupied |
| No Vehicle | 108 (3.3%) | 1,201 (20.8%) |
| 1 Vehicle | 1,197 (36.9%) | 3,036 (52.5%) |
| 2 Vehicles | 1,391 (42.9%) | 1,338 (23.1%) |
| 3 or more Vehicles | 548 (16.9%) | 208 (3.6%) |
| Total | 3,244 (100.0%) | 5,783 (100.0%) |
Real Estate & Mortgages in Lindenwold borough
Real Estate and Mortgage Overview in Lindenwold borough
| Characteristic | Without Mortgage | With Mortgage |
| Housing Units | 1,121 | 2,123 |
| Median Property Value | $157,900 | $154,200 |
| Median Household Income | $90,728 | $361 |
| Monthly Housing Costs | $1,002 | $58 |
| Real Estate Taxes | $6,607 | $52 |
Property Value by Mortgage Status in Lindenwold borough
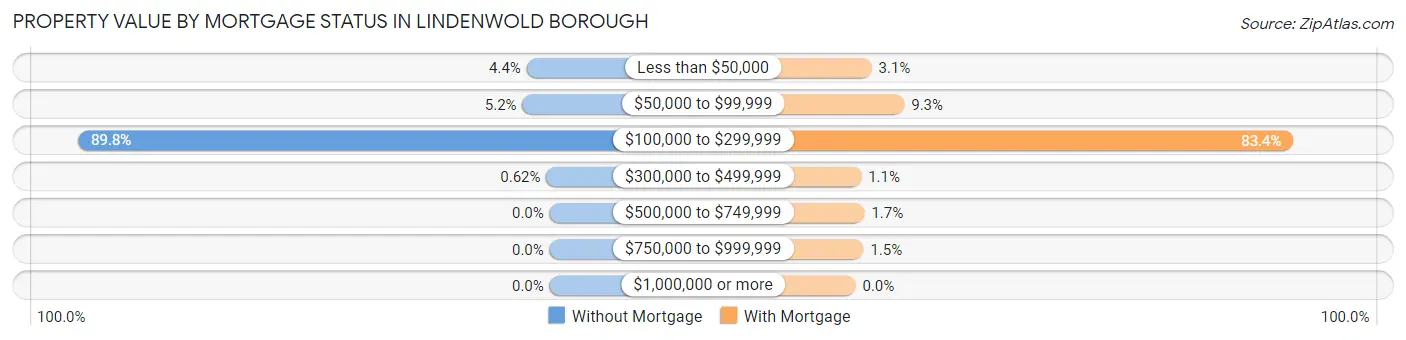
| Property Value | Without Mortgage | With Mortgage |
| Less than $50,000 | 49 (4.4%) | 65 (3.1%) |
| $50,000 to $99,999 | 58 (5.2%) | 197 (9.3%) |
| $100,000 to $299,999 | 1,007 (89.8%) | 1,770 (83.4%) |
| $300,000 to $499,999 | 7 (0.6%) | 23 (1.1%) |
| $500,000 to $749,999 | 0 (0.0%) | 36 (1.7%) |
| $750,000 to $999,999 | 0 (0.0%) | 32 (1.5%) |
| $1,000,000 or more | 0 (0.0%) | 0 (0.0%) |
| Total | 1,121 (100.0%) | 2,123 (100.0%) |
Household Income by Mortgage Status in Lindenwold borough
| Household Income | Without Mortgage | With Mortgage |
| Less than $10,000 | 29 (2.6%) | 75 (3.5%) |
| $10,000 to $24,999 | 65 (5.8%) | 23 (1.1%) |
| $25,000 to $34,999 | 88 (7.9%) | 120 (5.7%) |
| $35,000 to $49,999 | 67 (6.0%) | 165 (7.8%) |
| $50,000 to $74,999 | 221 (19.7%) | 62 (2.9%) |
| $75,000 to $99,999 | 233 (20.8%) | 464 (21.9%) |
| $100,000 to $149,999 | 255 (22.8%) | 595 (28.0%) |
| $150,000 or more | 163 (14.5%) | 333 (15.7%) |
| Total | 1,121 (100.0%) | 2,123 (100.0%) |
Property Value to Household Income Ratio in Lindenwold borough
| Value-to-Income Ratio | Without Mortgage | With Mortgage |
| Less than 2.0x | 696 (62.1%) | 79,812 (3,759.4%) |
| 2.0x to 2.9x | 199 (17.7%) | 1,270 (59.8%) |
| 3.0x to 3.9x | 76 (6.8%) | 401 (18.9%) |
| 4.0x or more | 135 (12.0%) | 160 (7.5%) |
| Total | 1,121 (100.0%) | 2,123 (100.0%) |
Real Estate Taxes by Mortgage Status in Lindenwold borough
| Property Taxes | Without Mortgage | With Mortgage |
| Less than $800 | 0 (0.0%) | 7 (0.3%) |
| $800 to $1,499 | 26 (2.3%) | 171 (8.1%) |
| $800 to $1,499 | 1,088 (97.1%) | 8 (0.4%) |
| Total | 1,121 (100.0%) | 2,123 (100.0%) |
Health & Disability in Lindenwold borough
Health Insurance Coverage by Age in Lindenwold borough
| Age Bracket | With Coverage | Without Coverage |
| Under 6 Years | 1,746 (91.3%) | 167 (8.7%) |
| 6 to 18 Years | 3,080 (95.3%) | 153 (4.7%) |
| 19 to 25 Years | 1,137 (73.5%) | 411 (26.6%) |
| 26 to 34 Years | 2,292 (71.0%) | 938 (29.0%) |
| 35 to 44 Years | 2,161 (67.0%) | 1,063 (33.0%) |
| 45 to 54 Years | 2,200 (86.1%) | 355 (13.9%) |
| 55 to 64 Years | 2,185 (80.4%) | 532 (19.6%) |
| 65 to 74 Years | 2,051 (99.9%) | 3 (0.2%) |
| 75 Years and older | 861 (99.8%) | 2 (0.2%) |
| Total | 17,713 (83.0%) | 3,624 (17.0%) |
Health Insurance Coverage by Citizenship Status in Lindenwold borough
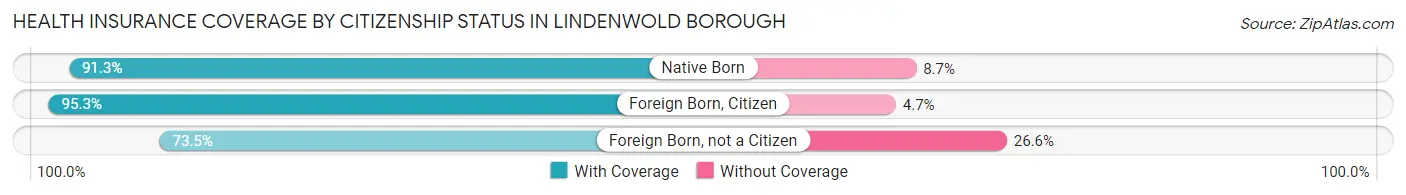
| Citizenship Status | With Coverage | Without Coverage |
| Native Born | 1,746 (91.3%) | 167 (8.7%) |
| Foreign Born, Citizen | 3,080 (95.3%) | 153 (4.7%) |
| Foreign Born, not a Citizen | 1,137 (73.5%) | 411 (26.6%) |
Health Insurance Coverage by Household Income in Lindenwold borough
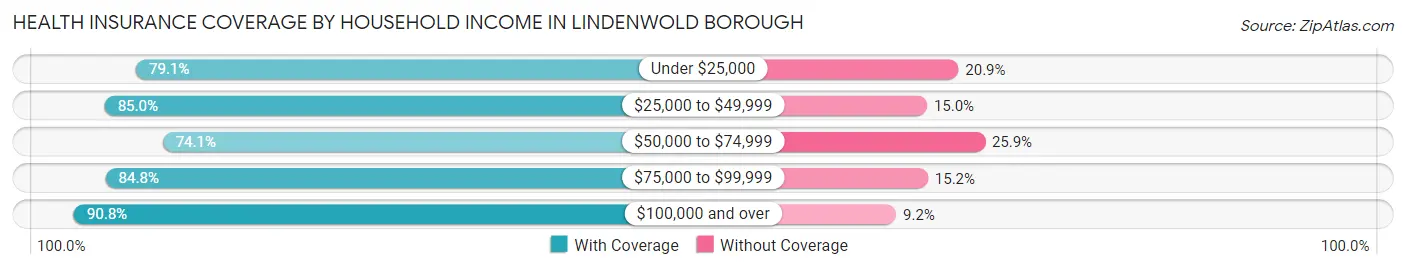
| Household Income | With Coverage | Without Coverage |
| Under $25,000 | 2,698 (79.1%) | 713 (20.9%) |
| $25,000 to $49,999 | 4,408 (85.0%) | 779 (15.0%) |
| $50,000 to $74,999 | 3,294 (74.1%) | 1,150 (25.9%) |
| $75,000 to $99,999 | 3,094 (84.8%) | 554 (15.2%) |
| $100,000 and over | 4,205 (90.8%) | 428 (9.2%) |
Public vs Private Health Insurance Coverage by Age in Lindenwold borough
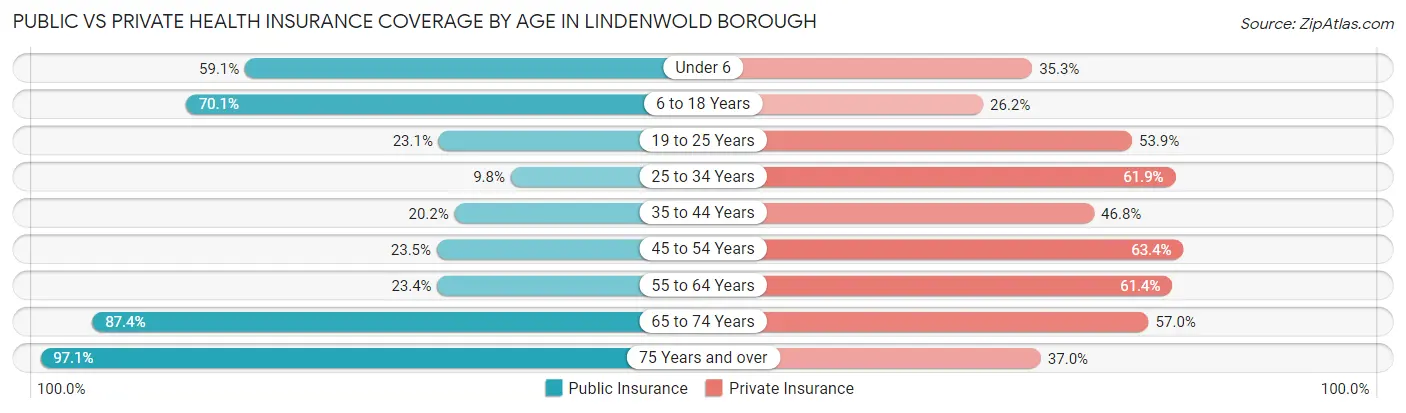
| Age Bracket | Public Insurance | Private Insurance |
| Under 6 | 1,130 (59.1%) | 676 (35.3%) |
| 6 to 18 Years | 2,266 (70.1%) | 848 (26.2%) |
| 19 to 25 Years | 358 (23.1%) | 834 (53.9%) |
| 25 to 34 Years | 315 (9.8%) | 2,000 (61.9%) |
| 35 to 44 Years | 651 (20.2%) | 1,510 (46.8%) |
| 45 to 54 Years | 600 (23.5%) | 1,620 (63.4%) |
| 55 to 64 Years | 635 (23.4%) | 1,667 (61.4%) |
| 65 to 74 Years | 1,796 (87.4%) | 1,170 (57.0%) |
| 75 Years and over | 838 (97.1%) | 319 (37.0%) |
| Total | 8,589 (40.3%) | 10,644 (49.9%) |
Disability Status by Sex by Age in Lindenwold borough
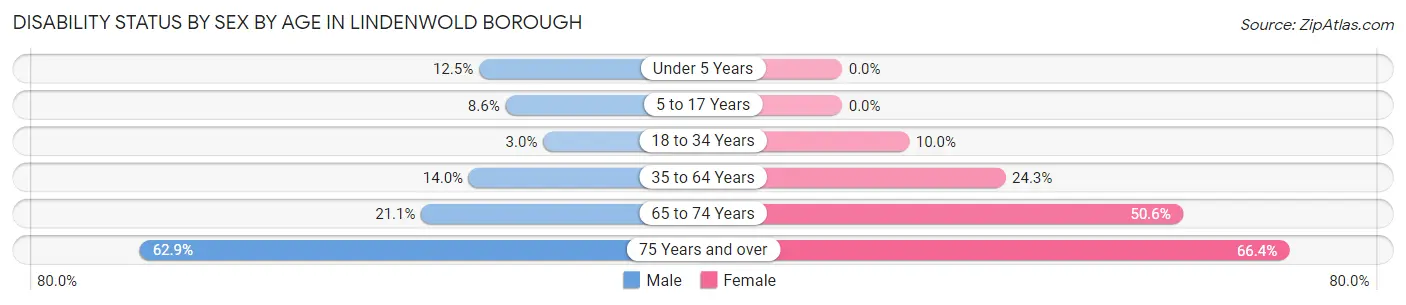
| Age Bracket | Male | Female |
| Under 5 Years | 111 (12.5%) | 0 (0.0%) |
| 5 to 17 Years | 145 (8.6%) | 0 (0.0%) |
| 18 to 34 Years | 74 (3.0%) | 262 (10.0%) |
| 35 to 64 Years | 618 (14.0%) | 991 (24.2%) |
| 65 to 74 Years | 171 (21.1%) | 629 (50.6%) |
| 75 Years and over | 234 (62.9%) | 326 (66.4%) |
Disability Class by Sex by Age in Lindenwold borough
Disability Class: Hearing Difficulty
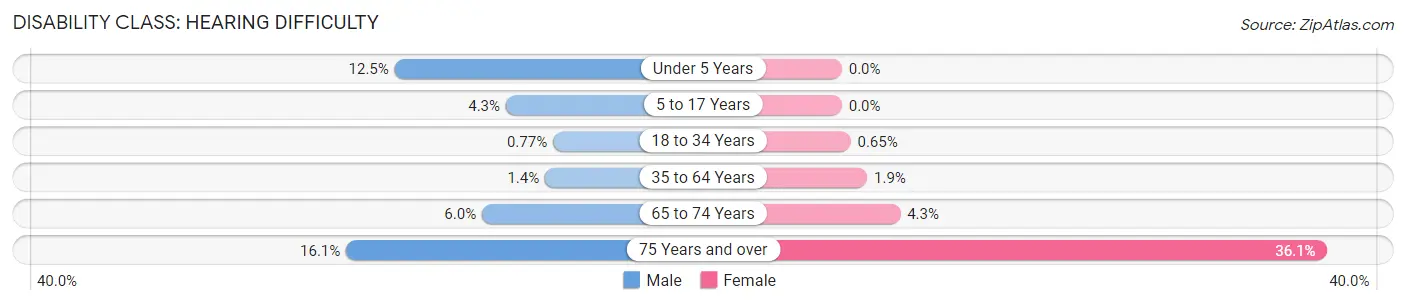
| Age Bracket | Male | Female |
| Under 5 Years | 111 (12.5%) | 0 (0.0%) |
| 5 to 17 Years | 72 (4.3%) | 0 (0.0%) |
| 18 to 34 Years | 19 (0.8%) | 17 (0.6%) |
| 35 to 64 Years | 60 (1.4%) | 77 (1.9%) |
| 65 to 74 Years | 49 (6.0%) | 54 (4.3%) |
| 75 Years and over | 60 (16.1%) | 177 (36.0%) |
Disability Class: Vision Difficulty
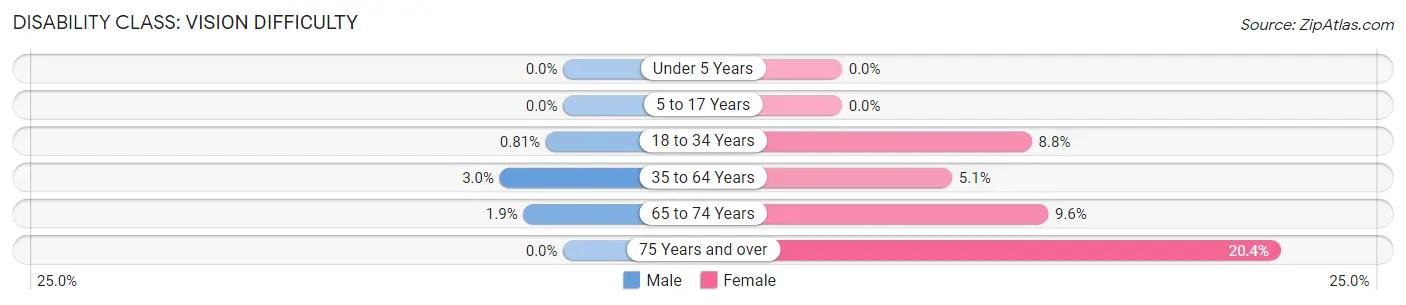
| Age Bracket | Male | Female |
| Under 5 Years | 0 (0.0%) | 0 (0.0%) |
| 5 to 17 Years | 0 (0.0%) | 0 (0.0%) |
| 18 to 34 Years | 20 (0.8%) | 232 (8.8%) |
| 35 to 64 Years | 130 (2.9%) | 209 (5.1%) |
| 65 to 74 Years | 15 (1.8%) | 119 (9.6%) |
| 75 Years and over | 0 (0.0%) | 100 (20.4%) |
Disability Class: Cognitive Difficulty
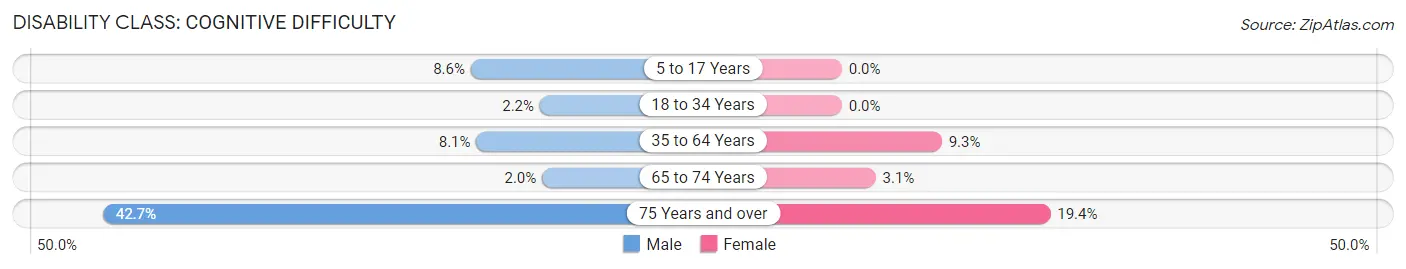
| Age Bracket | Male | Female |
| 5 to 17 Years | 145 (8.6%) | 0 (0.0%) |
| 18 to 34 Years | 54 (2.2%) | 0 (0.0%) |
| 35 to 64 Years | 356 (8.1%) | 379 (9.3%) |
| 65 to 74 Years | 16 (2.0%) | 39 (3.1%) |
| 75 Years and over | 159 (42.7%) | 95 (19.4%) |
Disability Class: Ambulatory Difficulty
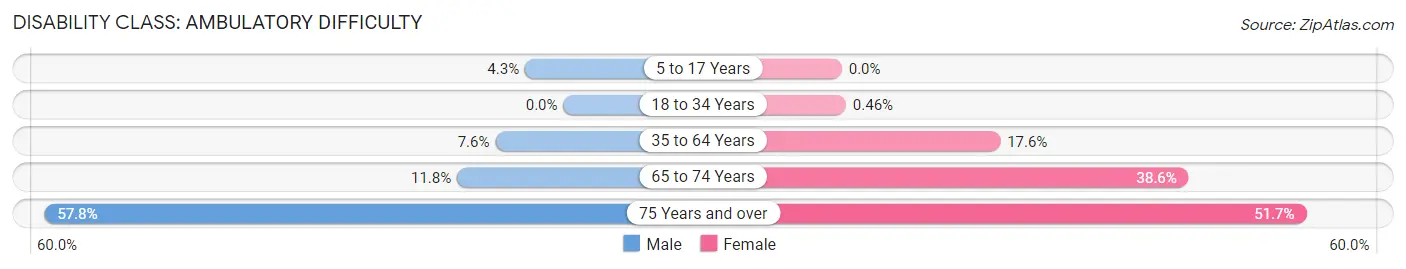
| Age Bracket | Male | Female |
| 5 to 17 Years | 72 (4.3%) | 0 (0.0%) |
| 18 to 34 Years | 0 (0.0%) | 12 (0.5%) |
| 35 to 64 Years | 334 (7.6%) | 721 (17.6%) |
| 65 to 74 Years | 96 (11.8%) | 480 (38.6%) |
| 75 Years and over | 215 (57.8%) | 254 (51.7%) |
Disability Class: Self-Care Difficulty
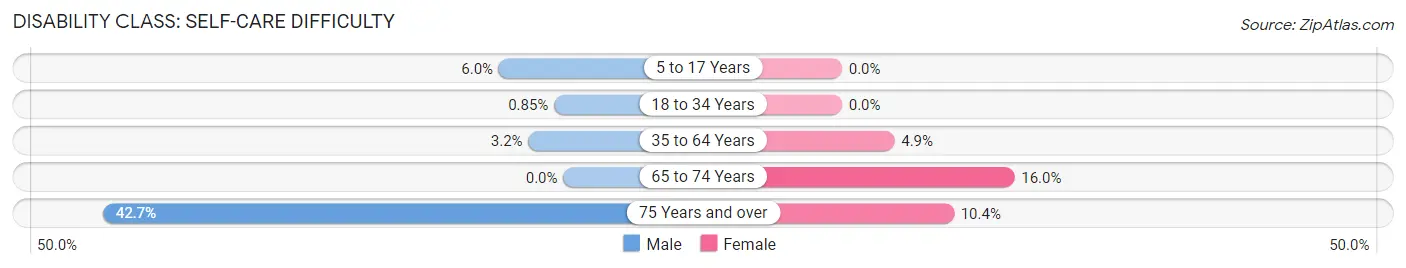
| Age Bracket | Male | Female |
| 5 to 17 Years | 101 (6.0%) | 0 (0.0%) |
| 18 to 34 Years | 21 (0.9%) | 0 (0.0%) |
| 35 to 64 Years | 143 (3.2%) | 199 (4.9%) |
| 65 to 74 Years | 0 (0.0%) | 199 (16.0%) |
| 75 Years and over | 159 (42.7%) | 51 (10.4%) |
Technology Access in Lindenwold borough
Computing Device Access in Lindenwold borough
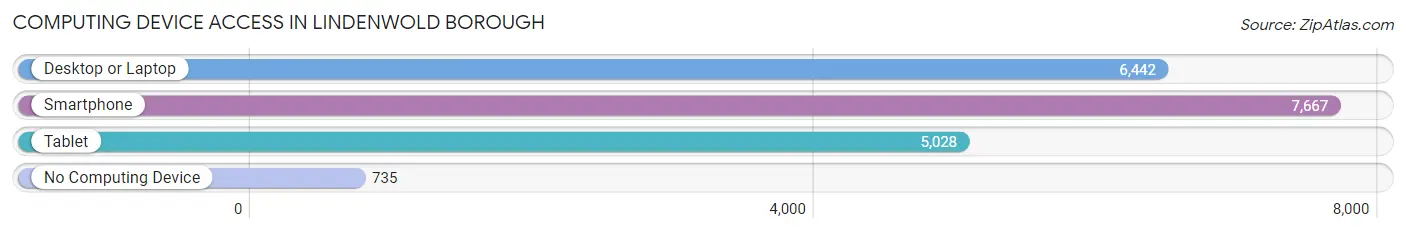
| Device Type | # Households | % Households |
| Desktop or Laptop | 6,442 | 71.4% |
| Smartphone | 7,667 | 84.9% |
| Tablet | 5,028 | 55.7% |
| No Computing Device | 735 | 8.1% |
| Total | 9,027 | 100.0% |
Internet Access in Lindenwold borough
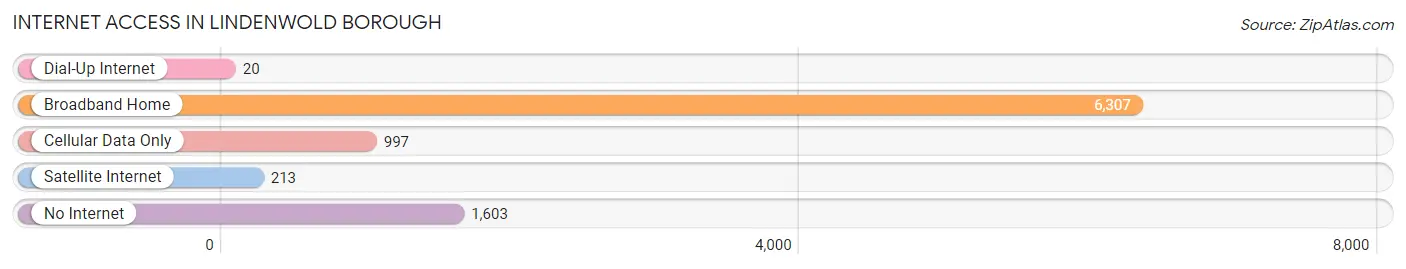
| Internet Type | # Households | % Households |
| Dial-Up Internet | 20 | 0.2% |
| Broadband Home | 6,307 | 69.9% |
| Cellular Data Only | 997 | 11.0% |
| Satellite Internet | 213 | 2.4% |
| No Internet | 1,603 | 17.8% |
| Total | 9,027 | 100.0% |
Lindenwold borough Summary
Lindenwold Borough is a small borough located in Camden County, New Jersey. It is situated in the southern part of the county, just north of the city of Camden. The borough was incorporated in 1929 and has a population of approximately 17,000 people.
Geography
Lindenwold Borough is located in the southern part of Camden County, New Jersey. It is bordered by the city of Camden to the south, Gloucester Township to the east, and Winslow Township to the west. The borough is situated on the eastern side of the Cooper River, and is approximately 8 miles from the Delaware River. The borough is approximately 4.5 square miles in size, and is mostly residential.
The terrain of Lindenwold Borough is mostly flat, with some rolling hills in the northern part of the borough. The borough is located in the Pine Barrens, and is home to a variety of wildlife, including deer, foxes, and other small animals. The borough is also home to a variety of trees, including oak, maple, and pine.
History
The area that is now Lindenwold Borough was originally inhabited by the Lenape Native Americans. The area was first settled by Europeans in the late 1600s, and was part of Gloucester Township until 1929, when it was incorporated as a borough. The borough was named after the Linden trees that were abundant in the area.
In the early 1900s, the borough was a rural farming community. In the 1950s, the borough began to experience rapid growth due to the construction of the Garden State Parkway and the New Jersey Turnpike. This growth continued into the 1960s and 1970s, when the borough experienced a population boom.
Economy
The economy of Lindenwold Borough is largely based on retail and services. The borough is home to a variety of retail stores, including grocery stores, clothing stores, and restaurants. The borough is also home to a variety of service businesses, including auto repair shops, hair salons, and medical offices.
The borough is also home to a variety of manufacturing businesses, including a paper mill, a plastics factory, and a metal fabrication plant. The borough is also home to a variety of light industrial businesses, including a printing company and a packaging company.
Demographics
As of the 2010 census, the population of Lindenwold Borough was 17,013. The racial makeup of the borough was 79.3% White, 13.2% African American, 0.4% Native American, 2.2% Asian, and 4.9% from other races. Hispanic or Latino of any race were 8.3% of the population.
The median household income in the borough was $50,945, and the median family income was $60,945. The per capita income in the borough was $22,945. About 8.3% of the population was below the poverty line.
Conclusion
Lindenwold Borough is a small borough located in Camden County, New Jersey. It was incorporated in 1929 and has a population of approximately 17,000 people. The borough is situated on the eastern side of the Cooper River, and is approximately 8 miles from the Delaware River. The economy of Lindenwold Borough is largely based on retail and services, and the borough is also home to a variety of manufacturing and light industrial businesses. The racial makeup of the borough is 79.3% White, 13.2% African American, 0.4% Native American, 2.2% Asian, and 4.9% from other races. The median household income in the borough was $50,945, and the median family income was $60,945.
Common Questions
What is the Total Population of Lindenwold borough?
Total Population of Lindenwold borough is 21,337.
What is the Total Male Population of Lindenwold borough?
Total Male Population of Lindenwold borough is 10,642.
What is the Total Female Population of Lindenwold borough?
Total Female Population of Lindenwold borough is 10,695.
What is the Ratio of Males per 100 Females in Lindenwold borough?
There are 99.50 Males per 100 Females in Lindenwold borough.
What is the Ratio of Females per 100 Males in Lindenwold borough?
There are 100.50 Females per 100 Males in Lindenwold borough.
What is the Median Population Age in Lindenwold borough?
Median Population Age in Lindenwold borough is 36.6 Years.
What is the Average Family Size in Lindenwold borough
Average Family Size in Lindenwold borough is 3.3 People.
What is the Average Household Size in Lindenwold borough
Average Household Size in Lindenwold borough is 2.4 People.
What is Per Capita Income in Lindenwold borough?
Per Capita income in Lindenwold borough is $28,628.
What is the Median Family Income in Lindenwold borough?
Median Family Income in Lindenwold borough is $66,901.
What is the Median Household income in Lindenwold borough?
Median Household Income in Lindenwold borough is $53,645.
What is Income or Wage Gap in Lindenwold borough?
Income or Wage Gap in Lindenwold borough is 16.7%.
Women in Lindenwold borough earn 83.3 cents for every dollar earned by a man.
What is Inequality or Gini Index in Lindenwold borough?
Inequality or Gini Index in Lindenwold borough is 0.42.
How Large is the Labor Force in Lindenwold borough?
There are 11,490 People in the Labor Forcein in Lindenwold borough.
What is the Percentage of People in the Labor Force in Lindenwold borough?
68.7% of People are in the Labor Force in Lindenwold borough.
What is the Unemployment Rate in Lindenwold borough?
Unemployment Rate in Lindenwold borough is 3.5%.