Laurence Harbor, NJ
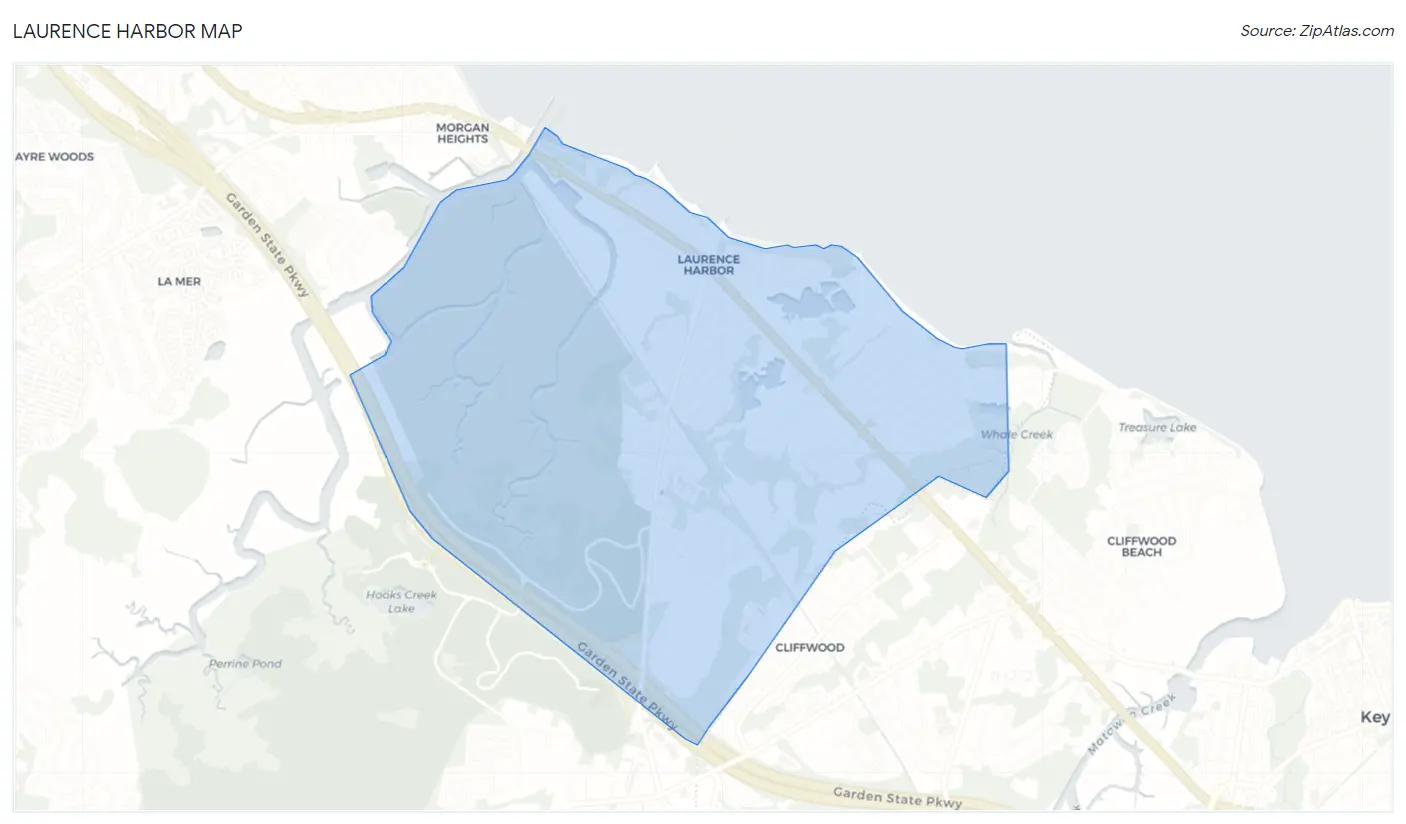
Laurence Harbor Map
Laurence Harbor Overview
6,418
TOTAL POPULATION
3,017
MALE POPULATION
3,401
FEMALE POPULATION
88.71
MALES / 100 FEMALES
112.73
FEMALES / 100 MALES
46.2
MEDIAN AGE
2.9
AVG FAMILY SIZE
2.4
AVG HOUSEHOLD SIZE
$47,764
PER CAPITA INCOME
$109,909
AVG FAMILY INCOME
$95,399
AVG HOUSEHOLD INCOME
20.7%
WAGE / INCOME GAP [ % ]
79.3¢/ $1
WAGE / INCOME GAP [ $ ]
$6,805
FAMILY INCOME DEFICIT
0.35
INEQUALITY / GINI INDEX
3,694
LABOR FORCE [ PEOPLE ]
68.0%
PERCENT IN LABOR FORCE
7.8%
UNEMPLOYMENT RATE
Laurence Harbor Area Codes
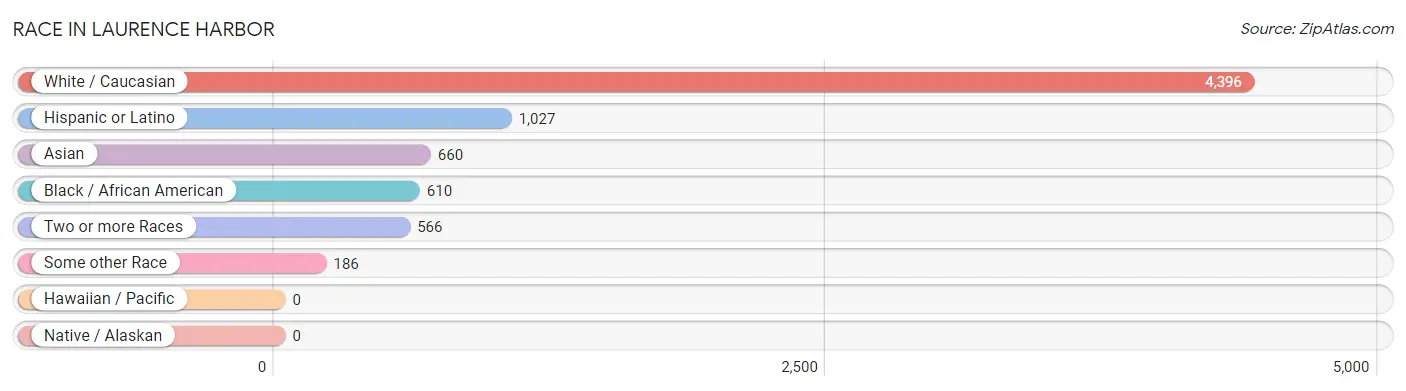
Race in Laurence Harbor
The most populous races in Laurence Harbor are White / Caucasian (4,396 | 68.5%), Hispanic or Latino (1,027 | 16.0%), and Asian (660 | 10.3%).
| Race | # Population | % Population |
| Asian | 660 | 10.3% |
| Black / African American | 610 | 9.5% |
| Hawaiian / Pacific | 0 | 0.0% |
| Hispanic or Latino | 1,027 | 16.0% |
| Native / Alaskan | 0 | 0.0% |
| White / Caucasian | 4,396 | 68.5% |
| Two or more Races | 566 | 8.8% |
| Some other Race | 186 | 2.9% |
| Total | 6,418 | 100.0% |
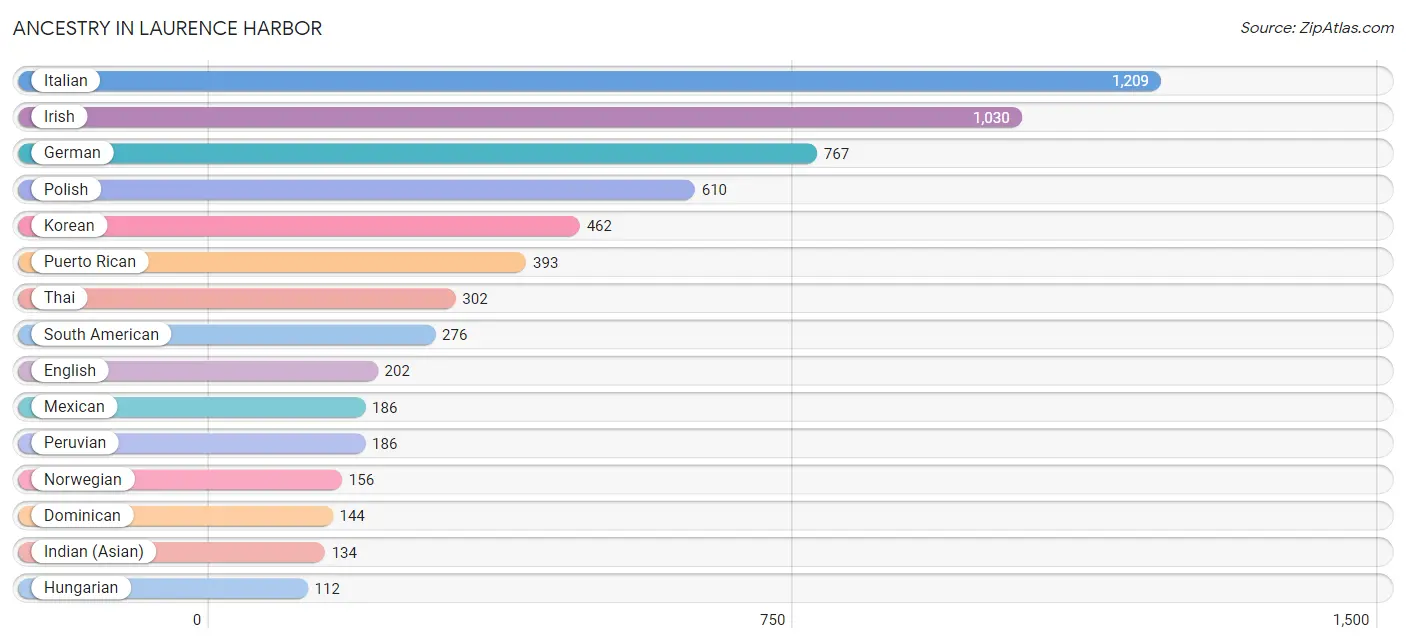
Ancestry in Laurence Harbor
The most populous ancestries reported in Laurence Harbor are Italian (1,209 | 18.8%), Irish (1,030 | 16.1%), German (767 | 11.9%), Polish (610 | 9.5%), and Korean (462 | 7.2%), together accounting for 63.5% of all Laurence Harbor residents.
| Ancestry | # Population | % Population |
| Albanian | 75 | 1.2% |
| American | 55 | 0.9% |
| Arab | 1 | 0.0% |
| Austrian | 10 | 0.2% |
| Brazilian | 68 | 1.1% |
| British | 7 | 0.1% |
| Burmese | 1 | 0.0% |
| Canadian | 43 | 0.7% |
| Central American | 16 | 0.3% |
| Croatian | 10 | 0.2% |
| Czechoslovakian | 63 | 1.0% |
| Delaware | 7 | 0.1% |
| Dominican | 144 | 2.2% |
| Dutch | 20 | 0.3% |
| Eastern European | 21 | 0.3% |
| Ecuadorian | 90 | 1.4% |
| Egyptian | 1 | 0.0% |
| English | 202 | 3.2% |
| French | 30 | 0.5% |
| French Canadian | 11 | 0.2% |
| German | 767 | 11.9% |
| Greek | 31 | 0.5% |
| Guatemalan | 16 | 0.3% |
| Hungarian | 112 | 1.8% |
| Indian (Asian) | 134 | 2.1% |
| Irish | 1,030 | 16.1% |
| Italian | 1,209 | 18.8% |
| Korean | 462 | 7.2% |
| Mexican | 186 | 2.9% |
| Norwegian | 156 | 2.4% |
| Peruvian | 186 | 2.9% |
| Polish | 610 | 9.5% |
| Portuguese | 48 | 0.7% |
| Puerto Rican | 393 | 6.1% |
| Romanian | 51 | 0.8% |
| Russian | 96 | 1.5% |
| Scottish | 78 | 1.2% |
| Slavic | 9 | 0.1% |
| Slovak | 53 | 0.8% |
| South American | 276 | 4.3% |
| Swedish | 46 | 0.7% |
| Thai | 302 | 4.7% |
| Trinidadian and Tobagonian | 111 | 1.7% |
| Ukrainian | 46 | 0.7% |
| Welsh | 59 | 0.9% | View All 45 Rows |
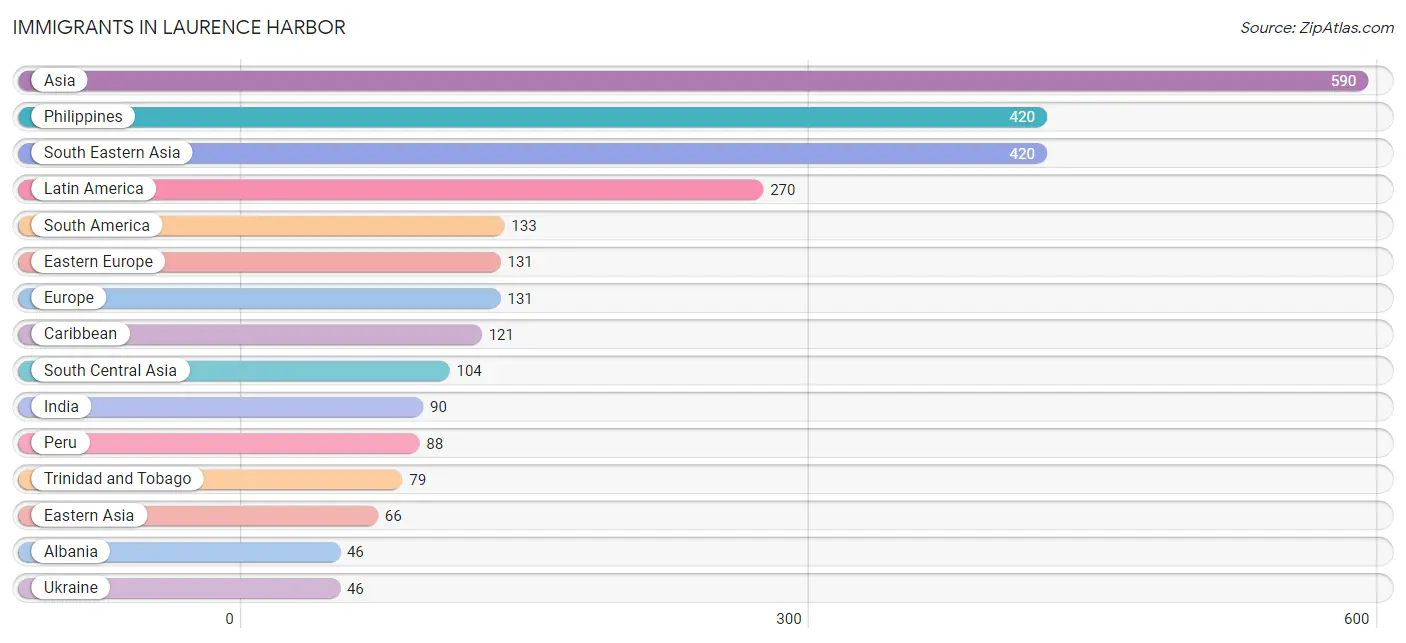
Immigrants in Laurence Harbor
The most numerous immigrant groups reported in Laurence Harbor came from Asia (590 | 9.2%), Philippines (420 | 6.5%), South Eastern Asia (420 | 6.5%), Latin America (270 | 4.2%), and South America (133 | 2.1%), together accounting for 28.6% of all Laurence Harbor residents.
| Immigration Origin | # Population | % Population |
| Africa | 12 | 0.2% |
| Albania | 46 | 0.7% |
| Asia | 590 | 9.2% |
| Brazil | 45 | 0.7% |
| Canada | 24 | 0.4% |
| Caribbean | 121 | 1.9% |
| Central America | 16 | 0.3% |
| China | 39 | 0.6% |
| Dominican Republic | 42 | 0.6% |
| Eastern Asia | 66 | 1.0% |
| Eastern Europe | 131 | 2.0% |
| Europe | 131 | 2.0% |
| Guatemala | 16 | 0.3% |
| India | 90 | 1.4% |
| Korea | 27 | 0.4% |
| Latin America | 270 | 4.2% |
| Morocco | 12 | 0.2% |
| Northern Africa | 12 | 0.2% |
| Peru | 88 | 1.4% |
| Philippines | 420 | 6.5% |
| Romania | 39 | 0.6% |
| South America | 133 | 2.1% |
| South Central Asia | 104 | 1.6% |
| South Eastern Asia | 420 | 6.5% |
| Sri Lanka | 14 | 0.2% |
| Trinidad and Tobago | 79 | 1.2% |
| Ukraine | 46 | 0.7% | View All 27 Rows |
Sex and Age in Laurence Harbor
Sex and Age in Laurence Harbor
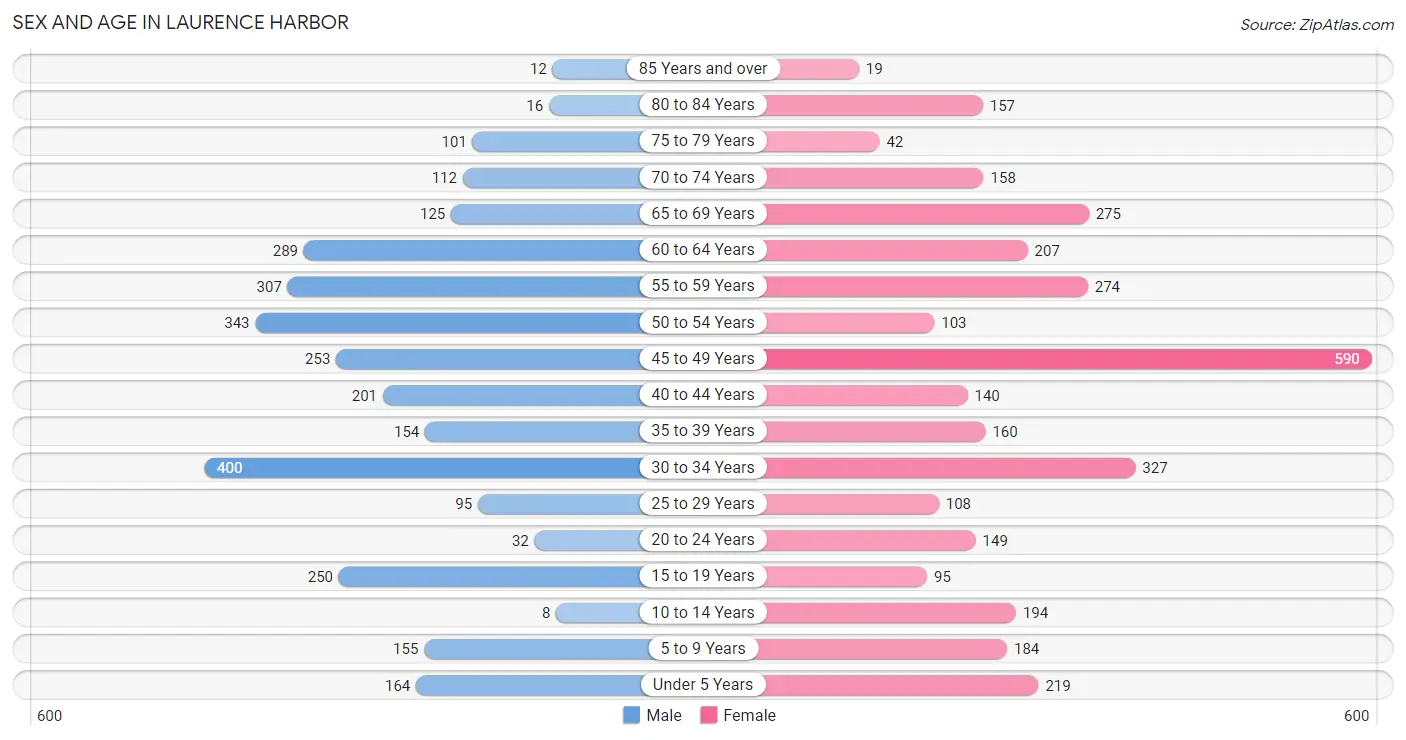
The most populous age groups in Laurence Harbor are 30 to 34 Years (400 | 13.3%) for men and 45 to 49 Years (590 | 17.3%) for women.
| Age Bracket | Male | Female |
| Under 5 Years | 164 (5.4%) | 219 (6.4%) |
| 5 to 9 Years | 155 (5.1%) | 184 (5.4%) |
| 10 to 14 Years | 8 (0.3%) | 194 (5.7%) |
| 15 to 19 Years | 250 (8.3%) | 95 (2.8%) |
| 20 to 24 Years | 32 (1.1%) | 149 (4.4%) |
| 25 to 29 Years | 95 (3.2%) | 108 (3.2%) |
| 30 to 34 Years | 400 (13.3%) | 327 (9.6%) |
| 35 to 39 Years | 154 (5.1%) | 160 (4.7%) |
| 40 to 44 Years | 201 (6.7%) | 140 (4.1%) |
| 45 to 49 Years | 253 (8.4%) | 590 (17.3%) |
| 50 to 54 Years | 343 (11.4%) | 103 (3.0%) |
| 55 to 59 Years | 307 (10.2%) | 274 (8.1%) |
| 60 to 64 Years | 289 (9.6%) | 207 (6.1%) |
| 65 to 69 Years | 125 (4.1%) | 275 (8.1%) |
| 70 to 74 Years | 112 (3.7%) | 158 (4.6%) |
| 75 to 79 Years | 101 (3.4%) | 42 (1.2%) |
| 80 to 84 Years | 16 (0.5%) | 157 (4.6%) |
| 85 Years and over | 12 (0.4%) | 19 (0.6%) |
| Total | 3,017 (100.0%) | 3,401 (100.0%) |
Families and Households in Laurence Harbor
Median Family Size in Laurence Harbor
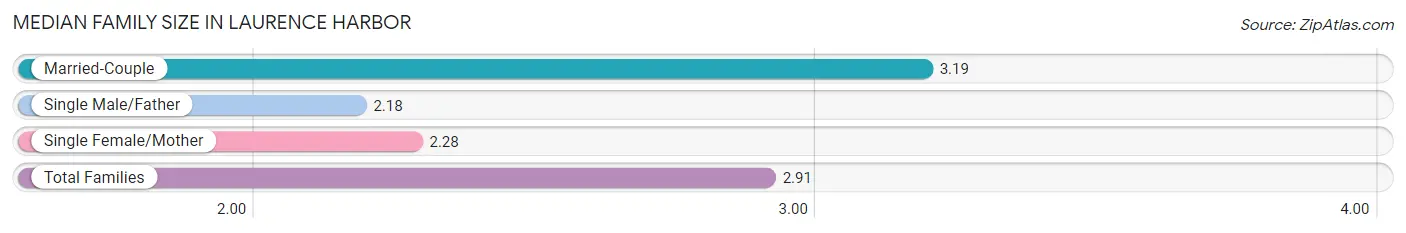
The median family size in Laurence Harbor is 2.91 persons per family, with married-couple families (1,219 | 70.3%) accounting for the largest median family size of 3.19 persons per family. On the other hand, single male/father families (73 | 4.2%) represent the smallest median family size with 2.18 persons per family.
| Family Type | # Families | Family Size |
| Married-Couple | 1,219 (70.3%) | 3.19 |
| Single Male/Father | 73 (4.2%) | 2.18 |
| Single Female/Mother | 443 (25.5%) | 2.28 |
| Total Families | 1,735 (100.0%) | 2.91 |
Median Household Size in Laurence Harbor
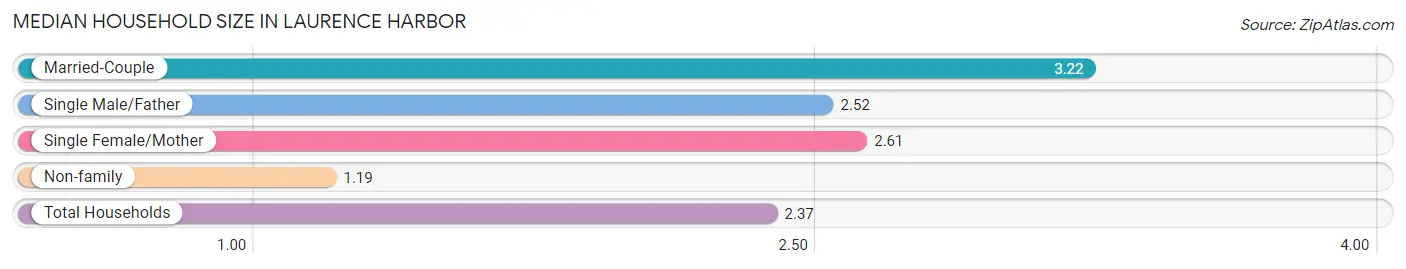
The median household size in Laurence Harbor is 2.37 persons per household, with married-couple households (1,219 | 45.1%) accounting for the largest median household size of 3.22 persons per household. non-family households (966 | 35.8%) represent the smallest median household size with 1.19 persons per household.
| Household Type | # Households | Household Size |
| Married-Couple | 1,219 (45.1%) | 3.22 |
| Single Male/Father | 73 (2.7%) | 2.52 |
| Single Female/Mother | 443 (16.4%) | 2.61 |
| Non-family | 966 (35.8%) | 1.19 |
| Total Households | 2,701 (100.0%) | 2.37 |
Household Size by Marriage Status in Laurence Harbor
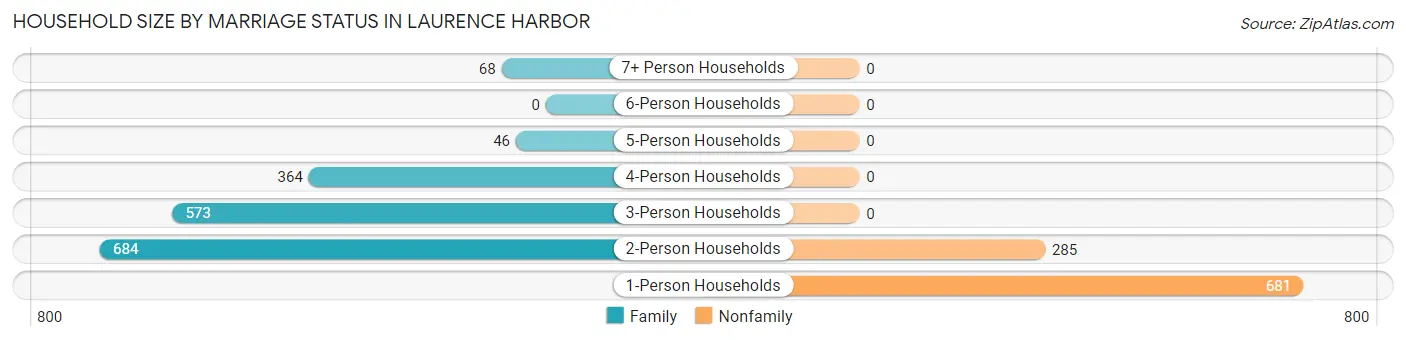
Out of a total of 2,701 households in Laurence Harbor, 1,735 (64.2%) are family households, while 966 (35.8%) are nonfamily households. The most numerous type of family households are 2-person households, comprising 684, and the most common type of nonfamily households are 1-person households, comprising 681.
| Household Size | Family Households | Nonfamily Households |
| 1-Person Households | - | 681 (25.2%) |
| 2-Person Households | 684 (25.3%) | 285 (10.5%) |
| 3-Person Households | 573 (21.2%) | 0 (0.0%) |
| 4-Person Households | 364 (13.5%) | 0 (0.0%) |
| 5-Person Households | 46 (1.7%) | 0 (0.0%) |
| 6-Person Households | 0 (0.0%) | 0 (0.0%) |
| 7+ Person Households | 68 (2.5%) | 0 (0.0%) |
| Total | 1,735 (64.2%) | 966 (35.8%) |
Female Fertility in Laurence Harbor
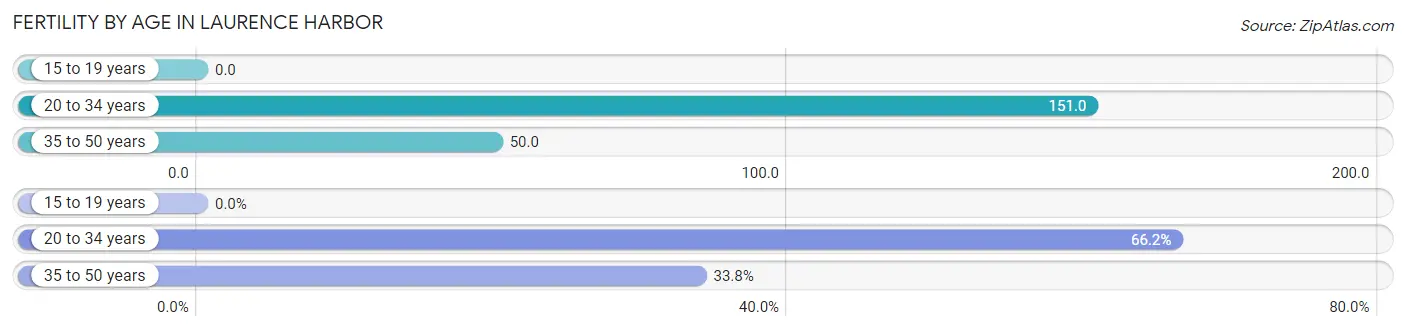
Fertility by Age in Laurence Harbor
Average fertility rate in Laurence Harbor is 84.0 births per 1,000 women. Women in the age bracket of 20 to 34 years have the highest fertility rate with 151.0 births per 1,000 women. Women in the age bracket of 20 to 34 years acount for 66.2% of all women with births.
| Age Bracket | Women with Births | Births / 1,000 Women |
| 15 to 19 years | 0 (0.0%) | 0.0 |
| 20 to 34 years | 88 (66.2%) | 151.0 |
| 35 to 50 years | 45 (33.8%) | 50.0 |
| Total | 133 (100.0%) | 84.0 |
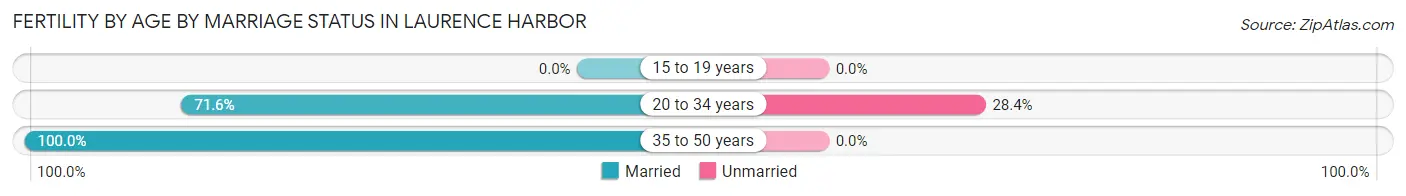
Fertility by Age by Marriage Status in Laurence Harbor
81.2% of women with births (133) in Laurence Harbor are married. The highest percentage of unmarried women with births falls into 20 to 34 years age bracket with 28.4% of them unmarried at the time of birth, while the lowest percentage of unmarried women with births belong to 35 to 50 years age bracket with 0.0% of them unmarried.
| Age Bracket | Married | Unmarried |
| 15 to 19 years | 0 (0.0%) | 0 (0.0%) |
| 20 to 34 years | 63 (71.6%) | 25 (28.4%) |
| 35 to 50 years | 45 (100.0%) | 0 (0.0%) |
| Total | 108 (81.2%) | 25 (18.8%) |
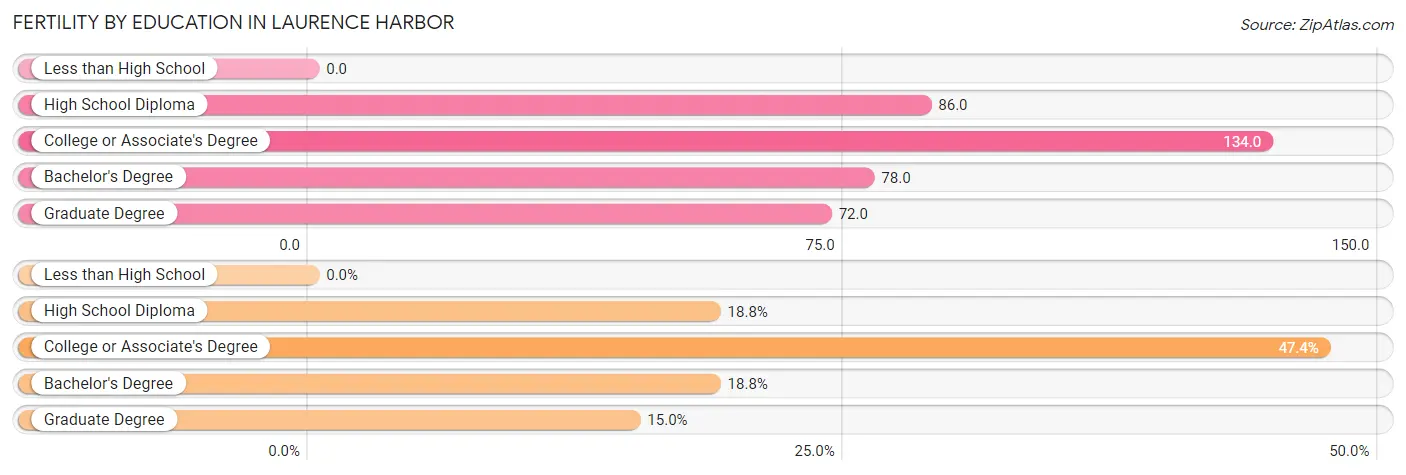
Fertility by Education in Laurence Harbor
| Educational Attainment | Women with Births | Births / 1,000 Women |
| Less than High School | 0 (0.0%) | 0.0 |
| High School Diploma | 25 (18.8%) | 86.0 |
| College or Associate's Degree | 63 (47.4%) | 134.0 |
| Bachelor's Degree | 25 (18.8%) | 78.0 |
| Graduate Degree | 20 (15.0%) | 72.0 |
| Total | 133 (100.0%) | 84.0 |
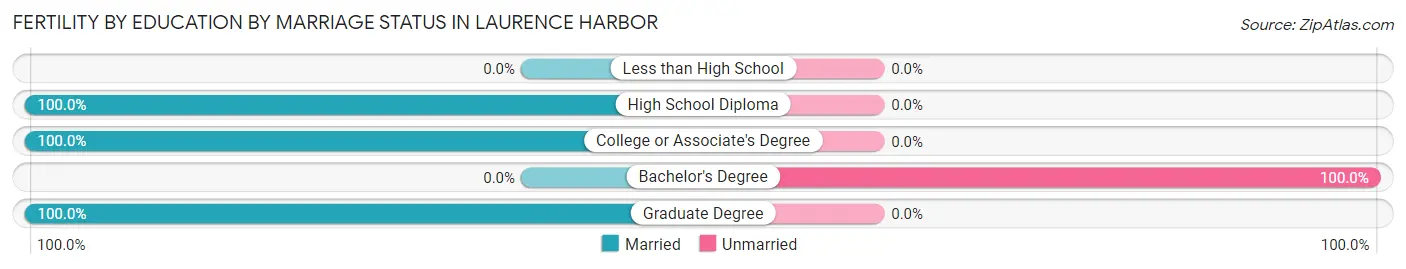
Fertility by Education by Marriage Status in Laurence Harbor
18.8% of women with births in Laurence Harbor are unmarried. Women with the educational attainment of high school diploma are most likely to be married with 100.0% of them married at childbirth, while women with the educational attainment of bachelor's degree are least likely to be married with 100.0% of them unmarried at childbirth.
| Educational Attainment | Married | Unmarried |
| Less than High School | 0 (0.0%) | 0 (0.0%) |
| High School Diploma | 25 (100.0%) | 0 (0.0%) |
| College or Associate's Degree | 63 (100.0%) | 0 (0.0%) |
| Bachelor's Degree | 0 (0.0%) | 25 (100.0%) |
| Graduate Degree | 20 (100.0%) | 0 (0.0%) |
| Total | 108 (81.2%) | 25 (18.8%) |
Income in Laurence Harbor
Income Overview in Laurence Harbor
Per Capita Income in Laurence Harbor is $47,764, while median incomes of families and households are $109,909 and $95,399 respectively.
| Characteristic | Number | Measure |
| Per Capita Income | 6,418 | $47,764 |
| Median Family Income | 1,735 | $109,909 |
| Mean Family Income | 1,735 | $131,437 |
| Median Household Income | 2,701 | $95,399 |
| Mean Household Income | 2,701 | $113,565 |
| Income Deficit | 1,735 | $6,805 |
| Wage / Income Gap (%) | 6,418 | 20.68% |
| Wage / Income Gap ($) | 6,418 | 79.32¢ per $1 |
| Gini / Inequality Index | 6,418 | 0.35 |
Earnings by Sex in Laurence Harbor
Average Earnings in Laurence Harbor are $51,431, $59,173 for men and $46,936 for women, a difference of 20.7%.
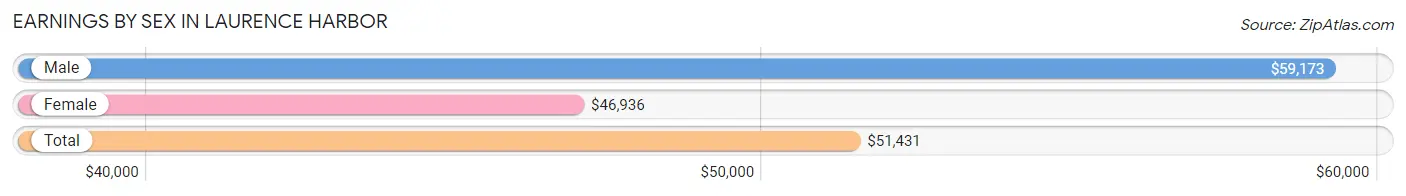
| Sex | Number | Average Earnings |
| Male | 1,855 (50.7%) | $59,173 |
| Female | 1,805 (49.3%) | $46,936 |
| Total | 3,660 (100.0%) | $51,431 |
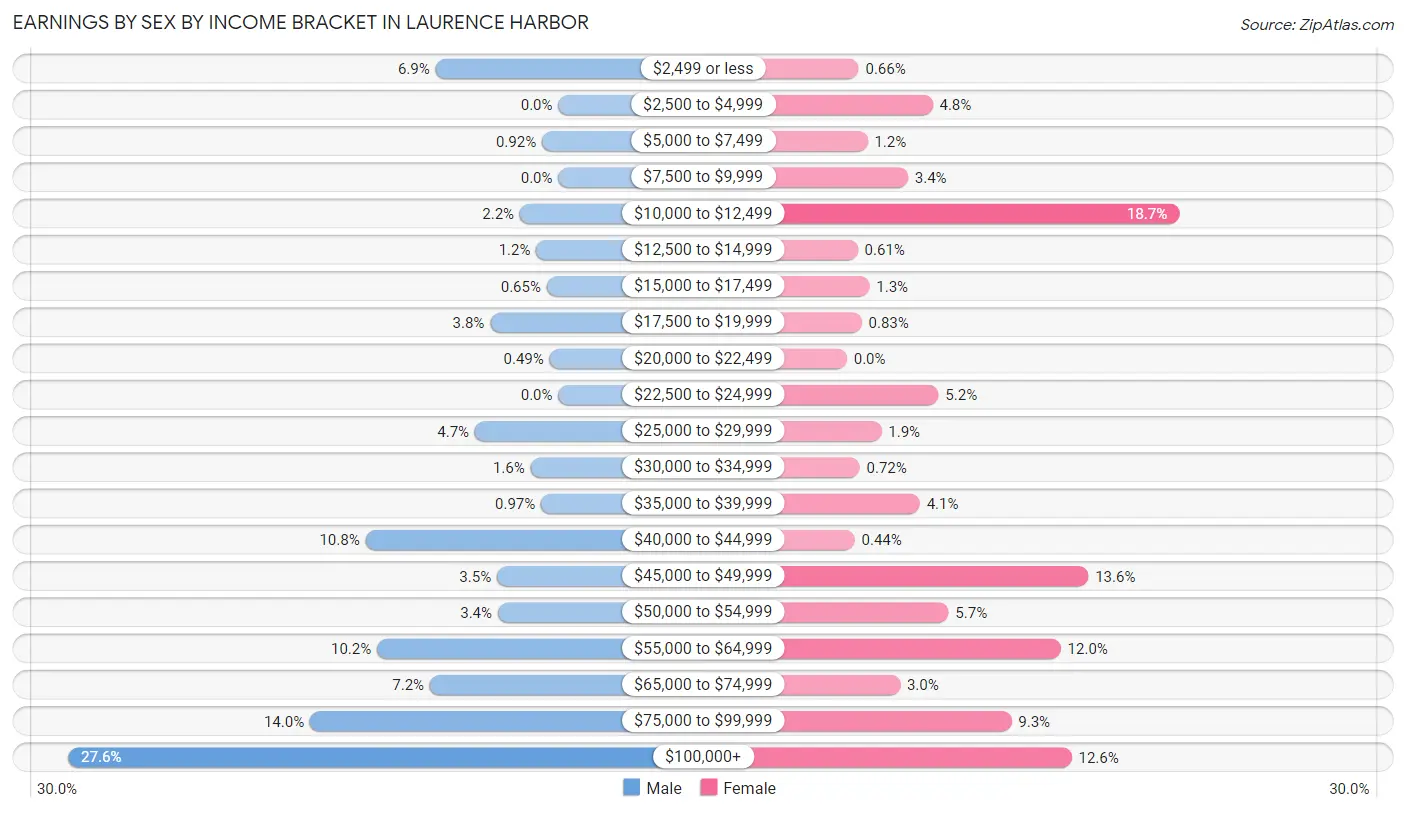
Earnings by Sex by Income Bracket in Laurence Harbor
The most common earnings brackets in Laurence Harbor are $100,000+ for men (511 | 27.6%) and $10,000 to $12,499 for women (337 | 18.7%).
| Income | Male | Female |
| $2,499 or less | 128 (6.9%) | 12 (0.7%) |
| $2,500 to $4,999 | 0 (0.0%) | 87 (4.8%) |
| $5,000 to $7,499 | 17 (0.9%) | 21 (1.2%) |
| $7,500 to $9,999 | 0 (0.0%) | 62 (3.4%) |
| $10,000 to $12,499 | 40 (2.2%) | 337 (18.7%) |
| $12,500 to $14,999 | 23 (1.2%) | 11 (0.6%) |
| $15,000 to $17,499 | 12 (0.6%) | 23 (1.3%) |
| $17,500 to $19,999 | 71 (3.8%) | 15 (0.8%) |
| $20,000 to $22,499 | 9 (0.5%) | 0 (0.0%) |
| $22,500 to $24,999 | 0 (0.0%) | 93 (5.1%) |
| $25,000 to $29,999 | 87 (4.7%) | 35 (1.9%) |
| $30,000 to $34,999 | 29 (1.6%) | 13 (0.7%) |
| $35,000 to $39,999 | 18 (1.0%) | 74 (4.1%) |
| $40,000 to $44,999 | 201 (10.8%) | 8 (0.4%) |
| $45,000 to $49,999 | 64 (3.5%) | 245 (13.6%) |
| $50,000 to $54,999 | 63 (3.4%) | 103 (5.7%) |
| $55,000 to $64,999 | 189 (10.2%) | 217 (12.0%) |
| $65,000 to $74,999 | 134 (7.2%) | 54 (3.0%) |
| $75,000 to $99,999 | 259 (14.0%) | 167 (9.2%) |
| $100,000+ | 511 (27.6%) | 228 (12.6%) |
| Total | 1,855 (100.0%) | 1,805 (100.0%) |
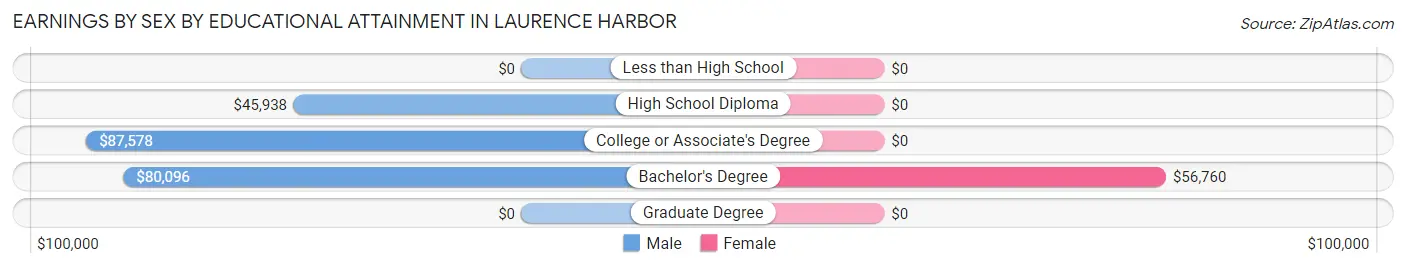
Earnings by Sex by Educational Attainment in Laurence Harbor
Average earnings in Laurence Harbor are $66,034 for men and $47,797 for women, a difference of 27.6%. Men with an educational attainment of college or associate's degree enjoy the highest average annual earnings of $87,578, while those with high school diploma education earn the least with $45,938. Women with an educational attainment of bachelor's degree earn the most with the average annual earnings of $56,760, while those with bachelor's degree education have the smallest earnings of $56,760.
| Educational Attainment | Male Income | Female Income |
| Less than High School | - | - |
| High School Diploma | $45,938 | $0 |
| College or Associate's Degree | $87,578 | $0 |
| Bachelor's Degree | $80,096 | $56,760 |
| Graduate Degree | - | - |
| Total | $66,034 | $47,797 |
Family Income in Laurence Harbor
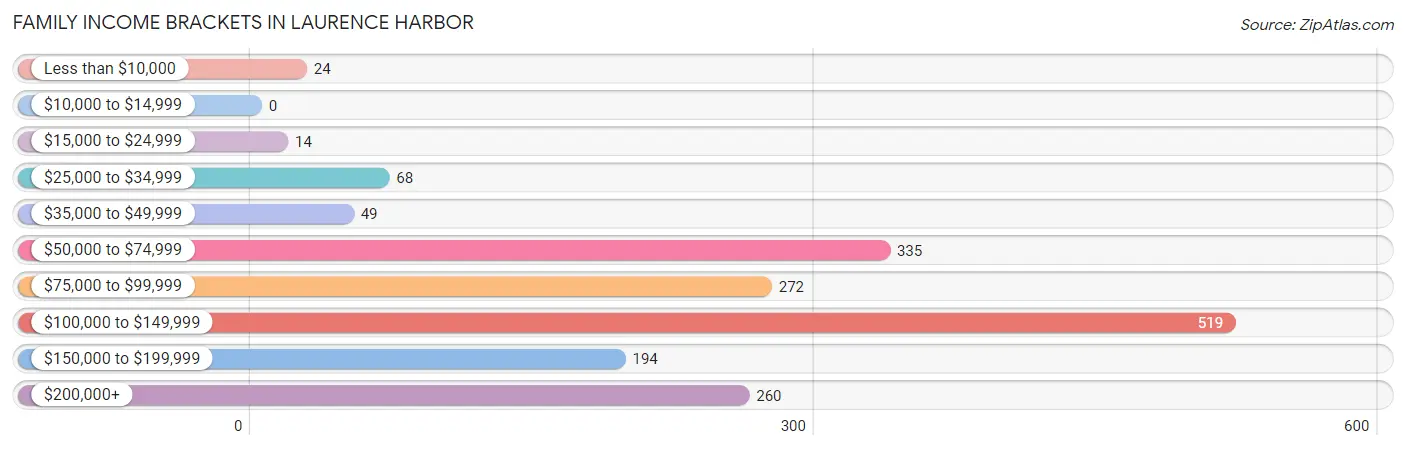
Family Income Brackets in Laurence Harbor
According to the Laurence Harbor family income data, there are 519 families falling into the $100,000 to $149,999 income range, which is the most common income bracket and makes up 29.9% of all families.
| Income Bracket | # Families | % Families |
| Less than $10,000 | 24 | 1.4% |
| $10,000 to $14,999 | 0 | 0.0% |
| $15,000 to $24,999 | 14 | 0.8% |
| $25,000 to $34,999 | 68 | 3.9% |
| $35,000 to $49,999 | 49 | 2.8% |
| $50,000 to $74,999 | 335 | 19.3% |
| $75,000 to $99,999 | 272 | 15.7% |
| $100,000 to $149,999 | 519 | 29.9% |
| $150,000 to $199,999 | 194 | 11.2% |
| $200,000+ | 260 | 15.0% |
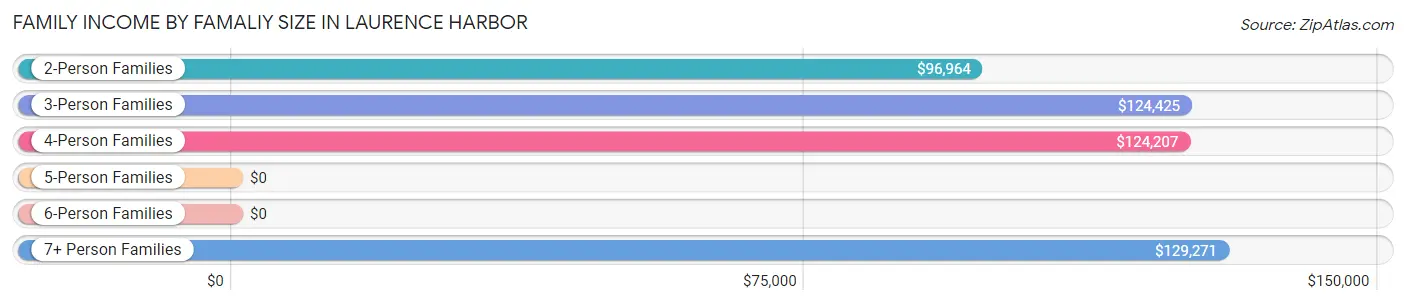
Family Income by Famaliy Size in Laurence Harbor
7+ person families (68 | 3.9%) account for the highest median family income in Laurence Harbor with $129,271 per family, while 2-person families (894 | 51.5%) have the highest median income of $48,482 per family member.
| Income Bracket | # Families | Median Income |
| 2-Person Families | 894 (51.5%) | $96,964 |
| 3-Person Families | 363 (20.9%) | $124,425 |
| 4-Person Families | 364 (21.0%) | $124,207 |
| 5-Person Families | 46 (2.6%) | $0 |
| 6-Person Families | 0 (0.0%) | $0 |
| 7+ Person Families | 68 (3.9%) | $129,271 |
| Total | 1,735 (100.0%) | $109,909 |
Family Income by Number of Earners in Laurence Harbor
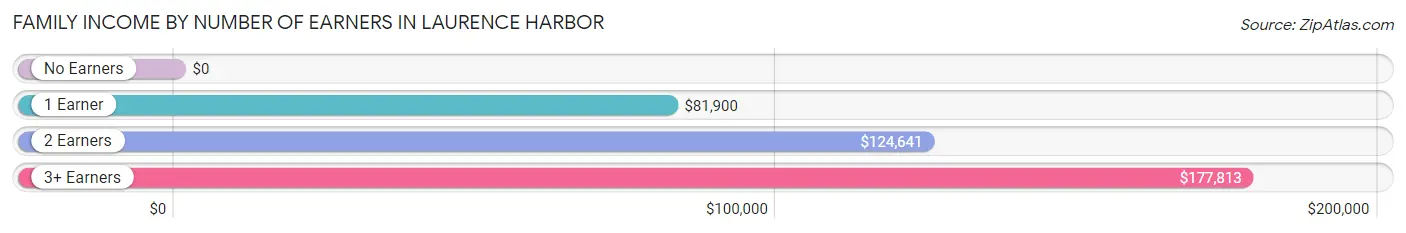
| Number of Earners | # Families | Median Income |
| No Earners | 116 (6.7%) | $0 |
| 1 Earner | 668 (38.5%) | $81,900 |
| 2 Earners | 787 (45.4%) | $124,641 |
| 3+ Earners | 164 (9.5%) | $177,813 |
| Total | 1,735 (100.0%) | $109,909 |
Household Income in Laurence Harbor
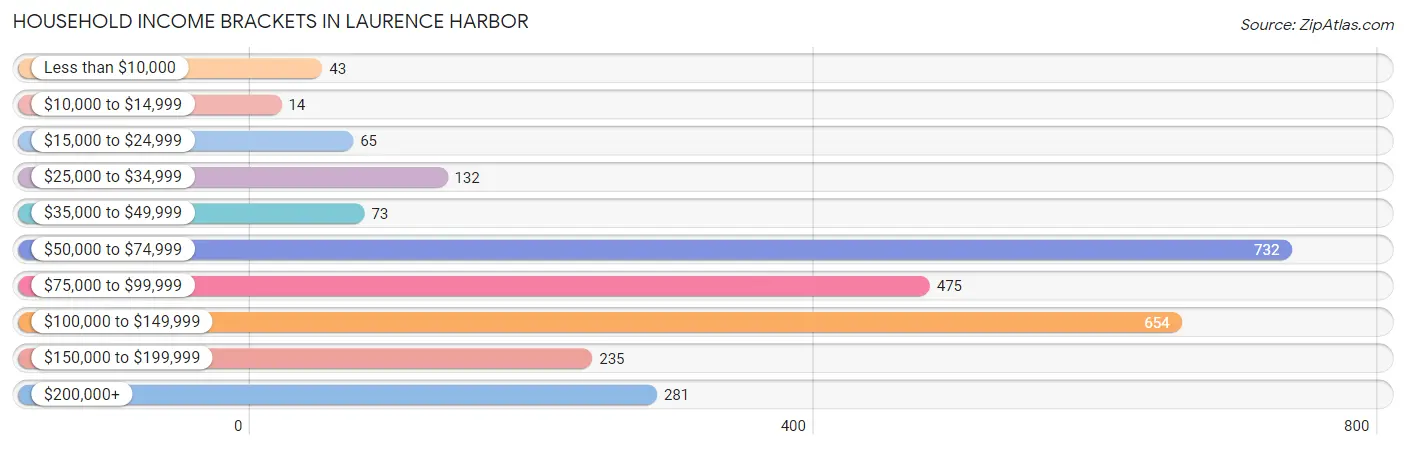
Household Income Brackets in Laurence Harbor
With 732 households falling in the category, the $50,000 to $74,999 income range is the most frequent in Laurence Harbor, accounting for 27.1% of all households. In contrast, only 14 households (0.5%) fall into the $10,000 to $14,999 income bracket, making it the least populous group.
| Income Bracket | # Households | % Households |
| Less than $10,000 | 43 | 1.6% |
| $10,000 to $14,999 | 14 | 0.5% |
| $15,000 to $24,999 | 65 | 2.4% |
| $25,000 to $34,999 | 132 | 4.9% |
| $35,000 to $49,999 | 73 | 2.7% |
| $50,000 to $74,999 | 732 | 27.1% |
| $75,000 to $99,999 | 475 | 17.6% |
| $100,000 to $149,999 | 654 | 24.2% |
| $150,000 to $199,999 | 235 | 8.7% |
| $200,000+ | 281 | 10.4% |
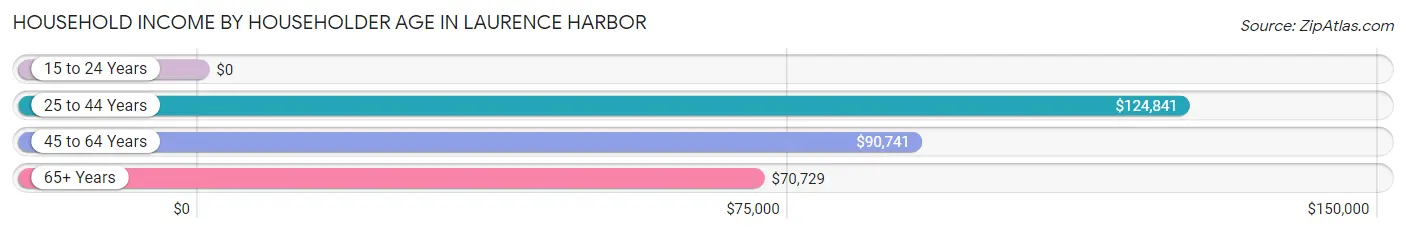
Household Income by Householder Age in Laurence Harbor
The median household income in Laurence Harbor is $95,399, with the highest median household income of $124,841 found in the 25 to 44 years age bracket for the primary householder. A total of 612 households (22.7%) fall into this category. Meanwhile, the 15 to 24 years age bracket for the primary householder has the lowest median household income of $0, with 10 households (0.4%) in this group.
| Income Bracket | # Households | Median Income |
| 15 to 24 Years | 10 (0.4%) | $0 |
| 25 to 44 Years | 612 (22.7%) | $124,841 |
| 45 to 64 Years | 1,398 (51.8%) | $90,741 |
| 65+ Years | 681 (25.2%) | $70,729 |
| Total | 2,701 (100.0%) | $95,399 |
Poverty in Laurence Harbor
Income Below Poverty by Sex and Age in Laurence Harbor
With 7.1% poverty level for males and 2.3% for females among the residents of Laurence Harbor, 65 to 74 year old males and 12 to 14 year old females are the most vulnerable to poverty, with 42 males (17.7%) and 16 females (10.5%) in their respective age groups living below the poverty level.
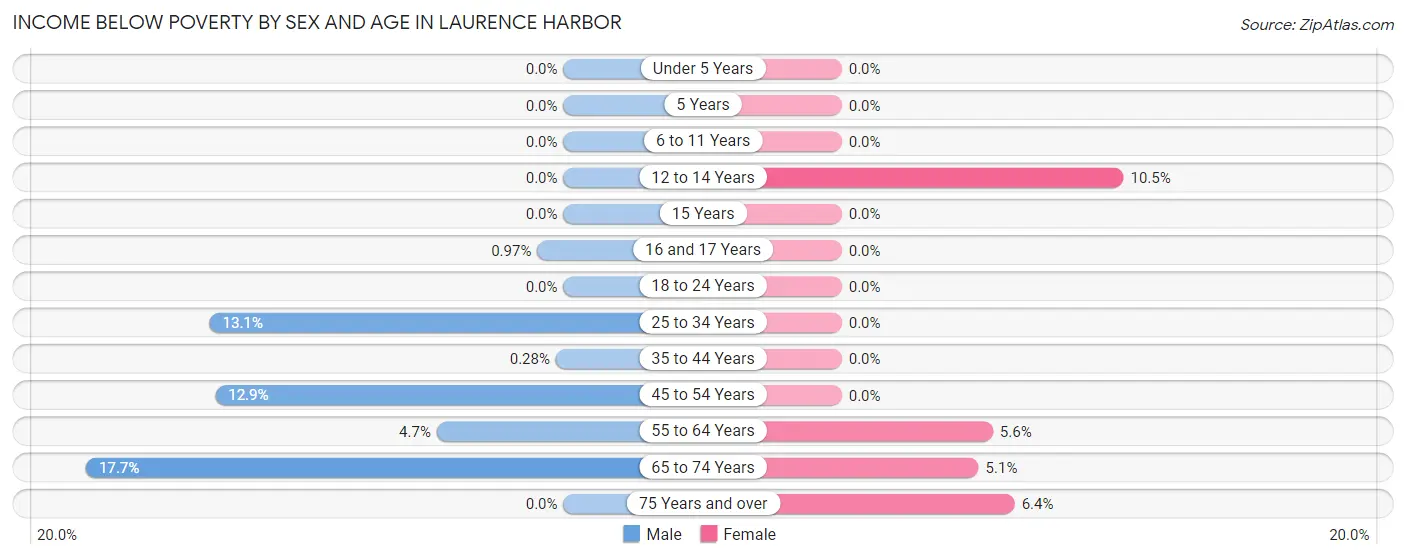
| Age Bracket | Male | Female |
| Under 5 Years | 0 (0.0%) | 0 (0.0%) |
| 5 Years | 0 (0.0%) | 0 (0.0%) |
| 6 to 11 Years | 0 (0.0%) | 0 (0.0%) |
| 12 to 14 Years | 0 (0.0%) | 16 (10.5%) |
| 15 Years | 0 (0.0%) | 0 (0.0%) |
| 16 and 17 Years | 1 (1.0%) | 0 (0.0%) |
| 18 to 24 Years | 0 (0.0%) | 0 (0.0%) |
| 25 to 34 Years | 65 (13.1%) | 0 (0.0%) |
| 35 to 44 Years | 1 (0.3%) | 0 (0.0%) |
| 45 to 54 Years | 77 (12.9%) | 0 (0.0%) |
| 55 to 64 Years | 28 (4.7%) | 27 (5.6%) |
| 65 to 74 Years | 42 (17.7%) | 22 (5.1%) |
| 75 Years and over | 0 (0.0%) | 14 (6.4%) |
| Total | 214 (7.1%) | 79 (2.3%) |
Income Above Poverty by Sex and Age in Laurence Harbor
According to the poverty statistics in Laurence Harbor, males aged under 5 years and females aged under 5 years are the age groups that are most secure financially, with 100.0% of males and 100.0% of females in these age groups living above the poverty line.
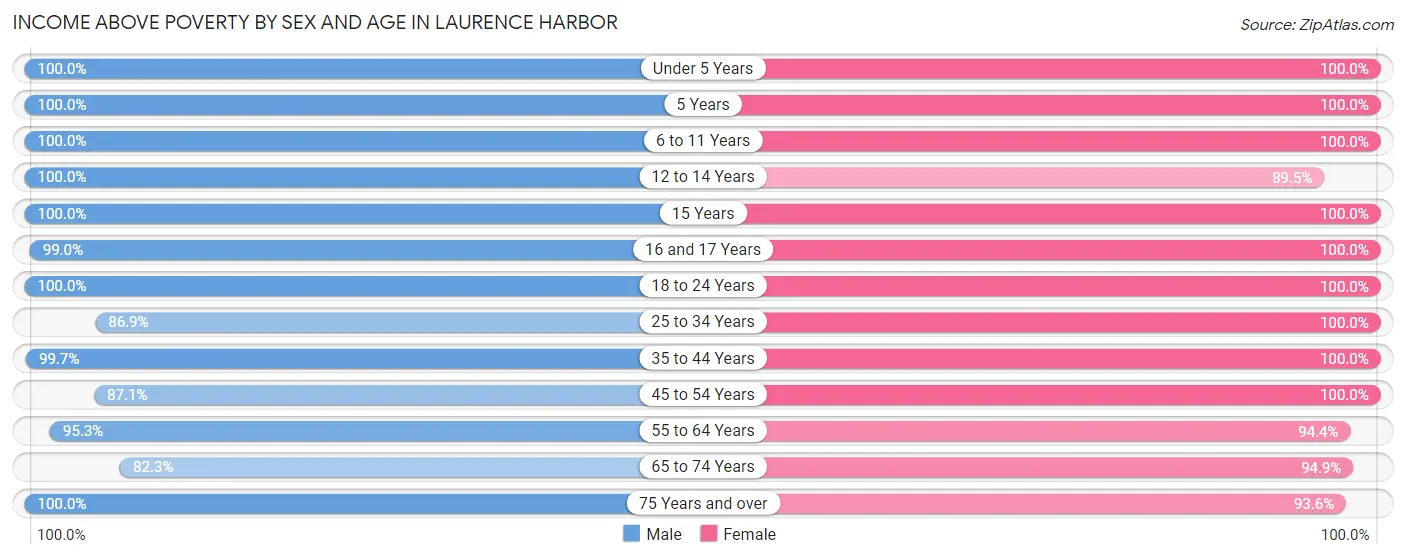
| Age Bracket | Male | Female |
| Under 5 Years | 164 (100.0%) | 219 (100.0%) |
| 5 Years | 141 (100.0%) | 99 (100.0%) |
| 6 to 11 Years | 14 (100.0%) | 126 (100.0%) |
| 12 to 14 Years | 8 (100.0%) | 137 (89.5%) |
| 15 Years | 51 (100.0%) | 10 (100.0%) |
| 16 and 17 Years | 102 (99.0%) | 85 (100.0%) |
| 18 to 24 Years | 128 (100.0%) | 149 (100.0%) |
| 25 to 34 Years | 430 (86.9%) | 435 (100.0%) |
| 35 to 44 Years | 354 (99.7%) | 300 (100.0%) |
| 45 to 54 Years | 519 (87.1%) | 693 (100.0%) |
| 55 to 64 Years | 568 (95.3%) | 454 (94.4%) |
| 65 to 74 Years | 195 (82.3%) | 411 (94.9%) |
| 75 Years and over | 129 (100.0%) | 204 (93.6%) |
| Total | 2,803 (92.9%) | 3,322 (97.7%) |
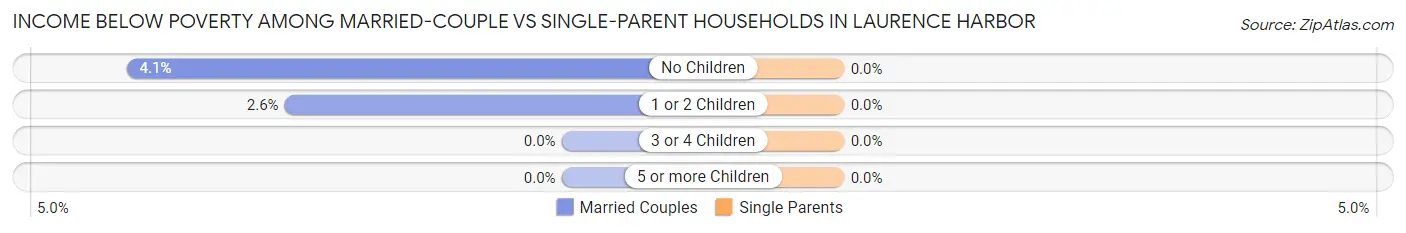
Income Below Poverty Among Married-Couple Families in Laurence Harbor
The poverty statistics for married-couple families in Laurence Harbor show that 3.2% or 39 of the total 1,219 families live below the poverty line. Families with no children have the highest poverty rate of 4.1%, comprising of 25 families. On the other hand, families with 3 or 4 children have the lowest poverty rate of 0.0%, which includes 0 families.
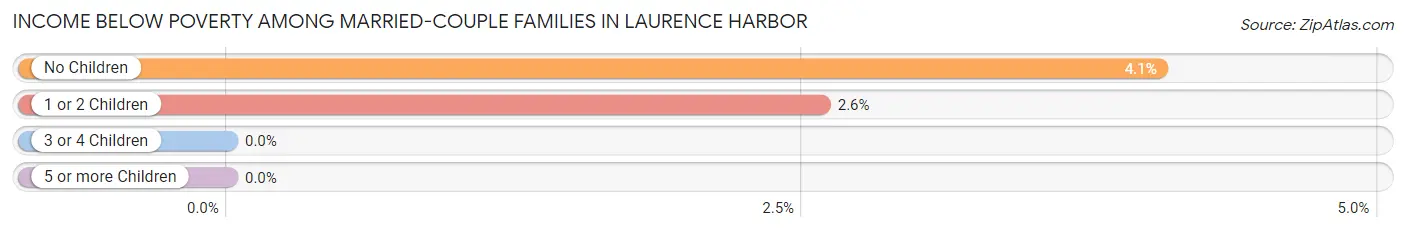
| Children | Above Poverty | Below Poverty |
| No Children | 592 (96.0%) | 25 (4.1%) |
| 1 or 2 Children | 529 (97.4%) | 14 (2.6%) |
| 3 or 4 Children | 59 (100.0%) | 0 (0.0%) |
| 5 or more Children | 0 (0.0%) | 0 (0.0%) |
| Total | 1,180 (96.8%) | 39 (3.2%) |
Income Below Poverty Among Single-Parent Households in Laurence Harbor
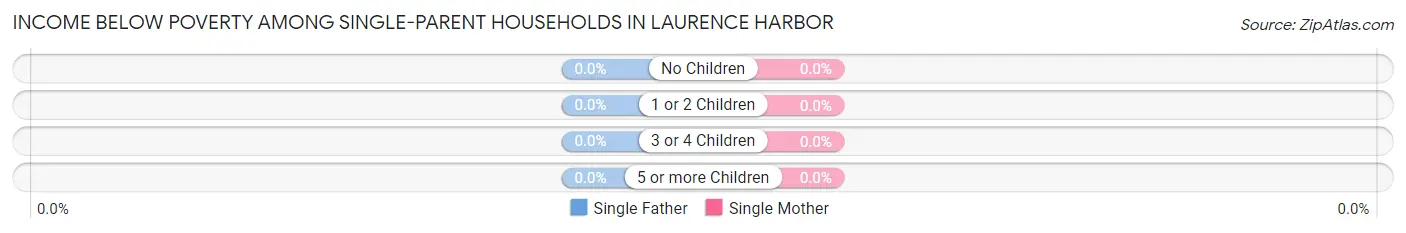
| Children | Single Father | Single Mother |
| No Children | 0 (0.0%) | 0 (0.0%) |
| 1 or 2 Children | 0 (0.0%) | 0 (0.0%) |
| 3 or 4 Children | 0 (0.0%) | 0 (0.0%) |
| 5 or more Children | 0 (0.0%) | 0 (0.0%) |
| Total | 0 (0.0%) | 0 (0.0%) |
Income Below Poverty Among Married-Couple vs Single-Parent Households in Laurence Harbor
| Children | Married-Couple Families | Single-Parent Households |
| No Children | 25 (4.1%) | 0 (0.0%) |
| 1 or 2 Children | 14 (2.6%) | 0 (0.0%) |
| 3 or 4 Children | 0 (0.0%) | 0 (0.0%) |
| 5 or more Children | 0 (0.0%) | 0 (0.0%) |
| Total | 39 (3.2%) | 0 (0.0%) |
Employment Characteristics in Laurence Harbor
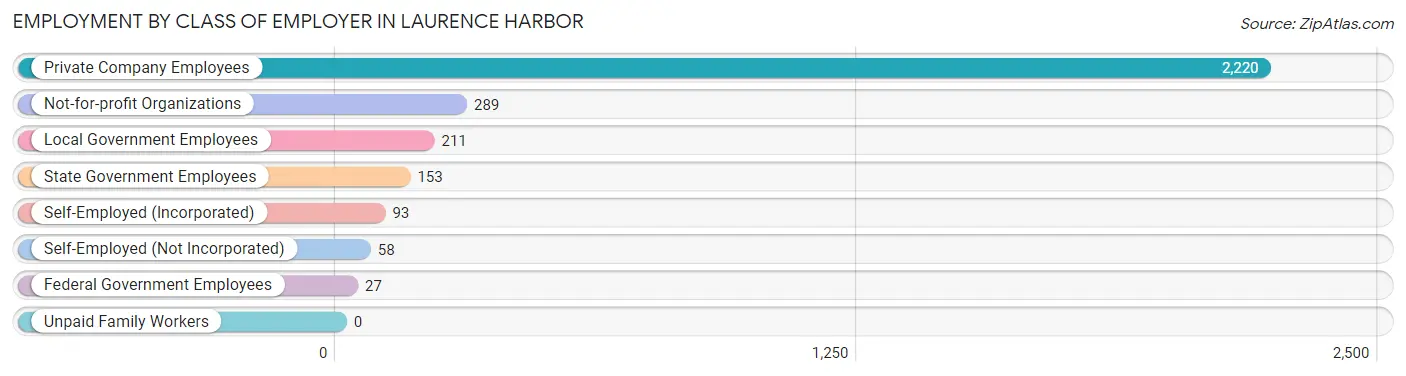
Employment by Class of Employer in Laurence Harbor
Among the 3,051 employed individuals in Laurence Harbor, private company employees (2,220 | 72.8%), not-for-profit organizations (289 | 9.5%), and local government employees (211 | 6.9%) make up the most common classes of employment.
| Employer Class | # Employees | % Employees |
| Private Company Employees | 2,220 | 72.8% |
| Self-Employed (Incorporated) | 93 | 3.0% |
| Self-Employed (Not Incorporated) | 58 | 1.9% |
| Not-for-profit Organizations | 289 | 9.5% |
| Local Government Employees | 211 | 6.9% |
| State Government Employees | 153 | 5.0% |
| Federal Government Employees | 27 | 0.9% |
| Unpaid Family Workers | 0 | 0.0% |
| Total | 3,051 | 100.0% |
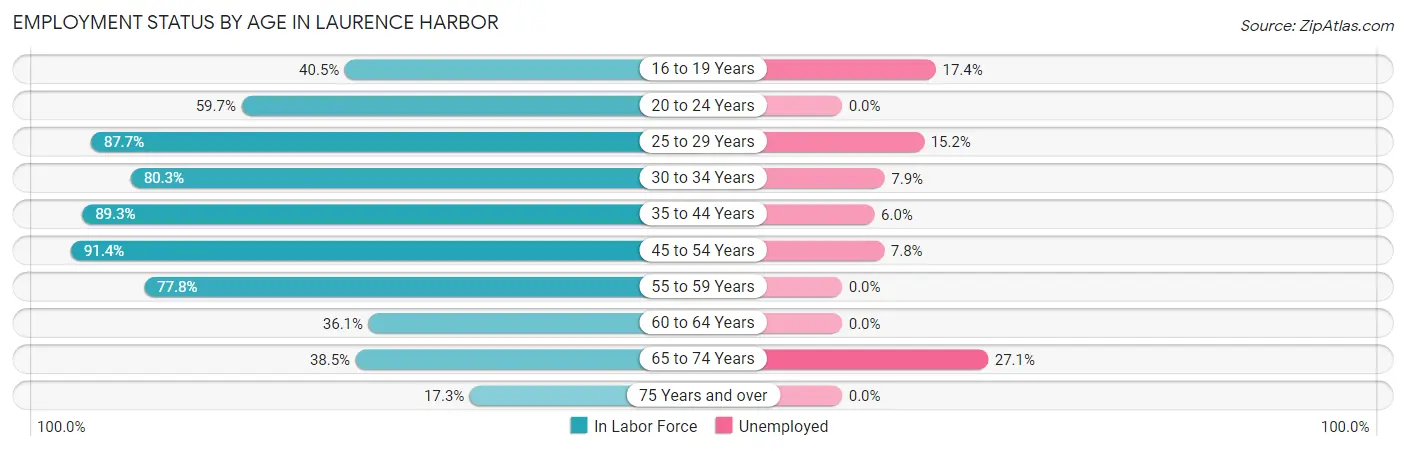
Employment Status by Age in Laurence Harbor
According to the labor force statistics for Laurence Harbor, out of the total population over 16 years of age (5,433), 68.0% or 3,694 individuals are in the labor force, with 7.8% or 288 of them unemployed. The age group with the highest labor force participation rate is 45 to 54 years, with 91.4% or 1,178 individuals in the labor force. Within the labor force, the 65 to 74 years age range has the highest percentage of unemployed individuals, with 27.1% or 70 of them being unemployed.
| Age Bracket | In Labor Force | Unemployed |
| 16 to 19 Years | 115 (40.5%) | 20 (17.4%) |
| 20 to 24 Years | 108 (59.7%) | 0 (0.0%) |
| 25 to 29 Years | 178 (87.7%) | 27 (15.2%) |
| 30 to 34 Years | 584 (80.3%) | 46 (7.9%) |
| 35 to 44 Years | 585 (89.3%) | 35 (6.0%) |
| 45 to 54 Years | 1,178 (91.4%) | 92 (7.8%) |
| 55 to 59 Years | 452 (77.8%) | 0 (0.0%) |
| 60 to 64 Years | 179 (36.1%) | 0 (0.0%) |
| 65 to 74 Years | 258 (38.5%) | 70 (27.1%) |
| 75 Years and over | 60 (17.3%) | 0 (0.0%) |
| Total | 3,694 (68.0%) | 288 (7.8%) |
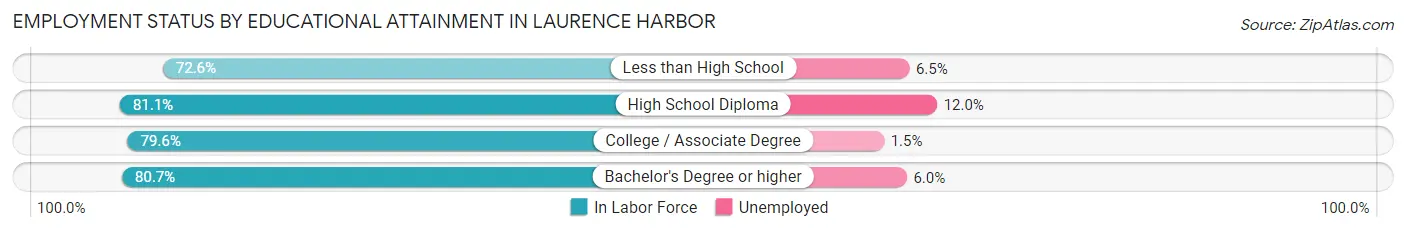
Employment Status by Educational Attainment in Laurence Harbor
According to labor force statistics for Laurence Harbor, 79.9% of individuals (3,157) out of the total population between 25 and 64 years of age (3,951) are in the labor force, with 6.3% or 199 of them being unemployed. The group with the highest labor force participation rate are those with the educational attainment of high school diploma, with 81.1% or 865 individuals in the labor force. Within the labor force, individuals with high school diploma education have the highest percentage of unemployment, with 12.0% or 104 of them being unemployed.
| Educational Attainment | In Labor Force | Unemployed |
| Less than High School | 215 (72.6%) | 19 (6.5%) |
| High School Diploma | 865 (81.1%) | 128 (12.0%) |
| College / Associate Degree | 935 (79.6%) | 18 (1.5%) |
| Bachelor's Degree or higher | 1,141 (80.7%) | 85 (6.0%) |
| Total | 3,157 (79.9%) | 249 (6.3%) |
Employment Occupations by Sex in Laurence Harbor
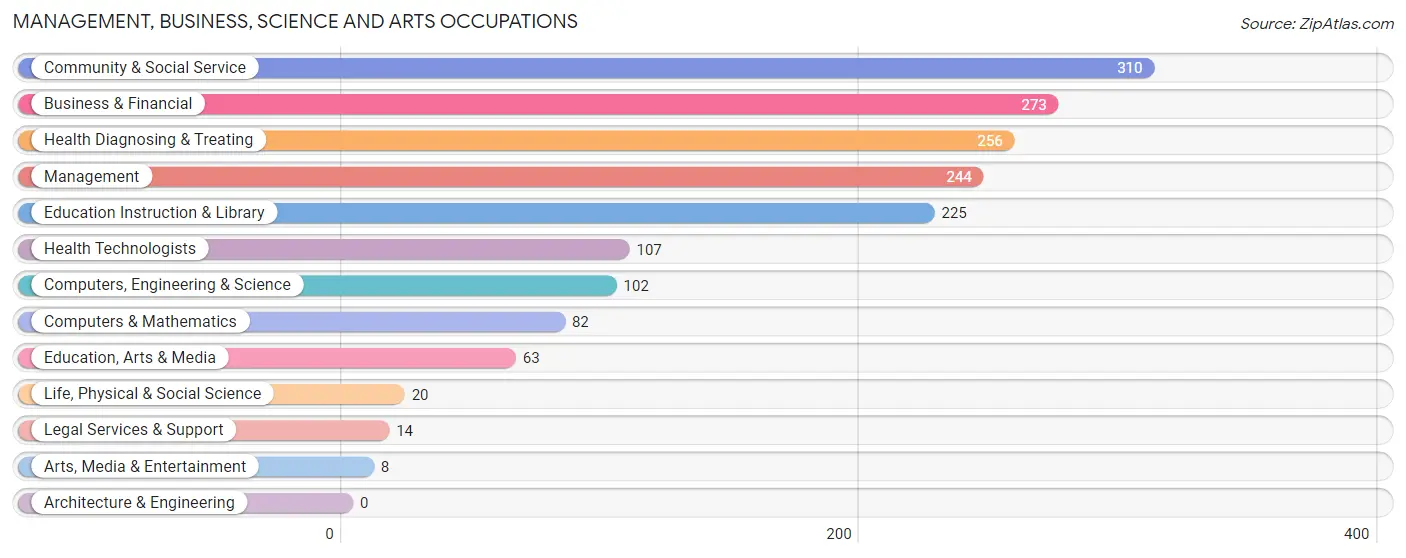
Management, Business, Science and Arts Occupations
The most common Management, Business, Science and Arts occupations in Laurence Harbor are Community & Social Service (310 | 9.1%), Business & Financial (273 | 8.0%), Health Diagnosing & Treating (256 | 7.5%), Management (244 | 7.2%), and Education Instruction & Library (225 | 6.6%).
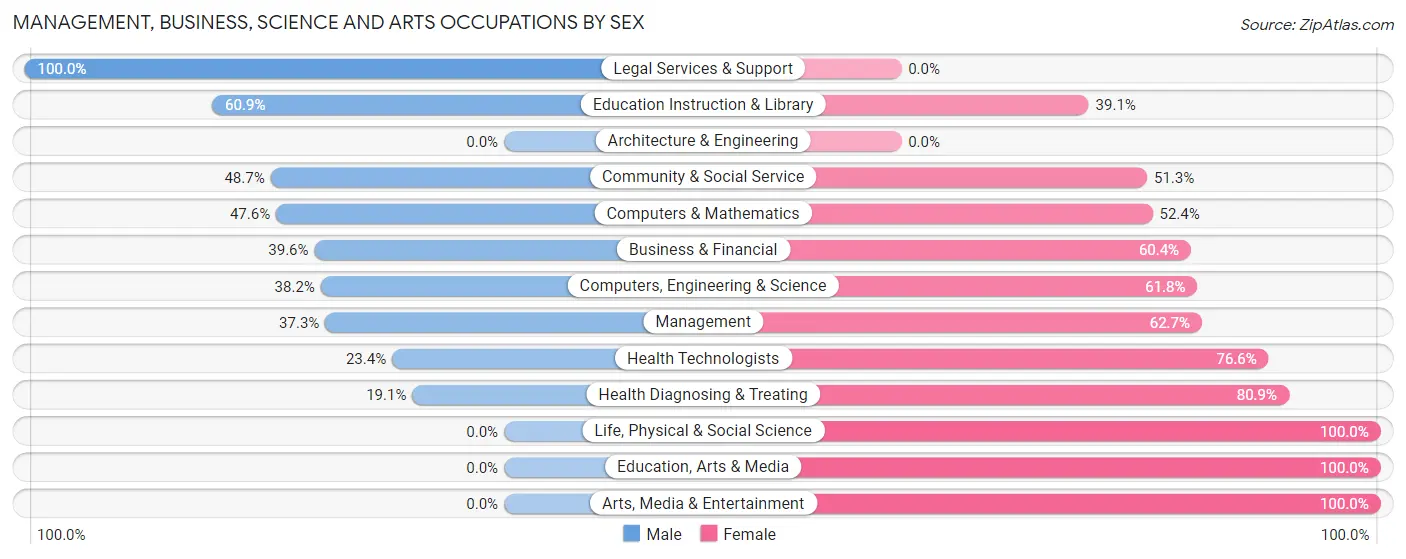
Management, Business, Science and Arts Occupations by Sex
Within the Management, Business, Science and Arts occupations in Laurence Harbor, the most male-oriented occupations are Legal Services & Support (100.0%), Education Instruction & Library (60.9%), and Community & Social Service (48.7%), while the most female-oriented occupations are Life, Physical & Social Science (100.0%), Education, Arts & Media (100.0%), and Arts, Media & Entertainment (100.0%).
| Occupation | Male | Female |
| Management | 91 (37.3%) | 153 (62.7%) |
| Business & Financial | 108 (39.6%) | 165 (60.4%) |
| Computers, Engineering & Science | 39 (38.2%) | 63 (61.8%) |
| Computers & Mathematics | 39 (47.6%) | 43 (52.4%) |
| Architecture & Engineering | 0 (0.0%) | 0 (0.0%) |
| Life, Physical & Social Science | 0 (0.0%) | 20 (100.0%) |
| Community & Social Service | 151 (48.7%) | 159 (51.3%) |
| Education, Arts & Media | 0 (0.0%) | 63 (100.0%) |
| Legal Services & Support | 14 (100.0%) | 0 (0.0%) |
| Education Instruction & Library | 137 (60.9%) | 88 (39.1%) |
| Arts, Media & Entertainment | 0 (0.0%) | 8 (100.0%) |
| Health Diagnosing & Treating | 49 (19.1%) | 207 (80.9%) |
| Health Technologists | 25 (23.4%) | 82 (76.6%) |
| Total (Category) | 438 (37.0%) | 747 (63.0%) |
| Total (Overall) | 1,662 (48.8%) | 1,745 (51.2%) |
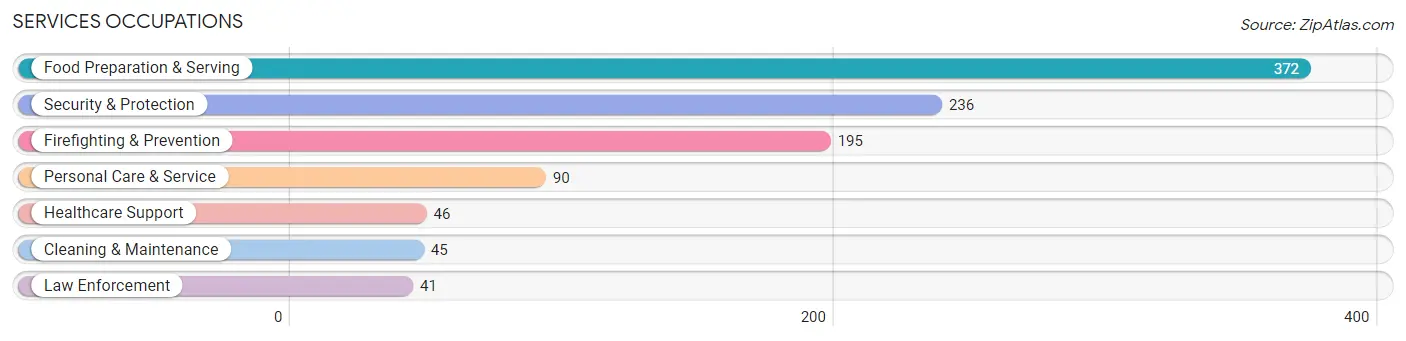
Services Occupations
The most common Services occupations in Laurence Harbor are Food Preparation & Serving (372 | 10.9%), Security & Protection (236 | 6.9%), Firefighting & Prevention (195 | 5.7%), Personal Care & Service (90 | 2.6%), and Healthcare Support (46 | 1.3%).
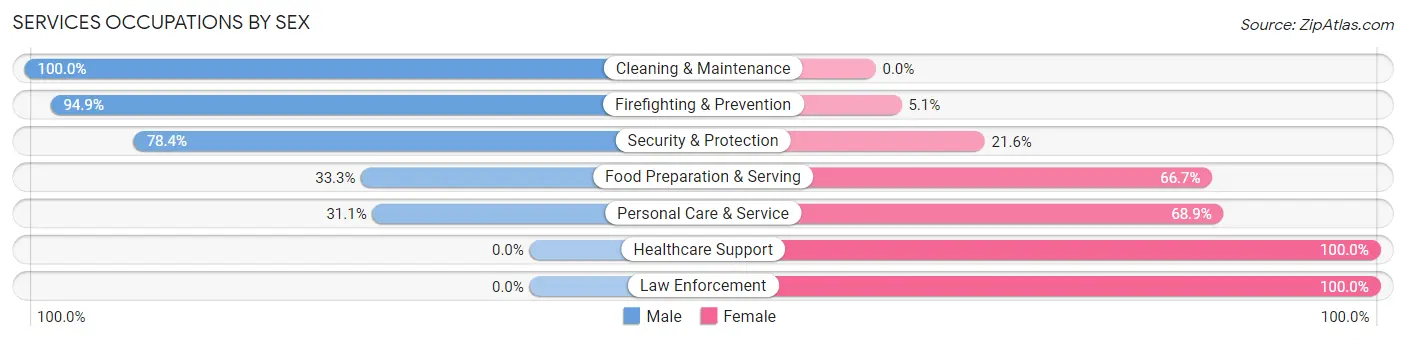
Services Occupations by Sex
Within the Services occupations in Laurence Harbor, the most male-oriented occupations are Cleaning & Maintenance (100.0%), Firefighting & Prevention (94.9%), and Security & Protection (78.4%), while the most female-oriented occupations are Healthcare Support (100.0%), Law Enforcement (100.0%), and Personal Care & Service (68.9%).
| Occupation | Male | Female |
| Healthcare Support | 0 (0.0%) | 46 (100.0%) |
| Security & Protection | 185 (78.4%) | 51 (21.6%) |
| Firefighting & Prevention | 185 (94.9%) | 10 (5.1%) |
| Law Enforcement | 0 (0.0%) | 41 (100.0%) |
| Food Preparation & Serving | 124 (33.3%) | 248 (66.7%) |
| Cleaning & Maintenance | 45 (100.0%) | 0 (0.0%) |
| Personal Care & Service | 28 (31.1%) | 62 (68.9%) |
| Total (Category) | 382 (48.4%) | 407 (51.6%) |
| Total (Overall) | 1,662 (48.8%) | 1,745 (51.2%) |
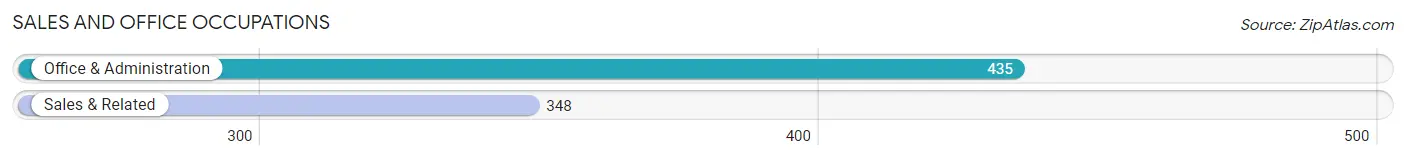
Sales and Office Occupations
The most common Sales and Office occupations in Laurence Harbor are Office & Administration (435 | 12.8%), and Sales & Related (348 | 10.2%).
Sales and Office Occupations by Sex
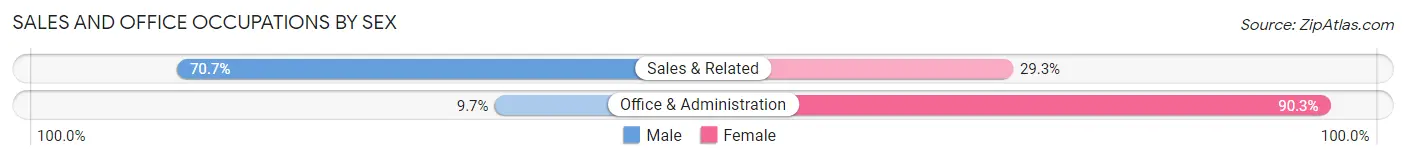
| Occupation | Male | Female |
| Sales & Related | 246 (70.7%) | 102 (29.3%) |
| Office & Administration | 42 (9.7%) | 393 (90.3%) |
| Total (Category) | 288 (36.8%) | 495 (63.2%) |
| Total (Overall) | 1,662 (48.8%) | 1,745 (51.2%) |
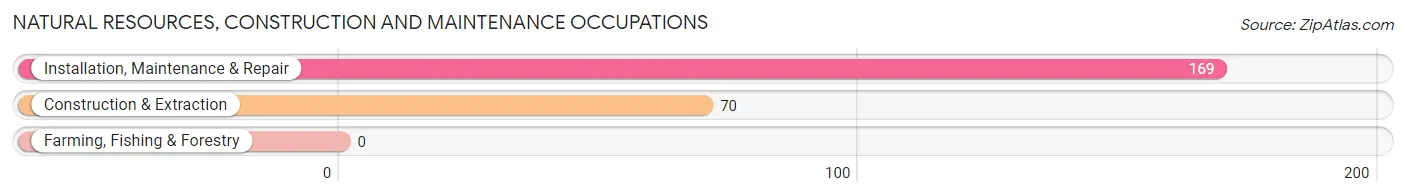
Natural Resources, Construction and Maintenance Occupations
The most common Natural Resources, Construction and Maintenance occupations in Laurence Harbor are Installation, Maintenance & Repair (169 | 5.0%), and Construction & Extraction (70 | 2.1%).
Natural Resources, Construction and Maintenance Occupations by Sex

| Occupation | Male | Female |
| Farming, Fishing & Forestry | 0 (0.0%) | 0 (0.0%) |
| Construction & Extraction | 70 (100.0%) | 0 (0.0%) |
| Installation, Maintenance & Repair | 169 (100.0%) | 0 (0.0%) |
| Total (Category) | 239 (100.0%) | 0 (0.0%) |
| Total (Overall) | 1,662 (48.8%) | 1,745 (51.2%) |
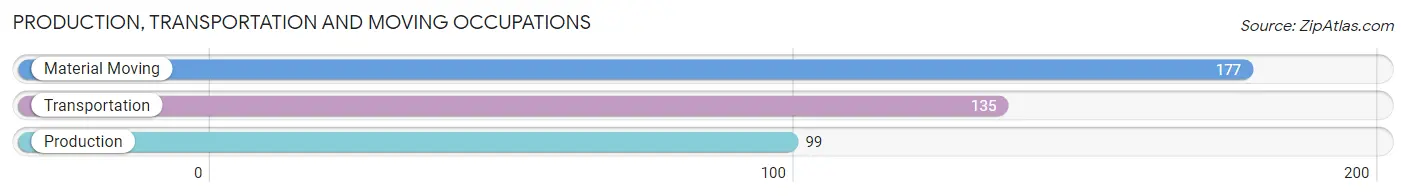
Production, Transportation and Moving Occupations
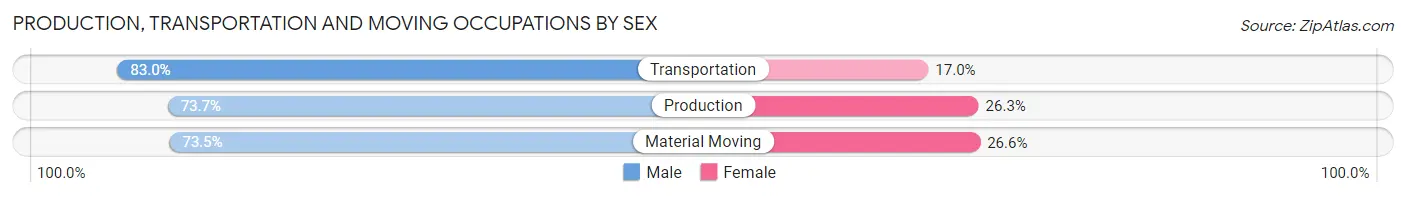
The most common Production, Transportation and Moving occupations in Laurence Harbor are Material Moving (177 | 5.2%), Transportation (135 | 4.0%), and Production (99 | 2.9%).
Production, Transportation and Moving Occupations by Sex
| Occupation | Male | Female |
| Production | 73 (73.7%) | 26 (26.3%) |
| Transportation | 112 (83.0%) | 23 (17.0%) |
| Material Moving | 130 (73.5%) | 47 (26.6%) |
| Total (Category) | 315 (76.6%) | 96 (23.4%) |
| Total (Overall) | 1,662 (48.8%) | 1,745 (51.2%) |
Employment Industries by Sex in Laurence Harbor
Employment Industries in Laurence Harbor
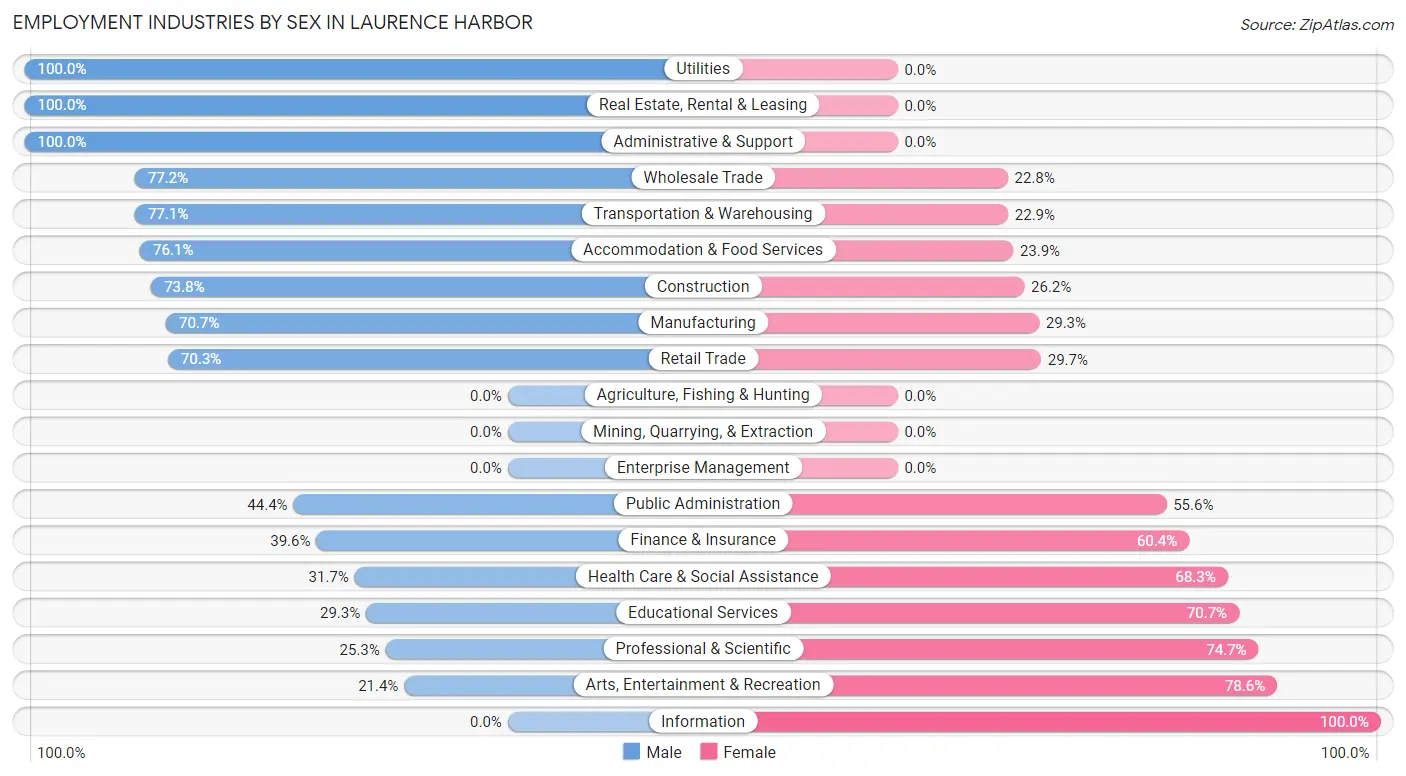
The major employment industries in Laurence Harbor include Health Care & Social Assistance (543 | 15.9%), Retail Trade (509 | 14.9%), Educational Services (498 | 14.6%), Transportation & Warehousing (210 | 6.2%), and Manufacturing (181 | 5.3%).

Employment Industries by Sex in Laurence Harbor
The Laurence Harbor industries that see more men than women are Utilities (100.0%), Real Estate, Rental & Leasing (100.0%), and Administrative & Support (100.0%), whereas the industries that tend to have a higher number of women are Information (100.0%), Arts, Entertainment & Recreation (78.6%), and Professional & Scientific (74.7%).
| Industry | Male | Female |
| Agriculture, Fishing & Hunting | 0 (0.0%) | 0 (0.0%) |
| Mining, Quarrying, & Extraction | 0 (0.0%) | 0 (0.0%) |
| Construction | 121 (73.8%) | 43 (26.2%) |
| Manufacturing | 128 (70.7%) | 53 (29.3%) |
| Wholesale Trade | 44 (77.2%) | 13 (22.8%) |
| Retail Trade | 358 (70.3%) | 151 (29.7%) |
| Transportation & Warehousing | 162 (77.1%) | 48 (22.9%) |
| Utilities | 21 (100.0%) | 0 (0.0%) |
| Information | 0 (0.0%) | 54 (100.0%) |
| Finance & Insurance | 65 (39.6%) | 99 (60.4%) |
| Real Estate, Rental & Leasing | 58 (100.0%) | 0 (0.0%) |
| Professional & Scientific | 45 (25.3%) | 133 (74.7%) |
| Enterprise Management | 0 (0.0%) | 0 (0.0%) |
| Administrative & Support | 59 (100.0%) | 0 (0.0%) |
| Educational Services | 146 (29.3%) | 352 (70.7%) |
| Health Care & Social Assistance | 172 (31.7%) | 371 (68.3%) |
| Arts, Entertainment & Recreation | 12 (21.4%) | 44 (78.6%) |
| Accommodation & Food Services | 70 (76.1%) | 22 (23.9%) |
| Public Administration | 59 (44.4%) | 74 (55.6%) |
| Total | 1,662 (48.8%) | 1,745 (51.2%) |
Education in Laurence Harbor
School Enrollment in Laurence Harbor
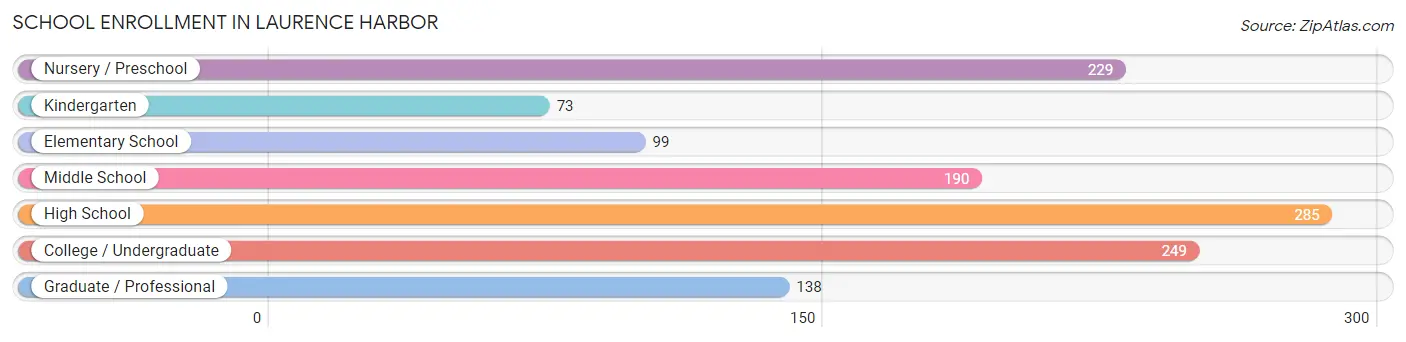
The most common levels of schooling among the 1,263 students in Laurence Harbor are high school (285 | 22.6%), college / undergraduate (249 | 19.7%), and nursery / preschool (229 | 18.1%).
| School Level | # Students | % Students |
| Nursery / Preschool | 229 | 18.1% |
| Kindergarten | 73 | 5.8% |
| Elementary School | 99 | 7.8% |
| Middle School | 190 | 15.0% |
| High School | 285 | 22.6% |
| College / Undergraduate | 249 | 19.7% |
| Graduate / Professional | 138 | 10.9% |
| Total | 1,263 | 100.0% |
School Enrollment by Age by Funding Source in Laurence Harbor
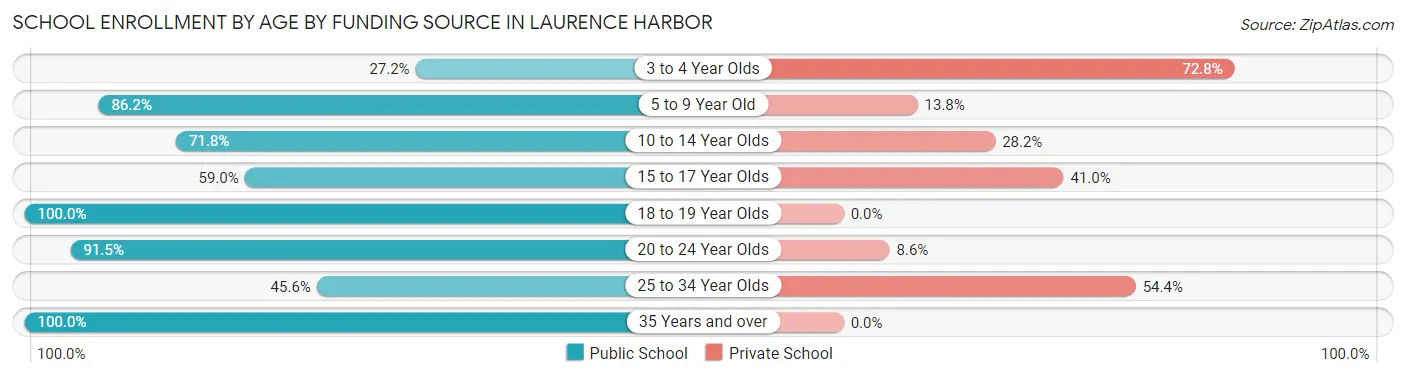
Out of a total of 1,263 students who are enrolled in schools in Laurence Harbor, 405 (32.1%) attend a private institution, while the remaining 858 (67.9%) are enrolled in public schools. The age group of 3 to 4 year olds has the highest likelihood of being enrolled in private schools, with 91 (72.8% in the age bracket) enrolled. Conversely, the age group of 18 to 19 year olds has the lowest likelihood of being enrolled in a private school, with 31 (100.0% in the age bracket) attending a public institution.
| Age Bracket | Public School | Private School |
| 3 to 4 Year Olds | 34 (27.2%) | 91 (72.8%) |
| 5 to 9 Year Old | 238 (86.2%) | 38 (13.8%) |
| 10 to 14 Year Olds | 145 (71.8%) | 57 (28.2%) |
| 15 to 17 Year Olds | 147 (59.0%) | 102 (41.0%) |
| 18 to 19 Year Olds | 31 (100.0%) | 0 (0.0%) |
| 20 to 24 Year Olds | 139 (91.4%) | 13 (8.6%) |
| 25 to 34 Year Olds | 88 (45.6%) | 105 (54.4%) |
| 35 Years and over | 35 (100.0%) | 0 (0.0%) |
| Total | 858 (67.9%) | 405 (32.1%) |
Educational Attainment by Field of Study in Laurence Harbor
Business (393 | 20.7%), education (300 | 15.8%), liberal arts & history (212 | 11.2%), social sciences (192 | 10.1%), and psychology (185 | 9.7%) are the most common fields of study among 1,899 individuals in Laurence Harbor who have obtained a bachelor's degree or higher.
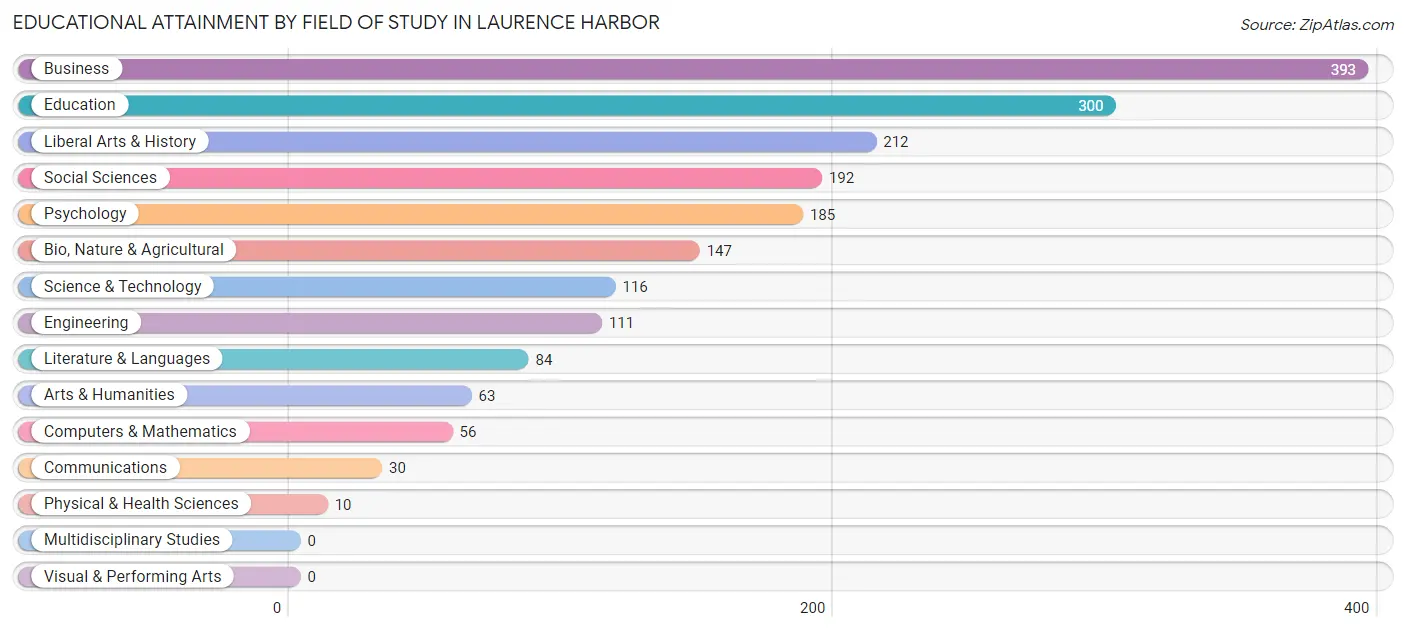
| Field of Study | # Graduates | % Graduates |
| Computers & Mathematics | 56 | 2.9% |
| Bio, Nature & Agricultural | 147 | 7.7% |
| Physical & Health Sciences | 10 | 0.5% |
| Psychology | 185 | 9.7% |
| Social Sciences | 192 | 10.1% |
| Engineering | 111 | 5.9% |
| Multidisciplinary Studies | 0 | 0.0% |
| Science & Technology | 116 | 6.1% |
| Business | 393 | 20.7% |
| Education | 300 | 15.8% |
| Literature & Languages | 84 | 4.4% |
| Liberal Arts & History | 212 | 11.2% |
| Visual & Performing Arts | 0 | 0.0% |
| Communications | 30 | 1.6% |
| Arts & Humanities | 63 | 3.3% |
| Total | 1,899 | 100.0% |
Transportation & Commute in Laurence Harbor
Vehicle Availability by Sex in Laurence Harbor
The most prevalent vehicle ownership categories in Laurence Harbor are males with 2 vehicles (656, accounting for 41.8%) and females with 2 vehicles (699, making up 44.2%).
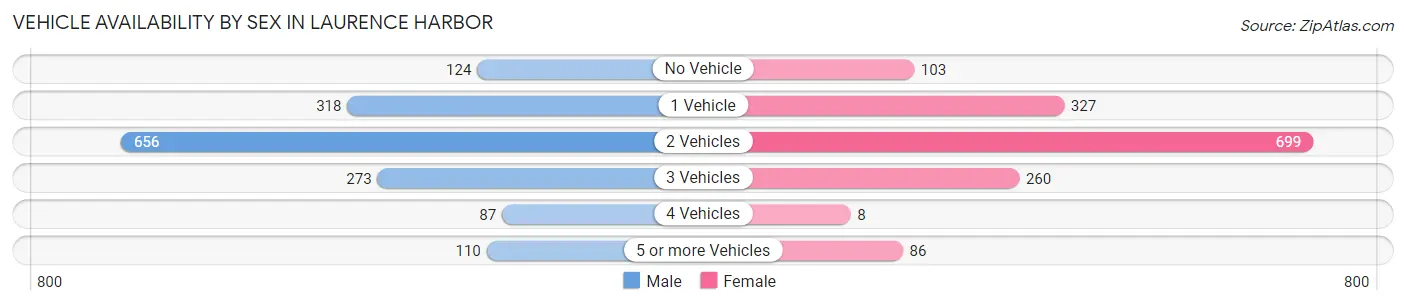
| Vehicles Available | Male | Female |
| No Vehicle | 124 (7.9%) | 103 (7.0%) |
| 1 Vehicle | 318 (20.3%) | 327 (22.1%) |
| 2 Vehicles | 656 (41.8%) | 699 (47.1%) |
| 3 Vehicles | 273 (17.4%) | 260 (17.5%) |
| 4 Vehicles | 87 (5.6%) | 8 (0.5%) |
| 5 or more Vehicles | 110 (7.0%) | 86 (5.8%) |
| Total | 1,568 (100.0%) | 1,483 (100.0%) |
Commute Time in Laurence Harbor
The most frequently occuring commute durations in Laurence Harbor are 20 to 24 minutes (491 commuters, 18.1%), 60 to 89 minutes (445 commuters, 16.4%), and 30 to 34 minutes (332 commuters, 12.3%).
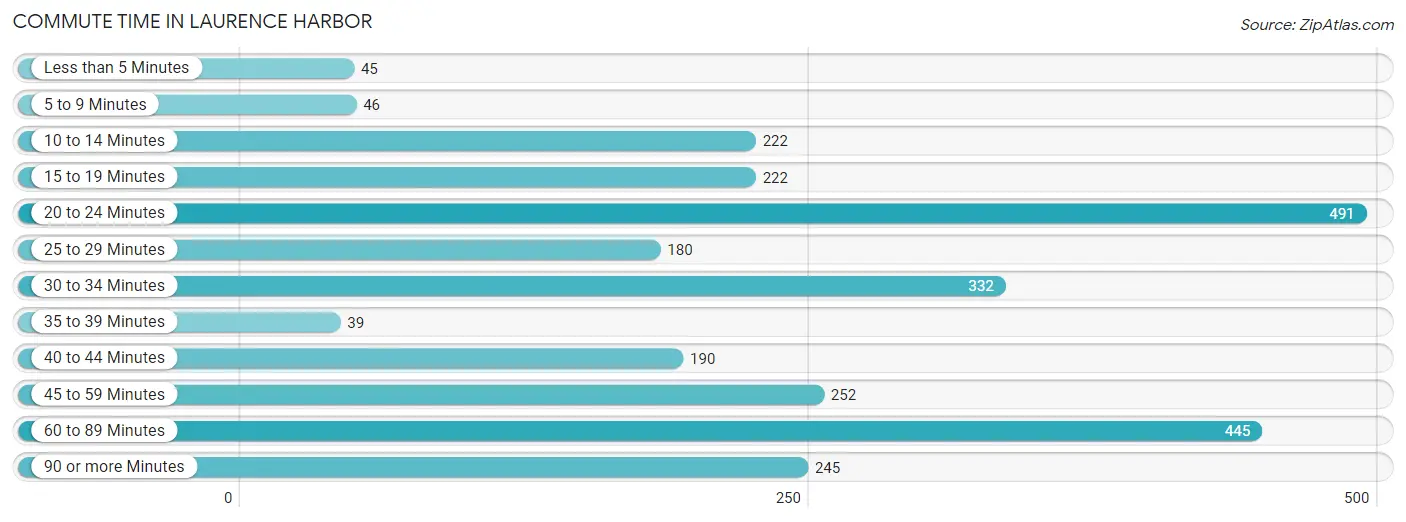
| Commute Time | # Commuters | % Commuters |
| Less than 5 Minutes | 45 | 1.7% |
| 5 to 9 Minutes | 46 | 1.7% |
| 10 to 14 Minutes | 222 | 8.2% |
| 15 to 19 Minutes | 222 | 8.2% |
| 20 to 24 Minutes | 491 | 18.1% |
| 25 to 29 Minutes | 180 | 6.6% |
| 30 to 34 Minutes | 332 | 12.3% |
| 35 to 39 Minutes | 39 | 1.4% |
| 40 to 44 Minutes | 190 | 7.0% |
| 45 to 59 Minutes | 252 | 9.3% |
| 60 to 89 Minutes | 445 | 16.4% |
| 90 or more Minutes | 245 | 9.0% |
Commute Time by Sex in Laurence Harbor
The most common commute times in Laurence Harbor are 20 to 24 minutes (315 commuters, 21.0%) for males and 60 to 89 minutes (178 commuters, 14.7%) for females.
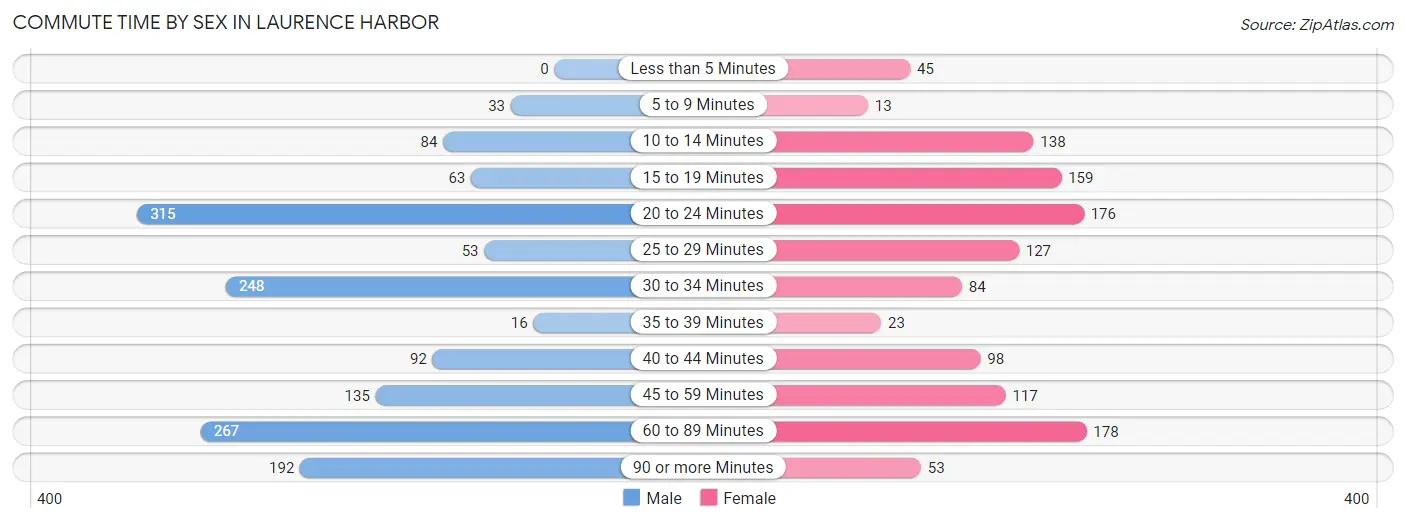
| Commute Time | Male | Female |
| Less than 5 Minutes | 0 (0.0%) | 45 (3.7%) |
| 5 to 9 Minutes | 33 (2.2%) | 13 (1.1%) |
| 10 to 14 Minutes | 84 (5.6%) | 138 (11.4%) |
| 15 to 19 Minutes | 63 (4.2%) | 159 (13.1%) |
| 20 to 24 Minutes | 315 (21.0%) | 176 (14.5%) |
| 25 to 29 Minutes | 53 (3.5%) | 127 (10.5%) |
| 30 to 34 Minutes | 248 (16.6%) | 84 (6.9%) |
| 35 to 39 Minutes | 16 (1.1%) | 23 (1.9%) |
| 40 to 44 Minutes | 92 (6.1%) | 98 (8.1%) |
| 45 to 59 Minutes | 135 (9.0%) | 117 (9.7%) |
| 60 to 89 Minutes | 267 (17.8%) | 178 (14.7%) |
| 90 or more Minutes | 192 (12.8%) | 53 (4.4%) |
Time of Departure to Work by Sex in Laurence Harbor
The most frequent times of departure to work in Laurence Harbor are 7:00 AM to 7:29 AM (266, 17.8%) for males and 12:00 PM to 3:59 PM (182, 15.0%) for females.
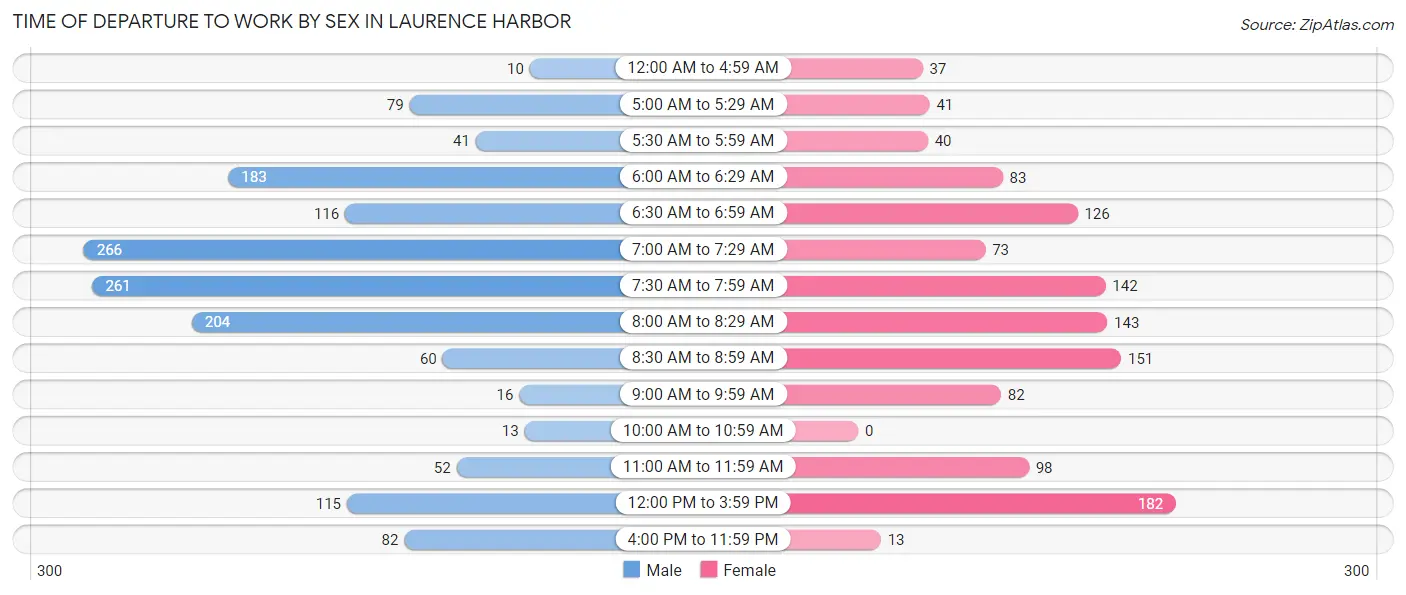
| Time of Departure | Male | Female |
| 12:00 AM to 4:59 AM | 10 (0.7%) | 37 (3.1%) |
| 5:00 AM to 5:29 AM | 79 (5.3%) | 41 (3.4%) |
| 5:30 AM to 5:59 AM | 41 (2.7%) | 40 (3.3%) |
| 6:00 AM to 6:29 AM | 183 (12.2%) | 83 (6.9%) |
| 6:30 AM to 6:59 AM | 116 (7.7%) | 126 (10.4%) |
| 7:00 AM to 7:29 AM | 266 (17.8%) | 73 (6.0%) |
| 7:30 AM to 7:59 AM | 261 (17.4%) | 142 (11.7%) |
| 8:00 AM to 8:29 AM | 204 (13.6%) | 143 (11.8%) |
| 8:30 AM to 8:59 AM | 60 (4.0%) | 151 (12.5%) |
| 9:00 AM to 9:59 AM | 16 (1.1%) | 82 (6.8%) |
| 10:00 AM to 10:59 AM | 13 (0.9%) | 0 (0.0%) |
| 11:00 AM to 11:59 AM | 52 (3.5%) | 98 (8.1%) |
| 12:00 PM to 3:59 PM | 115 (7.7%) | 182 (15.0%) |
| 4:00 PM to 11:59 PM | 82 (5.5%) | 13 (1.1%) |
| Total | 1,498 (100.0%) | 1,211 (100.0%) |
Housing Occupancy in Laurence Harbor
Occupancy by Ownership in Laurence Harbor
Of the total 2,701 dwellings in Laurence Harbor, owner-occupied units account for 2,251 (83.3%), while renter-occupied units make up 450 (16.7%).
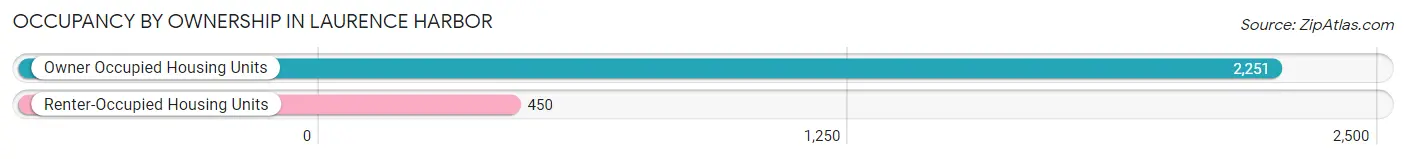
| Occupancy | # Housing Units | % Housing Units |
| Owner Occupied Housing Units | 2,251 | 83.3% |
| Renter-Occupied Housing Units | 450 | 16.7% |
| Total Occupied Housing Units | 2,701 | 100.0% |
Occupancy by Household Size in Laurence Harbor
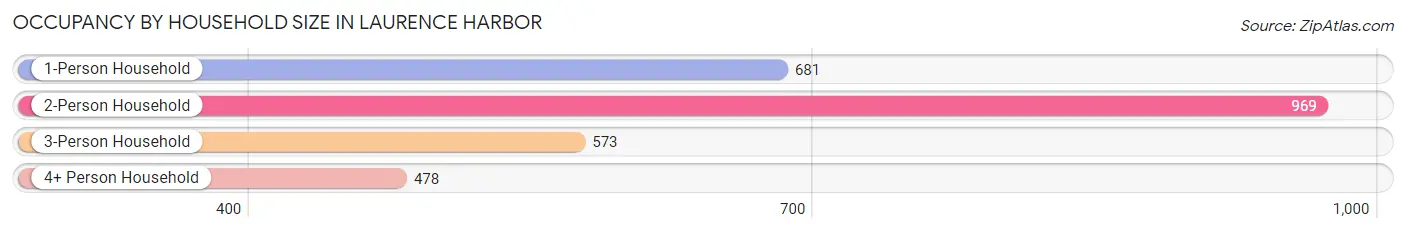
| Household Size | # Housing Units | % Housing Units |
| 1-Person Household | 681 | 25.2% |
| 2-Person Household | 969 | 35.9% |
| 3-Person Household | 573 | 21.2% |
| 4+ Person Household | 478 | 17.7% |
| Total Housing Units | 2,701 | 100.0% |
Occupancy by Ownership by Household Size in Laurence Harbor
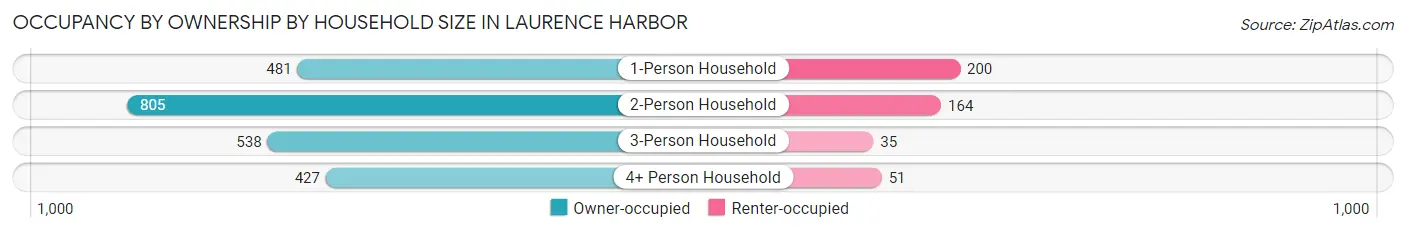
| Household Size | Owner-occupied | Renter-occupied |
| 1-Person Household | 481 (70.6%) | 200 (29.4%) |
| 2-Person Household | 805 (83.1%) | 164 (16.9%) |
| 3-Person Household | 538 (93.9%) | 35 (6.1%) |
| 4+ Person Household | 427 (89.3%) | 51 (10.7%) |
| Total Housing Units | 2,251 (83.3%) | 450 (16.7%) |
Occupancy by Educational Attainment in Laurence Harbor
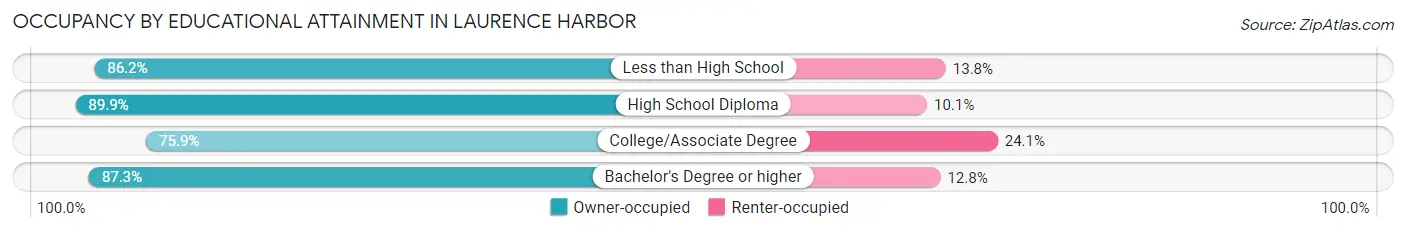
| Household Size | Owner-occupied | Renter-occupied |
| Less than High School | 131 (86.2%) | 21 (13.8%) |
| High School Diploma | 464 (89.9%) | 52 (10.1%) |
| College/Associate Degree | 787 (75.9%) | 250 (24.1%) |
| Bachelor's Degree or higher | 869 (87.3%) | 127 (12.8%) |
Occupancy by Age of Householder in Laurence Harbor
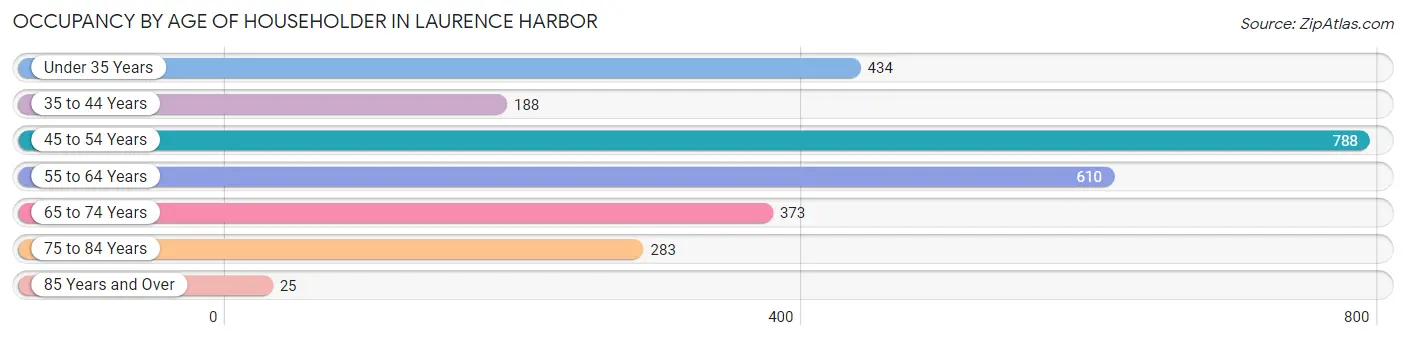
| Age Bracket | # Households | % Households |
| Under 35 Years | 434 | 16.1% |
| 35 to 44 Years | 188 | 7.0% |
| 45 to 54 Years | 788 | 29.2% |
| 55 to 64 Years | 610 | 22.6% |
| 65 to 74 Years | 373 | 13.8% |
| 75 to 84 Years | 283 | 10.5% |
| 85 Years and Over | 25 | 0.9% |
| Total | 2,701 | 100.0% |
Housing Finances in Laurence Harbor
Median Income by Occupancy in Laurence Harbor
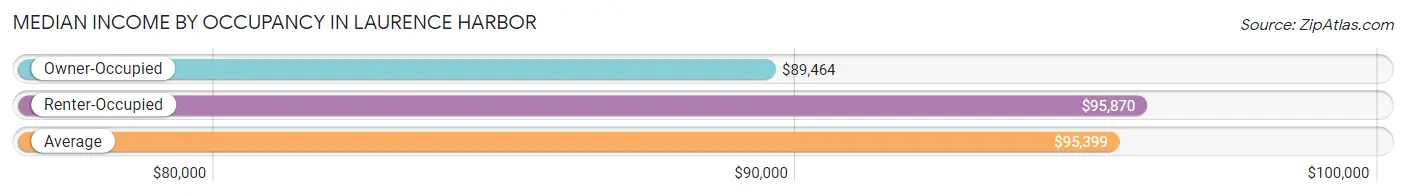
| Occupancy Type | # Households | Median Income |
| Owner-Occupied | 2,251 (83.3%) | $89,464 |
| Renter-Occupied | 450 (16.7%) | $95,870 |
| Average | 2,701 (100.0%) | $95,399 |
Occupancy by Householder Income Bracket in Laurence Harbor
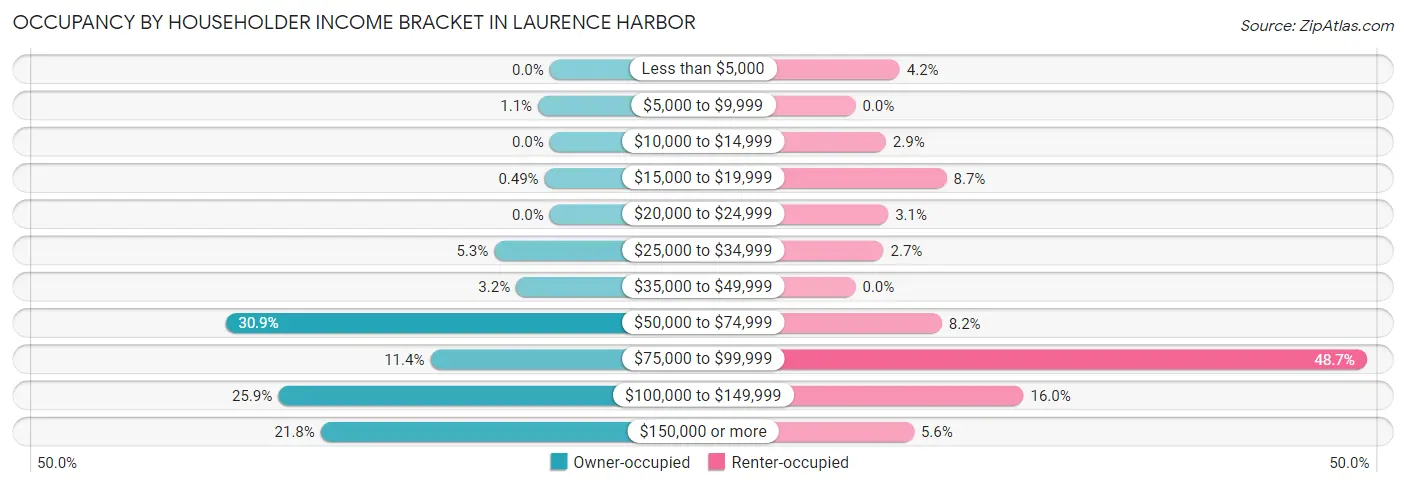
| Income Bracket | Owner-occupied | Renter-occupied |
| Less than $5,000 | 0 (0.0%) | 19 (4.2%) |
| $5,000 to $9,999 | 25 (1.1%) | 0 (0.0%) |
| $10,000 to $14,999 | 0 (0.0%) | 13 (2.9%) |
| $15,000 to $19,999 | 11 (0.5%) | 39 (8.7%) |
| $20,000 to $24,999 | 0 (0.0%) | 14 (3.1%) |
| $25,000 to $34,999 | 119 (5.3%) | 12 (2.7%) |
| $35,000 to $49,999 | 72 (3.2%) | 0 (0.0%) |
| $50,000 to $74,999 | 695 (30.9%) | 37 (8.2%) |
| $75,000 to $99,999 | 256 (11.4%) | 219 (48.7%) |
| $100,000 to $149,999 | 582 (25.9%) | 72 (16.0%) |
| $150,000 or more | 491 (21.8%) | 25 (5.6%) |
| Total | 2,251 (100.0%) | 450 (100.0%) |
Monthly Housing Cost Tiers in Laurence Harbor
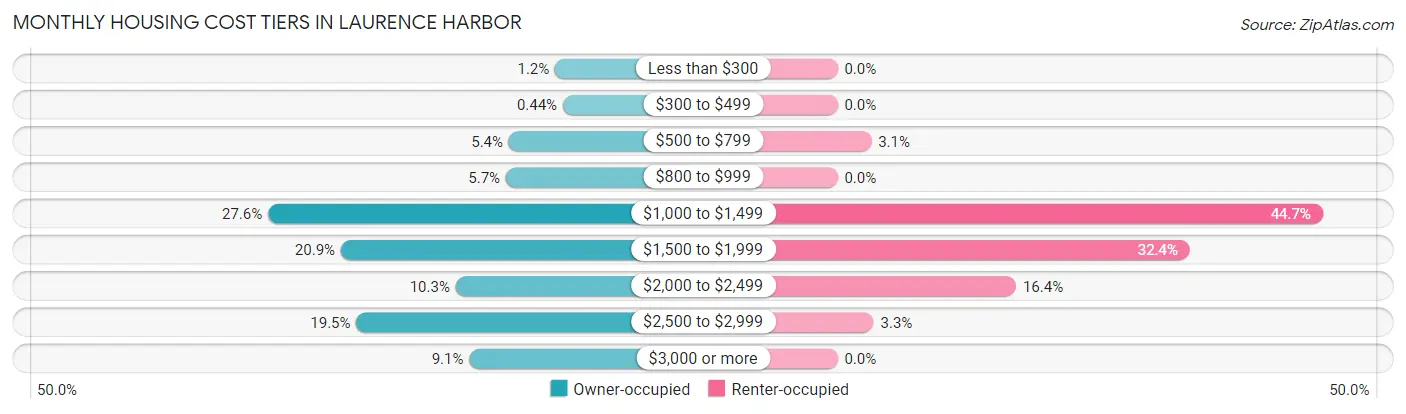
| Monthly Cost | Owner-occupied | Renter-occupied |
| Less than $300 | 26 (1.2%) | 0 (0.0%) |
| $300 to $499 | 10 (0.4%) | 0 (0.0%) |
| $500 to $799 | 122 (5.4%) | 14 (3.1%) |
| $800 to $999 | 128 (5.7%) | 0 (0.0%) |
| $1,000 to $1,499 | 621 (27.6%) | 201 (44.7%) |
| $1,500 to $1,999 | 470 (20.9%) | 146 (32.4%) |
| $2,000 to $2,499 | 232 (10.3%) | 74 (16.4%) |
| $2,500 to $2,999 | 438 (19.5%) | 15 (3.3%) |
| $3,000 or more | 204 (9.1%) | 0 (0.0%) |
| Total | 2,251 (100.0%) | 450 (100.0%) |
Physical Housing Characteristics in Laurence Harbor
Housing Structures in Laurence Harbor
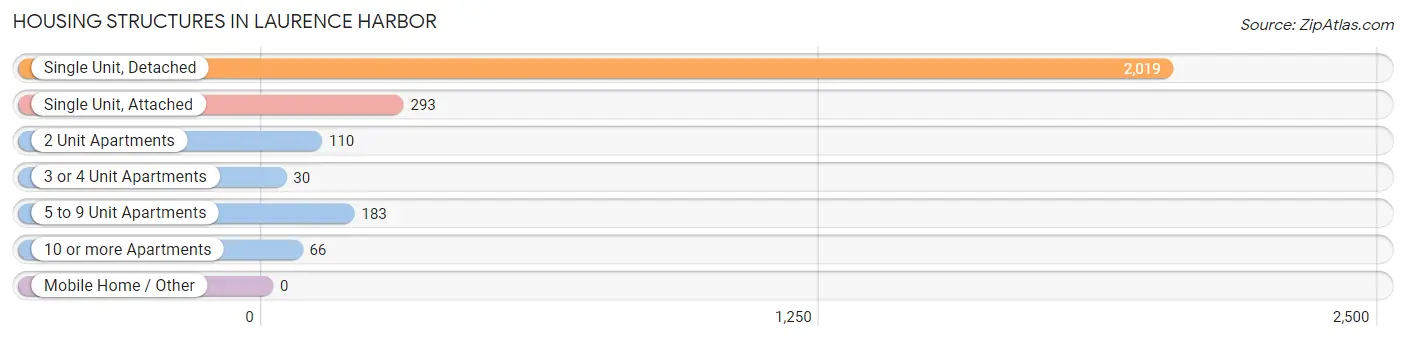
| Structure Type | # Housing Units | % Housing Units |
| Single Unit, Detached | 2,019 | 74.8% |
| Single Unit, Attached | 293 | 10.8% |
| 2 Unit Apartments | 110 | 4.1% |
| 3 or 4 Unit Apartments | 30 | 1.1% |
| 5 to 9 Unit Apartments | 183 | 6.8% |
| 10 or more Apartments | 66 | 2.4% |
| Mobile Home / Other | 0 | 0.0% |
| Total | 2,701 | 100.0% |
Housing Structures by Occupancy in Laurence Harbor
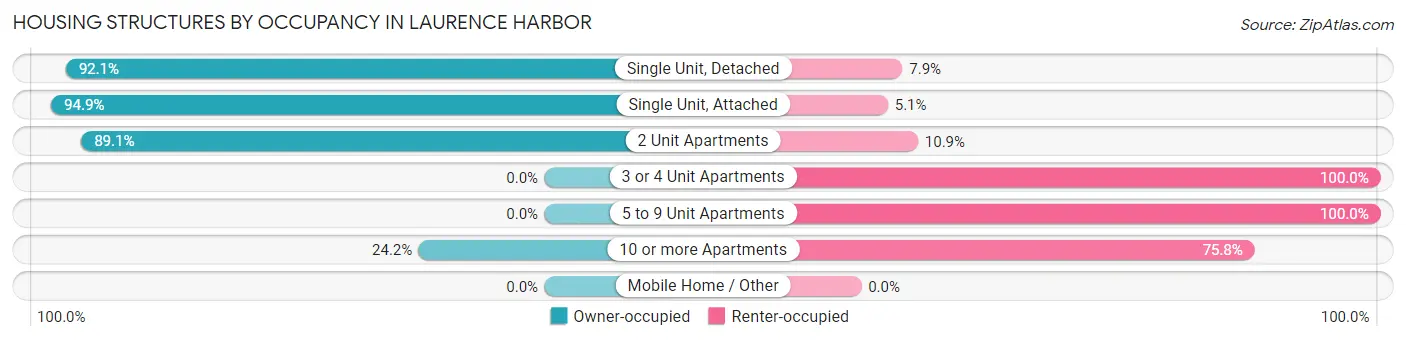
| Structure Type | Owner-occupied | Renter-occupied |
| Single Unit, Detached | 1,859 (92.1%) | 160 (7.9%) |
| Single Unit, Attached | 278 (94.9%) | 15 (5.1%) |
| 2 Unit Apartments | 98 (89.1%) | 12 (10.9%) |
| 3 or 4 Unit Apartments | 0 (0.0%) | 30 (100.0%) |
| 5 to 9 Unit Apartments | 0 (0.0%) | 183 (100.0%) |
| 10 or more Apartments | 16 (24.2%) | 50 (75.8%) |
| Mobile Home / Other | 0 (0.0%) | 0 (0.0%) |
| Total | 2,251 (83.3%) | 450 (16.7%) |
Housing Structures by Number of Rooms in Laurence Harbor
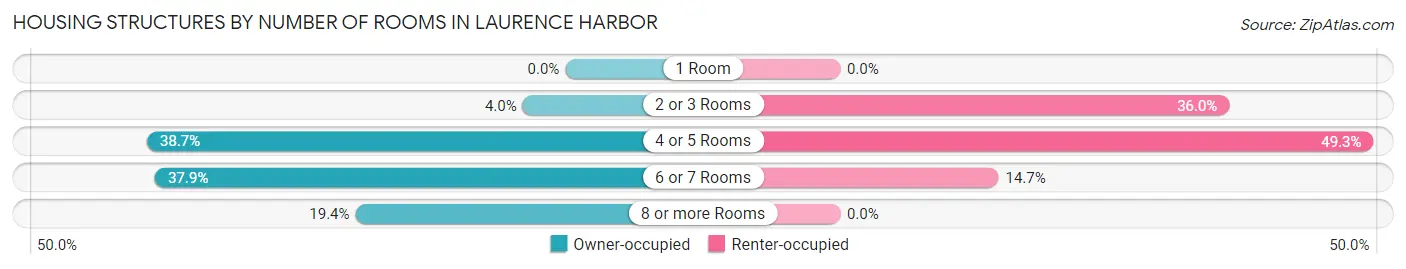
| Number of Rooms | Owner-occupied | Renter-occupied |
| 1 Room | 0 (0.0%) | 0 (0.0%) |
| 2 or 3 Rooms | 89 (4.0%) | 162 (36.0%) |
| 4 or 5 Rooms | 871 (38.7%) | 222 (49.3%) |
| 6 or 7 Rooms | 854 (37.9%) | 66 (14.7%) |
| 8 or more Rooms | 437 (19.4%) | 0 (0.0%) |
| Total | 2,251 (100.0%) | 450 (100.0%) |
Housing Structure by Heating Type in Laurence Harbor

| Heating Type | Owner-occupied | Renter-occupied |
| Utility Gas | 1,972 (87.6%) | 341 (75.8%) |
| Bottled, Tank, or LP Gas | 15 (0.7%) | 0 (0.0%) |
| Electricity | 154 (6.8%) | 109 (24.2%) |
| Fuel Oil or Kerosene | 110 (4.9%) | 0 (0.0%) |
| Coal or Coke | 0 (0.0%) | 0 (0.0%) |
| All other Fuels | 0 (0.0%) | 0 (0.0%) |
| No Fuel Used | 0 (0.0%) | 0 (0.0%) |
| Total | 2,251 (100.0%) | 450 (100.0%) |
Household Vehicle Usage in Laurence Harbor
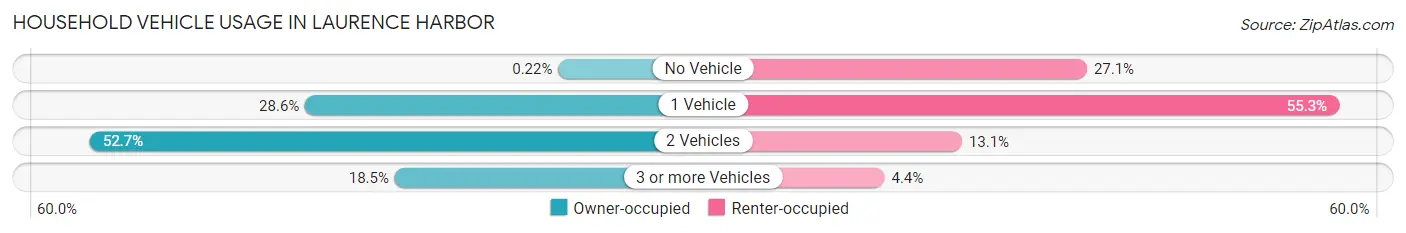
| Vehicles per Household | Owner-occupied | Renter-occupied |
| No Vehicle | 5 (0.2%) | 122 (27.1%) |
| 1 Vehicle | 643 (28.6%) | 249 (55.3%) |
| 2 Vehicles | 1,186 (52.7%) | 59 (13.1%) |
| 3 or more Vehicles | 417 (18.5%) | 20 (4.4%) |
| Total | 2,251 (100.0%) | 450 (100.0%) |
Real Estate & Mortgages in Laurence Harbor
Real Estate and Mortgage Overview in Laurence Harbor
| Characteristic | Without Mortgage | With Mortgage |
| Housing Units | 618 | 1,633 |
| Median Property Value | $362,600 | $296,700 |
| Median Household Income | $80,156 | $422 |
| Monthly Housing Costs | $1,043 | $204 |
| Real Estate Taxes | $7,016 | $42 |
Property Value by Mortgage Status in Laurence Harbor
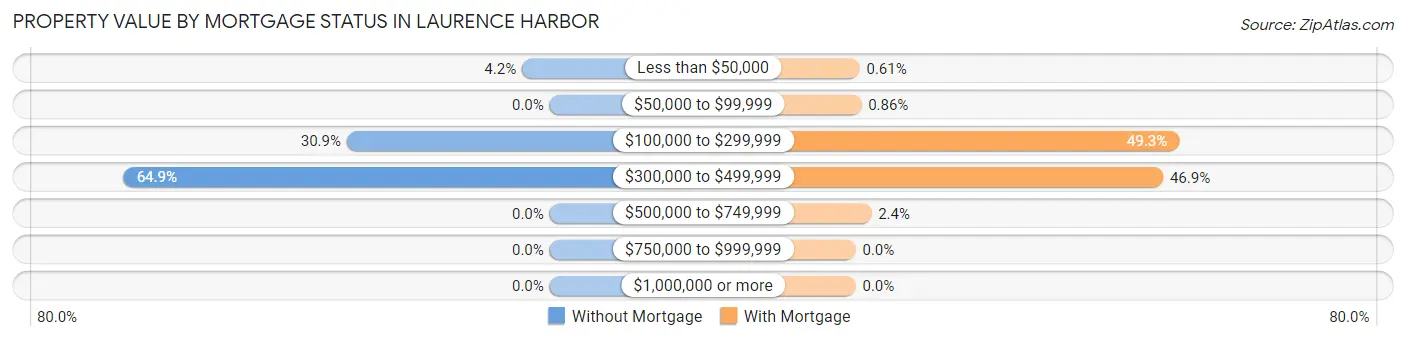
| Property Value | Without Mortgage | With Mortgage |
| Less than $50,000 | 26 (4.2%) | 10 (0.6%) |
| $50,000 to $99,999 | 0 (0.0%) | 14 (0.9%) |
| $100,000 to $299,999 | 191 (30.9%) | 805 (49.3%) |
| $300,000 to $499,999 | 401 (64.9%) | 765 (46.9%) |
| $500,000 to $749,999 | 0 (0.0%) | 39 (2.4%) |
| $750,000 to $999,999 | 0 (0.0%) | 0 (0.0%) |
| $1,000,000 or more | 0 (0.0%) | 0 (0.0%) |
| Total | 618 (100.0%) | 1,633 (100.0%) |
Household Income by Mortgage Status in Laurence Harbor
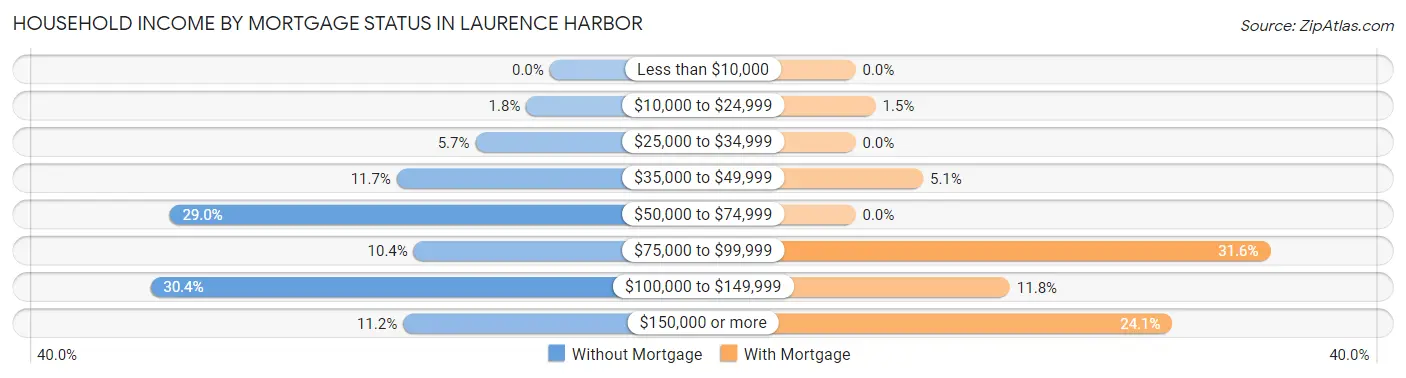
| Household Income | Without Mortgage | With Mortgage |
| Less than $10,000 | 0 (0.0%) | 0 (0.0%) |
| $10,000 to $24,999 | 11 (1.8%) | 25 (1.5%) |
| $25,000 to $34,999 | 35 (5.7%) | 0 (0.0%) |
| $35,000 to $49,999 | 72 (11.7%) | 84 (5.1%) |
| $50,000 to $74,999 | 179 (29.0%) | 0 (0.0%) |
| $75,000 to $99,999 | 64 (10.4%) | 516 (31.6%) |
| $100,000 to $149,999 | 188 (30.4%) | 192 (11.8%) |
| $150,000 or more | 69 (11.2%) | 394 (24.1%) |
| Total | 618 (100.0%) | 1,633 (100.0%) |
Property Value to Household Income Ratio in Laurence Harbor
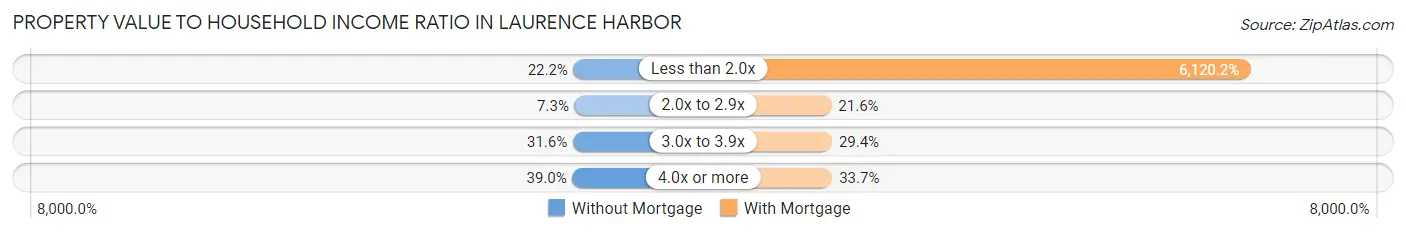
| Value-to-Income Ratio | Without Mortgage | With Mortgage |
| Less than 2.0x | 137 (22.2%) | 99,943 (6,120.2%) |
| 2.0x to 2.9x | 45 (7.3%) | 353 (21.6%) |
| 3.0x to 3.9x | 195 (31.6%) | 480 (29.4%) |
| 4.0x or more | 241 (39.0%) | 550 (33.7%) |
| Total | 618 (100.0%) | 1,633 (100.0%) |
Real Estate Taxes by Mortgage Status in Laurence Harbor
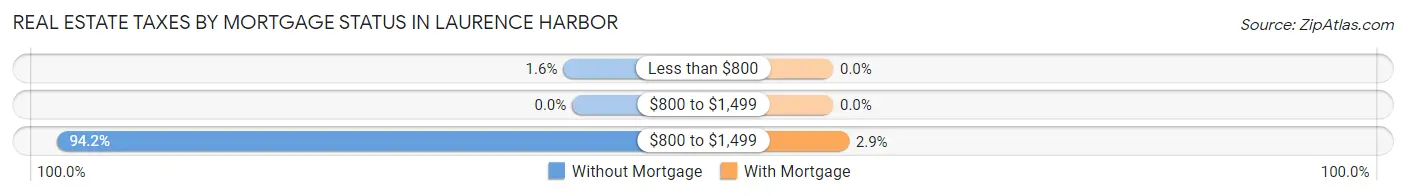
| Property Taxes | Without Mortgage | With Mortgage |
| Less than $800 | 10 (1.6%) | 0 (0.0%) |
| $800 to $1,499 | 0 (0.0%) | 0 (0.0%) |
| $800 to $1,499 | 582 (94.2%) | 47 (2.9%) |
| Total | 618 (100.0%) | 1,633 (100.0%) |
Health & Disability in Laurence Harbor
Health Insurance Coverage by Age in Laurence Harbor
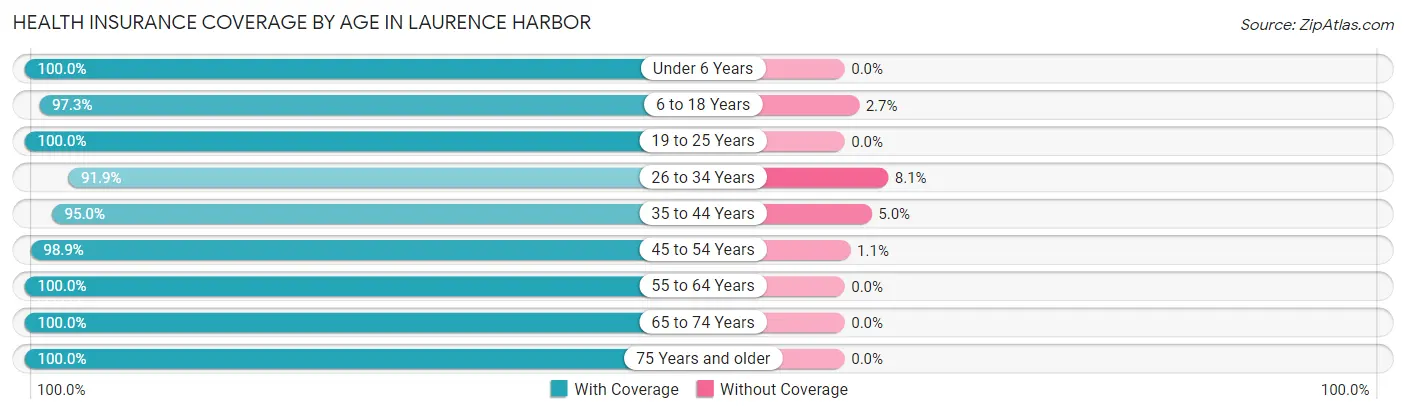
| Age Bracket | With Coverage | Without Coverage |
| Under 6 Years | 623 (100.0%) | 0 (0.0%) |
| 6 to 18 Years | 579 (97.3%) | 16 (2.7%) |
| 19 to 25 Years | 288 (100.0%) | 0 (0.0%) |
| 26 to 34 Years | 803 (91.9%) | 71 (8.1%) |
| 35 to 44 Years | 622 (95.0%) | 33 (5.0%) |
| 45 to 54 Years | 1,275 (98.9%) | 14 (1.1%) |
| 55 to 64 Years | 1,077 (100.0%) | 0 (0.0%) |
| 65 to 74 Years | 670 (100.0%) | 0 (0.0%) |
| 75 Years and older | 347 (100.0%) | 0 (0.0%) |
| Total | 6,284 (97.9%) | 134 (2.1%) |
Health Insurance Coverage by Citizenship Status in Laurence Harbor

| Citizenship Status | With Coverage | Without Coverage |
| Native Born | 623 (100.0%) | 0 (0.0%) |
| Foreign Born, Citizen | 579 (97.3%) | 16 (2.7%) |
| Foreign Born, not a Citizen | 288 (100.0%) | 0 (0.0%) |
Health Insurance Coverage by Household Income in Laurence Harbor
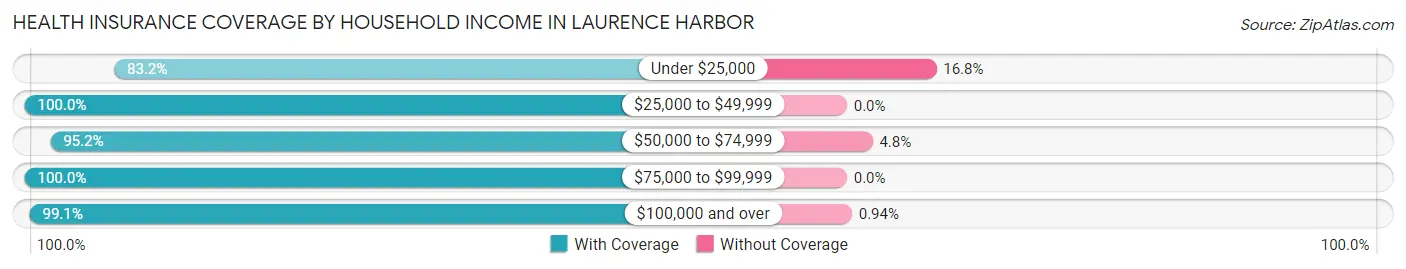
| Household Income | With Coverage | Without Coverage |
| Under $25,000 | 149 (83.2%) | 30 (16.8%) |
| $25,000 to $49,999 | 384 (100.0%) | 0 (0.0%) |
| $50,000 to $74,999 | 1,404 (95.2%) | 71 (4.8%) |
| $75,000 to $99,999 | 850 (100.0%) | 0 (0.0%) |
| $100,000 and over | 3,492 (99.1%) | 33 (0.9%) |
Public vs Private Health Insurance Coverage by Age in Laurence Harbor
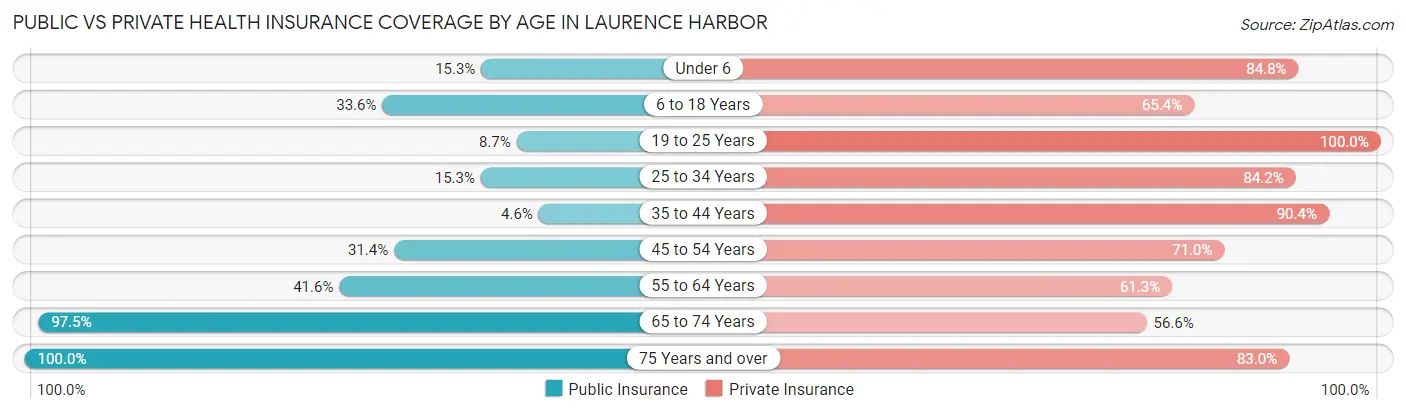
| Age Bracket | Public Insurance | Private Insurance |
| Under 6 | 95 (15.2%) | 528 (84.8%) |
| 6 to 18 Years | 200 (33.6%) | 389 (65.4%) |
| 19 to 25 Years | 25 (8.7%) | 288 (100.0%) |
| 25 to 34 Years | 134 (15.3%) | 736 (84.2%) |
| 35 to 44 Years | 30 (4.6%) | 592 (90.4%) |
| 45 to 54 Years | 405 (31.4%) | 915 (71.0%) |
| 55 to 64 Years | 448 (41.6%) | 660 (61.3%) |
| 65 to 74 Years | 653 (97.5%) | 379 (56.6%) |
| 75 Years and over | 347 (100.0%) | 288 (83.0%) |
| Total | 2,337 (36.4%) | 4,775 (74.4%) |
Disability Status by Sex by Age in Laurence Harbor
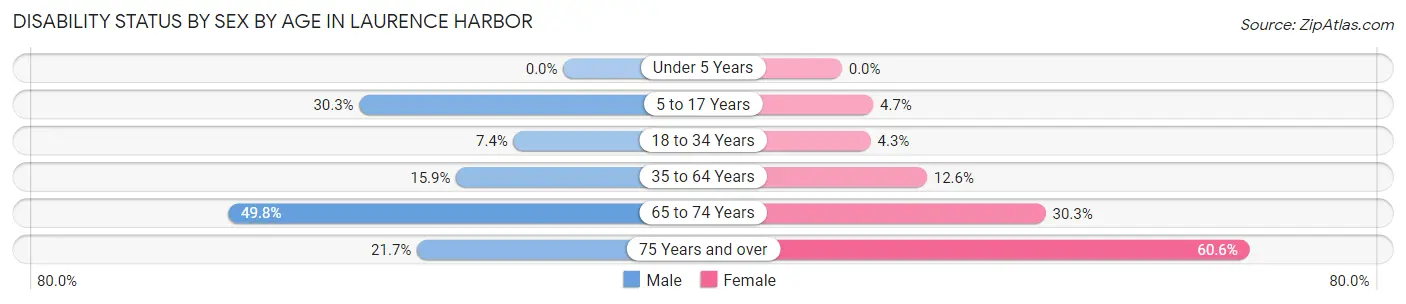
| Age Bracket | Male | Female |
| Under 5 Years | 0 (0.0%) | 0 (0.0%) |
| 5 to 17 Years | 96 (30.3%) | 22 (4.6%) |
| 18 to 34 Years | 46 (7.4%) | 25 (4.3%) |
| 35 to 64 Years | 246 (15.9%) | 186 (12.6%) |
| 65 to 74 Years | 118 (49.8%) | 131 (30.2%) |
| 75 Years and over | 28 (21.7%) | 132 (60.6%) |
Disability Class by Sex by Age in Laurence Harbor
Disability Class: Hearing Difficulty
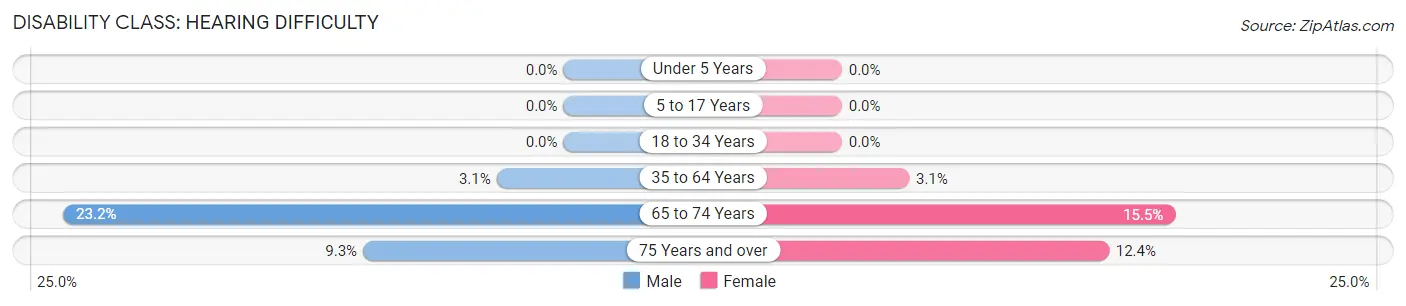
| Age Bracket | Male | Female |
| Under 5 Years | 0 (0.0%) | 0 (0.0%) |
| 5 to 17 Years | 0 (0.0%) | 0 (0.0%) |
| 18 to 34 Years | 0 (0.0%) | 0 (0.0%) |
| 35 to 64 Years | 48 (3.1%) | 46 (3.1%) |
| 65 to 74 Years | 55 (23.2%) | 67 (15.5%) |
| 75 Years and over | 12 (9.3%) | 27 (12.4%) |
Disability Class: Vision Difficulty
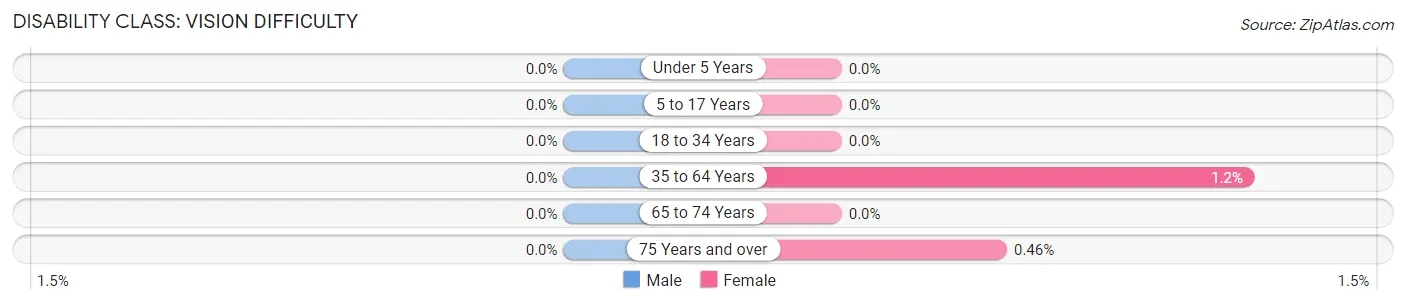
| Age Bracket | Male | Female |
| Under 5 Years | 0 (0.0%) | 0 (0.0%) |
| 5 to 17 Years | 0 (0.0%) | 0 (0.0%) |
| 18 to 34 Years | 0 (0.0%) | 0 (0.0%) |
| 35 to 64 Years | 0 (0.0%) | 17 (1.1%) |
| 65 to 74 Years | 0 (0.0%) | 0 (0.0%) |
| 75 Years and over | 0 (0.0%) | 1 (0.5%) |
Disability Class: Cognitive Difficulty
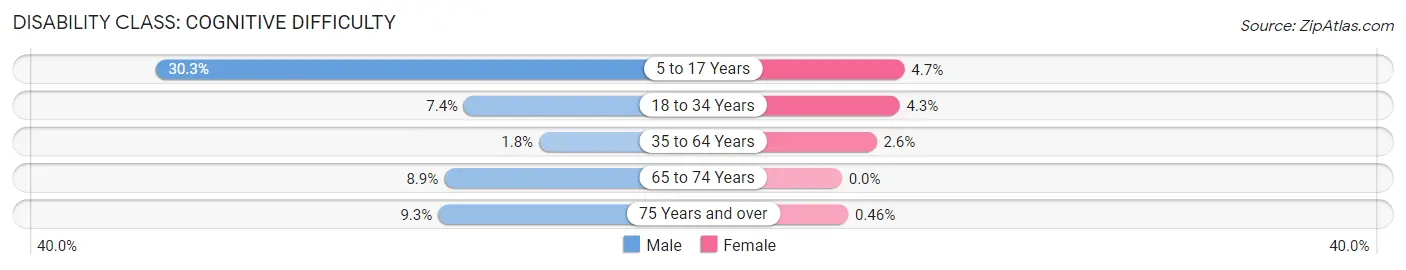
| Age Bracket | Male | Female |
| 5 to 17 Years | 96 (30.3%) | 22 (4.6%) |
| 18 to 34 Years | 46 (7.4%) | 25 (4.3%) |
| 35 to 64 Years | 28 (1.8%) | 38 (2.6%) |
| 65 to 74 Years | 21 (8.9%) | 0 (0.0%) |
| 75 Years and over | 12 (9.3%) | 1 (0.5%) |
Disability Class: Ambulatory Difficulty
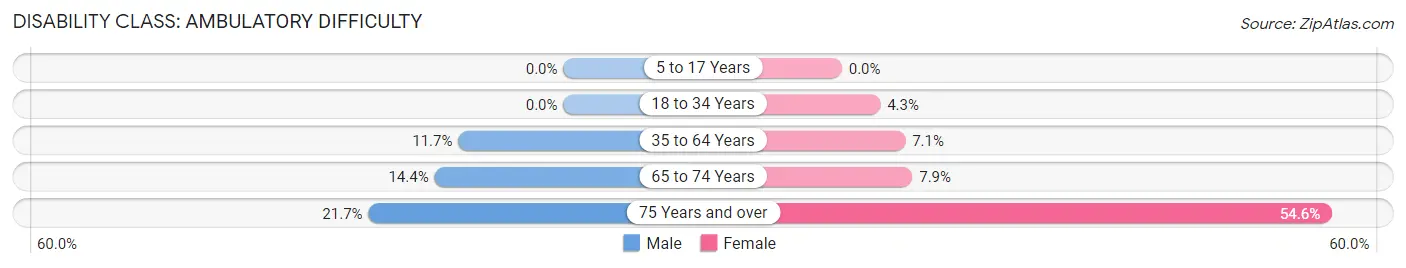
| Age Bracket | Male | Female |
| 5 to 17 Years | 0 (0.0%) | 0 (0.0%) |
| 18 to 34 Years | 0 (0.0%) | 25 (4.3%) |
| 35 to 64 Years | 181 (11.7%) | 104 (7.1%) |
| 65 to 74 Years | 34 (14.3%) | 34 (7.9%) |
| 75 Years and over | 28 (21.7%) | 119 (54.6%) |
Disability Class: Self-Care Difficulty
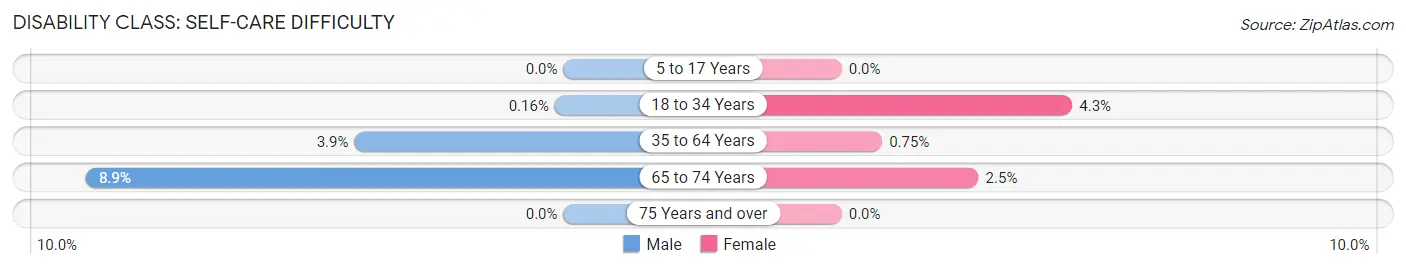
| Age Bracket | Male | Female |
| 5 to 17 Years | 0 (0.0%) | 0 (0.0%) |
| 18 to 34 Years | 1 (0.2%) | 25 (4.3%) |
| 35 to 64 Years | 60 (3.9%) | 11 (0.7%) |
| 65 to 74 Years | 21 (8.9%) | 11 (2.5%) |
| 75 Years and over | 0 (0.0%) | 0 (0.0%) |
Technology Access in Laurence Harbor
Computing Device Access in Laurence Harbor
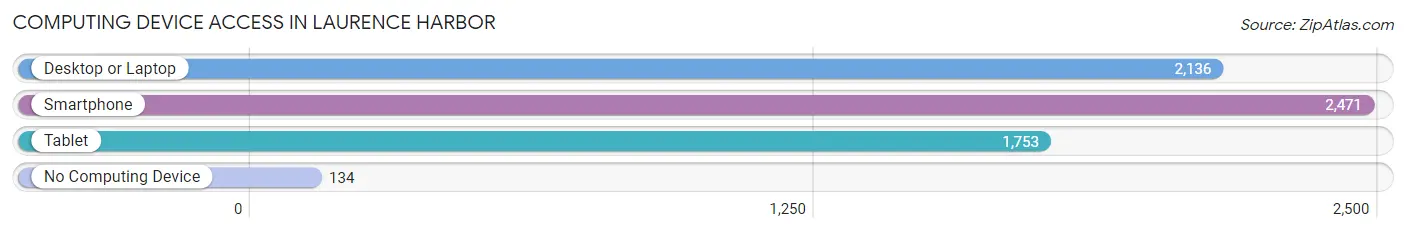
| Device Type | # Households | % Households |
| Desktop or Laptop | 2,136 | 79.1% |
| Smartphone | 2,471 | 91.5% |
| Tablet | 1,753 | 64.9% |
| No Computing Device | 134 | 5.0% |
| Total | 2,701 | 100.0% |
Internet Access in Laurence Harbor
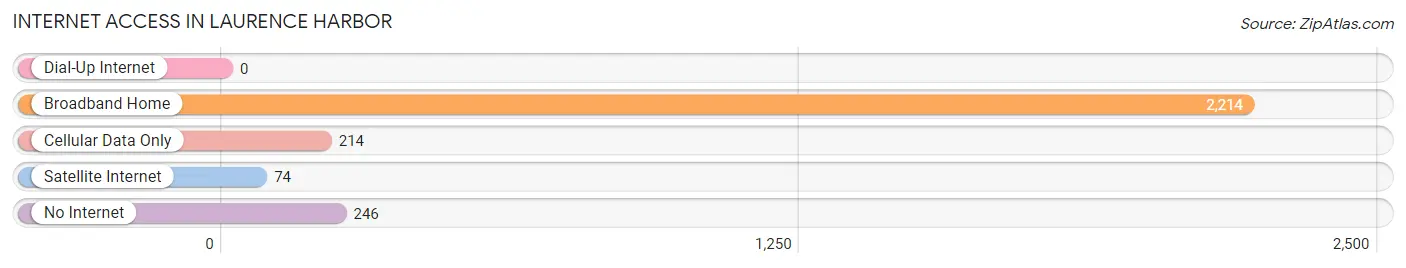
| Internet Type | # Households | % Households |
| Dial-Up Internet | 0 | 0.0% |
| Broadband Home | 2,214 | 82.0% |
| Cellular Data Only | 214 | 7.9% |
| Satellite Internet | 74 | 2.7% |
| No Internet | 246 | 9.1% |
| Total | 2,701 | 100.0% |
Laurence Harbor Summary
Laurence Harbor is a small unincorporated community located in Old Bridge Township, in Middlesex County, New Jersey. It is situated on the Raritan Bay, and is part of the New York metropolitan area. The community is bordered by the towns of South Amboy, Sayreville, and Matawan.
History
Laurence Harbor was originally part of South Amboy, and was known as Laurence Harbor Beach. It was named after the Laurence family, who were among the first settlers in the area. The family owned a large tract of land that stretched from the bay to the Raritan River. The area was first developed in the late 19th century, when a number of summer homes were built along the shoreline.
In the early 20th century, the area began to be developed as a residential community. The first homes were built in the 1920s, and the community grew steadily over the next few decades. By the 1950s, Laurence Harbor had become a popular summer destination for families from New York City and the surrounding area.
In the late 1960s, the community was incorporated as an independent municipality. However, in 1975, it was annexed by Old Bridge Township.
Geography
Laurence Harbor is located in central New Jersey, on the Raritan Bay. It is bordered by the towns of South Amboy, Sayreville, and Matawan. The community is situated on a peninsula, with the bay to the east and the Raritan River to the west.
The area is mostly flat, with some low hills in the northern part of the community. The climate is humid subtropical, with hot, humid summers and cold, wet winters.
Economy
The economy of Laurence Harbor is largely based on tourism and recreation. The community is home to several marinas, which attract visitors from all over the region. There are also several restaurants and bars in the area, as well as a few small shops.
The community is also home to a number of light industrial businesses, including a plastics factory and a printing company.
Demographics
As of the 2010 census, the population of Laurence Harbor was 8,945. The racial makeup of the community was 79.3% White, 11.2% African American, 0.3% Native American, 3.2% Asian, and 4.9% from other races. Hispanic or Latino of any race were 8.7% of the population.
The median household income in Laurence Harbor was $63,917, and the median family income was $76,917. The per capita income was $30,917. About 5.3% of families and 7.2% of the population were below the poverty line.
The population of Laurence Harbor is largely made up of families, with a median age of 43. The community is also home to a large number of retirees, with a median age of 62. The majority of the population is of Italian descent, with a significant minority of Irish and Polish ancestry.
Common Questions
What is the Total Population of Laurence Harbor?
Total Population of Laurence Harbor is 6,418.
What is the Total Male Population of Laurence Harbor?
Total Male Population of Laurence Harbor is 3,017.
What is the Total Female Population of Laurence Harbor?
Total Female Population of Laurence Harbor is 3,401.
What is the Ratio of Males per 100 Females in Laurence Harbor?
There are 88.71 Males per 100 Females in Laurence Harbor.
What is the Ratio of Females per 100 Males in Laurence Harbor?
There are 112.73 Females per 100 Males in Laurence Harbor.
What is the Median Population Age in Laurence Harbor?
Median Population Age in Laurence Harbor is 46.2 Years.
What is the Average Family Size in Laurence Harbor
Average Family Size in Laurence Harbor is 2.9 People.
What is the Average Household Size in Laurence Harbor
Average Household Size in Laurence Harbor is 2.4 People.
What is Per Capita Income in Laurence Harbor?
Per Capita income in Laurence Harbor is $47,764.
What is the Median Family Income in Laurence Harbor?
Median Family Income in Laurence Harbor is $109,909.
What is the Median Household income in Laurence Harbor?
Median Household Income in Laurence Harbor is $95,399.
What is Income or Wage Gap in Laurence Harbor?
Income or Wage Gap in Laurence Harbor is 20.7%.
Women in Laurence Harbor earn 79.3 cents for every dollar earned by a man.
What is Family Income Deficit in Laurence Harbor?
Family Income Deficit in Laurence Harbor is $6,805.
Families that are below poverty line in Laurence Harbor earn $6,805 less on average than the poverty threshold level.
What is Inequality or Gini Index in Laurence Harbor?
Inequality or Gini Index in Laurence Harbor is 0.35.
How Large is the Labor Force in Laurence Harbor?
There are 3,694 People in the Labor Forcein in Laurence Harbor.
What is the Percentage of People in the Labor Force in Laurence Harbor?
68.0% of People are in the Labor Force in Laurence Harbor.
What is the Unemployment Rate in Laurence Harbor?
Unemployment Rate in Laurence Harbor is 7.8%.