Mineral Springs, NC
Mineral Springs Map
Mineral Springs Overview
3,185
TOTAL POPULATION
1,659
MALE POPULATION
1,526
FEMALE POPULATION
108.72
MALES / 100 FEMALES
91.98
FEMALES / 100 MALES
47.8
MEDIAN AGE
3.0
AVG FAMILY SIZE
2.7
AVG HOUSEHOLD SIZE
$46,695
PER CAPITA INCOME
$109,740
AVG FAMILY INCOME
$94,113
AVG HOUSEHOLD INCOME
14.8%
WAGE / INCOME GAP [ % ]
85.2¢/ $1
WAGE / INCOME GAP [ $ ]
0.40
INEQUALITY / GINI INDEX
1,889
LABOR FORCE [ PEOPLE ]
68.5%
PERCENT IN LABOR FORCE
5.2%
UNEMPLOYMENT RATE
Mineral Springs Zip Codes
Mineral Springs Area Codes
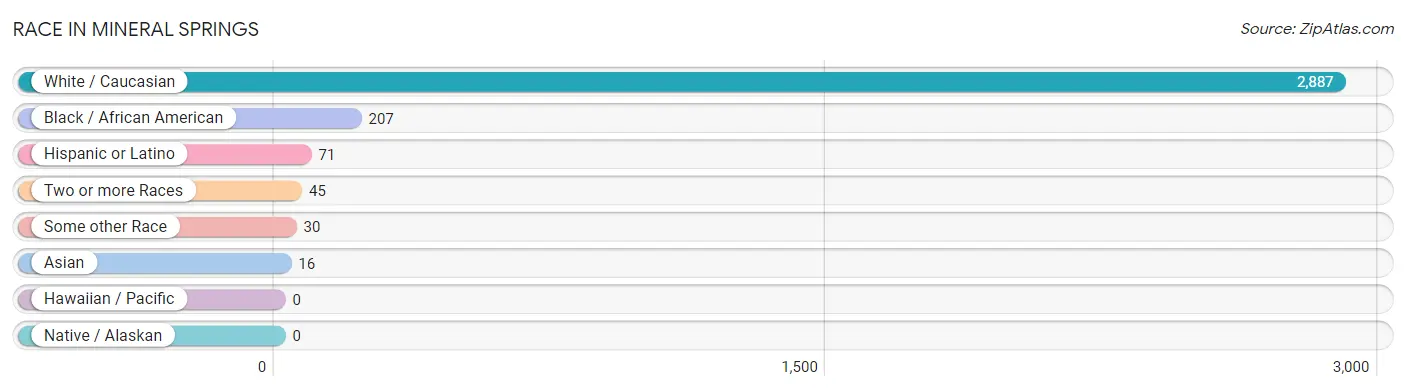
Race in Mineral Springs
The most populous races in Mineral Springs are White / Caucasian (2,887 | 90.6%), Black / African American (207 | 6.5%), and Hispanic or Latino (71 | 2.2%).
| Race | # Population | % Population |
| Asian | 16 | 0.5% |
| Black / African American | 207 | 6.5% |
| Hawaiian / Pacific | 0 | 0.0% |
| Hispanic or Latino | 71 | 2.2% |
| Native / Alaskan | 0 | 0.0% |
| White / Caucasian | 2,887 | 90.6% |
| Two or more Races | 45 | 1.4% |
| Some other Race | 30 | 0.9% |
| Total | 3,185 | 100.0% |
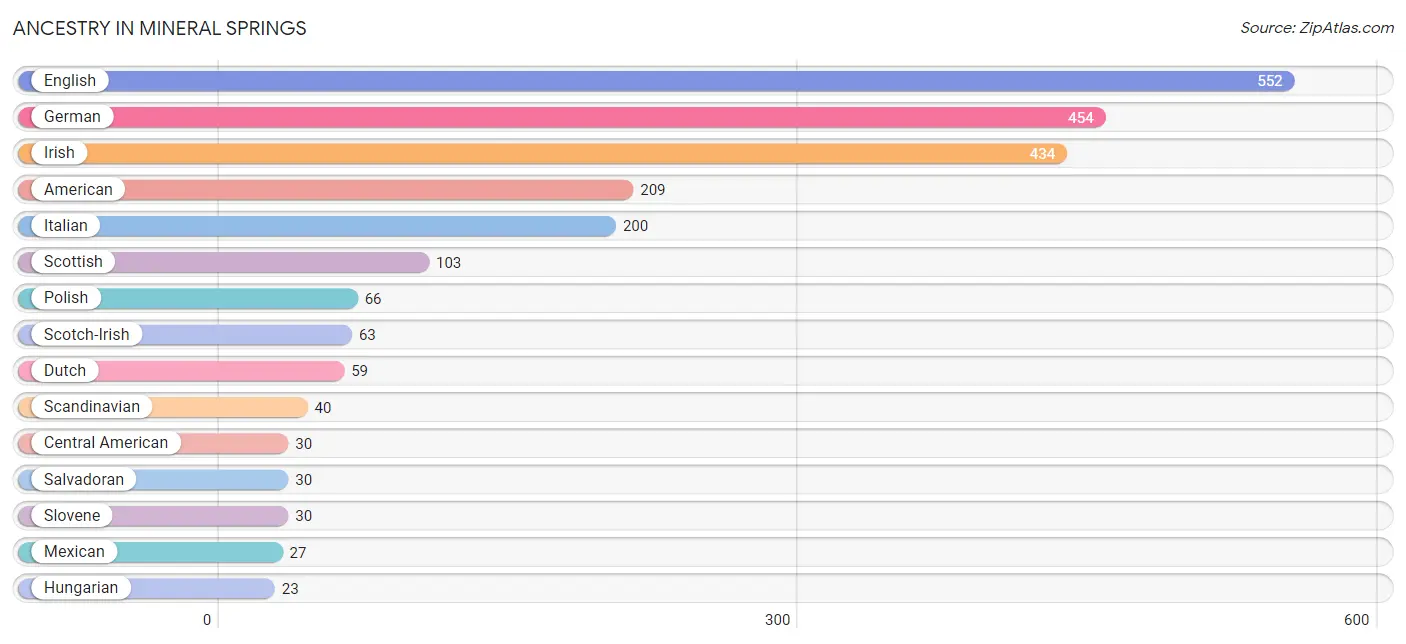
Ancestry in Mineral Springs
The most populous ancestries reported in Mineral Springs are English (552 | 17.3%), German (454 | 14.2%), Irish (434 | 13.6%), American (209 | 6.6%), and Italian (200 | 6.3%), together accounting for 58.0% of all Mineral Springs residents.
| Ancestry | # Population | % Population |
| African | 5 | 0.2% |
| American | 209 | 6.6% |
| Armenian | 8 | 0.3% |
| Burmese | 18 | 0.6% |
| Celtic | 1 | 0.0% |
| Central American | 30 | 0.9% |
| Cherokee | 12 | 0.4% |
| Cuban | 3 | 0.1% |
| Cypriot | 6 | 0.2% |
| Czech | 12 | 0.4% |
| Danish | 1 | 0.0% |
| Dutch | 59 | 1.8% |
| English | 552 | 17.3% |
| European | 12 | 0.4% |
| Finnish | 12 | 0.4% |
| French | 18 | 0.6% |
| German | 454 | 14.2% |
| Greek | 9 | 0.3% |
| Hungarian | 23 | 0.7% |
| Irish | 434 | 13.6% |
| Italian | 200 | 6.3% |
| Jamaican | 5 | 0.2% |
| Latvian | 6 | 0.2% |
| Mexican | 27 | 0.9% |
| Peruvian | 11 | 0.4% |
| Polish | 66 | 2.1% |
| Salvadoran | 30 | 0.9% |
| Scandinavian | 40 | 1.3% |
| Scotch-Irish | 63 | 2.0% |
| Scottish | 103 | 3.2% |
| Slovak | 16 | 0.5% |
| Slovene | 30 | 0.9% |
| South American | 11 | 0.4% |
| Subsaharan African | 5 | 0.2% |
| Swedish | 5 | 0.2% |
| Swiss | 6 | 0.2% |
| Thai | 11 | 0.4% |
| Trinidadian and Tobagonian | 8 | 0.3% |
| Ukrainian | 8 | 0.3% |
| Welsh | 9 | 0.3% |
| Yugoslavian | 6 | 0.2% | View All 41 Rows |
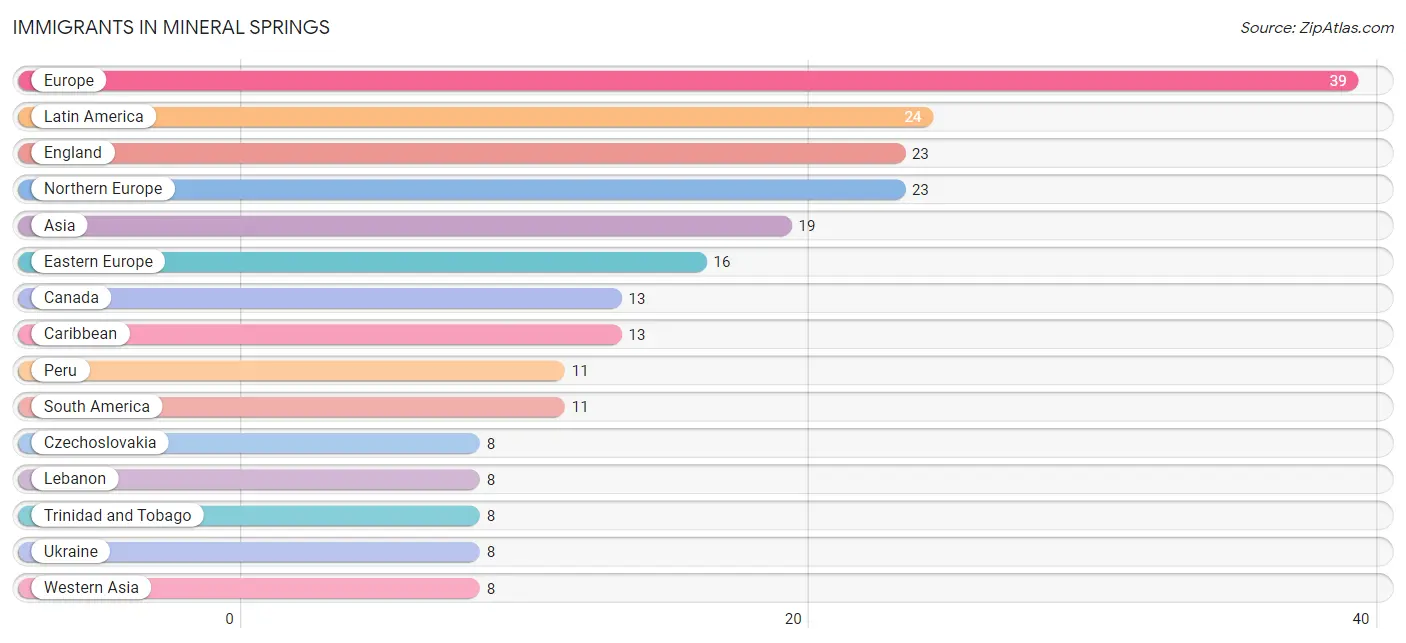
Immigrants in Mineral Springs
The most numerous immigrant groups reported in Mineral Springs came from Europe (39 | 1.2%), Latin America (24 | 0.7%), England (23 | 0.7%), Northern Europe (23 | 0.7%), and Asia (19 | 0.6%), together accounting for 4.0% of all Mineral Springs residents.
| Immigration Origin | # Population | % Population |
| Asia | 19 | 0.6% |
| Canada | 13 | 0.4% |
| Caribbean | 13 | 0.4% |
| Czechoslovakia | 8 | 0.3% |
| Eastern Asia | 5 | 0.2% |
| Eastern Europe | 16 | 0.5% |
| England | 23 | 0.7% |
| Europe | 39 | 1.2% |
| India | 6 | 0.2% |
| Jamaica | 5 | 0.2% |
| Korea | 5 | 0.2% |
| Latin America | 24 | 0.7% |
| Lebanon | 8 | 0.3% |
| Northern Europe | 23 | 0.7% |
| Peru | 11 | 0.4% |
| South America | 11 | 0.4% |
| South Central Asia | 6 | 0.2% |
| Trinidad and Tobago | 8 | 0.3% |
| Ukraine | 8 | 0.3% |
| Western Asia | 8 | 0.3% | View All 20 Rows |
Sex and Age in Mineral Springs
Sex and Age in Mineral Springs
The most populous age groups in Mineral Springs are 50 to 54 Years (228 | 13.7%) for men and 50 to 54 Years (178 | 11.7%) for women.
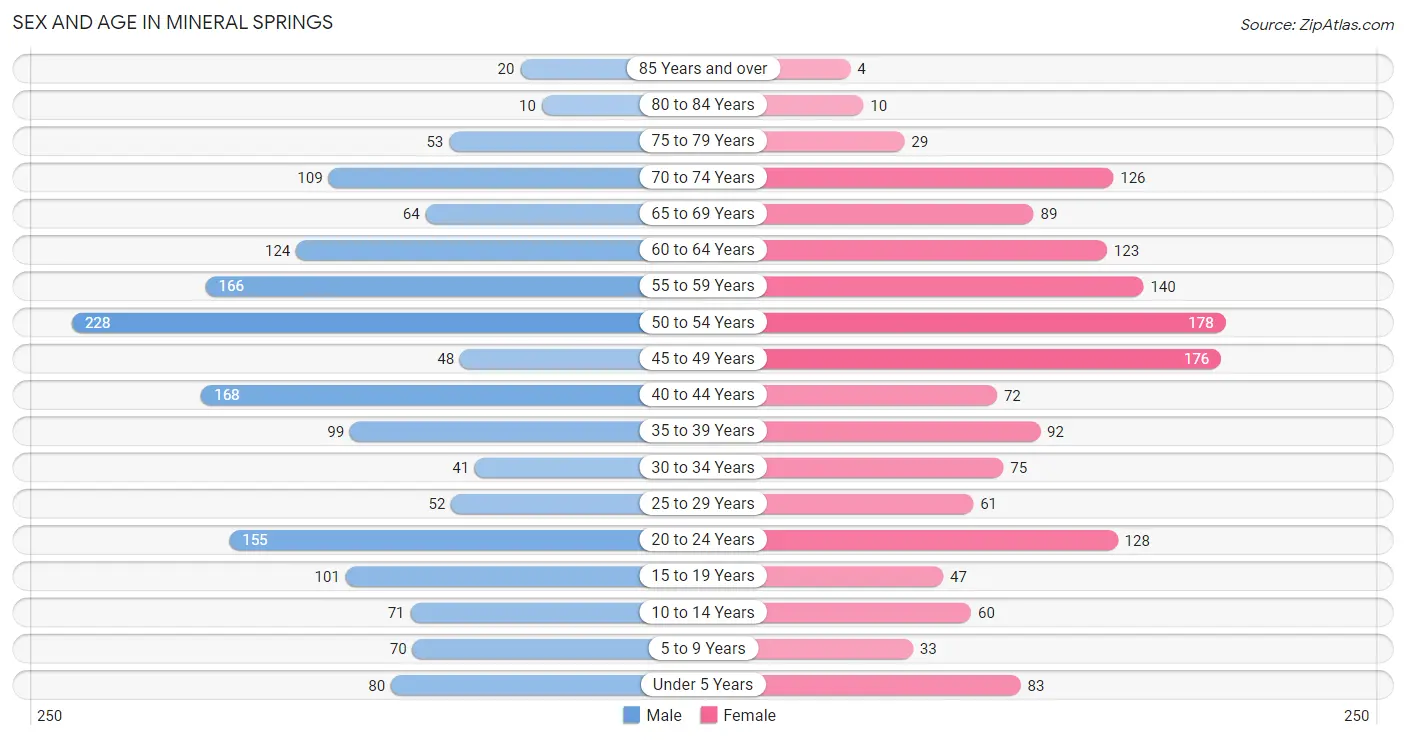
| Age Bracket | Male | Female |
| Under 5 Years | 80 (4.8%) | 83 (5.4%) |
| 5 to 9 Years | 70 (4.2%) | 33 (2.2%) |
| 10 to 14 Years | 71 (4.3%) | 60 (3.9%) |
| 15 to 19 Years | 101 (6.1%) | 47 (3.1%) |
| 20 to 24 Years | 155 (9.3%) | 128 (8.4%) |
| 25 to 29 Years | 52 (3.1%) | 61 (4.0%) |
| 30 to 34 Years | 41 (2.5%) | 75 (4.9%) |
| 35 to 39 Years | 99 (6.0%) | 92 (6.0%) |
| 40 to 44 Years | 168 (10.1%) | 72 (4.7%) |
| 45 to 49 Years | 48 (2.9%) | 176 (11.5%) |
| 50 to 54 Years | 228 (13.7%) | 178 (11.7%) |
| 55 to 59 Years | 166 (10.0%) | 140 (9.2%) |
| 60 to 64 Years | 124 (7.5%) | 123 (8.1%) |
| 65 to 69 Years | 64 (3.9%) | 89 (5.8%) |
| 70 to 74 Years | 109 (6.6%) | 126 (8.3%) |
| 75 to 79 Years | 53 (3.2%) | 29 (1.9%) |
| 80 to 84 Years | 10 (0.6%) | 10 (0.7%) |
| 85 Years and over | 20 (1.2%) | 4 (0.3%) |
| Total | 1,659 (100.0%) | 1,526 (100.0%) |
Families and Households in Mineral Springs
Median Family Size in Mineral Springs
The median family size in Mineral Springs is 2.95 persons per family, with married-couple families (865 | 92.1%) accounting for the largest median family size of 2.99 persons per family. On the other hand, single male/father families (49 | 5.2%) represent the smallest median family size with 2.51 persons per family.
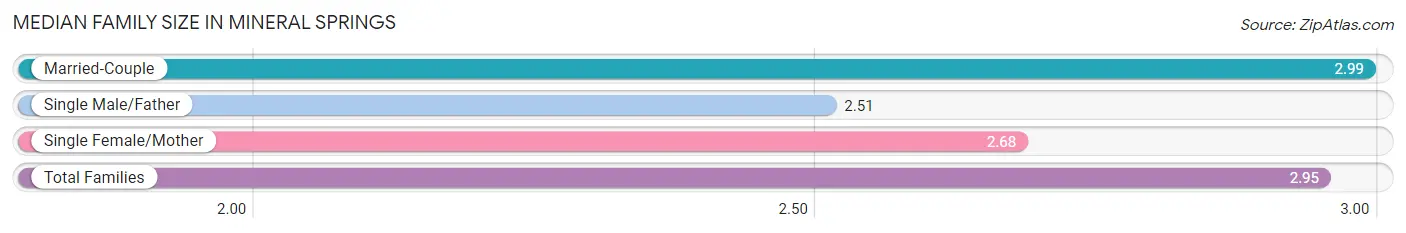
| Family Type | # Families | Family Size |
| Married-Couple | 865 (92.1%) | 2.99 |
| Single Male/Father | 49 (5.2%) | 2.51 |
| Single Female/Mother | 25 (2.7%) | 2.68 |
| Total Families | 939 (100.0%) | 2.95 |
Median Household Size in Mineral Springs
The median household size in Mineral Springs is 2.71 persons per household, with single male/father households (49 | 4.2%) accounting for the largest median household size of 3.22 persons per household. non-family households (237 | 20.2%) represent the smallest median household size with 1.42 persons per household.
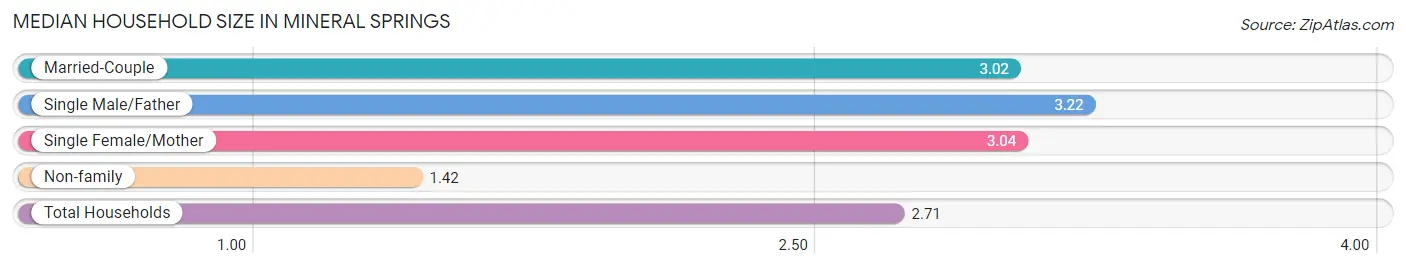
| Household Type | # Households | Household Size |
| Married-Couple | 865 (73.6%) | 3.02 |
| Single Male/Father | 49 (4.2%) | 3.22 |
| Single Female/Mother | 25 (2.1%) | 3.04 |
| Non-family | 237 (20.2%) | 1.42 |
| Total Households | 1,176 (100.0%) | 2.71 |
Household Size by Marriage Status in Mineral Springs
Out of a total of 1,176 households in Mineral Springs, 939 (79.8%) are family households, while 237 (20.2%) are nonfamily households. The most numerous type of family households are 2-person households, comprising 545, and the most common type of nonfamily households are 1-person households, comprising 173.
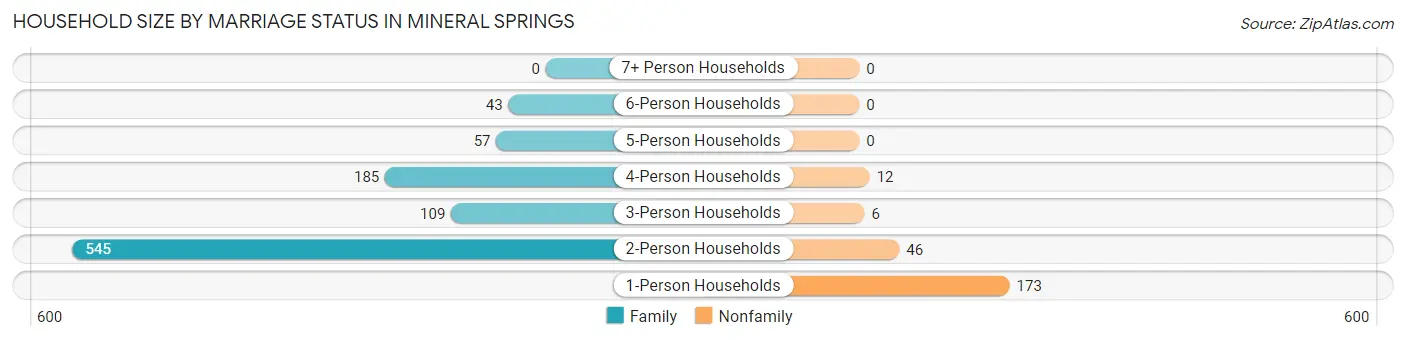
| Household Size | Family Households | Nonfamily Households |
| 1-Person Households | - | 173 (14.7%) |
| 2-Person Households | 545 (46.3%) | 46 (3.9%) |
| 3-Person Households | 109 (9.3%) | 6 (0.5%) |
| 4-Person Households | 185 (15.7%) | 12 (1.0%) |
| 5-Person Households | 57 (4.9%) | 0 (0.0%) |
| 6-Person Households | 43 (3.7%) | 0 (0.0%) |
| 7+ Person Households | 0 (0.0%) | 0 (0.0%) |
| Total | 939 (79.8%) | 237 (20.2%) |
Female Fertility in Mineral Springs
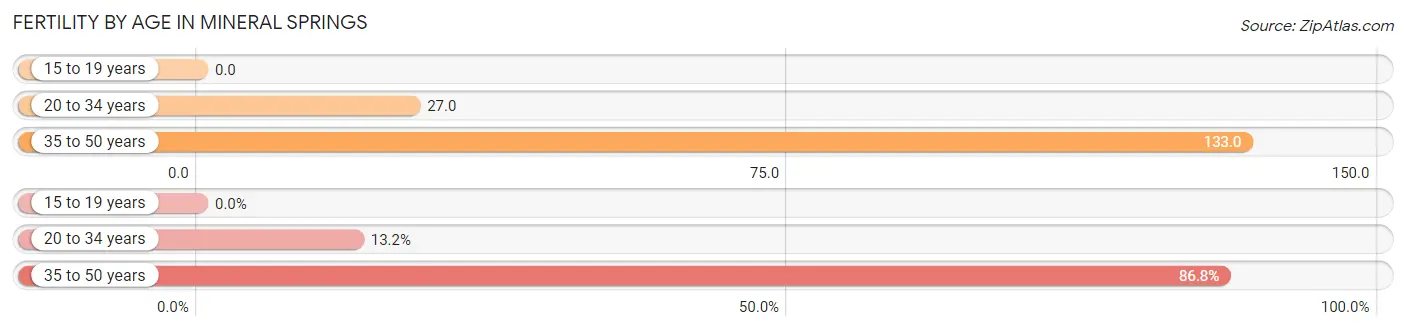
Fertility by Age in Mineral Springs
Average fertility rate in Mineral Springs is 81.0 births per 1,000 women. Women in the age bracket of 35 to 50 years have the highest fertility rate with 133.0 births per 1,000 women. Women in the age bracket of 35 to 50 years acount for 86.8% of all women with births.
| Age Bracket | Women with Births | Births / 1,000 Women |
| 15 to 19 years | 0 (0.0%) | 0.0 |
| 20 to 34 years | 7 (13.2%) | 27.0 |
| 35 to 50 years | 46 (86.8%) | 133.0 |
| Total | 53 (100.0%) | 81.0 |
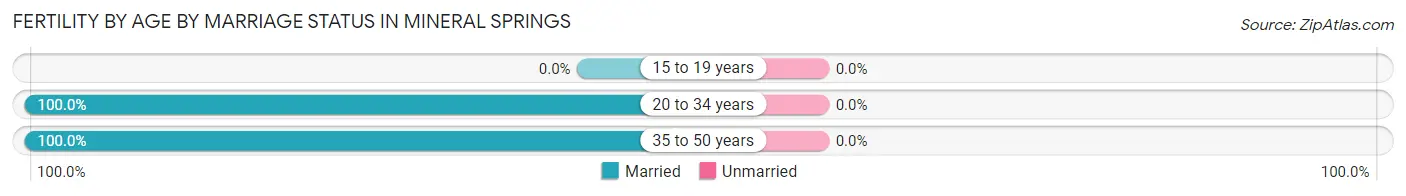
Fertility by Age by Marriage Status in Mineral Springs
| Age Bracket | Married | Unmarried |
| 15 to 19 years | 0 (0.0%) | 0 (0.0%) |
| 20 to 34 years | 7 (100.0%) | 0 (0.0%) |
| 35 to 50 years | 46 (100.0%) | 0 (0.0%) |
| Total | 53 (100.0%) | 0 (0.0%) |
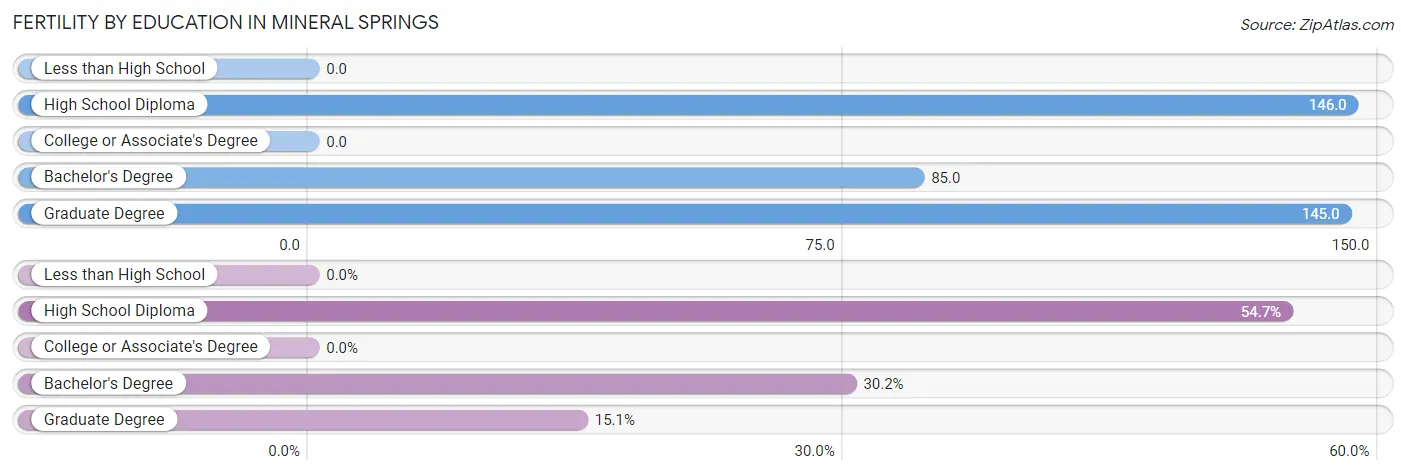
Fertility by Education in Mineral Springs
| Educational Attainment | Women with Births | Births / 1,000 Women |
| Less than High School | 0 (0.0%) | 0.0 |
| High School Diploma | 29 (54.7%) | 146.0 |
| College or Associate's Degree | 0 (0.0%) | 0.0 |
| Bachelor's Degree | 16 (30.2%) | 85.0 |
| Graduate Degree | 8 (15.1%) | 145.0 |
| Total | 53 (100.0%) | 81.0 |
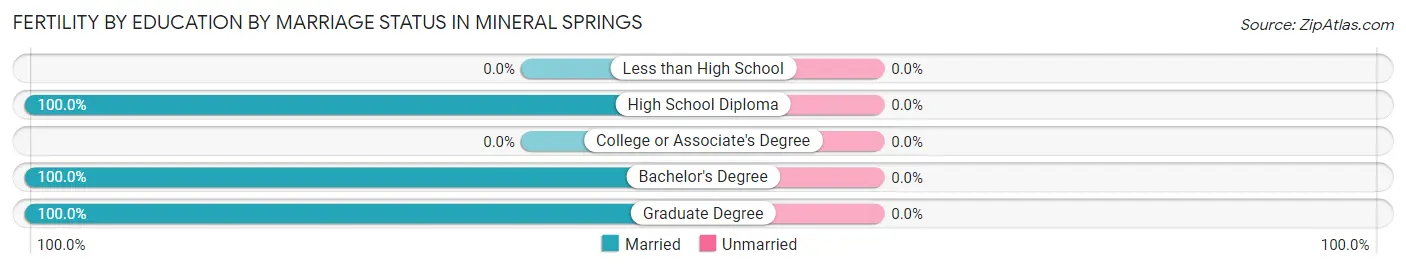
Fertility by Education by Marriage Status in Mineral Springs
| Educational Attainment | Married | Unmarried |
| Less than High School | 0 (0.0%) | 0 (0.0%) |
| High School Diploma | 29 (100.0%) | 0 (0.0%) |
| College or Associate's Degree | 0 (0.0%) | 0 (0.0%) |
| Bachelor's Degree | 16 (100.0%) | 0 (0.0%) |
| Graduate Degree | 8 (100.0%) | 0 (0.0%) |
| Total | 53 (100.0%) | 0 (0.0%) |
Income in Mineral Springs
Income Overview in Mineral Springs
Per Capita Income in Mineral Springs is $46,695, while median incomes of families and households are $109,740 and $94,113 respectively.
| Characteristic | Number | Measure |
| Per Capita Income | 3,185 | $46,695 |
| Median Family Income | 939 | $109,740 |
| Mean Family Income | 939 | $130,149 |
| Median Household Income | 1,176 | $94,113 |
| Mean Household Income | 1,176 | $121,381 |
| Income Deficit | 939 | $0 |
| Wage / Income Gap (%) | 3,185 | 14.77% |
| Wage / Income Gap ($) | 3,185 | 85.23¢ per $1 |
| Gini / Inequality Index | 3,185 | 0.40 |
Earnings by Sex in Mineral Springs
Average Earnings in Mineral Springs are $43,311, $48,125 for men and $41,016 for women, a difference of 14.8%.
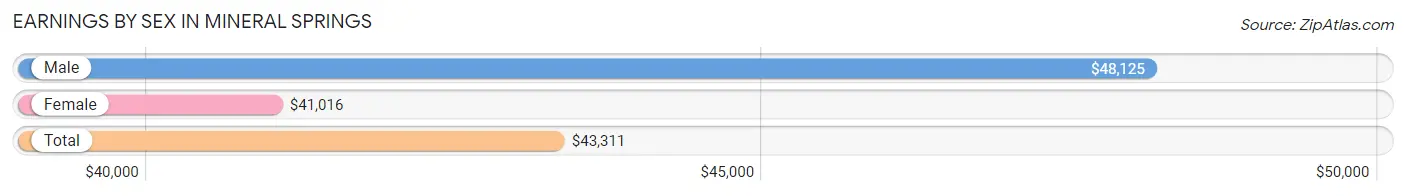
| Sex | Number | Average Earnings |
| Male | 1,039 (53.6%) | $48,125 |
| Female | 899 (46.4%) | $41,016 |
| Total | 1,938 (100.0%) | $43,311 |
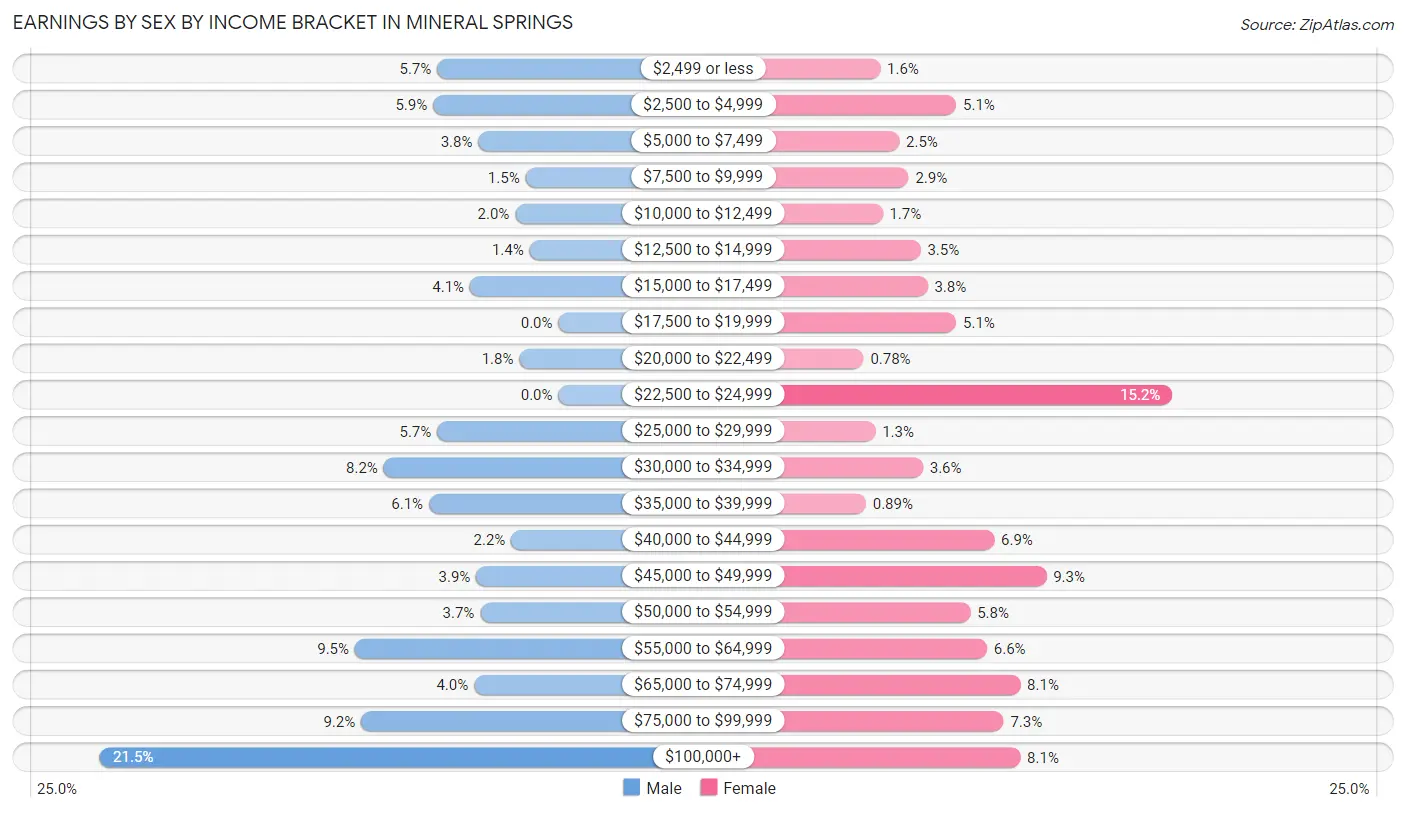
Earnings by Sex by Income Bracket in Mineral Springs
The most common earnings brackets in Mineral Springs are $100,000+ for men (223 | 21.5%) and $22,500 to $24,999 for women (137 | 15.2%).
| Income | Male | Female |
| $2,499 or less | 59 (5.7%) | 14 (1.6%) |
| $2,500 to $4,999 | 61 (5.9%) | 46 (5.1%) |
| $5,000 to $7,499 | 39 (3.7%) | 22 (2.5%) |
| $7,500 to $9,999 | 16 (1.5%) | 26 (2.9%) |
| $10,000 to $12,499 | 21 (2.0%) | 15 (1.7%) |
| $12,500 to $14,999 | 14 (1.3%) | 31 (3.5%) |
| $15,000 to $17,499 | 43 (4.1%) | 34 (3.8%) |
| $17,500 to $19,999 | 0 (0.0%) | 46 (5.1%) |
| $20,000 to $22,499 | 19 (1.8%) | 7 (0.8%) |
| $22,500 to $24,999 | 0 (0.0%) | 137 (15.2%) |
| $25,000 to $29,999 | 59 (5.7%) | 12 (1.3%) |
| $30,000 to $34,999 | 85 (8.2%) | 32 (3.6%) |
| $35,000 to $39,999 | 63 (6.1%) | 8 (0.9%) |
| $40,000 to $44,999 | 23 (2.2%) | 62 (6.9%) |
| $45,000 to $49,999 | 40 (3.8%) | 84 (9.3%) |
| $50,000 to $54,999 | 38 (3.7%) | 52 (5.8%) |
| $55,000 to $64,999 | 99 (9.5%) | 59 (6.6%) |
| $65,000 to $74,999 | 41 (4.0%) | 73 (8.1%) |
| $75,000 to $99,999 | 96 (9.2%) | 66 (7.3%) |
| $100,000+ | 223 (21.5%) | 73 (8.1%) |
| Total | 1,039 (100.0%) | 899 (100.0%) |
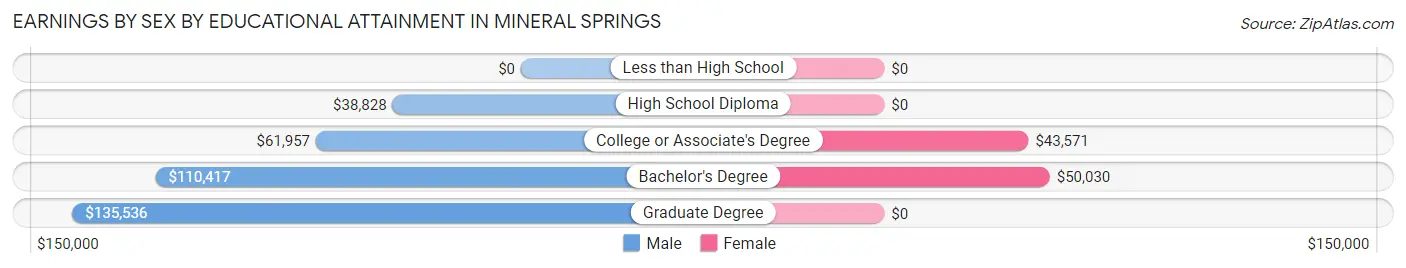
Earnings by Sex by Educational Attainment in Mineral Springs
Average earnings in Mineral Springs are $60,116 for men and $48,099 for women, a difference of 20.0%. Men with an educational attainment of graduate degree enjoy the highest average annual earnings of $135,536, while those with high school diploma education earn the least with $38,828. Women with an educational attainment of bachelor's degree earn the most with the average annual earnings of $50,030, while those with college or associate's degree education have the smallest earnings of $43,571.
| Educational Attainment | Male Income | Female Income |
| Less than High School | - | - |
| High School Diploma | $38,828 | $0 |
| College or Associate's Degree | $61,957 | $43,571 |
| Bachelor's Degree | $110,417 | $50,030 |
| Graduate Degree | $135,536 | $0 |
| Total | $60,116 | $48,099 |
Family Income in Mineral Springs
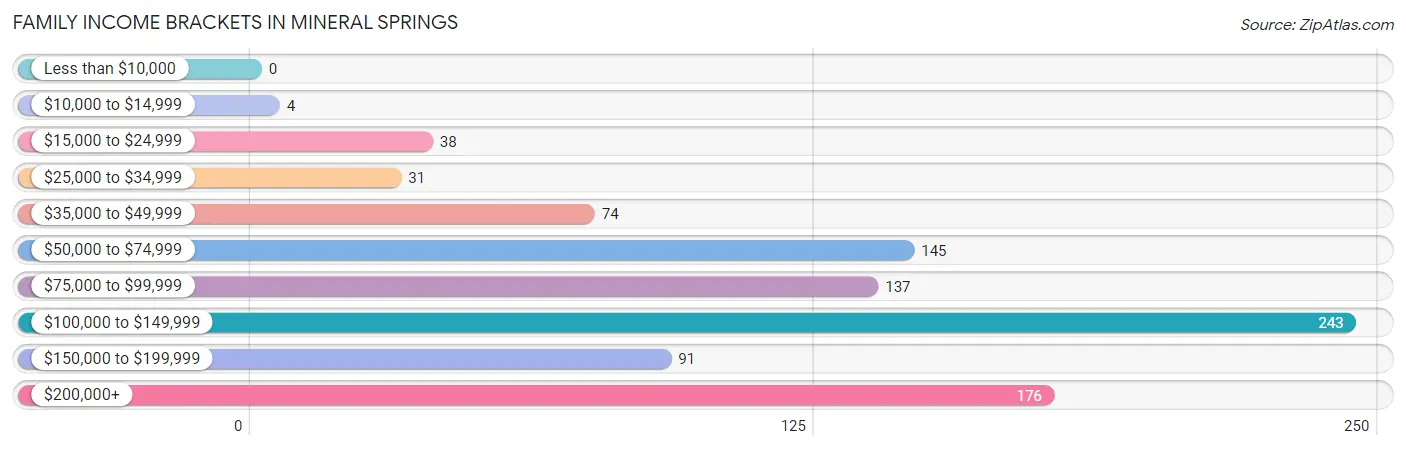
Family Income Brackets in Mineral Springs
According to the Mineral Springs family income data, there are 243 families falling into the $100,000 to $149,999 income range, which is the most common income bracket and makes up 25.9% of all families.
| Income Bracket | # Families | % Families |
| Less than $10,000 | 0 | 0.0% |
| $10,000 to $14,999 | 4 | 0.4% |
| $15,000 to $24,999 | 38 | 4.0% |
| $25,000 to $34,999 | 31 | 3.3% |
| $35,000 to $49,999 | 74 | 7.9% |
| $50,000 to $74,999 | 145 | 15.4% |
| $75,000 to $99,999 | 137 | 14.6% |
| $100,000 to $149,999 | 243 | 25.9% |
| $150,000 to $199,999 | 91 | 9.7% |
| $200,000+ | 176 | 18.7% |
Family Income by Famaliy Size in Mineral Springs
3-person families (106 | 11.3%) account for the highest median family income in Mineral Springs with $170,000 per family, while 3-person families (106 | 11.3%) have the highest median income of $56,667 per family member.
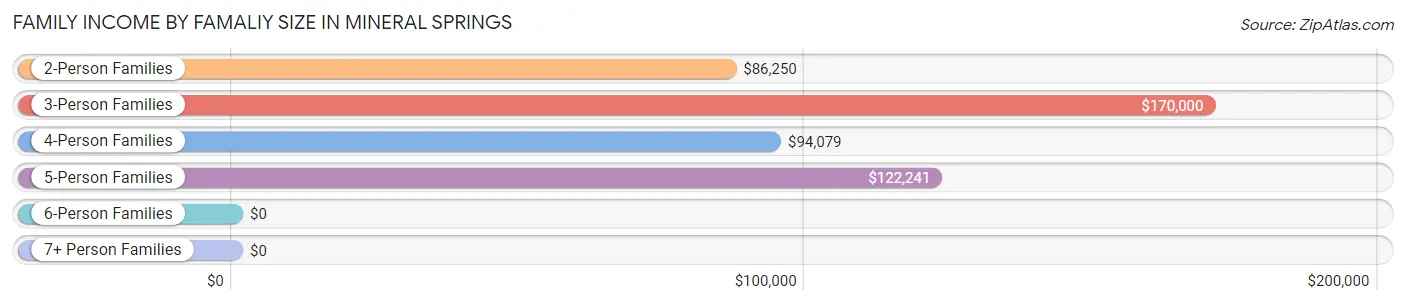
| Income Bracket | # Families | Median Income |
| 2-Person Families | 554 (59.0%) | $86,250 |
| 3-Person Families | 106 (11.3%) | $170,000 |
| 4-Person Families | 186 (19.8%) | $94,079 |
| 5-Person Families | 82 (8.7%) | $122,241 |
| 6-Person Families | 11 (1.2%) | $0 |
| 7+ Person Families | 0 (0.0%) | $0 |
| Total | 939 (100.0%) | $109,740 |
Family Income by Number of Earners in Mineral Springs
The median family income in Mineral Springs is $109,740, with families comprising 2 earners (446) having the highest median family income of $128,690, while families with no earners (156) have the lowest median family income of $45,887, accounting for 47.5% and 16.6% of families, respectively.
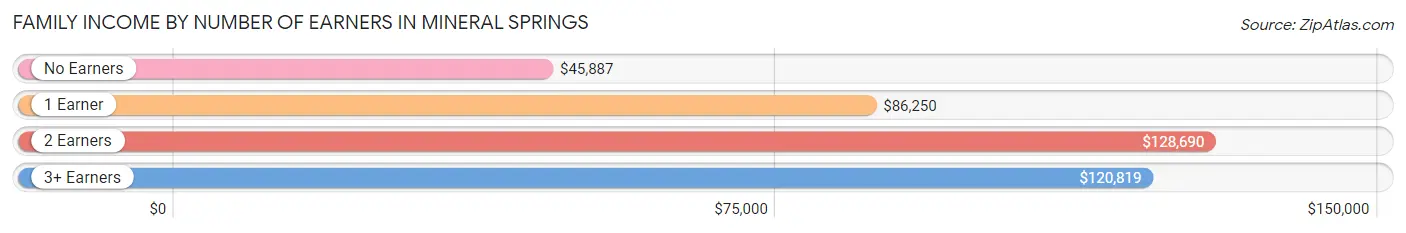
| Number of Earners | # Families | Median Income |
| No Earners | 156 (16.6%) | $45,887 |
| 1 Earner | 206 (21.9%) | $86,250 |
| 2 Earners | 446 (47.5%) | $128,690 |
| 3+ Earners | 131 (14.0%) | $120,819 |
| Total | 939 (100.0%) | $109,740 |
Household Income in Mineral Springs
Household Income Brackets in Mineral Springs
With 269 households falling in the category, the $100,000 to $149,999 income range is the most frequent in Mineral Springs, accounting for 22.9% of all households.
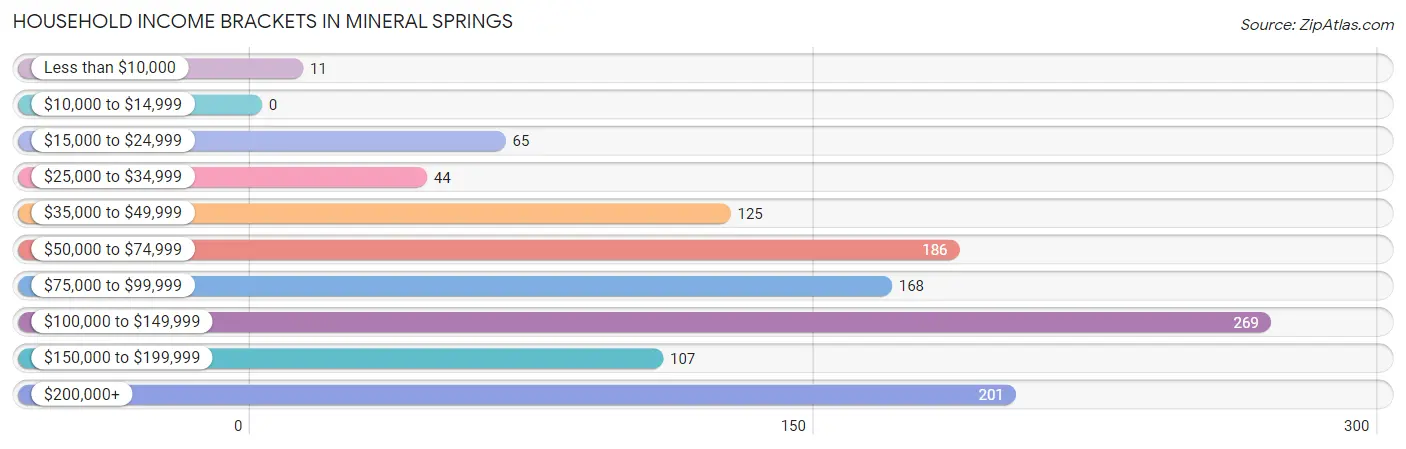
| Income Bracket | # Households | % Households |
| Less than $10,000 | 11 | 0.9% |
| $10,000 to $14,999 | 0 | 0.0% |
| $15,000 to $24,999 | 65 | 5.5% |
| $25,000 to $34,999 | 44 | 3.7% |
| $35,000 to $49,999 | 125 | 10.6% |
| $50,000 to $74,999 | 186 | 15.8% |
| $75,000 to $99,999 | 168 | 14.3% |
| $100,000 to $149,999 | 269 | 22.9% |
| $150,000 to $199,999 | 107 | 9.1% |
| $200,000+ | 201 | 17.1% |
Household Income by Householder Age in Mineral Springs
The median household income in Mineral Springs is $94,113, with the highest median household income of $117,308 found in the 45 to 64 years age bracket for the primary householder. A total of 610 households (51.9%) fall into this category. Meanwhile, the 15 to 24 years age bracket for the primary householder has the lowest median household income of $0, with 13 households (1.1%) in this group.
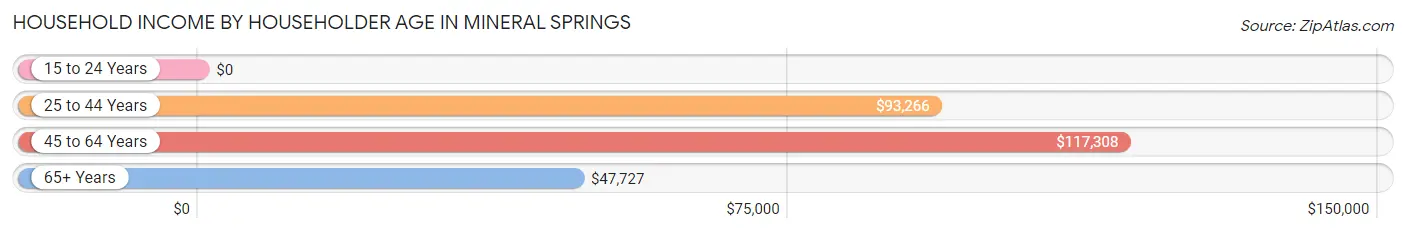
| Income Bracket | # Households | Median Income |
| 15 to 24 Years | 13 (1.1%) | $0 |
| 25 to 44 Years | 263 (22.4%) | $93,266 |
| 45 to 64 Years | 610 (51.9%) | $117,308 |
| 65+ Years | 290 (24.7%) | $47,727 |
| Total | 1,176 (100.0%) | $94,113 |
Poverty in Mineral Springs
Income Below Poverty by Sex and Age in Mineral Springs
With 5.4% poverty level for males and 3.7% for females among the residents of Mineral Springs, 25 to 34 year old males and 6 to 11 year old females are the most vulnerable to poverty, with 31 males (33.3%) and 4 females (9.5%) in their respective age groups living below the poverty level.
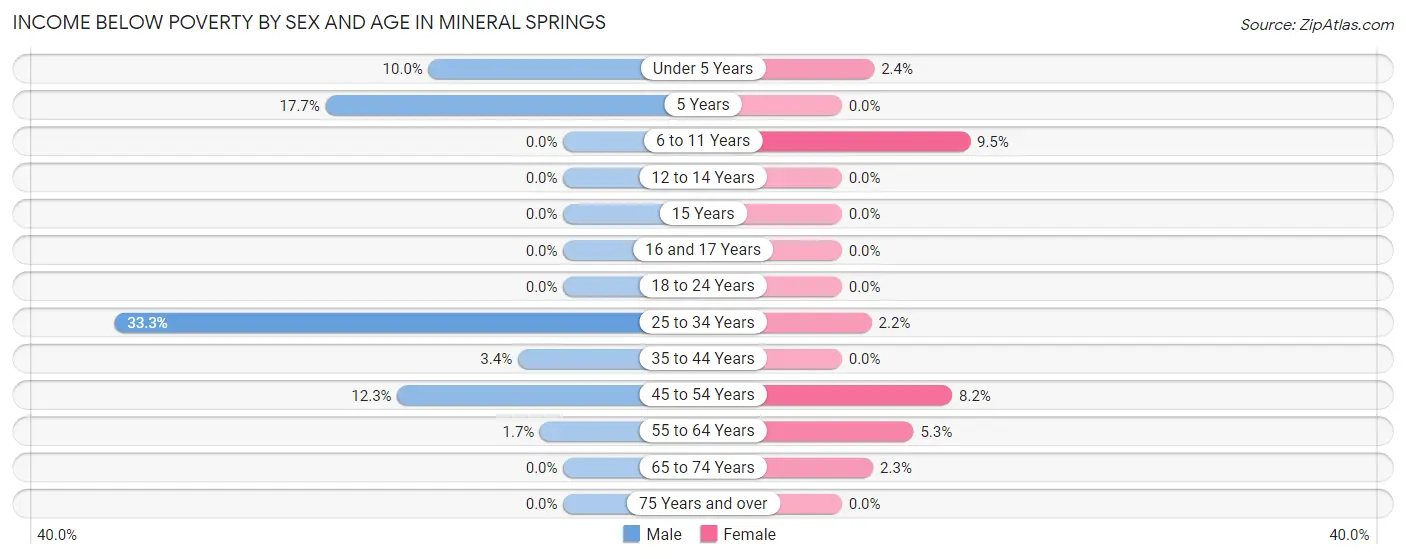
| Age Bracket | Male | Female |
| Under 5 Years | 8 (10.0%) | 2 (2.4%) |
| 5 Years | 3 (17.6%) | 0 (0.0%) |
| 6 to 11 Years | 0 (0.0%) | 4 (9.5%) |
| 12 to 14 Years | 0 (0.0%) | 0 (0.0%) |
| 15 Years | 0 (0.0%) | 0 (0.0%) |
| 16 and 17 Years | 0 (0.0%) | 0 (0.0%) |
| 18 to 24 Years | 0 (0.0%) | 0 (0.0%) |
| 25 to 34 Years | 31 (33.3%) | 3 (2.2%) |
| 35 to 44 Years | 9 (3.4%) | 0 (0.0%) |
| 45 to 54 Years | 34 (12.3%) | 29 (8.2%) |
| 55 to 64 Years | 5 (1.7%) | 14 (5.3%) |
| 65 to 74 Years | 0 (0.0%) | 5 (2.3%) |
| 75 Years and over | 0 (0.0%) | 0 (0.0%) |
| Total | 90 (5.4%) | 57 (3.7%) |
Income Above Poverty by Sex and Age in Mineral Springs
According to the poverty statistics in Mineral Springs, males aged 6 to 11 years and females aged 5 years are the age groups that are most secure financially, with 100.0% of males and 100.0% of females in these age groups living above the poverty line.
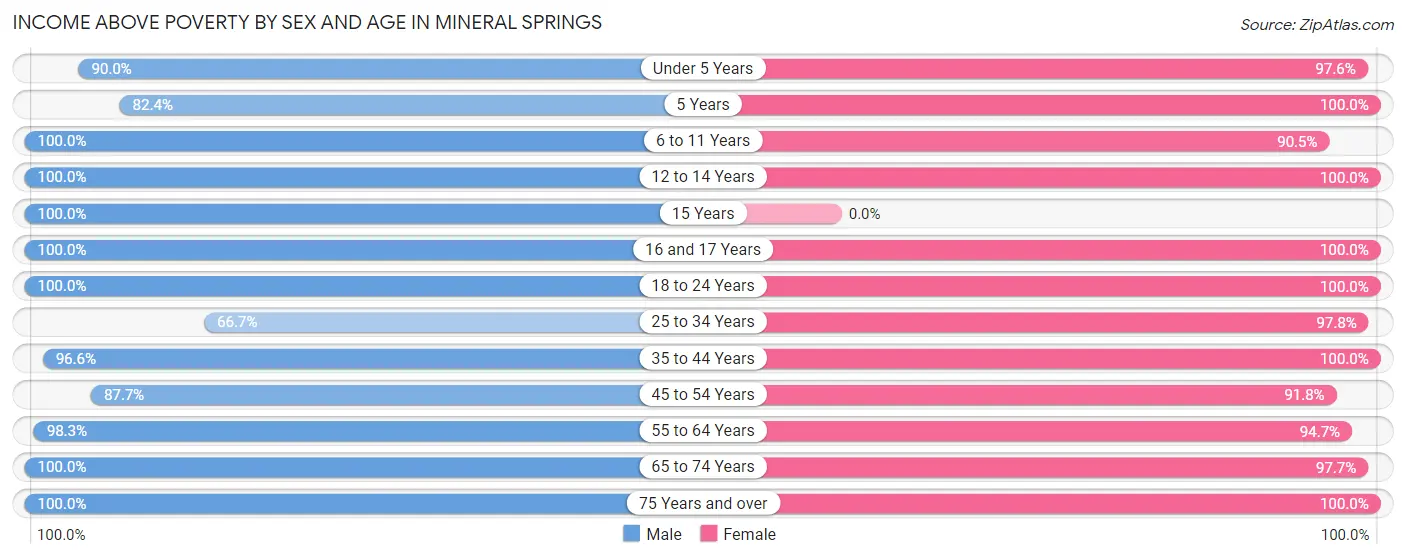
| Age Bracket | Male | Female |
| Under 5 Years | 72 (90.0%) | 81 (97.6%) |
| 5 Years | 14 (82.4%) | 6 (100.0%) |
| 6 to 11 Years | 79 (100.0%) | 38 (90.5%) |
| 12 to 14 Years | 45 (100.0%) | 40 (100.0%) |
| 15 Years | 30 (100.0%) | 0 (0.0%) |
| 16 and 17 Years | 59 (100.0%) | 26 (100.0%) |
| 18 to 24 Years | 167 (100.0%) | 149 (100.0%) |
| 25 to 34 Years | 62 (66.7%) | 133 (97.8%) |
| 35 to 44 Years | 258 (96.6%) | 164 (100.0%) |
| 45 to 54 Years | 242 (87.7%) | 325 (91.8%) |
| 55 to 64 Years | 285 (98.3%) | 249 (94.7%) |
| 65 to 74 Years | 173 (100.0%) | 210 (97.7%) |
| 75 Years and over | 83 (100.0%) | 43 (100.0%) |
| Total | 1,569 (94.6%) | 1,464 (96.3%) |
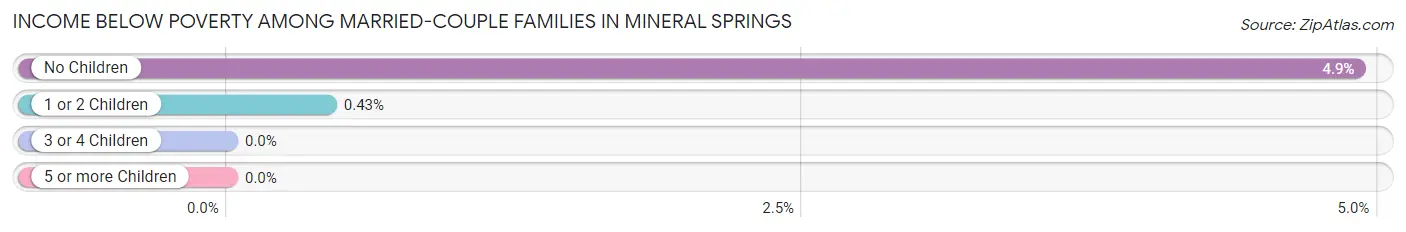
Income Below Poverty Among Married-Couple Families in Mineral Springs
The poverty statistics for married-couple families in Mineral Springs show that 3.5% or 30 of the total 865 families live below the poverty line. Families with no children have the highest poverty rate of 4.9%, comprising of 29 families. On the other hand, families with 3 or 4 children have the lowest poverty rate of 0.0%, which includes 0 families.
| Children | Above Poverty | Below Poverty |
| No Children | 562 (95.1%) | 29 (4.9%) |
| 1 or 2 Children | 229 (99.6%) | 1 (0.4%) |
| 3 or 4 Children | 44 (100.0%) | 0 (0.0%) |
| 5 or more Children | 0 (0.0%) | 0 (0.0%) |
| Total | 835 (96.5%) | 30 (3.5%) |
Income Below Poverty Among Single-Parent Households in Mineral Springs
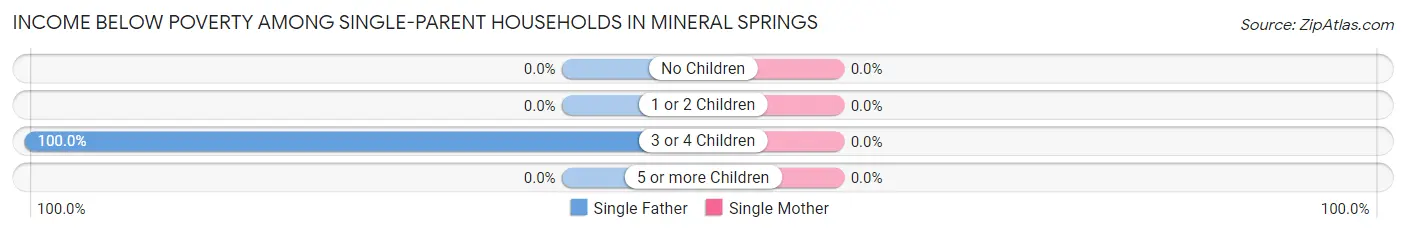
| Children | Single Father | Single Mother |
| No Children | 0 (0.0%) | 0 (0.0%) |
| 1 or 2 Children | 0 (0.0%) | 0 (0.0%) |
| 3 or 4 Children | 4 (100.0%) | 0 (0.0%) |
| 5 or more Children | 0 (0.0%) | 0 (0.0%) |
| Total | 4 (8.2%) | 0 (0.0%) |
Income Below Poverty Among Married-Couple vs Single-Parent Households in Mineral Springs
The poverty data for Mineral Springs shows that 30 of the married-couple family households (3.5%) and 4 of the single-parent households (5.4%) are living below the poverty level. Within the married-couple family households, those with no children have the highest poverty rate, with 29 households (4.9%) falling below the poverty line. Among the single-parent households, those with 3 or 4 children have the highest poverty rate, with 4 household (100.0%) living below poverty.
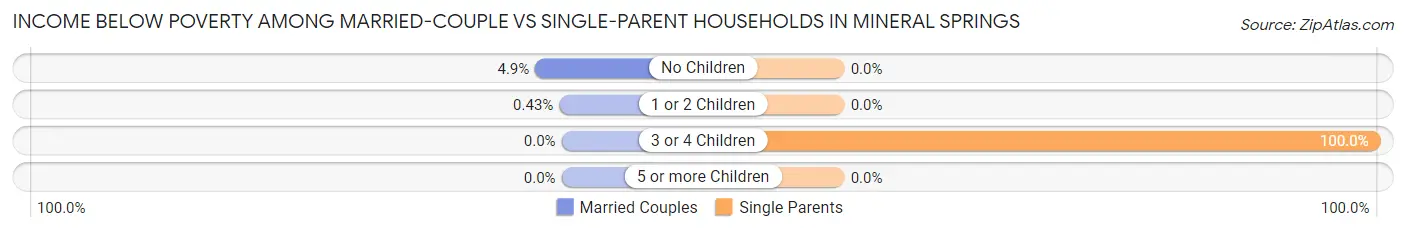
| Children | Married-Couple Families | Single-Parent Households |
| No Children | 29 (4.9%) | 0 (0.0%) |
| 1 or 2 Children | 1 (0.4%) | 0 (0.0%) |
| 3 or 4 Children | 0 (0.0%) | 4 (100.0%) |
| 5 or more Children | 0 (0.0%) | 0 (0.0%) |
| Total | 30 (3.5%) | 4 (5.4%) |
Employment Characteristics in Mineral Springs
Employment by Class of Employer in Mineral Springs
Among the 1,729 employed individuals in Mineral Springs, private company employees (1,259 | 72.8%), local government employees (129 | 7.5%), and self-employed (incorporated) (120 | 6.9%) make up the most common classes of employment.
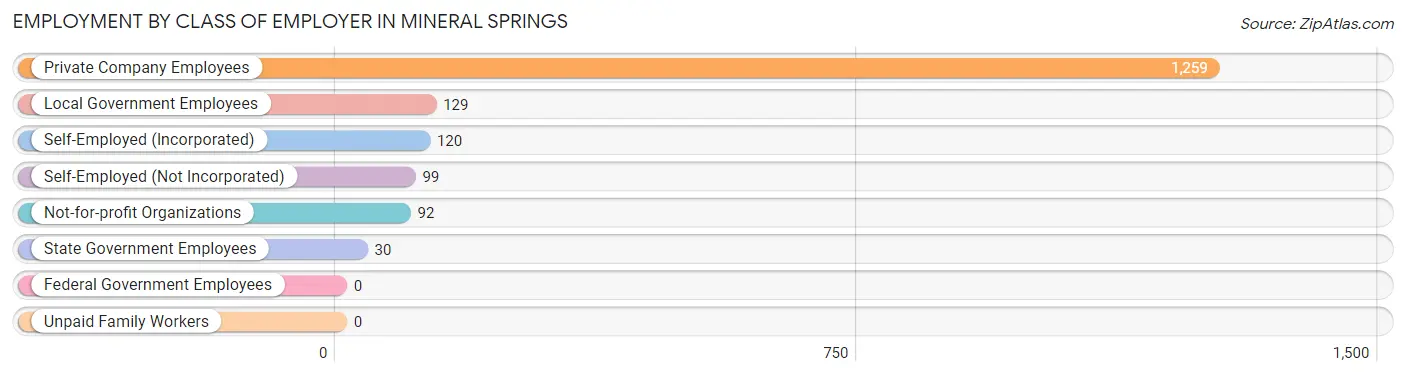
| Employer Class | # Employees | % Employees |
| Private Company Employees | 1,259 | 72.8% |
| Self-Employed (Incorporated) | 120 | 6.9% |
| Self-Employed (Not Incorporated) | 99 | 5.7% |
| Not-for-profit Organizations | 92 | 5.3% |
| Local Government Employees | 129 | 7.5% |
| State Government Employees | 30 | 1.7% |
| Federal Government Employees | 0 | 0.0% |
| Unpaid Family Workers | 0 | 0.0% |
| Total | 1,729 | 100.0% |
Employment Status by Age in Mineral Springs
According to the labor force statistics for Mineral Springs, out of the total population over 16 years of age (2,758), 68.5% or 1,889 individuals are in the labor force, with 5.2% or 98 of them unemployed. The age group with the highest labor force participation rate is 20 to 24 years, with 93.6% or 265 individuals in the labor force. Within the labor force, the 16 to 19 years age range has the highest percentage of unemployed individuals, with 36.0% or 18 of them being unemployed.
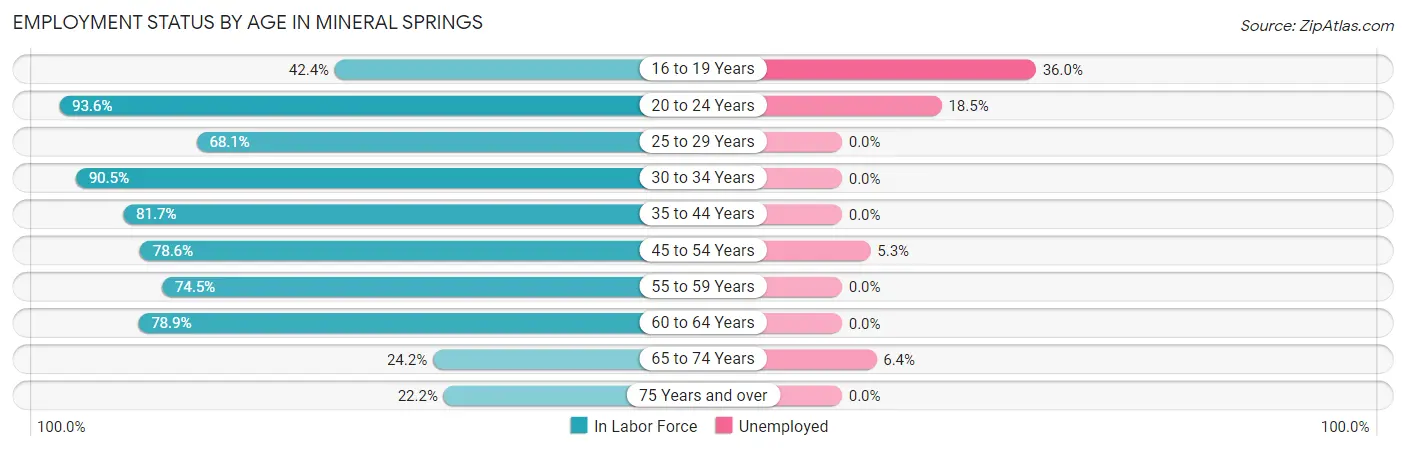
| Age Bracket | In Labor Force | Unemployed |
| 16 to 19 Years | 50 (42.4%) | 18 (36.0%) |
| 20 to 24 Years | 265 (93.6%) | 49 (18.5%) |
| 25 to 29 Years | 77 (68.1%) | 0 (0.0%) |
| 30 to 34 Years | 105 (90.5%) | 0 (0.0%) |
| 35 to 44 Years | 352 (81.7%) | 0 (0.0%) |
| 45 to 54 Years | 495 (78.6%) | 26 (5.3%) |
| 55 to 59 Years | 228 (74.5%) | 0 (0.0%) |
| 60 to 64 Years | 195 (78.9%) | 0 (0.0%) |
| 65 to 74 Years | 94 (24.2%) | 6 (6.4%) |
| 75 Years and over | 28 (22.2%) | 0 (0.0%) |
| Total | 1,889 (68.5%) | 98 (5.2%) |
Employment Status by Educational Attainment in Mineral Springs
According to labor force statistics for Mineral Springs, 78.8% of individuals (1,452) out of the total population between 25 and 64 years of age (1,843) are in the labor force, with 1.8% or 26 of them being unemployed. The group with the highest labor force participation rate are those with the educational attainment of bachelor's degree or higher, with 82.8% or 560 individuals in the labor force. Within the labor force, individuals with less than high school education have the highest percentage of unemployment, with 24.4% or 20 of them being unemployed.
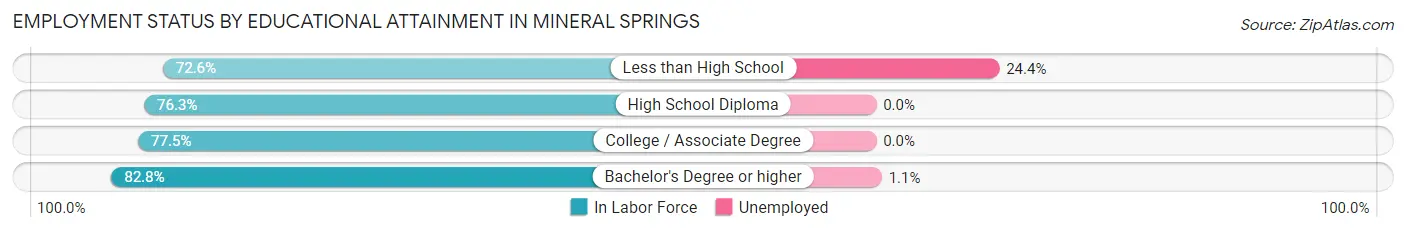
| Educational Attainment | In Labor Force | Unemployed |
| Less than High School | 82 (72.6%) | 28 (24.4%) |
| High School Diploma | 421 (76.3%) | 0 (0.0%) |
| College / Associate Degree | 389 (77.5%) | 0 (0.0%) |
| Bachelor's Degree or higher | 560 (82.8%) | 7 (1.1%) |
| Total | 1,452 (78.8%) | 33 (1.8%) |
Employment Occupations by Sex in Mineral Springs
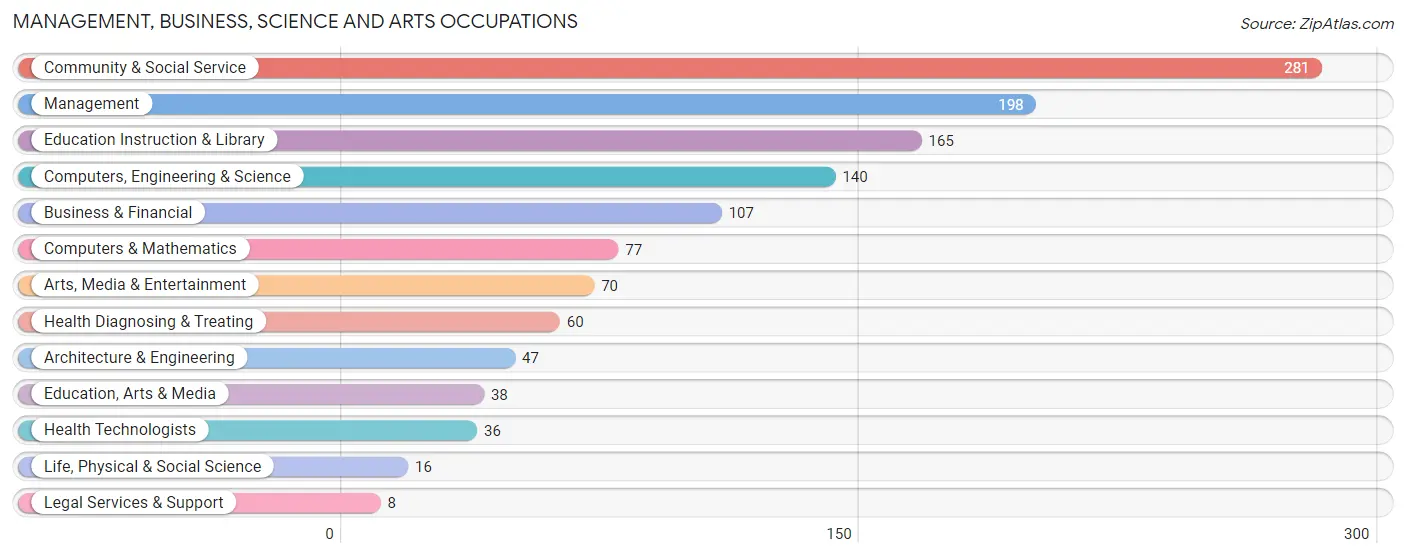
Management, Business, Science and Arts Occupations
The most common Management, Business, Science and Arts occupations in Mineral Springs are Community & Social Service (281 | 15.7%), Management (198 | 11.1%), Education Instruction & Library (165 | 9.2%), Computers, Engineering & Science (140 | 7.8%), and Business & Financial (107 | 6.0%).
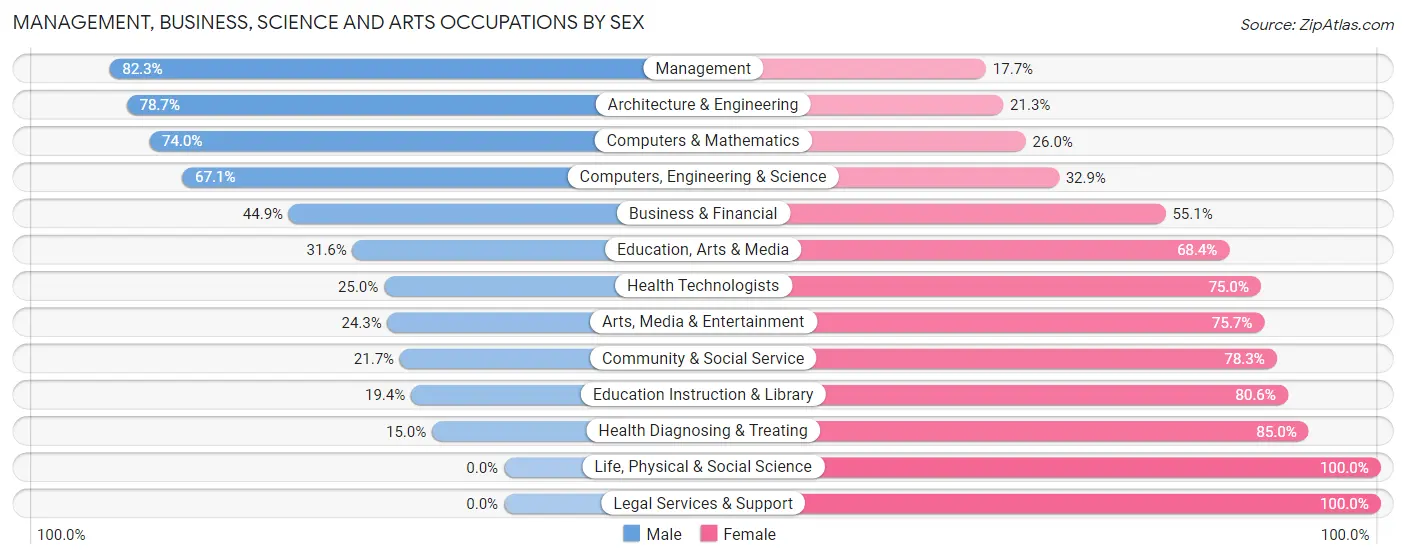
Management, Business, Science and Arts Occupations by Sex
Within the Management, Business, Science and Arts occupations in Mineral Springs, the most male-oriented occupations are Management (82.3%), Architecture & Engineering (78.7%), and Computers & Mathematics (74.0%), while the most female-oriented occupations are Life, Physical & Social Science (100.0%), Legal Services & Support (100.0%), and Health Diagnosing & Treating (85.0%).
| Occupation | Male | Female |
| Management | 163 (82.3%) | 35 (17.7%) |
| Business & Financial | 48 (44.9%) | 59 (55.1%) |
| Computers, Engineering & Science | 94 (67.1%) | 46 (32.9%) |
| Computers & Mathematics | 57 (74.0%) | 20 (26.0%) |
| Architecture & Engineering | 37 (78.7%) | 10 (21.3%) |
| Life, Physical & Social Science | 0 (0.0%) | 16 (100.0%) |
| Community & Social Service | 61 (21.7%) | 220 (78.3%) |
| Education, Arts & Media | 12 (31.6%) | 26 (68.4%) |
| Legal Services & Support | 0 (0.0%) | 8 (100.0%) |
| Education Instruction & Library | 32 (19.4%) | 133 (80.6%) |
| Arts, Media & Entertainment | 17 (24.3%) | 53 (75.7%) |
| Health Diagnosing & Treating | 9 (15.0%) | 51 (85.0%) |
| Health Technologists | 9 (25.0%) | 27 (75.0%) |
| Total (Category) | 375 (47.7%) | 411 (52.3%) |
| Total (Overall) | 956 (53.4%) | 834 (46.6%) |
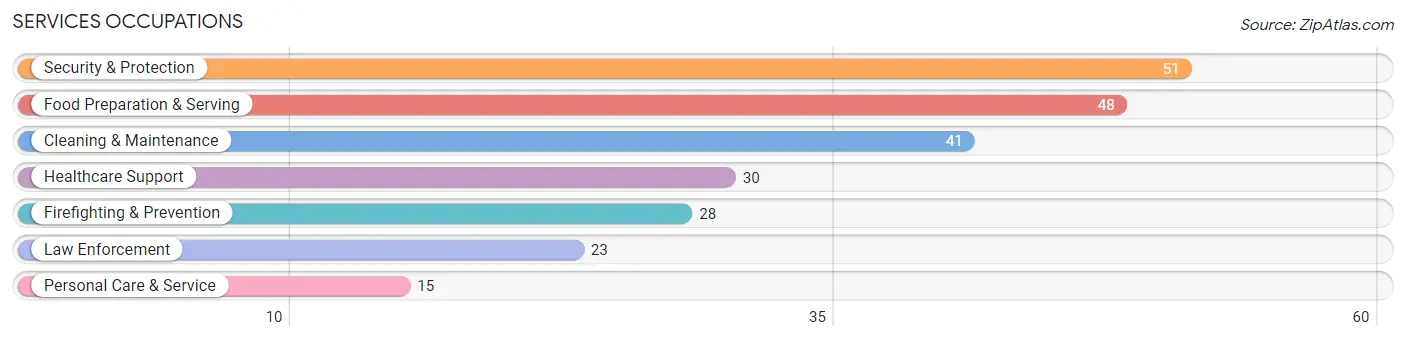
Services Occupations
The most common Services occupations in Mineral Springs are Security & Protection (51 | 2.9%), Food Preparation & Serving (48 | 2.7%), Cleaning & Maintenance (41 | 2.3%), Healthcare Support (30 | 1.7%), and Firefighting & Prevention (28 | 1.6%).
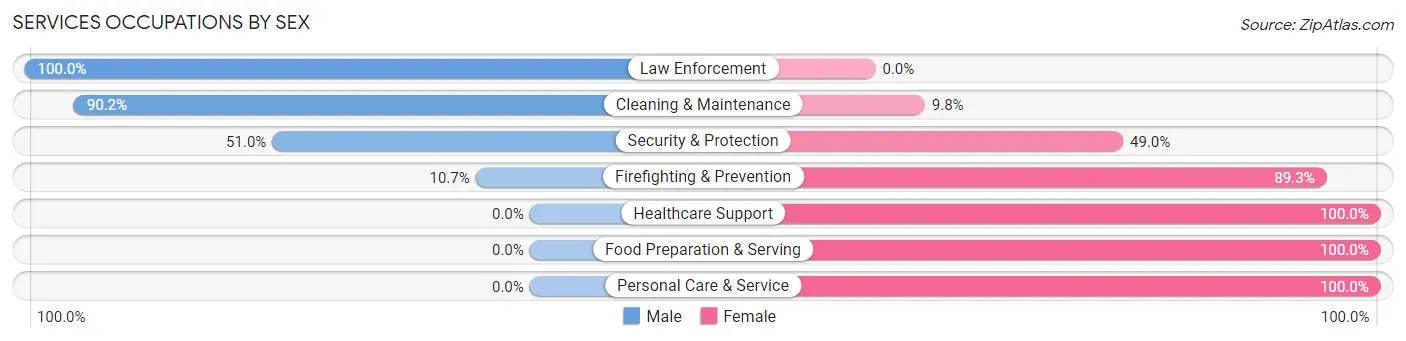
Services Occupations by Sex
Within the Services occupations in Mineral Springs, the most male-oriented occupations are Law Enforcement (100.0%), Cleaning & Maintenance (90.2%), and Security & Protection (51.0%), while the most female-oriented occupations are Healthcare Support (100.0%), Food Preparation & Serving (100.0%), and Personal Care & Service (100.0%).
| Occupation | Male | Female |
| Healthcare Support | 0 (0.0%) | 30 (100.0%) |
| Security & Protection | 26 (51.0%) | 25 (49.0%) |
| Firefighting & Prevention | 3 (10.7%) | 25 (89.3%) |
| Law Enforcement | 23 (100.0%) | 0 (0.0%) |
| Food Preparation & Serving | 0 (0.0%) | 48 (100.0%) |
| Cleaning & Maintenance | 37 (90.2%) | 4 (9.8%) |
| Personal Care & Service | 0 (0.0%) | 15 (100.0%) |
| Total (Category) | 63 (34.1%) | 122 (65.9%) |
| Total (Overall) | 956 (53.4%) | 834 (46.6%) |
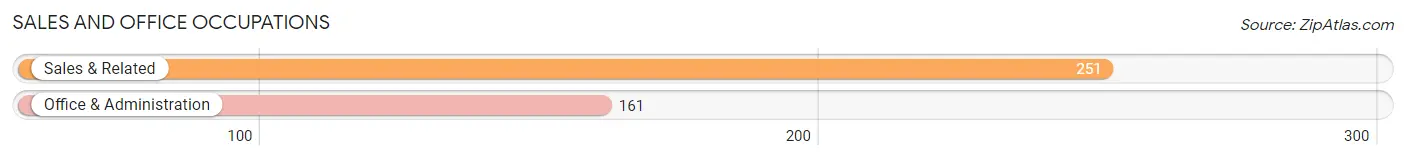
Sales and Office Occupations
The most common Sales and Office occupations in Mineral Springs are Sales & Related (251 | 14.0%), and Office & Administration (161 | 9.0%).
Sales and Office Occupations by Sex
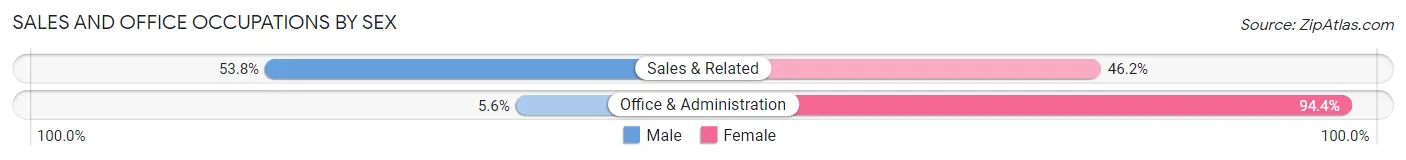
| Occupation | Male | Female |
| Sales & Related | 135 (53.8%) | 116 (46.2%) |
| Office & Administration | 9 (5.6%) | 152 (94.4%) |
| Total (Category) | 144 (34.9%) | 268 (65.0%) |
| Total (Overall) | 956 (53.4%) | 834 (46.6%) |
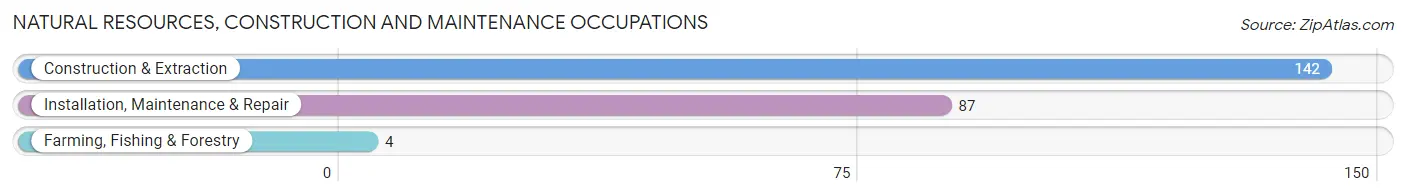
Natural Resources, Construction and Maintenance Occupations
The most common Natural Resources, Construction and Maintenance occupations in Mineral Springs are Construction & Extraction (142 | 7.9%), Installation, Maintenance & Repair (87 | 4.9%), and Farming, Fishing & Forestry (4 | 0.2%).
Natural Resources, Construction and Maintenance Occupations by Sex
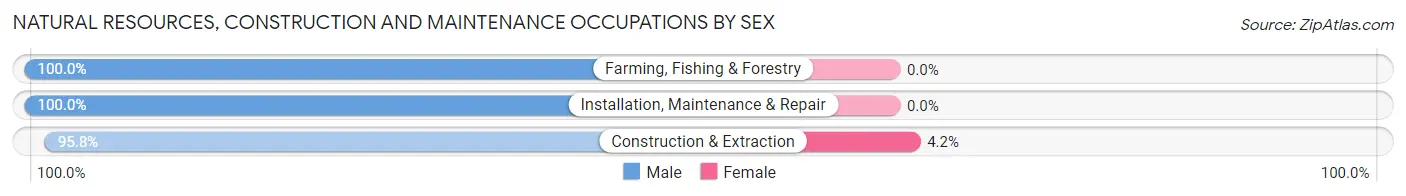
| Occupation | Male | Female |
| Farming, Fishing & Forestry | 4 (100.0%) | 0 (0.0%) |
| Construction & Extraction | 136 (95.8%) | 6 (4.2%) |
| Installation, Maintenance & Repair | 87 (100.0%) | 0 (0.0%) |
| Total (Category) | 227 (97.4%) | 6 (2.6%) |
| Total (Overall) | 956 (53.4%) | 834 (46.6%) |
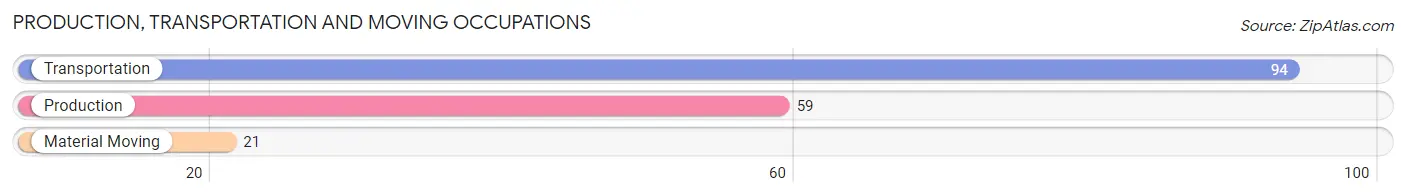
Production, Transportation and Moving Occupations
The most common Production, Transportation and Moving occupations in Mineral Springs are Transportation (94 | 5.2%), Production (59 | 3.3%), and Material Moving (21 | 1.2%).
Production, Transportation and Moving Occupations by Sex
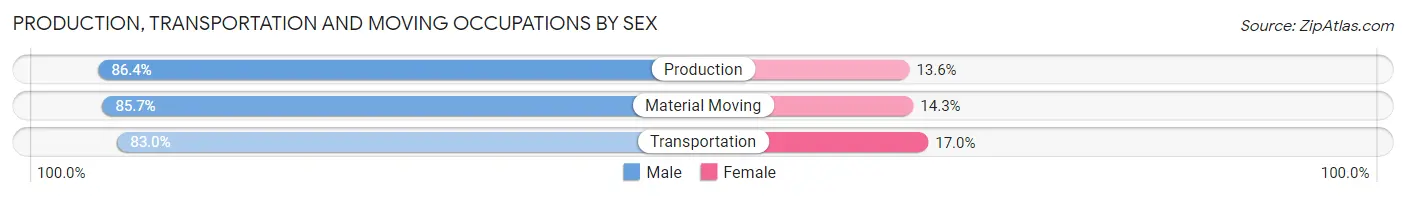
| Occupation | Male | Female |
| Production | 51 (86.4%) | 8 (13.6%) |
| Transportation | 78 (83.0%) | 16 (17.0%) |
| Material Moving | 18 (85.7%) | 3 (14.3%) |
| Total (Category) | 147 (84.5%) | 27 (15.5%) |
| Total (Overall) | 956 (53.4%) | 834 (46.6%) |
Employment Industries by Sex in Mineral Springs
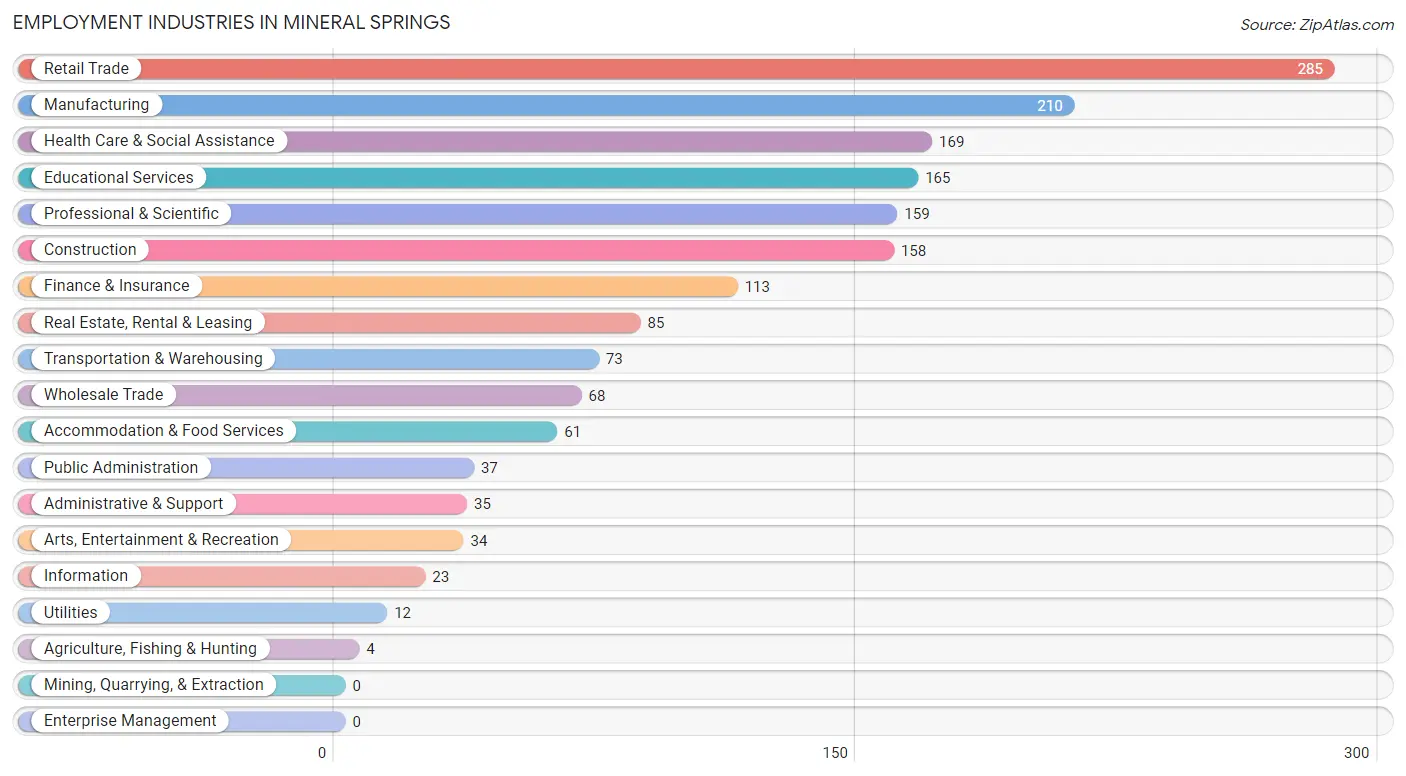
Employment Industries in Mineral Springs
The major employment industries in Mineral Springs include Retail Trade (285 | 15.9%), Manufacturing (210 | 11.7%), Health Care & Social Assistance (169 | 9.4%), Educational Services (165 | 9.2%), and Professional & Scientific (159 | 8.9%).
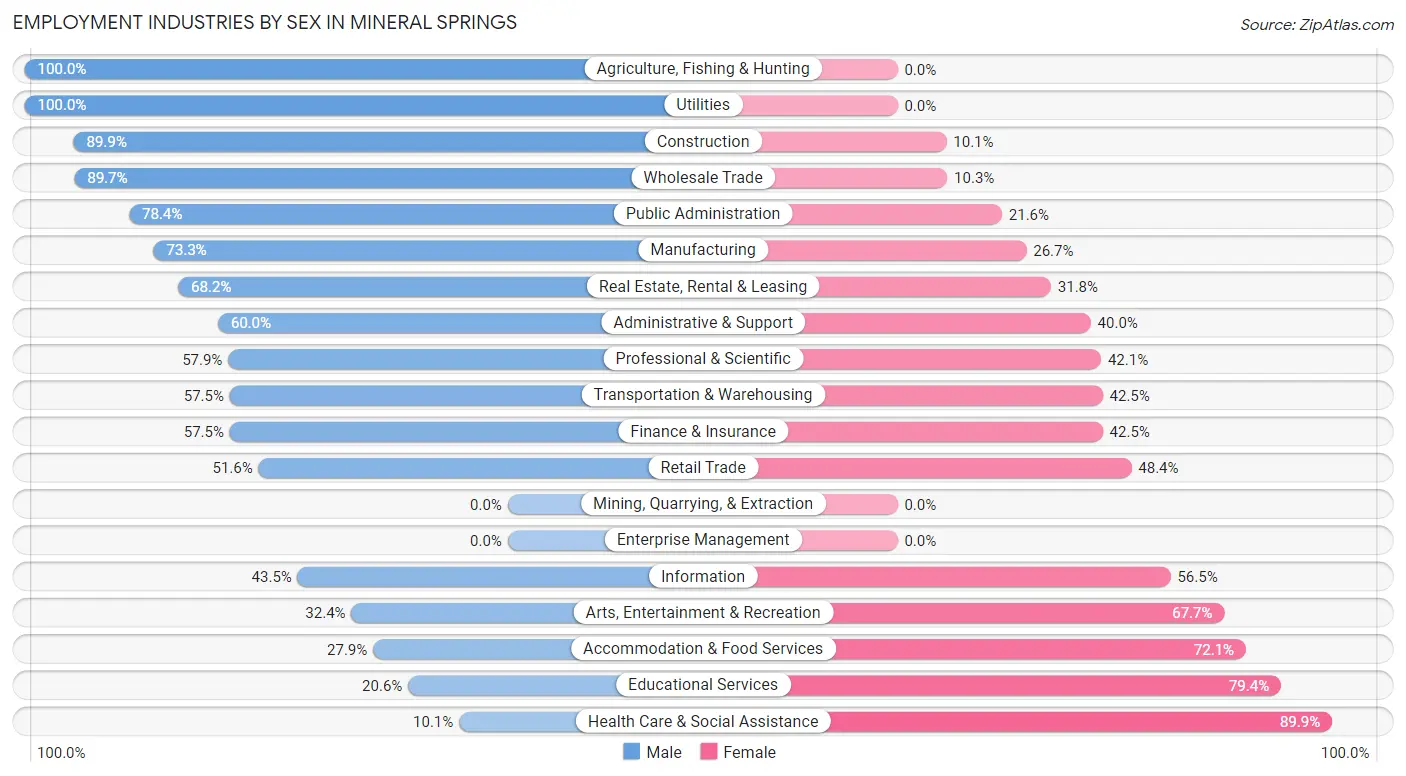
Employment Industries by Sex in Mineral Springs
The Mineral Springs industries that see more men than women are Agriculture, Fishing & Hunting (100.0%), Utilities (100.0%), and Construction (89.9%), whereas the industries that tend to have a higher number of women are Health Care & Social Assistance (89.9%), Educational Services (79.4%), and Accommodation & Food Services (72.1%).
| Industry | Male | Female |
| Agriculture, Fishing & Hunting | 4 (100.0%) | 0 (0.0%) |
| Mining, Quarrying, & Extraction | 0 (0.0%) | 0 (0.0%) |
| Construction | 142 (89.9%) | 16 (10.1%) |
| Manufacturing | 154 (73.3%) | 56 (26.7%) |
| Wholesale Trade | 61 (89.7%) | 7 (10.3%) |
| Retail Trade | 147 (51.6%) | 138 (48.4%) |
| Transportation & Warehousing | 42 (57.5%) | 31 (42.5%) |
| Utilities | 12 (100.0%) | 0 (0.0%) |
| Information | 10 (43.5%) | 13 (56.5%) |
| Finance & Insurance | 65 (57.5%) | 48 (42.5%) |
| Real Estate, Rental & Leasing | 58 (68.2%) | 27 (31.8%) |
| Professional & Scientific | 92 (57.9%) | 67 (42.1%) |
| Enterprise Management | 0 (0.0%) | 0 (0.0%) |
| Administrative & Support | 21 (60.0%) | 14 (40.0%) |
| Educational Services | 34 (20.6%) | 131 (79.4%) |
| Health Care & Social Assistance | 17 (10.1%) | 152 (89.9%) |
| Arts, Entertainment & Recreation | 11 (32.4%) | 23 (67.6%) |
| Accommodation & Food Services | 17 (27.9%) | 44 (72.1%) |
| Public Administration | 29 (78.4%) | 8 (21.6%) |
| Total | 956 (53.4%) | 834 (46.6%) |
Education in Mineral Springs
School Enrollment in Mineral Springs
The most common levels of schooling among the 480 students in Mineral Springs are high school (134 | 27.9%), middle school (114 | 23.7%), and college / undergraduate (96 | 20.0%).
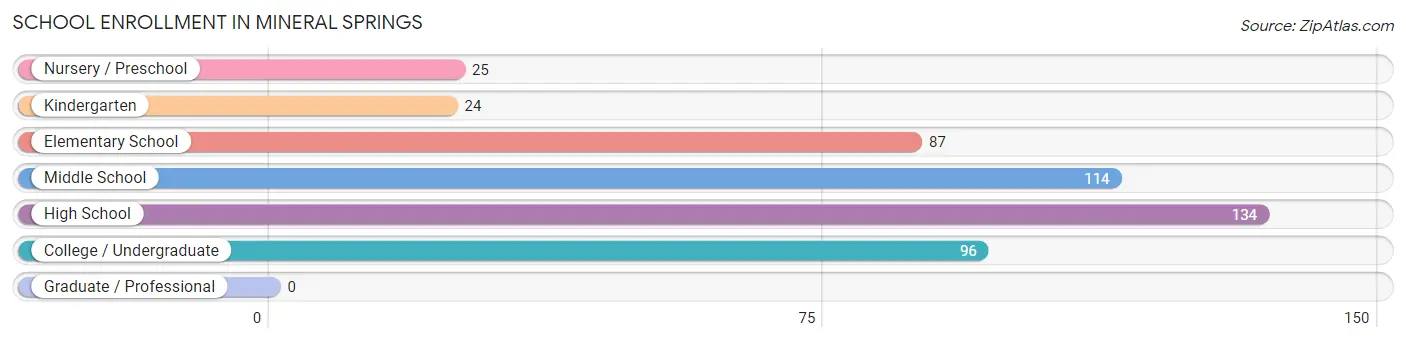
| School Level | # Students | % Students |
| Nursery / Preschool | 25 | 5.2% |
| Kindergarten | 24 | 5.0% |
| Elementary School | 87 | 18.1% |
| Middle School | 114 | 23.7% |
| High School | 134 | 27.9% |
| College / Undergraduate | 96 | 20.0% |
| Graduate / Professional | 0 | 0.0% |
| Total | 480 | 100.0% |
School Enrollment by Age by Funding Source in Mineral Springs
Out of a total of 480 students who are enrolled in schools in Mineral Springs, 162 (33.8%) attend a private institution, while the remaining 318 (66.2%) are enrolled in public schools. The age group of 25 to 34 year olds has the highest likelihood of being enrolled in private schools, with 13 (100.0% in the age bracket) enrolled. Conversely, the age group of 35 years and over has the lowest likelihood of being enrolled in a private school, with 7 (100.0% in the age bracket) attending a public institution.
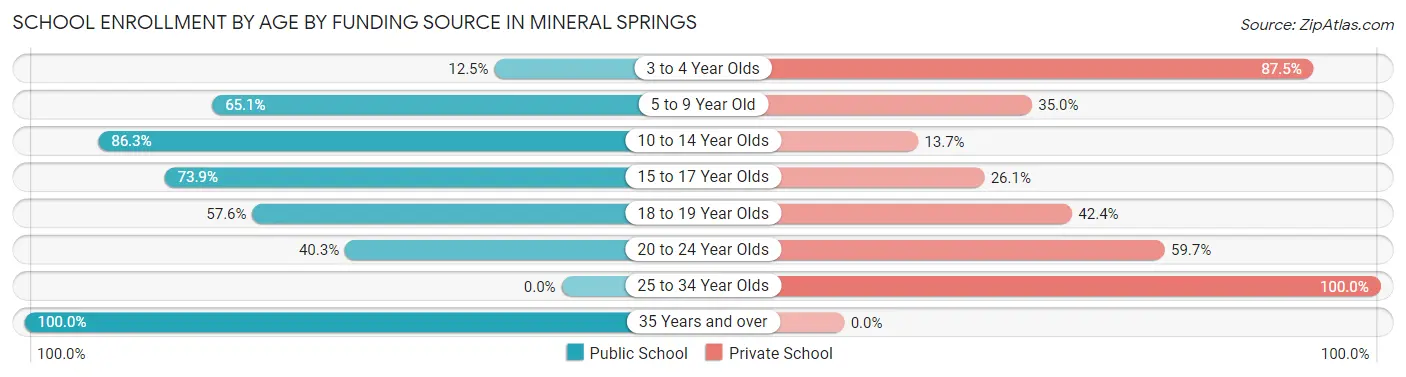
| Age Bracket | Public School | Private School |
| 3 to 4 Year Olds | 2 (12.5%) | 14 (87.5%) |
| 5 to 9 Year Old | 67 (65.0%) | 36 (34.9%) |
| 10 to 14 Year Olds | 113 (86.3%) | 18 (13.7%) |
| 15 to 17 Year Olds | 85 (73.9%) | 30 (26.1%) |
| 18 to 19 Year Olds | 19 (57.6%) | 14 (42.4%) |
| 20 to 24 Year Olds | 25 (40.3%) | 37 (59.7%) |
| 25 to 34 Year Olds | 0 (0.0%) | 13 (100.0%) |
| 35 Years and over | 7 (100.0%) | 0 (0.0%) |
| Total | 318 (66.3%) | 162 (33.8%) |
Educational Attainment by Field of Study in Mineral Springs
Business (205 | 22.6%), education (125 | 13.8%), arts & humanities (119 | 13.1%), engineering (81 | 8.9%), and literature & languages (64 | 7.0%) are the most common fields of study among 909 individuals in Mineral Springs who have obtained a bachelor's degree or higher.
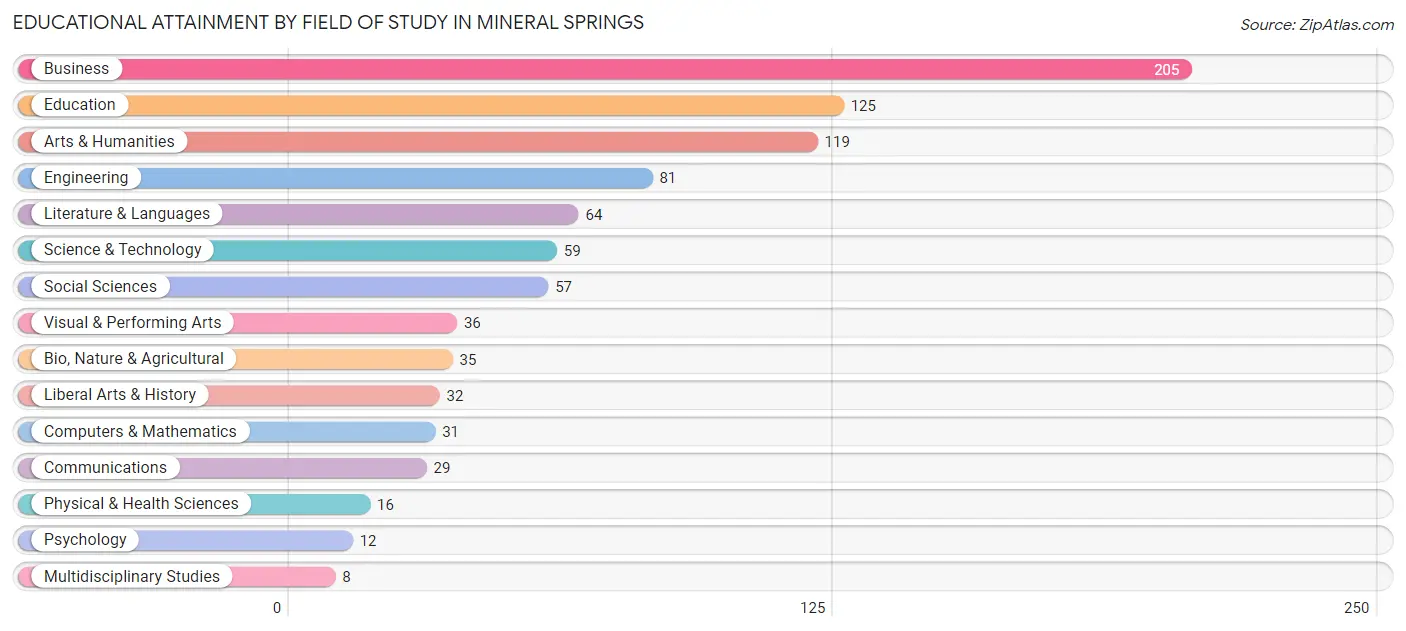
| Field of Study | # Graduates | % Graduates |
| Computers & Mathematics | 31 | 3.4% |
| Bio, Nature & Agricultural | 35 | 3.8% |
| Physical & Health Sciences | 16 | 1.8% |
| Psychology | 12 | 1.3% |
| Social Sciences | 57 | 6.3% |
| Engineering | 81 | 8.9% |
| Multidisciplinary Studies | 8 | 0.9% |
| Science & Technology | 59 | 6.5% |
| Business | 205 | 22.6% |
| Education | 125 | 13.8% |
| Literature & Languages | 64 | 7.0% |
| Liberal Arts & History | 32 | 3.5% |
| Visual & Performing Arts | 36 | 4.0% |
| Communications | 29 | 3.2% |
| Arts & Humanities | 119 | 13.1% |
| Total | 909 | 100.0% |
Transportation & Commute in Mineral Springs
Vehicle Availability by Sex in Mineral Springs
The most prevalent vehicle ownership categories in Mineral Springs are males with 2 vehicles (425, accounting for 47.1%) and females with 2 vehicles (272, making up 51.4%).
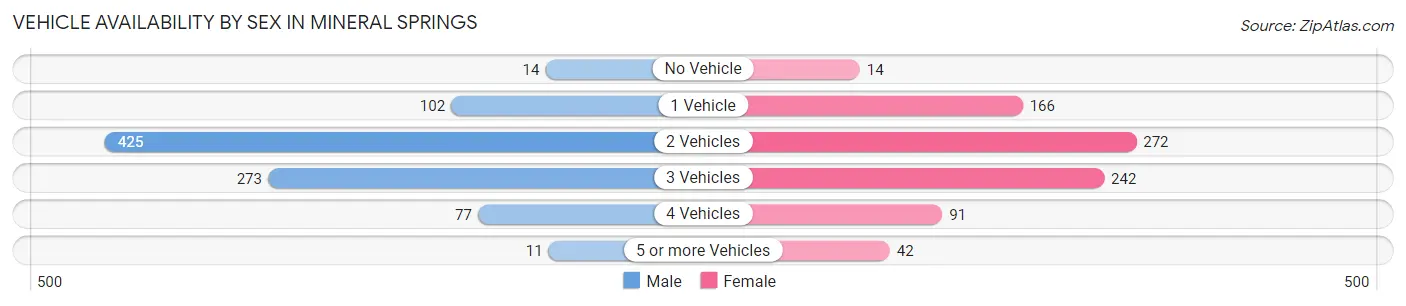
| Vehicles Available | Male | Female |
| No Vehicle | 14 (1.5%) | 14 (1.7%) |
| 1 Vehicle | 102 (11.3%) | 166 (20.1%) |
| 2 Vehicles | 425 (47.1%) | 272 (32.9%) |
| 3 Vehicles | 273 (30.3%) | 242 (29.3%) |
| 4 Vehicles | 77 (8.5%) | 91 (11.0%) |
| 5 or more Vehicles | 11 (1.2%) | 42 (5.1%) |
| Total | 902 (100.0%) | 827 (100.0%) |
Commute Time in Mineral Springs
The most frequently occuring commute durations in Mineral Springs are 30 to 34 minutes (310 commuters, 21.3%), 20 to 24 minutes (229 commuters, 15.8%), and 60 to 89 minutes (161 commuters, 11.1%).
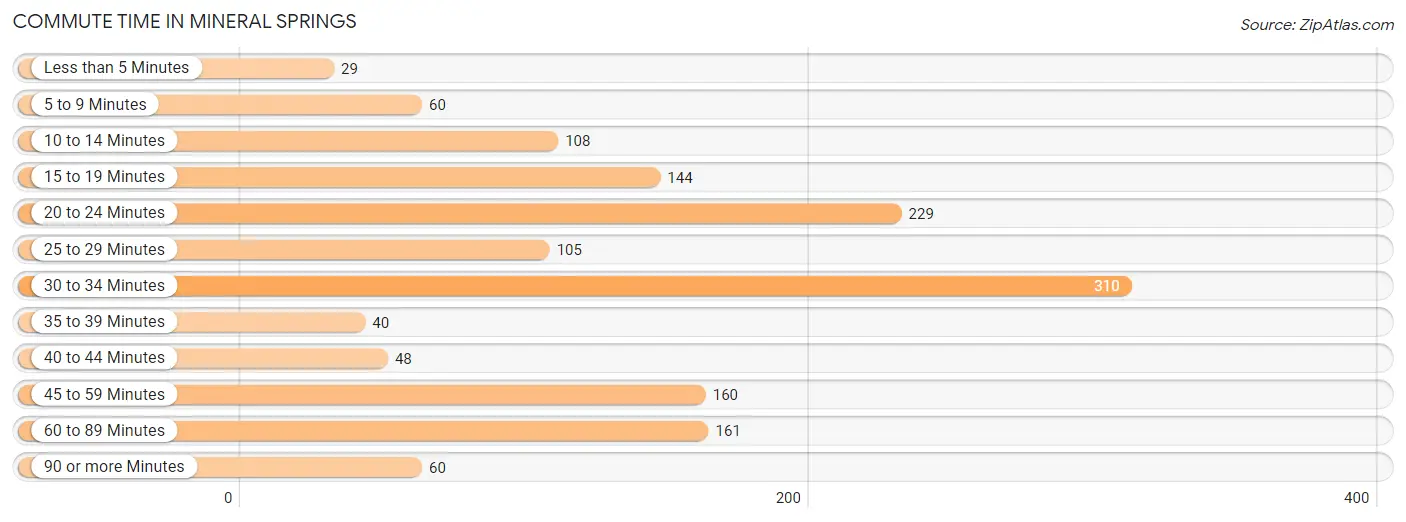
| Commute Time | # Commuters | % Commuters |
| Less than 5 Minutes | 29 | 2.0% |
| 5 to 9 Minutes | 60 | 4.1% |
| 10 to 14 Minutes | 108 | 7.4% |
| 15 to 19 Minutes | 144 | 9.9% |
| 20 to 24 Minutes | 229 | 15.8% |
| 25 to 29 Minutes | 105 | 7.2% |
| 30 to 34 Minutes | 310 | 21.3% |
| 35 to 39 Minutes | 40 | 2.8% |
| 40 to 44 Minutes | 48 | 3.3% |
| 45 to 59 Minutes | 160 | 11.0% |
| 60 to 89 Minutes | 161 | 11.1% |
| 90 or more Minutes | 60 | 4.1% |
Commute Time by Sex in Mineral Springs
The most common commute times in Mineral Springs are 30 to 34 minutes (160 commuters, 21.0%) for males and 30 to 34 minutes (150 commuters, 21.7%) for females.
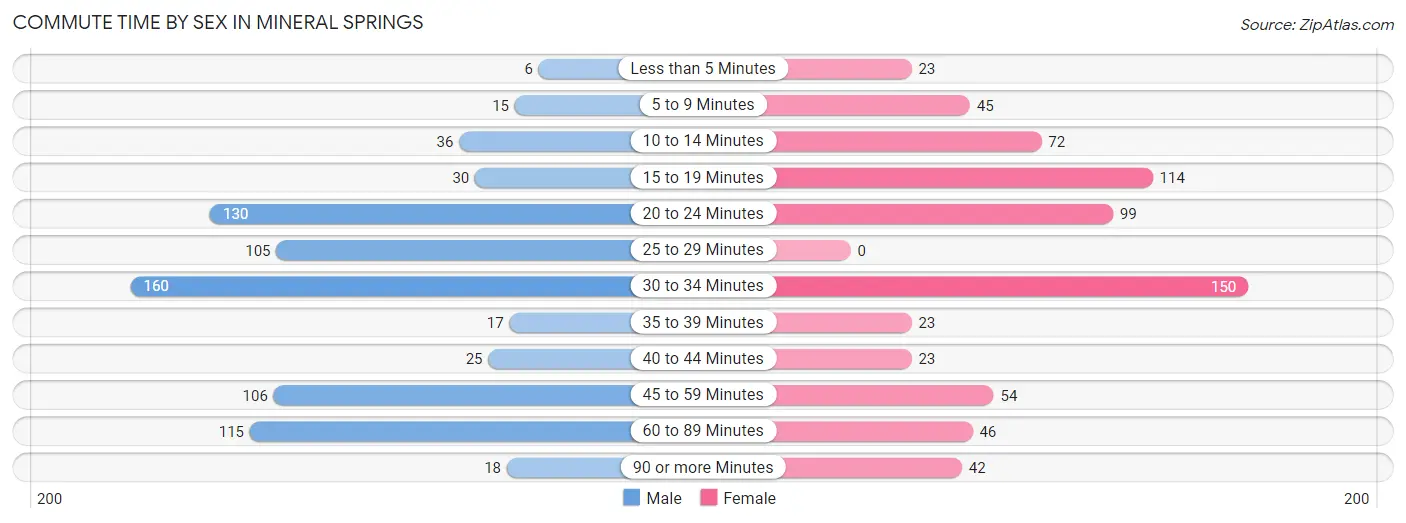
| Commute Time | Male | Female |
| Less than 5 Minutes | 6 (0.8%) | 23 (3.3%) |
| 5 to 9 Minutes | 15 (2.0%) | 45 (6.5%) |
| 10 to 14 Minutes | 36 (4.7%) | 72 (10.4%) |
| 15 to 19 Minutes | 30 (3.9%) | 114 (16.5%) |
| 20 to 24 Minutes | 130 (17.0%) | 99 (14.3%) |
| 25 to 29 Minutes | 105 (13.8%) | 0 (0.0%) |
| 30 to 34 Minutes | 160 (21.0%) | 150 (21.7%) |
| 35 to 39 Minutes | 17 (2.2%) | 23 (3.3%) |
| 40 to 44 Minutes | 25 (3.3%) | 23 (3.3%) |
| 45 to 59 Minutes | 106 (13.9%) | 54 (7.8%) |
| 60 to 89 Minutes | 115 (15.1%) | 46 (6.7%) |
| 90 or more Minutes | 18 (2.4%) | 42 (6.1%) |
Time of Departure to Work by Sex in Mineral Springs
The most frequent times of departure to work in Mineral Springs are 6:30 AM to 6:59 AM (138, 18.1%) for males and 7:00 AM to 7:29 AM (168, 24.3%) for females.
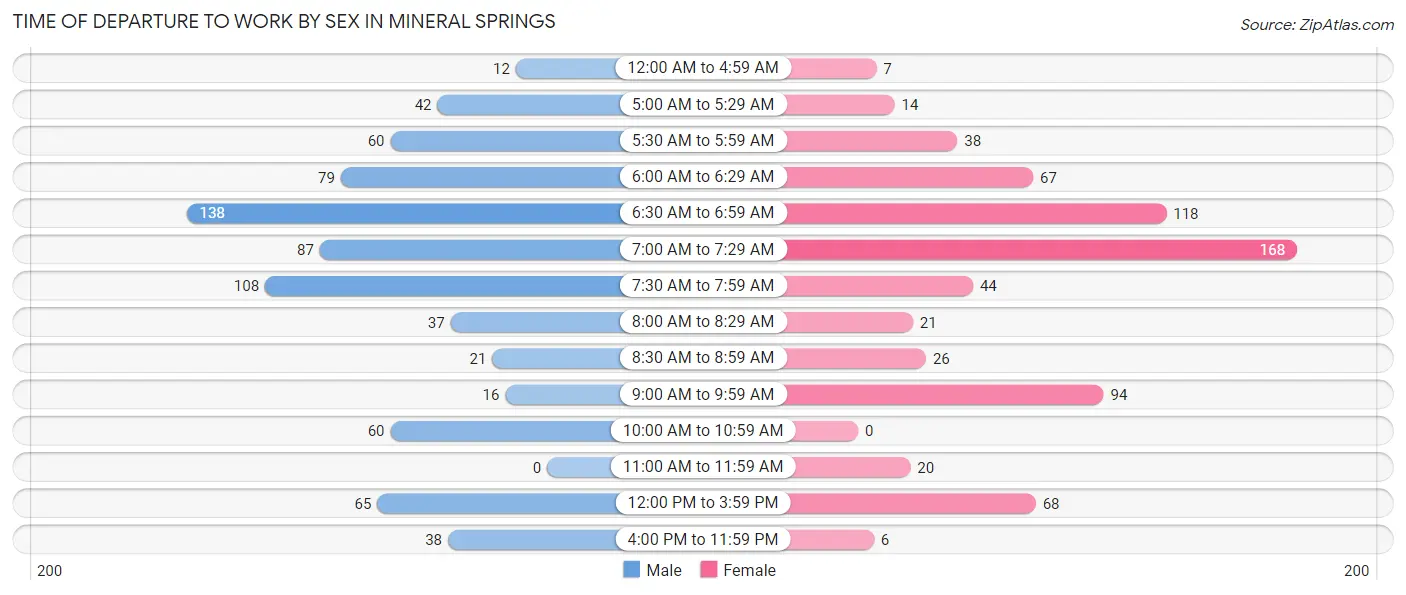
| Time of Departure | Male | Female |
| 12:00 AM to 4:59 AM | 12 (1.6%) | 7 (1.0%) |
| 5:00 AM to 5:29 AM | 42 (5.5%) | 14 (2.0%) |
| 5:30 AM to 5:59 AM | 60 (7.9%) | 38 (5.5%) |
| 6:00 AM to 6:29 AM | 79 (10.3%) | 67 (9.7%) |
| 6:30 AM to 6:59 AM | 138 (18.1%) | 118 (17.1%) |
| 7:00 AM to 7:29 AM | 87 (11.4%) | 168 (24.3%) |
| 7:30 AM to 7:59 AM | 108 (14.1%) | 44 (6.4%) |
| 8:00 AM to 8:29 AM | 37 (4.9%) | 21 (3.0%) |
| 8:30 AM to 8:59 AM | 21 (2.8%) | 26 (3.8%) |
| 9:00 AM to 9:59 AM | 16 (2.1%) | 94 (13.6%) |
| 10:00 AM to 10:59 AM | 60 (7.9%) | 0 (0.0%) |
| 11:00 AM to 11:59 AM | 0 (0.0%) | 20 (2.9%) |
| 12:00 PM to 3:59 PM | 65 (8.5%) | 68 (9.8%) |
| 4:00 PM to 11:59 PM | 38 (5.0%) | 6 (0.9%) |
| Total | 763 (100.0%) | 691 (100.0%) |
Housing Occupancy in Mineral Springs
Occupancy by Ownership in Mineral Springs
Of the total 1,176 dwellings in Mineral Springs, owner-occupied units account for 1,011 (86.0%), while renter-occupied units make up 165 (14.0%).
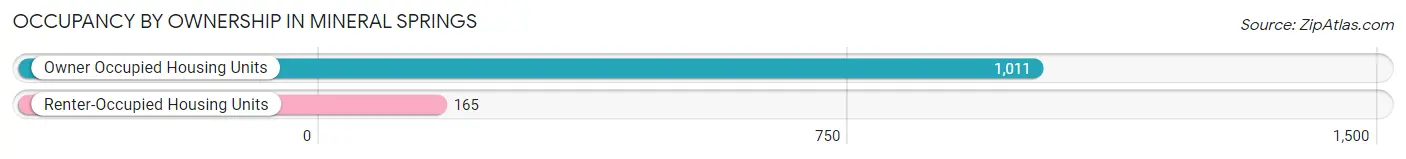
| Occupancy | # Housing Units | % Housing Units |
| Owner Occupied Housing Units | 1,011 | 86.0% |
| Renter-Occupied Housing Units | 165 | 14.0% |
| Total Occupied Housing Units | 1,176 | 100.0% |
Occupancy by Household Size in Mineral Springs
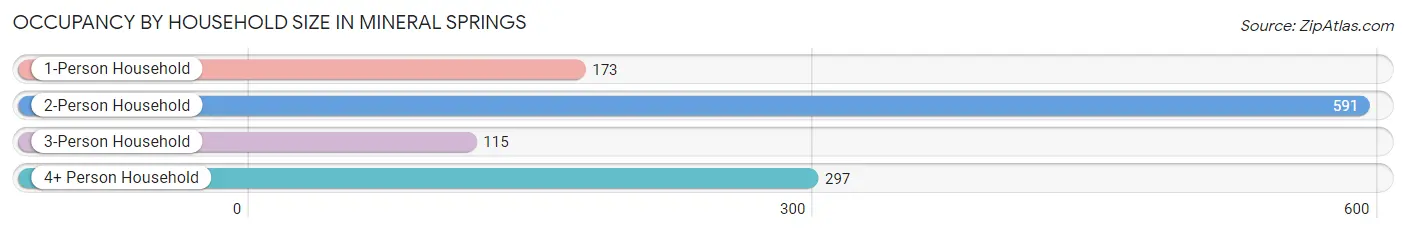
| Household Size | # Housing Units | % Housing Units |
| 1-Person Household | 173 | 14.7% |
| 2-Person Household | 591 | 50.3% |
| 3-Person Household | 115 | 9.8% |
| 4+ Person Household | 297 | 25.3% |
| Total Housing Units | 1,176 | 100.0% |
Occupancy by Ownership by Household Size in Mineral Springs
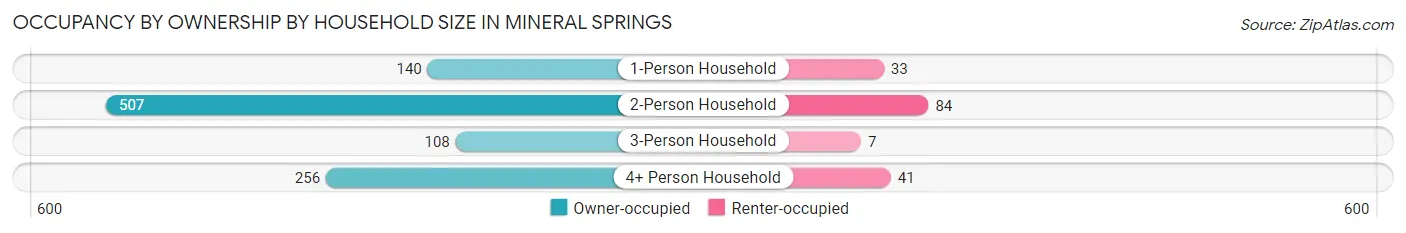
| Household Size | Owner-occupied | Renter-occupied |
| 1-Person Household | 140 (80.9%) | 33 (19.1%) |
| 2-Person Household | 507 (85.8%) | 84 (14.2%) |
| 3-Person Household | 108 (93.9%) | 7 (6.1%) |
| 4+ Person Household | 256 (86.2%) | 41 (13.8%) |
| Total Housing Units | 1,011 (86.0%) | 165 (14.0%) |
Occupancy by Educational Attainment in Mineral Springs
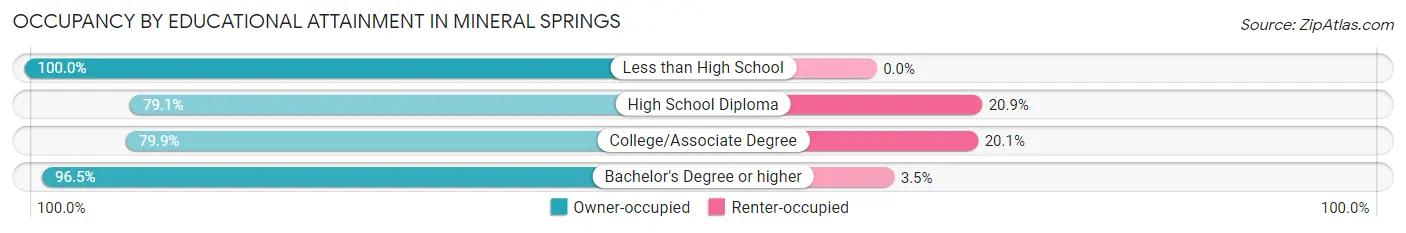
| Household Size | Owner-occupied | Renter-occupied |
| Less than High School | 62 (100.0%) | 0 (0.0%) |
| High School Diploma | 257 (79.1%) | 68 (20.9%) |
| College/Associate Degree | 333 (79.9%) | 84 (20.1%) |
| Bachelor's Degree or higher | 359 (96.5%) | 13 (3.5%) |
Occupancy by Age of Householder in Mineral Springs
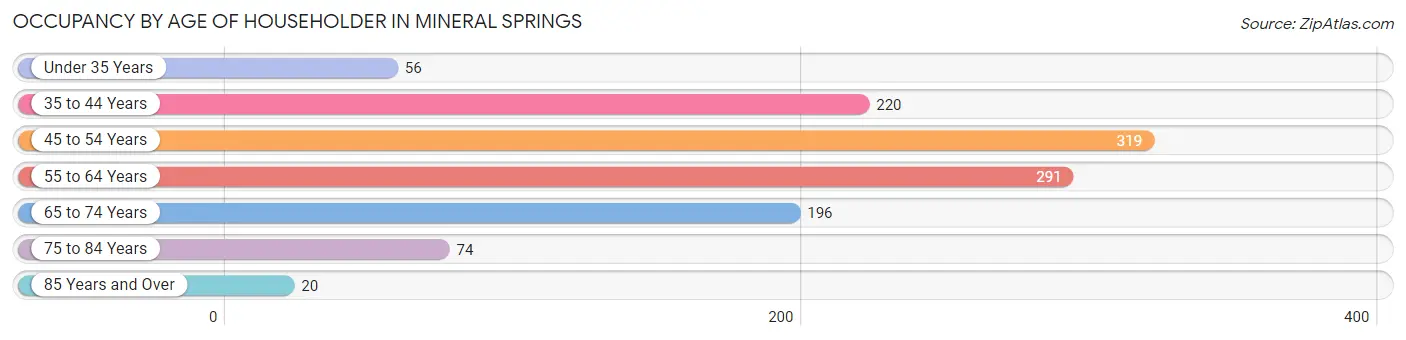
| Age Bracket | # Households | % Households |
| Under 35 Years | 56 | 4.8% |
| 35 to 44 Years | 220 | 18.7% |
| 45 to 54 Years | 319 | 27.1% |
| 55 to 64 Years | 291 | 24.7% |
| 65 to 74 Years | 196 | 16.7% |
| 75 to 84 Years | 74 | 6.3% |
| 85 Years and Over | 20 | 1.7% |
| Total | 1,176 | 100.0% |
Housing Finances in Mineral Springs
Median Income by Occupancy in Mineral Springs
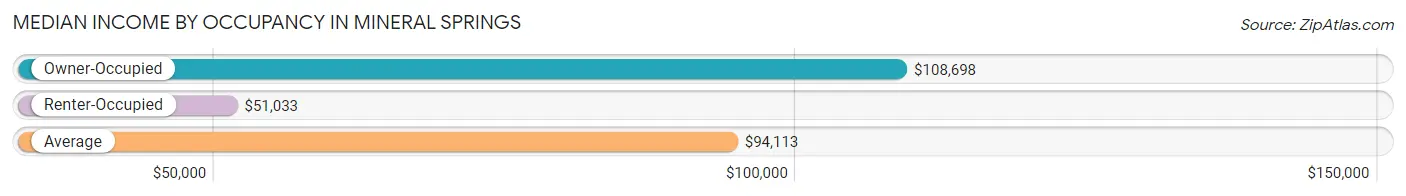
| Occupancy Type | # Households | Median Income |
| Owner-Occupied | 1,011 (86.0%) | $108,698 |
| Renter-Occupied | 165 (14.0%) | $51,033 |
| Average | 1,176 (100.0%) | $94,113 |
Occupancy by Householder Income Bracket in Mineral Springs
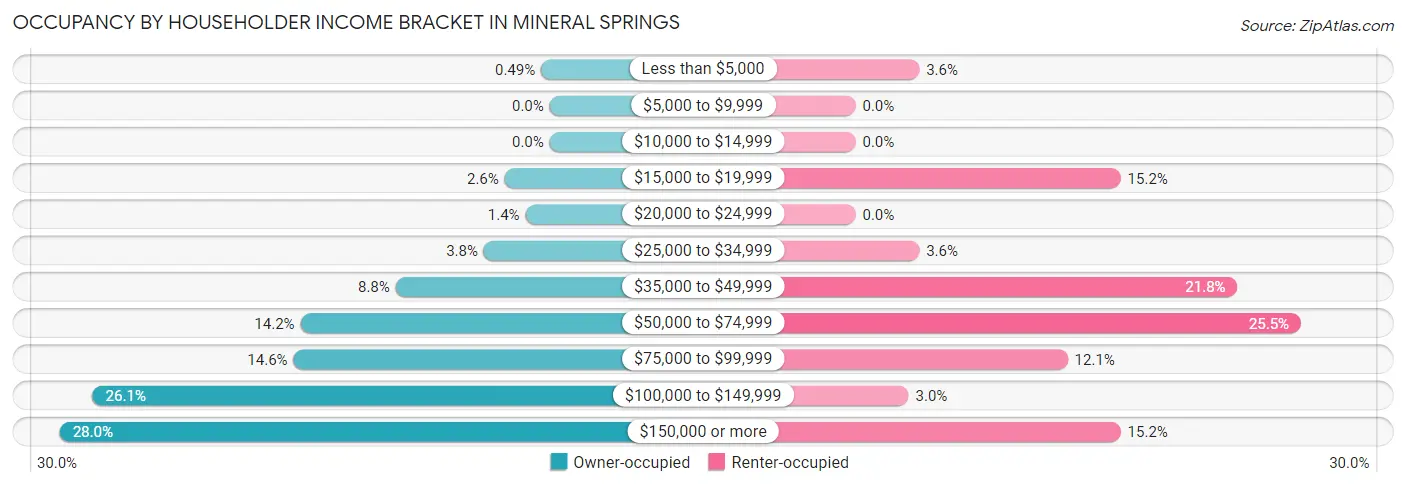
| Income Bracket | Owner-occupied | Renter-occupied |
| Less than $5,000 | 5 (0.5%) | 6 (3.6%) |
| $5,000 to $9,999 | 0 (0.0%) | 0 (0.0%) |
| $10,000 to $14,999 | 0 (0.0%) | 0 (0.0%) |
| $15,000 to $19,999 | 26 (2.6%) | 25 (15.1%) |
| $20,000 to $24,999 | 14 (1.4%) | 0 (0.0%) |
| $25,000 to $34,999 | 38 (3.8%) | 6 (3.6%) |
| $35,000 to $49,999 | 89 (8.8%) | 36 (21.8%) |
| $50,000 to $74,999 | 144 (14.2%) | 42 (25.5%) |
| $75,000 to $99,999 | 148 (14.6%) | 20 (12.1%) |
| $100,000 to $149,999 | 264 (26.1%) | 5 (3.0%) |
| $150,000 or more | 283 (28.0%) | 25 (15.1%) |
| Total | 1,011 (100.0%) | 165 (100.0%) |
Monthly Housing Cost Tiers in Mineral Springs
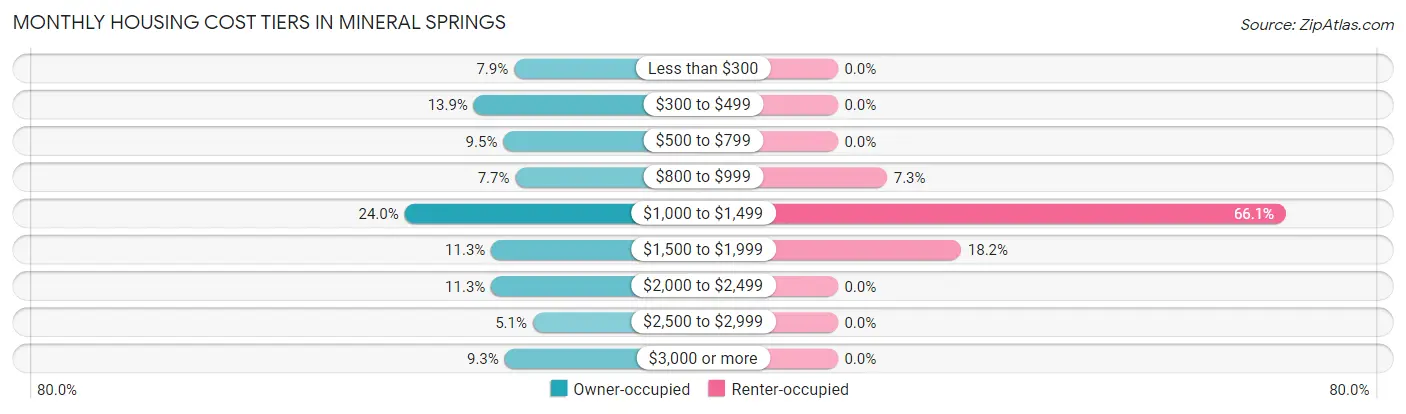
| Monthly Cost | Owner-occupied | Renter-occupied |
| Less than $300 | 80 (7.9%) | 0 (0.0%) |
| $300 to $499 | 140 (13.9%) | 0 (0.0%) |
| $500 to $799 | 96 (9.5%) | 0 (0.0%) |
| $800 to $999 | 78 (7.7%) | 12 (7.3%) |
| $1,000 to $1,499 | 243 (24.0%) | 109 (66.1%) |
| $1,500 to $1,999 | 114 (11.3%) | 30 (18.2%) |
| $2,000 to $2,499 | 114 (11.3%) | 0 (0.0%) |
| $2,500 to $2,999 | 52 (5.1%) | 0 (0.0%) |
| $3,000 or more | 94 (9.3%) | 0 (0.0%) |
| Total | 1,011 (100.0%) | 165 (100.0%) |
Physical Housing Characteristics in Mineral Springs
Housing Structures in Mineral Springs
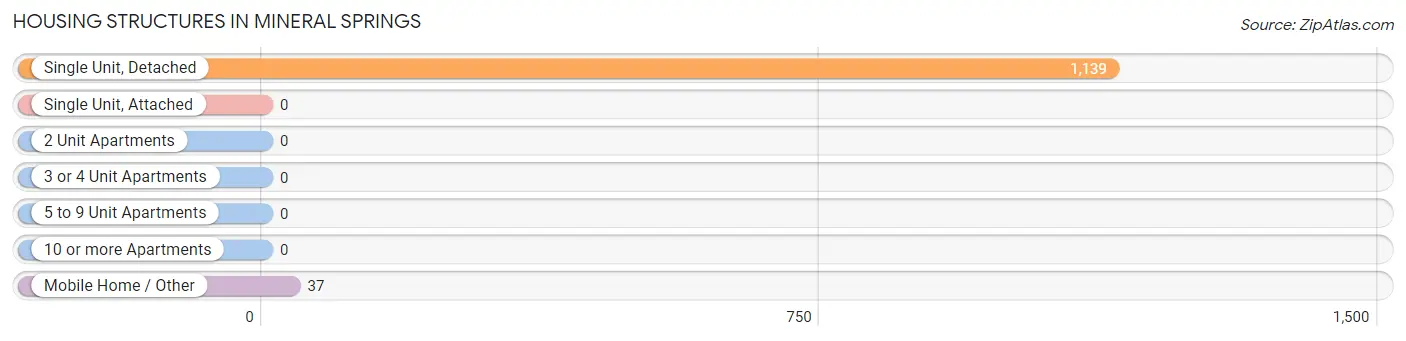
| Structure Type | # Housing Units | % Housing Units |
| Single Unit, Detached | 1,139 | 96.9% |
| Single Unit, Attached | 0 | 0.0% |
| 2 Unit Apartments | 0 | 0.0% |
| 3 or 4 Unit Apartments | 0 | 0.0% |
| 5 to 9 Unit Apartments | 0 | 0.0% |
| 10 or more Apartments | 0 | 0.0% |
| Mobile Home / Other | 37 | 3.2% |
| Total | 1,176 | 100.0% |
Housing Structures by Occupancy in Mineral Springs
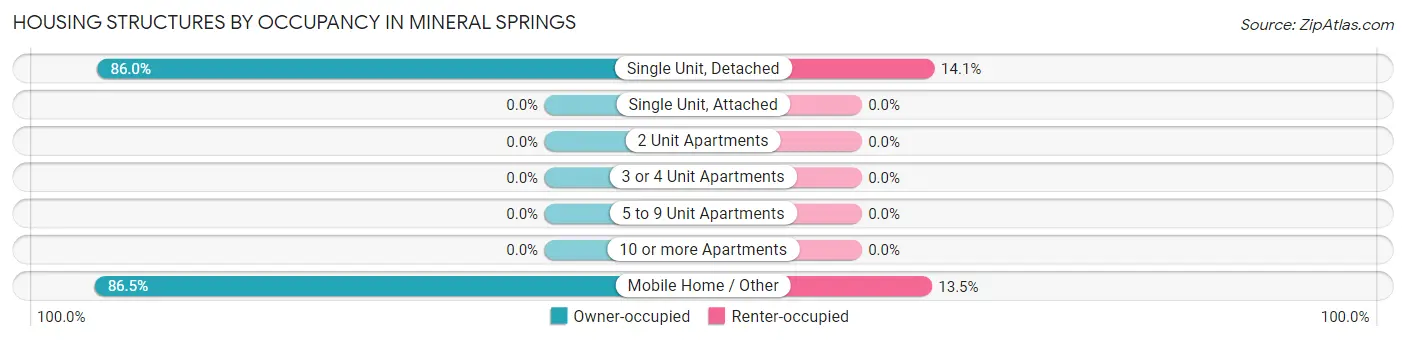
| Structure Type | Owner-occupied | Renter-occupied |
| Single Unit, Detached | 979 (86.0%) | 160 (14.1%) |
| Single Unit, Attached | 0 (0.0%) | 0 (0.0%) |
| 2 Unit Apartments | 0 (0.0%) | 0 (0.0%) |
| 3 or 4 Unit Apartments | 0 (0.0%) | 0 (0.0%) |
| 5 to 9 Unit Apartments | 0 (0.0%) | 0 (0.0%) |
| 10 or more Apartments | 0 (0.0%) | 0 (0.0%) |
| Mobile Home / Other | 32 (86.5%) | 5 (13.5%) |
| Total | 1,011 (86.0%) | 165 (14.0%) |
Housing Structures by Number of Rooms in Mineral Springs
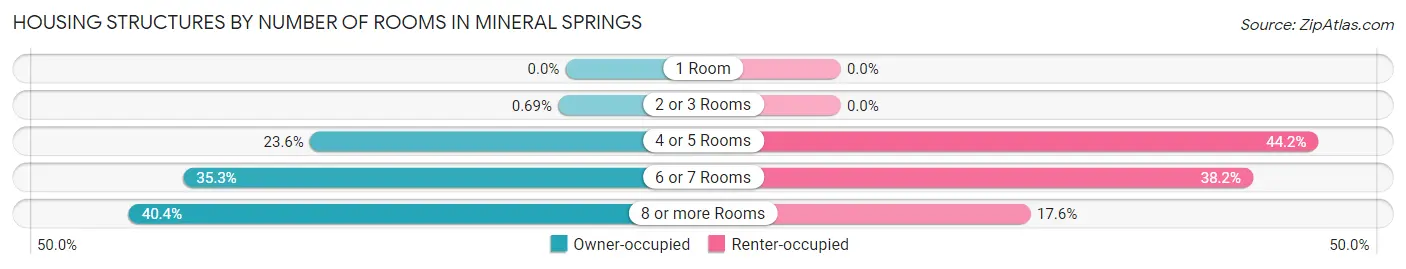
| Number of Rooms | Owner-occupied | Renter-occupied |
| 1 Room | 0 (0.0%) | 0 (0.0%) |
| 2 or 3 Rooms | 7 (0.7%) | 0 (0.0%) |
| 4 or 5 Rooms | 239 (23.6%) | 73 (44.2%) |
| 6 or 7 Rooms | 357 (35.3%) | 63 (38.2%) |
| 8 or more Rooms | 408 (40.4%) | 29 (17.6%) |
| Total | 1,011 (100.0%) | 165 (100.0%) |
Housing Structure by Heating Type in Mineral Springs
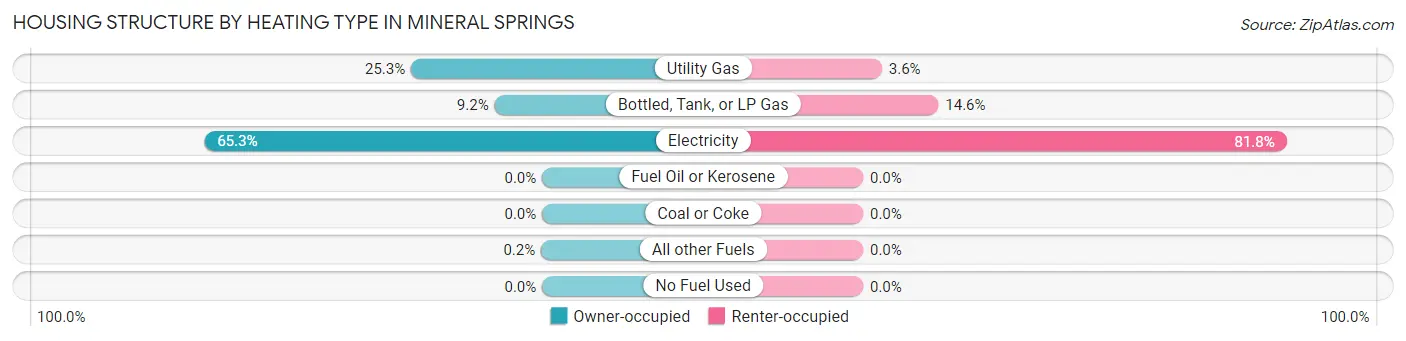
| Heating Type | Owner-occupied | Renter-occupied |
| Utility Gas | 256 (25.3%) | 6 (3.6%) |
| Bottled, Tank, or LP Gas | 93 (9.2%) | 24 (14.5%) |
| Electricity | 660 (65.3%) | 135 (81.8%) |
| Fuel Oil or Kerosene | 0 (0.0%) | 0 (0.0%) |
| Coal or Coke | 0 (0.0%) | 0 (0.0%) |
| All other Fuels | 2 (0.2%) | 0 (0.0%) |
| No Fuel Used | 0 (0.0%) | 0 (0.0%) |
| Total | 1,011 (100.0%) | 165 (100.0%) |
Household Vehicle Usage in Mineral Springs
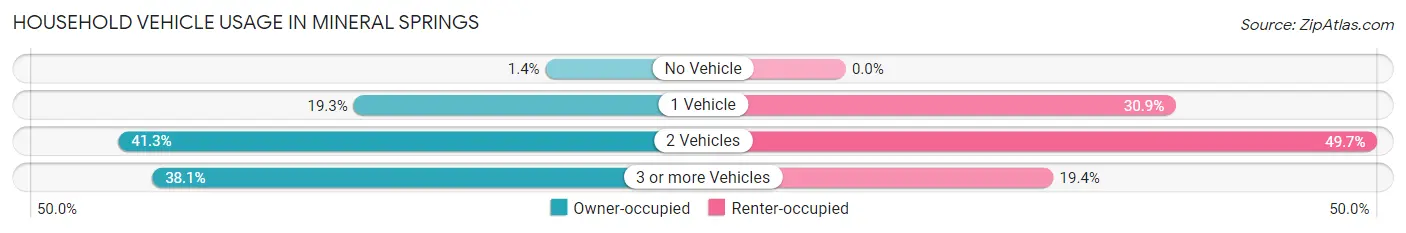
| Vehicles per Household | Owner-occupied | Renter-occupied |
| No Vehicle | 14 (1.4%) | 0 (0.0%) |
| 1 Vehicle | 195 (19.3%) | 51 (30.9%) |
| 2 Vehicles | 417 (41.2%) | 82 (49.7%) |
| 3 or more Vehicles | 385 (38.1%) | 32 (19.4%) |
| Total | 1,011 (100.0%) | 165 (100.0%) |
Real Estate & Mortgages in Mineral Springs
Real Estate and Mortgage Overview in Mineral Springs
| Characteristic | Without Mortgage | With Mortgage |
| Housing Units | 287 | 724 |
| Median Property Value | $250,700 | $365,400 |
| Median Household Income | $60,560 | $226 |
| Monthly Housing Costs | $397 | $94 |
| Real Estate Taxes | $1,353 | $8 |
Property Value by Mortgage Status in Mineral Springs
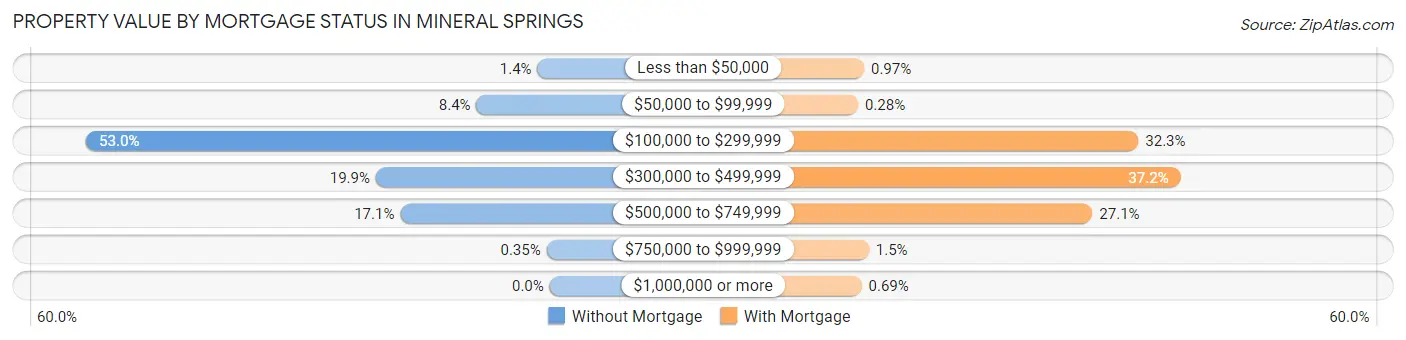
| Property Value | Without Mortgage | With Mortgage |
| Less than $50,000 | 4 (1.4%) | 7 (1.0%) |
| $50,000 to $99,999 | 24 (8.4%) | 2 (0.3%) |
| $100,000 to $299,999 | 152 (53.0%) | 234 (32.3%) |
| $300,000 to $499,999 | 57 (19.9%) | 269 (37.1%) |
| $500,000 to $749,999 | 49 (17.1%) | 196 (27.1%) |
| $750,000 to $999,999 | 1 (0.4%) | 11 (1.5%) |
| $1,000,000 or more | 0 (0.0%) | 5 (0.7%) |
| Total | 287 (100.0%) | 724 (100.0%) |
Household Income by Mortgage Status in Mineral Springs
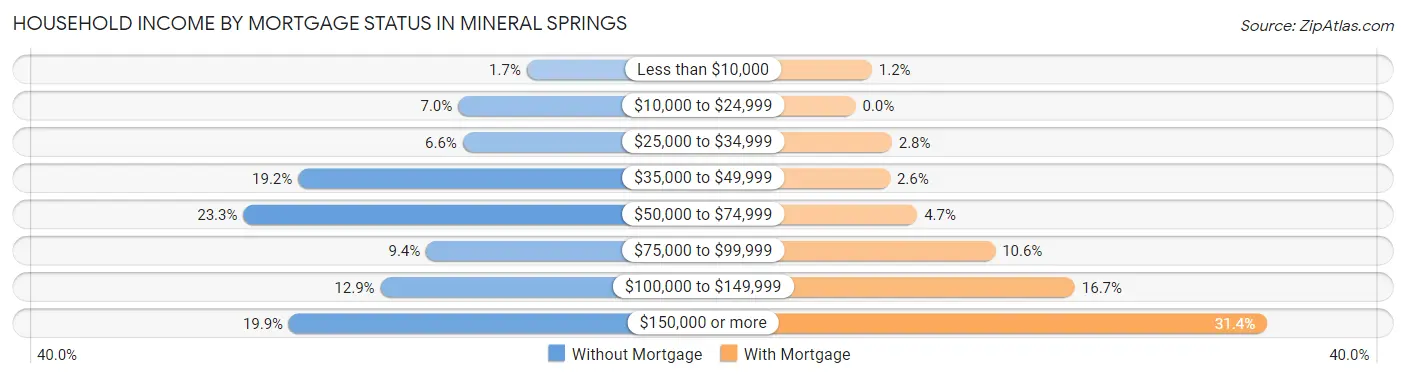
| Household Income | Without Mortgage | With Mortgage |
| Less than $10,000 | 5 (1.7%) | 9 (1.2%) |
| $10,000 to $24,999 | 20 (7.0%) | 0 (0.0%) |
| $25,000 to $34,999 | 19 (6.6%) | 20 (2.8%) |
| $35,000 to $49,999 | 55 (19.2%) | 19 (2.6%) |
| $50,000 to $74,999 | 67 (23.3%) | 34 (4.7%) |
| $75,000 to $99,999 | 27 (9.4%) | 77 (10.6%) |
| $100,000 to $149,999 | 37 (12.9%) | 121 (16.7%) |
| $150,000 or more | 57 (19.9%) | 227 (31.4%) |
| Total | 287 (100.0%) | 724 (100.0%) |
Property Value to Household Income Ratio in Mineral Springs
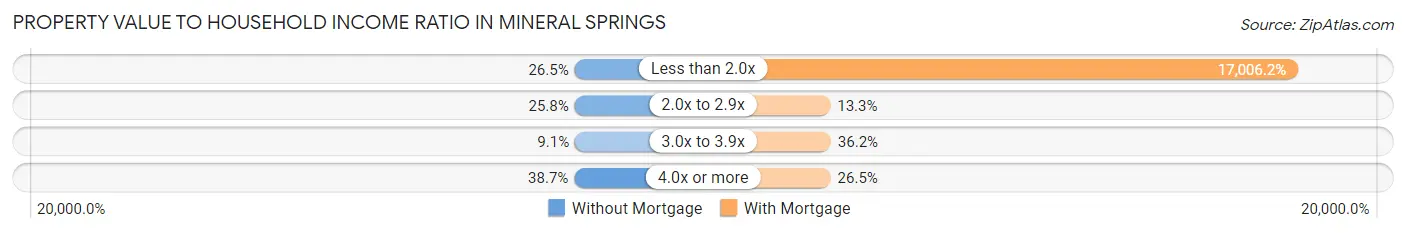
| Value-to-Income Ratio | Without Mortgage | With Mortgage |
| Less than 2.0x | 76 (26.5%) | 123,125 (17,006.2%) |
| 2.0x to 2.9x | 74 (25.8%) | 96 (13.3%) |
| 3.0x to 3.9x | 26 (9.1%) | 262 (36.2%) |
| 4.0x or more | 111 (38.7%) | 192 (26.5%) |
| Total | 287 (100.0%) | 724 (100.0%) |
Real Estate Taxes by Mortgage Status in Mineral Springs
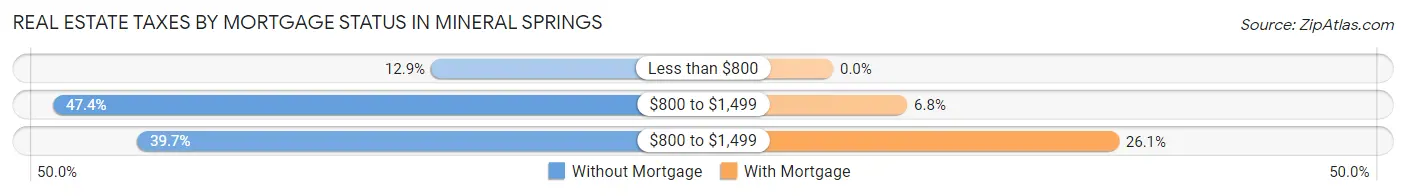
| Property Taxes | Without Mortgage | With Mortgage |
| Less than $800 | 37 (12.9%) | 0 (0.0%) |
| $800 to $1,499 | 136 (47.4%) | 49 (6.8%) |
| $800 to $1,499 | 114 (39.7%) | 189 (26.1%) |
| Total | 287 (100.0%) | 724 (100.0%) |
Health & Disability in Mineral Springs
Health Insurance Coverage by Age in Mineral Springs
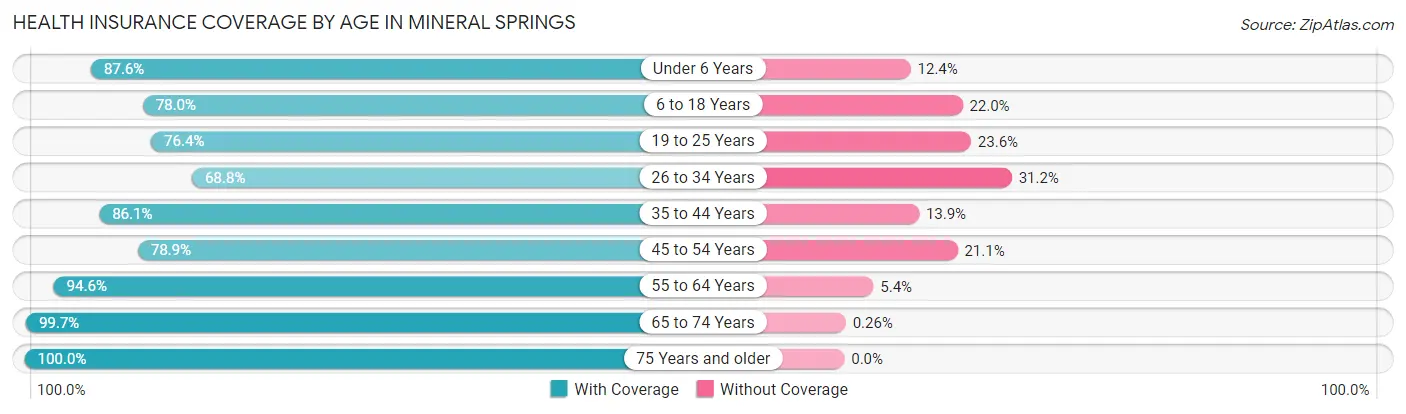
| Age Bracket | With Coverage | Without Coverage |
| Under 6 Years | 163 (87.6%) | 23 (12.4%) |
| 6 to 18 Years | 269 (78.0%) | 76 (22.0%) |
| 19 to 25 Years | 233 (76.4%) | 72 (23.6%) |
| 26 to 34 Years | 152 (68.8%) | 69 (31.2%) |
| 35 to 44 Years | 371 (86.1%) | 60 (13.9%) |
| 45 to 54 Years | 497 (78.9%) | 133 (21.1%) |
| 55 to 64 Years | 523 (94.6%) | 30 (5.4%) |
| 65 to 74 Years | 387 (99.7%) | 1 (0.3%) |
| 75 Years and older | 126 (100.0%) | 0 (0.0%) |
| Total | 2,721 (85.4%) | 464 (14.6%) |
Health Insurance Coverage by Citizenship Status in Mineral Springs
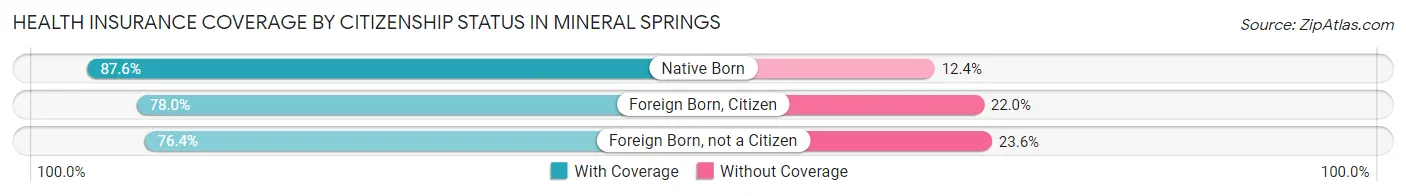
| Citizenship Status | With Coverage | Without Coverage |
| Native Born | 163 (87.6%) | 23 (12.4%) |
| Foreign Born, Citizen | 269 (78.0%) | 76 (22.0%) |
| Foreign Born, not a Citizen | 233 (76.4%) | 72 (23.6%) |
Health Insurance Coverage by Household Income in Mineral Springs
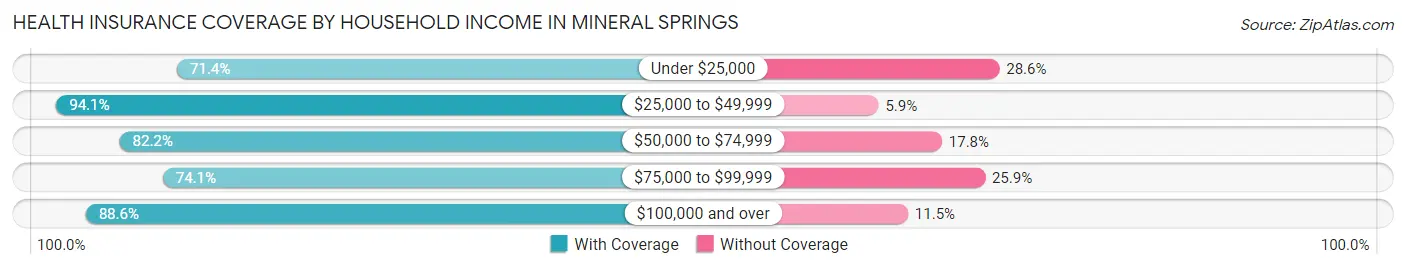
| Household Income | With Coverage | Without Coverage |
| Under $25,000 | 90 (71.4%) | 36 (28.6%) |
| $25,000 to $49,999 | 301 (94.1%) | 19 (5.9%) |
| $50,000 to $74,999 | 397 (82.2%) | 86 (17.8%) |
| $75,000 to $99,999 | 332 (74.1%) | 116 (25.9%) |
| $100,000 and over | 1,601 (88.5%) | 207 (11.5%) |
Public vs Private Health Insurance Coverage by Age in Mineral Springs
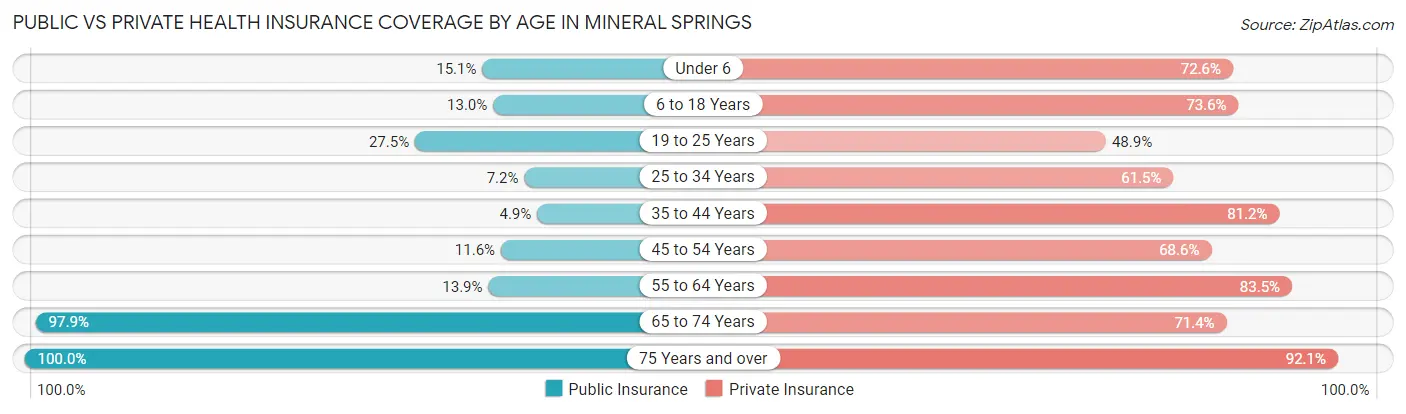
| Age Bracket | Public Insurance | Private Insurance |
| Under 6 | 28 (15.0%) | 135 (72.6%) |
| 6 to 18 Years | 45 (13.0%) | 254 (73.6%) |
| 19 to 25 Years | 84 (27.5%) | 149 (48.8%) |
| 25 to 34 Years | 16 (7.2%) | 136 (61.5%) |
| 35 to 44 Years | 21 (4.9%) | 350 (81.2%) |
| 45 to 54 Years | 73 (11.6%) | 432 (68.6%) |
| 55 to 64 Years | 77 (13.9%) | 462 (83.5%) |
| 65 to 74 Years | 380 (97.9%) | 277 (71.4%) |
| 75 Years and over | 126 (100.0%) | 116 (92.1%) |
| Total | 850 (26.7%) | 2,311 (72.6%) |
Disability Status by Sex by Age in Mineral Springs
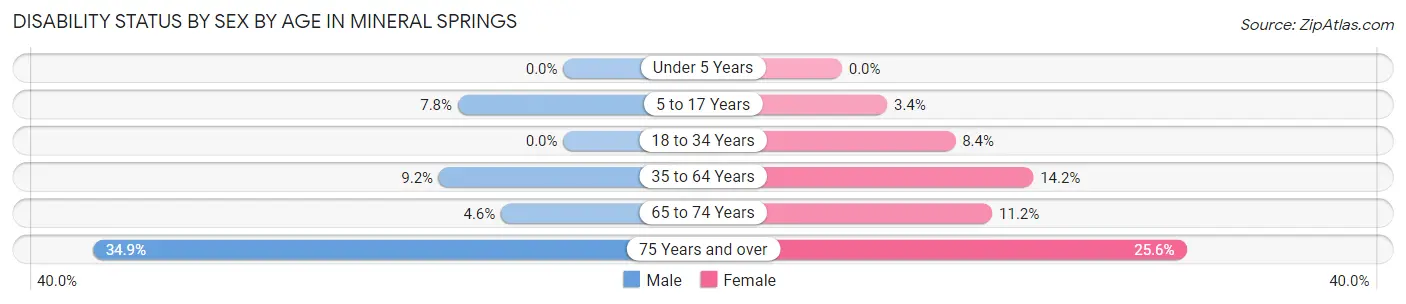
| Age Bracket | Male | Female |
| Under 5 Years | 0 (0.0%) | 0 (0.0%) |
| 5 to 17 Years | 18 (7.8%) | 4 (3.4%) |
| 18 to 34 Years | 0 (0.0%) | 24 (8.4%) |
| 35 to 64 Years | 77 (9.2%) | 111 (14.2%) |
| 65 to 74 Years | 8 (4.6%) | 24 (11.2%) |
| 75 Years and over | 29 (34.9%) | 11 (25.6%) |
Disability Class by Sex by Age in Mineral Springs
Disability Class: Hearing Difficulty
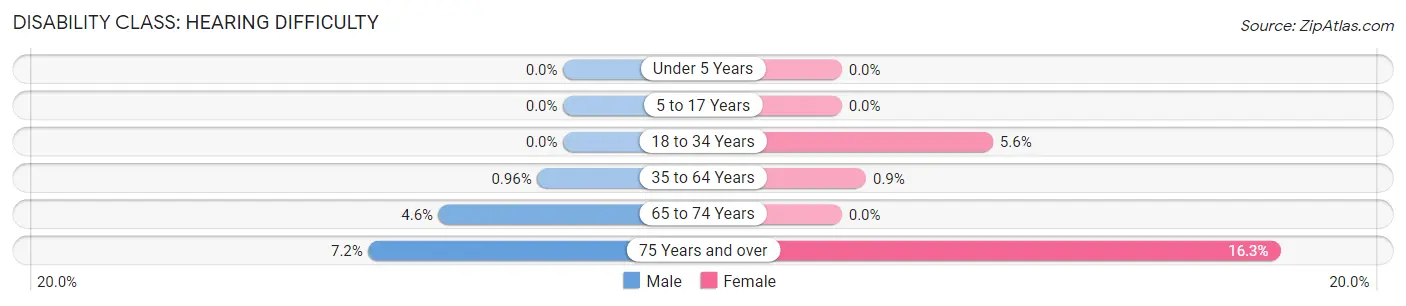
| Age Bracket | Male | Female |
| Under 5 Years | 0 (0.0%) | 0 (0.0%) |
| 5 to 17 Years | 0 (0.0%) | 0 (0.0%) |
| 18 to 34 Years | 0 (0.0%) | 16 (5.6%) |
| 35 to 64 Years | 8 (1.0%) | 7 (0.9%) |
| 65 to 74 Years | 8 (4.6%) | 0 (0.0%) |
| 75 Years and over | 6 (7.2%) | 7 (16.3%) |
Disability Class: Vision Difficulty
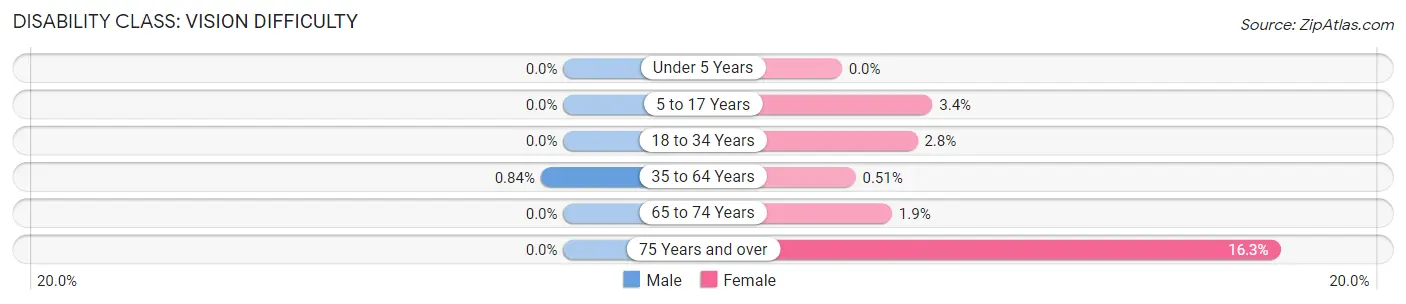
| Age Bracket | Male | Female |
| Under 5 Years | 0 (0.0%) | 0 (0.0%) |
| 5 to 17 Years | 0 (0.0%) | 4 (3.4%) |
| 18 to 34 Years | 0 (0.0%) | 8 (2.8%) |
| 35 to 64 Years | 7 (0.8%) | 4 (0.5%) |
| 65 to 74 Years | 0 (0.0%) | 4 (1.9%) |
| 75 Years and over | 0 (0.0%) | 7 (16.3%) |
Disability Class: Cognitive Difficulty
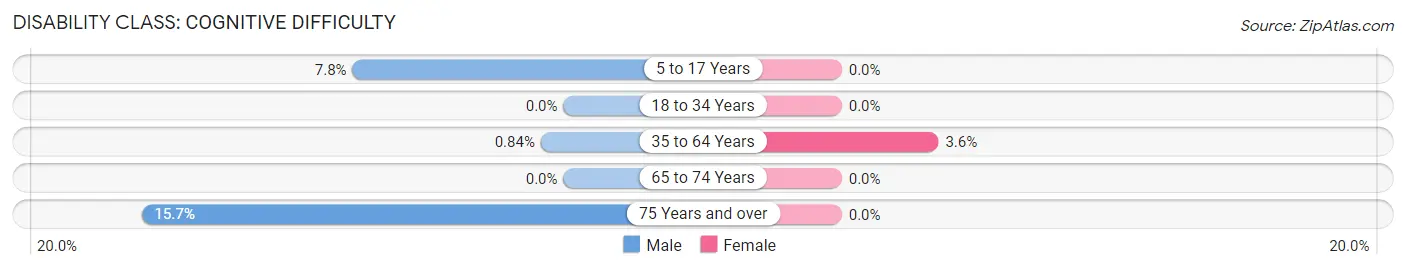
| Age Bracket | Male | Female |
| 5 to 17 Years | 18 (7.8%) | 0 (0.0%) |
| 18 to 34 Years | 0 (0.0%) | 0 (0.0%) |
| 35 to 64 Years | 7 (0.8%) | 28 (3.6%) |
| 65 to 74 Years | 0 (0.0%) | 0 (0.0%) |
| 75 Years and over | 13 (15.7%) | 0 (0.0%) |
Disability Class: Ambulatory Difficulty
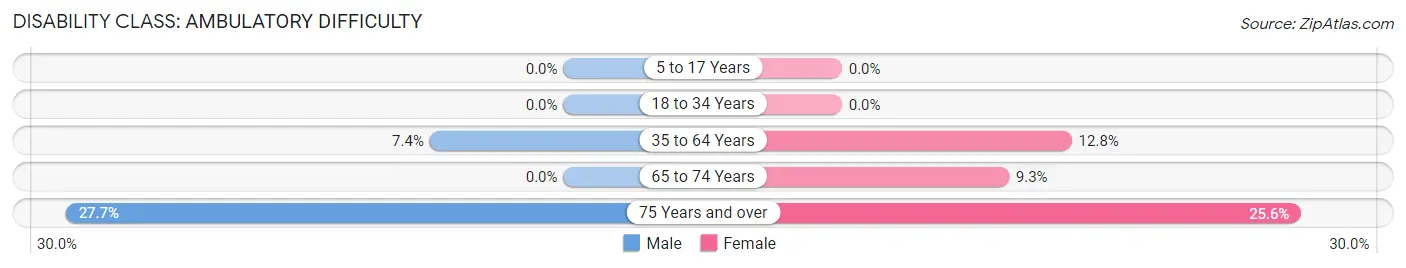
| Age Bracket | Male | Female |
| 5 to 17 Years | 0 (0.0%) | 0 (0.0%) |
| 18 to 34 Years | 0 (0.0%) | 0 (0.0%) |
| 35 to 64 Years | 62 (7.4%) | 100 (12.8%) |
| 65 to 74 Years | 0 (0.0%) | 20 (9.3%) |
| 75 Years and over | 23 (27.7%) | 11 (25.6%) |
Disability Class: Self-Care Difficulty
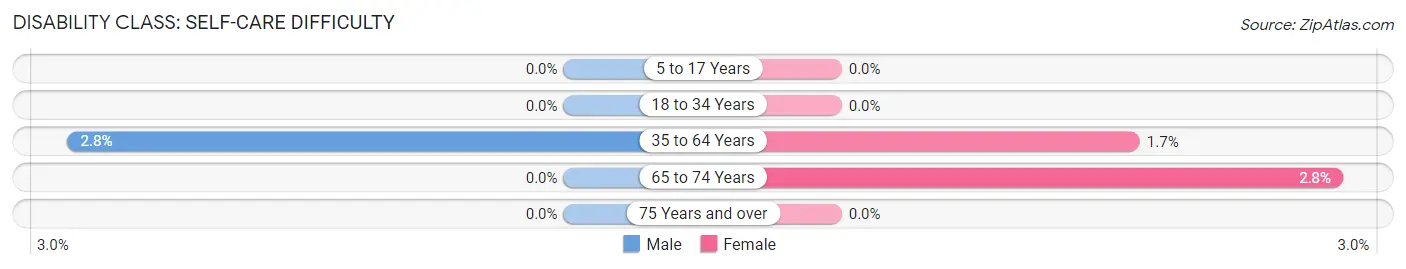
| Age Bracket | Male | Female |
| 5 to 17 Years | 0 (0.0%) | 0 (0.0%) |
| 18 to 34 Years | 0 (0.0%) | 0 (0.0%) |
| 35 to 64 Years | 23 (2.8%) | 13 (1.7%) |
| 65 to 74 Years | 0 (0.0%) | 6 (2.8%) |
| 75 Years and over | 0 (0.0%) | 0 (0.0%) |
Technology Access in Mineral Springs
Computing Device Access in Mineral Springs
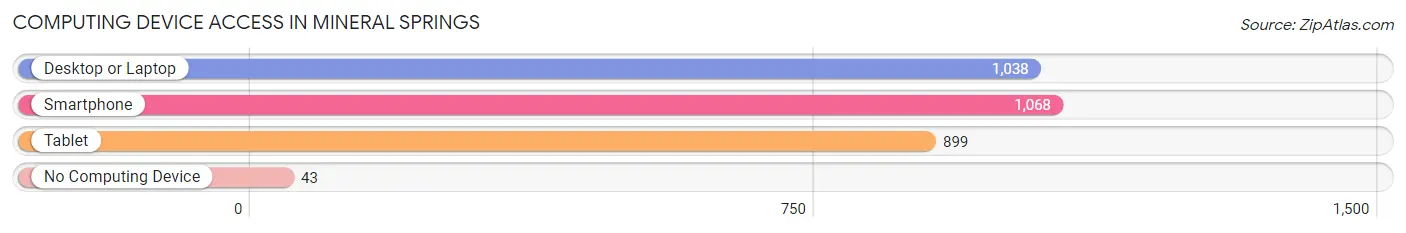
| Device Type | # Households | % Households |
| Desktop or Laptop | 1,038 | 88.3% |
| Smartphone | 1,068 | 90.8% |
| Tablet | 899 | 76.4% |
| No Computing Device | 43 | 3.7% |
| Total | 1,176 | 100.0% |
Internet Access in Mineral Springs
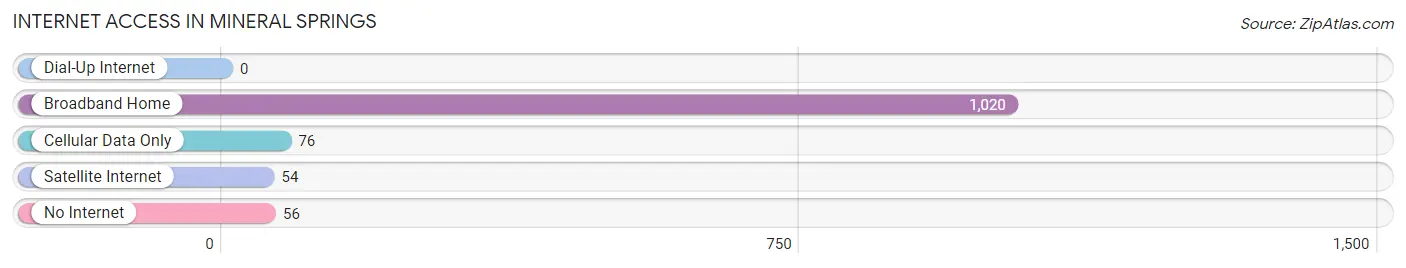
| Internet Type | # Households | % Households |
| Dial-Up Internet | 0 | 0.0% |
| Broadband Home | 1,020 | 86.7% |
| Cellular Data Only | 76 | 6.5% |
| Satellite Internet | 54 | 4.6% |
| No Internet | 56 | 4.8% |
| Total | 1,176 | 100.0% |
Mineral Springs Summary
Mineral Springs is a small town located in Union County, North Carolina. It is situated in the foothills of the Blue Ridge Mountains, approximately 25 miles east of Charlotte. The town was founded in 1845 and is named for the mineral springs that were discovered in the area. The population of Mineral Springs was 1,845 at the time of the 2010 census.
Geography
Mineral Springs is located at 35°17'25"N 80°37'45"W (35.290278, -80.629167). The town is situated in the foothills of the Blue Ridge Mountains, approximately 25 miles east of Charlotte. The town is located in the Piedmont region of North Carolina, and is part of the Charlotte-Gastonia-Concord Metropolitan Statistical Area.
The town is situated on the banks of the Rocky River, which flows through the town and is a tributary of the Catawba River. The town is surrounded by rolling hills and forests, and is home to a variety of wildlife, including deer, foxes, and wild turkeys.
Climate
Mineral Springs has a humid subtropical climate, with hot, humid summers and mild winters. The average annual temperature is 61°F (16°C), and the average annual precipitation is 44 inches (112 cm).
Demographics
At the time of the 2010 census, the population of Mineral Springs was 1,845. The racial makeup of the town was 79.3% White, 16.2% African American, 0.3% Native American, 0.7% Asian, 0.1% Pacific Islander, 1.7% from other races, and 1.9% from two or more races. Hispanic or Latino of any race were 3.3% of the population.
Economy
The economy of Mineral Springs is largely based on agriculture and tourism. The town is home to several farms, which produce a variety of crops, including corn, soybeans, and tobacco. The town is also home to several wineries, which produce a variety of wines.
Tourism is an important part of the economy of Mineral Springs. The town is home to several historic sites, including the Mineral Springs Hotel, which was built in 1845 and is listed on the National Register of Historic Places. The town is also home to several parks, including the Mineral Springs Park, which features a lake, picnic areas, and a playground.
Conclusion
Mineral Springs is a small town located in Union County, North Carolina. It is situated in the foothills of the Blue Ridge Mountains, approximately 25 miles east of Charlotte. The town was founded in 1845 and is named for the mineral springs that were discovered in the area. The population of Mineral Springs was 1,845 at the time of the 2010 census. The town is situated on the banks of the Rocky River, and is surrounded by rolling hills and forests. The economy of Mineral Springs is largely based on agriculture and tourism. The town is home to several farms, wineries, and historic sites, as well as several parks.
Common Questions
What is the Total Population of Mineral Springs?
Total Population of Mineral Springs is 3,185.
What is the Total Male Population of Mineral Springs?
Total Male Population of Mineral Springs is 1,659.
What is the Total Female Population of Mineral Springs?
Total Female Population of Mineral Springs is 1,526.
What is the Ratio of Males per 100 Females in Mineral Springs?
There are 108.72 Males per 100 Females in Mineral Springs.
What is the Ratio of Females per 100 Males in Mineral Springs?
There are 91.98 Females per 100 Males in Mineral Springs.
What is the Median Population Age in Mineral Springs?
Median Population Age in Mineral Springs is 47.8 Years.
What is the Average Family Size in Mineral Springs
Average Family Size in Mineral Springs is 3.0 People.
What is the Average Household Size in Mineral Springs
Average Household Size in Mineral Springs is 2.7 People.
What is Per Capita Income in Mineral Springs?
Per Capita income in Mineral Springs is $46,695.
What is the Median Family Income in Mineral Springs?
Median Family Income in Mineral Springs is $109,740.
What is the Median Household income in Mineral Springs?
Median Household Income in Mineral Springs is $94,113.
What is Income or Wage Gap in Mineral Springs?
Income or Wage Gap in Mineral Springs is 14.8%.
Women in Mineral Springs earn 85.2 cents for every dollar earned by a man.
What is Inequality or Gini Index in Mineral Springs?
Inequality or Gini Index in Mineral Springs is 0.40.
How Large is the Labor Force in Mineral Springs?
There are 1,889 People in the Labor Forcein in Mineral Springs.
What is the Percentage of People in the Labor Force in Mineral Springs?
68.5% of People are in the Labor Force in Mineral Springs.
What is the Unemployment Rate in Mineral Springs?
Unemployment Rate in Mineral Springs is 5.2%.