Holden Beach, NC
Holden Beach Map
Holden Beach Overview
997
TOTAL POPULATION
480
MALE POPULATION
517
FEMALE POPULATION
92.84
MALES / 100 FEMALES
107.71
FEMALES / 100 MALES
63.7
MEDIAN AGE
2.3
AVG FAMILY SIZE
2.1
AVG HOUSEHOLD SIZE
$68,093
PER CAPITA INCOME
$119,250
AVG FAMILY INCOME
$106,375
AVG HOUSEHOLD INCOME
65.4%
WAGE / INCOME GAP [ % ]
34.6¢/ $1
WAGE / INCOME GAP [ $ ]
0.44
INEQUALITY / GINI INDEX
432
LABOR FORCE [ PEOPLE ]
45.2%
PERCENT IN LABOR FORCE
2.3%
UNEMPLOYMENT RATE
Holden Beach Area Codes
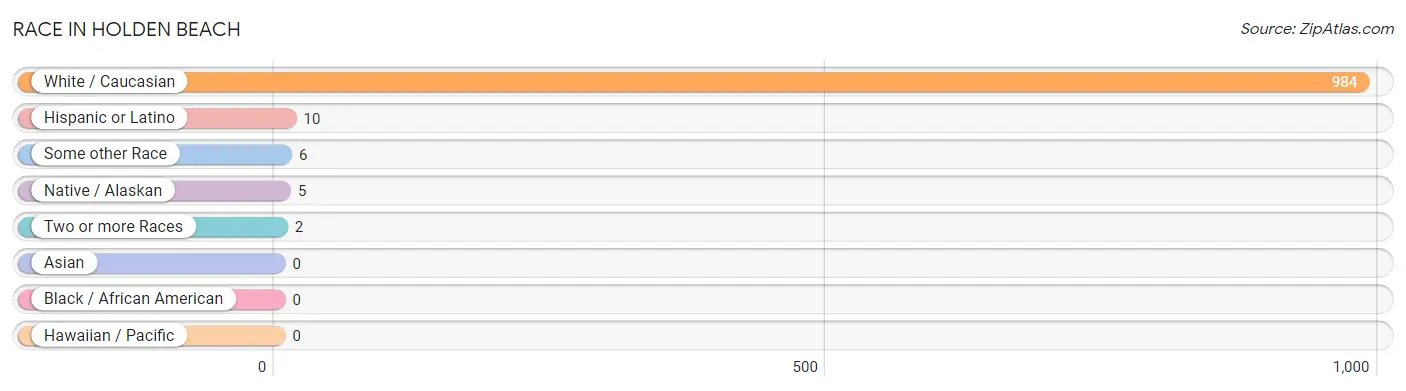
Race in Holden Beach
The most populous races in Holden Beach are White / Caucasian (984 | 98.7%), Hispanic or Latino (10 | 1.0%), and Some other Race (6 | 0.6%).
| Race | # Population | % Population |
| Asian | 0 | 0.0% |
| Black / African American | 0 | 0.0% |
| Hawaiian / Pacific | 0 | 0.0% |
| Hispanic or Latino | 10 | 1.0% |
| Native / Alaskan | 5 | 0.5% |
| White / Caucasian | 984 | 98.7% |
| Two or more Races | 2 | 0.2% |
| Some other Race | 6 | 0.6% |
| Total | 997 | 100.0% |
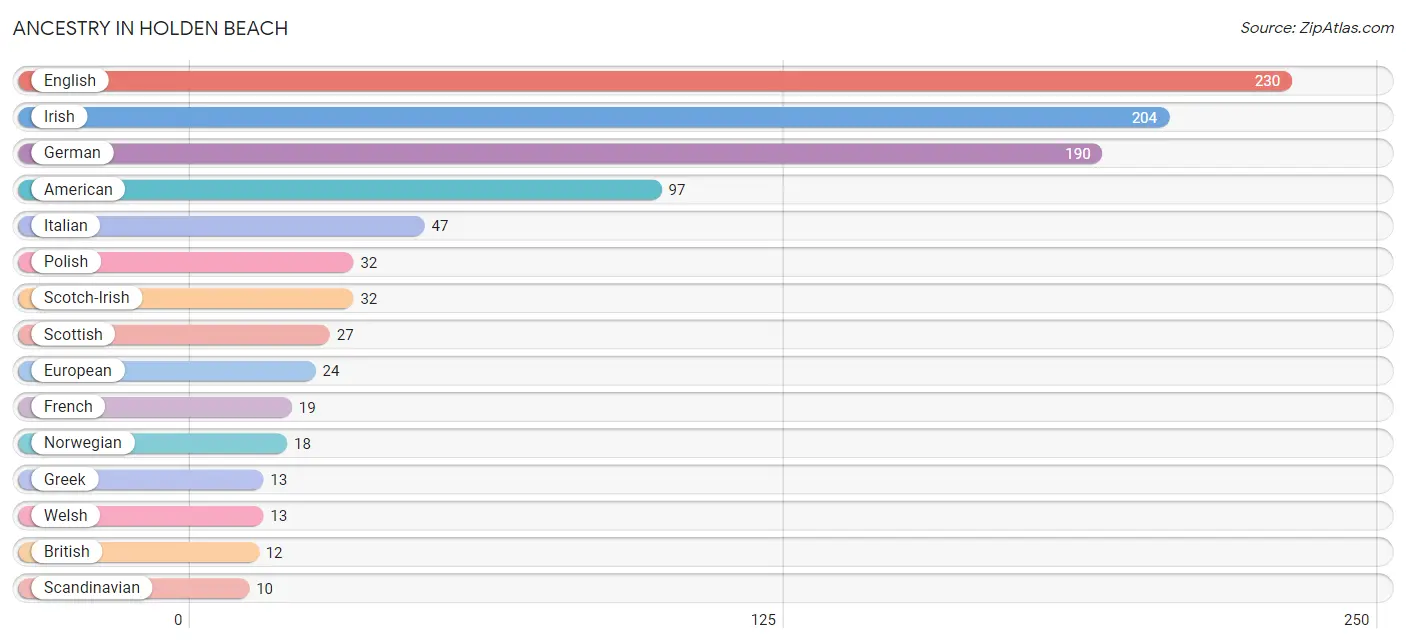
Ancestry in Holden Beach
The most populous ancestries reported in Holden Beach are English (230 | 23.1%), Irish (204 | 20.5%), German (190 | 19.1%), American (97 | 9.7%), and Italian (47 | 4.7%), together accounting for 77.0% of all Holden Beach residents.
| Ancestry | # Population | % Population |
| American | 97 | 9.7% |
| Bahamian | 4 | 0.4% |
| British | 12 | 1.2% |
| Central American | 2 | 0.2% |
| Cherokee | 3 | 0.3% |
| Croatian | 3 | 0.3% |
| Cuban | 2 | 0.2% |
| Czech | 2 | 0.2% |
| Dutch | 5 | 0.5% |
| Eastern European | 7 | 0.7% |
| English | 230 | 23.1% |
| European | 24 | 2.4% |
| French | 19 | 1.9% |
| French Canadian | 5 | 0.5% |
| German | 190 | 19.1% |
| Greek | 13 | 1.3% |
| Hungarian | 2 | 0.2% |
| Irish | 204 | 20.5% |
| Italian | 47 | 4.7% |
| Lithuanian | 4 | 0.4% |
| Nicaraguan | 2 | 0.2% |
| Norwegian | 18 | 1.8% |
| Polish | 32 | 3.2% |
| Portuguese | 2 | 0.2% |
| Russian | 6 | 0.6% |
| Scandinavian | 10 | 1.0% |
| Scotch-Irish | 32 | 3.2% |
| Scottish | 27 | 2.7% |
| Slovene | 2 | 0.2% |
| Spaniard | 4 | 0.4% |
| Spanish | 2 | 0.2% |
| Swedish | 5 | 0.5% |
| Swiss | 3 | 0.3% |
| Welsh | 13 | 1.3% | View All 34 Rows |
Immigrants in Holden Beach
The most numerous immigrant groups reported in Holden Beach came from , and Canada (4 | 0.4%), together accounting for 0.4% of all Holden Beach residents.

| Immigration Origin | # Population | % Population |
| Canada | 4 | 0.4% | View All 1 Rows |
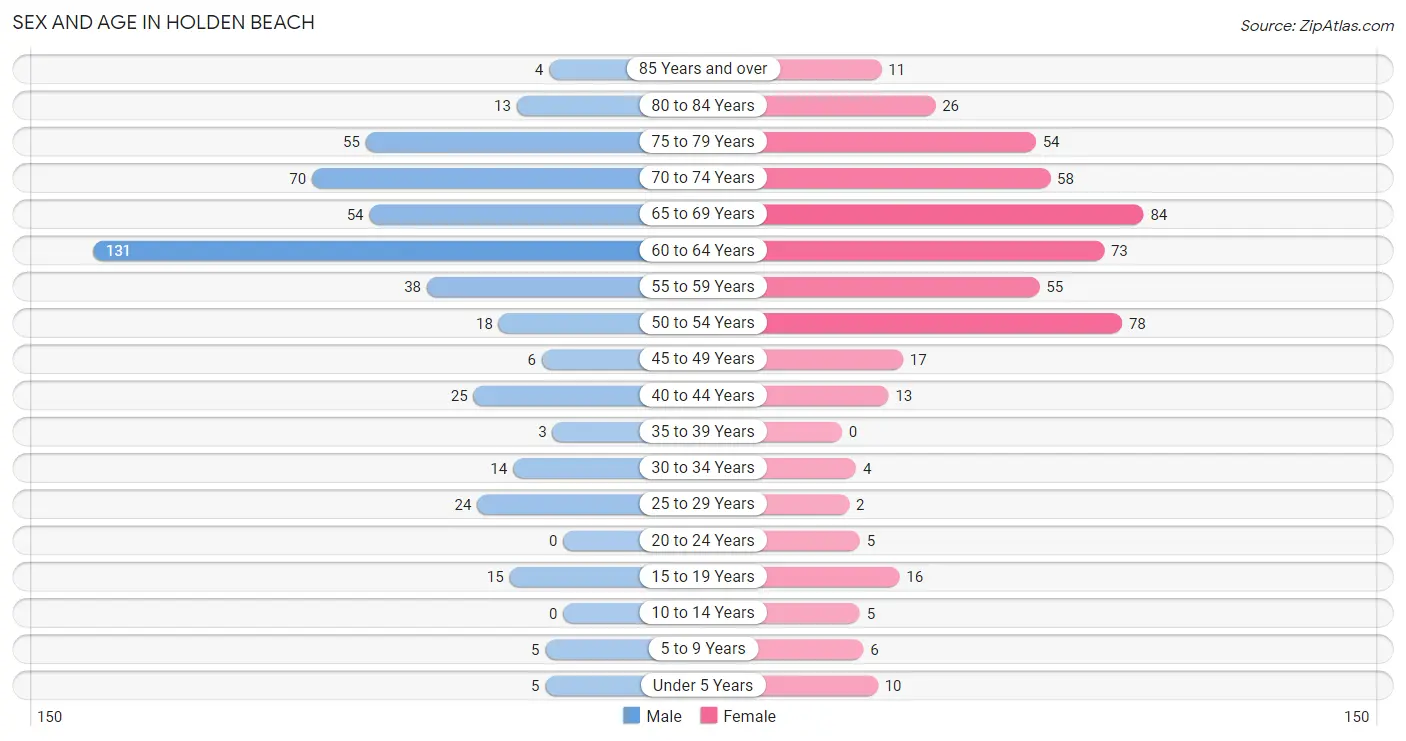
Sex and Age in Holden Beach
Sex and Age in Holden Beach
The most populous age groups in Holden Beach are 60 to 64 Years (131 | 27.3%) for men and 65 to 69 Years (84 | 16.3%) for women.
| Age Bracket | Male | Female |
| Under 5 Years | 5 (1.0%) | 10 (1.9%) |
| 5 to 9 Years | 5 (1.0%) | 6 (1.2%) |
| 10 to 14 Years | 0 (0.0%) | 5 (1.0%) |
| 15 to 19 Years | 15 (3.1%) | 16 (3.1%) |
| 20 to 24 Years | 0 (0.0%) | 5 (1.0%) |
| 25 to 29 Years | 24 (5.0%) | 2 (0.4%) |
| 30 to 34 Years | 14 (2.9%) | 4 (0.8%) |
| 35 to 39 Years | 3 (0.6%) | 0 (0.0%) |
| 40 to 44 Years | 25 (5.2%) | 13 (2.5%) |
| 45 to 49 Years | 6 (1.3%) | 17 (3.3%) |
| 50 to 54 Years | 18 (3.7%) | 78 (15.1%) |
| 55 to 59 Years | 38 (7.9%) | 55 (10.6%) |
| 60 to 64 Years | 131 (27.3%) | 73 (14.1%) |
| 65 to 69 Years | 54 (11.3%) | 84 (16.3%) |
| 70 to 74 Years | 70 (14.6%) | 58 (11.2%) |
| 75 to 79 Years | 55 (11.5%) | 54 (10.4%) |
| 80 to 84 Years | 13 (2.7%) | 26 (5.0%) |
| 85 Years and over | 4 (0.8%) | 11 (2.1%) |
| Total | 480 (100.0%) | 517 (100.0%) |
Families and Households in Holden Beach
Median Family Size in Holden Beach
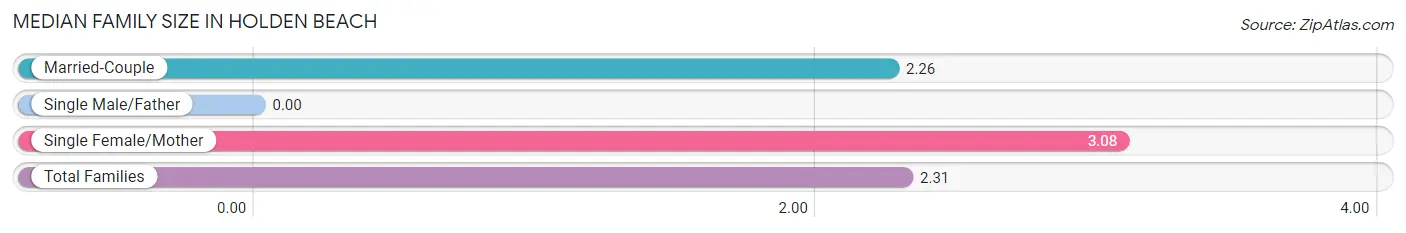
| Family Type | # Families | Family Size |
| Married-Couple | 357 (93.7%) | 2.26 |
| Single Male/Father | 0 (0.0%) | - |
| Single Female/Mother | 24 (6.3%) | 3.08 |
| Total Families | 381 (100.0%) | 2.31 |
Median Household Size in Holden Beach
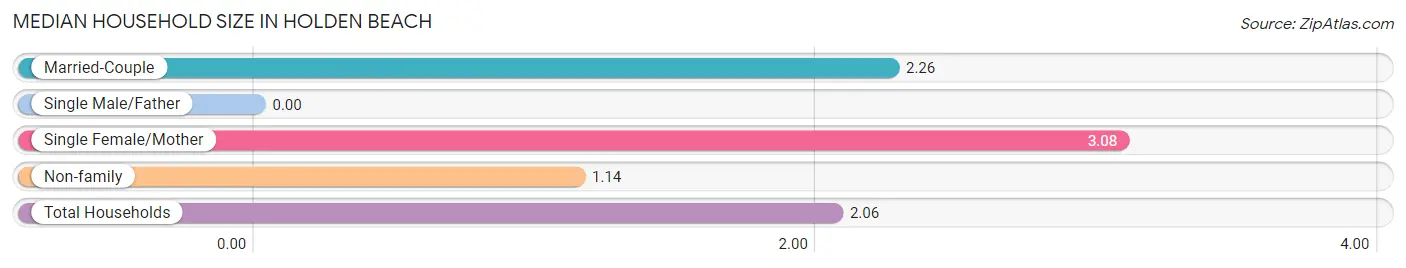
| Household Type | # Households | Household Size |
| Married-Couple | 357 (73.9%) | 2.26 |
| Single Male/Father | 0 (0.0%) | - |
| Single Female/Mother | 24 (5.0%) | 3.08 |
| Non-family | 102 (21.1%) | 1.14 |
| Total Households | 483 (100.0%) | 2.06 |
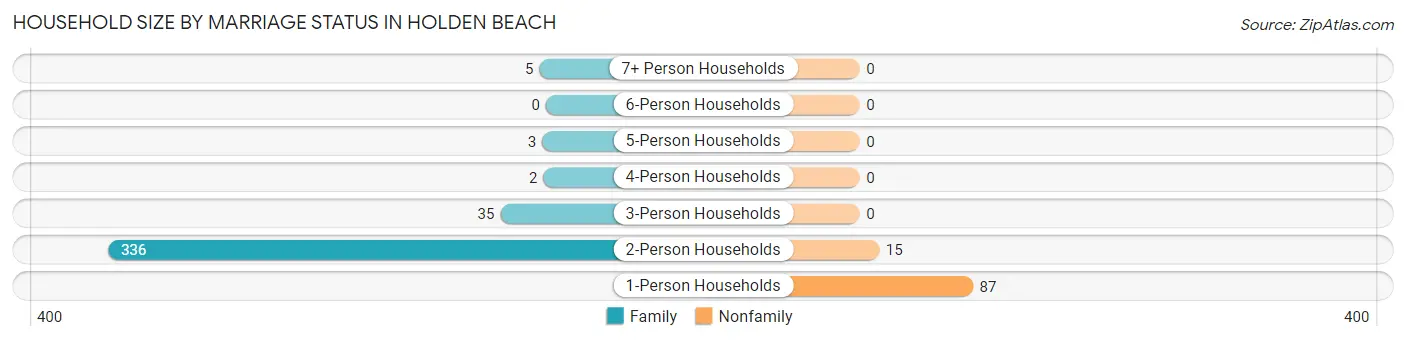
Household Size by Marriage Status in Holden Beach
Out of a total of 483 households in Holden Beach, 381 (78.9%) are family households, while 102 (21.1%) are nonfamily households. The most numerous type of family households are 2-person households, comprising 336, and the most common type of nonfamily households are 1-person households, comprising 87.
| Household Size | Family Households | Nonfamily Households |
| 1-Person Households | - | 87 (18.0%) |
| 2-Person Households | 336 (69.6%) | 15 (3.1%) |
| 3-Person Households | 35 (7.2%) | 0 (0.0%) |
| 4-Person Households | 2 (0.4%) | 0 (0.0%) |
| 5-Person Households | 3 (0.6%) | 0 (0.0%) |
| 6-Person Households | 0 (0.0%) | 0 (0.0%) |
| 7+ Person Households | 5 (1.0%) | 0 (0.0%) |
| Total | 381 (78.9%) | 102 (21.1%) |
Female Fertility in Holden Beach
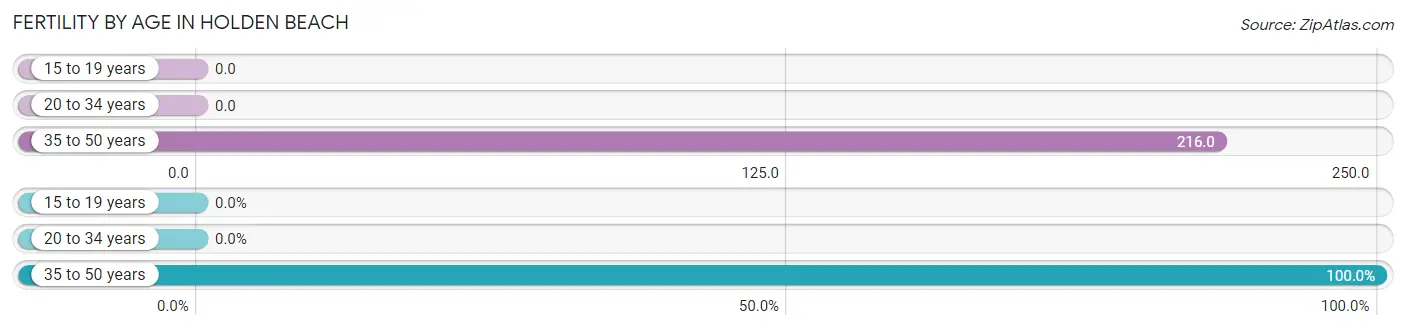
Fertility by Age in Holden Beach
Average fertility rate in Holden Beach is 125.0 births per 1,000 women. Women in the age bracket of 35 to 50 years have the highest fertility rate with 216.0 births per 1,000 women. Women in the age bracket of 35 to 50 years acount for 100.0% of all women with births.
| Age Bracket | Women with Births | Births / 1,000 Women |
| 15 to 19 years | 0 (0.0%) | 0.0 |
| 20 to 34 years | 0 (0.0%) | 0.0 |
| 35 to 50 years | 8 (100.0%) | 216.0 |
| Total | 8 (100.0%) | 125.0 |
Fertility by Age by Marriage Status in Holden Beach
62.5% of women with births (8) in Holden Beach are married. The highest percentage of unmarried women with births falls into 35 to 50 years age bracket with 37.5% of them unmarried at the time of birth, while the lowest percentage of unmarried women with births belong to 35 to 50 years age bracket with 37.5% of them unmarried.
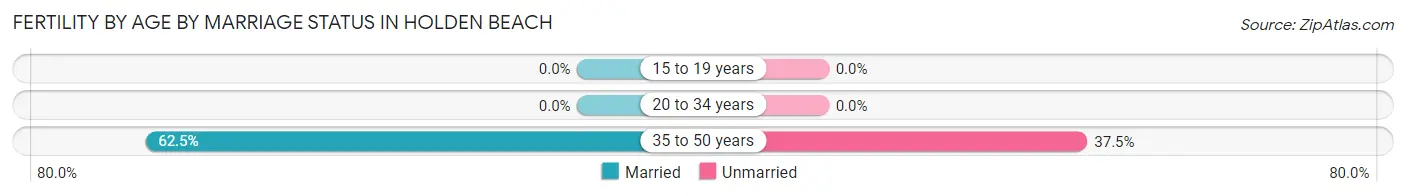
| Age Bracket | Married | Unmarried |
| 15 to 19 years | 0 (0.0%) | 0 (0.0%) |
| 20 to 34 years | 0 (0.0%) | 0 (0.0%) |
| 35 to 50 years | 5 (62.5%) | 3 (37.5%) |
| Total | 5 (62.5%) | 3 (37.5%) |
Fertility by Education in Holden Beach
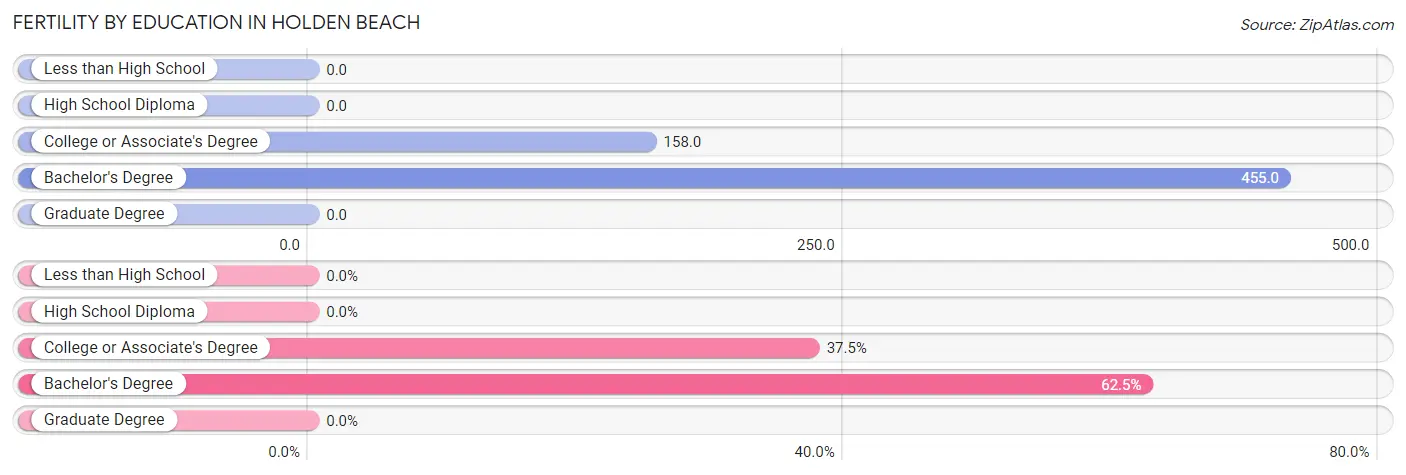
| Educational Attainment | Women with Births | Births / 1,000 Women |
| Less than High School | 0 (0.0%) | 0.0 |
| High School Diploma | 0 (0.0%) | 0.0 |
| College or Associate's Degree | 3 (37.5%) | 158.0 |
| Bachelor's Degree | 5 (62.5%) | 455.0 |
| Graduate Degree | 0 (0.0%) | 0.0 |
| Total | 8 (100.0%) | 125.0 |
Fertility by Education by Marriage Status in Holden Beach
37.5% of women with births in Holden Beach are unmarried. Women with the educational attainment of bachelor's degree are most likely to be married with 100.0% of them married at childbirth, while women with the educational attainment of college or associate's degree are least likely to be married with 100.0% of them unmarried at childbirth.
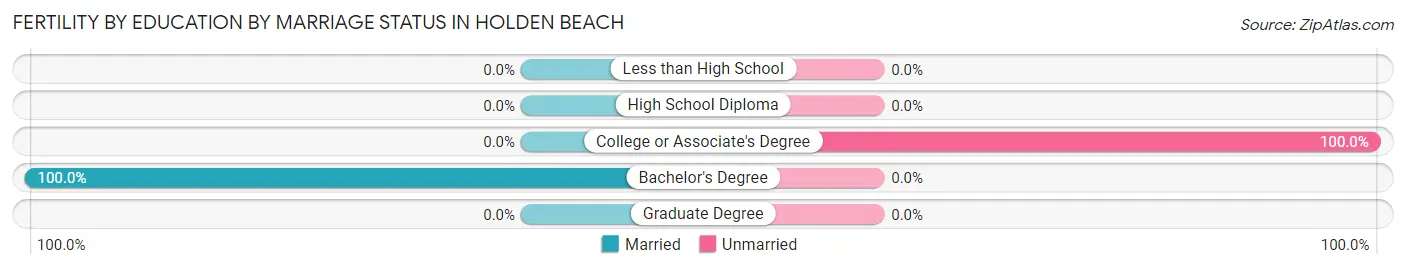
| Educational Attainment | Married | Unmarried |
| Less than High School | 0 (0.0%) | 0 (0.0%) |
| High School Diploma | 0 (0.0%) | 0 (0.0%) |
| College or Associate's Degree | 0 (0.0%) | 3 (100.0%) |
| Bachelor's Degree | 5 (100.0%) | 0 (0.0%) |
| Graduate Degree | 0 (0.0%) | 0 (0.0%) |
| Total | 5 (62.5%) | 3 (37.5%) |
Income in Holden Beach
Income Overview in Holden Beach
Per Capita Income in Holden Beach is $68,093, while median incomes of families and households are $119,250 and $106,375 respectively.
| Characteristic | Number | Measure |
| Per Capita Income | 997 | $68,093 |
| Median Family Income | 381 | $119,250 |
| Mean Family Income | 381 | $152,996 |
| Median Household Income | 483 | $106,375 |
| Mean Household Income | 483 | $137,103 |
| Income Deficit | 381 | $0 |
| Wage / Income Gap (%) | 997 | 65.42% |
| Wage / Income Gap ($) | 997 | 34.58¢ per $1 |
| Gini / Inequality Index | 997 | 0.44 |
Earnings by Sex in Holden Beach
Average Earnings in Holden Beach are $44,250, $71,250 for men and $24,640 for women, a difference of 65.4%.
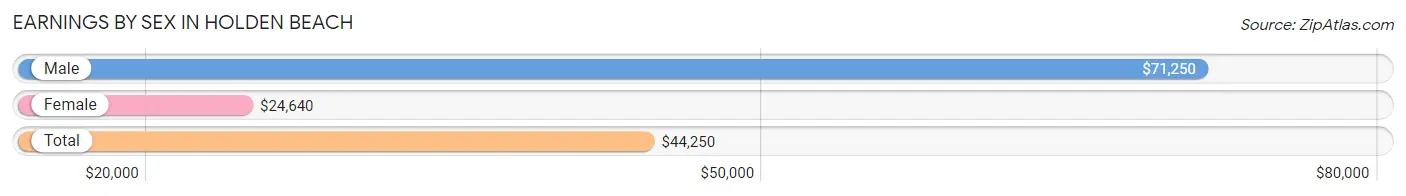
| Sex | Number | Average Earnings |
| Male | 252 (52.8%) | $71,250 |
| Female | 225 (47.2%) | $24,640 |
| Total | 477 (100.0%) | $44,250 |
Earnings by Sex by Income Bracket in Holden Beach
The most common earnings brackets in Holden Beach are $100,000+ for men (103 | 40.9%) and $22,500 to $24,999 for women (59 | 26.2%).
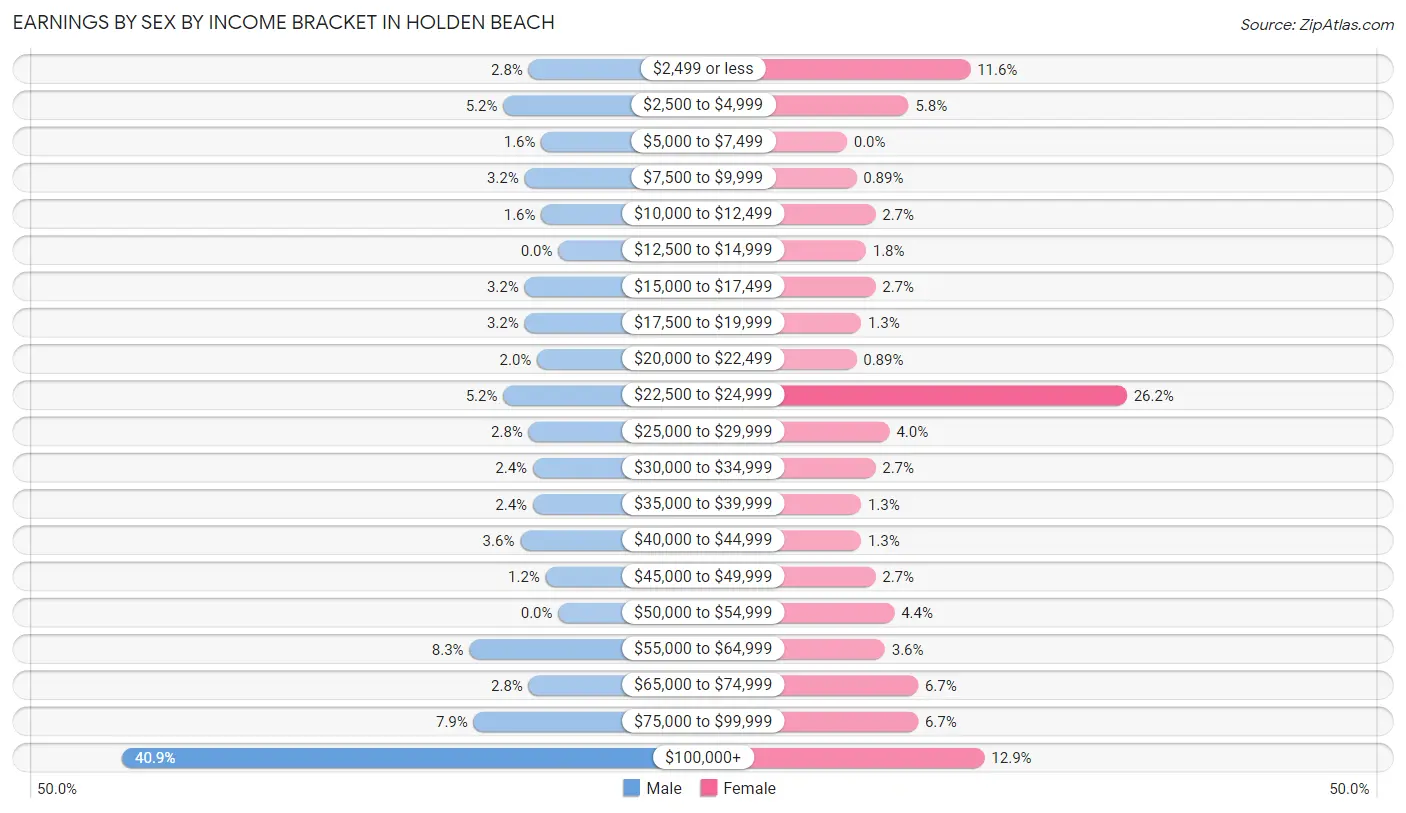
| Income | Male | Female |
| $2,499 or less | 7 (2.8%) | 26 (11.6%) |
| $2,500 to $4,999 | 13 (5.2%) | 13 (5.8%) |
| $5,000 to $7,499 | 4 (1.6%) | 0 (0.0%) |
| $7,500 to $9,999 | 8 (3.2%) | 2 (0.9%) |
| $10,000 to $12,499 | 4 (1.6%) | 6 (2.7%) |
| $12,500 to $14,999 | 0 (0.0%) | 4 (1.8%) |
| $15,000 to $17,499 | 8 (3.2%) | 6 (2.7%) |
| $17,500 to $19,999 | 8 (3.2%) | 3 (1.3%) |
| $20,000 to $22,499 | 5 (2.0%) | 2 (0.9%) |
| $22,500 to $24,999 | 13 (5.2%) | 59 (26.2%) |
| $25,000 to $29,999 | 7 (2.8%) | 9 (4.0%) |
| $30,000 to $34,999 | 6 (2.4%) | 6 (2.7%) |
| $35,000 to $39,999 | 6 (2.4%) | 3 (1.3%) |
| $40,000 to $44,999 | 9 (3.6%) | 3 (1.3%) |
| $45,000 to $49,999 | 3 (1.2%) | 6 (2.7%) |
| $50,000 to $54,999 | 0 (0.0%) | 10 (4.4%) |
| $55,000 to $64,999 | 21 (8.3%) | 8 (3.6%) |
| $65,000 to $74,999 | 7 (2.8%) | 15 (6.7%) |
| $75,000 to $99,999 | 20 (7.9%) | 15 (6.7%) |
| $100,000+ | 103 (40.9%) | 29 (12.9%) |
| Total | 252 (100.0%) | 225 (100.0%) |
Earnings by Sex by Educational Attainment in Holden Beach
Average earnings in Holden Beach are $74,375 for men and $24,958 for women, a difference of 66.4%. Men with an educational attainment of bachelor's degree enjoy the highest average annual earnings of $102,566, while those with graduate degree education earn the least with $95,000. Women with an educational attainment of graduate degree earn the most with the average annual earnings of $61,250, while those with bachelor's degree education have the smallest earnings of $24,040.
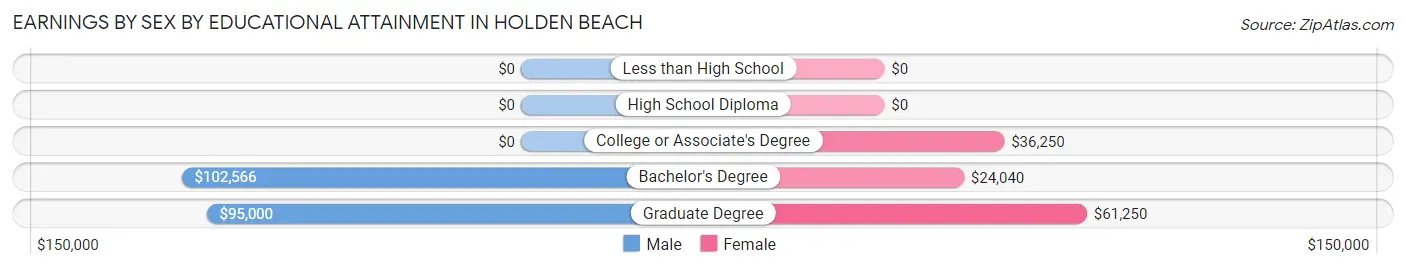
| Educational Attainment | Male Income | Female Income |
| Less than High School | - | - |
| High School Diploma | - | - |
| College or Associate's Degree | - | - |
| Bachelor's Degree | $102,566 | $24,040 |
| Graduate Degree | $95,000 | $61,250 |
| Total | $74,375 | $24,958 |
Family Income in Holden Beach
Family Income Brackets in Holden Beach
According to the Holden Beach family income data, there are 91 families falling into the $100,000 to $149,999 income range, which is the most common income bracket and makes up 23.9% of all families. Conversely, the $10,000 to $14,999 income bracket is the least frequent group with only 3 families (0.8%) belonging to this category.
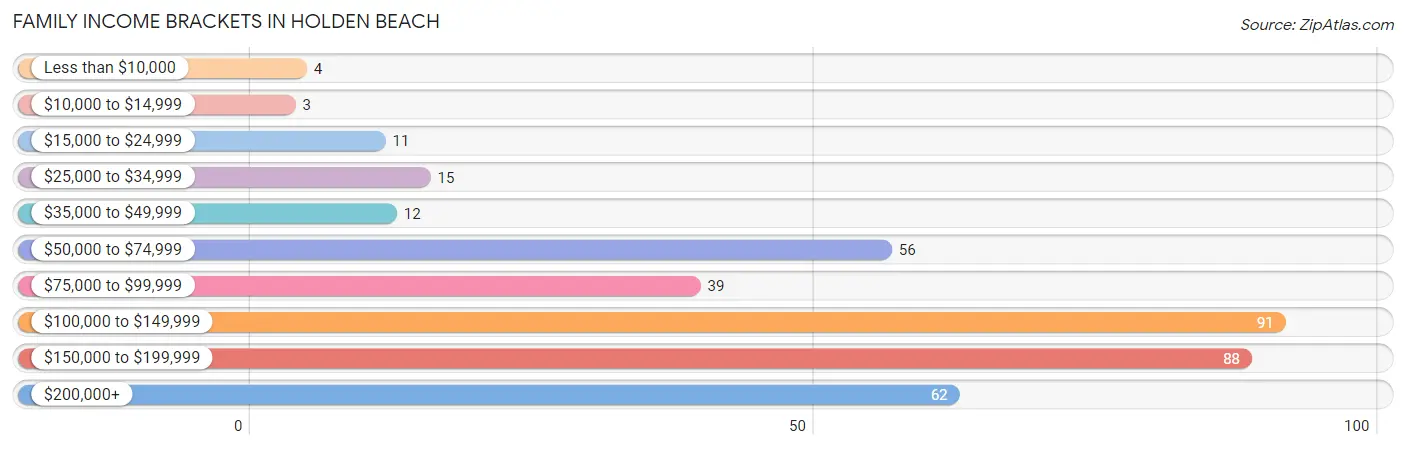
| Income Bracket | # Families | % Families |
| Less than $10,000 | 4 | 1.0% |
| $10,000 to $14,999 | 3 | 0.8% |
| $15,000 to $24,999 | 11 | 2.9% |
| $25,000 to $34,999 | 15 | 3.9% |
| $35,000 to $49,999 | 12 | 3.1% |
| $50,000 to $74,999 | 56 | 14.7% |
| $75,000 to $99,999 | 39 | 10.2% |
| $100,000 to $149,999 | 91 | 23.9% |
| $150,000 to $199,999 | 88 | 23.1% |
| $200,000+ | 62 | 16.3% |
Family Income by Famaliy Size in Holden Beach
2-person families (336 | 88.2%) account for the highest median family income in Holden Beach with $118,500 per family, while 2-person families (336 | 88.2%) have the highest median income of $59,250 per family member.
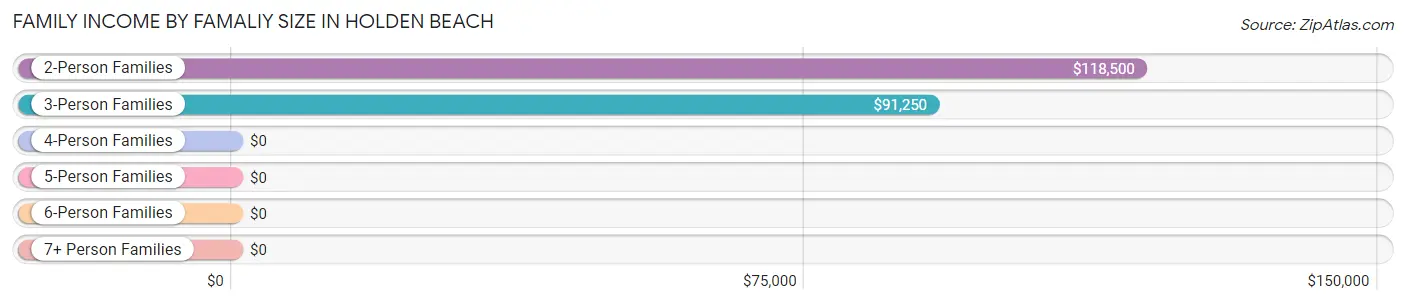
| Income Bracket | # Families | Median Income |
| 2-Person Families | 336 (88.2%) | $118,500 |
| 3-Person Families | 35 (9.2%) | $91,250 |
| 4-Person Families | 2 (0.5%) | $0 |
| 5-Person Families | 3 (0.8%) | $0 |
| 6-Person Families | 0 (0.0%) | $0 |
| 7+ Person Families | 5 (1.3%) | $0 |
| Total | 381 (100.0%) | $119,250 |
Family Income by Number of Earners in Holden Beach
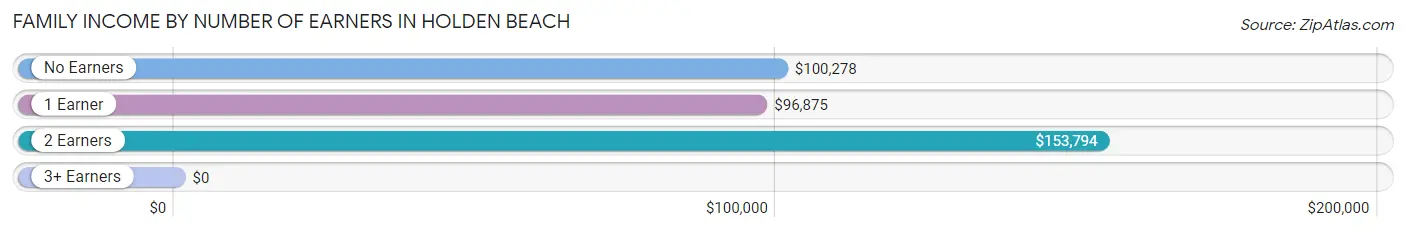
| Number of Earners | # Families | Median Income |
| No Earners | 134 (35.2%) | $100,278 |
| 1 Earner | 110 (28.9%) | $96,875 |
| 2 Earners | 131 (34.4%) | $153,794 |
| 3+ Earners | 6 (1.6%) | $0 |
| Total | 381 (100.0%) | $119,250 |
Household Income in Holden Beach
Household Income Brackets in Holden Beach
With 96 households falling in the category, the $100,000 to $149,999 income range is the most frequent in Holden Beach, accounting for 19.9% of all households. In contrast, only 5 households (1.0%) fall into the $10,000 to $14,999 income bracket, making it the least populous group.
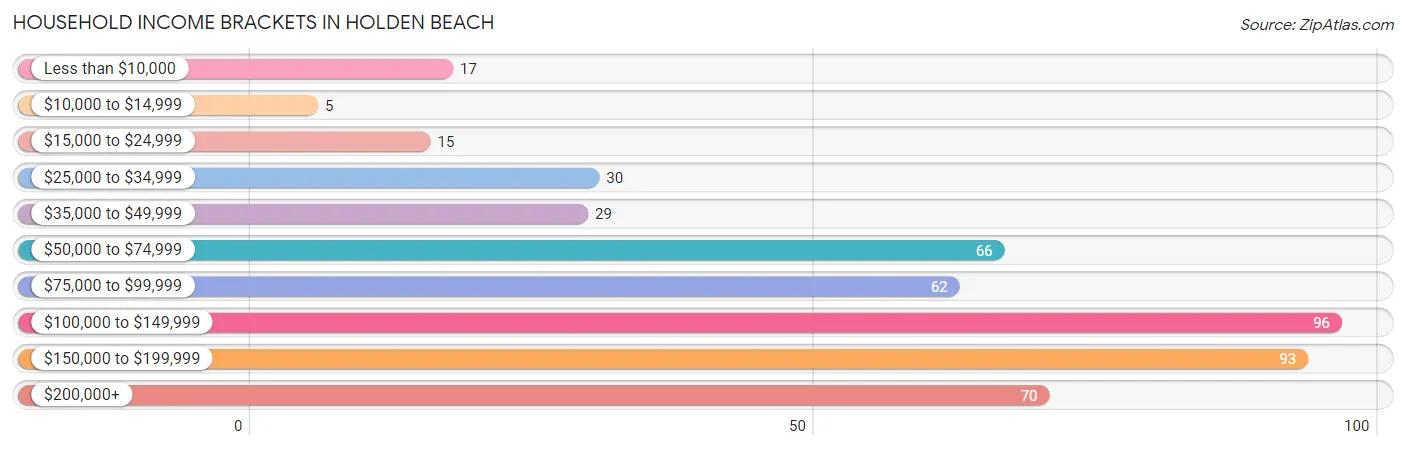
| Income Bracket | # Households | % Households |
| Less than $10,000 | 17 | 3.5% |
| $10,000 to $14,999 | 5 | 1.0% |
| $15,000 to $24,999 | 15 | 3.1% |
| $25,000 to $34,999 | 30 | 6.2% |
| $35,000 to $49,999 | 29 | 6.0% |
| $50,000 to $74,999 | 66 | 13.7% |
| $75,000 to $99,999 | 62 | 12.8% |
| $100,000 to $149,999 | 96 | 19.9% |
| $150,000 to $199,999 | 93 | 19.3% |
| $200,000+ | 70 | 14.5% |
Household Income by Householder Age in Holden Beach
The median household income in Holden Beach is $106,375, with the highest median household income of $137,083 found in the 45 to 64 years age bracket for the primary householder. A total of 211 households (43.7%) fall into this category.
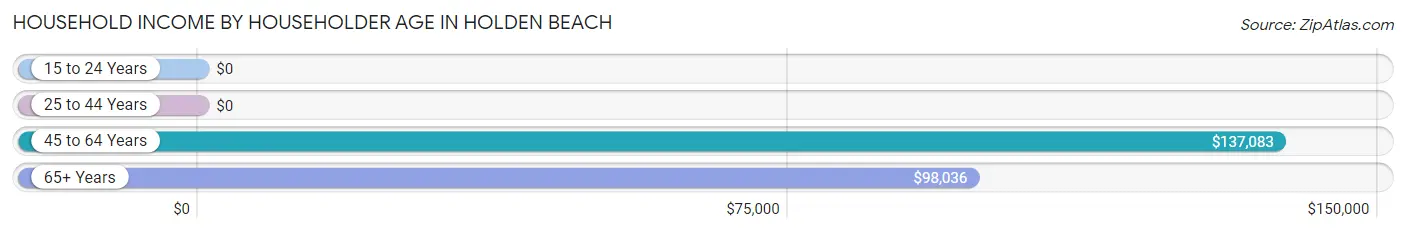
| Income Bracket | # Households | Median Income |
| 15 to 24 Years | 0 (0.0%) | $0 |
| 25 to 44 Years | 17 (3.5%) | $0 |
| 45 to 64 Years | 211 (43.7%) | $137,083 |
| 65+ Years | 255 (52.8%) | $98,036 |
| Total | 483 (100.0%) | $106,375 |
Poverty in Holden Beach
Income Below Poverty by Sex and Age in Holden Beach
With 4.0% poverty level for males and 8.1% for females among the residents of Holden Beach, 45 to 54 year old males and 12 to 14 year old females are the most vulnerable to poverty, with 8 males (33.3%) and 2 females (40.0%) in their respective age groups living below the poverty level.
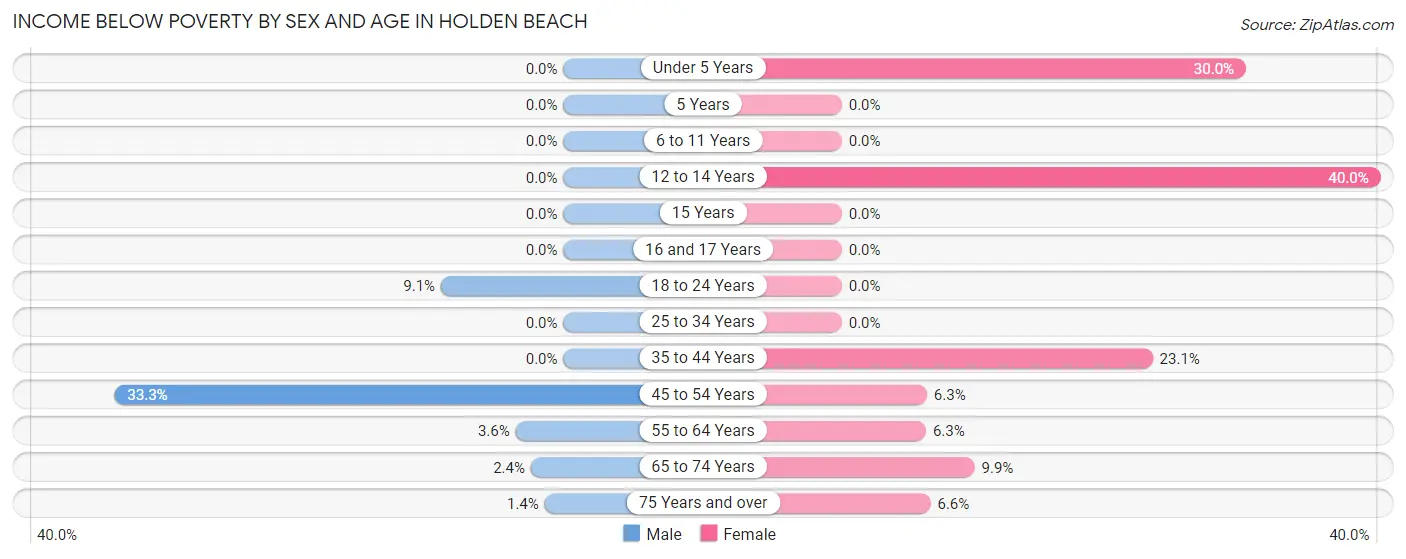
| Age Bracket | Male | Female |
| Under 5 Years | 0 (0.0%) | 3 (30.0%) |
| 5 Years | 0 (0.0%) | 0 (0.0%) |
| 6 to 11 Years | 0 (0.0%) | 0 (0.0%) |
| 12 to 14 Years | 0 (0.0%) | 2 (40.0%) |
| 15 Years | 0 (0.0%) | 0 (0.0%) |
| 16 and 17 Years | 0 (0.0%) | 0 (0.0%) |
| 18 to 24 Years | 1 (9.1%) | 0 (0.0%) |
| 25 to 34 Years | 0 (0.0%) | 0 (0.0%) |
| 35 to 44 Years | 0 (0.0%) | 3 (23.1%) |
| 45 to 54 Years | 8 (33.3%) | 6 (6.3%) |
| 55 to 64 Years | 6 (3.5%) | 8 (6.2%) |
| 65 to 74 Years | 3 (2.4%) | 14 (9.9%) |
| 75 Years and over | 1 (1.4%) | 6 (6.6%) |
| Total | 19 (4.0%) | 42 (8.1%) |
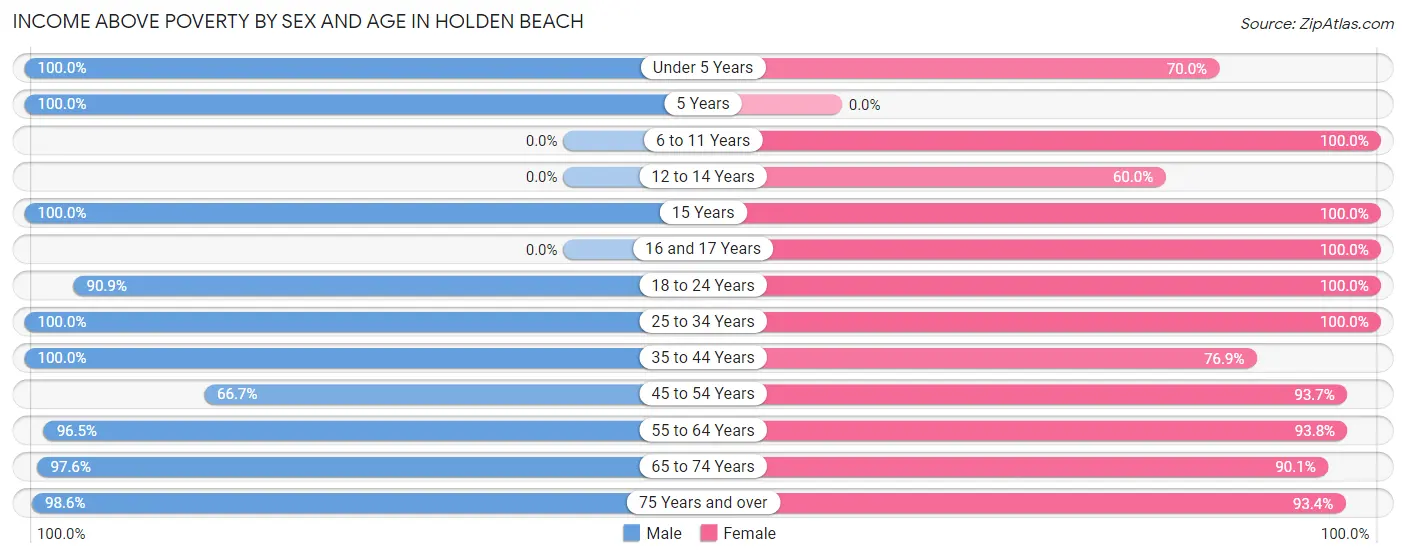
Income Above Poverty by Sex and Age in Holden Beach
According to the poverty statistics in Holden Beach, males aged under 5 years and females aged 6 to 11 years are the age groups that are most secure financially, with 100.0% of males and 100.0% of females in these age groups living above the poverty line.
| Age Bracket | Male | Female |
| Under 5 Years | 5 (100.0%) | 7 (70.0%) |
| 5 Years | 5 (100.0%) | 0 (0.0%) |
| 6 to 11 Years | 0 (0.0%) | 6 (100.0%) |
| 12 to 14 Years | 0 (0.0%) | 3 (60.0%) |
| 15 Years | 4 (100.0%) | 6 (100.0%) |
| 16 and 17 Years | 0 (0.0%) | 6 (100.0%) |
| 18 to 24 Years | 10 (90.9%) | 9 (100.0%) |
| 25 to 34 Years | 38 (100.0%) | 6 (100.0%) |
| 35 to 44 Years | 28 (100.0%) | 10 (76.9%) |
| 45 to 54 Years | 16 (66.7%) | 89 (93.7%) |
| 55 to 64 Years | 163 (96.5%) | 120 (93.8%) |
| 65 to 74 Years | 121 (97.6%) | 128 (90.1%) |
| 75 Years and over | 71 (98.6%) | 85 (93.4%) |
| Total | 461 (96.0%) | 475 (91.9%) |
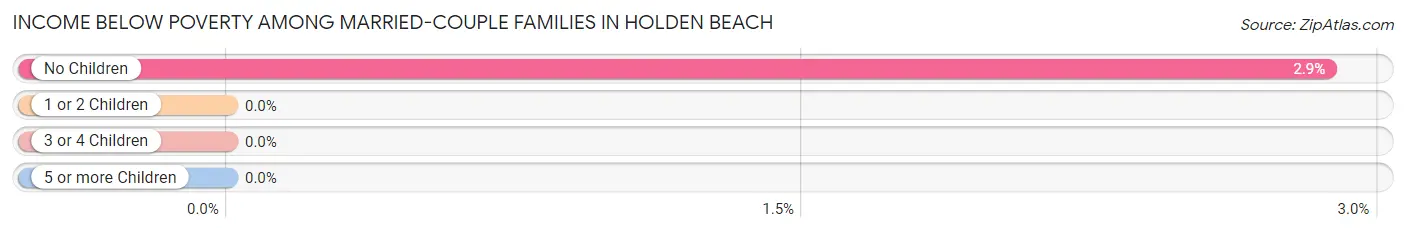
Income Below Poverty Among Married-Couple Families in Holden Beach
The poverty statistics for married-couple families in Holden Beach show that 2.8% or 10 of the total 357 families live below the poverty line. Families with no children have the highest poverty rate of 2.9%, comprising of 10 families. On the other hand, families with 1 or 2 children have the lowest poverty rate of 0.0%, which includes 0 families.
| Children | Above Poverty | Below Poverty |
| No Children | 338 (97.1%) | 10 (2.9%) |
| 1 or 2 Children | 4 (100.0%) | 0 (0.0%) |
| 3 or 4 Children | 0 (0.0%) | 0 (0.0%) |
| 5 or more Children | 5 (100.0%) | 0 (0.0%) |
| Total | 347 (97.2%) | 10 (2.8%) |
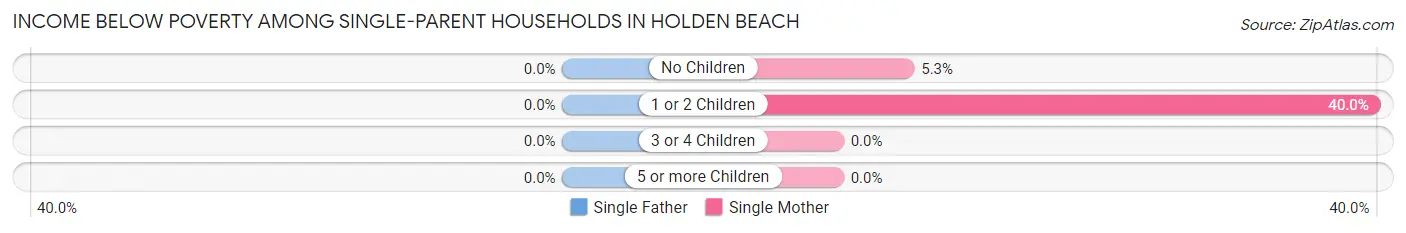
Income Below Poverty Among Single-Parent Households in Holden Beach
| Children | Single Father | Single Mother |
| No Children | 0 (0.0%) | 1 (5.3%) |
| 1 or 2 Children | 0 (0.0%) | 2 (40.0%) |
| 3 or 4 Children | 0 (0.0%) | 0 (0.0%) |
| 5 or more Children | 0 (0.0%) | 0 (0.0%) |
| Total | 0 (0.0%) | 3 (12.5%) |
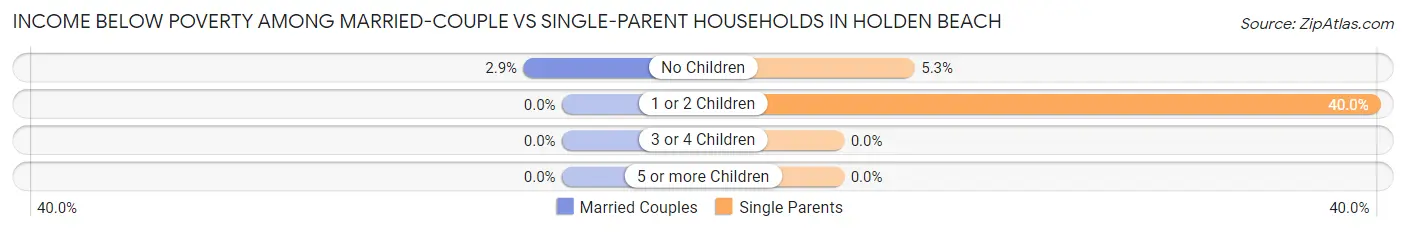
Income Below Poverty Among Married-Couple vs Single-Parent Households in Holden Beach
The poverty data for Holden Beach shows that 10 of the married-couple family households (2.8%) and 3 of the single-parent households (12.5%) are living below the poverty level. Within the married-couple family households, those with no children have the highest poverty rate, with 10 households (2.9%) falling below the poverty line. Among the single-parent households, those with 1 or 2 children have the highest poverty rate, with 2 household (40.0%) living below poverty.
| Children | Married-Couple Families | Single-Parent Households |
| No Children | 10 (2.9%) | 1 (5.3%) |
| 1 or 2 Children | 0 (0.0%) | 2 (40.0%) |
| 3 or 4 Children | 0 (0.0%) | 0 (0.0%) |
| 5 or more Children | 0 (0.0%) | 0 (0.0%) |
| Total | 10 (2.8%) | 3 (12.5%) |
Employment Characteristics in Holden Beach
Employment by Class of Employer in Holden Beach
Among the 422 employed individuals in Holden Beach, private company employees (244 | 57.8%), self-employed (incorporated) (83 | 19.7%), and not-for-profit organizations (44 | 10.4%) make up the most common classes of employment.
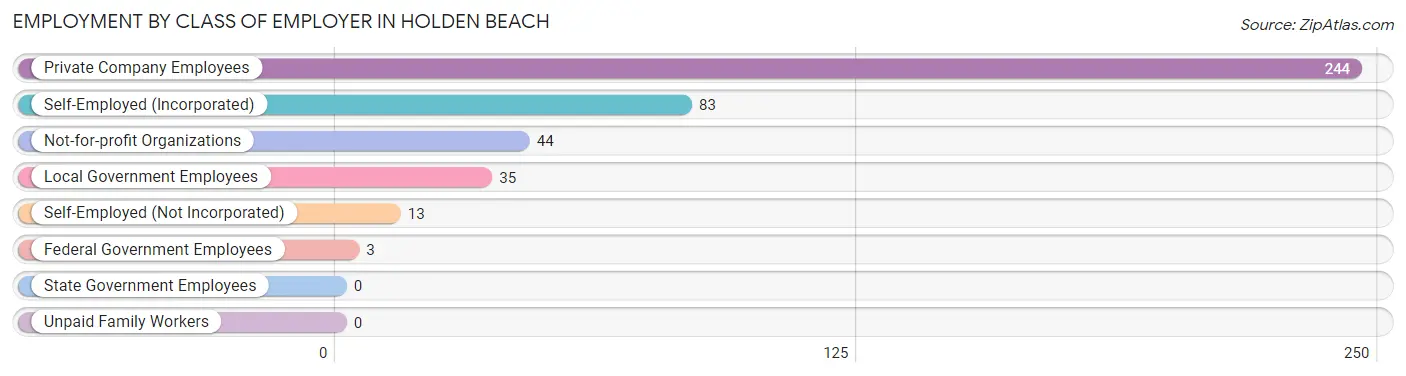
| Employer Class | # Employees | % Employees |
| Private Company Employees | 244 | 57.8% |
| Self-Employed (Incorporated) | 83 | 19.7% |
| Self-Employed (Not Incorporated) | 13 | 3.1% |
| Not-for-profit Organizations | 44 | 10.4% |
| Local Government Employees | 35 | 8.3% |
| State Government Employees | 0 | 0.0% |
| Federal Government Employees | 3 | 0.7% |
| Unpaid Family Workers | 0 | 0.0% |
| Total | 422 | 100.0% |
Employment Status by Age in Holden Beach
According to the labor force statistics for Holden Beach, out of the total population over 16 years of age (956), 45.2% or 432 individuals are in the labor force, with 2.3% or 10 of them unemployed. The age group with the highest labor force participation rate is 20 to 24 years, with 100.0% or 5 individuals in the labor force. Within the labor force, the 60 to 64 years age range has the highest percentage of unemployed individuals, with 5.6% or 7 of them being unemployed.
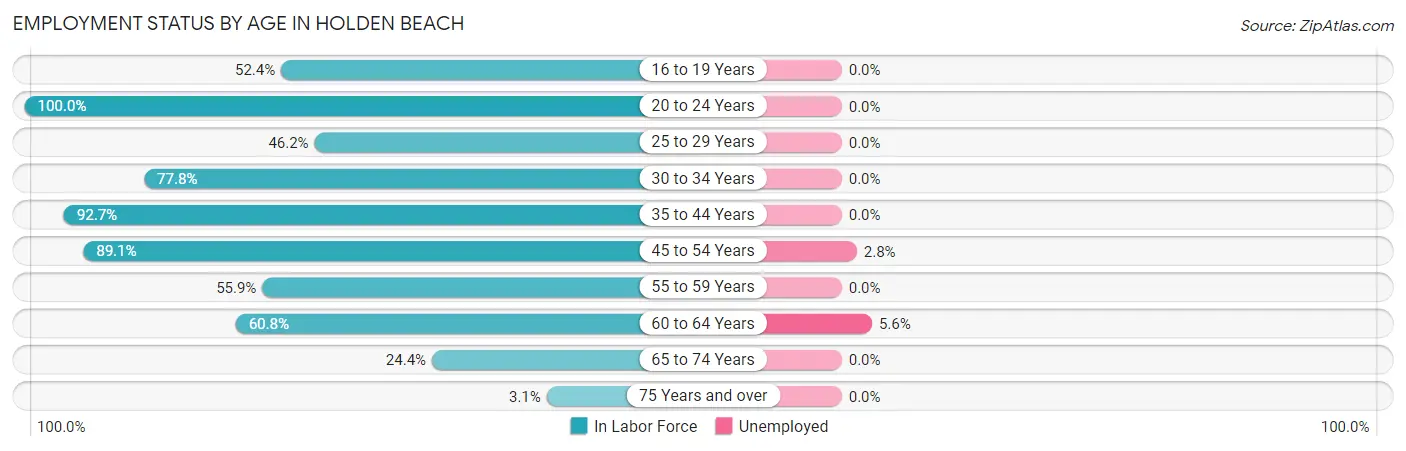
| Age Bracket | In Labor Force | Unemployed |
| 16 to 19 Years | 11 (52.4%) | 0 (0.0%) |
| 20 to 24 Years | 5 (100.0%) | 0 (0.0%) |
| 25 to 29 Years | 12 (46.2%) | 0 (0.0%) |
| 30 to 34 Years | 14 (77.8%) | 0 (0.0%) |
| 35 to 44 Years | 38 (92.7%) | 0 (0.0%) |
| 45 to 54 Years | 106 (89.1%) | 3 (2.8%) |
| 55 to 59 Years | 52 (55.9%) | 0 (0.0%) |
| 60 to 64 Years | 124 (60.8%) | 7 (5.6%) |
| 65 to 74 Years | 65 (24.4%) | 0 (0.0%) |
| 75 Years and over | 5 (3.1%) | 0 (0.0%) |
| Total | 432 (45.2%) | 10 (2.3%) |
Employment Status by Educational Attainment in Holden Beach
According to labor force statistics for Holden Beach, 69.1% of individuals (346) out of the total population between 25 and 64 years of age (501) are in the labor force, with 2.9% or 10 of them being unemployed. The group with the highest labor force participation rate are those with the educational attainment of bachelor's degree or higher, with 77.1% or 269 individuals in the labor force. Within the labor force, individuals with high school diploma education have the highest percentage of unemployment, with 38.5% or 5 of them being unemployed.
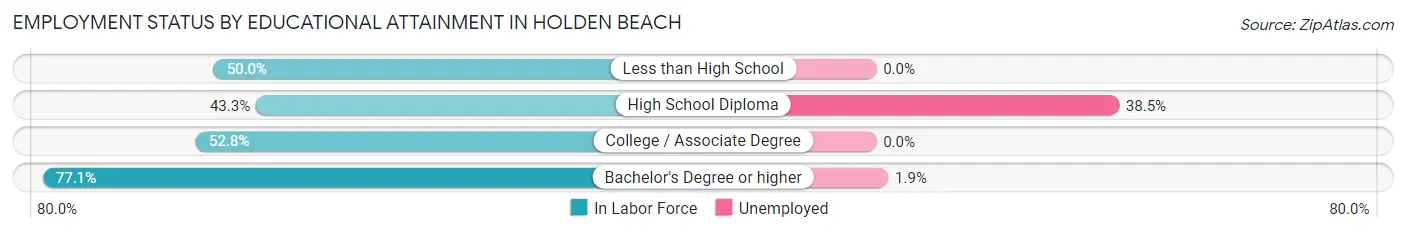
| Educational Attainment | In Labor Force | Unemployed |
| Less than High School | 7 (50.0%) | 0 (0.0%) |
| High School Diploma | 13 (43.3%) | 12 (38.5%) |
| College / Associate Degree | 57 (52.8%) | 0 (0.0%) |
| Bachelor's Degree or higher | 269 (77.1%) | 7 (1.9%) |
| Total | 346 (69.1%) | 15 (2.9%) |
Employment Occupations by Sex in Holden Beach
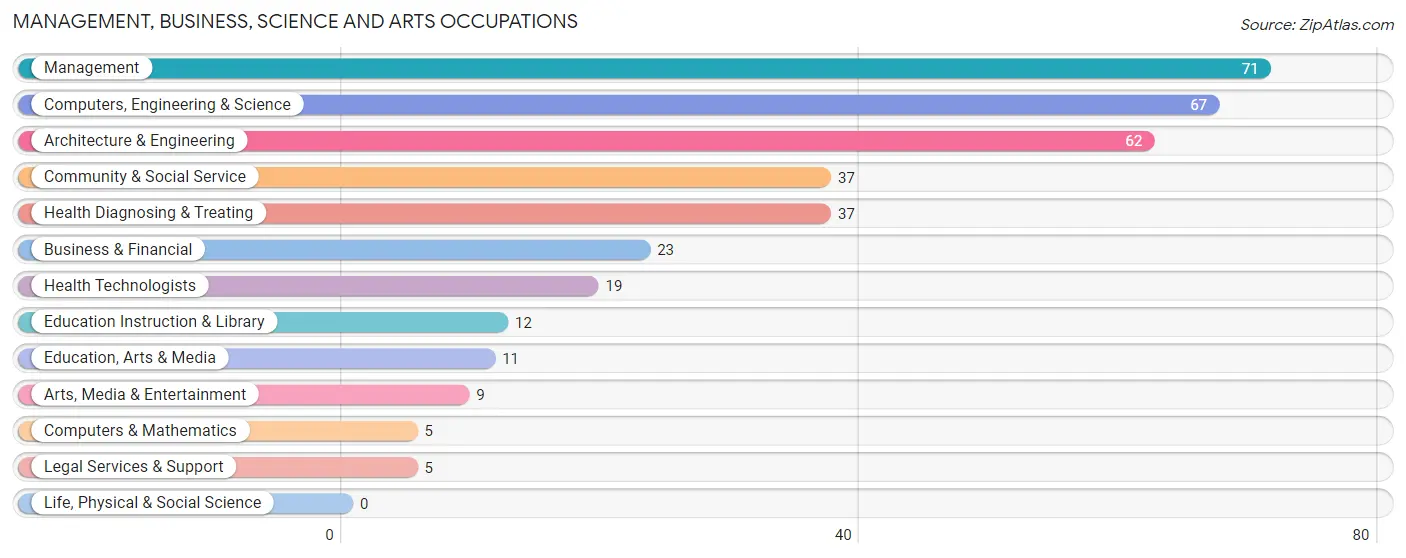
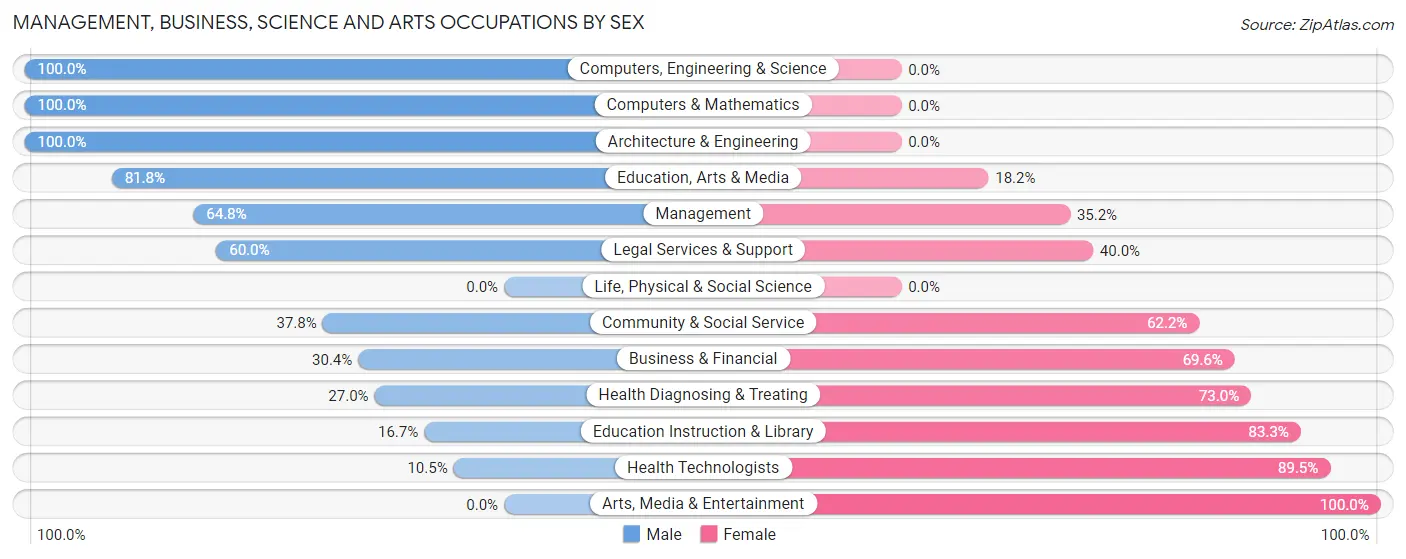
Management, Business, Science and Arts Occupations
The most common Management, Business, Science and Arts occupations in Holden Beach are Management (71 | 16.8%), Computers, Engineering & Science (67 | 15.9%), Architecture & Engineering (62 | 14.7%), Community & Social Service (37 | 8.8%), and Health Diagnosing & Treating (37 | 8.8%).
Management, Business, Science and Arts Occupations by Sex
Within the Management, Business, Science and Arts occupations in Holden Beach, the most male-oriented occupations are Computers, Engineering & Science (100.0%), Computers & Mathematics (100.0%), and Architecture & Engineering (100.0%), while the most female-oriented occupations are Arts, Media & Entertainment (100.0%), Health Technologists (89.5%), and Education Instruction & Library (83.3%).
| Occupation | Male | Female |
| Management | 46 (64.8%) | 25 (35.2%) |
| Business & Financial | 7 (30.4%) | 16 (69.6%) |
| Computers, Engineering & Science | 67 (100.0%) | 0 (0.0%) |
| Computers & Mathematics | 5 (100.0%) | 0 (0.0%) |
| Architecture & Engineering | 62 (100.0%) | 0 (0.0%) |
| Life, Physical & Social Science | 0 (0.0%) | 0 (0.0%) |
| Community & Social Service | 14 (37.8%) | 23 (62.2%) |
| Education, Arts & Media | 9 (81.8%) | 2 (18.2%) |
| Legal Services & Support | 3 (60.0%) | 2 (40.0%) |
| Education Instruction & Library | 2 (16.7%) | 10 (83.3%) |
| Arts, Media & Entertainment | 0 (0.0%) | 9 (100.0%) |
| Health Diagnosing & Treating | 10 (27.0%) | 27 (73.0%) |
| Health Technologists | 2 (10.5%) | 17 (89.5%) |
| Total (Category) | 144 (61.3%) | 91 (38.7%) |
| Total (Overall) | 217 (51.4%) | 205 (48.6%) |
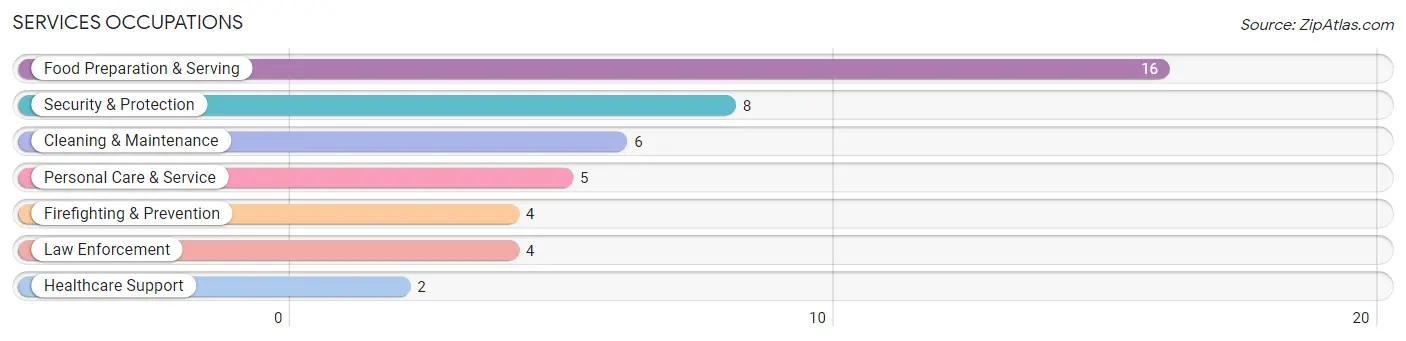
Services Occupations
The most common Services occupations in Holden Beach are Food Preparation & Serving (16 | 3.8%), Security & Protection (8 | 1.9%), Cleaning & Maintenance (6 | 1.4%), Personal Care & Service (5 | 1.2%), and Firefighting & Prevention (4 | 0.9%).
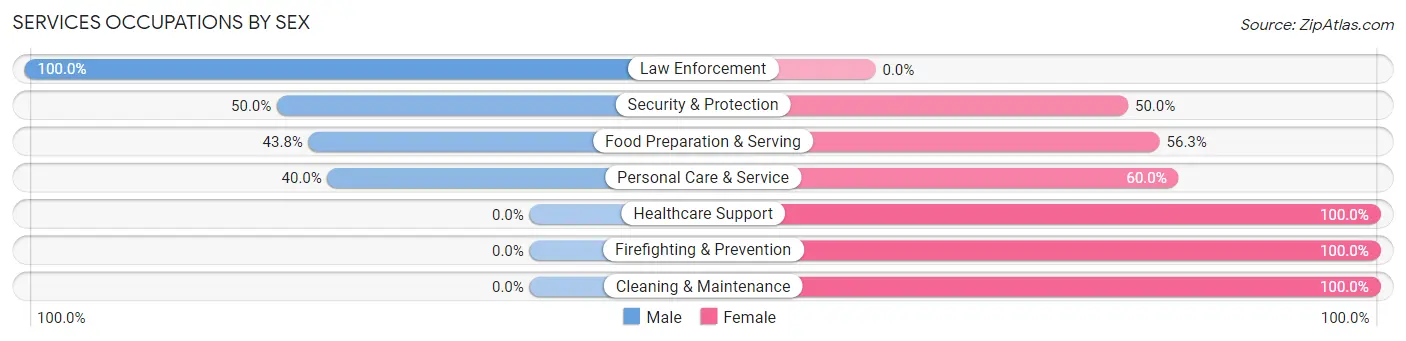
Services Occupations by Sex
Within the Services occupations in Holden Beach, the most male-oriented occupations are Law Enforcement (100.0%), Security & Protection (50.0%), and Food Preparation & Serving (43.8%), while the most female-oriented occupations are Healthcare Support (100.0%), Firefighting & Prevention (100.0%), and Cleaning & Maintenance (100.0%).
| Occupation | Male | Female |
| Healthcare Support | 0 (0.0%) | 2 (100.0%) |
| Security & Protection | 4 (50.0%) | 4 (50.0%) |
| Firefighting & Prevention | 0 (0.0%) | 4 (100.0%) |
| Law Enforcement | 4 (100.0%) | 0 (0.0%) |
| Food Preparation & Serving | 7 (43.8%) | 9 (56.2%) |
| Cleaning & Maintenance | 0 (0.0%) | 6 (100.0%) |
| Personal Care & Service | 2 (40.0%) | 3 (60.0%) |
| Total (Category) | 13 (35.1%) | 24 (64.9%) |
| Total (Overall) | 217 (51.4%) | 205 (48.6%) |
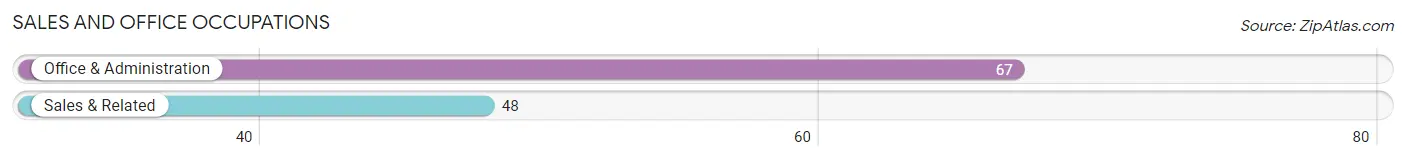
Sales and Office Occupations
The most common Sales and Office occupations in Holden Beach are Office & Administration (67 | 15.9%), and Sales & Related (48 | 11.4%).
Sales and Office Occupations by Sex
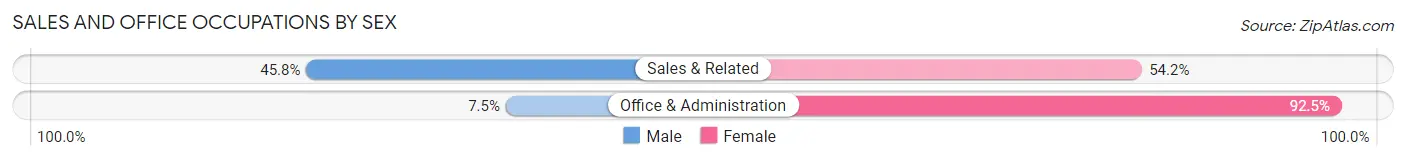
| Occupation | Male | Female |
| Sales & Related | 22 (45.8%) | 26 (54.2%) |
| Office & Administration | 5 (7.5%) | 62 (92.5%) |
| Total (Category) | 27 (23.5%) | 88 (76.5%) |
| Total (Overall) | 217 (51.4%) | 205 (48.6%) |
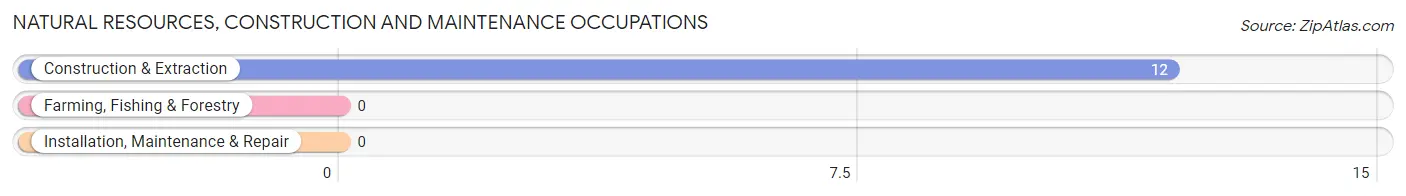
Natural Resources, Construction and Maintenance Occupations
The most common Natural Resources, Construction and Maintenance occupations in Holden Beach are , and Construction & Extraction (12 | 2.8%).
Natural Resources, Construction and Maintenance Occupations by Sex
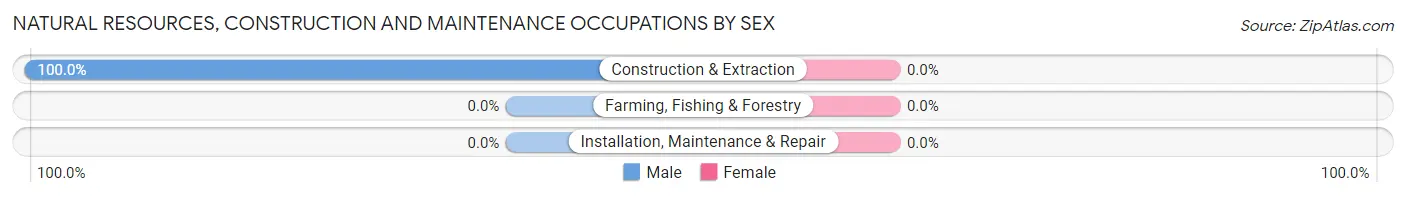
| Occupation | Male | Female |
| Farming, Fishing & Forestry | 0 (0.0%) | 0 (0.0%) |
| Construction & Extraction | 12 (100.0%) | 0 (0.0%) |
| Installation, Maintenance & Repair | 0 (0.0%) | 0 (0.0%) |
| Total (Category) | 12 (100.0%) | 0 (0.0%) |
| Total (Overall) | 217 (51.4%) | 205 (48.6%) |
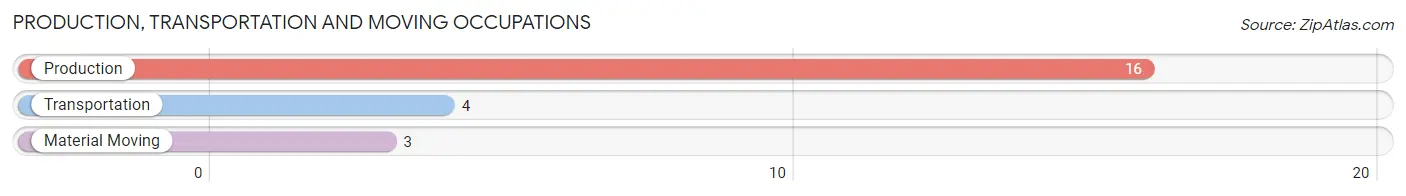
Production, Transportation and Moving Occupations
The most common Production, Transportation and Moving occupations in Holden Beach are Production (16 | 3.8%), Transportation (4 | 0.9%), and Material Moving (3 | 0.7%).
Production, Transportation and Moving Occupations by Sex
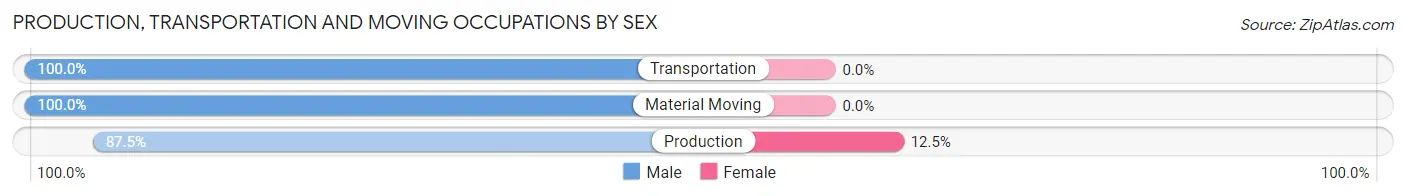
| Occupation | Male | Female |
| Production | 14 (87.5%) | 2 (12.5%) |
| Transportation | 4 (100.0%) | 0 (0.0%) |
| Material Moving | 3 (100.0%) | 0 (0.0%) |
| Total (Category) | 21 (91.3%) | 2 (8.7%) |
| Total (Overall) | 217 (51.4%) | 205 (48.6%) |
Employment Industries by Sex in Holden Beach
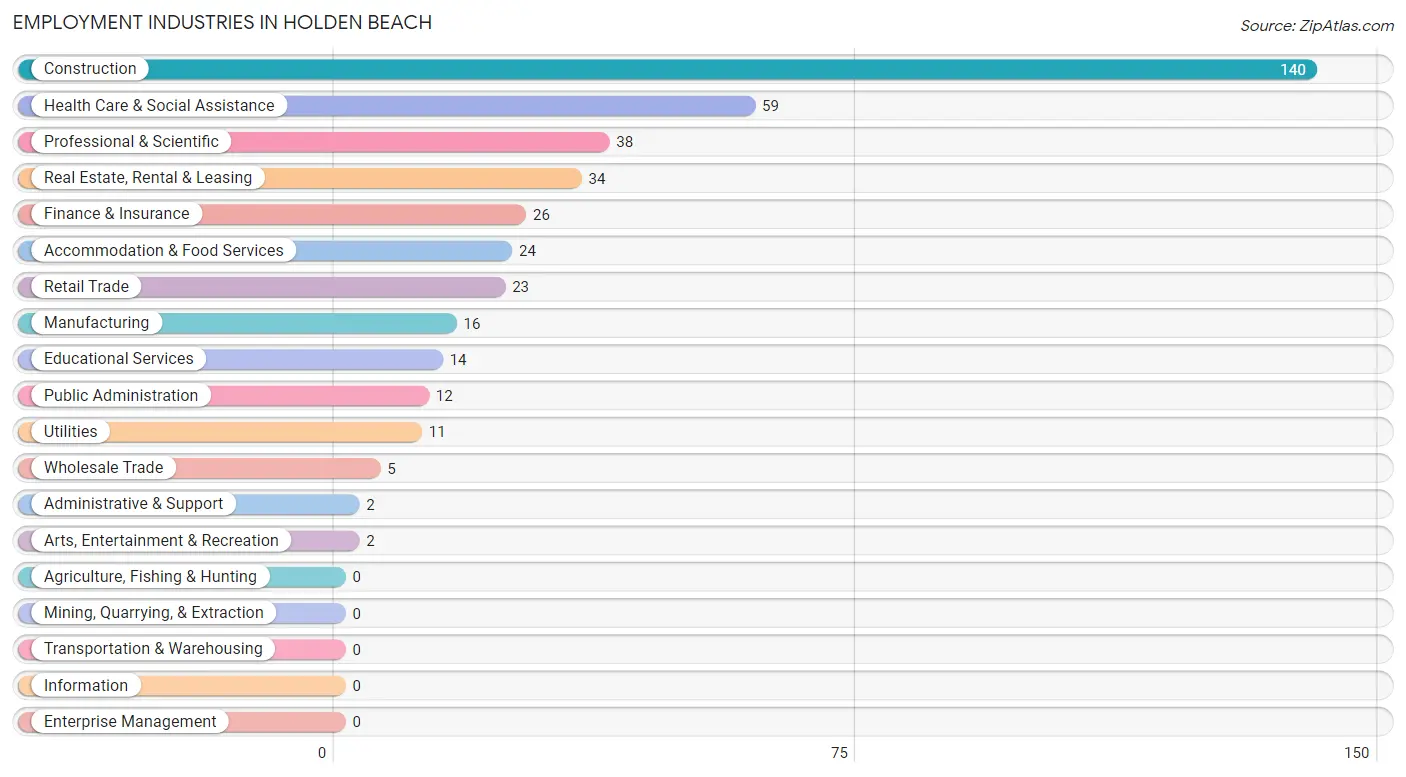
Employment Industries in Holden Beach
The major employment industries in Holden Beach include Construction (140 | 33.2%), Health Care & Social Assistance (59 | 14.0%), Professional & Scientific (38 | 9.0%), Real Estate, Rental & Leasing (34 | 8.1%), and Finance & Insurance (26 | 6.2%).
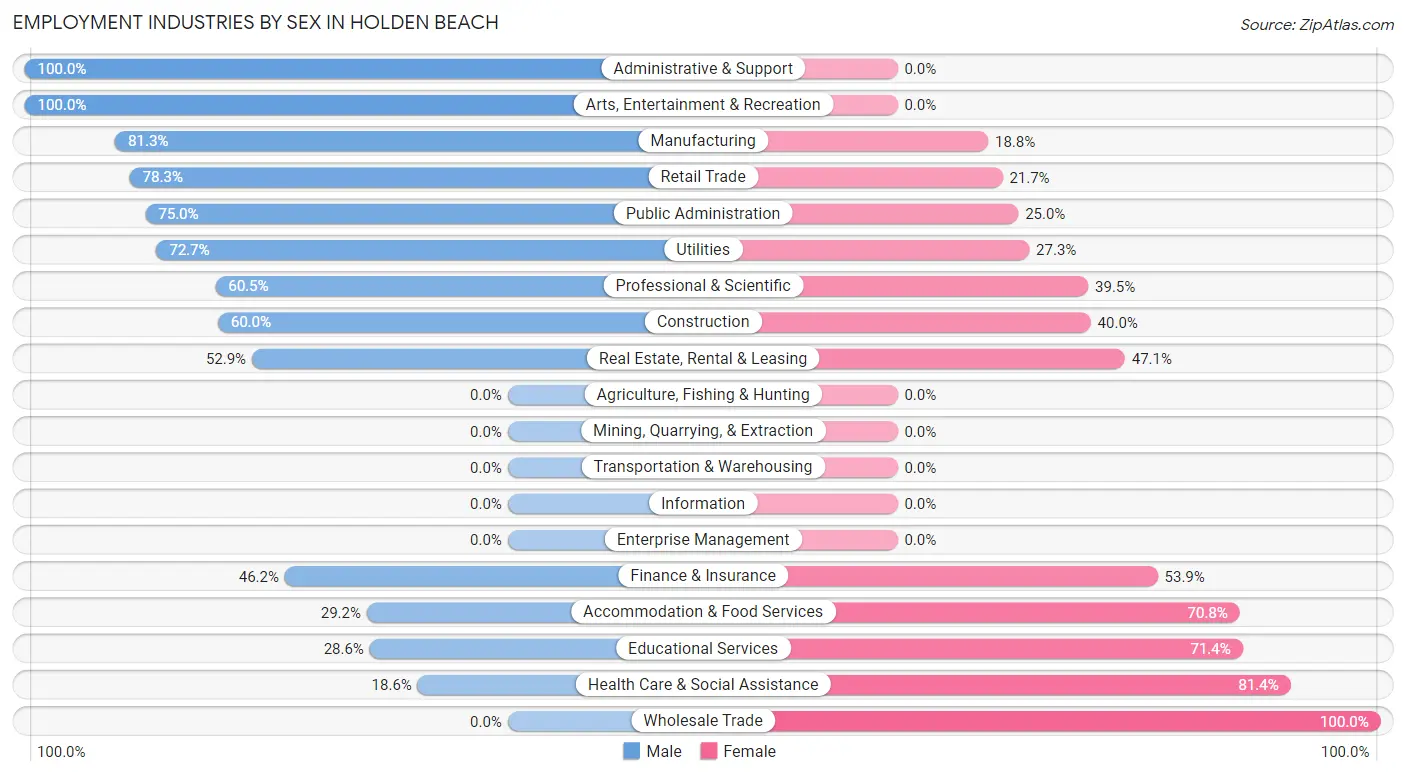
Employment Industries by Sex in Holden Beach
The Holden Beach industries that see more men than women are Administrative & Support (100.0%), Arts, Entertainment & Recreation (100.0%), and Manufacturing (81.2%), whereas the industries that tend to have a higher number of women are Wholesale Trade (100.0%), Health Care & Social Assistance (81.4%), and Educational Services (71.4%).
| Industry | Male | Female |
| Agriculture, Fishing & Hunting | 0 (0.0%) | 0 (0.0%) |
| Mining, Quarrying, & Extraction | 0 (0.0%) | 0 (0.0%) |
| Construction | 84 (60.0%) | 56 (40.0%) |
| Manufacturing | 13 (81.2%) | 3 (18.8%) |
| Wholesale Trade | 0 (0.0%) | 5 (100.0%) |
| Retail Trade | 18 (78.3%) | 5 (21.7%) |
| Transportation & Warehousing | 0 (0.0%) | 0 (0.0%) |
| Utilities | 8 (72.7%) | 3 (27.3%) |
| Information | 0 (0.0%) | 0 (0.0%) |
| Finance & Insurance | 12 (46.2%) | 14 (53.8%) |
| Real Estate, Rental & Leasing | 18 (52.9%) | 16 (47.1%) |
| Professional & Scientific | 23 (60.5%) | 15 (39.5%) |
| Enterprise Management | 0 (0.0%) | 0 (0.0%) |
| Administrative & Support | 2 (100.0%) | 0 (0.0%) |
| Educational Services | 4 (28.6%) | 10 (71.4%) |
| Health Care & Social Assistance | 11 (18.6%) | 48 (81.4%) |
| Arts, Entertainment & Recreation | 2 (100.0%) | 0 (0.0%) |
| Accommodation & Food Services | 7 (29.2%) | 17 (70.8%) |
| Public Administration | 9 (75.0%) | 3 (25.0%) |
| Total | 217 (51.4%) | 205 (48.6%) |
Education in Holden Beach
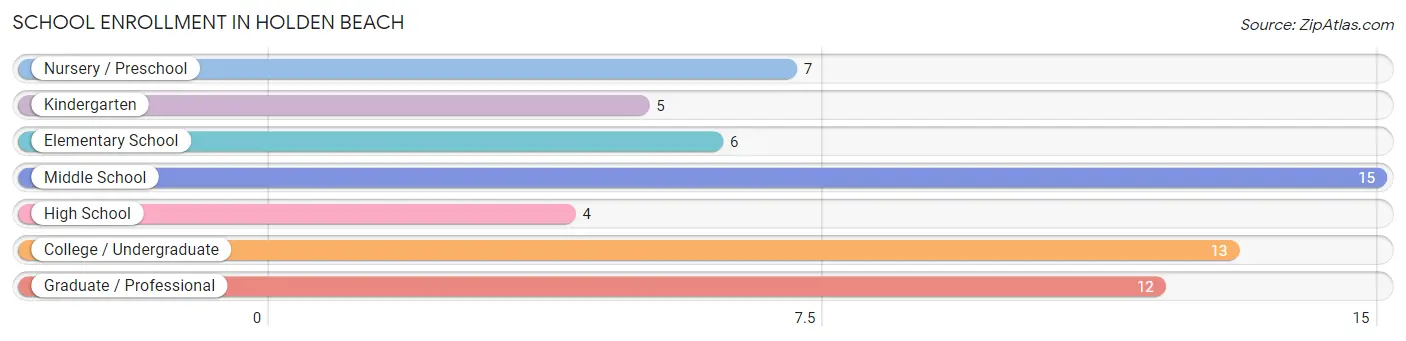
School Enrollment in Holden Beach
The most common levels of schooling among the 62 students in Holden Beach are middle school (15 | 24.2%), college / undergraduate (13 | 21.0%), and graduate / professional (12 | 19.4%).
| School Level | # Students | % Students |
| Nursery / Preschool | 7 | 11.3% |
| Kindergarten | 5 | 8.1% |
| Elementary School | 6 | 9.7% |
| Middle School | 15 | 24.2% |
| High School | 4 | 6.5% |
| College / Undergraduate | 13 | 21.0% |
| Graduate / Professional | 12 | 19.4% |
| Total | 62 | 100.0% |
School Enrollment by Age by Funding Source in Holden Beach
Out of a total of 62 students who are enrolled in schools in Holden Beach, 23 (37.1%) attend a private institution, while the remaining 39 (62.9%) are enrolled in public schools. The age group of 15 to 17 year olds has the highest likelihood of being enrolled in private schools, with 10 (100.0% in the age bracket) enrolled. Conversely, the age group of 3 to 4 year olds has the lowest likelihood of being enrolled in a private school, with 7 (100.0% in the age bracket) attending a public institution.
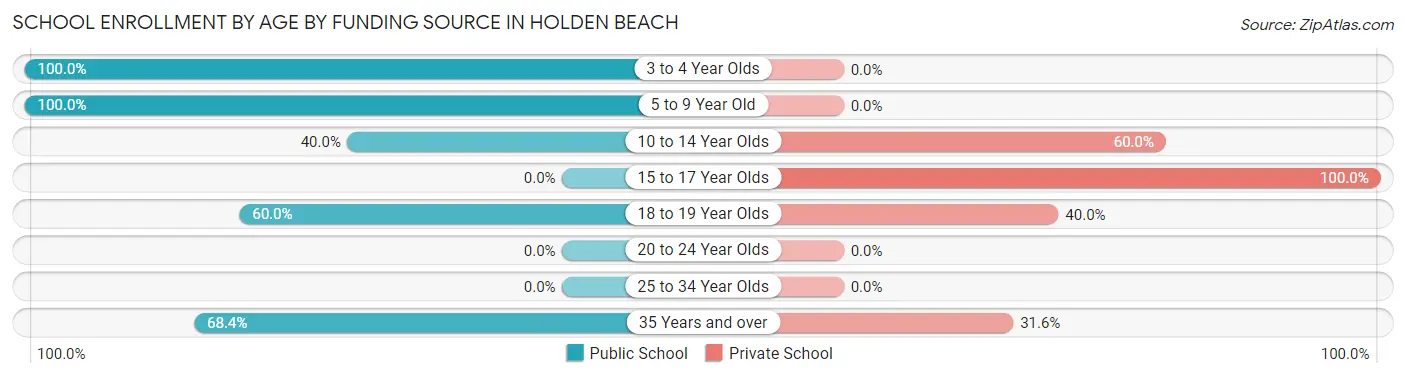
| Age Bracket | Public School | Private School |
| 3 to 4 Year Olds | 7 (100.0%) | 0 (0.0%) |
| 5 to 9 Year Old | 11 (100.0%) | 0 (0.0%) |
| 10 to 14 Year Olds | 2 (40.0%) | 3 (60.0%) |
| 15 to 17 Year Olds | 0 (0.0%) | 10 (100.0%) |
| 18 to 19 Year Olds | 6 (60.0%) | 4 (40.0%) |
| 20 to 24 Year Olds | 0 (0.0%) | 0 (0.0%) |
| 25 to 34 Year Olds | 0 (0.0%) | 0 (0.0%) |
| 35 Years and over | 13 (68.4%) | 6 (31.6%) |
| Total | 39 (62.9%) | 23 (37.1%) |
Educational Attainment by Field of Study in Holden Beach
Business (186 | 28.0%), education (105 | 15.8%), engineering (79 | 11.9%), science & technology (52 | 7.8%), and liberal arts & history (49 | 7.4%) are the most common fields of study among 664 individuals in Holden Beach who have obtained a bachelor's degree or higher.
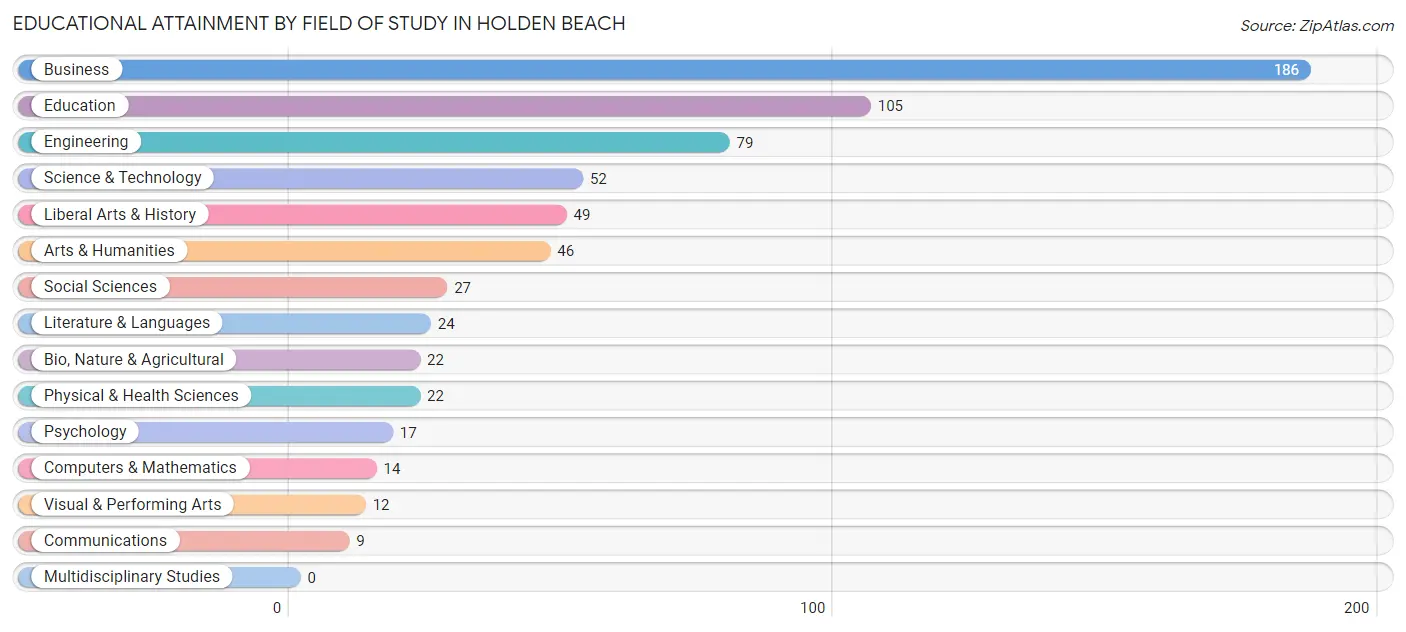
| Field of Study | # Graduates | % Graduates |
| Computers & Mathematics | 14 | 2.1% |
| Bio, Nature & Agricultural | 22 | 3.3% |
| Physical & Health Sciences | 22 | 3.3% |
| Psychology | 17 | 2.6% |
| Social Sciences | 27 | 4.1% |
| Engineering | 79 | 11.9% |
| Multidisciplinary Studies | 0 | 0.0% |
| Science & Technology | 52 | 7.8% |
| Business | 186 | 28.0% |
| Education | 105 | 15.8% |
| Literature & Languages | 24 | 3.6% |
| Liberal Arts & History | 49 | 7.4% |
| Visual & Performing Arts | 12 | 1.8% |
| Communications | 9 | 1.4% |
| Arts & Humanities | 46 | 6.9% |
| Total | 664 | 100.0% |
Transportation & Commute in Holden Beach
Vehicle Availability by Sex in Holden Beach
The most prevalent vehicle ownership categories in Holden Beach are males with 2 vehicles (115, accounting for 53.0%) and females with 2 vehicles (98, making up 56.1%).
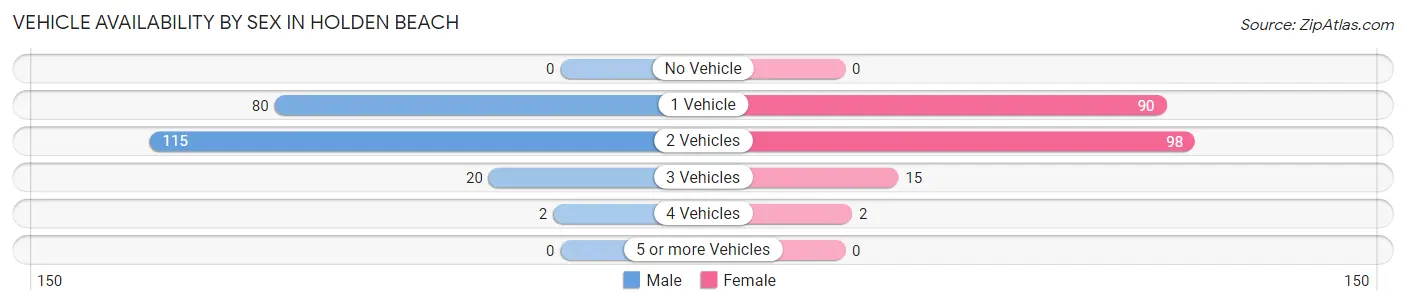
| Vehicles Available | Male | Female |
| No Vehicle | 0 (0.0%) | 0 (0.0%) |
| 1 Vehicle | 80 (36.9%) | 90 (43.9%) |
| 2 Vehicles | 115 (53.0%) | 98 (47.8%) |
| 3 Vehicles | 20 (9.2%) | 15 (7.3%) |
| 4 Vehicles | 2 (0.9%) | 2 (1.0%) |
| 5 or more Vehicles | 0 (0.0%) | 0 (0.0%) |
| Total | 217 (100.0%) | 205 (100.0%) |
Commute Time in Holden Beach
The most frequently occuring commute durations in Holden Beach are 20 to 24 minutes (111 commuters, 30.4%), 10 to 14 minutes (78 commuters, 21.4%), and less than 5 minutes (35 commuters, 9.6%).
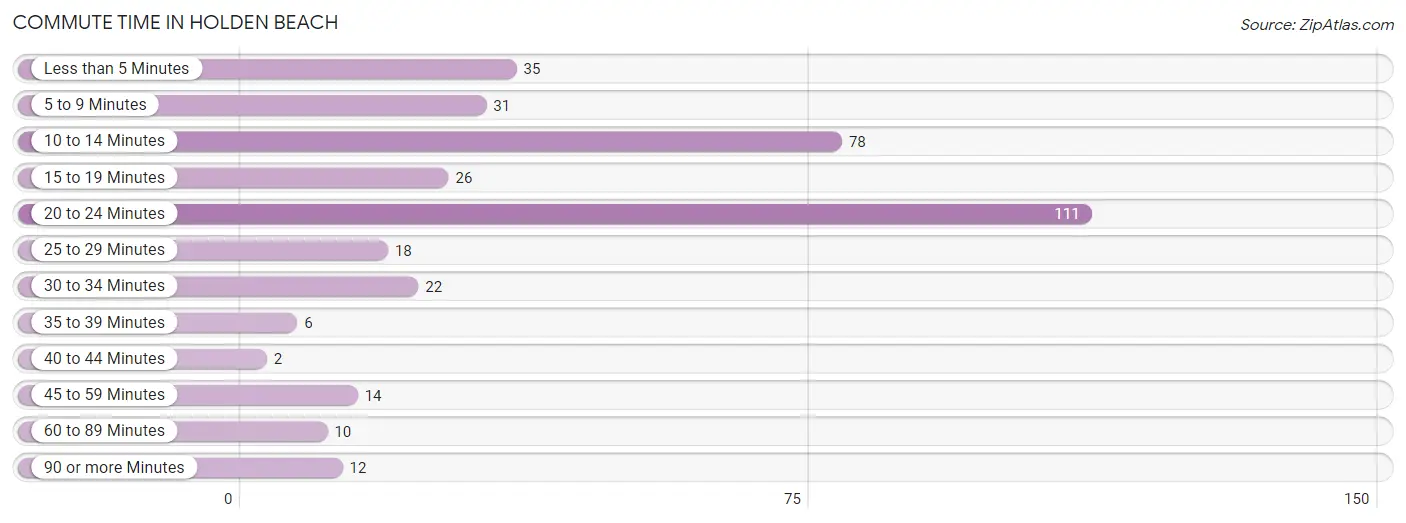
| Commute Time | # Commuters | % Commuters |
| Less than 5 Minutes | 35 | 9.6% |
| 5 to 9 Minutes | 31 | 8.5% |
| 10 to 14 Minutes | 78 | 21.4% |
| 15 to 19 Minutes | 26 | 7.1% |
| 20 to 24 Minutes | 111 | 30.4% |
| 25 to 29 Minutes | 18 | 4.9% |
| 30 to 34 Minutes | 22 | 6.0% |
| 35 to 39 Minutes | 6 | 1.6% |
| 40 to 44 Minutes | 2 | 0.5% |
| 45 to 59 Minutes | 14 | 3.8% |
| 60 to 89 Minutes | 10 | 2.7% |
| 90 or more Minutes | 12 | 3.3% |
Commute Time by Sex in Holden Beach
The most common commute times in Holden Beach are 20 to 24 minutes (92 commuters, 47.7%) for males and 10 to 14 minutes (63 commuters, 36.6%) for females.
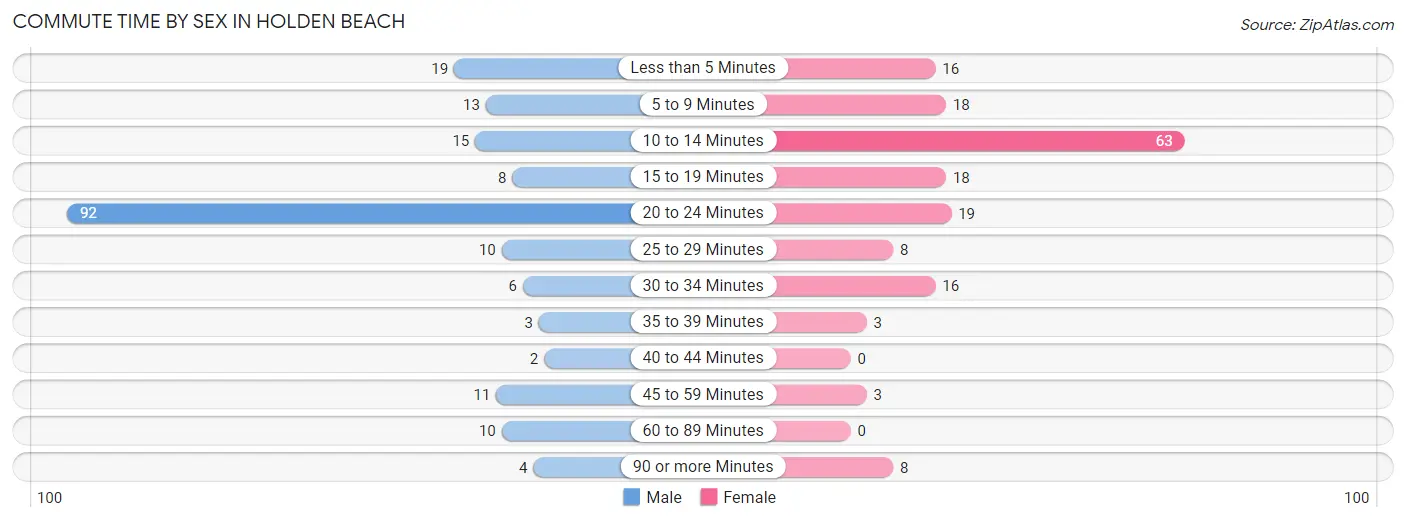
| Commute Time | Male | Female |
| Less than 5 Minutes | 19 (9.8%) | 16 (9.3%) |
| 5 to 9 Minutes | 13 (6.7%) | 18 (10.5%) |
| 10 to 14 Minutes | 15 (7.8%) | 63 (36.6%) |
| 15 to 19 Minutes | 8 (4.2%) | 18 (10.5%) |
| 20 to 24 Minutes | 92 (47.7%) | 19 (11.1%) |
| 25 to 29 Minutes | 10 (5.2%) | 8 (4.6%) |
| 30 to 34 Minutes | 6 (3.1%) | 16 (9.3%) |
| 35 to 39 Minutes | 3 (1.5%) | 3 (1.7%) |
| 40 to 44 Minutes | 2 (1.0%) | 0 (0.0%) |
| 45 to 59 Minutes | 11 (5.7%) | 3 (1.7%) |
| 60 to 89 Minutes | 10 (5.2%) | 0 (0.0%) |
| 90 or more Minutes | 4 (2.1%) | 8 (4.6%) |
Time of Departure to Work by Sex in Holden Beach
The most frequent times of departure to work in Holden Beach are 7:30 AM to 7:59 AM (62, 32.1%) for males and 12:00 PM to 3:59 PM (62, 36.0%) for females.
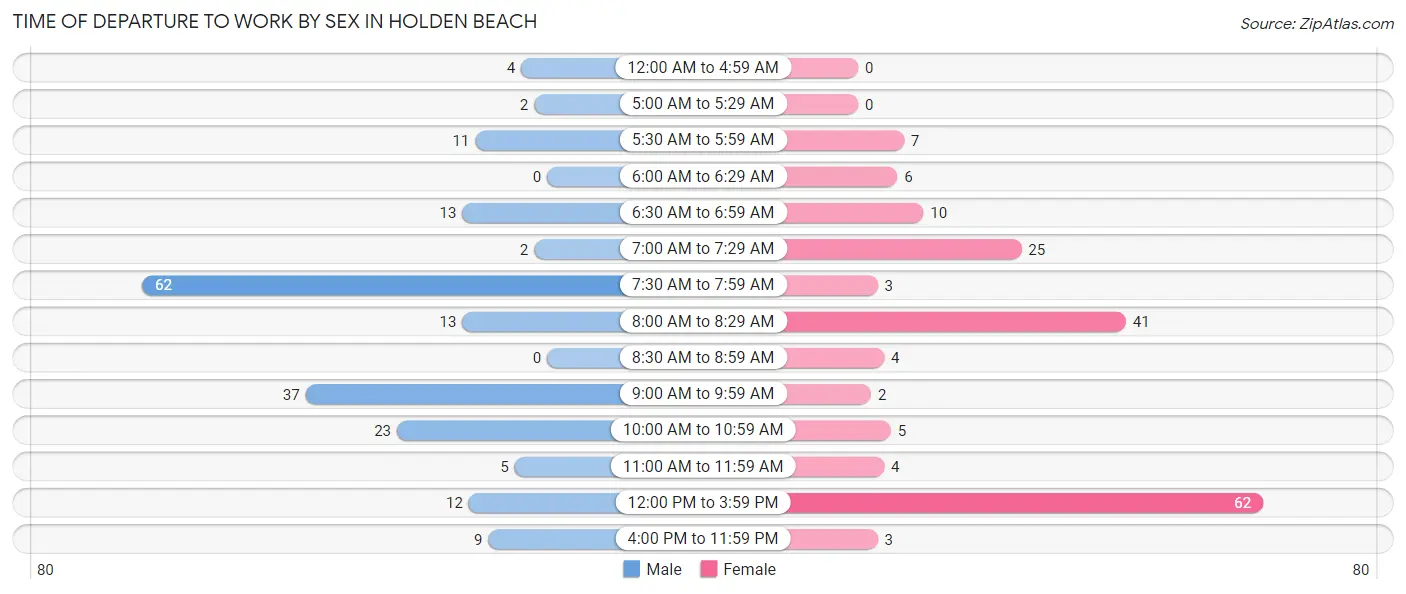
| Time of Departure | Male | Female |
| 12:00 AM to 4:59 AM | 4 (2.1%) | 0 (0.0%) |
| 5:00 AM to 5:29 AM | 2 (1.0%) | 0 (0.0%) |
| 5:30 AM to 5:59 AM | 11 (5.7%) | 7 (4.1%) |
| 6:00 AM to 6:29 AM | 0 (0.0%) | 6 (3.5%) |
| 6:30 AM to 6:59 AM | 13 (6.7%) | 10 (5.8%) |
| 7:00 AM to 7:29 AM | 2 (1.0%) | 25 (14.5%) |
| 7:30 AM to 7:59 AM | 62 (32.1%) | 3 (1.7%) |
| 8:00 AM to 8:29 AM | 13 (6.7%) | 41 (23.8%) |
| 8:30 AM to 8:59 AM | 0 (0.0%) | 4 (2.3%) |
| 9:00 AM to 9:59 AM | 37 (19.2%) | 2 (1.2%) |
| 10:00 AM to 10:59 AM | 23 (11.9%) | 5 (2.9%) |
| 11:00 AM to 11:59 AM | 5 (2.6%) | 4 (2.3%) |
| 12:00 PM to 3:59 PM | 12 (6.2%) | 62 (36.0%) |
| 4:00 PM to 11:59 PM | 9 (4.7%) | 3 (1.7%) |
| Total | 193 (100.0%) | 172 (100.0%) |
Housing Occupancy in Holden Beach
Occupancy by Ownership in Holden Beach
Of the total 483 dwellings in Holden Beach, owner-occupied units account for 447 (92.5%), while renter-occupied units make up 36 (7.4%).
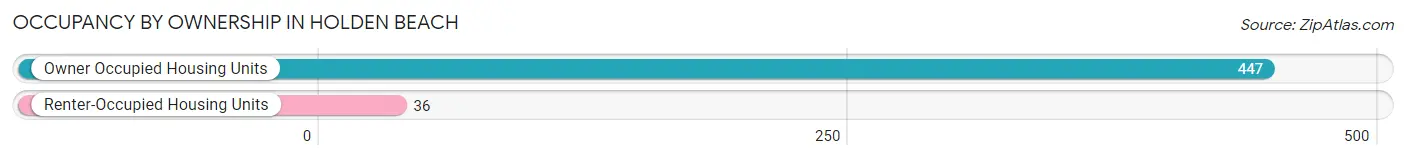
| Occupancy | # Housing Units | % Housing Units |
| Owner Occupied Housing Units | 447 | 92.5% |
| Renter-Occupied Housing Units | 36 | 7.4% |
| Total Occupied Housing Units | 483 | 100.0% |
Occupancy by Household Size in Holden Beach
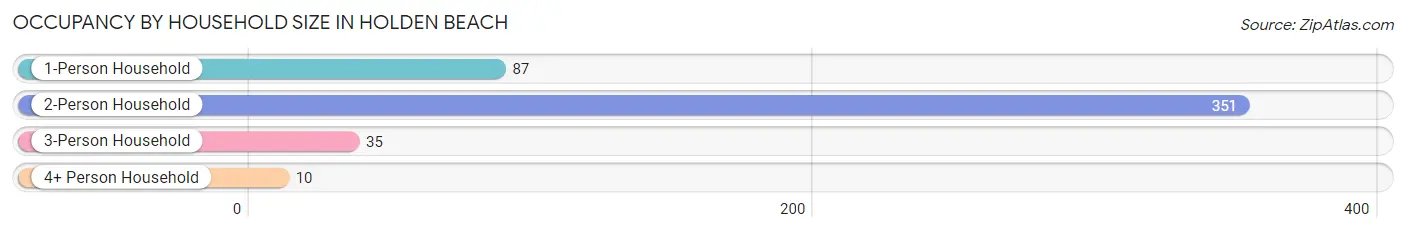
| Household Size | # Housing Units | % Housing Units |
| 1-Person Household | 87 | 18.0% |
| 2-Person Household | 351 | 72.7% |
| 3-Person Household | 35 | 7.2% |
| 4+ Person Household | 10 | 2.1% |
| Total Housing Units | 483 | 100.0% |
Occupancy by Ownership by Household Size in Holden Beach
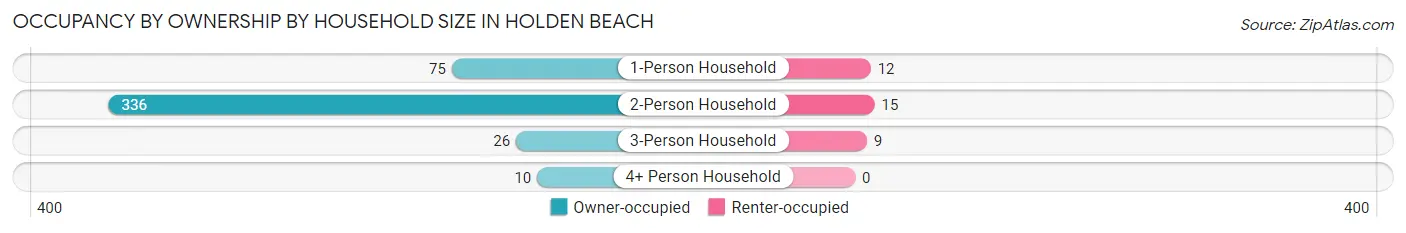
| Household Size | Owner-occupied | Renter-occupied |
| 1-Person Household | 75 (86.2%) | 12 (13.8%) |
| 2-Person Household | 336 (95.7%) | 15 (4.3%) |
| 3-Person Household | 26 (74.3%) | 9 (25.7%) |
| 4+ Person Household | 10 (100.0%) | 0 (0.0%) |
| Total Housing Units | 447 (92.5%) | 36 (7.4%) |
Occupancy by Educational Attainment in Holden Beach
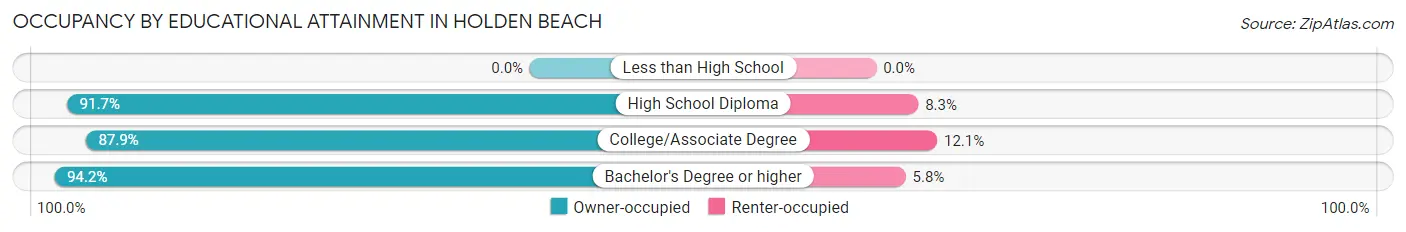
| Household Size | Owner-occupied | Renter-occupied |
| Less than High School | 0 (0.0%) | 0 (0.0%) |
| High School Diploma | 22 (91.7%) | 2 (8.3%) |
| College/Associate Degree | 102 (87.9%) | 14 (12.1%) |
| Bachelor's Degree or higher | 323 (94.2%) | 20 (5.8%) |
Occupancy by Age of Householder in Holden Beach
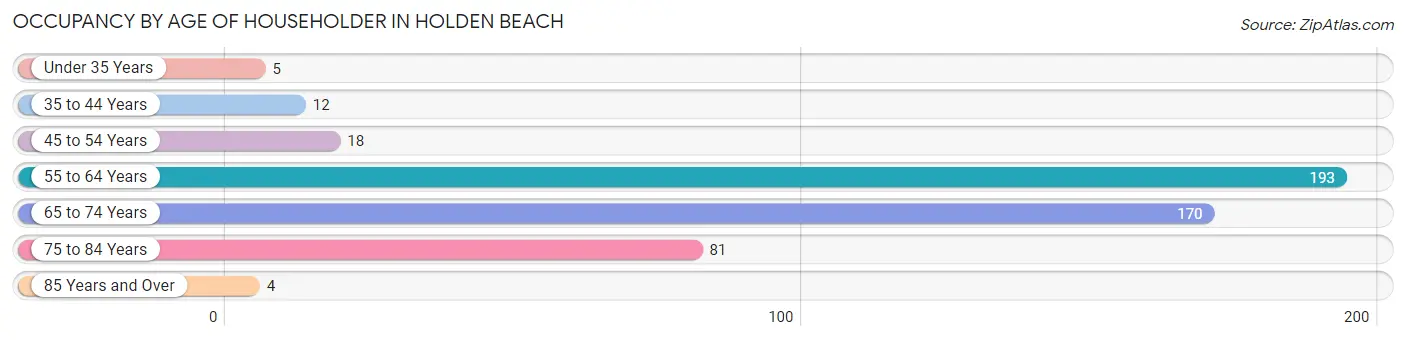
| Age Bracket | # Households | % Households |
| Under 35 Years | 5 | 1.0% |
| 35 to 44 Years | 12 | 2.5% |
| 45 to 54 Years | 18 | 3.7% |
| 55 to 64 Years | 193 | 40.0% |
| 65 to 74 Years | 170 | 35.2% |
| 75 to 84 Years | 81 | 16.8% |
| 85 Years and Over | 4 | 0.8% |
| Total | 483 | 100.0% |
Housing Finances in Holden Beach
Median Income by Occupancy in Holden Beach
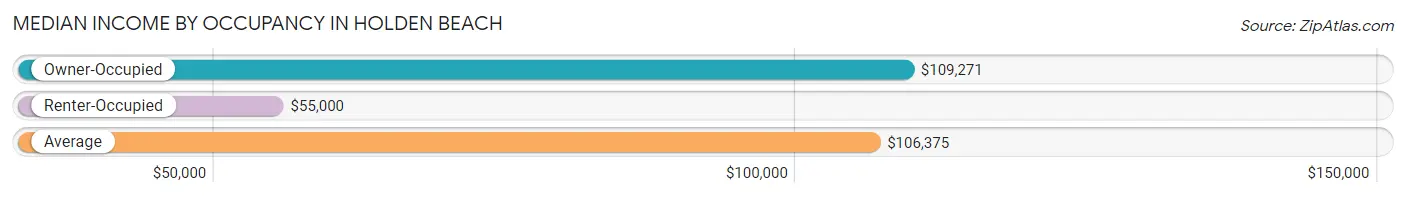
| Occupancy Type | # Households | Median Income |
| Owner-Occupied | 447 (92.5%) | $109,271 |
| Renter-Occupied | 36 (7.4%) | $55,000 |
| Average | 483 (100.0%) | $106,375 |
Occupancy by Householder Income Bracket in Holden Beach
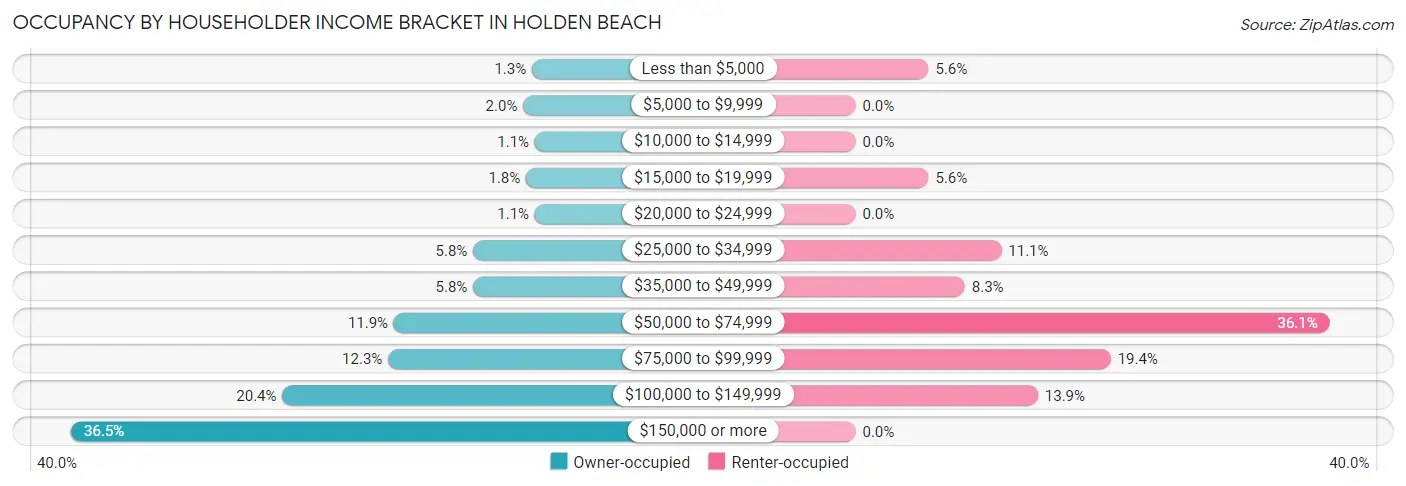
| Income Bracket | Owner-occupied | Renter-occupied |
| Less than $5,000 | 6 (1.3%) | 2 (5.6%) |
| $5,000 to $9,999 | 9 (2.0%) | 0 (0.0%) |
| $10,000 to $14,999 | 5 (1.1%) | 0 (0.0%) |
| $15,000 to $19,999 | 8 (1.8%) | 2 (5.6%) |
| $20,000 to $24,999 | 5 (1.1%) | 0 (0.0%) |
| $25,000 to $34,999 | 26 (5.8%) | 4 (11.1%) |
| $35,000 to $49,999 | 26 (5.8%) | 3 (8.3%) |
| $50,000 to $74,999 | 53 (11.9%) | 13 (36.1%) |
| $75,000 to $99,999 | 55 (12.3%) | 7 (19.4%) |
| $100,000 to $149,999 | 91 (20.4%) | 5 (13.9%) |
| $150,000 or more | 163 (36.5%) | 0 (0.0%) |
| Total | 447 (100.0%) | 36 (100.0%) |
Monthly Housing Cost Tiers in Holden Beach
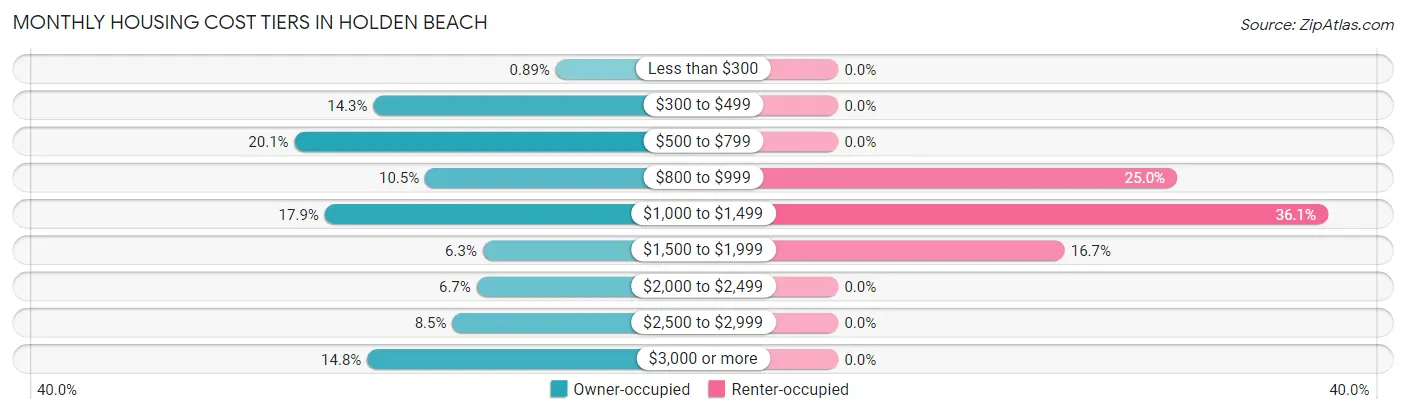
| Monthly Cost | Owner-occupied | Renter-occupied |
| Less than $300 | 4 (0.9%) | 0 (0.0%) |
| $300 to $499 | 64 (14.3%) | 0 (0.0%) |
| $500 to $799 | 90 (20.1%) | 0 (0.0%) |
| $800 to $999 | 47 (10.5%) | 9 (25.0%) |
| $1,000 to $1,499 | 80 (17.9%) | 13 (36.1%) |
| $1,500 to $1,999 | 28 (6.3%) | 6 (16.7%) |
| $2,000 to $2,499 | 30 (6.7%) | 0 (0.0%) |
| $2,500 to $2,999 | 38 (8.5%) | 0 (0.0%) |
| $3,000 or more | 66 (14.8%) | 0 (0.0%) |
| Total | 447 (100.0%) | 36 (100.0%) |
Physical Housing Characteristics in Holden Beach
Housing Structures in Holden Beach
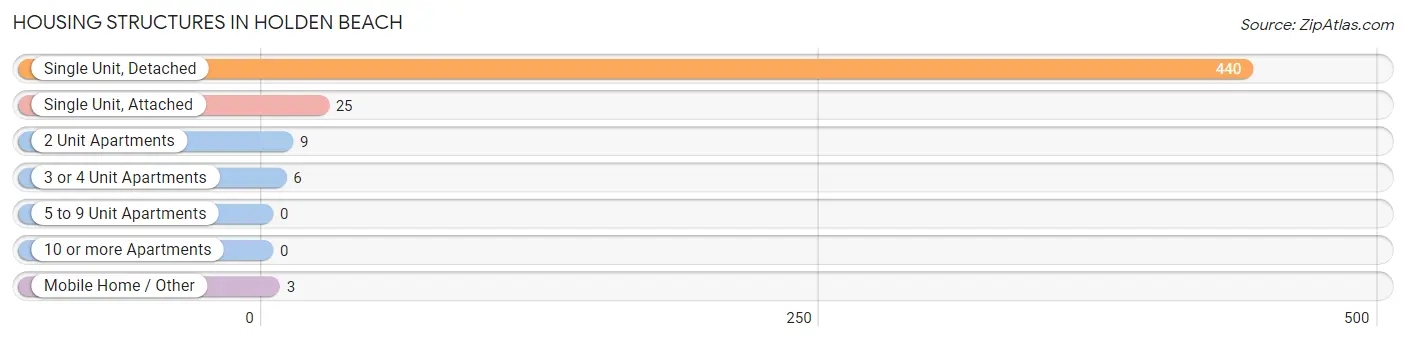
| Structure Type | # Housing Units | % Housing Units |
| Single Unit, Detached | 440 | 91.1% |
| Single Unit, Attached | 25 | 5.2% |
| 2 Unit Apartments | 9 | 1.9% |
| 3 or 4 Unit Apartments | 6 | 1.2% |
| 5 to 9 Unit Apartments | 0 | 0.0% |
| 10 or more Apartments | 0 | 0.0% |
| Mobile Home / Other | 3 | 0.6% |
| Total | 483 | 100.0% |
Housing Structures by Occupancy in Holden Beach
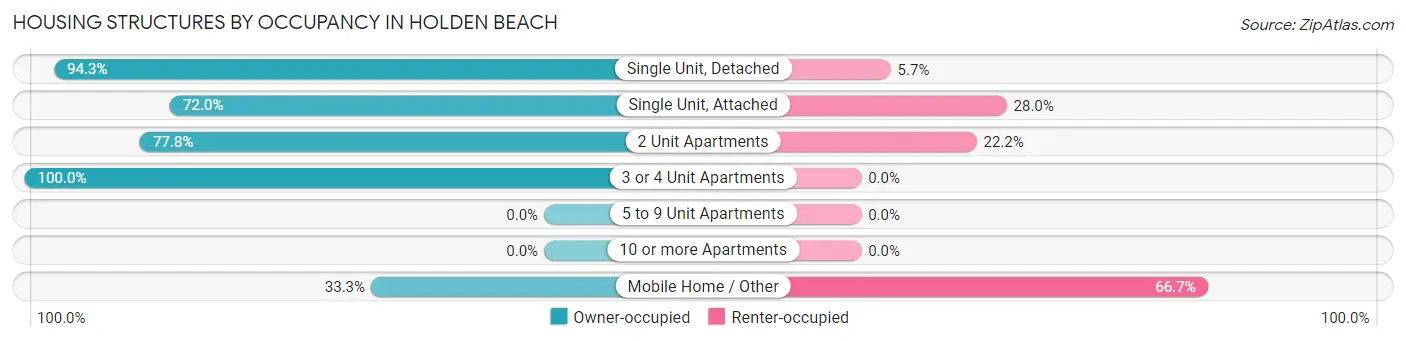
| Structure Type | Owner-occupied | Renter-occupied |
| Single Unit, Detached | 415 (94.3%) | 25 (5.7%) |
| Single Unit, Attached | 18 (72.0%) | 7 (28.0%) |
| 2 Unit Apartments | 7 (77.8%) | 2 (22.2%) |
| 3 or 4 Unit Apartments | 6 (100.0%) | 0 (0.0%) |
| 5 to 9 Unit Apartments | 0 (0.0%) | 0 (0.0%) |
| 10 or more Apartments | 0 (0.0%) | 0 (0.0%) |
| Mobile Home / Other | 1 (33.3%) | 2 (66.7%) |
| Total | 447 (92.5%) | 36 (7.4%) |
Housing Structures by Number of Rooms in Holden Beach
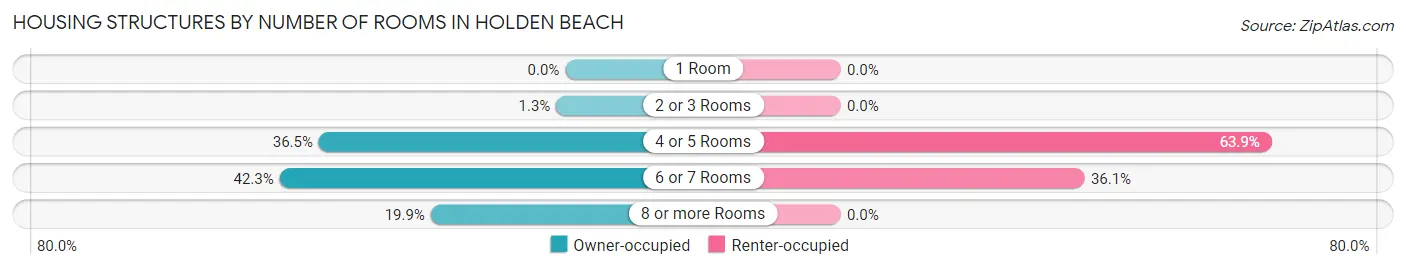
| Number of Rooms | Owner-occupied | Renter-occupied |
| 1 Room | 0 (0.0%) | 0 (0.0%) |
| 2 or 3 Rooms | 6 (1.3%) | 0 (0.0%) |
| 4 or 5 Rooms | 163 (36.5%) | 23 (63.9%) |
| 6 or 7 Rooms | 189 (42.3%) | 13 (36.1%) |
| 8 or more Rooms | 89 (19.9%) | 0 (0.0%) |
| Total | 447 (100.0%) | 36 (100.0%) |
Housing Structure by Heating Type in Holden Beach
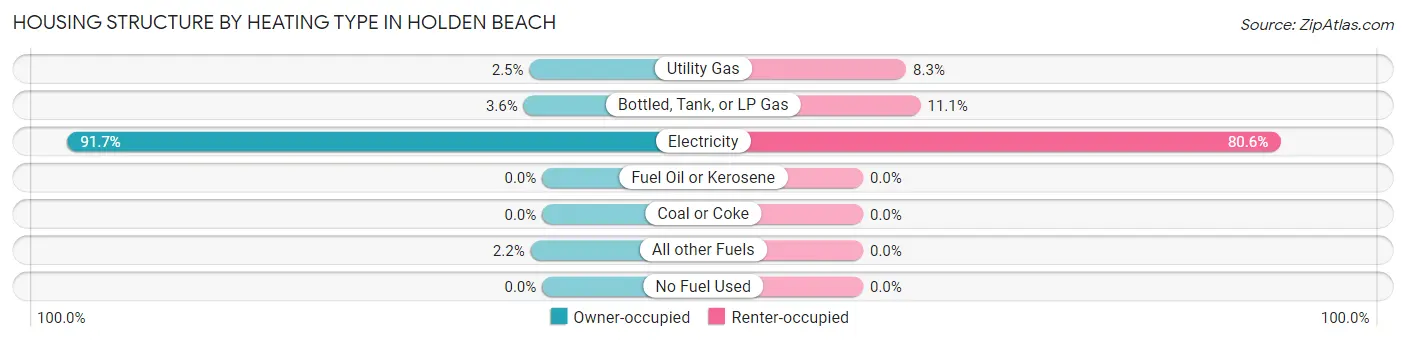
| Heating Type | Owner-occupied | Renter-occupied |
| Utility Gas | 11 (2.5%) | 3 (8.3%) |
| Bottled, Tank, or LP Gas | 16 (3.6%) | 4 (11.1%) |
| Electricity | 410 (91.7%) | 29 (80.6%) |
| Fuel Oil or Kerosene | 0 (0.0%) | 0 (0.0%) |
| Coal or Coke | 0 (0.0%) | 0 (0.0%) |
| All other Fuels | 10 (2.2%) | 0 (0.0%) |
| No Fuel Used | 0 (0.0%) | 0 (0.0%) |
| Total | 447 (100.0%) | 36 (100.0%) |
Household Vehicle Usage in Holden Beach
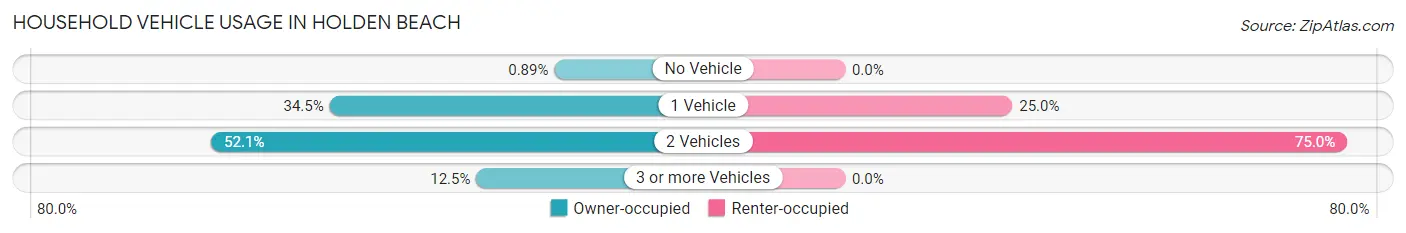
| Vehicles per Household | Owner-occupied | Renter-occupied |
| No Vehicle | 4 (0.9%) | 0 (0.0%) |
| 1 Vehicle | 154 (34.4%) | 9 (25.0%) |
| 2 Vehicles | 233 (52.1%) | 27 (75.0%) |
| 3 or more Vehicles | 56 (12.5%) | 0 (0.0%) |
| Total | 447 (100.0%) | 36 (100.0%) |
Real Estate & Mortgages in Holden Beach
Real Estate and Mortgage Overview in Holden Beach
| Characteristic | Without Mortgage | With Mortgage |
| Housing Units | 265 | 182 |
| Median Property Value | $451,300 | $492,700 |
| Median Household Income | $120,417 | $50 |
| Monthly Housing Costs | $725 | $66 |
| Real Estate Taxes | $3,023 | $0 |
Property Value by Mortgage Status in Holden Beach
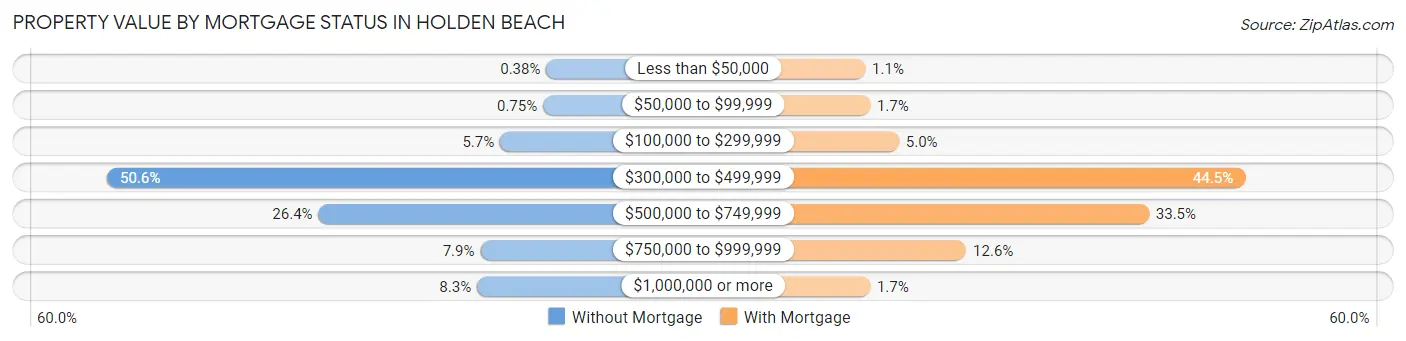
| Property Value | Without Mortgage | With Mortgage |
| Less than $50,000 | 1 (0.4%) | 2 (1.1%) |
| $50,000 to $99,999 | 2 (0.7%) | 3 (1.7%) |
| $100,000 to $299,999 | 15 (5.7%) | 9 (5.0%) |
| $300,000 to $499,999 | 134 (50.6%) | 81 (44.5%) |
| $500,000 to $749,999 | 70 (26.4%) | 61 (33.5%) |
| $750,000 to $999,999 | 21 (7.9%) | 23 (12.6%) |
| $1,000,000 or more | 22 (8.3%) | 3 (1.7%) |
| Total | 265 (100.0%) | 182 (100.0%) |
Household Income by Mortgage Status in Holden Beach
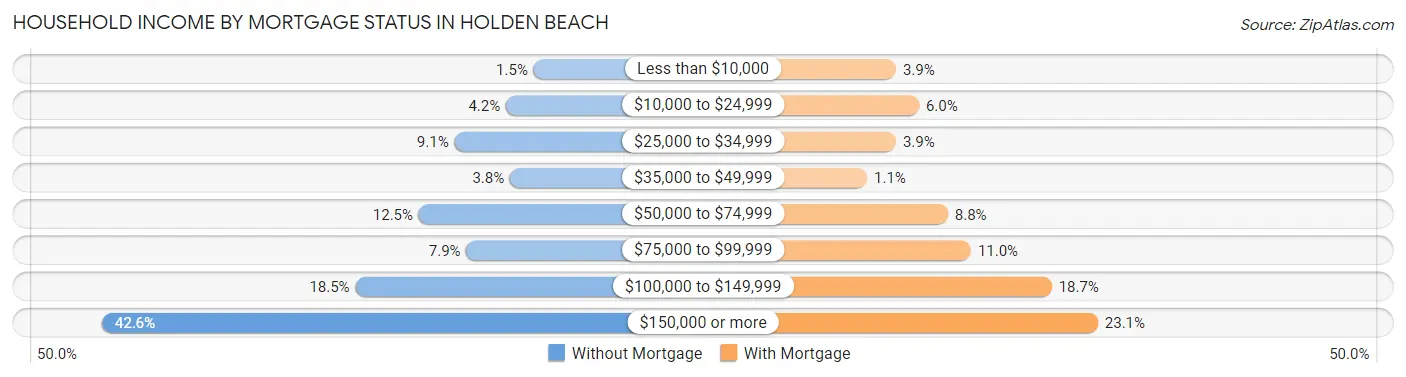
| Household Income | Without Mortgage | With Mortgage |
| Less than $10,000 | 4 (1.5%) | 7 (3.8%) |
| $10,000 to $24,999 | 11 (4.2%) | 11 (6.0%) |
| $25,000 to $34,999 | 24 (9.1%) | 7 (3.8%) |
| $35,000 to $49,999 | 10 (3.8%) | 2 (1.1%) |
| $50,000 to $74,999 | 33 (12.4%) | 16 (8.8%) |
| $75,000 to $99,999 | 21 (7.9%) | 20 (11.0%) |
| $100,000 to $149,999 | 49 (18.5%) | 34 (18.7%) |
| $150,000 or more | 113 (42.6%) | 42 (23.1%) |
| Total | 265 (100.0%) | 182 (100.0%) |
Property Value to Household Income Ratio in Holden Beach
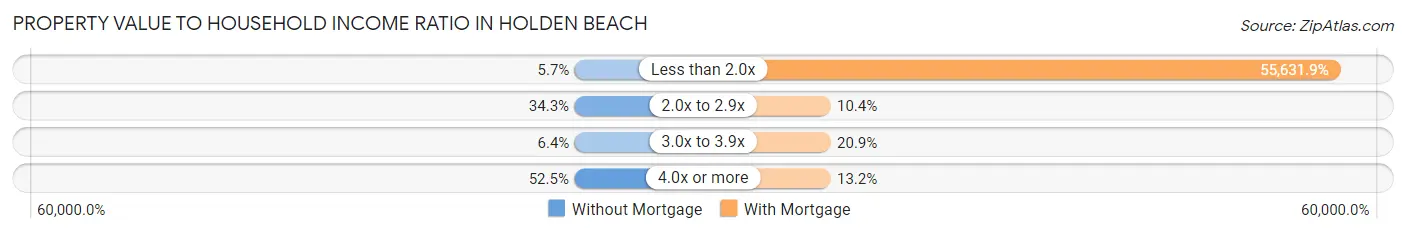
| Value-to-Income Ratio | Without Mortgage | With Mortgage |
| Less than 2.0x | 15 (5.7%) | 101,250 (55,631.9%) |
| 2.0x to 2.9x | 91 (34.3%) | 19 (10.4%) |
| 3.0x to 3.9x | 17 (6.4%) | 38 (20.9%) |
| 4.0x or more | 139 (52.4%) | 24 (13.2%) |
| Total | 265 (100.0%) | 182 (100.0%) |
Real Estate Taxes by Mortgage Status in Holden Beach
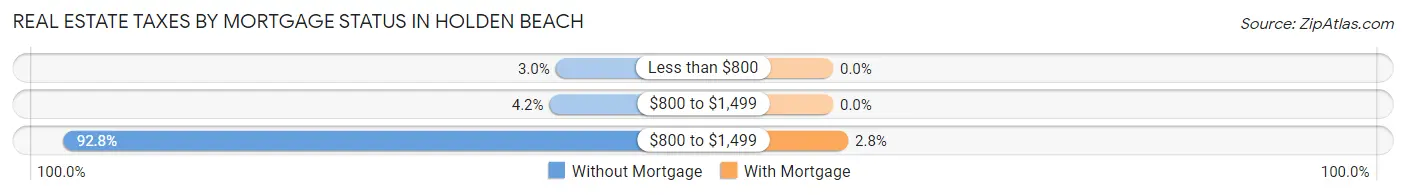
| Property Taxes | Without Mortgage | With Mortgage |
| Less than $800 | 8 (3.0%) | 0 (0.0%) |
| $800 to $1,499 | 11 (4.2%) | 0 (0.0%) |
| $800 to $1,499 | 246 (92.8%) | 5 (2.8%) |
| Total | 265 (100.0%) | 182 (100.0%) |
Health & Disability in Holden Beach
Health Insurance Coverage by Age in Holden Beach
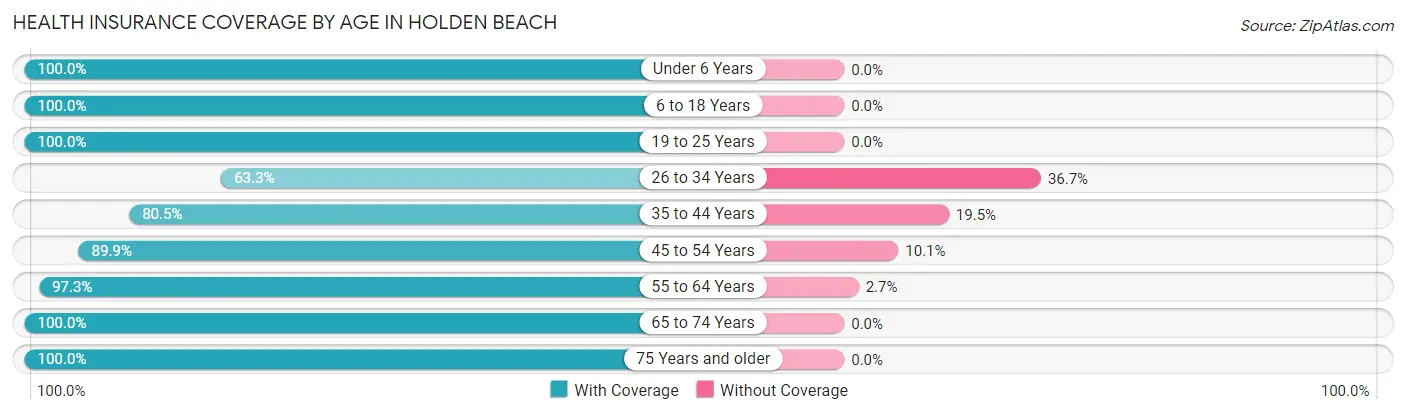
| Age Bracket | With Coverage | Without Coverage |
| Under 6 Years | 20 (100.0%) | 0 (0.0%) |
| 6 to 18 Years | 32 (100.0%) | 0 (0.0%) |
| 19 to 25 Years | 29 (100.0%) | 0 (0.0%) |
| 26 to 34 Years | 19 (63.3%) | 11 (36.7%) |
| 35 to 44 Years | 33 (80.5%) | 8 (19.5%) |
| 45 to 54 Years | 107 (89.9%) | 12 (10.1%) |
| 55 to 64 Years | 289 (97.3%) | 8 (2.7%) |
| 65 to 74 Years | 266 (100.0%) | 0 (0.0%) |
| 75 Years and older | 163 (100.0%) | 0 (0.0%) |
| Total | 958 (96.1%) | 39 (3.9%) |
Health Insurance Coverage by Citizenship Status in Holden Beach
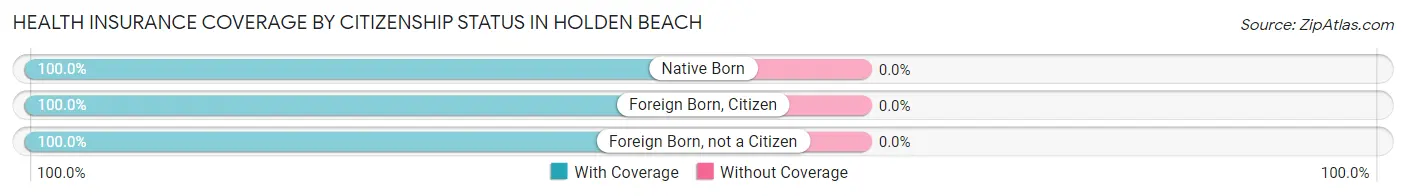
| Citizenship Status | With Coverage | Without Coverage |
| Native Born | 20 (100.0%) | 0 (0.0%) |
| Foreign Born, Citizen | 32 (100.0%) | 0 (0.0%) |
| Foreign Born, not a Citizen | 29 (100.0%) | 0 (0.0%) |
Health Insurance Coverage by Household Income in Holden Beach
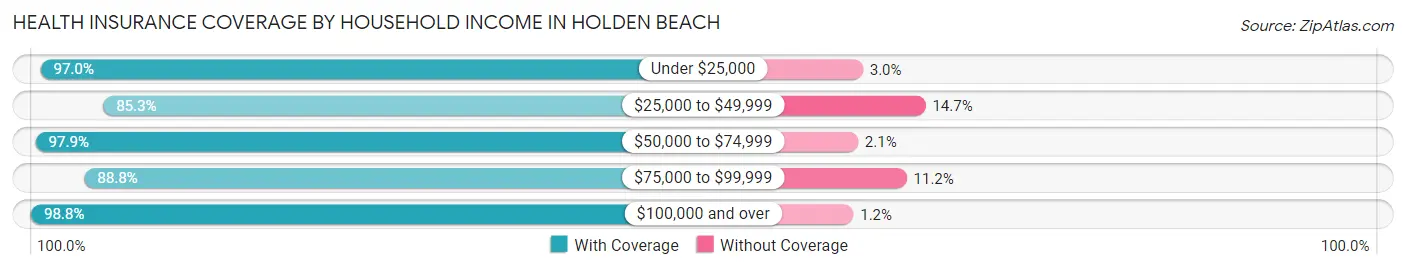
| Household Income | With Coverage | Without Coverage |
| Under $25,000 | 65 (97.0%) | 2 (3.0%) |
| $25,000 to $49,999 | 81 (85.3%) | 14 (14.7%) |
| $50,000 to $74,999 | 141 (97.9%) | 3 (2.1%) |
| $75,000 to $99,999 | 103 (88.8%) | 13 (11.2%) |
| $100,000 and over | 568 (98.8%) | 7 (1.2%) |
Public vs Private Health Insurance Coverage by Age in Holden Beach
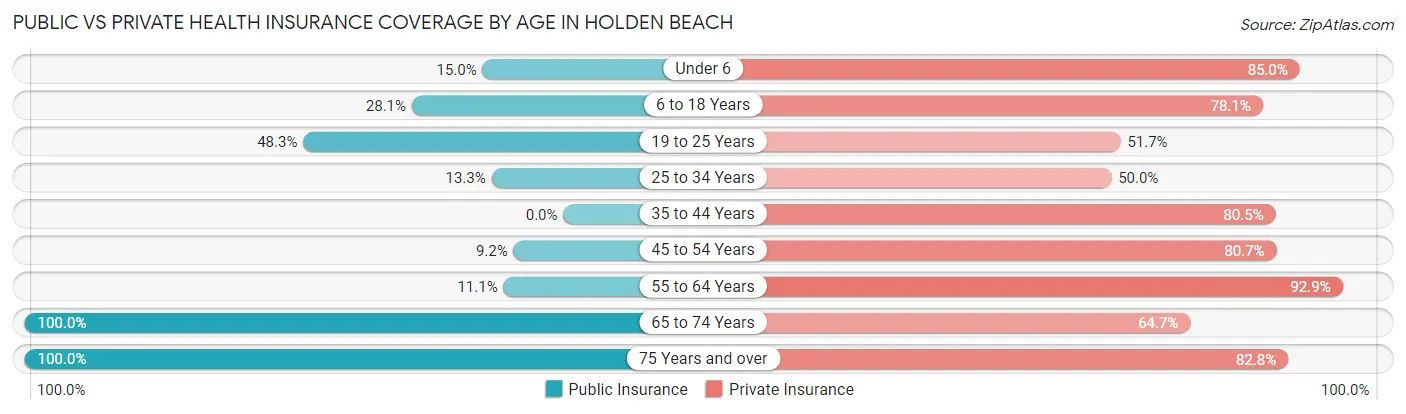
| Age Bracket | Public Insurance | Private Insurance |
| Under 6 | 3 (15.0%) | 17 (85.0%) |
| 6 to 18 Years | 9 (28.1%) | 25 (78.1%) |
| 19 to 25 Years | 14 (48.3%) | 15 (51.7%) |
| 25 to 34 Years | 4 (13.3%) | 15 (50.0%) |
| 35 to 44 Years | 0 (0.0%) | 33 (80.5%) |
| 45 to 54 Years | 11 (9.2%) | 96 (80.7%) |
| 55 to 64 Years | 33 (11.1%) | 276 (92.9%) |
| 65 to 74 Years | 266 (100.0%) | 172 (64.7%) |
| 75 Years and over | 163 (100.0%) | 135 (82.8%) |
| Total | 503 (50.4%) | 784 (78.6%) |
Disability Status by Sex by Age in Holden Beach
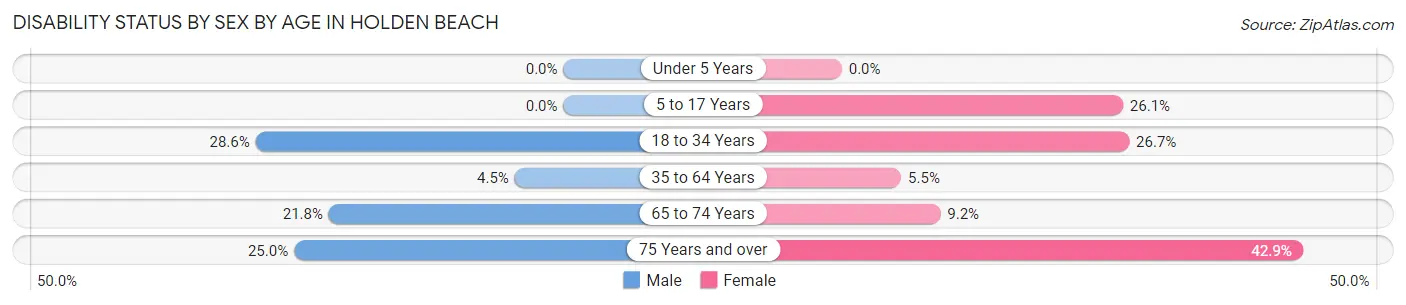
| Age Bracket | Male | Female |
| Under 5 Years | 0 (0.0%) | 0 (0.0%) |
| 5 to 17 Years | 0 (0.0%) | 6 (26.1%) |
| 18 to 34 Years | 14 (28.6%) | 4 (26.7%) |
| 35 to 64 Years | 10 (4.5%) | 13 (5.5%) |
| 65 to 74 Years | 27 (21.8%) | 13 (9.1%) |
| 75 Years and over | 18 (25.0%) | 39 (42.9%) |
Disability Class by Sex by Age in Holden Beach
Disability Class: Hearing Difficulty
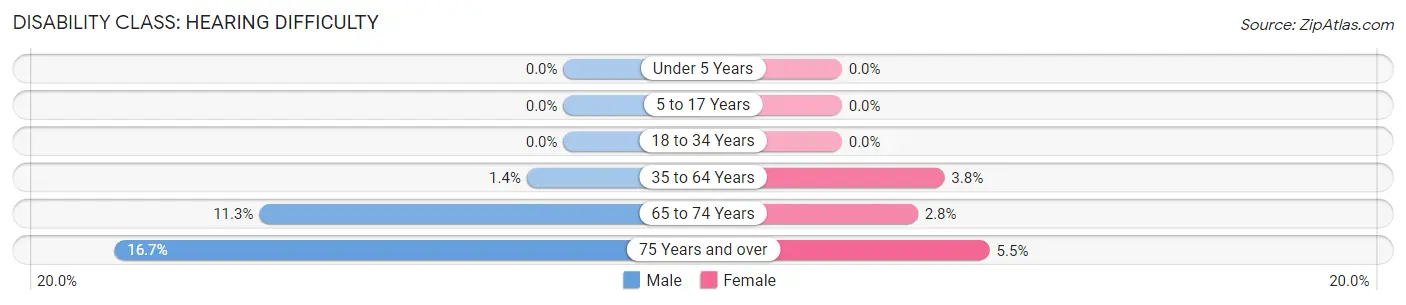
| Age Bracket | Male | Female |
| Under 5 Years | 0 (0.0%) | 0 (0.0%) |
| 5 to 17 Years | 0 (0.0%) | 0 (0.0%) |
| 18 to 34 Years | 0 (0.0%) | 0 (0.0%) |
| 35 to 64 Years | 3 (1.4%) | 9 (3.8%) |
| 65 to 74 Years | 14 (11.3%) | 4 (2.8%) |
| 75 Years and over | 12 (16.7%) | 5 (5.5%) |
Disability Class: Vision Difficulty
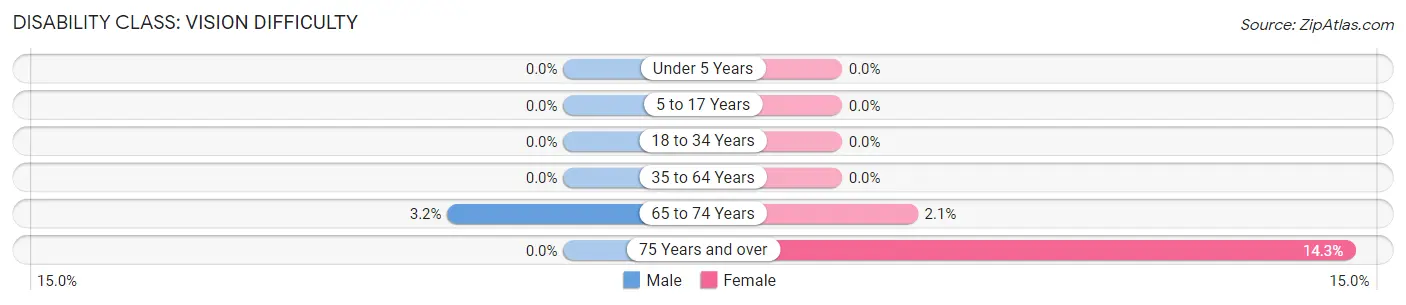
| Age Bracket | Male | Female |
| Under 5 Years | 0 (0.0%) | 0 (0.0%) |
| 5 to 17 Years | 0 (0.0%) | 0 (0.0%) |
| 18 to 34 Years | 0 (0.0%) | 0 (0.0%) |
| 35 to 64 Years | 0 (0.0%) | 0 (0.0%) |
| 65 to 74 Years | 4 (3.2%) | 3 (2.1%) |
| 75 Years and over | 0 (0.0%) | 13 (14.3%) |
Disability Class: Cognitive Difficulty
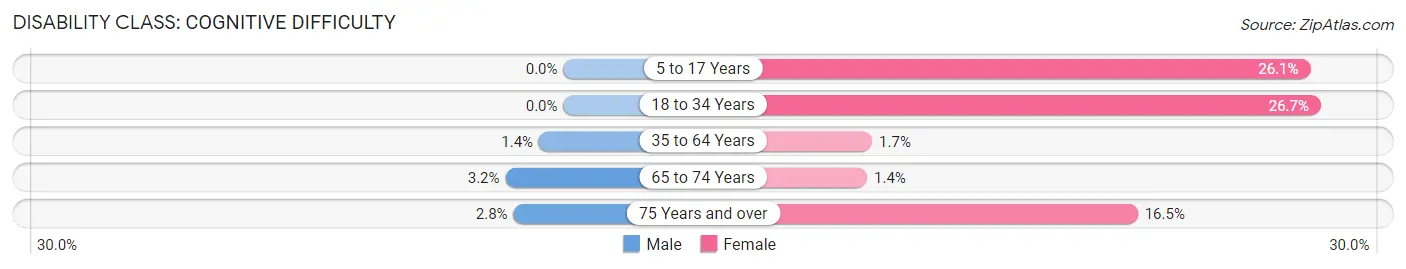
| Age Bracket | Male | Female |
| 5 to 17 Years | 0 (0.0%) | 6 (26.1%) |
| 18 to 34 Years | 0 (0.0%) | 4 (26.7%) |
| 35 to 64 Years | 3 (1.4%) | 4 (1.7%) |
| 65 to 74 Years | 4 (3.2%) | 2 (1.4%) |
| 75 Years and over | 2 (2.8%) | 15 (16.5%) |
Disability Class: Ambulatory Difficulty
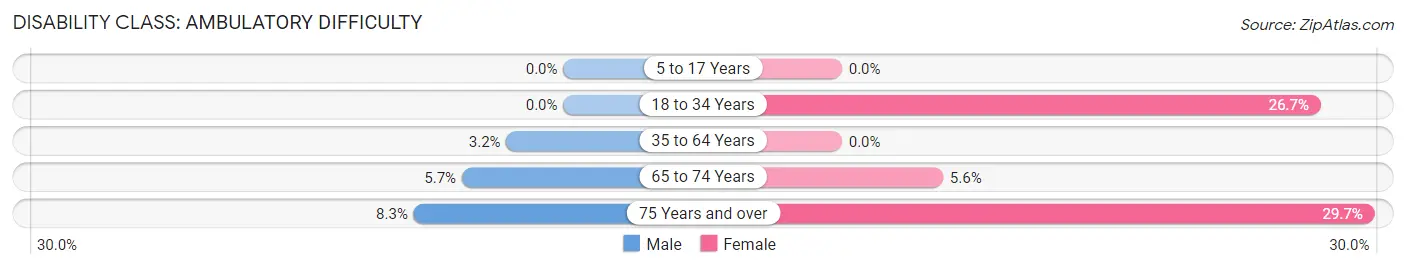
| Age Bracket | Male | Female |
| 5 to 17 Years | 0 (0.0%) | 0 (0.0%) |
| 18 to 34 Years | 0 (0.0%) | 4 (26.7%) |
| 35 to 64 Years | 7 (3.2%) | 0 (0.0%) |
| 65 to 74 Years | 7 (5.7%) | 8 (5.6%) |
| 75 Years and over | 6 (8.3%) | 27 (29.7%) |
Disability Class: Self-Care Difficulty
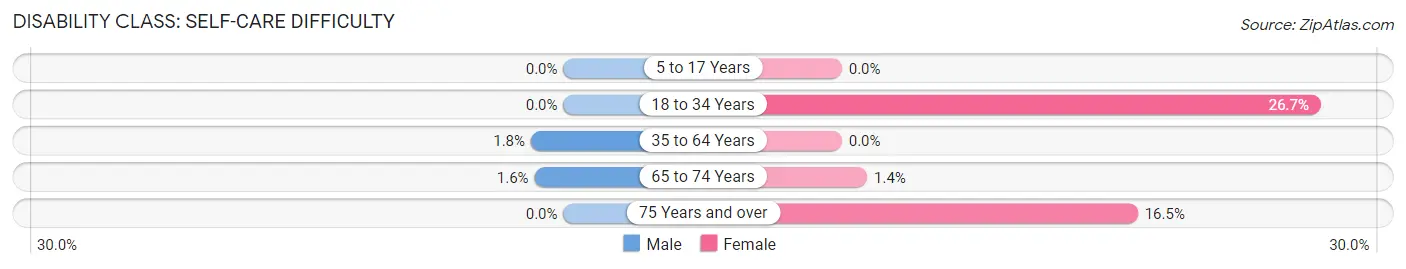
| Age Bracket | Male | Female |
| 5 to 17 Years | 0 (0.0%) | 0 (0.0%) |
| 18 to 34 Years | 0 (0.0%) | 4 (26.7%) |
| 35 to 64 Years | 4 (1.8%) | 0 (0.0%) |
| 65 to 74 Years | 2 (1.6%) | 2 (1.4%) |
| 75 Years and over | 0 (0.0%) | 15 (16.5%) |
Technology Access in Holden Beach
Computing Device Access in Holden Beach
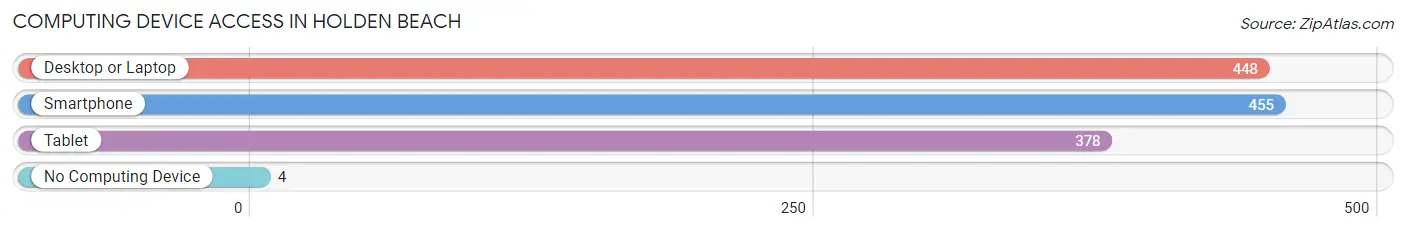
| Device Type | # Households | % Households |
| Desktop or Laptop | 448 | 92.7% |
| Smartphone | 455 | 94.2% |
| Tablet | 378 | 78.3% |
| No Computing Device | 4 | 0.8% |
| Total | 483 | 100.0% |
Internet Access in Holden Beach
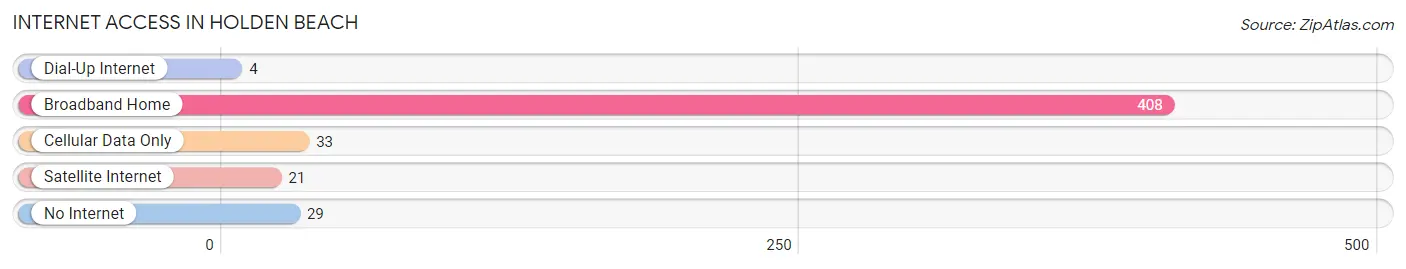
| Internet Type | # Households | % Households |
| Dial-Up Internet | 4 | 0.8% |
| Broadband Home | 408 | 84.5% |
| Cellular Data Only | 33 | 6.8% |
| Satellite Internet | 21 | 4.3% |
| No Internet | 29 | 6.0% |
| Total | 483 | 100.0% |
Holden Beach Summary
Holden Beach is a small town located in Brunswick County, North Carolina. It is situated on the Atlantic Ocean, just south of Wilmington and north of Myrtle Beach, South Carolina. The town is known for its beautiful beaches, fishing, and recreational activities.
Geography
Holden Beach is located on the Atlantic Ocean, just south of Wilmington and north of Myrtle Beach, South Carolina. The town is situated on a barrier island, which is separated from the mainland by the Intracoastal Waterway. The town is approximately 4.5 miles long and 0.5 miles wide. The town is bordered by the Atlantic Ocean to the east, the Intracoastal Waterway to the west, and the Holden Beach Causeway to the north. The town is located in the Cape Fear region of North Carolina, and is part of the Wilmington Metropolitan Statistical Area.
History
Holden Beach was first settled in the late 1800s by the Holden family, who were originally from England. The family purchased the land from the local Native American tribes and established a small fishing village. The town was officially incorporated in 1953, and the Holden Beach Causeway was built in the 1960s, connecting the town to the mainland.
Economy
The economy of Holden Beach is largely based on tourism. The town is a popular destination for beachgoers, and there are numerous hotels, restaurants, and shops in the area. Fishing is also a major industry in the town, and there are several charter fishing companies that operate in the area. The town also has a small commercial fishing fleet.
Demographics
As of the 2010 census, the population of Holden Beach was 524. The racial makeup of the town was 97.3% White, 0.6% African American, 0.2% Native American, 0.4% Asian, 0.2% from other races, and 1.3% from two or more races. The median household income was $50,000, and the median family income was $54,000. The per capita income was $25,000.
Conclusion
Holden Beach is a small town located in Brunswick County, North Carolina. It is situated on the Atlantic Ocean, just south of Wilmington and north of Myrtle Beach, South Carolina. The town is known for its beautiful beaches, fishing, and recreational activities. The economy of Holden Beach is largely based on tourism, fishing, and commercial fishing. As of the 2010 census, the population of Holden Beach was 524. The racial makeup of the town was 97.3% White, 0.6% African American, 0.2% Native American, 0.4% Asian, 0.2% from other races, and 1.3% from two or more races. The median household income was $50,000, and the median family income was $54,000. The per capita income was $25,000.
Common Questions
What is the Total Population of Holden Beach?
Total Population of Holden Beach is 997.
What is the Total Male Population of Holden Beach?
Total Male Population of Holden Beach is 480.
What is the Total Female Population of Holden Beach?
Total Female Population of Holden Beach is 517.
What is the Ratio of Males per 100 Females in Holden Beach?
There are 92.84 Males per 100 Females in Holden Beach.
What is the Ratio of Females per 100 Males in Holden Beach?
There are 107.71 Females per 100 Males in Holden Beach.
What is the Median Population Age in Holden Beach?
Median Population Age in Holden Beach is 63.7 Years.
What is the Average Family Size in Holden Beach
Average Family Size in Holden Beach is 2.3 People.
What is the Average Household Size in Holden Beach
Average Household Size in Holden Beach is 2.1 People.
What is Per Capita Income in Holden Beach?
Per Capita income in Holden Beach is $68,093.
What is the Median Family Income in Holden Beach?
Median Family Income in Holden Beach is $119,250.
What is the Median Household income in Holden Beach?
Median Household Income in Holden Beach is $106,375.
What is Income or Wage Gap in Holden Beach?
Income or Wage Gap in Holden Beach is 65.4%.
Women in Holden Beach earn 34.6 cents for every dollar earned by a man.
What is Inequality or Gini Index in Holden Beach?
Inequality or Gini Index in Holden Beach is 0.44.
How Large is the Labor Force in Holden Beach?
There are 432 People in the Labor Forcein in Holden Beach.
What is the Percentage of People in the Labor Force in Holden Beach?
45.2% of People are in the Labor Force in Holden Beach.
What is the Unemployment Rate in Holden Beach?
Unemployment Rate in Holden Beach is 2.3%.