Unionville, NC
Unionville Map
Unionville Overview
6,694
TOTAL POPULATION
3,504
MALE POPULATION
3,190
FEMALE POPULATION
109.84
MALES / 100 FEMALES
91.04
FEMALES / 100 MALES
39.7
MEDIAN AGE
3.1
AVG FAMILY SIZE
2.8
AVG HOUSEHOLD SIZE
$37,700
PER CAPITA INCOME
$98,375
AVG FAMILY INCOME
$90,904
AVG HOUSEHOLD INCOME
28.6%
WAGE / INCOME GAP [ % ]
71.4¢/ $1
WAGE / INCOME GAP [ $ ]
0.36
INEQUALITY / GINI INDEX
3,826
LABOR FORCE [ PEOPLE ]
71.7%
PERCENT IN LABOR FORCE
3.6%
UNEMPLOYMENT RATE
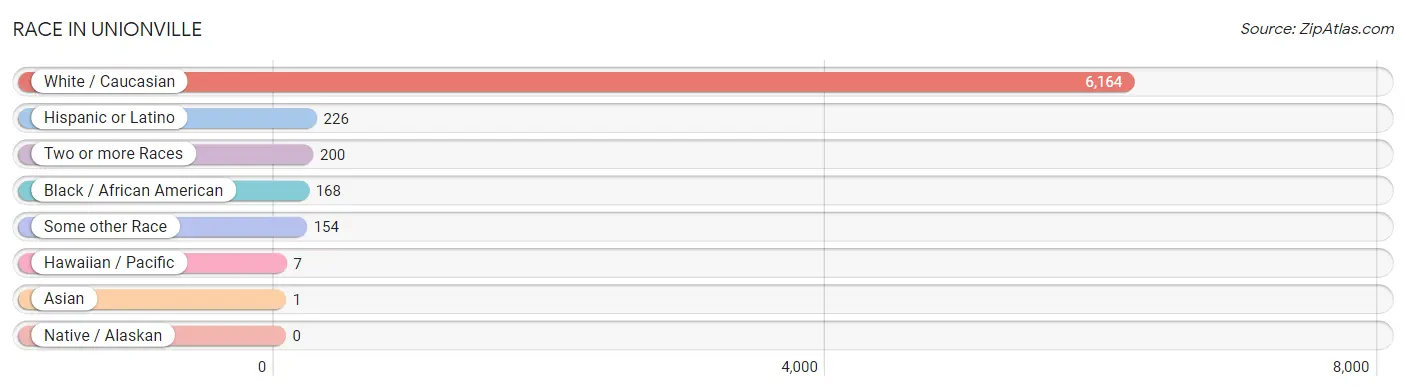
Race in Unionville
The most populous races in Unionville are White / Caucasian (6,164 | 92.1%), Hispanic or Latino (226 | 3.4%), and Two or more Races (200 | 3.0%).
| Race | # Population | % Population |
| Asian | 1 | 0.0% |
| Black / African American | 168 | 2.5% |
| Hawaiian / Pacific | 7 | 0.1% |
| Hispanic or Latino | 226 | 3.4% |
| Native / Alaskan | 0 | 0.0% |
| White / Caucasian | 6,164 | 92.1% |
| Two or more Races | 200 | 3.0% |
| Some other Race | 154 | 2.3% |
| Total | 6,694 | 100.0% |
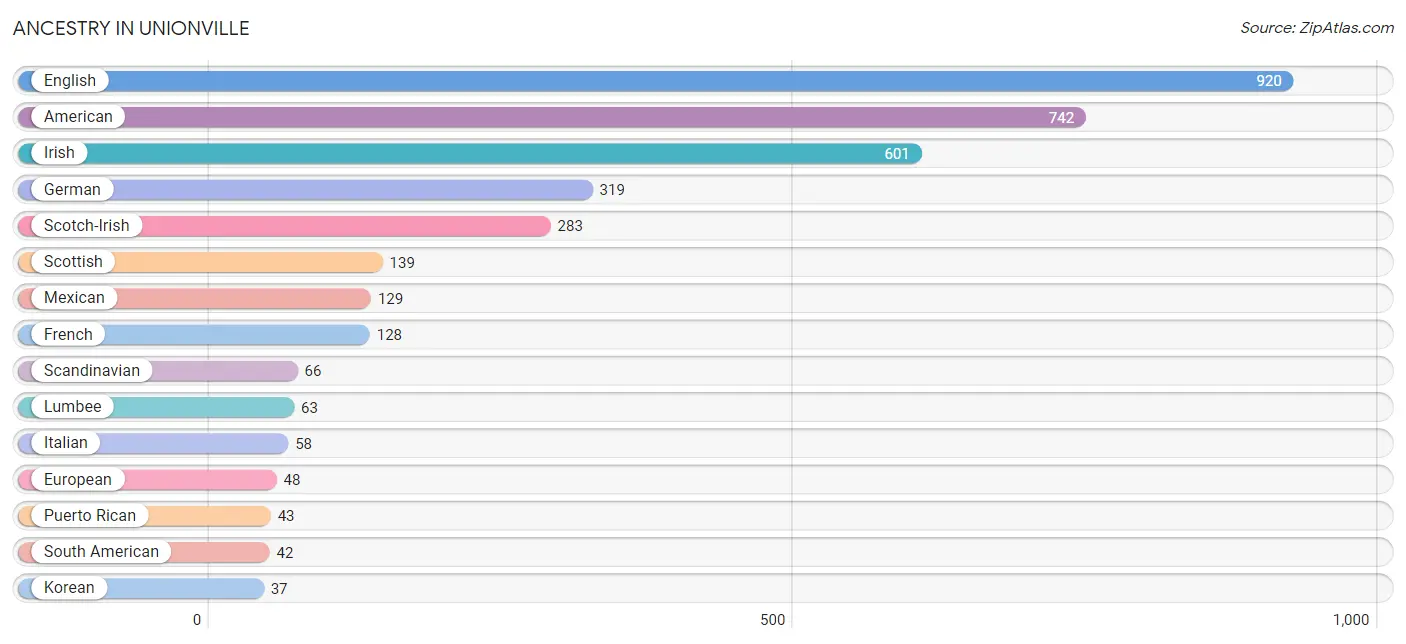
Ancestry in Unionville
The most populous ancestries reported in Unionville are English (920 | 13.7%), American (742 | 11.1%), Irish (601 | 9.0%), German (319 | 4.8%), and Scotch-Irish (283 | 4.2%), together accounting for 42.8% of all Unionville residents.
| Ancestry | # Population | % Population |
| American | 742 | 11.1% |
| British | 27 | 0.4% |
| British West Indian | 14 | 0.2% |
| Burmese | 1 | 0.0% |
| Cherokee | 14 | 0.2% |
| Choctaw | 6 | 0.1% |
| Colombian | 9 | 0.1% |
| Dominican | 12 | 0.2% |
| English | 920 | 13.7% |
| European | 48 | 0.7% |
| French | 128 | 1.9% |
| German | 319 | 4.8% |
| Guamanian / Chamorro | 4 | 0.1% |
| Hungarian | 11 | 0.2% |
| Irish | 601 | 9.0% |
| Italian | 58 | 0.9% |
| Korean | 37 | 0.5% |
| Lumbee | 63 | 0.9% |
| Maltese | 14 | 0.2% |
| Mexican | 129 | 1.9% |
| Mexican American Indian | 11 | 0.2% |
| Native Hawaiian | 7 | 0.1% |
| Northern European | 13 | 0.2% |
| Norwegian | 15 | 0.2% |
| Peruvian | 33 | 0.5% |
| Polish | 23 | 0.3% |
| Portuguese | 28 | 0.4% |
| Puerto Rican | 43 | 0.6% |
| Scandinavian | 66 | 1.0% |
| Scotch-Irish | 283 | 4.2% |
| Scottish | 139 | 2.1% |
| South American | 42 | 0.6% |
| Swiss | 7 | 0.1% |
| Welsh | 23 | 0.3% | View All 34 Rows |
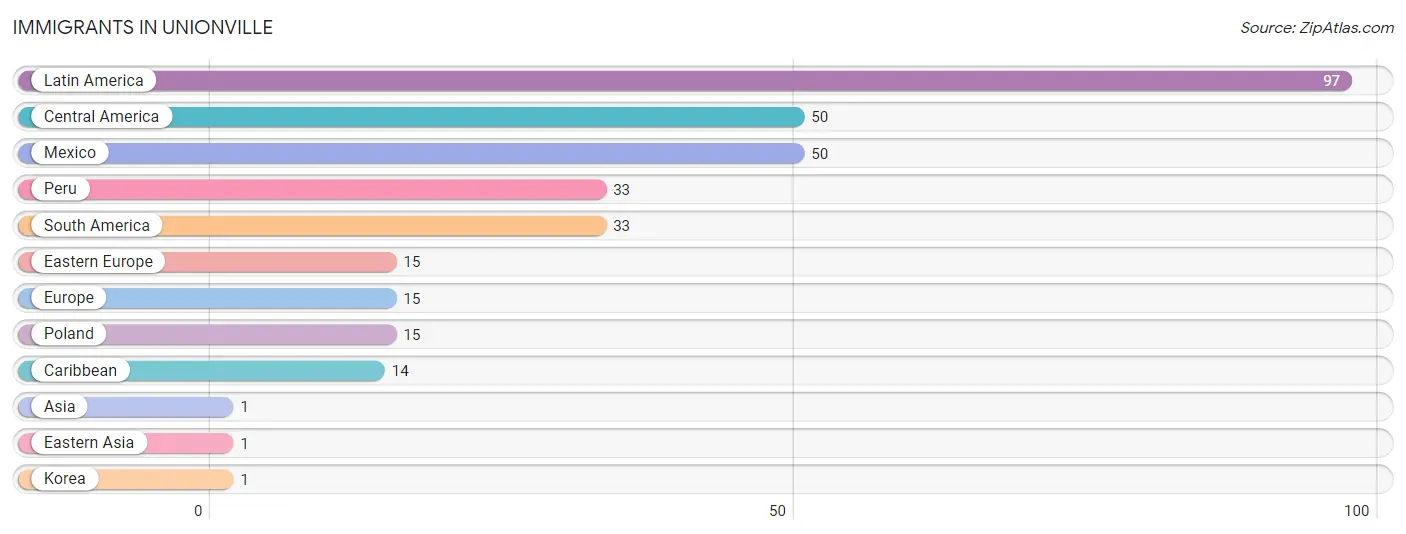
Immigrants in Unionville
The most numerous immigrant groups reported in Unionville came from Latin America (97 | 1.5%), Central America (50 | 0.7%), Mexico (50 | 0.7%), Peru (33 | 0.5%), and South America (33 | 0.5%), together accounting for 3.9% of all Unionville residents.
| Immigration Origin | # Population | % Population |
| Asia | 1 | 0.0% |
| Caribbean | 14 | 0.2% |
| Central America | 50 | 0.7% |
| Eastern Asia | 1 | 0.0% |
| Eastern Europe | 15 | 0.2% |
| Europe | 15 | 0.2% |
| Korea | 1 | 0.0% |
| Latin America | 97 | 1.5% |
| Mexico | 50 | 0.7% |
| Peru | 33 | 0.5% |
| Poland | 15 | 0.2% |
| South America | 33 | 0.5% | View All 12 Rows |
Sex and Age in Unionville
Sex and Age in Unionville
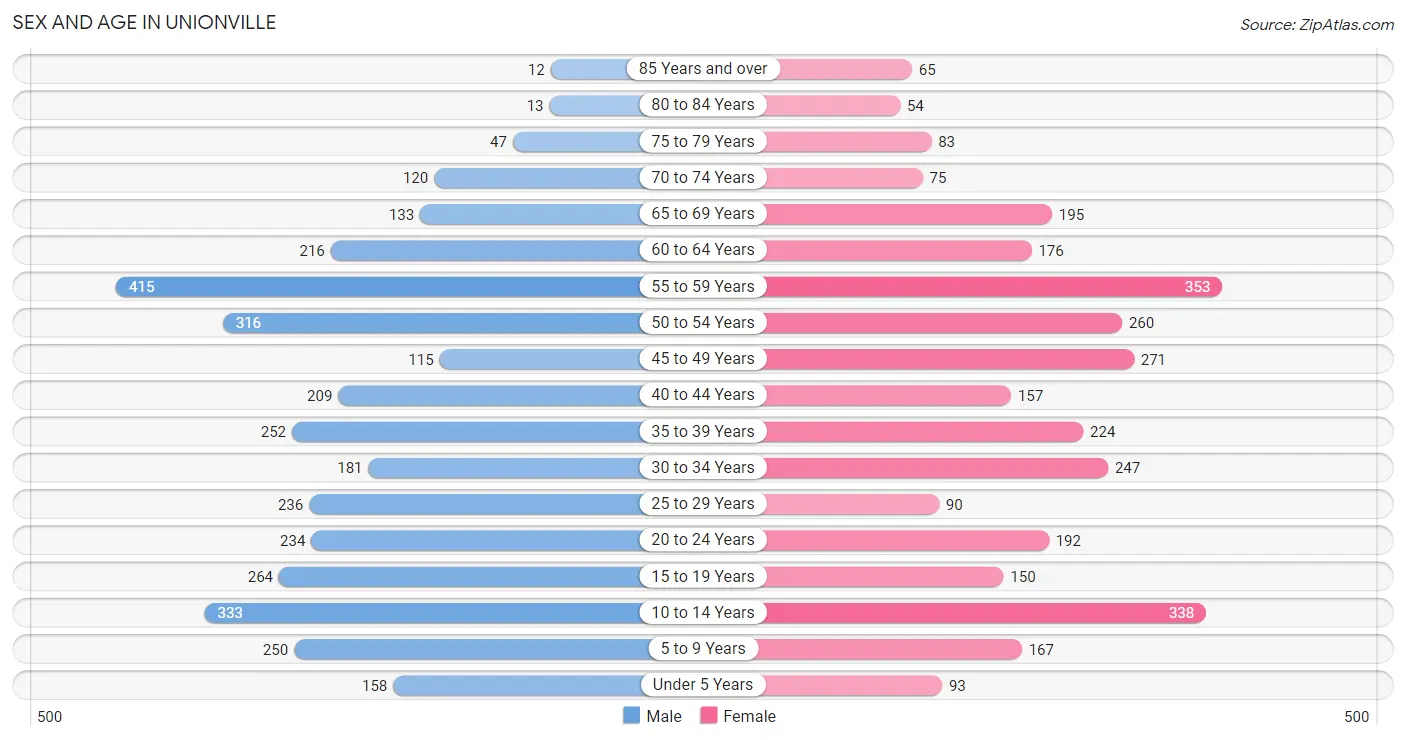
The most populous age groups in Unionville are 55 to 59 Years (415 | 11.8%) for men and 55 to 59 Years (353 | 11.1%) for women.
| Age Bracket | Male | Female |
| Under 5 Years | 158 (4.5%) | 93 (2.9%) |
| 5 to 9 Years | 250 (7.1%) | 167 (5.2%) |
| 10 to 14 Years | 333 (9.5%) | 338 (10.6%) |
| 15 to 19 Years | 264 (7.5%) | 150 (4.7%) |
| 20 to 24 Years | 234 (6.7%) | 192 (6.0%) |
| 25 to 29 Years | 236 (6.7%) | 90 (2.8%) |
| 30 to 34 Years | 181 (5.2%) | 247 (7.7%) |
| 35 to 39 Years | 252 (7.2%) | 224 (7.0%) |
| 40 to 44 Years | 209 (6.0%) | 157 (4.9%) |
| 45 to 49 Years | 115 (3.3%) | 271 (8.5%) |
| 50 to 54 Years | 316 (9.0%) | 260 (8.2%) |
| 55 to 59 Years | 415 (11.8%) | 353 (11.1%) |
| 60 to 64 Years | 216 (6.2%) | 176 (5.5%) |
| 65 to 69 Years | 133 (3.8%) | 195 (6.1%) |
| 70 to 74 Years | 120 (3.4%) | 75 (2.4%) |
| 75 to 79 Years | 47 (1.3%) | 83 (2.6%) |
| 80 to 84 Years | 13 (0.4%) | 54 (1.7%) |
| 85 Years and over | 12 (0.3%) | 65 (2.0%) |
| Total | 3,504 (100.0%) | 3,190 (100.0%) |
Families and Households in Unionville
Median Family Size in Unionville
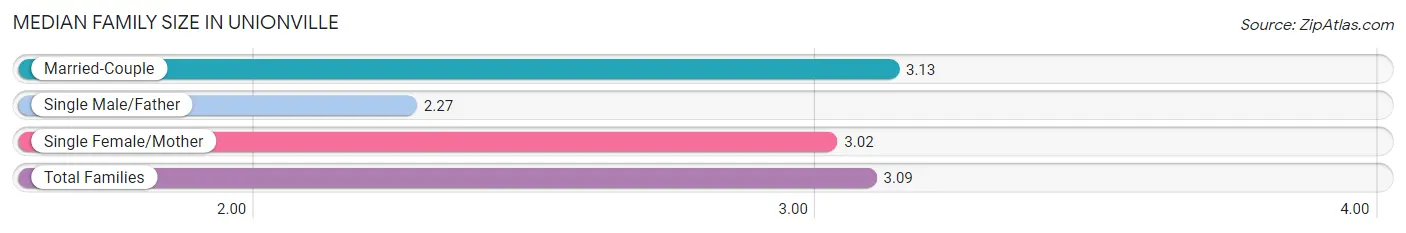
The median family size in Unionville is 3.09 persons per family, with married-couple families (1,593 | 79.9%) accounting for the largest median family size of 3.13 persons per family. On the other hand, single male/father families (59 | 3.0%) represent the smallest median family size with 2.27 persons per family.
| Family Type | # Families | Family Size |
| Married-Couple | 1,593 (79.9%) | 3.13 |
| Single Male/Father | 59 (3.0%) | 2.27 |
| Single Female/Mother | 341 (17.1%) | 3.02 |
| Total Families | 1,993 (100.0%) | 3.09 |
Median Household Size in Unionville
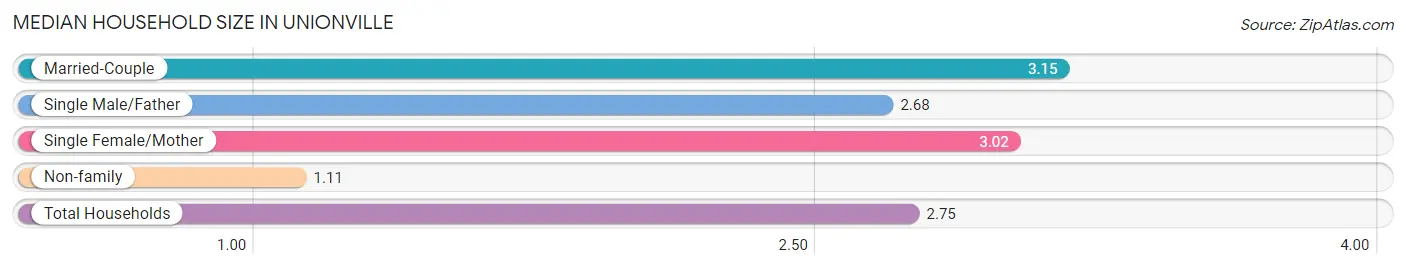
The median household size in Unionville is 2.75 persons per household, with married-couple households (1,593 | 65.6%) accounting for the largest median household size of 3.15 persons per household. non-family households (435 | 17.9%) represent the smallest median household size with 1.11 persons per household.
| Household Type | # Households | Household Size |
| Married-Couple | 1,593 (65.6%) | 3.15 |
| Single Male/Father | 59 (2.4%) | 2.68 |
| Single Female/Mother | 341 (14.0%) | 3.02 |
| Non-family | 435 (17.9%) | 1.11 |
| Total Households | 2,428 (100.0%) | 2.75 |
Household Size by Marriage Status in Unionville
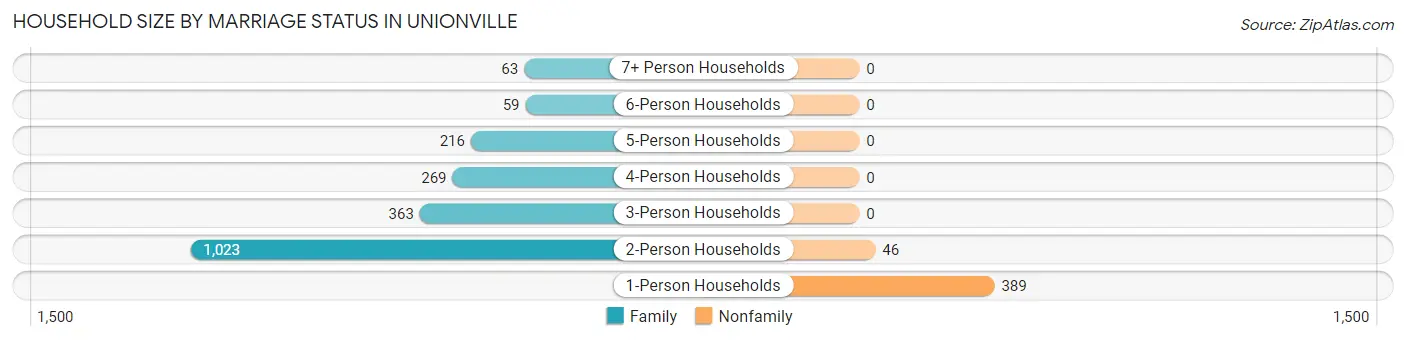
Out of a total of 2,428 households in Unionville, 1,993 (82.1%) are family households, while 435 (17.9%) are nonfamily households. The most numerous type of family households are 2-person households, comprising 1,023, and the most common type of nonfamily households are 1-person households, comprising 389.
| Household Size | Family Households | Nonfamily Households |
| 1-Person Households | - | 389 (16.0%) |
| 2-Person Households | 1,023 (42.1%) | 46 (1.9%) |
| 3-Person Households | 363 (14.9%) | 0 (0.0%) |
| 4-Person Households | 269 (11.1%) | 0 (0.0%) |
| 5-Person Households | 216 (8.9%) | 0 (0.0%) |
| 6-Person Households | 59 (2.4%) | 0 (0.0%) |
| 7+ Person Households | 63 (2.6%) | 0 (0.0%) |
| Total | 1,993 (82.1%) | 435 (17.9%) |
Female Fertility in Unionville
Fertility by Age in Unionville
| Age Bracket | Women with Births | Births / 1,000 Women |
| 15 to 19 years | 0 (0.0%) | 0.0 |
| 20 to 34 years | 0 (0.0%) | 0.0 |
| 35 to 50 years | 0 (0.0%) | 0.0 |
| Total | 0 (0.0%) | 0.0 |
Fertility by Age by Marriage Status in Unionville
| Age Bracket | Married | Unmarried |
| 15 to 19 years | 0 (0.0%) | 0 (0.0%) |
| 20 to 34 years | 0 (0.0%) | 0 (0.0%) |
| 35 to 50 years | 0 (0.0%) | 0 (0.0%) |
| Total | 0 (0.0%) | 0 (0.0%) |
Fertility by Education in Unionville
| Educational Attainment | Women with Births | Births / 1,000 Women |
| Less than High School | 0 (0.0%) | 0.0 |
| High School Diploma | 0 (0.0%) | 0.0 |
| College or Associate's Degree | 0 (0.0%) | 0.0 |
| Bachelor's Degree | 0 (0.0%) | 0.0 |
| Graduate Degree | 0 (0.0%) | 0.0 |
| Total | 0 (0.0%) | 0.0 |
Fertility by Education by Marriage Status in Unionville
| Educational Attainment | Married | Unmarried |
| Less than High School | 0 (0.0%) | 0 (0.0%) |
| High School Diploma | 0 (0.0%) | 0 (0.0%) |
| College or Associate's Degree | 0 (0.0%) | 0 (0.0%) |
| Bachelor's Degree | 0 (0.0%) | 0 (0.0%) |
| Graduate Degree | 0 (0.0%) | 0 (0.0%) |
| Total | 0 (0.0%) | 0 (0.0%) |
Income in Unionville
Income Overview in Unionville
Per Capita Income in Unionville is $37,700, while median incomes of families and households are $98,375 and $90,904 respectively.
| Characteristic | Number | Measure |
| Per Capita Income | 6,694 | $37,700 |
| Median Family Income | 1,993 | $98,375 |
| Mean Family Income | 1,993 | $116,083 |
| Median Household Income | 2,428 | $90,904 |
| Mean Household Income | 2,428 | $104,137 |
| Income Deficit | 1,993 | $0 |
| Wage / Income Gap (%) | 6,694 | 28.56% |
| Wage / Income Gap ($) | 6,694 | 71.44¢ per $1 |
| Gini / Inequality Index | 6,694 | 0.36 |
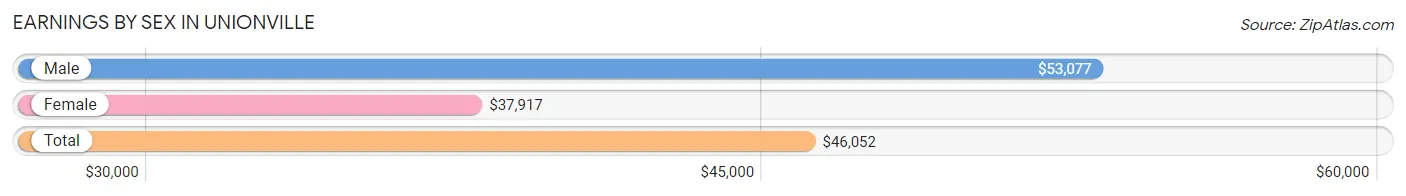
Earnings by Sex in Unionville
Average Earnings in Unionville are $46,052, $53,077 for men and $37,917 for women, a difference of 28.6%.
| Sex | Number | Average Earnings |
| Male | 2,188 (55.3%) | $53,077 |
| Female | 1,767 (44.7%) | $37,917 |
| Total | 3,955 (100.0%) | $46,052 |
Earnings by Sex by Income Bracket in Unionville
The most common earnings brackets in Unionville are $75,000 to $99,999 for men (441 | 20.2%) and $25,000 to $29,999 for women (255 | 14.4%).
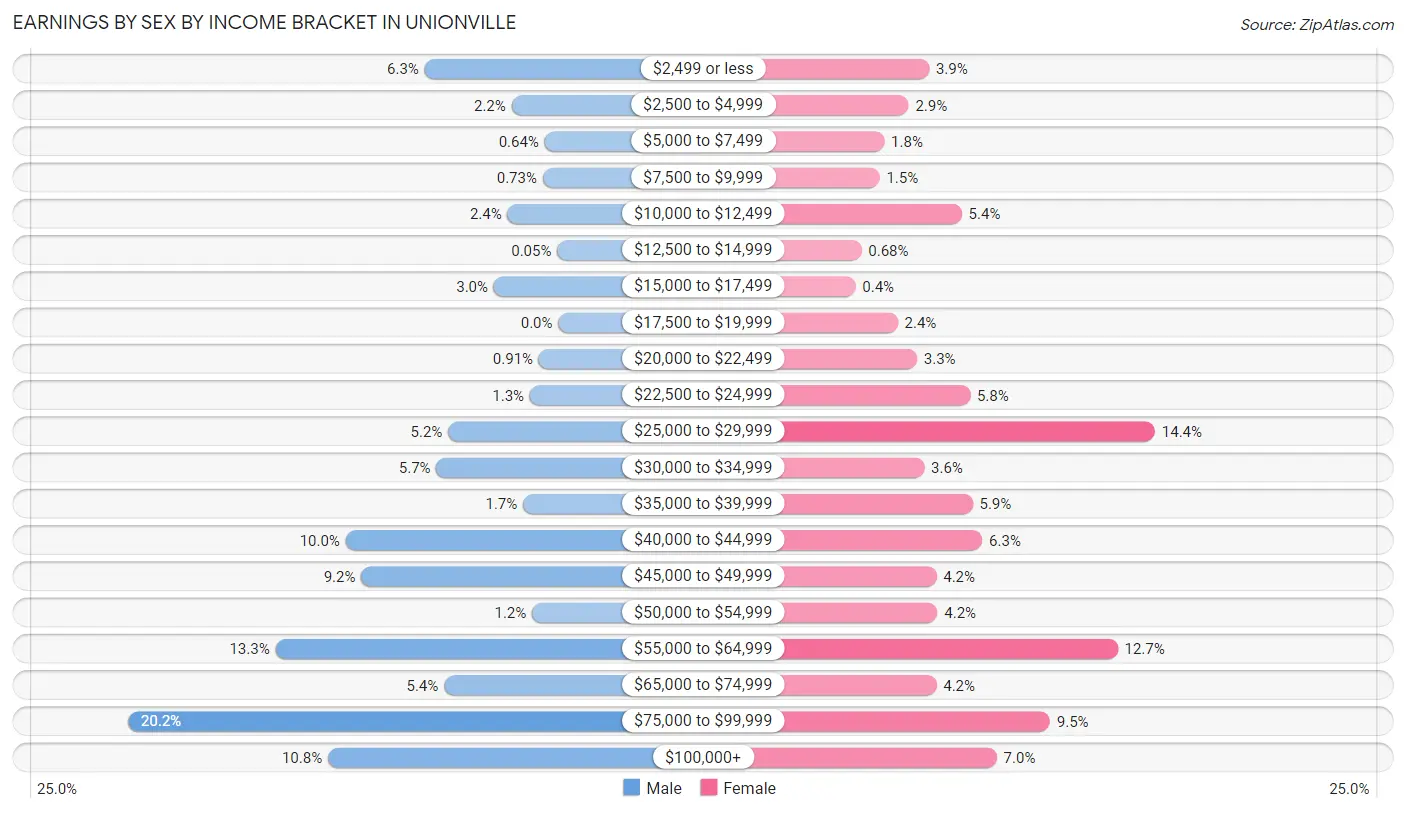
| Income | Male | Female |
| $2,499 or less | 137 (6.3%) | 68 (3.8%) |
| $2,500 to $4,999 | 48 (2.2%) | 51 (2.9%) |
| $5,000 to $7,499 | 14 (0.6%) | 31 (1.8%) |
| $7,500 to $9,999 | 16 (0.7%) | 27 (1.5%) |
| $10,000 to $12,499 | 52 (2.4%) | 95 (5.4%) |
| $12,500 to $14,999 | 1 (0.1%) | 12 (0.7%) |
| $15,000 to $17,499 | 66 (3.0%) | 7 (0.4%) |
| $17,500 to $19,999 | 0 (0.0%) | 42 (2.4%) |
| $20,000 to $22,499 | 20 (0.9%) | 58 (3.3%) |
| $22,500 to $24,999 | 29 (1.3%) | 102 (5.8%) |
| $25,000 to $29,999 | 113 (5.2%) | 255 (14.4%) |
| $30,000 to $34,999 | 125 (5.7%) | 64 (3.6%) |
| $35,000 to $39,999 | 36 (1.7%) | 104 (5.9%) |
| $40,000 to $44,999 | 218 (10.0%) | 112 (6.3%) |
| $45,000 to $49,999 | 202 (9.2%) | 74 (4.2%) |
| $50,000 to $54,999 | 27 (1.2%) | 75 (4.2%) |
| $55,000 to $64,999 | 290 (13.3%) | 224 (12.7%) |
| $65,000 to $74,999 | 117 (5.3%) | 74 (4.2%) |
| $75,000 to $99,999 | 441 (20.2%) | 168 (9.5%) |
| $100,000+ | 236 (10.8%) | 124 (7.0%) |
| Total | 2,188 (100.0%) | 1,767 (100.0%) |
Earnings by Sex by Educational Attainment in Unionville
Average earnings in Unionville are $59,399 for men and $42,121 for women, a difference of 29.1%. Men with an educational attainment of graduate degree enjoy the highest average annual earnings of $144,750, while those with less than high school education earn the least with $43,494. Women with an educational attainment of graduate degree earn the most with the average annual earnings of $63,861, while those with less than high school education have the smallest earnings of $2,499.
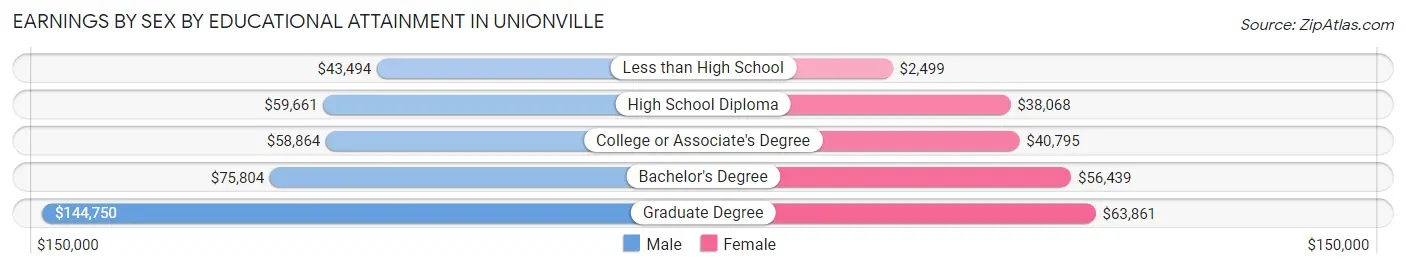
| Educational Attainment | Male Income | Female Income |
| Less than High School | $43,494 | $2,499 |
| High School Diploma | $59,661 | $38,068 |
| College or Associate's Degree | $58,864 | $40,795 |
| Bachelor's Degree | $75,804 | $56,439 |
| Graduate Degree | $144,750 | $63,861 |
| Total | $59,399 | $42,121 |
Family Income in Unionville
Family Income Brackets in Unionville
According to the Unionville family income data, there are 488 families falling into the $100,000 to $149,999 income range, which is the most common income bracket and makes up 24.5% of all families.
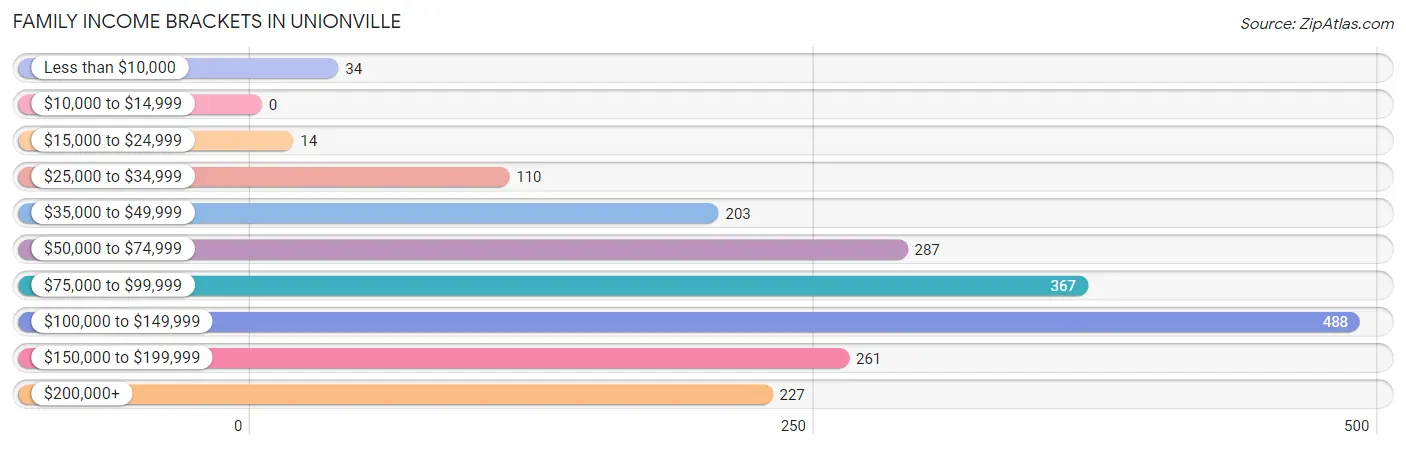
| Income Bracket | # Families | % Families |
| Less than $10,000 | 34 | 1.7% |
| $10,000 to $14,999 | 0 | 0.0% |
| $15,000 to $24,999 | 14 | 0.7% |
| $25,000 to $34,999 | 110 | 5.5% |
| $35,000 to $49,999 | 203 | 10.2% |
| $50,000 to $74,999 | 287 | 14.4% |
| $75,000 to $99,999 | 367 | 18.4% |
| $100,000 to $149,999 | 488 | 24.5% |
| $150,000 to $199,999 | 261 | 13.1% |
| $200,000+ | 227 | 11.4% |
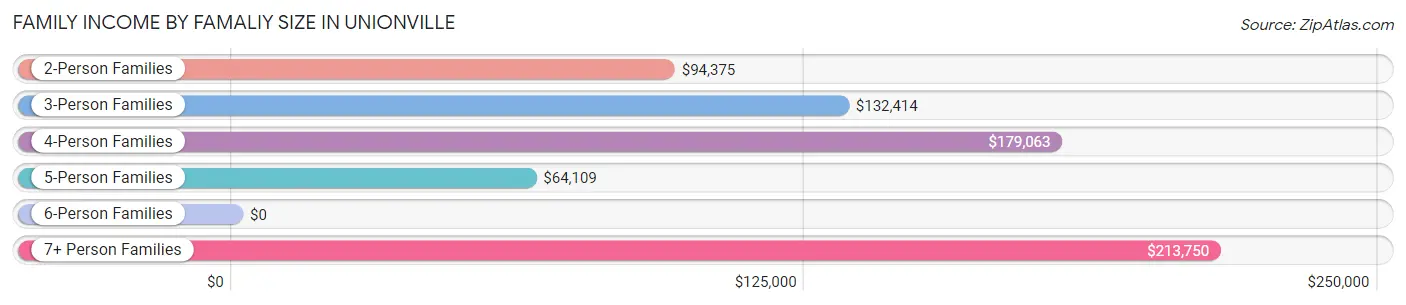
Family Income by Famaliy Size in Unionville
7+ person families (63 | 3.2%) account for the highest median family income in Unionville with $213,750 per family, while 2-person families (1,041 | 52.2%) have the highest median income of $47,188 per family member.
| Income Bracket | # Families | Median Income |
| 2-Person Families | 1,041 (52.2%) | $94,375 |
| 3-Person Families | 360 (18.1%) | $132,414 |
| 4-Person Families | 254 (12.7%) | $179,063 |
| 5-Person Families | 225 (11.3%) | $64,109 |
| 6-Person Families | 50 (2.5%) | $0 |
| 7+ Person Families | 63 (3.2%) | $213,750 |
| Total | 1,993 (100.0%) | $98,375 |
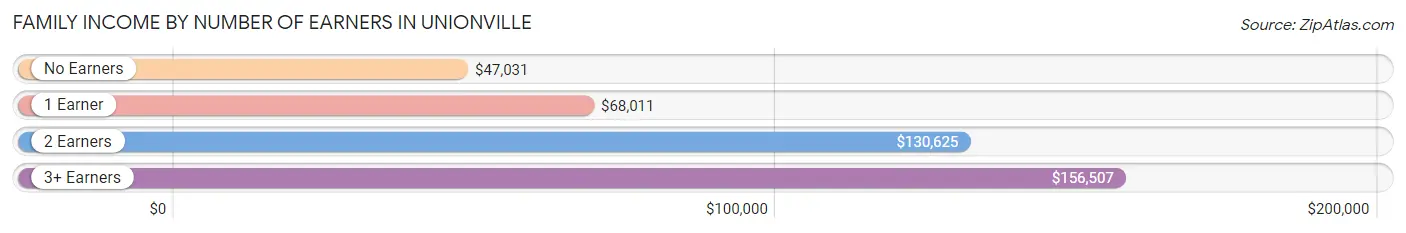
Family Income by Number of Earners in Unionville
The median family income in Unionville is $98,375, with families comprising 3+ earners (389) having the highest median family income of $156,507, while families with no earners (134) have the lowest median family income of $47,031, accounting for 19.5% and 6.7% of families, respectively.
| Number of Earners | # Families | Median Income |
| No Earners | 134 (6.7%) | $47,031 |
| 1 Earner | 615 (30.9%) | $68,011 |
| 2 Earners | 855 (42.9%) | $130,625 |
| 3+ Earners | 389 (19.5%) | $156,507 |
| Total | 1,993 (100.0%) | $98,375 |
Household Income in Unionville
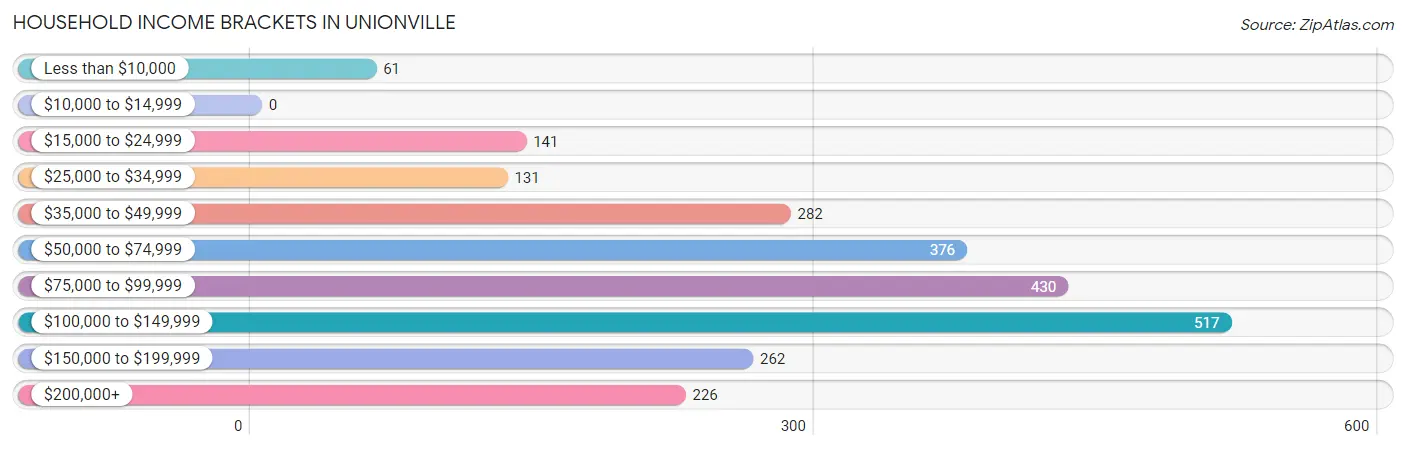
Household Income Brackets in Unionville
With 517 households falling in the category, the $100,000 to $149,999 income range is the most frequent in Unionville, accounting for 21.3% of all households.
| Income Bracket | # Households | % Households |
| Less than $10,000 | 61 | 2.5% |
| $10,000 to $14,999 | 0 | 0.0% |
| $15,000 to $24,999 | 141 | 5.8% |
| $25,000 to $34,999 | 131 | 5.4% |
| $35,000 to $49,999 | 282 | 11.6% |
| $50,000 to $74,999 | 376 | 15.5% |
| $75,000 to $99,999 | 430 | 17.7% |
| $100,000 to $149,999 | 517 | 21.3% |
| $150,000 to $199,999 | 262 | 10.8% |
| $200,000+ | 226 | 9.3% |
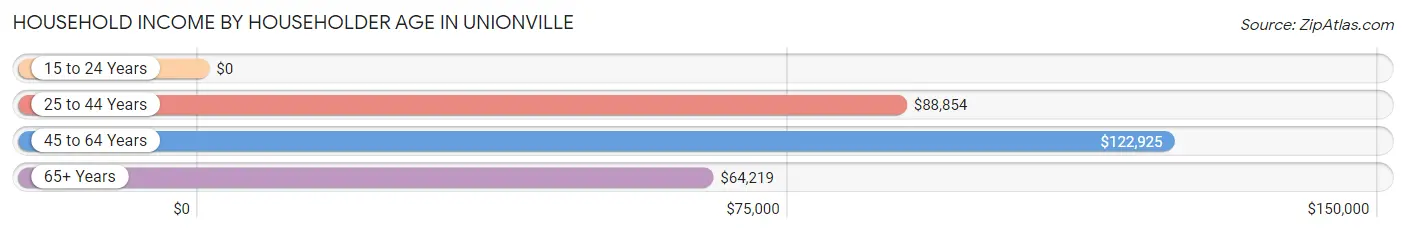
Household Income by Householder Age in Unionville
The median household income in Unionville is $90,904, with the highest median household income of $122,925 found in the 45 to 64 years age bracket for the primary householder. A total of 1,201 households (49.5%) fall into this category. Meanwhile, the 15 to 24 years age bracket for the primary householder has the lowest median household income of $0, with 35 households (1.4%) in this group.
| Income Bracket | # Households | Median Income |
| 15 to 24 Years | 35 (1.4%) | $0 |
| 25 to 44 Years | 635 (26.2%) | $88,854 |
| 45 to 64 Years | 1,201 (49.5%) | $122,925 |
| 65+ Years | 557 (22.9%) | $64,219 |
| Total | 2,428 (100.0%) | $90,904 |
Poverty in Unionville
Income Below Poverty by Sex and Age in Unionville
With 4.2% poverty level for males and 8.2% for females among the residents of Unionville, under 5 year old males and 25 to 34 year old females are the most vulnerable to poverty, with 36 males (22.8%) and 78 females (23.2%) in their respective age groups living below the poverty level.
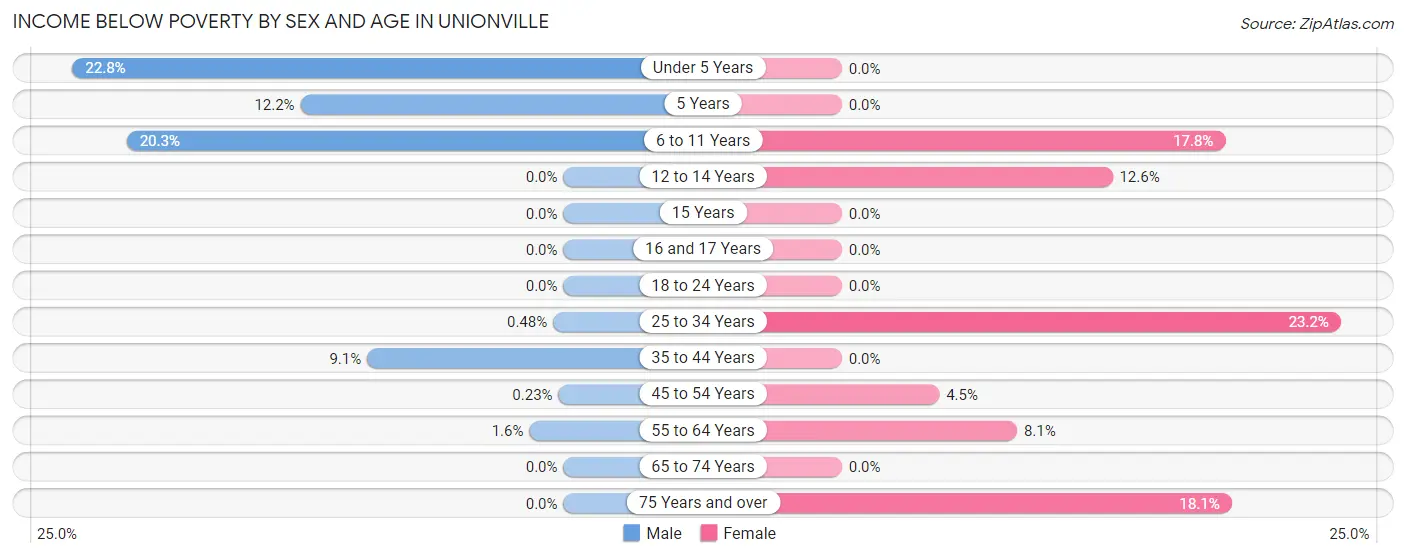
| Age Bracket | Male | Female |
| Under 5 Years | 36 (22.8%) | 0 (0.0%) |
| 5 Years | 10 (12.2%) | 0 (0.0%) |
| 6 to 11 Years | 46 (20.3%) | 53 (17.8%) |
| 12 to 14 Years | 0 (0.0%) | 26 (12.6%) |
| 15 Years | 0 (0.0%) | 0 (0.0%) |
| 16 and 17 Years | 0 (0.0%) | 0 (0.0%) |
| 18 to 24 Years | 0 (0.0%) | 0 (0.0%) |
| 25 to 34 Years | 2 (0.5%) | 78 (23.2%) |
| 35 to 44 Years | 42 (9.1%) | 0 (0.0%) |
| 45 to 54 Years | 1 (0.2%) | 24 (4.5%) |
| 55 to 64 Years | 10 (1.6%) | 43 (8.1%) |
| 65 to 74 Years | 0 (0.0%) | 0 (0.0%) |
| 75 Years and over | 0 (0.0%) | 36 (18.1%) |
| Total | 147 (4.2%) | 260 (8.2%) |
Income Above Poverty by Sex and Age in Unionville
According to the poverty statistics in Unionville, males aged 12 to 14 years and females aged under 5 years are the age groups that are most secure financially, with 100.0% of males and 100.0% of females in these age groups living above the poverty line.
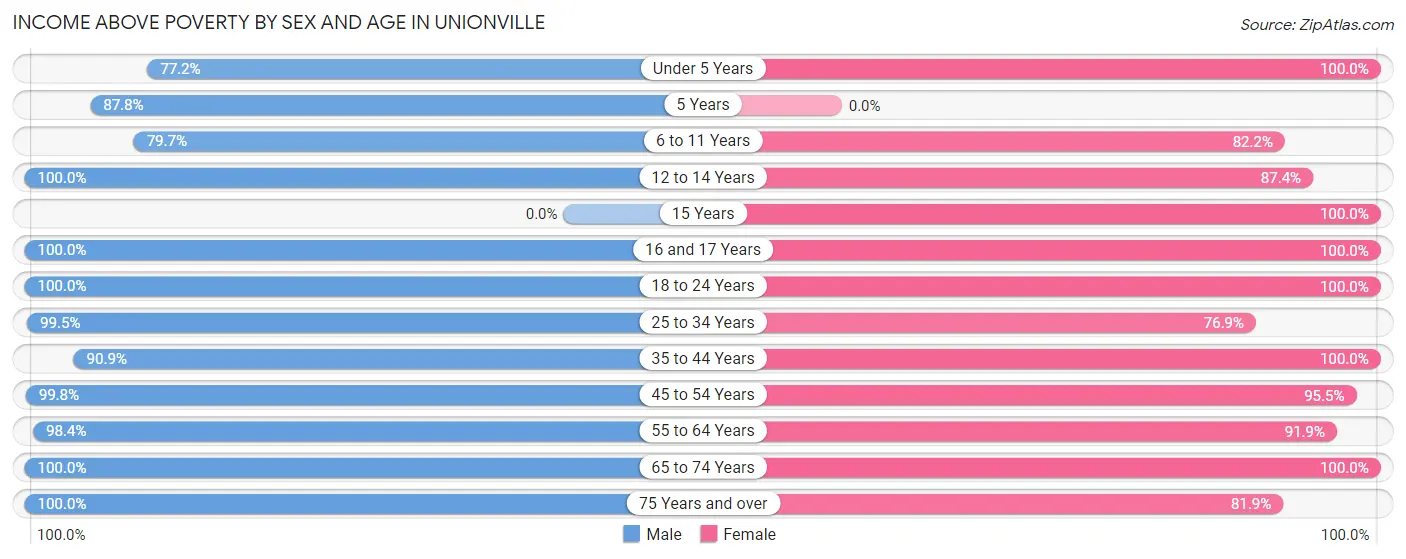
| Age Bracket | Male | Female |
| Under 5 Years | 122 (77.2%) | 93 (100.0%) |
| 5 Years | 72 (87.8%) | 0 (0.0%) |
| 6 to 11 Years | 181 (79.7%) | 245 (82.2%) |
| 12 to 14 Years | 274 (100.0%) | 181 (87.4%) |
| 15 Years | 0 (0.0%) | 19 (100.0%) |
| 16 and 17 Years | 218 (100.0%) | 108 (100.0%) |
| 18 to 24 Years | 280 (100.0%) | 215 (100.0%) |
| 25 to 34 Years | 415 (99.5%) | 259 (76.8%) |
| 35 to 44 Years | 419 (90.9%) | 381 (100.0%) |
| 45 to 54 Years | 429 (99.8%) | 507 (95.5%) |
| 55 to 64 Years | 621 (98.4%) | 486 (91.9%) |
| 65 to 74 Years | 253 (100.0%) | 270 (100.0%) |
| 75 Years and over | 72 (100.0%) | 163 (81.9%) |
| Total | 3,356 (95.8%) | 2,927 (91.8%) |
Income Below Poverty Among Married-Couple Families in Unionville
The poverty statistics for married-couple families in Unionville show that 0.6% or 9 of the total 1,593 families live below the poverty line. Families with 1 or 2 children have the highest poverty rate of 2.6%, comprising of 9 families. On the other hand, families with no children have the lowest poverty rate of 0.0%, which includes 0 families.
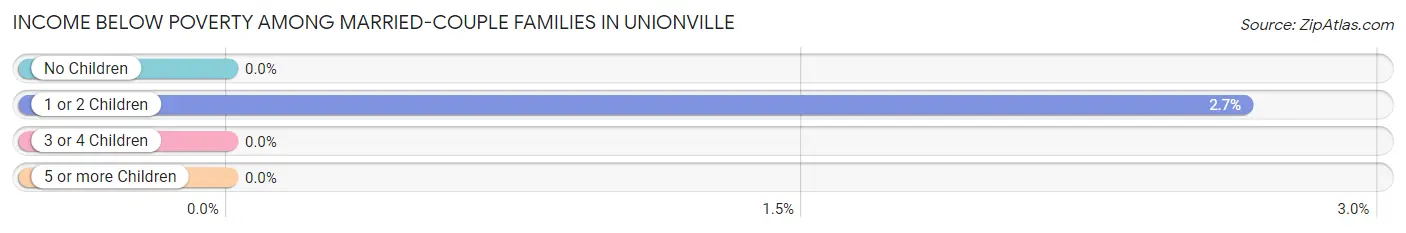
| Children | Above Poverty | Below Poverty |
| No Children | 970 (100.0%) | 0 (0.0%) |
| 1 or 2 Children | 331 (97.4%) | 9 (2.6%) |
| 3 or 4 Children | 262 (100.0%) | 0 (0.0%) |
| 5 or more Children | 21 (100.0%) | 0 (0.0%) |
| Total | 1,584 (99.4%) | 9 (0.6%) |
Income Below Poverty Among Single-Parent Households in Unionville
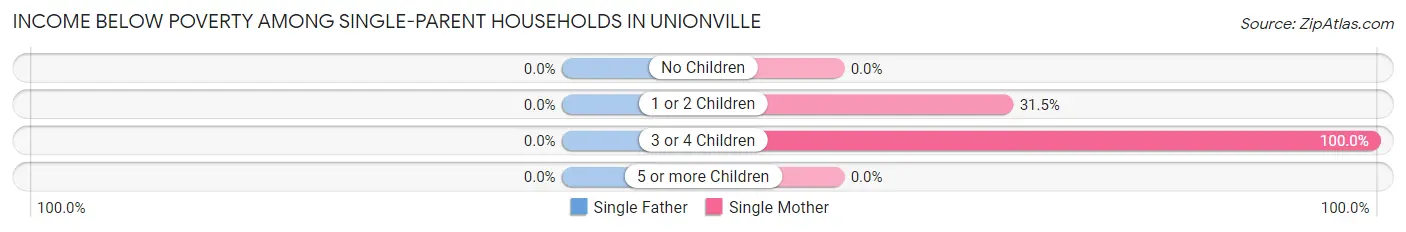
| Children | Single Father | Single Mother |
| No Children | 0 (0.0%) | 0 (0.0%) |
| 1 or 2 Children | 0 (0.0%) | 34 (31.5%) |
| 3 or 4 Children | 0 (0.0%) | 25 (100.0%) |
| 5 or more Children | 0 (0.0%) | 0 (0.0%) |
| Total | 0 (0.0%) | 59 (17.3%) |
Income Below Poverty Among Married-Couple vs Single-Parent Households in Unionville
The poverty data for Unionville shows that 9 of the married-couple family households (0.6%) and 59 of the single-parent households (14.7%) are living below the poverty level. Within the married-couple family households, those with 1 or 2 children have the highest poverty rate, with 9 households (2.6%) falling below the poverty line. Among the single-parent households, those with 3 or 4 children have the highest poverty rate, with 25 household (100.0%) living below poverty.
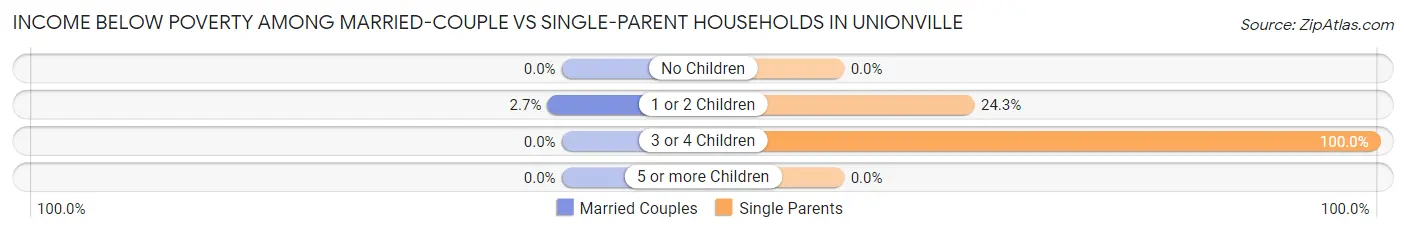
| Children | Married-Couple Families | Single-Parent Households |
| No Children | 0 (0.0%) | 0 (0.0%) |
| 1 or 2 Children | 9 (2.6%) | 34 (24.3%) |
| 3 or 4 Children | 0 (0.0%) | 25 (100.0%) |
| 5 or more Children | 0 (0.0%) | 0 (0.0%) |
| Total | 9 (0.6%) | 59 (14.7%) |
Employment Characteristics in Unionville
Employment by Class of Employer in Unionville
Among the 3,688 employed individuals in Unionville, private company employees (2,762 | 74.9%), self-employed (not incorporated) (267 | 7.2%), and local government employees (233 | 6.3%) make up the most common classes of employment.
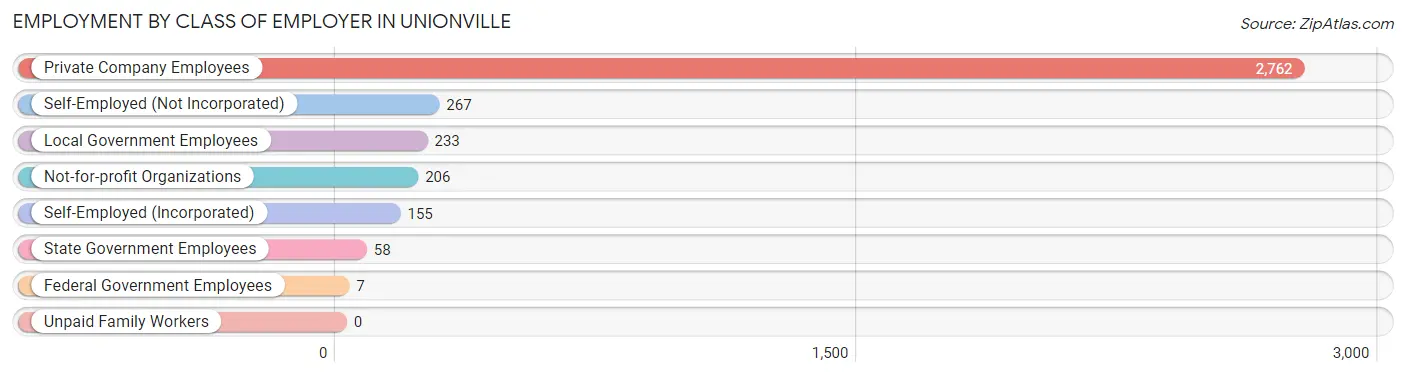
| Employer Class | # Employees | % Employees |
| Private Company Employees | 2,762 | 74.9% |
| Self-Employed (Incorporated) | 155 | 4.2% |
| Self-Employed (Not Incorporated) | 267 | 7.2% |
| Not-for-profit Organizations | 206 | 5.6% |
| Local Government Employees | 233 | 6.3% |
| State Government Employees | 58 | 1.6% |
| Federal Government Employees | 7 | 0.2% |
| Unpaid Family Workers | 0 | 0.0% |
| Total | 3,688 | 100.0% |
Employment Status by Age in Unionville
According to the labor force statistics for Unionville, out of the total population over 16 years of age (5,336), 71.7% or 3,826 individuals are in the labor force, with 3.6% or 138 of them unemployed. The age group with the highest labor force participation rate is 25 to 29 years, with 100.0% or 326 individuals in the labor force. Within the labor force, the 35 to 44 years age range has the highest percentage of unemployed individuals, with 6.0% or 42 of them being unemployed.
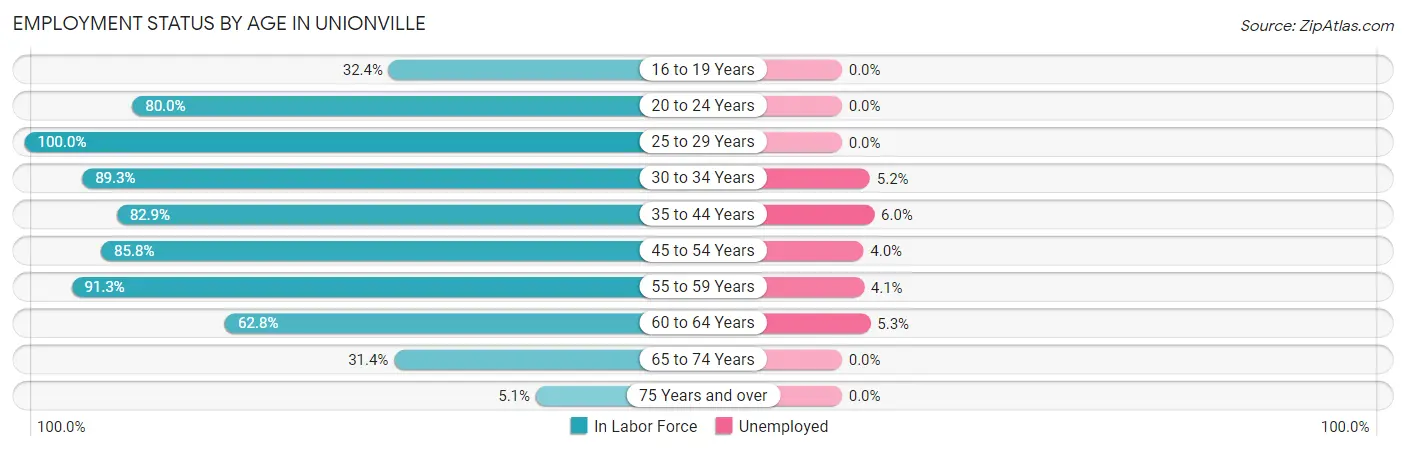
| Age Bracket | In Labor Force | Unemployed |
| 16 to 19 Years | 128 (32.4%) | 0 (0.0%) |
| 20 to 24 Years | 341 (80.0%) | 0 (0.0%) |
| 25 to 29 Years | 326 (100.0%) | 0 (0.0%) |
| 30 to 34 Years | 382 (89.3%) | 20 (5.2%) |
| 35 to 44 Years | 698 (82.9%) | 42 (6.0%) |
| 45 to 54 Years | 825 (85.8%) | 33 (4.0%) |
| 55 to 59 Years | 701 (91.3%) | 29 (4.1%) |
| 60 to 64 Years | 246 (62.8%) | 13 (5.3%) |
| 65 to 74 Years | 164 (31.4%) | 0 (0.0%) |
| 75 Years and over | 14 (5.1%) | 0 (0.0%) |
| Total | 3,826 (71.7%) | 138 (3.6%) |
Employment Status by Educational Attainment in Unionville
According to labor force statistics for Unionville, 85.5% of individuals (3,179) out of the total population between 25 and 64 years of age (3,718) are in the labor force, with 4.3% or 137 of them being unemployed. The group with the highest labor force participation rate are those with the educational attainment of college / associate degree, with 88.9% or 1,206 individuals in the labor force. Within the labor force, individuals with less than high school education have the highest percentage of unemployment, with 18.5% or 33 of them being unemployed.
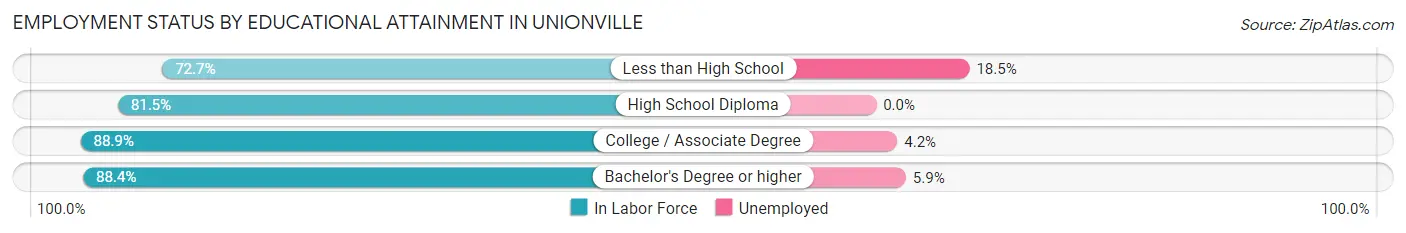
| Educational Attainment | In Labor Force | Unemployed |
| Less than High School | 178 (72.7%) | 45 (18.5%) |
| High School Diploma | 902 (81.5%) | 0 (0.0%) |
| College / Associate Degree | 1,206 (88.9%) | 57 (4.2%) |
| Bachelor's Degree or higher | 892 (88.4%) | 60 (5.9%) |
| Total | 3,179 (85.5%) | 160 (4.3%) |
Employment Occupations by Sex in Unionville
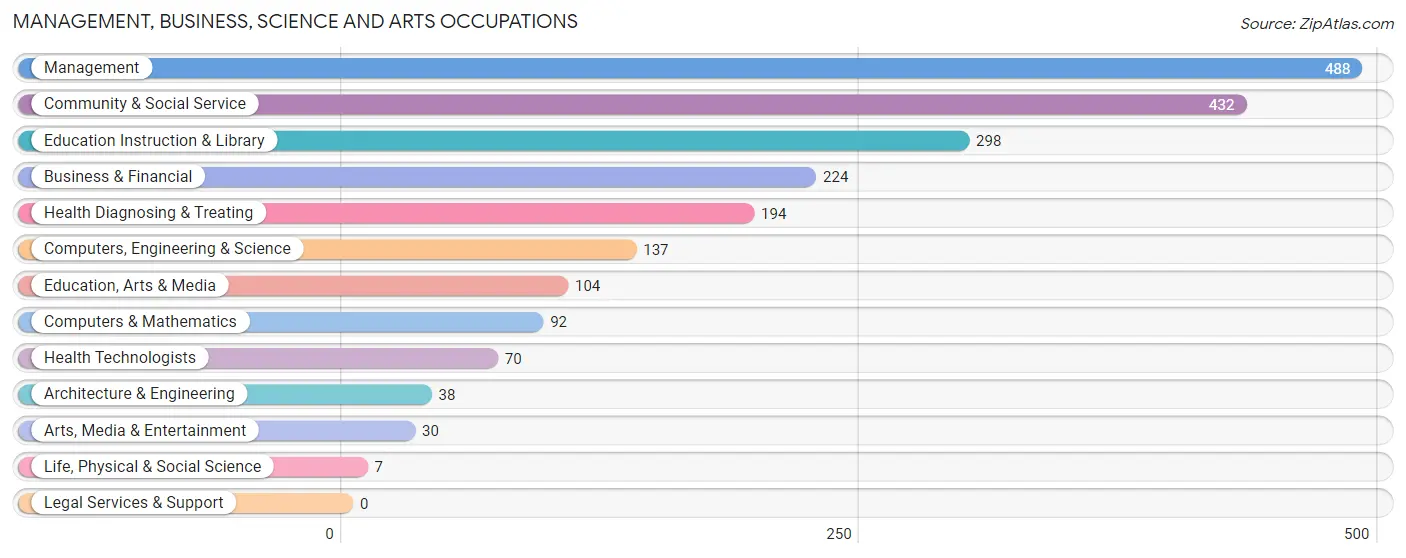
Management, Business, Science and Arts Occupations
The most common Management, Business, Science and Arts occupations in Unionville are Management (488 | 13.2%), Community & Social Service (432 | 11.7%), Education Instruction & Library (298 | 8.1%), Business & Financial (224 | 6.1%), and Health Diagnosing & Treating (194 | 5.3%).
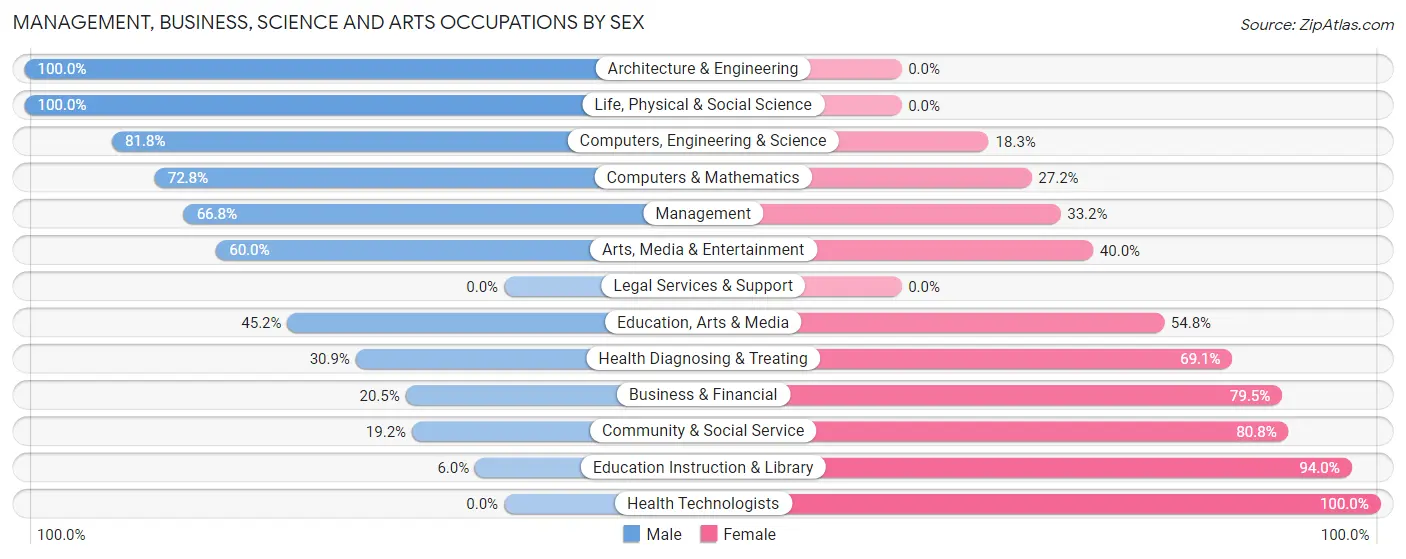
Management, Business, Science and Arts Occupations by Sex
Within the Management, Business, Science and Arts occupations in Unionville, the most male-oriented occupations are Architecture & Engineering (100.0%), Life, Physical & Social Science (100.0%), and Computers, Engineering & Science (81.8%), while the most female-oriented occupations are Health Technologists (100.0%), Education Instruction & Library (94.0%), and Community & Social Service (80.8%).
| Occupation | Male | Female |
| Management | 326 (66.8%) | 162 (33.2%) |
| Business & Financial | 46 (20.5%) | 178 (79.5%) |
| Computers, Engineering & Science | 112 (81.8%) | 25 (18.2%) |
| Computers & Mathematics | 67 (72.8%) | 25 (27.2%) |
| Architecture & Engineering | 38 (100.0%) | 0 (0.0%) |
| Life, Physical & Social Science | 7 (100.0%) | 0 (0.0%) |
| Community & Social Service | 83 (19.2%) | 349 (80.8%) |
| Education, Arts & Media | 47 (45.2%) | 57 (54.8%) |
| Legal Services & Support | 0 (0.0%) | 0 (0.0%) |
| Education Instruction & Library | 18 (6.0%) | 280 (94.0%) |
| Arts, Media & Entertainment | 18 (60.0%) | 12 (40.0%) |
| Health Diagnosing & Treating | 60 (30.9%) | 134 (69.1%) |
| Health Technologists | 0 (0.0%) | 70 (100.0%) |
| Total (Category) | 627 (42.5%) | 848 (57.5%) |
| Total (Overall) | 2,017 (54.7%) | 1,671 (45.3%) |
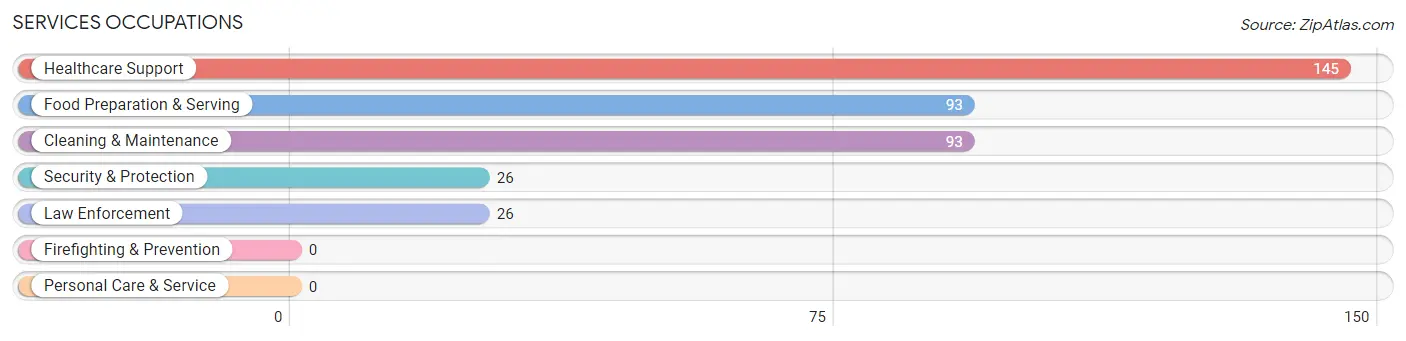
Services Occupations
The most common Services occupations in Unionville are Healthcare Support (145 | 3.9%), Food Preparation & Serving (93 | 2.5%), Cleaning & Maintenance (93 | 2.5%), Security & Protection (26 | 0.7%), and Law Enforcement (26 | 0.7%).
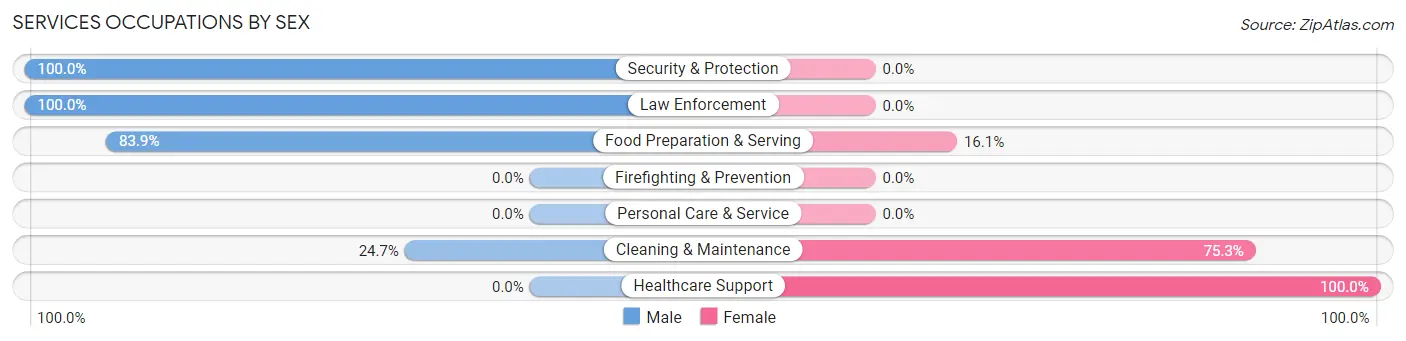
Services Occupations by Sex
Within the Services occupations in Unionville, the most male-oriented occupations are Security & Protection (100.0%), Law Enforcement (100.0%), and Food Preparation & Serving (83.9%), while the most female-oriented occupations are Healthcare Support (100.0%), Cleaning & Maintenance (75.3%), and Food Preparation & Serving (16.1%).
| Occupation | Male | Female |
| Healthcare Support | 0 (0.0%) | 145 (100.0%) |
| Security & Protection | 26 (100.0%) | 0 (0.0%) |
| Firefighting & Prevention | 0 (0.0%) | 0 (0.0%) |
| Law Enforcement | 26 (100.0%) | 0 (0.0%) |
| Food Preparation & Serving | 78 (83.9%) | 15 (16.1%) |
| Cleaning & Maintenance | 23 (24.7%) | 70 (75.3%) |
| Personal Care & Service | 0 (0.0%) | 0 (0.0%) |
| Total (Category) | 127 (35.6%) | 230 (64.4%) |
| Total (Overall) | 2,017 (54.7%) | 1,671 (45.3%) |
Sales and Office Occupations
The most common Sales and Office occupations in Unionville are Sales & Related (473 | 12.8%), and Office & Administration (435 | 11.8%).
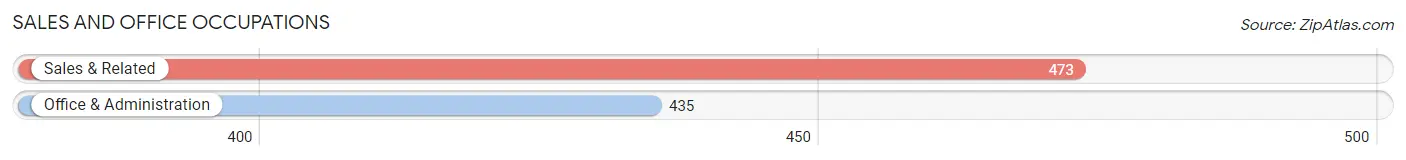
Sales and Office Occupations by Sex
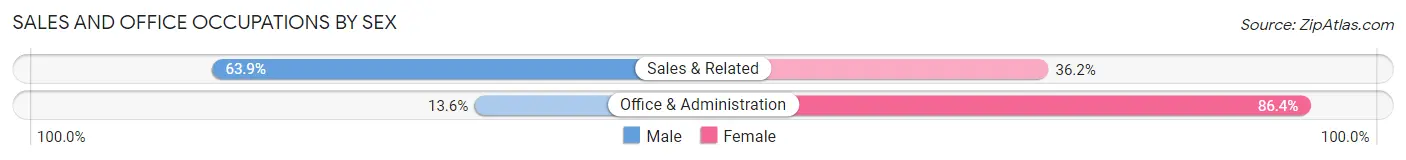
| Occupation | Male | Female |
| Sales & Related | 302 (63.8%) | 171 (36.1%) |
| Office & Administration | 59 (13.6%) | 376 (86.4%) |
| Total (Category) | 361 (39.8%) | 547 (60.2%) |
| Total (Overall) | 2,017 (54.7%) | 1,671 (45.3%) |
Natural Resources, Construction and Maintenance Occupations
The most common Natural Resources, Construction and Maintenance occupations in Unionville are Construction & Extraction (251 | 6.8%), Installation, Maintenance & Repair (130 | 3.5%), and Farming, Fishing & Forestry (80 | 2.2%).
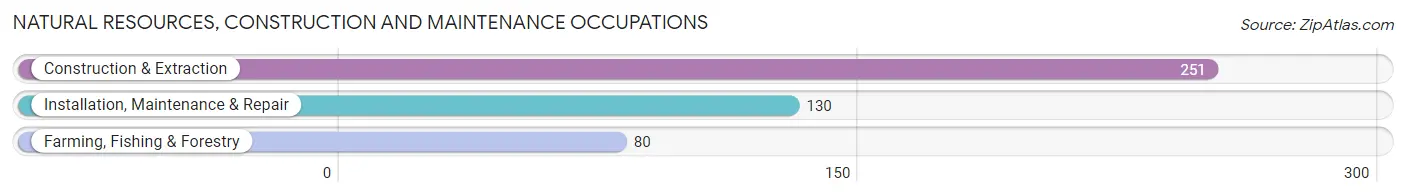
Natural Resources, Construction and Maintenance Occupations by Sex
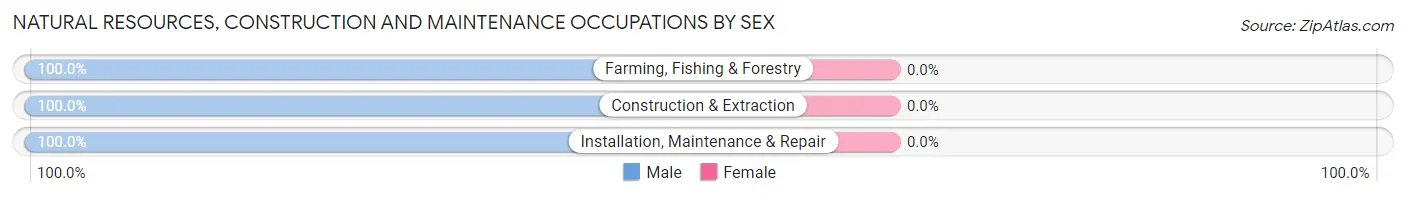
| Occupation | Male | Female |
| Farming, Fishing & Forestry | 80 (100.0%) | 0 (0.0%) |
| Construction & Extraction | 251 (100.0%) | 0 (0.0%) |
| Installation, Maintenance & Repair | 130 (100.0%) | 0 (0.0%) |
| Total (Category) | 461 (100.0%) | 0 (0.0%) |
| Total (Overall) | 2,017 (54.7%) | 1,671 (45.3%) |
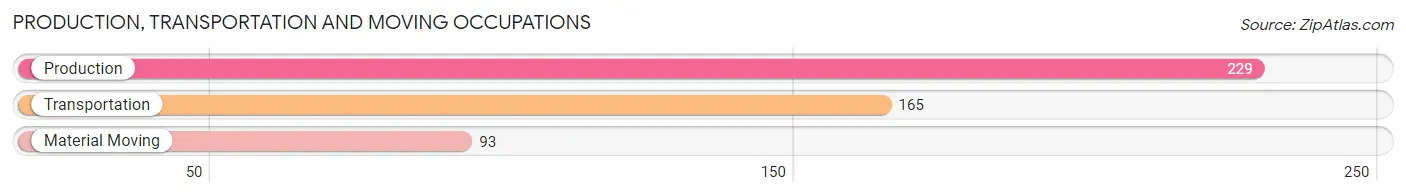
Production, Transportation and Moving Occupations
The most common Production, Transportation and Moving occupations in Unionville are Production (229 | 6.2%), Transportation (165 | 4.5%), and Material Moving (93 | 2.5%).
Production, Transportation and Moving Occupations by Sex
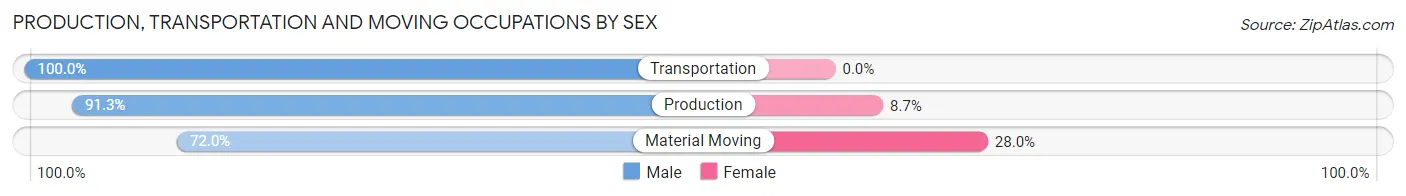
| Occupation | Male | Female |
| Production | 209 (91.3%) | 20 (8.7%) |
| Transportation | 165 (100.0%) | 0 (0.0%) |
| Material Moving | 67 (72.0%) | 26 (28.0%) |
| Total (Category) | 441 (90.5%) | 46 (9.5%) |
| Total (Overall) | 2,017 (54.7%) | 1,671 (45.3%) |
Employment Industries by Sex in Unionville
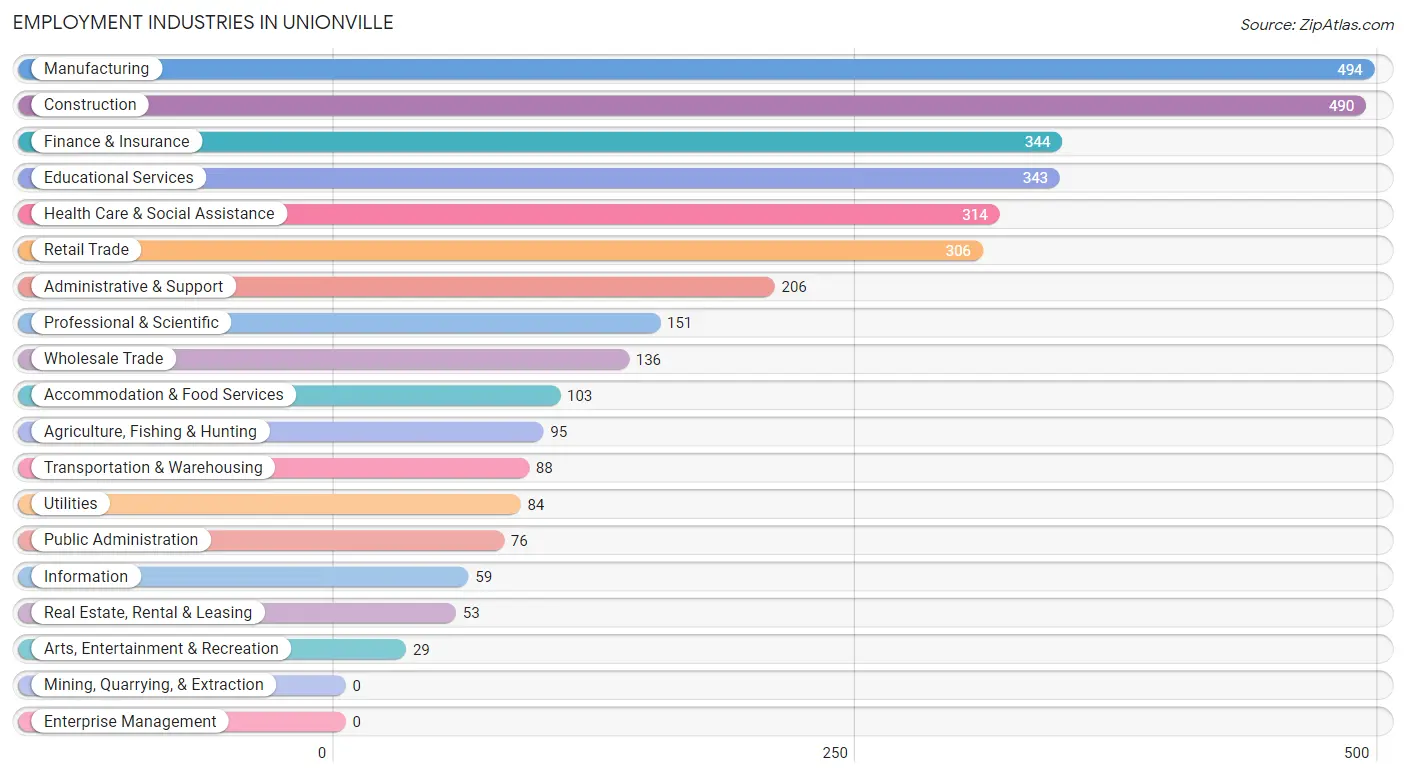
Employment Industries in Unionville
The major employment industries in Unionville include Manufacturing (494 | 13.4%), Construction (490 | 13.3%), Finance & Insurance (344 | 9.3%), Educational Services (343 | 9.3%), and Health Care & Social Assistance (314 | 8.5%).
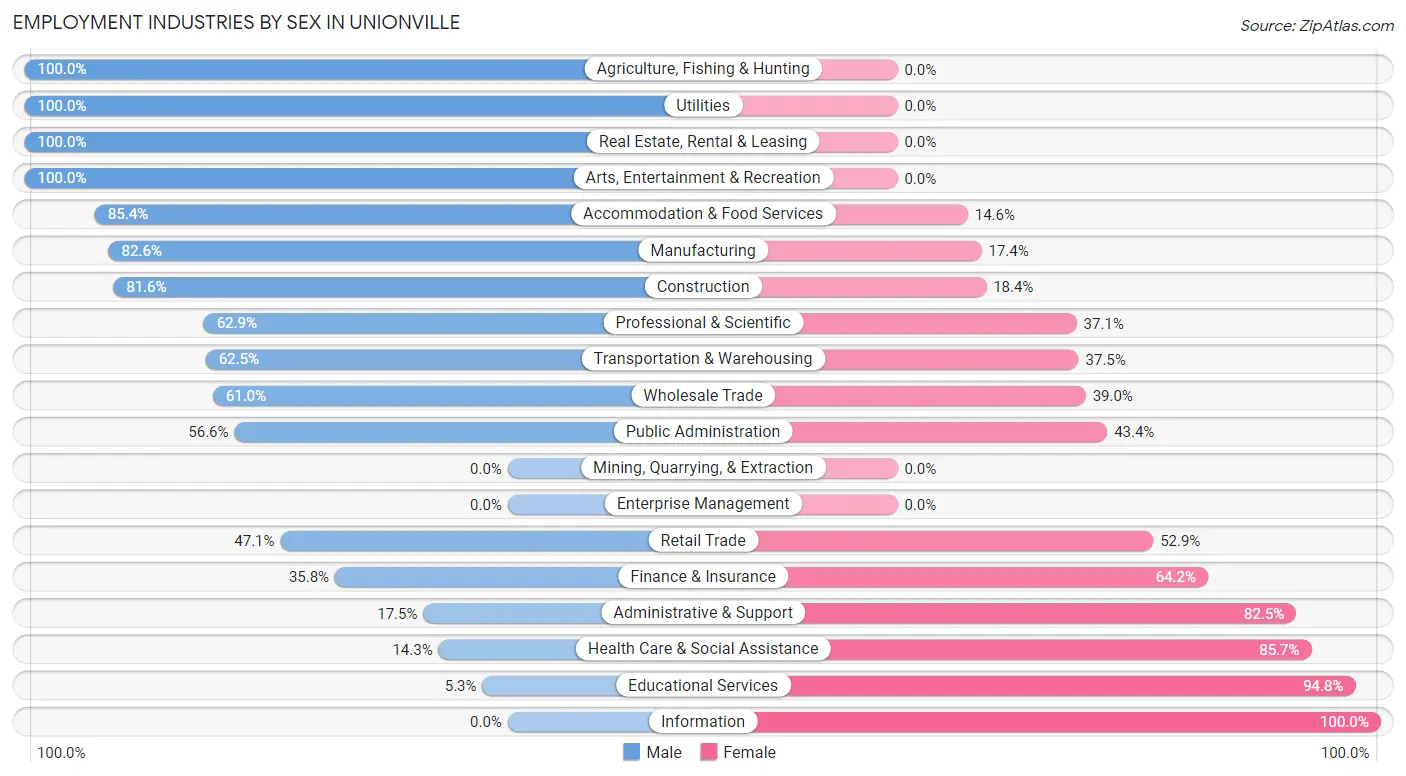
Employment Industries by Sex in Unionville
The Unionville industries that see more men than women are Agriculture, Fishing & Hunting (100.0%), Utilities (100.0%), and Real Estate, Rental & Leasing (100.0%), whereas the industries that tend to have a higher number of women are Information (100.0%), Educational Services (94.8%), and Health Care & Social Assistance (85.7%).
| Industry | Male | Female |
| Agriculture, Fishing & Hunting | 95 (100.0%) | 0 (0.0%) |
| Mining, Quarrying, & Extraction | 0 (0.0%) | 0 (0.0%) |
| Construction | 400 (81.6%) | 90 (18.4%) |
| Manufacturing | 408 (82.6%) | 86 (17.4%) |
| Wholesale Trade | 83 (61.0%) | 53 (39.0%) |
| Retail Trade | 144 (47.1%) | 162 (52.9%) |
| Transportation & Warehousing | 55 (62.5%) | 33 (37.5%) |
| Utilities | 84 (100.0%) | 0 (0.0%) |
| Information | 0 (0.0%) | 59 (100.0%) |
| Finance & Insurance | 123 (35.8%) | 221 (64.2%) |
| Real Estate, Rental & Leasing | 53 (100.0%) | 0 (0.0%) |
| Professional & Scientific | 95 (62.9%) | 56 (37.1%) |
| Enterprise Management | 0 (0.0%) | 0 (0.0%) |
| Administrative & Support | 36 (17.5%) | 170 (82.5%) |
| Educational Services | 18 (5.2%) | 325 (94.8%) |
| Health Care & Social Assistance | 45 (14.3%) | 269 (85.7%) |
| Arts, Entertainment & Recreation | 29 (100.0%) | 0 (0.0%) |
| Accommodation & Food Services | 88 (85.4%) | 15 (14.6%) |
| Public Administration | 43 (56.6%) | 33 (43.4%) |
| Total | 2,017 (54.7%) | 1,671 (45.3%) |
Education in Unionville
School Enrollment in Unionville
The most common levels of schooling among the 1,839 students in Unionville are high school (515 | 28.0%), middle school (467 | 25.4%), and elementary school (391 | 21.3%).
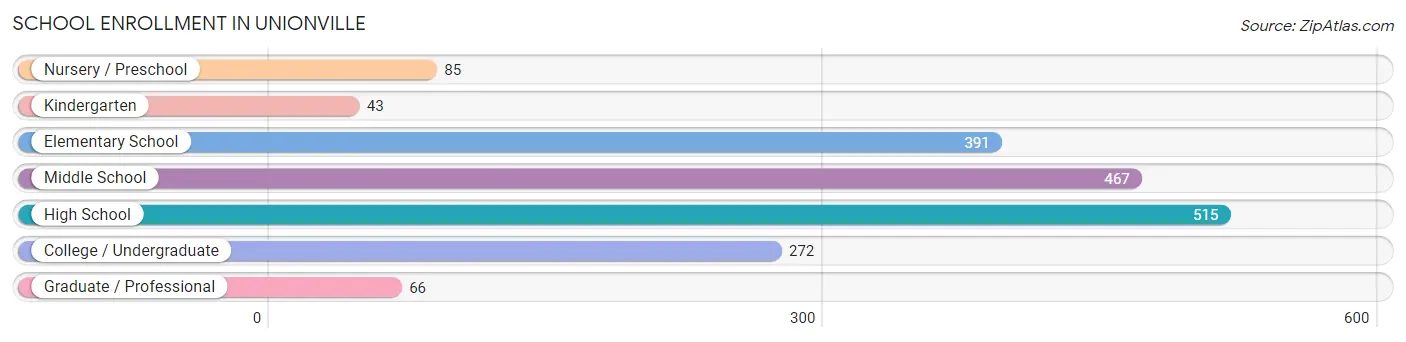
| School Level | # Students | % Students |
| Nursery / Preschool | 85 | 4.6% |
| Kindergarten | 43 | 2.3% |
| Elementary School | 391 | 21.3% |
| Middle School | 467 | 25.4% |
| High School | 515 | 28.0% |
| College / Undergraduate | 272 | 14.8% |
| Graduate / Professional | 66 | 3.6% |
| Total | 1,839 | 100.0% |
School Enrollment by Age by Funding Source in Unionville
Out of a total of 1,839 students who are enrolled in schools in Unionville, 476 (25.9%) attend a private institution, while the remaining 1,363 (74.1%) are enrolled in public schools. The age group of 3 to 4 year olds has the highest likelihood of being enrolled in private schools, with 44 (58.7% in the age bracket) enrolled. Conversely, the age group of 25 to 34 year olds has the lowest likelihood of being enrolled in a private school, with 37 (100.0% in the age bracket) attending a public institution.
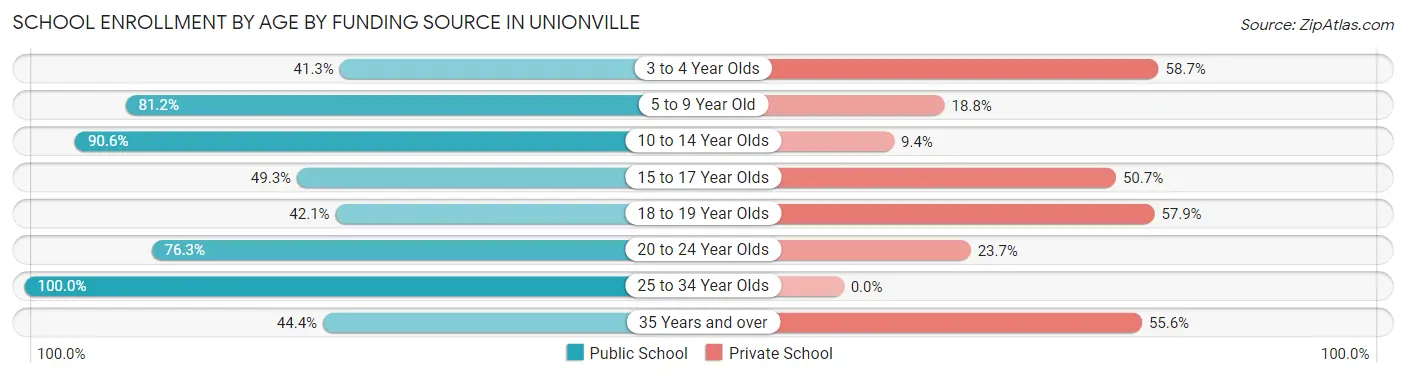
| Age Bracket | Public School | Private School |
| 3 to 4 Year Olds | 31 (41.3%) | 44 (58.7%) |
| 5 to 9 Year Old | 315 (81.2%) | 73 (18.8%) |
| 10 to 14 Year Olds | 608 (90.6%) | 63 (9.4%) |
| 15 to 17 Year Olds | 170 (49.3%) | 175 (50.7%) |
| 18 to 19 Year Olds | 16 (42.1%) | 22 (57.9%) |
| 20 to 24 Year Olds | 142 (76.3%) | 44 (23.7%) |
| 25 to 34 Year Olds | 37 (100.0%) | 0 (0.0%) |
| 35 Years and over | 44 (44.4%) | 55 (55.6%) |
| Total | 1,363 (74.1%) | 476 (25.9%) |
Educational Attainment by Field of Study in Unionville
Business (276 | 23.0%), education (181 | 15.1%), psychology (129 | 10.8%), engineering (120 | 10.0%), and science & technology (106 | 8.8%) are the most common fields of study among 1,199 individuals in Unionville who have obtained a bachelor's degree or higher.
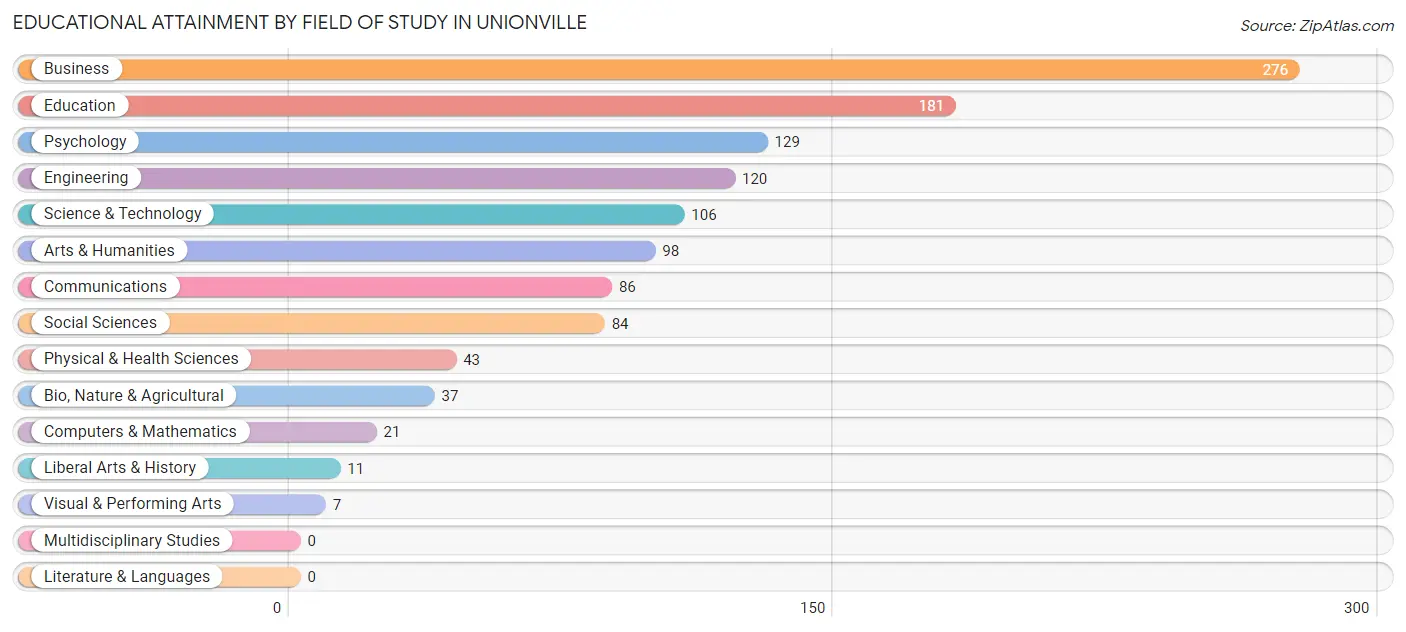
| Field of Study | # Graduates | % Graduates |
| Computers & Mathematics | 21 | 1.8% |
| Bio, Nature & Agricultural | 37 | 3.1% |
| Physical & Health Sciences | 43 | 3.6% |
| Psychology | 129 | 10.8% |
| Social Sciences | 84 | 7.0% |
| Engineering | 120 | 10.0% |
| Multidisciplinary Studies | 0 | 0.0% |
| Science & Technology | 106 | 8.8% |
| Business | 276 | 23.0% |
| Education | 181 | 15.1% |
| Literature & Languages | 0 | 0.0% |
| Liberal Arts & History | 11 | 0.9% |
| Visual & Performing Arts | 7 | 0.6% |
| Communications | 86 | 7.2% |
| Arts & Humanities | 98 | 8.2% |
| Total | 1,199 | 100.0% |
Transportation & Commute in Unionville
Vehicle Availability by Sex in Unionville
The most prevalent vehicle ownership categories in Unionville are males with 3 vehicles (633, accounting for 31.4%) and females with 3 vehicles (473, making up 37.9%).
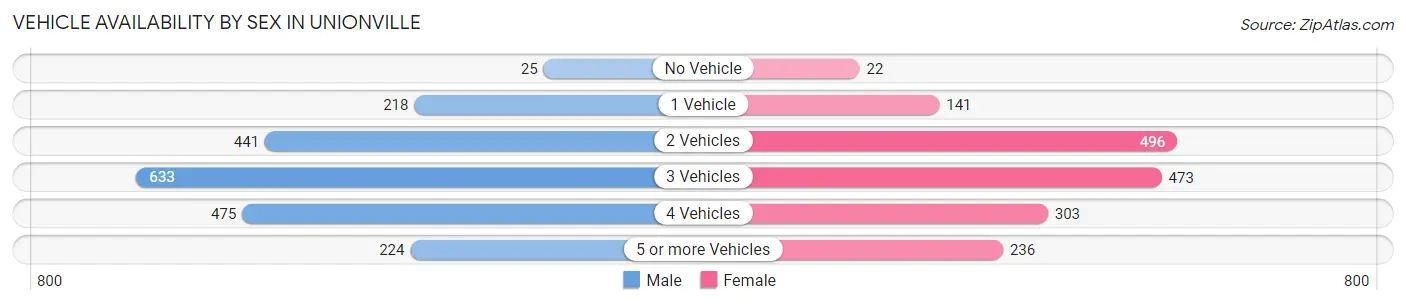
| Vehicles Available | Male | Female |
| No Vehicle | 25 (1.2%) | 22 (1.3%) |
| 1 Vehicle | 218 (10.8%) | 141 (8.4%) |
| 2 Vehicles | 441 (21.9%) | 496 (29.7%) |
| 3 Vehicles | 633 (31.4%) | 473 (28.3%) |
| 4 Vehicles | 475 (23.6%) | 303 (18.1%) |
| 5 or more Vehicles | 224 (11.1%) | 236 (14.1%) |
| Total | 2,016 (100.0%) | 1,671 (100.0%) |
Commute Time in Unionville
The most frequently occuring commute durations in Unionville are 45 to 59 minutes (702 commuters, 20.3%), 15 to 19 minutes (534 commuters, 15.5%), and 10 to 14 minutes (484 commuters, 14.0%).
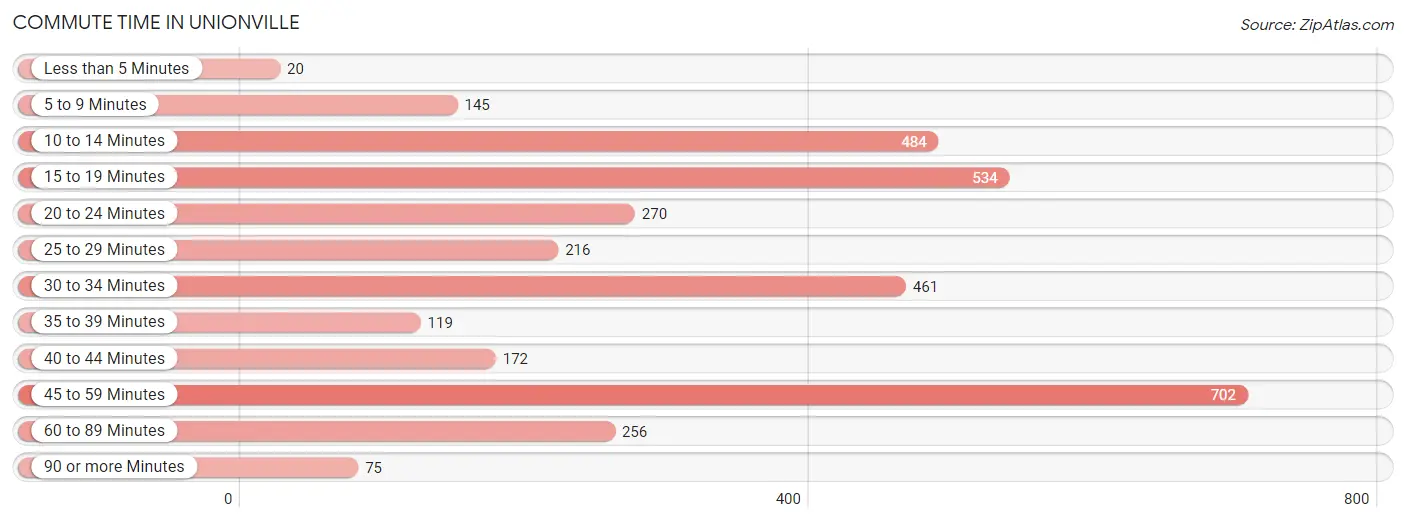
| Commute Time | # Commuters | % Commuters |
| Less than 5 Minutes | 20 | 0.6% |
| 5 to 9 Minutes | 145 | 4.2% |
| 10 to 14 Minutes | 484 | 14.0% |
| 15 to 19 Minutes | 534 | 15.5% |
| 20 to 24 Minutes | 270 | 7.8% |
| 25 to 29 Minutes | 216 | 6.2% |
| 30 to 34 Minutes | 461 | 13.4% |
| 35 to 39 Minutes | 119 | 3.5% |
| 40 to 44 Minutes | 172 | 5.0% |
| 45 to 59 Minutes | 702 | 20.3% |
| 60 to 89 Minutes | 256 | 7.4% |
| 90 or more Minutes | 75 | 2.2% |
Commute Time by Sex in Unionville
The most common commute times in Unionville are 45 to 59 minutes (448 commuters, 23.1%) for males and 10 to 14 minutes (276 commuters, 18.2%) for females.
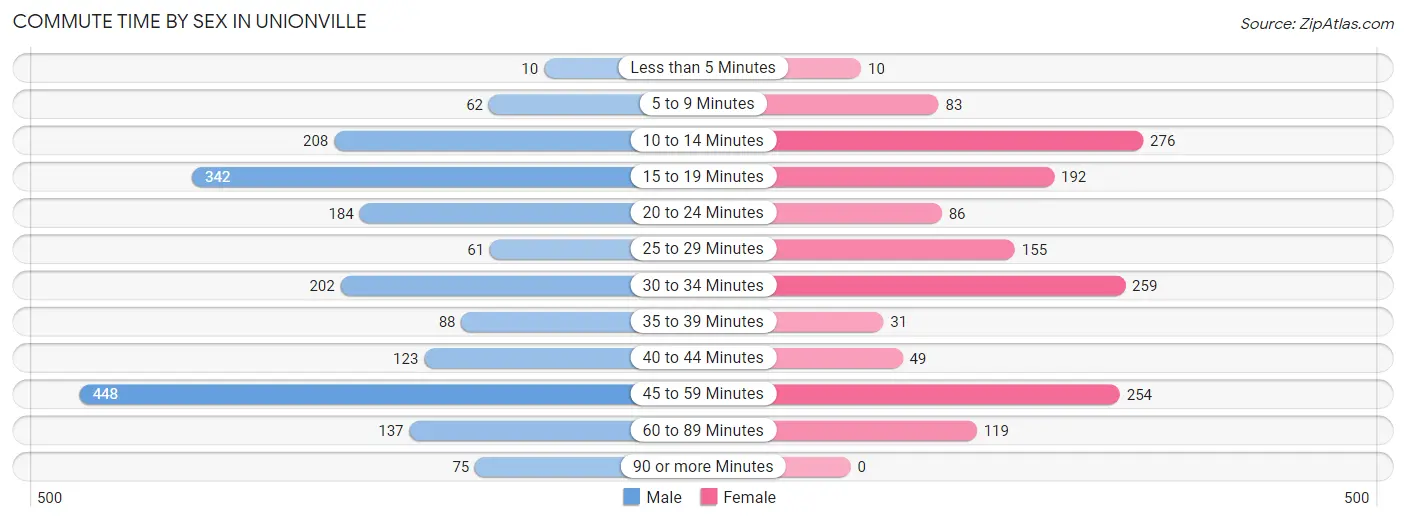
| Commute Time | Male | Female |
| Less than 5 Minutes | 10 (0.5%) | 10 (0.7%) |
| 5 to 9 Minutes | 62 (3.2%) | 83 (5.5%) |
| 10 to 14 Minutes | 208 (10.7%) | 276 (18.2%) |
| 15 to 19 Minutes | 342 (17.6%) | 192 (12.7%) |
| 20 to 24 Minutes | 184 (9.5%) | 86 (5.7%) |
| 25 to 29 Minutes | 61 (3.1%) | 155 (10.2%) |
| 30 to 34 Minutes | 202 (10.4%) | 259 (17.1%) |
| 35 to 39 Minutes | 88 (4.5%) | 31 (2.1%) |
| 40 to 44 Minutes | 123 (6.3%) | 49 (3.2%) |
| 45 to 59 Minutes | 448 (23.1%) | 254 (16.8%) |
| 60 to 89 Minutes | 137 (7.1%) | 119 (7.9%) |
| 90 or more Minutes | 75 (3.9%) | 0 (0.0%) |
Time of Departure to Work by Sex in Unionville
The most frequent times of departure to work in Unionville are 7:00 AM to 7:29 AM (348, 17.9%) for males and 7:30 AM to 7:59 AM (362, 23.9%) for females.
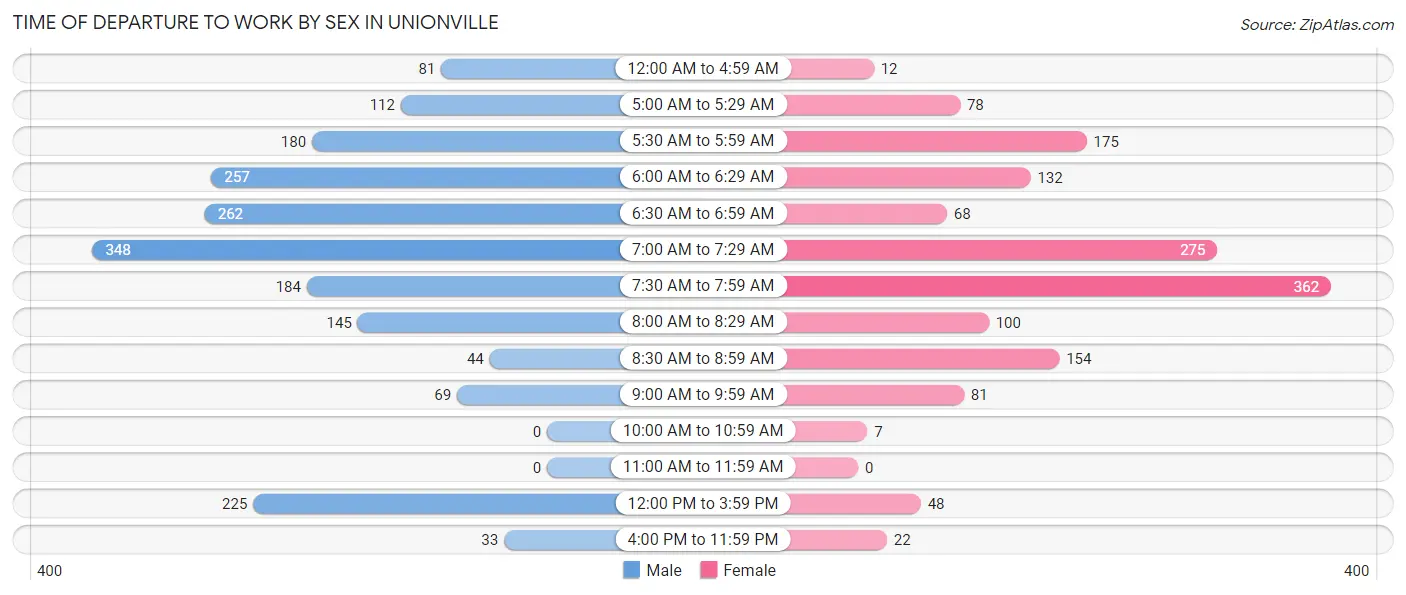
| Time of Departure | Male | Female |
| 12:00 AM to 4:59 AM | 81 (4.2%) | 12 (0.8%) |
| 5:00 AM to 5:29 AM | 112 (5.8%) | 78 (5.1%) |
| 5:30 AM to 5:59 AM | 180 (9.3%) | 175 (11.6%) |
| 6:00 AM to 6:29 AM | 257 (13.3%) | 132 (8.7%) |
| 6:30 AM to 6:59 AM | 262 (13.5%) | 68 (4.5%) |
| 7:00 AM to 7:29 AM | 348 (17.9%) | 275 (18.2%) |
| 7:30 AM to 7:59 AM | 184 (9.5%) | 362 (23.9%) |
| 8:00 AM to 8:29 AM | 145 (7.5%) | 100 (6.6%) |
| 8:30 AM to 8:59 AM | 44 (2.3%) | 154 (10.2%) |
| 9:00 AM to 9:59 AM | 69 (3.6%) | 81 (5.3%) |
| 10:00 AM to 10:59 AM | 0 (0.0%) | 7 (0.5%) |
| 11:00 AM to 11:59 AM | 0 (0.0%) | 0 (0.0%) |
| 12:00 PM to 3:59 PM | 225 (11.6%) | 48 (3.2%) |
| 4:00 PM to 11:59 PM | 33 (1.7%) | 22 (1.5%) |
| Total | 1,940 (100.0%) | 1,514 (100.0%) |
Housing Occupancy in Unionville
Occupancy by Ownership in Unionville
Of the total 2,428 dwellings in Unionville, owner-occupied units account for 2,208 (90.9%), while renter-occupied units make up 220 (9.1%).
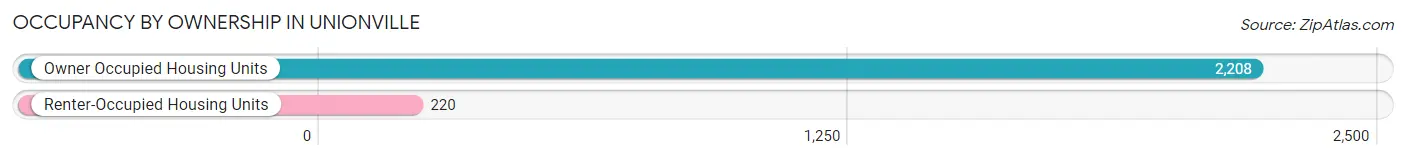
| Occupancy | # Housing Units | % Housing Units |
| Owner Occupied Housing Units | 2,208 | 90.9% |
| Renter-Occupied Housing Units | 220 | 9.1% |
| Total Occupied Housing Units | 2,428 | 100.0% |
Occupancy by Household Size in Unionville
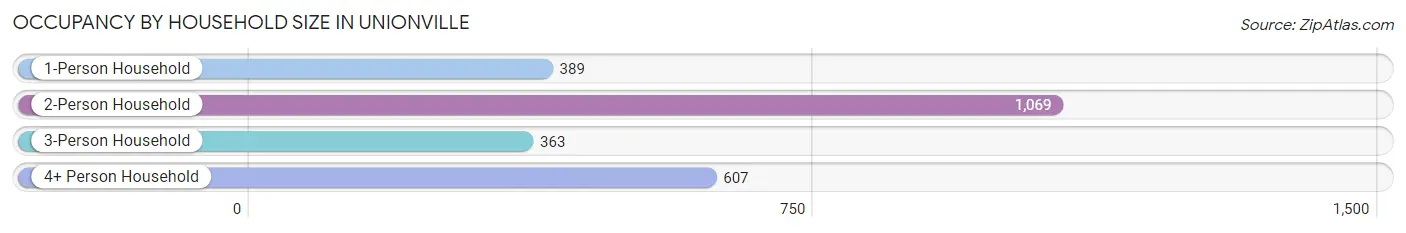
| Household Size | # Housing Units | % Housing Units |
| 1-Person Household | 389 | 16.0% |
| 2-Person Household | 1,069 | 44.0% |
| 3-Person Household | 363 | 14.9% |
| 4+ Person Household | 607 | 25.0% |
| Total Housing Units | 2,428 | 100.0% |
Occupancy by Ownership by Household Size in Unionville
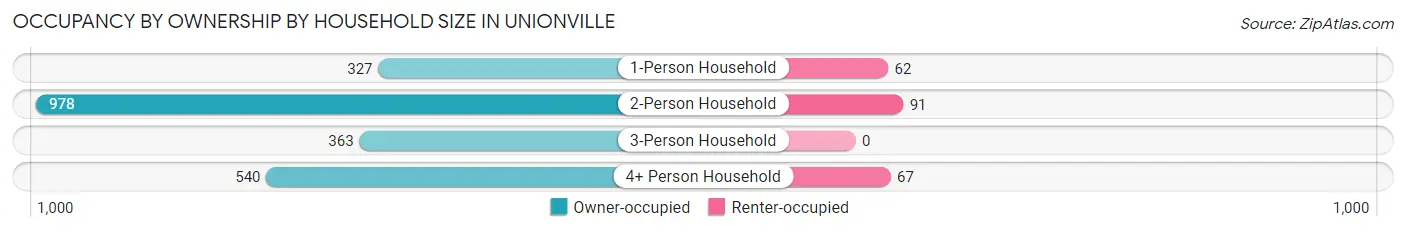
| Household Size | Owner-occupied | Renter-occupied |
| 1-Person Household | 327 (84.1%) | 62 (15.9%) |
| 2-Person Household | 978 (91.5%) | 91 (8.5%) |
| 3-Person Household | 363 (100.0%) | 0 (0.0%) |
| 4+ Person Household | 540 (89.0%) | 67 (11.0%) |
| Total Housing Units | 2,208 (90.9%) | 220 (9.1%) |
Occupancy by Educational Attainment in Unionville
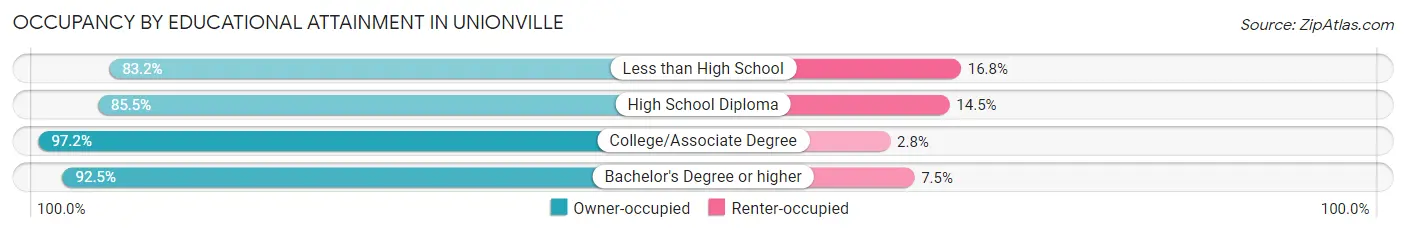
| Household Size | Owner-occupied | Renter-occupied |
| Less than High School | 124 (83.2%) | 25 (16.8%) |
| High School Diploma | 730 (85.5%) | 124 (14.5%) |
| College/Associate Degree | 741 (97.2%) | 21 (2.8%) |
| Bachelor's Degree or higher | 613 (92.5%) | 50 (7.5%) |
Occupancy by Age of Householder in Unionville
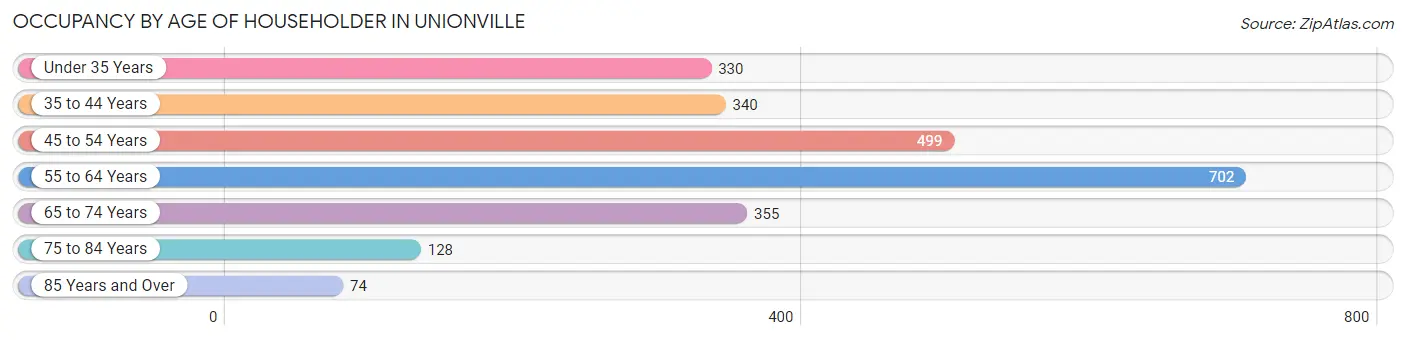
| Age Bracket | # Households | % Households |
| Under 35 Years | 330 | 13.6% |
| 35 to 44 Years | 340 | 14.0% |
| 45 to 54 Years | 499 | 20.5% |
| 55 to 64 Years | 702 | 28.9% |
| 65 to 74 Years | 355 | 14.6% |
| 75 to 84 Years | 128 | 5.3% |
| 85 Years and Over | 74 | 3.0% |
| Total | 2,428 | 100.0% |
Housing Finances in Unionville
Median Income by Occupancy in Unionville
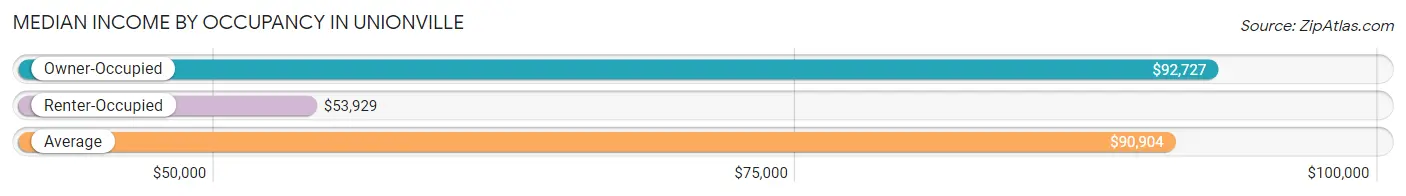
| Occupancy Type | # Households | Median Income |
| Owner-Occupied | 2,208 (90.9%) | $92,727 |
| Renter-Occupied | 220 (9.1%) | $53,929 |
| Average | 2,428 (100.0%) | $90,904 |
Occupancy by Householder Income Bracket in Unionville
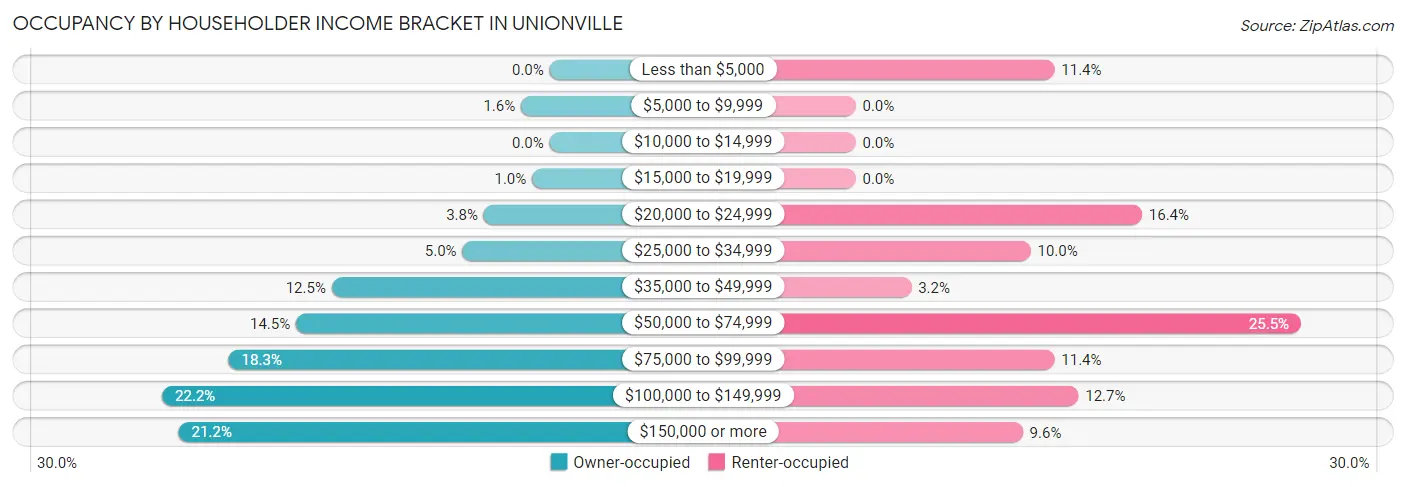
| Income Bracket | Owner-occupied | Renter-occupied |
| Less than $5,000 | 0 (0.0%) | 25 (11.4%) |
| $5,000 to $9,999 | 36 (1.6%) | 0 (0.0%) |
| $10,000 to $14,999 | 0 (0.0%) | 0 (0.0%) |
| $15,000 to $19,999 | 22 (1.0%) | 0 (0.0%) |
| $20,000 to $24,999 | 83 (3.8%) | 36 (16.4%) |
| $25,000 to $34,999 | 110 (5.0%) | 22 (10.0%) |
| $35,000 to $49,999 | 275 (12.4%) | 7 (3.2%) |
| $50,000 to $74,999 | 320 (14.5%) | 56 (25.5%) |
| $75,000 to $99,999 | 405 (18.3%) | 25 (11.4%) |
| $100,000 to $149,999 | 489 (22.2%) | 28 (12.7%) |
| $150,000 or more | 468 (21.2%) | 21 (9.6%) |
| Total | 2,208 (100.0%) | 220 (100.0%) |
Monthly Housing Cost Tiers in Unionville
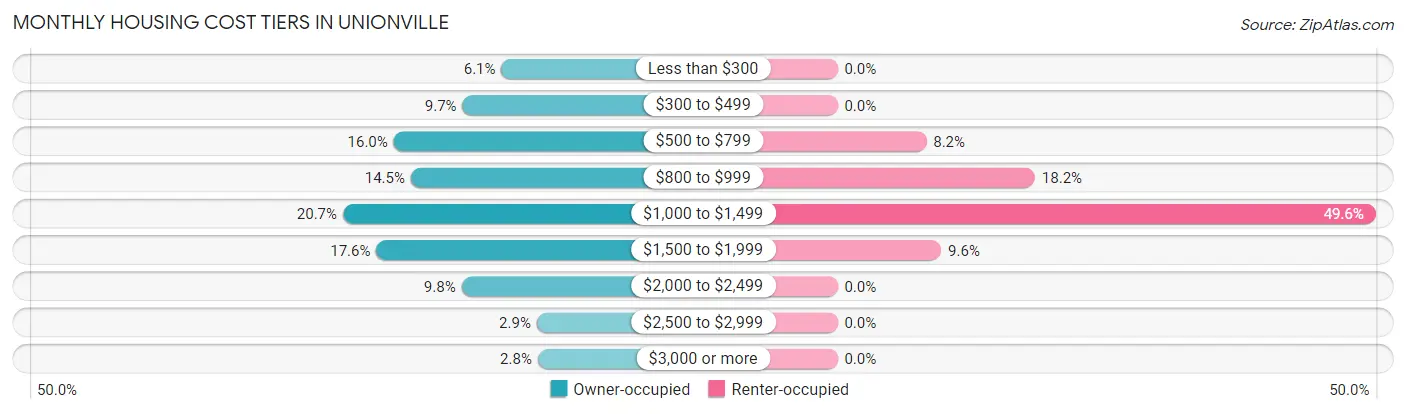
| Monthly Cost | Owner-occupied | Renter-occupied |
| Less than $300 | 135 (6.1%) | 0 (0.0%) |
| $300 to $499 | 214 (9.7%) | 0 (0.0%) |
| $500 to $799 | 354 (16.0%) | 18 (8.2%) |
| $800 to $999 | 319 (14.4%) | 40 (18.2%) |
| $1,000 to $1,499 | 457 (20.7%) | 109 (49.5%) |
| $1,500 to $1,999 | 389 (17.6%) | 21 (9.6%) |
| $2,000 to $2,499 | 216 (9.8%) | 0 (0.0%) |
| $2,500 to $2,999 | 63 (2.9%) | 0 (0.0%) |
| $3,000 or more | 61 (2.8%) | 0 (0.0%) |
| Total | 2,208 (100.0%) | 220 (100.0%) |
Physical Housing Characteristics in Unionville
Housing Structures in Unionville
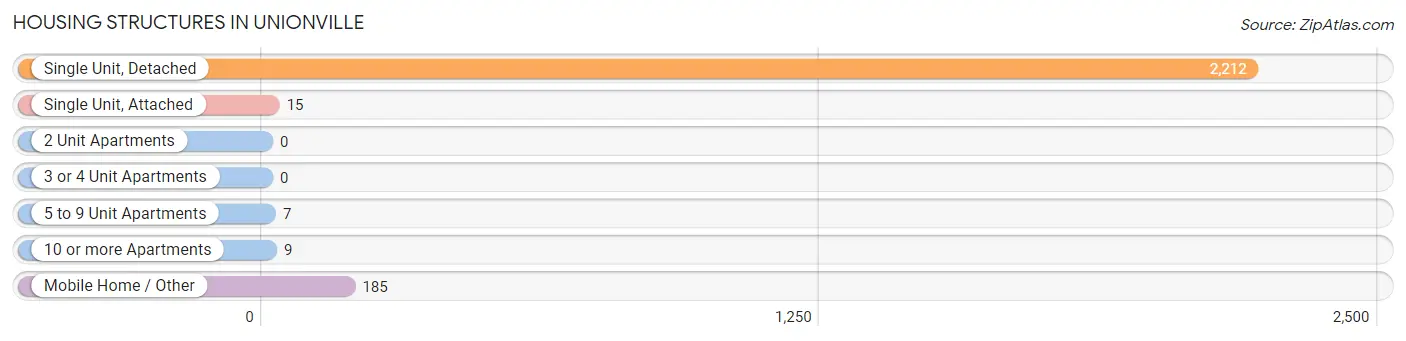
| Structure Type | # Housing Units | % Housing Units |
| Single Unit, Detached | 2,212 | 91.1% |
| Single Unit, Attached | 15 | 0.6% |
| 2 Unit Apartments | 0 | 0.0% |
| 3 or 4 Unit Apartments | 0 | 0.0% |
| 5 to 9 Unit Apartments | 7 | 0.3% |
| 10 or more Apartments | 9 | 0.4% |
| Mobile Home / Other | 185 | 7.6% |
| Total | 2,428 | 100.0% |
Housing Structures by Occupancy in Unionville
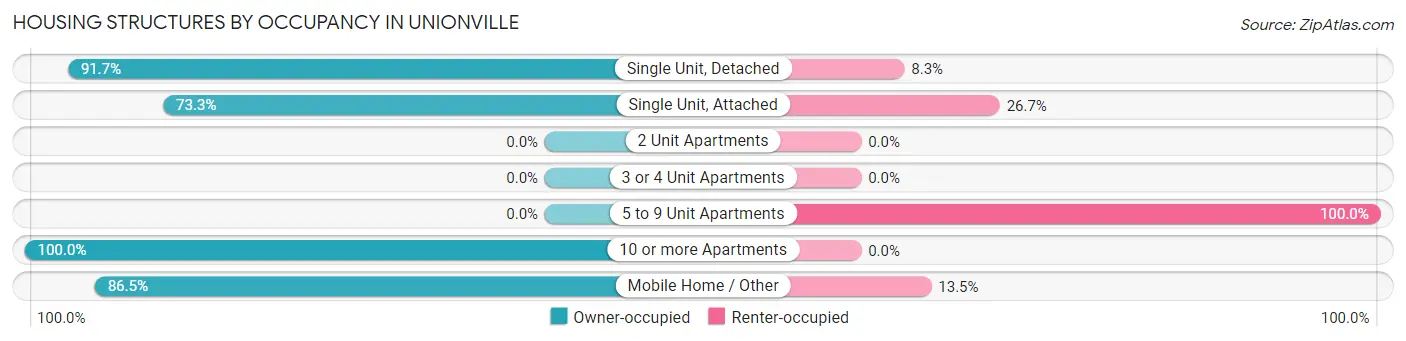
| Structure Type | Owner-occupied | Renter-occupied |
| Single Unit, Detached | 2,028 (91.7%) | 184 (8.3%) |
| Single Unit, Attached | 11 (73.3%) | 4 (26.7%) |
| 2 Unit Apartments | 0 (0.0%) | 0 (0.0%) |
| 3 or 4 Unit Apartments | 0 (0.0%) | 0 (0.0%) |
| 5 to 9 Unit Apartments | 0 (0.0%) | 7 (100.0%) |
| 10 or more Apartments | 9 (100.0%) | 0 (0.0%) |
| Mobile Home / Other | 160 (86.5%) | 25 (13.5%) |
| Total | 2,208 (90.9%) | 220 (9.1%) |
Housing Structures by Number of Rooms in Unionville
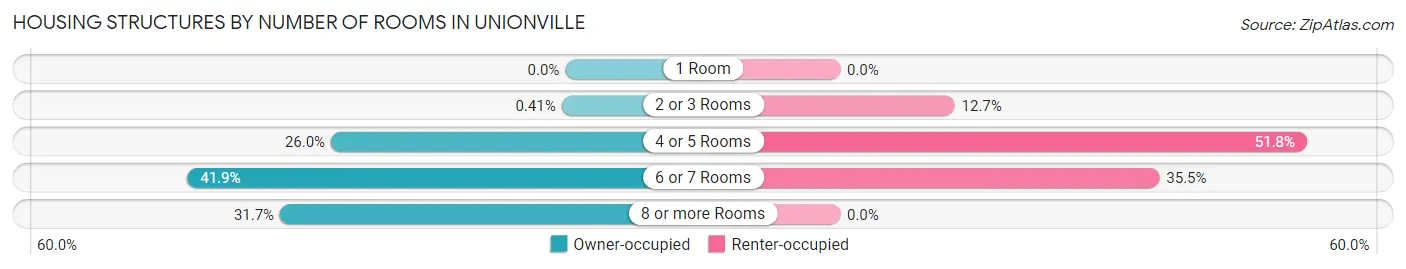
| Number of Rooms | Owner-occupied | Renter-occupied |
| 1 Room | 0 (0.0%) | 0 (0.0%) |
| 2 or 3 Rooms | 9 (0.4%) | 28 (12.7%) |
| 4 or 5 Rooms | 574 (26.0%) | 114 (51.8%) |
| 6 or 7 Rooms | 926 (41.9%) | 78 (35.4%) |
| 8 or more Rooms | 699 (31.7%) | 0 (0.0%) |
| Total | 2,208 (100.0%) | 220 (100.0%) |
Housing Structure by Heating Type in Unionville
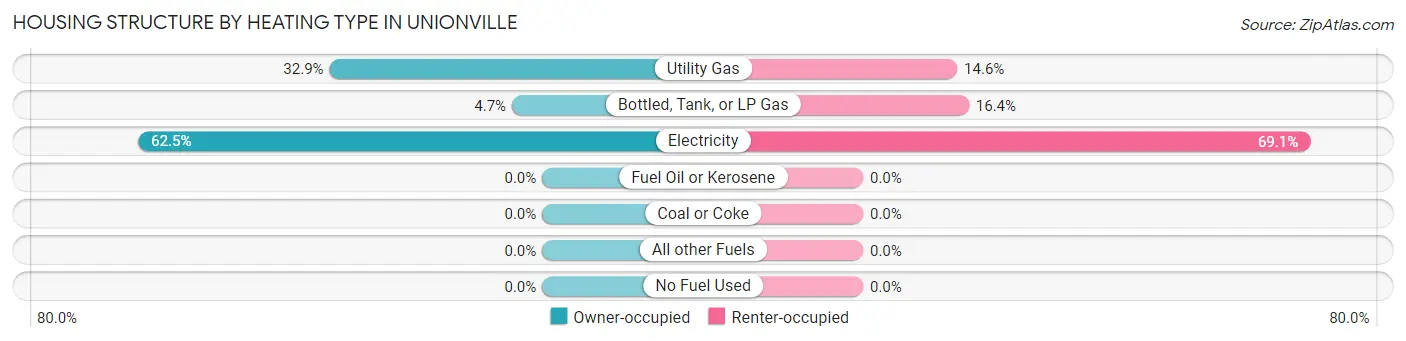
| Heating Type | Owner-occupied | Renter-occupied |
| Utility Gas | 726 (32.9%) | 32 (14.5%) |
| Bottled, Tank, or LP Gas | 103 (4.7%) | 36 (16.4%) |
| Electricity | 1,379 (62.5%) | 152 (69.1%) |
| Fuel Oil or Kerosene | 0 (0.0%) | 0 (0.0%) |
| Coal or Coke | 0 (0.0%) | 0 (0.0%) |
| All other Fuels | 0 (0.0%) | 0 (0.0%) |
| No Fuel Used | 0 (0.0%) | 0 (0.0%) |
| Total | 2,208 (100.0%) | 220 (100.0%) |
Household Vehicle Usage in Unionville
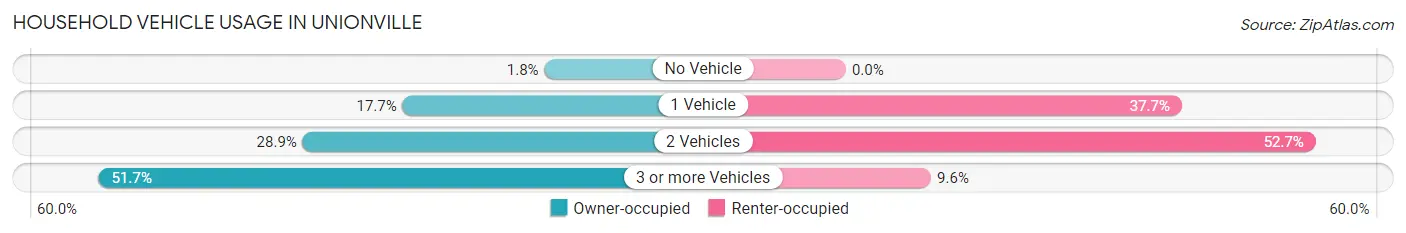
| Vehicles per Household | Owner-occupied | Renter-occupied |
| No Vehicle | 39 (1.8%) | 0 (0.0%) |
| 1 Vehicle | 390 (17.7%) | 83 (37.7%) |
| 2 Vehicles | 637 (28.8%) | 116 (52.7%) |
| 3 or more Vehicles | 1,142 (51.7%) | 21 (9.6%) |
| Total | 2,208 (100.0%) | 220 (100.0%) |
Real Estate & Mortgages in Unionville
Real Estate and Mortgage Overview in Unionville
| Characteristic | Without Mortgage | With Mortgage |
| Housing Units | 830 | 1,378 |
| Median Property Value | $252,300 | $322,700 |
| Median Household Income | $73,929 | $349 |
| Monthly Housing Costs | $538 | $61 |
| Real Estate Taxes | $1,547 | $0 |
Property Value by Mortgage Status in Unionville
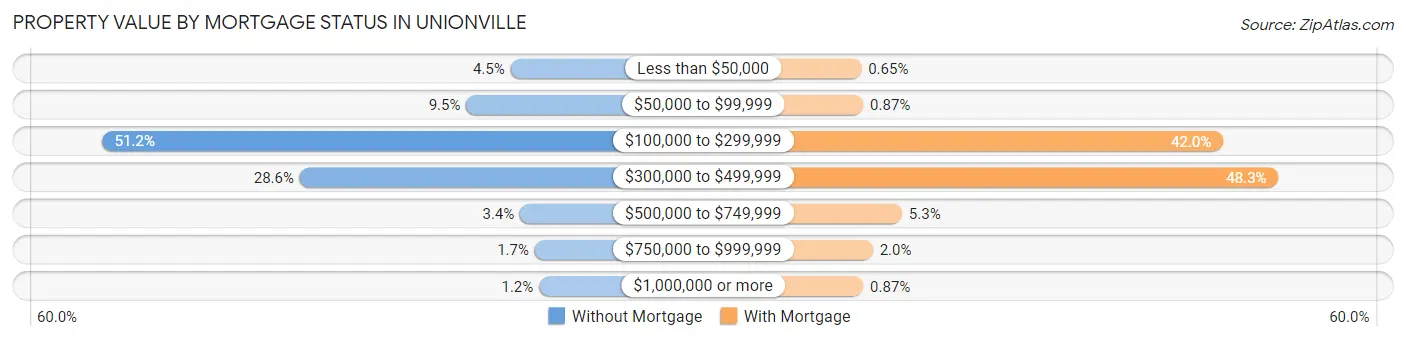
| Property Value | Without Mortgage | With Mortgage |
| Less than $50,000 | 37 (4.5%) | 9 (0.6%) |
| $50,000 to $99,999 | 79 (9.5%) | 12 (0.9%) |
| $100,000 to $299,999 | 425 (51.2%) | 579 (42.0%) |
| $300,000 to $499,999 | 237 (28.5%) | 666 (48.3%) |
| $500,000 to $749,999 | 28 (3.4%) | 73 (5.3%) |
| $750,000 to $999,999 | 14 (1.7%) | 27 (2.0%) |
| $1,000,000 or more | 10 (1.2%) | 12 (0.9%) |
| Total | 830 (100.0%) | 1,378 (100.0%) |
Household Income by Mortgage Status in Unionville
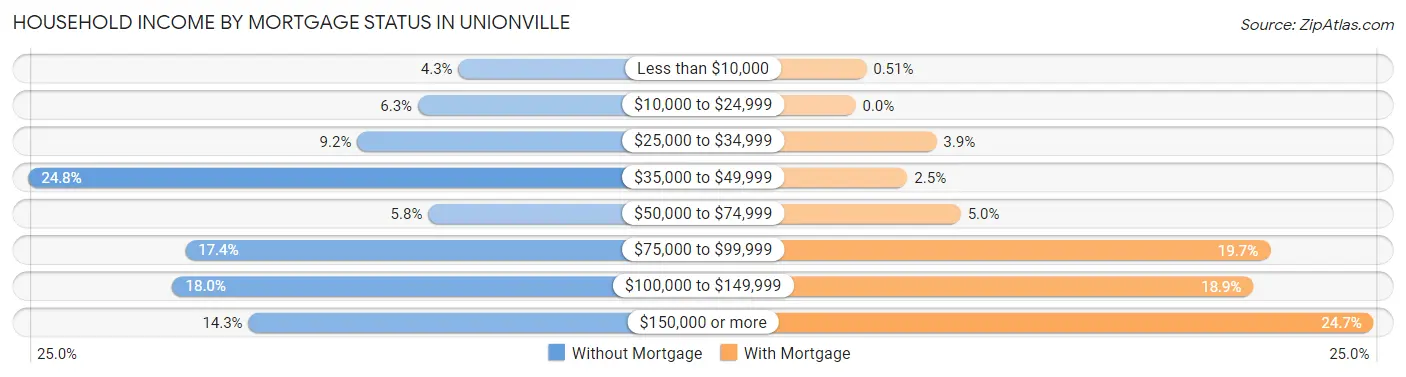
| Household Income | Without Mortgage | With Mortgage |
| Less than $10,000 | 36 (4.3%) | 7 (0.5%) |
| $10,000 to $24,999 | 52 (6.3%) | 0 (0.0%) |
| $25,000 to $34,999 | 76 (9.2%) | 53 (3.8%) |
| $35,000 to $49,999 | 206 (24.8%) | 34 (2.5%) |
| $50,000 to $74,999 | 48 (5.8%) | 69 (5.0%) |
| $75,000 to $99,999 | 144 (17.3%) | 272 (19.7%) |
| $100,000 to $149,999 | 149 (17.9%) | 261 (18.9%) |
| $150,000 or more | 119 (14.3%) | 340 (24.7%) |
| Total | 830 (100.0%) | 1,378 (100.0%) |
Property Value to Household Income Ratio in Unionville
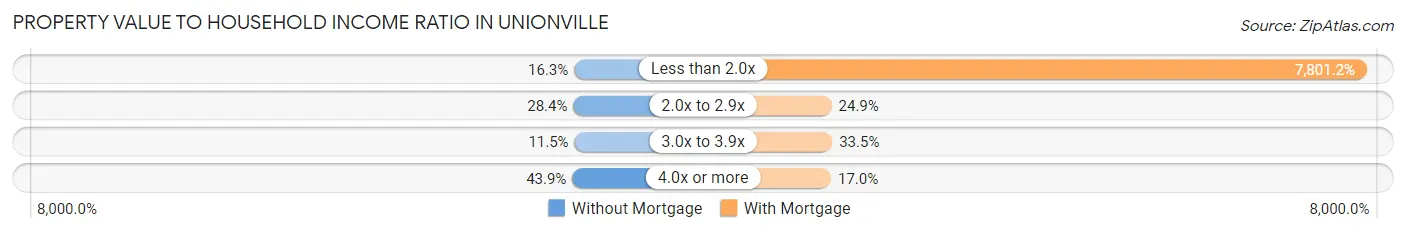
| Value-to-Income Ratio | Without Mortgage | With Mortgage |
| Less than 2.0x | 135 (16.3%) | 107,500 (7,801.2%) |
| 2.0x to 2.9x | 236 (28.4%) | 343 (24.9%) |
| 3.0x to 3.9x | 95 (11.5%) | 462 (33.5%) |
| 4.0x or more | 364 (43.9%) | 234 (17.0%) |
| Total | 830 (100.0%) | 1,378 (100.0%) |
Real Estate Taxes by Mortgage Status in Unionville
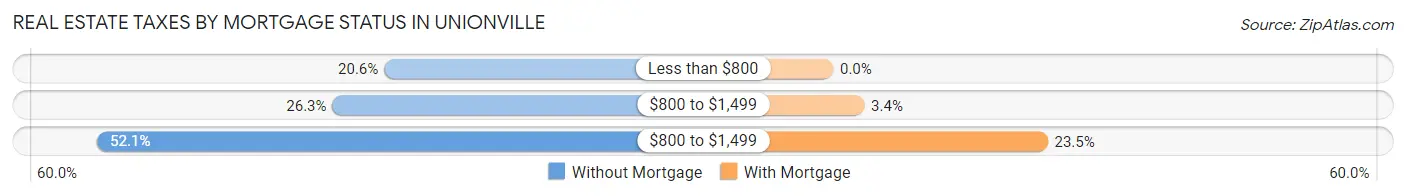
| Property Taxes | Without Mortgage | With Mortgage |
| Less than $800 | 171 (20.6%) | 0 (0.0%) |
| $800 to $1,499 | 218 (26.3%) | 47 (3.4%) |
| $800 to $1,499 | 432 (52.0%) | 324 (23.5%) |
| Total | 830 (100.0%) | 1,378 (100.0%) |
Health & Disability in Unionville
Health Insurance Coverage by Age in Unionville
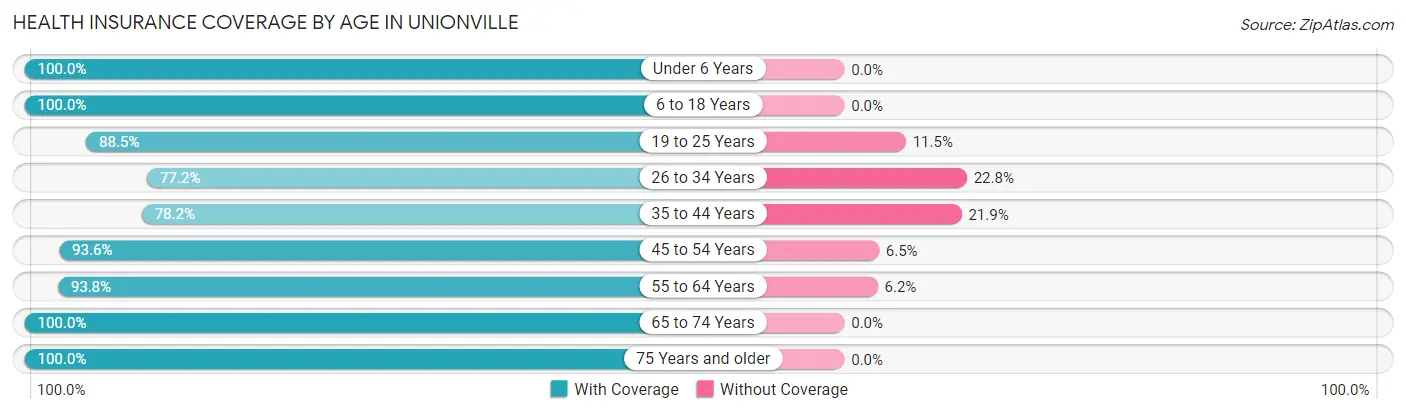
| Age Bracket | With Coverage | Without Coverage |
| Under 6 Years | 333 (100.0%) | 0 (0.0%) |
| 6 to 18 Years | 1,389 (100.0%) | 0 (0.0%) |
| 19 to 25 Years | 502 (88.5%) | 65 (11.5%) |
| 26 to 34 Years | 497 (77.2%) | 147 (22.8%) |
| 35 to 44 Years | 658 (78.1%) | 184 (21.8%) |
| 45 to 54 Years | 899 (93.5%) | 62 (6.5%) |
| 55 to 64 Years | 1,088 (93.8%) | 72 (6.2%) |
| 65 to 74 Years | 523 (100.0%) | 0 (0.0%) |
| 75 Years and older | 271 (100.0%) | 0 (0.0%) |
| Total | 6,160 (92.1%) | 530 (7.9%) |
Health Insurance Coverage by Citizenship Status in Unionville
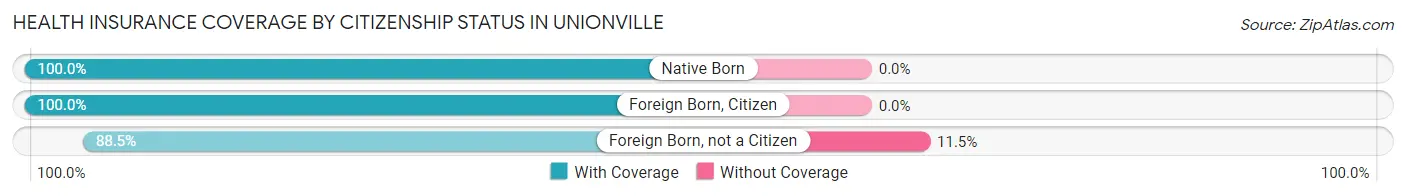
| Citizenship Status | With Coverage | Without Coverage |
| Native Born | 333 (100.0%) | 0 (0.0%) |
| Foreign Born, Citizen | 1,389 (100.0%) | 0 (0.0%) |
| Foreign Born, not a Citizen | 502 (88.5%) | 65 (11.5%) |
Health Insurance Coverage by Household Income in Unionville
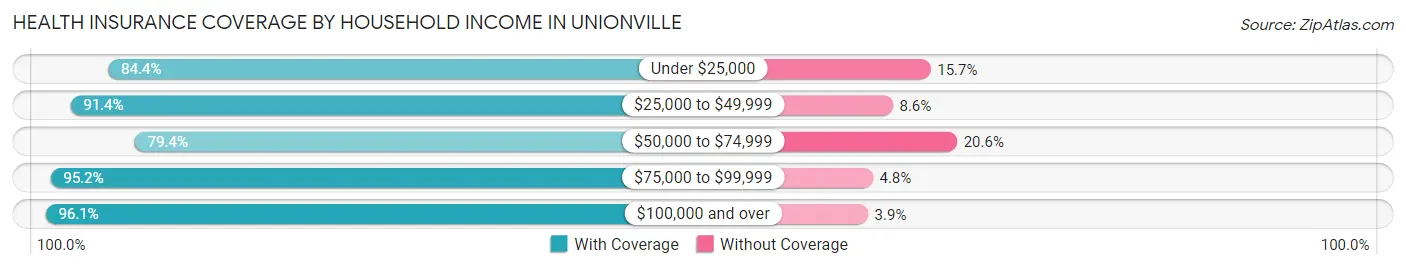
| Household Income | With Coverage | Without Coverage |
| Under $25,000 | 248 (84.4%) | 46 (15.7%) |
| $25,000 to $49,999 | 896 (91.4%) | 84 (8.6%) |
| $50,000 to $74,999 | 844 (79.4%) | 219 (20.6%) |
| $75,000 to $99,999 | 1,166 (95.2%) | 59 (4.8%) |
| $100,000 and over | 2,998 (96.1%) | 122 (3.9%) |
Public vs Private Health Insurance Coverage by Age in Unionville
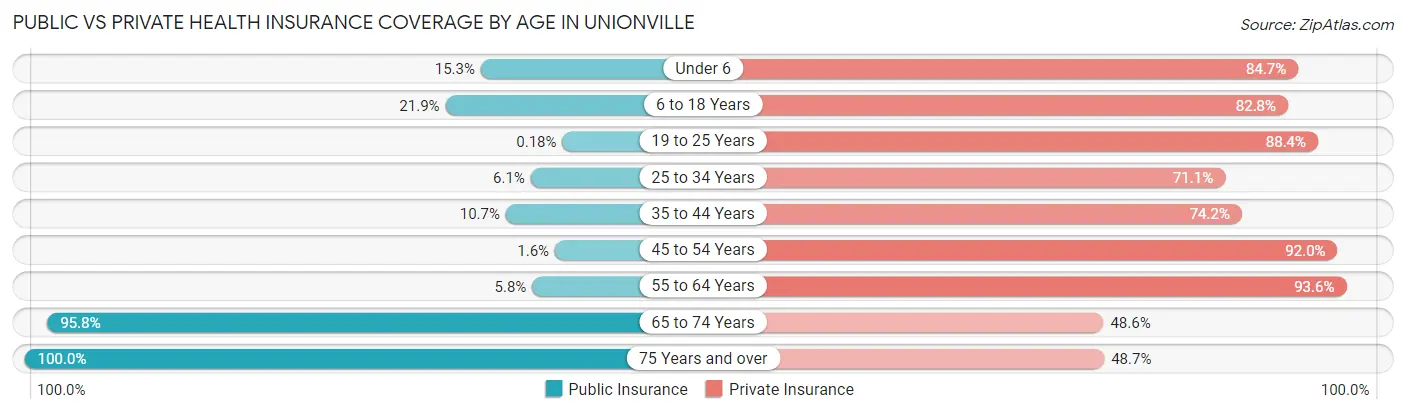
| Age Bracket | Public Insurance | Private Insurance |
| Under 6 | 51 (15.3%) | 282 (84.7%) |
| 6 to 18 Years | 304 (21.9%) | 1,150 (82.8%) |
| 19 to 25 Years | 1 (0.2%) | 501 (88.4%) |
| 25 to 34 Years | 39 (6.1%) | 458 (71.1%) |
| 35 to 44 Years | 90 (10.7%) | 625 (74.2%) |
| 45 to 54 Years | 15 (1.6%) | 884 (92.0%) |
| 55 to 64 Years | 67 (5.8%) | 1,086 (93.6%) |
| 65 to 74 Years | 501 (95.8%) | 254 (48.6%) |
| 75 Years and over | 271 (100.0%) | 132 (48.7%) |
| Total | 1,339 (20.0%) | 5,372 (80.3%) |
Disability Status by Sex by Age in Unionville
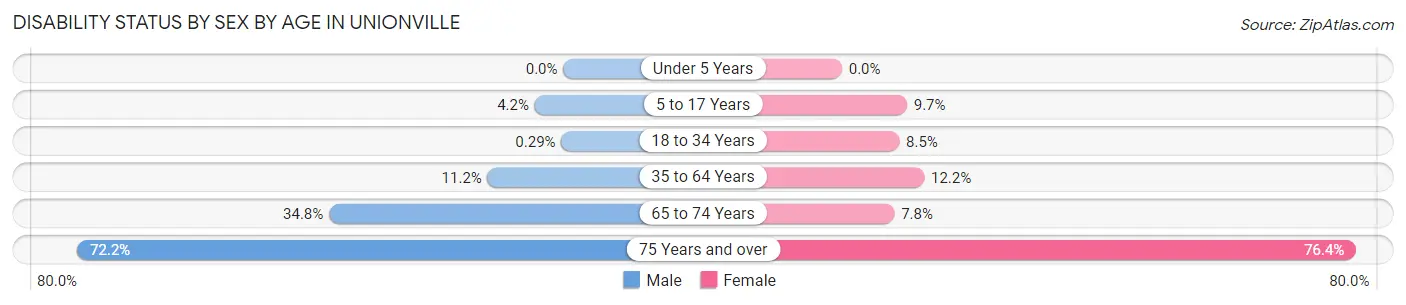
| Age Bracket | Male | Female |
| Under 5 Years | 0 (0.0%) | 0 (0.0%) |
| 5 to 17 Years | 34 (4.2%) | 61 (9.7%) |
| 18 to 34 Years | 2 (0.3%) | 47 (8.5%) |
| 35 to 64 Years | 171 (11.2%) | 176 (12.2%) |
| 65 to 74 Years | 88 (34.8%) | 21 (7.8%) |
| 75 Years and over | 52 (72.2%) | 152 (76.4%) |
Disability Class by Sex by Age in Unionville
Disability Class: Hearing Difficulty
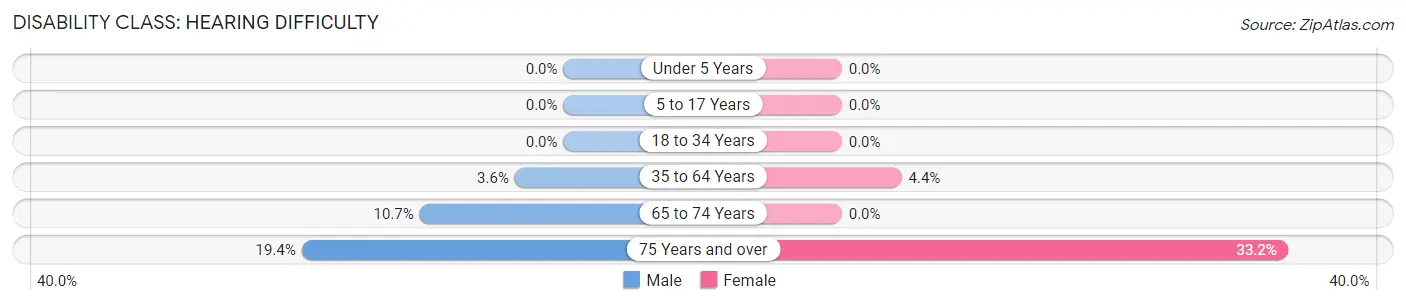
| Age Bracket | Male | Female |
| Under 5 Years | 0 (0.0%) | 0 (0.0%) |
| 5 to 17 Years | 0 (0.0%) | 0 (0.0%) |
| 18 to 34 Years | 0 (0.0%) | 0 (0.0%) |
| 35 to 64 Years | 55 (3.6%) | 64 (4.4%) |
| 65 to 74 Years | 27 (10.7%) | 0 (0.0%) |
| 75 Years and over | 14 (19.4%) | 66 (33.2%) |
Disability Class: Vision Difficulty
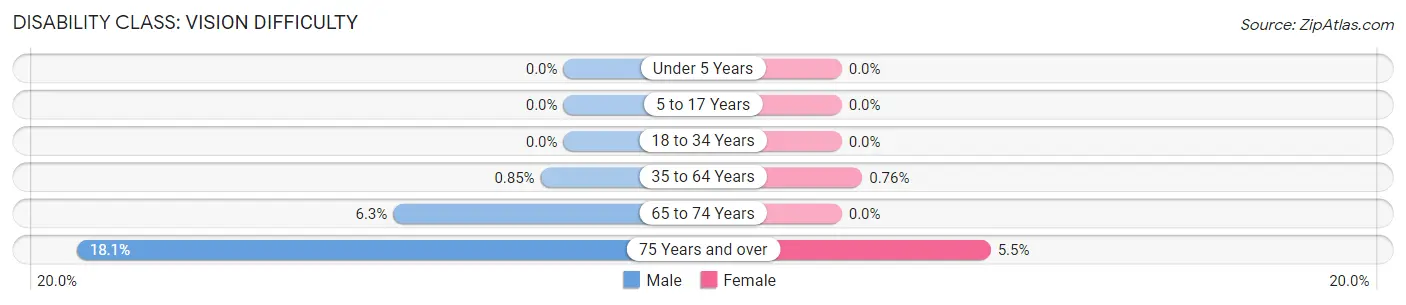
| Age Bracket | Male | Female |
| Under 5 Years | 0 (0.0%) | 0 (0.0%) |
| 5 to 17 Years | 0 (0.0%) | 0 (0.0%) |
| 18 to 34 Years | 0 (0.0%) | 0 (0.0%) |
| 35 to 64 Years | 13 (0.9%) | 11 (0.8%) |
| 65 to 74 Years | 16 (6.3%) | 0 (0.0%) |
| 75 Years and over | 13 (18.1%) | 11 (5.5%) |
Disability Class: Cognitive Difficulty
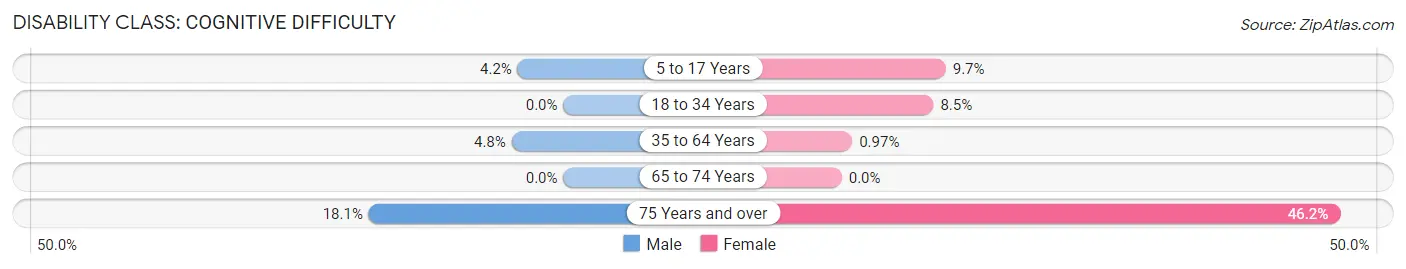
| Age Bracket | Male | Female |
| 5 to 17 Years | 34 (4.2%) | 61 (9.7%) |
| 18 to 34 Years | 0 (0.0%) | 47 (8.5%) |
| 35 to 64 Years | 73 (4.8%) | 14 (1.0%) |
| 65 to 74 Years | 0 (0.0%) | 0 (0.0%) |
| 75 Years and over | 13 (18.1%) | 92 (46.2%) |
Disability Class: Ambulatory Difficulty
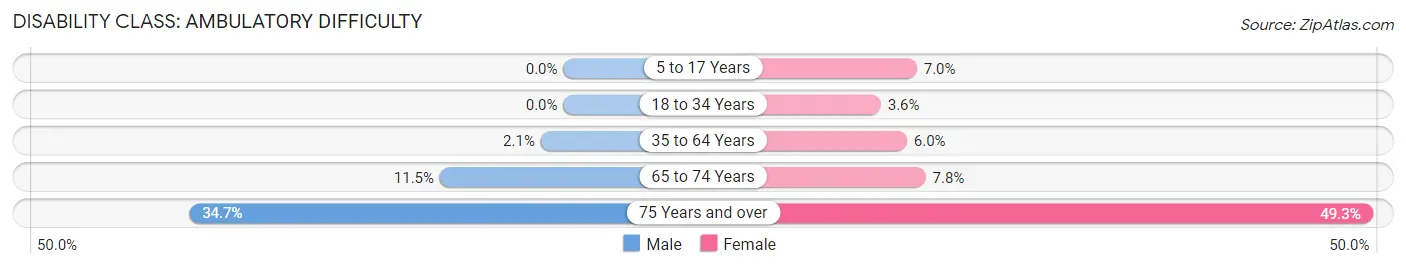
| Age Bracket | Male | Female |
| 5 to 17 Years | 0 (0.0%) | 44 (7.0%) |
| 18 to 34 Years | 0 (0.0%) | 20 (3.6%) |
| 35 to 64 Years | 32 (2.1%) | 87 (6.0%) |
| 65 to 74 Years | 29 (11.5%) | 21 (7.8%) |
| 75 Years and over | 25 (34.7%) | 98 (49.2%) |
Disability Class: Self-Care Difficulty
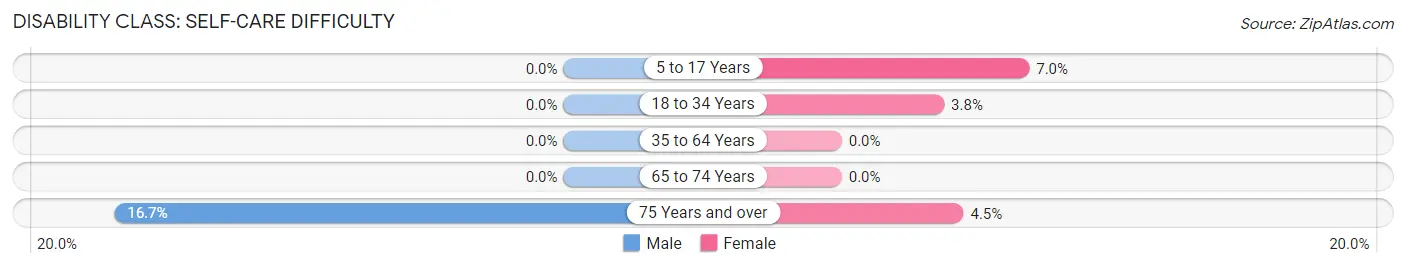
| Age Bracket | Male | Female |
| 5 to 17 Years | 0 (0.0%) | 44 (7.0%) |
| 18 to 34 Years | 0 (0.0%) | 21 (3.8%) |
| 35 to 64 Years | 0 (0.0%) | 0 (0.0%) |
| 65 to 74 Years | 0 (0.0%) | 0 (0.0%) |
| 75 Years and over | 12 (16.7%) | 9 (4.5%) |
Technology Access in Unionville
Computing Device Access in Unionville
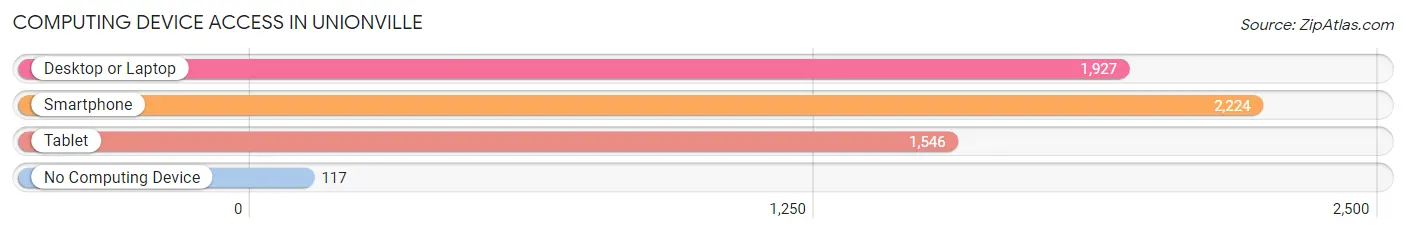
| Device Type | # Households | % Households |
| Desktop or Laptop | 1,927 | 79.4% |
| Smartphone | 2,224 | 91.6% |
| Tablet | 1,546 | 63.7% |
| No Computing Device | 117 | 4.8% |
| Total | 2,428 | 100.0% |
Internet Access in Unionville
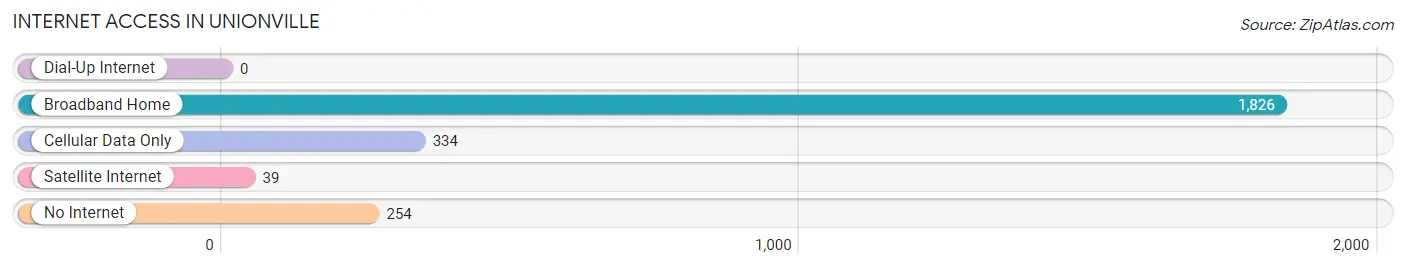
| Internet Type | # Households | % Households |
| Dial-Up Internet | 0 | 0.0% |
| Broadband Home | 1,826 | 75.2% |
| Cellular Data Only | 334 | 13.8% |
| Satellite Internet | 39 | 1.6% |
| No Internet | 254 | 10.5% |
| Total | 2,428 | 100.0% |
Unionville Summary
Introduction
Unionville is a small town located in the western part of North Carolina, in the foothills of the Blue Ridge Mountains. It is situated in the county of Union, and is part of the Charlotte metropolitan area. The town has a population of approximately 2,000 people, and is known for its rural charm and small-town atmosphere.
History
Unionville was founded in 1790 by a group of settlers from the nearby town of Waxhaw. The town was named after the Union Presbyterian Church, which was established in the area in 1788. The church was the first of its kind in the area, and served as a gathering place for the local community.
The town grew slowly over the years, and by the mid-1800s, it had become a thriving agricultural center. The town was home to several cotton mills, and the local economy was largely based on the production of cotton and other agricultural products.
In the late 1800s, the town began to experience a period of growth and development. The railroad arrived in 1891, and the town was incorporated in 1895. The town continued to grow and prosper throughout the 20th century, and today it is a vibrant and thriving community.
Geography
Unionville is located in the western part of North Carolina, in the foothills of the Blue Ridge Mountains. The town is situated in the county of Union, and is part of the Charlotte metropolitan area. The town is located approximately 25 miles west of Charlotte, and is bordered by the towns of Waxhaw, Monroe, and Indian Trail.
The town is situated at an elevation of 830 feet above sea level, and is surrounded by rolling hills and lush forests. The town is located in a temperate climate, with mild winters and hot, humid summers.
Economy
Unionville’s economy is largely based on agriculture and tourism. The town is home to several farms, and the local economy is largely based on the production of cotton, corn, soybeans, and other agricultural products. The town is also home to several wineries, and the local economy is bolstered by the tourism industry.
The town is also home to several small businesses, including restaurants, shops, and other services. The town is also home to several manufacturing companies, and the local economy is bolstered by the presence of these businesses.
Demographics
As of the 2010 census, the population of Unionville was 2,000 people. The town is predominantly white, with approximately 90% of the population identifying as white. The town is also home to a small African American population, with approximately 5% of the population identifying as African American. The town is also home to a small Hispanic population, with approximately 3% of the population identifying as Hispanic or Latino.
Conclusion
Unionville is a small town located in the western part of North Carolina, in the foothills of the Blue Ridge Mountains. The town has a population of approximately 2,000 people, and is known for its rural charm and small-town atmosphere. The town’s economy is largely based on agriculture and tourism, and the local economy is bolstered by the presence of several small businesses. The town is predominantly white, with a small African American and Hispanic population. Unionville is a vibrant and thriving community, and is a great place to live and work.
Common Questions
What is the Total Population of Unionville?
Total Population of Unionville is 6,694.
What is the Total Male Population of Unionville?
Total Male Population of Unionville is 3,504.
What is the Total Female Population of Unionville?
Total Female Population of Unionville is 3,190.
What is the Ratio of Males per 100 Females in Unionville?
There are 109.84 Males per 100 Females in Unionville.
What is the Ratio of Females per 100 Males in Unionville?
There are 91.04 Females per 100 Males in Unionville.
What is the Median Population Age in Unionville?
Median Population Age in Unionville is 39.7 Years.
What is the Average Family Size in Unionville
Average Family Size in Unionville is 3.1 People.
What is the Average Household Size in Unionville
Average Household Size in Unionville is 2.8 People.
What is Per Capita Income in Unionville?
Per Capita income in Unionville is $37,700.
What is the Median Family Income in Unionville?
Median Family Income in Unionville is $98,375.
What is the Median Household income in Unionville?
Median Household Income in Unionville is $90,904.
What is Income or Wage Gap in Unionville?
Income or Wage Gap in Unionville is 28.6%.
Women in Unionville earn 71.4 cents for every dollar earned by a man.
What is Inequality or Gini Index in Unionville?
Inequality or Gini Index in Unionville is 0.36.
How Large is the Labor Force in Unionville?
There are 3,826 People in the Labor Forcein in Unionville.
What is the Percentage of People in the Labor Force in Unionville?
71.7% of People are in the Labor Force in Unionville.
What is the Unemployment Rate in Unionville?
Unemployment Rate in Unionville is 3.6%.