Alliance, NC
Alliance Map
Alliance Overview
842
TOTAL POPULATION
415
MALE POPULATION
427
FEMALE POPULATION
97.19
MALES / 100 FEMALES
102.89
FEMALES / 100 MALES
63.5
MEDIAN AGE
2.9
AVG FAMILY SIZE
2.2
AVG HOUSEHOLD SIZE
$23,186
PER CAPITA INCOME
$63,227
AVG FAMILY INCOME
$39,432
AVG HOUSEHOLD INCOME
35.3%
WAGE / INCOME GAP [ % ]
64.7¢/ $1
WAGE / INCOME GAP [ $ ]
$8,982
FAMILY INCOME DEFICIT
0.45
INEQUALITY / GINI INDEX
259
LABOR FORCE [ PEOPLE ]
33.5%
PERCENT IN LABOR FORCE
6.9%
UNEMPLOYMENT RATE
Alliance Area Codes
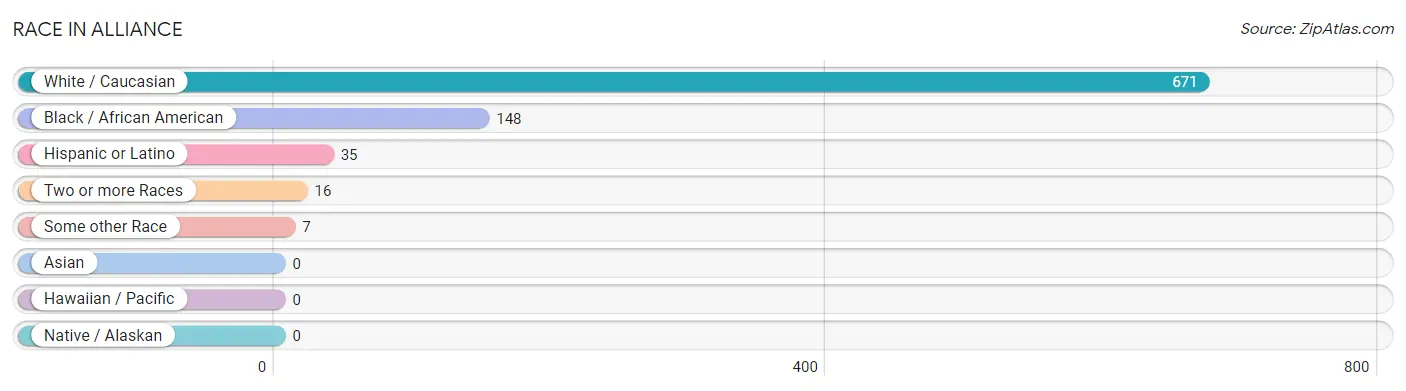
Race in Alliance
The most populous races in Alliance are White / Caucasian (671 | 79.7%), Black / African American (148 | 17.6%), and Hispanic or Latino (35 | 4.2%).
| Race | # Population | % Population |
| Asian | 0 | 0.0% |
| Black / African American | 148 | 17.6% |
| Hawaiian / Pacific | 0 | 0.0% |
| Hispanic or Latino | 35 | 4.2% |
| Native / Alaskan | 0 | 0.0% |
| White / Caucasian | 671 | 79.7% |
| Two or more Races | 16 | 1.9% |
| Some other Race | 7 | 0.8% |
| Total | 842 | 100.0% |
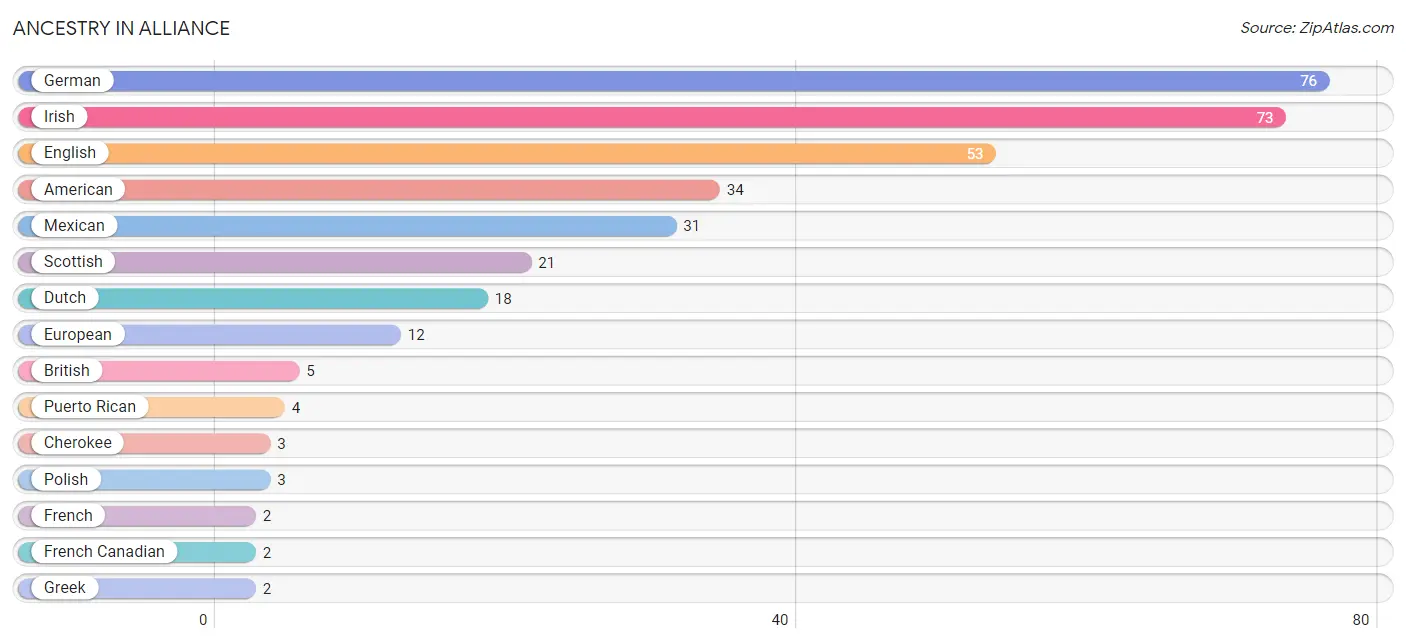
Ancestry in Alliance
The most populous ancestries reported in Alliance are German (76 | 9.0%), Irish (73 | 8.7%), English (53 | 6.3%), American (34 | 4.0%), and Mexican (31 | 3.7%), together accounting for 31.7% of all Alliance residents.
| Ancestry | # Population | % Population |
| African | 1 | 0.1% |
| American | 34 | 4.0% |
| British | 5 | 0.6% |
| Cherokee | 3 | 0.4% |
| Dutch | 18 | 2.1% |
| English | 53 | 6.3% |
| European | 12 | 1.4% |
| French | 2 | 0.2% |
| French Canadian | 2 | 0.2% |
| German | 76 | 9.0% |
| Greek | 2 | 0.2% |
| Irish | 73 | 8.7% |
| Italian | 2 | 0.2% |
| Mexican | 31 | 3.7% |
| Polish | 3 | 0.4% |
| Puerto Rican | 4 | 0.5% |
| Scottish | 21 | 2.5% |
| Subsaharan African | 1 | 0.1% | View All 18 Rows |
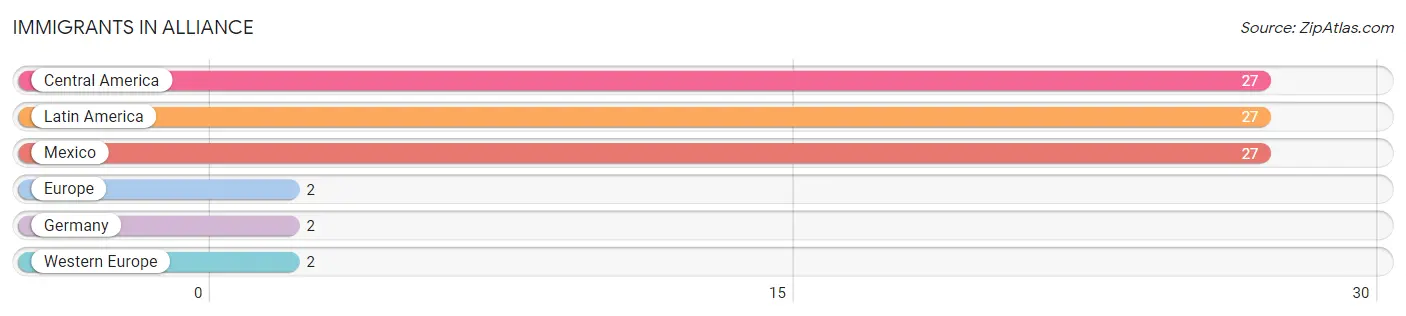
Immigrants in Alliance
The most numerous immigrant groups reported in Alliance came from Central America (27 | 3.2%), Latin America (27 | 3.2%), Mexico (27 | 3.2%), Europe (2 | 0.2%), and Germany (2 | 0.2%), together accounting for 10.1% of all Alliance residents.
| Immigration Origin | # Population | % Population |
| Central America | 27 | 3.2% |
| Europe | 2 | 0.2% |
| Germany | 2 | 0.2% |
| Latin America | 27 | 3.2% |
| Mexico | 27 | 3.2% |
| Western Europe | 2 | 0.2% | View All 6 Rows |
Sex and Age in Alliance
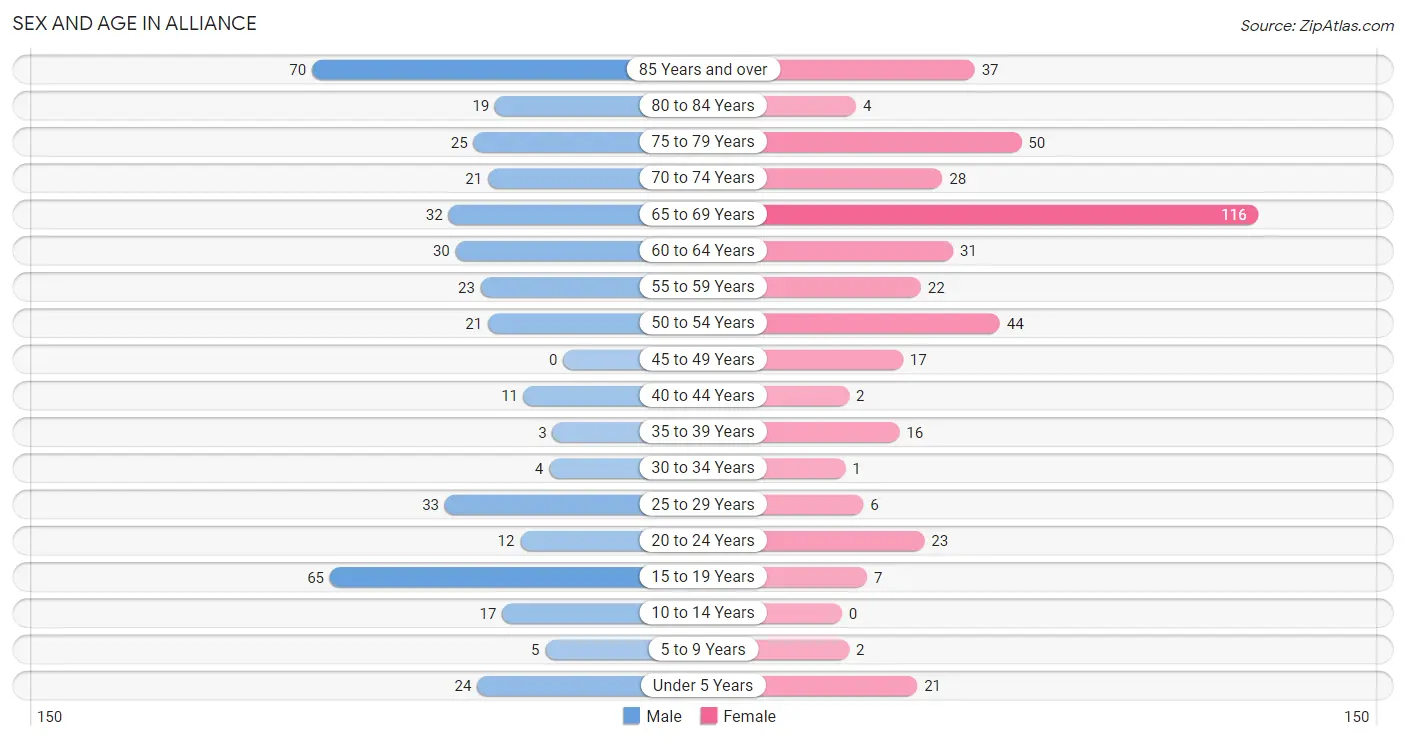
Sex and Age in Alliance
The most populous age groups in Alliance are 85 Years and over (70 | 16.9%) for men and 65 to 69 Years (116 | 27.2%) for women.
| Age Bracket | Male | Female |
| Under 5 Years | 24 (5.8%) | 21 (4.9%) |
| 5 to 9 Years | 5 (1.2%) | 2 (0.5%) |
| 10 to 14 Years | 17 (4.1%) | 0 (0.0%) |
| 15 to 19 Years | 65 (15.7%) | 7 (1.6%) |
| 20 to 24 Years | 12 (2.9%) | 23 (5.4%) |
| 25 to 29 Years | 33 (8.0%) | 6 (1.4%) |
| 30 to 34 Years | 4 (1.0%) | 1 (0.2%) |
| 35 to 39 Years | 3 (0.7%) | 16 (3.7%) |
| 40 to 44 Years | 11 (2.6%) | 2 (0.5%) |
| 45 to 49 Years | 0 (0.0%) | 17 (4.0%) |
| 50 to 54 Years | 21 (5.1%) | 44 (10.3%) |
| 55 to 59 Years | 23 (5.5%) | 22 (5.1%) |
| 60 to 64 Years | 30 (7.2%) | 31 (7.3%) |
| 65 to 69 Years | 32 (7.7%) | 116 (27.2%) |
| 70 to 74 Years | 21 (5.1%) | 28 (6.6%) |
| 75 to 79 Years | 25 (6.0%) | 50 (11.7%) |
| 80 to 84 Years | 19 (4.6%) | 4 (0.9%) |
| 85 Years and over | 70 (16.9%) | 37 (8.7%) |
| Total | 415 (100.0%) | 427 (100.0%) |
Families and Households in Alliance
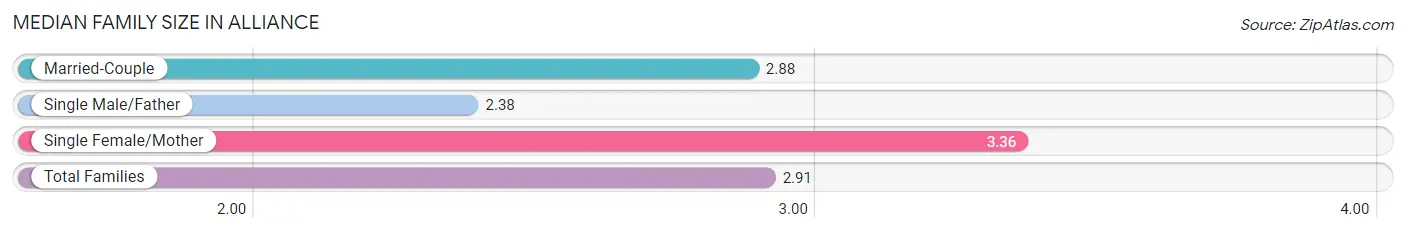
Median Family Size in Alliance
The median family size in Alliance is 2.91 persons per family, with single female/mother families (22 | 10.7%) accounting for the largest median family size of 3.36 persons per family. On the other hand, single male/father families (8 | 3.9%) represent the smallest median family size with 2.38 persons per family.
| Family Type | # Families | Family Size |
| Married-Couple | 176 (85.4%) | 2.88 |
| Single Male/Father | 8 (3.9%) | 2.38 |
| Single Female/Mother | 22 (10.7%) | 3.36 |
| Total Families | 206 (100.0%) | 2.91 |
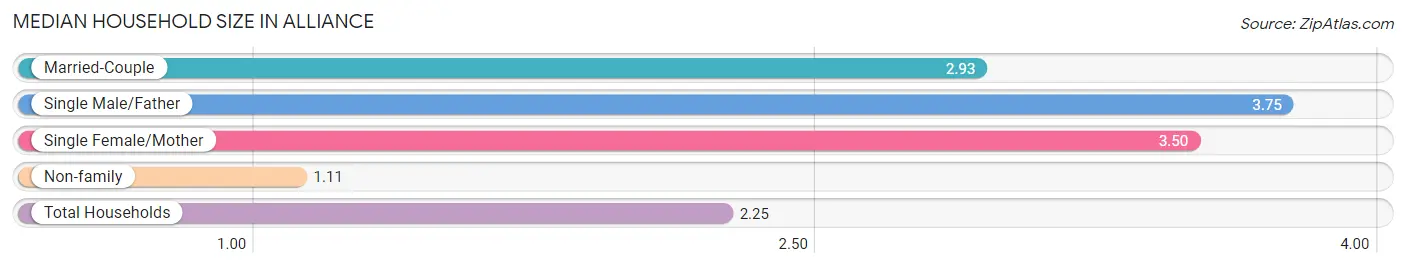
Median Household Size in Alliance
The median household size in Alliance is 2.25 persons per household, with single male/father households (8 | 2.3%) accounting for the largest median household size of 3.75 persons per household. non-family households (139 | 40.3%) represent the smallest median household size with 1.11 persons per household.
| Household Type | # Households | Household Size |
| Married-Couple | 176 (51.0%) | 2.93 |
| Single Male/Father | 8 (2.3%) | 3.75 |
| Single Female/Mother | 22 (6.4%) | 3.50 |
| Non-family | 139 (40.3%) | 1.11 |
| Total Households | 345 (100.0%) | 2.25 |
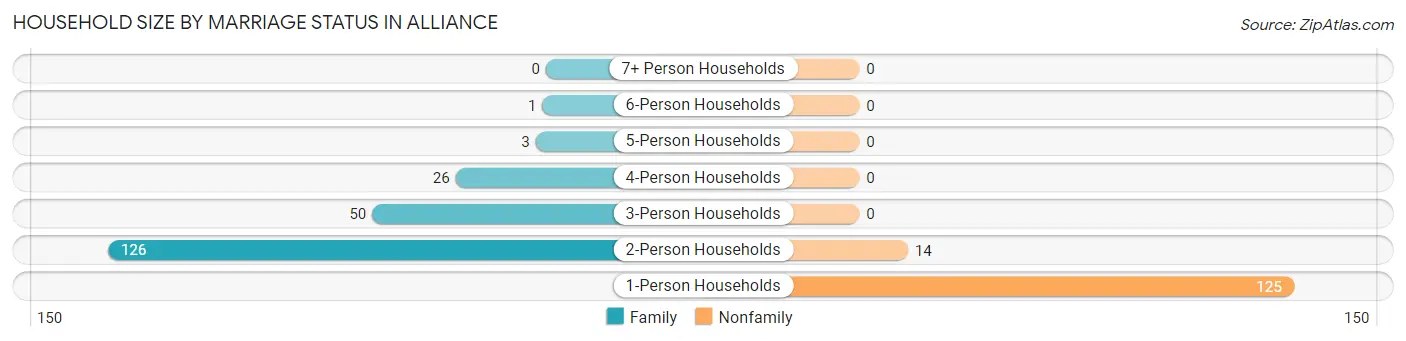
Household Size by Marriage Status in Alliance
Out of a total of 345 households in Alliance, 206 (59.7%) are family households, while 139 (40.3%) are nonfamily households. The most numerous type of family households are 2-person households, comprising 126, and the most common type of nonfamily households are 1-person households, comprising 125.
| Household Size | Family Households | Nonfamily Households |
| 1-Person Households | - | 125 (36.2%) |
| 2-Person Households | 126 (36.5%) | 14 (4.1%) |
| 3-Person Households | 50 (14.5%) | 0 (0.0%) |
| 4-Person Households | 26 (7.5%) | 0 (0.0%) |
| 5-Person Households | 3 (0.9%) | 0 (0.0%) |
| 6-Person Households | 1 (0.3%) | 0 (0.0%) |
| 7+ Person Households | 0 (0.0%) | 0 (0.0%) |
| Total | 206 (59.7%) | 139 (40.3%) |
Female Fertility in Alliance
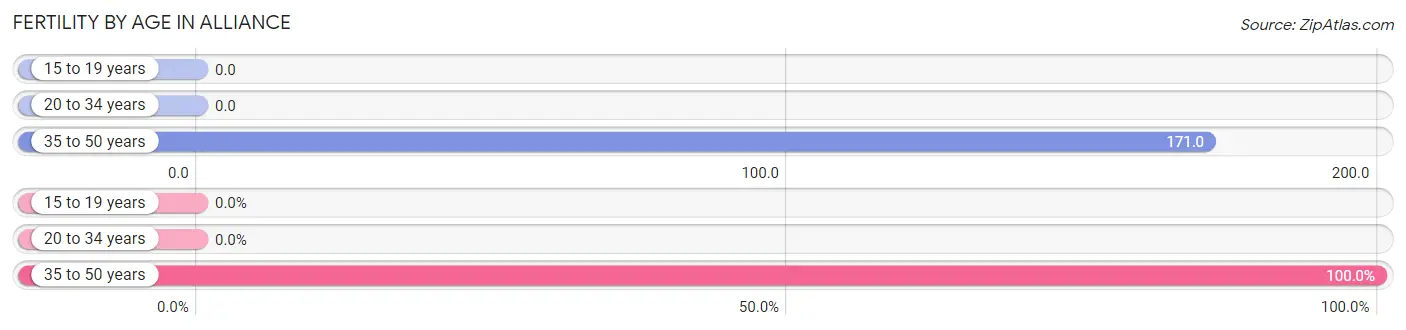
Fertility by Age in Alliance
Average fertility rate in Alliance is 83.0 births per 1,000 women. Women in the age bracket of 35 to 50 years have the highest fertility rate with 171.0 births per 1,000 women. Women in the age bracket of 35 to 50 years acount for 100.0% of all women with births.
| Age Bracket | Women with Births | Births / 1,000 Women |
| 15 to 19 years | 0 (0.0%) | 0.0 |
| 20 to 34 years | 0 (0.0%) | 0.0 |
| 35 to 50 years | 6 (100.0%) | 171.0 |
| Total | 6 (100.0%) | 83.0 |
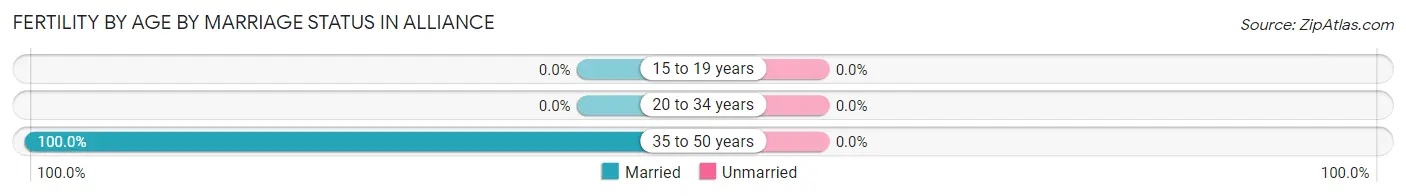
Fertility by Age by Marriage Status in Alliance
| Age Bracket | Married | Unmarried |
| 15 to 19 years | 0 (0.0%) | 0 (0.0%) |
| 20 to 34 years | 0 (0.0%) | 0 (0.0%) |
| 35 to 50 years | 6 (100.0%) | 0 (0.0%) |
| Total | 6 (100.0%) | 0 (0.0%) |
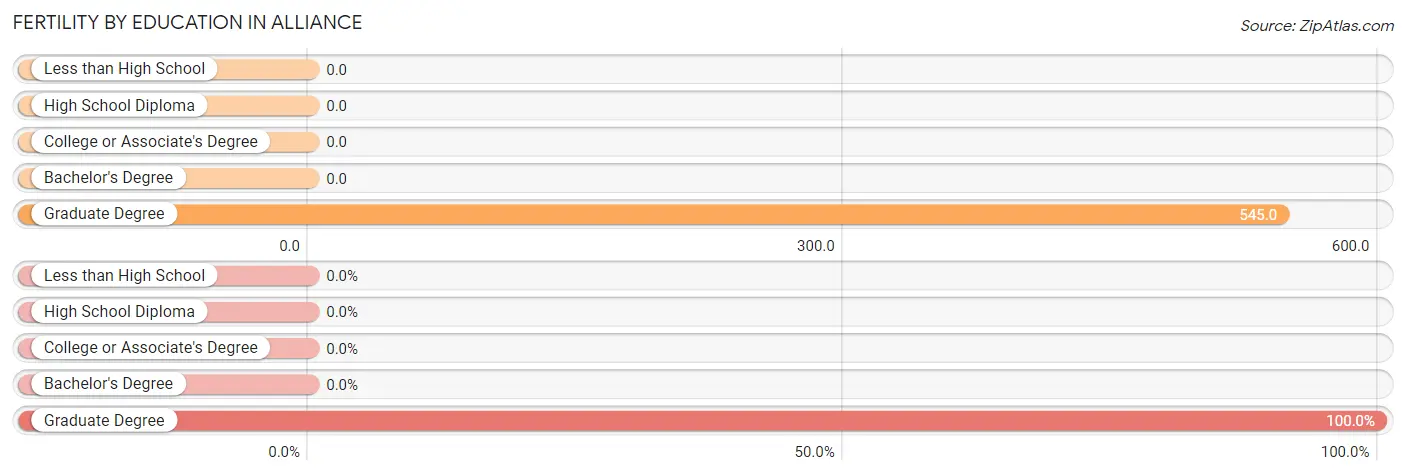
Fertility by Education in Alliance
| Educational Attainment | Women with Births | Births / 1,000 Women |
| Less than High School | 0 (0.0%) | 0.0 |
| High School Diploma | 0 (0.0%) | 0.0 |
| College or Associate's Degree | 0 (0.0%) | 0.0 |
| Bachelor's Degree | 0 (0.0%) | 0.0 |
| Graduate Degree | 6 (100.0%) | 545.0 |
| Total | 6 (100.0%) | 83.0 |
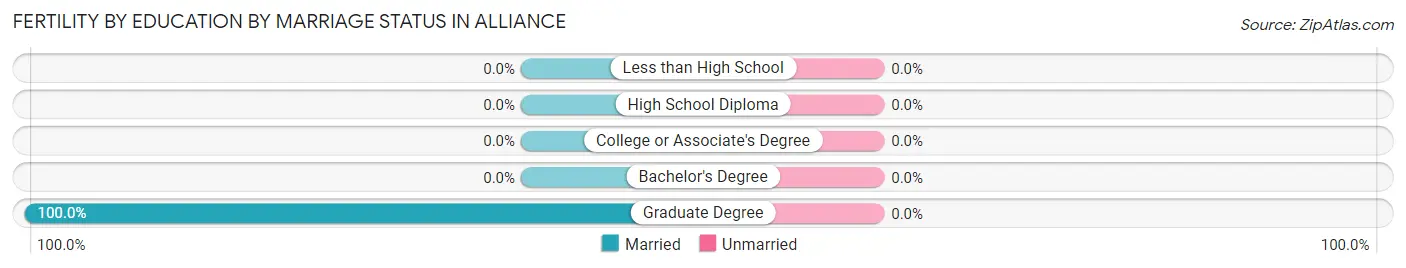
Fertility by Education by Marriage Status in Alliance
| Educational Attainment | Married | Unmarried |
| Less than High School | 0 (0.0%) | 0 (0.0%) |
| High School Diploma | 0 (0.0%) | 0 (0.0%) |
| College or Associate's Degree | 0 (0.0%) | 0 (0.0%) |
| Bachelor's Degree | 0 (0.0%) | 0 (0.0%) |
| Graduate Degree | 6 (100.0%) | 0 (0.0%) |
| Total | 6 (100.0%) | 0 (0.0%) |
Income in Alliance
Income Overview in Alliance
Per Capita Income in Alliance is $23,186, while median incomes of families and households are $63,227 and $39,432 respectively.
| Characteristic | Number | Measure |
| Per Capita Income | 842 | $23,186 |
| Median Family Income | 206 | $63,227 |
| Mean Family Income | 206 | $68,731 |
| Median Household Income | 345 | $39,432 |
| Mean Household Income | 345 | $49,568 |
| Income Deficit | 206 | $8,982 |
| Wage / Income Gap (%) | 842 | 35.26% |
| Wage / Income Gap ($) | 842 | 64.74¢ per $1 |
| Gini / Inequality Index | 842 | 0.45 |
Earnings by Sex in Alliance
Average Earnings in Alliance are $28,657, $32,826 for men and $21,250 for women, a difference of 35.3%.
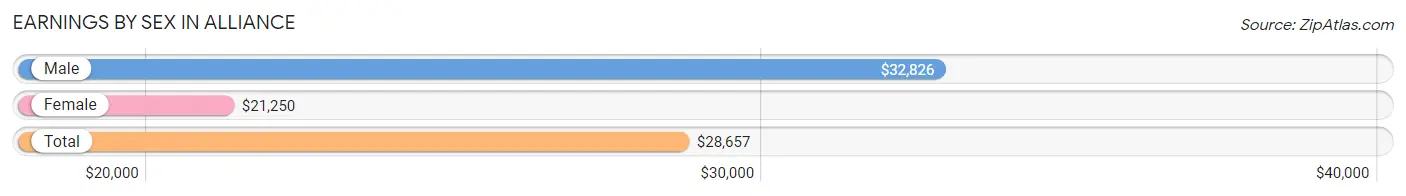
| Sex | Number | Average Earnings |
| Male | 144 (56.0%) | $32,826 |
| Female | 113 (44.0%) | $21,250 |
| Total | 257 (100.0%) | $28,657 |
Earnings by Sex by Income Bracket in Alliance
The most common earnings brackets in Alliance are $30,000 to $34,999 for men (25 | 17.4%) and $15,000 to $17,499 for women (19 | 16.8%).
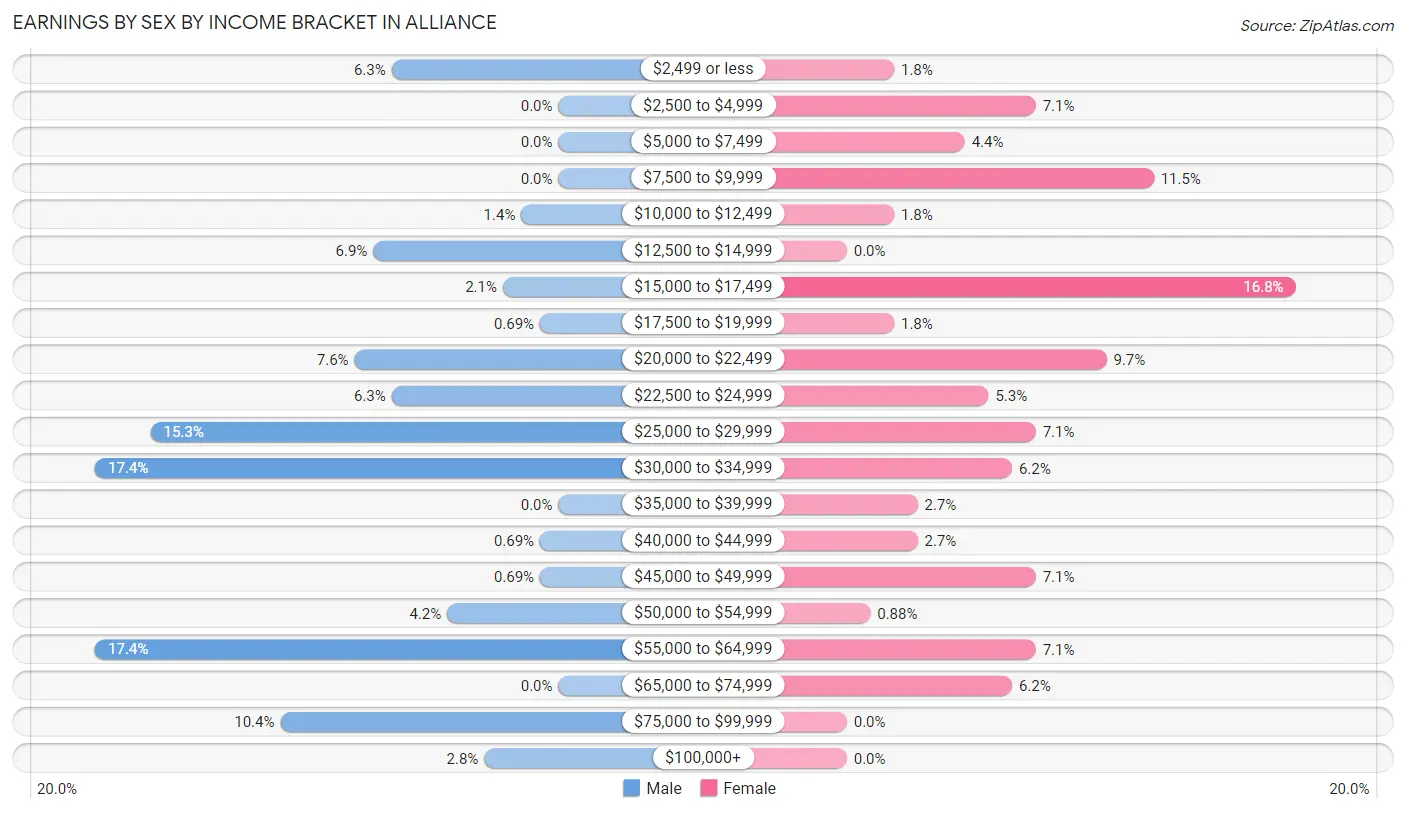
| Income | Male | Female |
| $2,499 or less | 9 (6.2%) | 2 (1.8%) |
| $2,500 to $4,999 | 0 (0.0%) | 8 (7.1%) |
| $5,000 to $7,499 | 0 (0.0%) | 5 (4.4%) |
| $7,500 to $9,999 | 0 (0.0%) | 13 (11.5%) |
| $10,000 to $12,499 | 2 (1.4%) | 2 (1.8%) |
| $12,500 to $14,999 | 10 (6.9%) | 0 (0.0%) |
| $15,000 to $17,499 | 3 (2.1%) | 19 (16.8%) |
| $17,500 to $19,999 | 1 (0.7%) | 2 (1.8%) |
| $20,000 to $22,499 | 11 (7.6%) | 11 (9.7%) |
| $22,500 to $24,999 | 9 (6.2%) | 6 (5.3%) |
| $25,000 to $29,999 | 22 (15.3%) | 8 (7.1%) |
| $30,000 to $34,999 | 25 (17.4%) | 7 (6.2%) |
| $35,000 to $39,999 | 0 (0.0%) | 3 (2.6%) |
| $40,000 to $44,999 | 1 (0.7%) | 3 (2.6%) |
| $45,000 to $49,999 | 1 (0.7%) | 8 (7.1%) |
| $50,000 to $54,999 | 6 (4.2%) | 1 (0.9%) |
| $55,000 to $64,999 | 25 (17.4%) | 8 (7.1%) |
| $65,000 to $74,999 | 0 (0.0%) | 7 (6.2%) |
| $75,000 to $99,999 | 15 (10.4%) | 0 (0.0%) |
| $100,000+ | 4 (2.8%) | 0 (0.0%) |
| Total | 144 (100.0%) | 113 (100.0%) |
Earnings by Sex by Educational Attainment in Alliance
Average earnings in Alliance are $33,929 for men and $23,750 for women, a difference of 30.0%. Men with an educational attainment of bachelor's degree enjoy the highest average annual earnings of $63,333, while those with college or associate's degree education earn the least with $34,286. Women with an educational attainment of college or associate's degree earn the most with the average annual earnings of $40,833, while those with high school diploma education have the smallest earnings of $8,077.
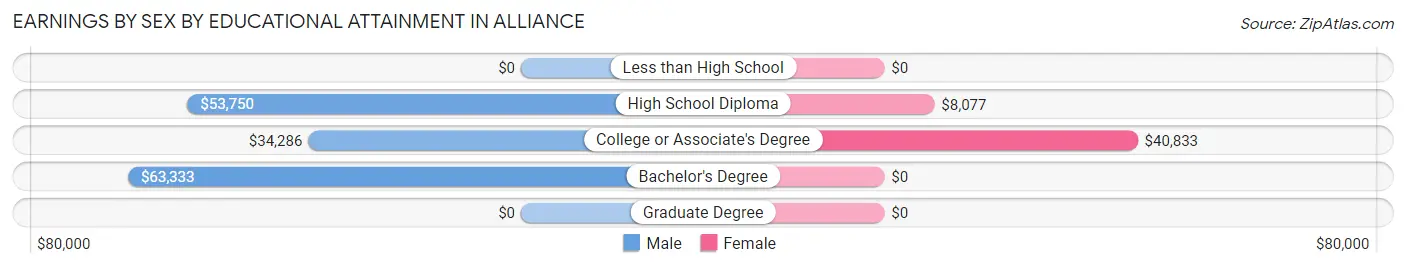
| Educational Attainment | Male Income | Female Income |
| Less than High School | - | - |
| High School Diploma | $53,750 | $8,077 |
| College or Associate's Degree | $34,286 | $40,833 |
| Bachelor's Degree | $63,333 | $0 |
| Graduate Degree | - | - |
| Total | $33,929 | $23,750 |
Family Income in Alliance
Family Income Brackets in Alliance
According to the Alliance family income data, there are 88 families falling into the $50,000 to $74,999 income range, which is the most common income bracket and makes up 42.7% of all families.
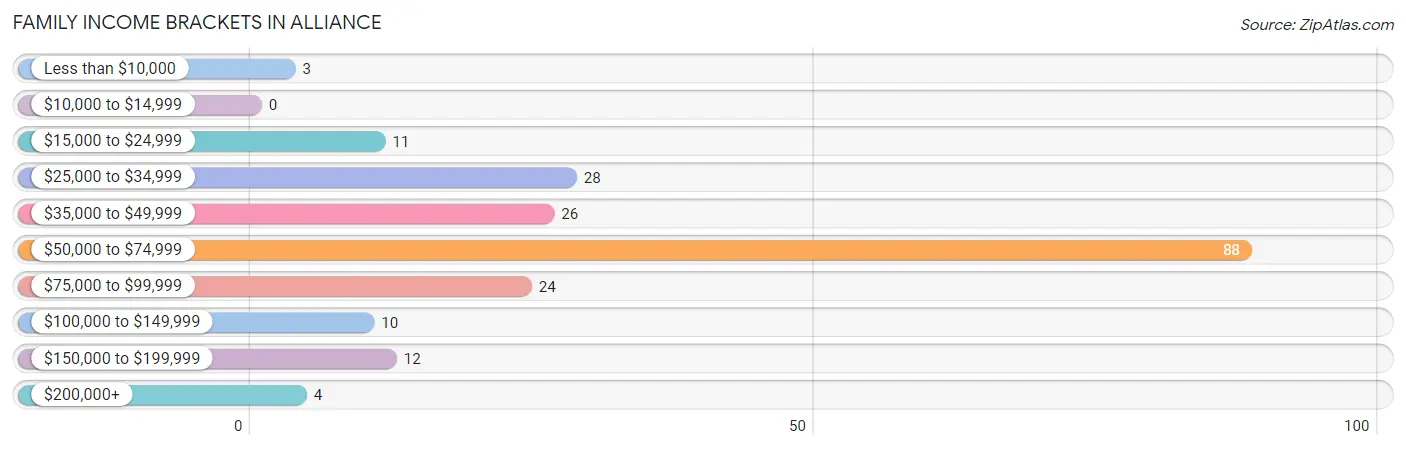
| Income Bracket | # Families | % Families |
| Less than $10,000 | 3 | 1.5% |
| $10,000 to $14,999 | 0 | 0.0% |
| $15,000 to $24,999 | 11 | 5.3% |
| $25,000 to $34,999 | 28 | 13.6% |
| $35,000 to $49,999 | 26 | 12.6% |
| $50,000 to $74,999 | 88 | 42.7% |
| $75,000 to $99,999 | 24 | 11.7% |
| $100,000 to $149,999 | 10 | 4.9% |
| $150,000 to $199,999 | 12 | 5.8% |
| $200,000+ | 4 | 1.9% |
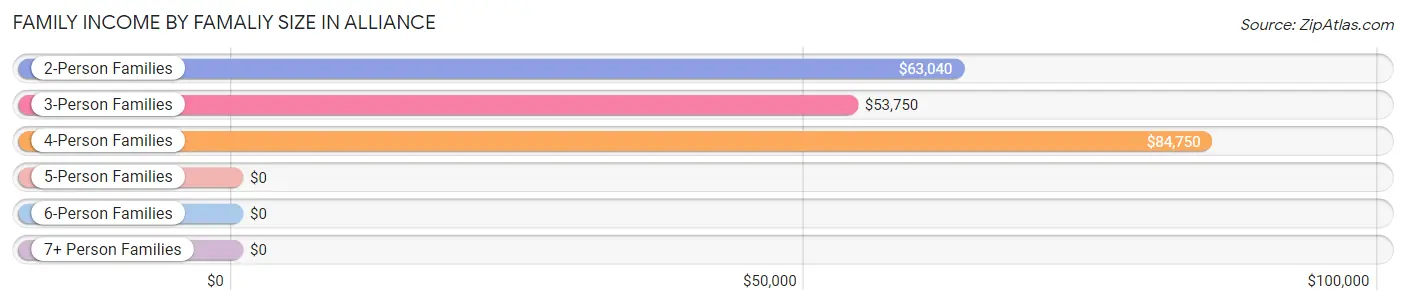
Family Income by Famaliy Size in Alliance
4-person families (21 | 10.2%) account for the highest median family income in Alliance with $84,750 per family, while 2-person families (135 | 65.5%) have the highest median income of $31,520 per family member.
| Income Bracket | # Families | Median Income |
| 2-Person Families | 135 (65.5%) | $63,040 |
| 3-Person Families | 46 (22.3%) | $53,750 |
| 4-Person Families | 21 (10.2%) | $84,750 |
| 5-Person Families | 3 (1.5%) | $0 |
| 6-Person Families | 1 (0.5%) | $0 |
| 7+ Person Families | 0 (0.0%) | $0 |
| Total | 206 (100.0%) | $63,227 |
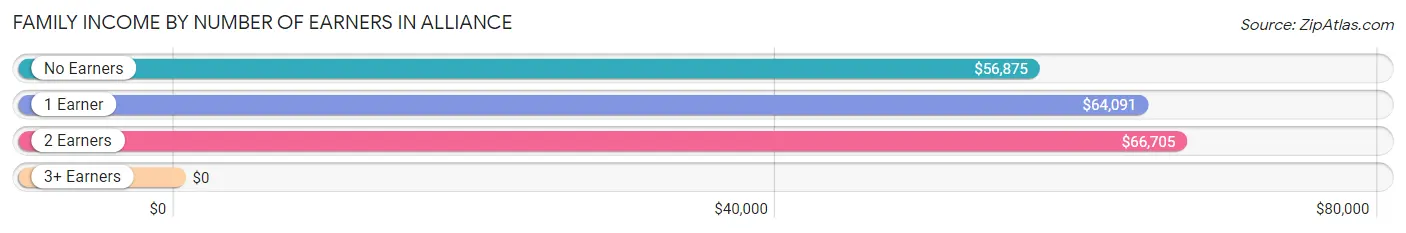
Family Income by Number of Earners in Alliance
| Number of Earners | # Families | Median Income |
| No Earners | 103 (50.0%) | $56,875 |
| 1 Earner | 34 (16.5%) | $64,091 |
| 2 Earners | 63 (30.6%) | $66,705 |
| 3+ Earners | 6 (2.9%) | $0 |
| Total | 206 (100.0%) | $63,227 |
Household Income in Alliance
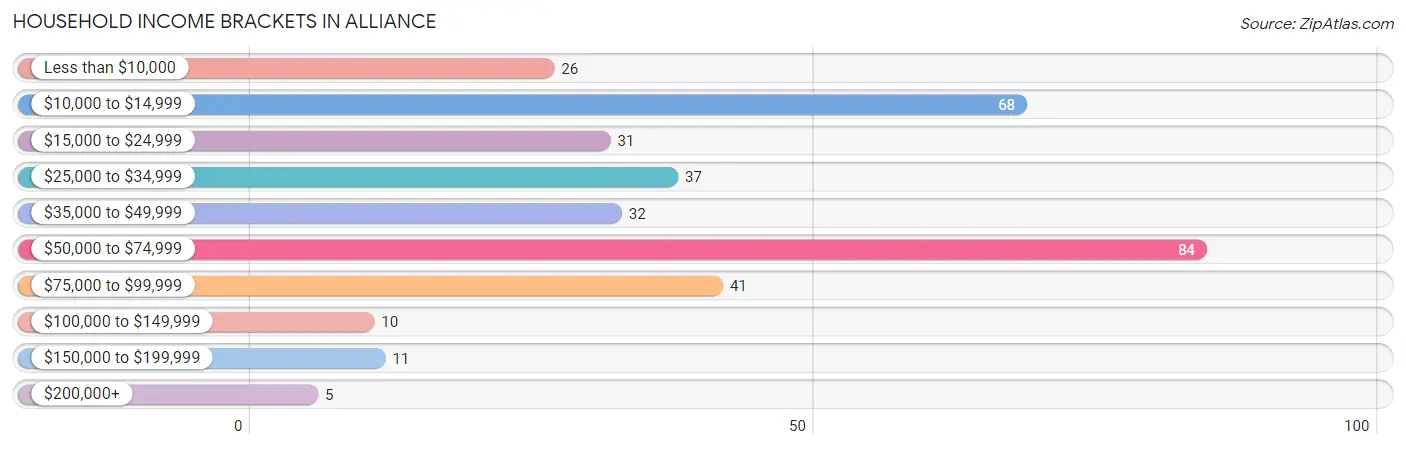
Household Income Brackets in Alliance
With 84 households falling in the category, the $50,000 to $74,999 income range is the most frequent in Alliance, accounting for 24.3% of all households. In contrast, only 5 households (1.5%) fall into the $200,000+ income bracket, making it the least populous group.
| Income Bracket | # Households | % Households |
| Less than $10,000 | 26 | 7.5% |
| $10,000 to $14,999 | 68 | 19.7% |
| $15,000 to $24,999 | 31 | 9.0% |
| $25,000 to $34,999 | 37 | 10.7% |
| $35,000 to $49,999 | 32 | 9.3% |
| $50,000 to $74,999 | 84 | 24.3% |
| $75,000 to $99,999 | 41 | 11.9% |
| $100,000 to $149,999 | 10 | 2.9% |
| $150,000 to $199,999 | 11 | 3.2% |
| $200,000+ | 5 | 1.4% |
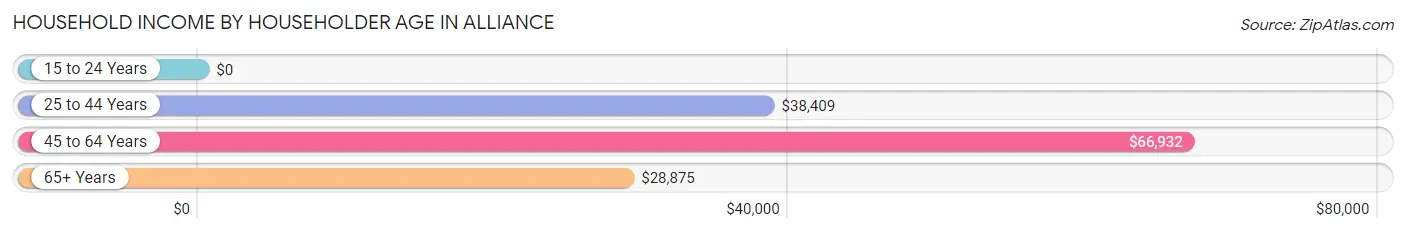
Household Income by Householder Age in Alliance
The median household income in Alliance is $39,432, with the highest median household income of $66,932 found in the 45 to 64 years age bracket for the primary householder. A total of 103 households (29.9%) fall into this category.
| Income Bracket | # Households | Median Income |
| 15 to 24 Years | 0 (0.0%) | $0 |
| 25 to 44 Years | 36 (10.4%) | $38,409 |
| 45 to 64 Years | 103 (29.9%) | $66,932 |
| 65+ Years | 206 (59.7%) | $28,875 |
| Total | 345 (100.0%) | $39,432 |
Poverty in Alliance
Income Below Poverty by Sex and Age in Alliance
With 14.9% poverty level for males and 26.0% for females among the residents of Alliance, 5 year old males and 35 to 44 year old females are the most vulnerable to poverty, with 1 males (100.0%) and 11 females (61.1%) in their respective age groups living below the poverty level.
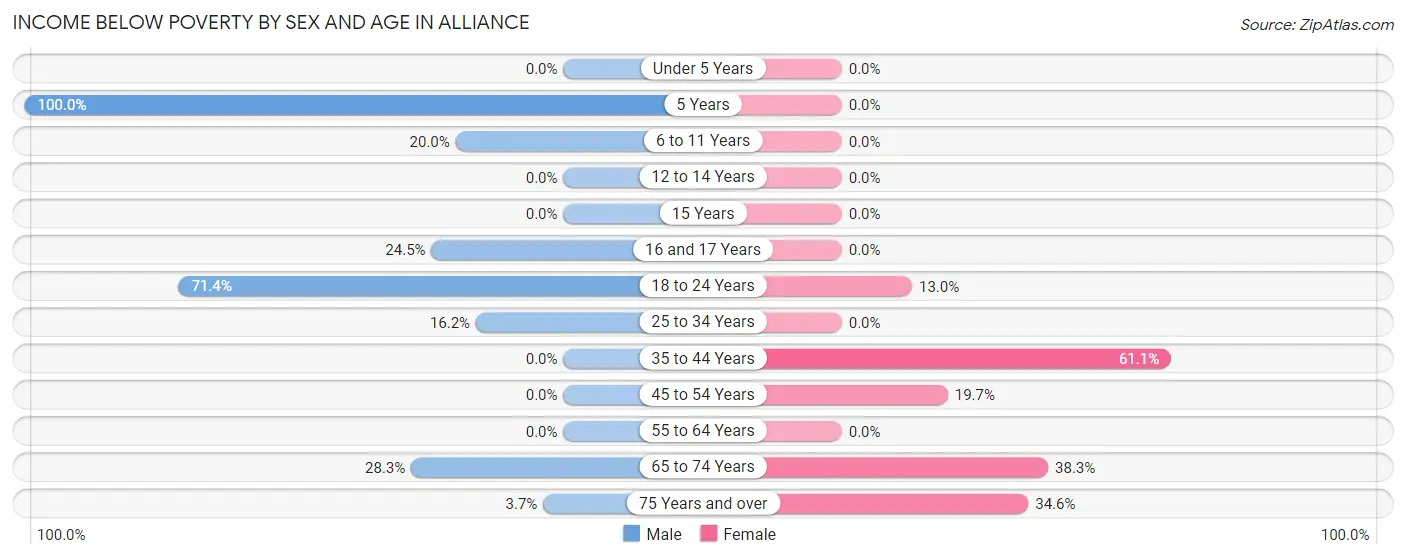
| Age Bracket | Male | Female |
| Under 5 Years | 0 (0.0%) | 0 (0.0%) |
| 5 Years | 1 (100.0%) | 0 (0.0%) |
| 6 to 11 Years | 3 (20.0%) | 0 (0.0%) |
| 12 to 14 Years | 0 (0.0%) | 0 (0.0%) |
| 15 Years | 0 (0.0%) | 0 (0.0%) |
| 16 and 17 Years | 12 (24.5%) | 0 (0.0%) |
| 18 to 24 Years | 20 (71.4%) | 3 (13.0%) |
| 25 to 34 Years | 6 (16.2%) | 0 (0.0%) |
| 35 to 44 Years | 0 (0.0%) | 11 (61.1%) |
| 45 to 54 Years | 0 (0.0%) | 12 (19.7%) |
| 55 to 64 Years | 0 (0.0%) | 0 (0.0%) |
| 65 to 74 Years | 13 (28.3%) | 54 (38.3%) |
| 75 Years and over | 4 (3.7%) | 27 (34.6%) |
| Total | 59 (14.9%) | 107 (26.0%) |
Income Above Poverty by Sex and Age in Alliance
According to the poverty statistics in Alliance, males aged under 5 years and females aged under 5 years are the age groups that are most secure financially, with 100.0% of males and 100.0% of females in these age groups living above the poverty line.
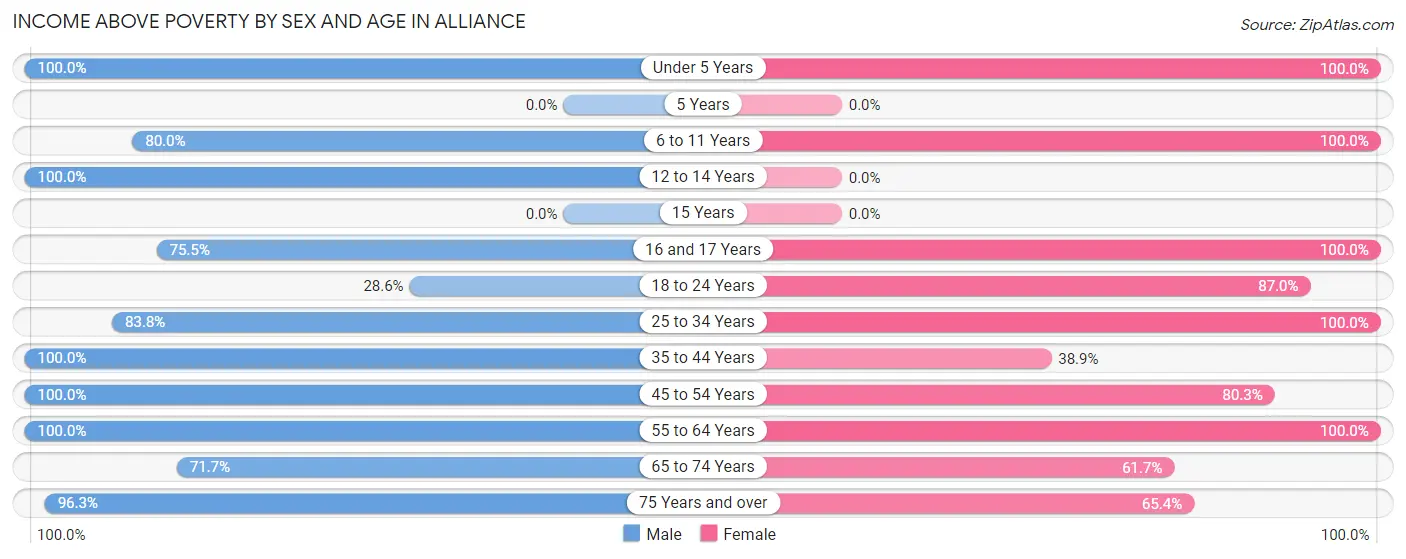
| Age Bracket | Male | Female |
| Under 5 Years | 24 (100.0%) | 21 (100.0%) |
| 5 Years | 0 (0.0%) | 0 (0.0%) |
| 6 to 11 Years | 12 (80.0%) | 2 (100.0%) |
| 12 to 14 Years | 6 (100.0%) | 0 (0.0%) |
| 15 Years | 0 (0.0%) | 0 (0.0%) |
| 16 and 17 Years | 37 (75.5%) | 7 (100.0%) |
| 18 to 24 Years | 8 (28.6%) | 20 (87.0%) |
| 25 to 34 Years | 31 (83.8%) | 7 (100.0%) |
| 35 to 44 Years | 14 (100.0%) | 7 (38.9%) |
| 45 to 54 Years | 21 (100.0%) | 49 (80.3%) |
| 55 to 64 Years | 49 (100.0%) | 53 (100.0%) |
| 65 to 74 Years | 33 (71.7%) | 87 (61.7%) |
| 75 Years and over | 103 (96.3%) | 51 (65.4%) |
| Total | 338 (85.1%) | 304 (74.0%) |
Income Below Poverty Among Married-Couple Families in Alliance
| Children | Above Poverty | Below Poverty |
| No Children | 134 (100.0%) | 0 (0.0%) |
| 1 or 2 Children | 41 (100.0%) | 0 (0.0%) |
| 3 or 4 Children | 1 (100.0%) | 0 (0.0%) |
| 5 or more Children | 0 (0.0%) | 0 (0.0%) |
| Total | 176 (100.0%) | 0 (0.0%) |
Income Below Poverty Among Single-Parent Households in Alliance
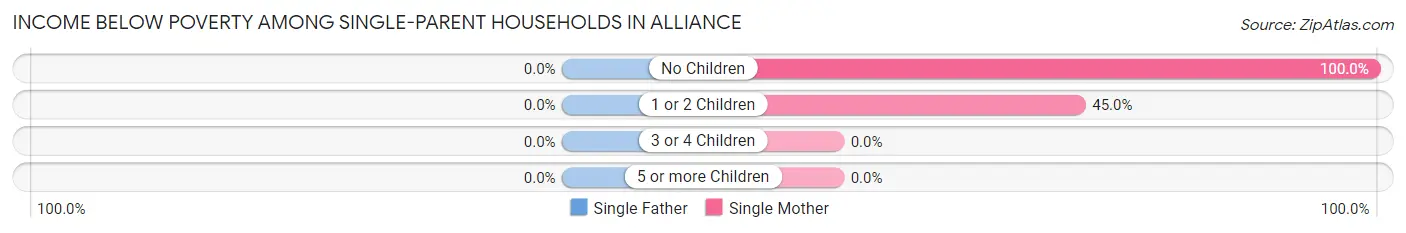
| Children | Single Father | Single Mother |
| No Children | 0 (0.0%) | 2 (100.0%) |
| 1 or 2 Children | 0 (0.0%) | 9 (45.0%) |
| 3 or 4 Children | 0 (0.0%) | 0 (0.0%) |
| 5 or more Children | 0 (0.0%) | 0 (0.0%) |
| Total | 0 (0.0%) | 11 (50.0%) |
Income Below Poverty Among Married-Couple vs Single-Parent Households in Alliance
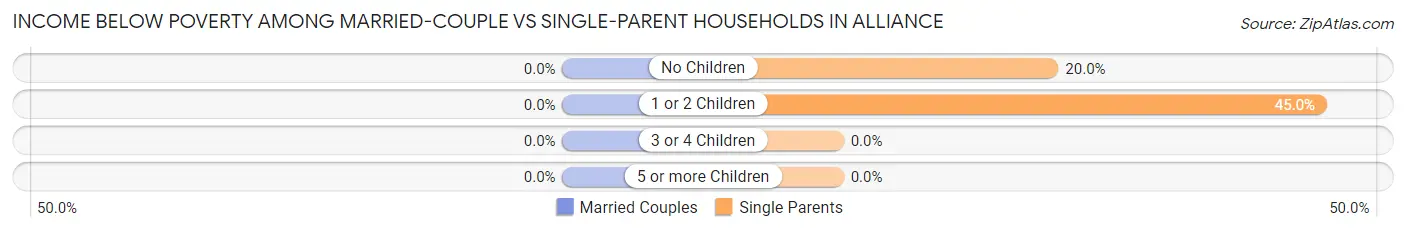
| Children | Married-Couple Families | Single-Parent Households |
| No Children | 0 (0.0%) | 2 (20.0%) |
| 1 or 2 Children | 0 (0.0%) | 9 (45.0%) |
| 3 or 4 Children | 0 (0.0%) | 0 (0.0%) |
| 5 or more Children | 0 (0.0%) | 0 (0.0%) |
| Total | 0 (0.0%) | 11 (36.7%) |
Employment Characteristics in Alliance
Employment by Class of Employer in Alliance
Among the 241 employed individuals in Alliance, private company employees (160 | 66.4%), self-employed (not incorporated) (34 | 14.1%), and state government employees (20 | 8.3%) make up the most common classes of employment.
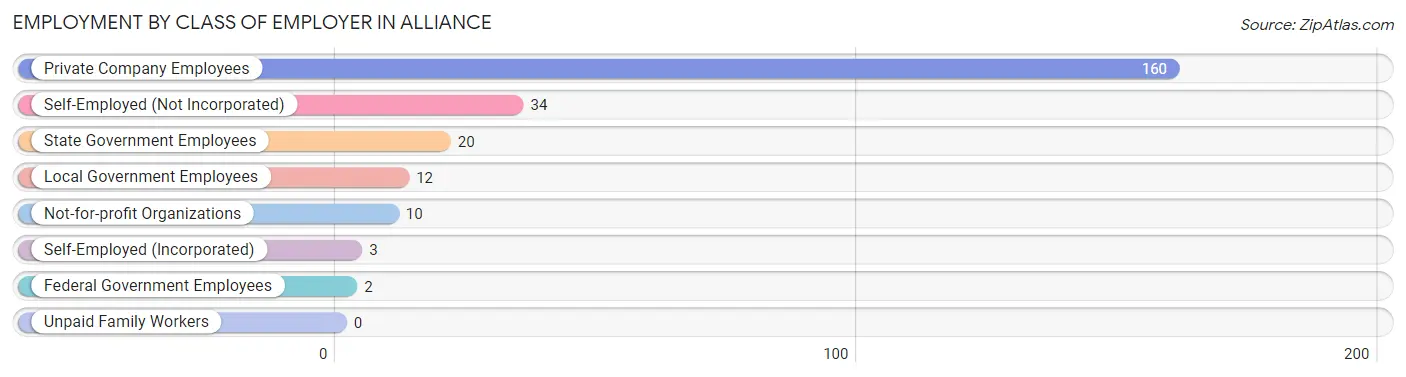
| Employer Class | # Employees | % Employees |
| Private Company Employees | 160 | 66.4% |
| Self-Employed (Incorporated) | 3 | 1.2% |
| Self-Employed (Not Incorporated) | 34 | 14.1% |
| Not-for-profit Organizations | 10 | 4.2% |
| Local Government Employees | 12 | 5.0% |
| State Government Employees | 20 | 8.3% |
| Federal Government Employees | 2 | 0.8% |
| Unpaid Family Workers | 0 | 0.0% |
| Total | 241 | 100.0% |
Employment Status by Age in Alliance
According to the labor force statistics for Alliance, out of the total population over 16 years of age (773), 33.5% or 259 individuals are in the labor force, with 6.9% or 18 of them unemployed. The age group with the highest labor force participation rate is 20 to 24 years, with 100.0% or 35 individuals in the labor force. Within the labor force, the 16 to 19 years age range has the highest percentage of unemployed individuals, with 30.4% or 7 of them being unemployed.
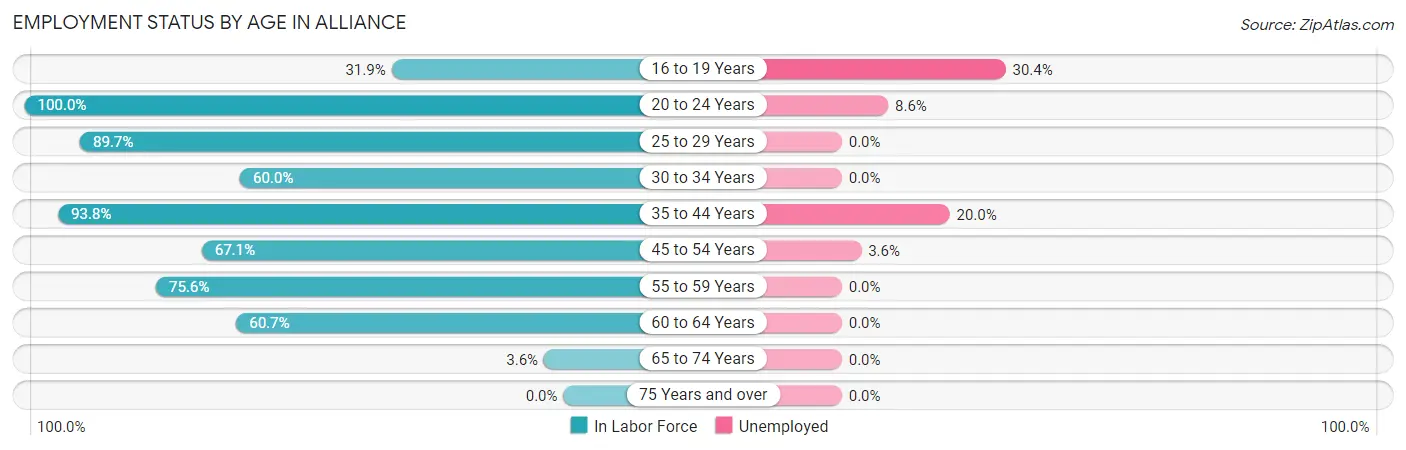
| Age Bracket | In Labor Force | Unemployed |
| 16 to 19 Years | 23 (31.9%) | 7 (30.4%) |
| 20 to 24 Years | 35 (100.0%) | 3 (8.6%) |
| 25 to 29 Years | 35 (89.7%) | 0 (0.0%) |
| 30 to 34 Years | 3 (60.0%) | 0 (0.0%) |
| 35 to 44 Years | 30 (93.8%) | 6 (20.0%) |
| 45 to 54 Years | 55 (67.1%) | 2 (3.6%) |
| 55 to 59 Years | 34 (75.6%) | 0 (0.0%) |
| 60 to 64 Years | 37 (60.7%) | 0 (0.0%) |
| 65 to 74 Years | 7 (3.6%) | 0 (0.0%) |
| 75 Years and over | 0 (0.0%) | 0 (0.0%) |
| Total | 259 (33.5%) | 18 (6.9%) |
Employment Status by Educational Attainment in Alliance
According to labor force statistics for Alliance, 73.5% of individuals (194) out of the total population between 25 and 64 years of age (264) are in the labor force, with 4.1% or 8 of them being unemployed. The group with the highest labor force participation rate are those with the educational attainment of college / associate degree, with 91.3% or 94 individuals in the labor force. Within the labor force, individuals with high school diploma education have the highest percentage of unemployment, with 5.5% or 3 of them being unemployed.
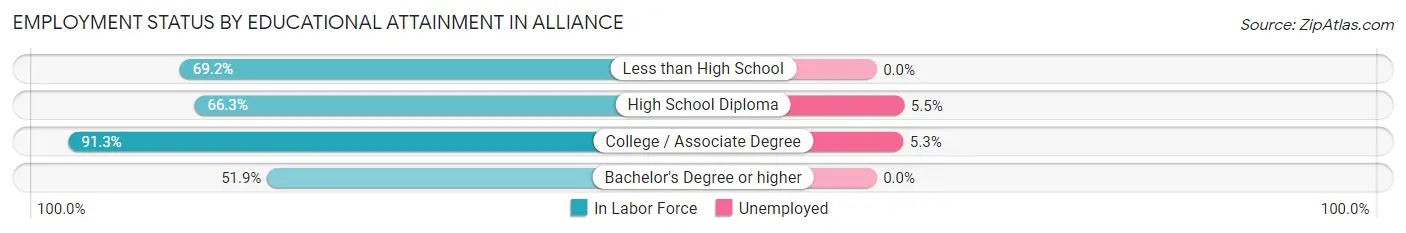
| Educational Attainment | In Labor Force | Unemployed |
| Less than High School | 18 (69.2%) | 0 (0.0%) |
| High School Diploma | 55 (66.3%) | 5 (5.5%) |
| College / Associate Degree | 94 (91.3%) | 5 (5.3%) |
| Bachelor's Degree or higher | 27 (51.9%) | 0 (0.0%) |
| Total | 194 (73.5%) | 11 (4.1%) |
Employment Occupations by Sex in Alliance
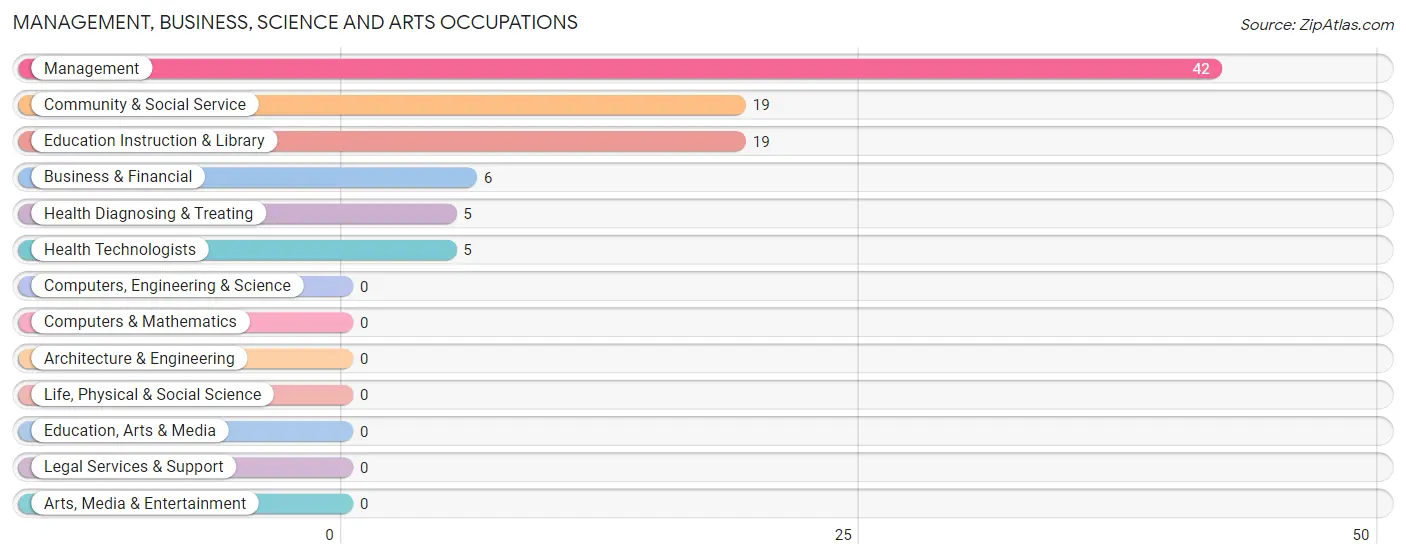
Management, Business, Science and Arts Occupations
The most common Management, Business, Science and Arts occupations in Alliance are Management (42 | 17.4%), Community & Social Service (19 | 7.9%), Education Instruction & Library (19 | 7.9%), Business & Financial (6 | 2.5%), and Health Diagnosing & Treating (5 | 2.1%).
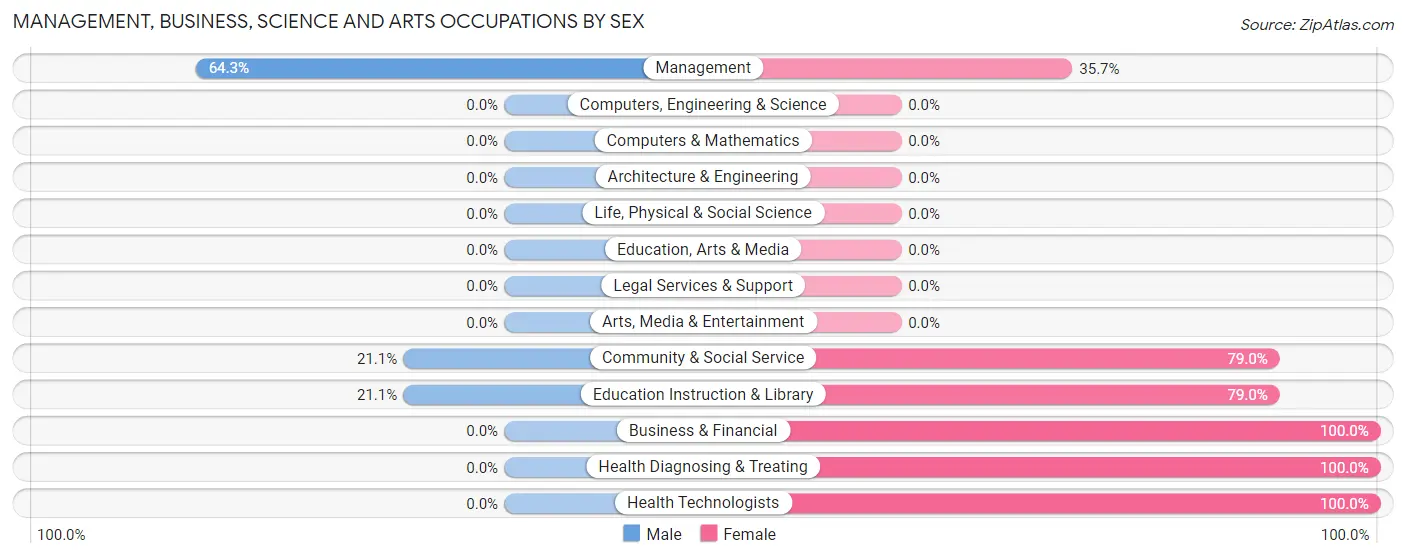
Management, Business, Science and Arts Occupations by Sex
Within the Management, Business, Science and Arts occupations in Alliance, the most male-oriented occupations are Management (64.3%), Community & Social Service (21.0%), and Education Instruction & Library (21.0%), while the most female-oriented occupations are Business & Financial (100.0%), Health Diagnosing & Treating (100.0%), and Health Technologists (100.0%).
| Occupation | Male | Female |
| Management | 27 (64.3%) | 15 (35.7%) |
| Business & Financial | 0 (0.0%) | 6 (100.0%) |
| Computers, Engineering & Science | 0 (0.0%) | 0 (0.0%) |
| Computers & Mathematics | 0 (0.0%) | 0 (0.0%) |
| Architecture & Engineering | 0 (0.0%) | 0 (0.0%) |
| Life, Physical & Social Science | 0 (0.0%) | 0 (0.0%) |
| Community & Social Service | 4 (21.0%) | 15 (78.9%) |
| Education, Arts & Media | 0 (0.0%) | 0 (0.0%) |
| Legal Services & Support | 0 (0.0%) | 0 (0.0%) |
| Education Instruction & Library | 4 (21.0%) | 15 (78.9%) |
| Arts, Media & Entertainment | 0 (0.0%) | 0 (0.0%) |
| Health Diagnosing & Treating | 0 (0.0%) | 5 (100.0%) |
| Health Technologists | 0 (0.0%) | 5 (100.0%) |
| Total (Category) | 31 (43.1%) | 41 (56.9%) |
| Total (Overall) | 130 (53.9%) | 111 (46.1%) |
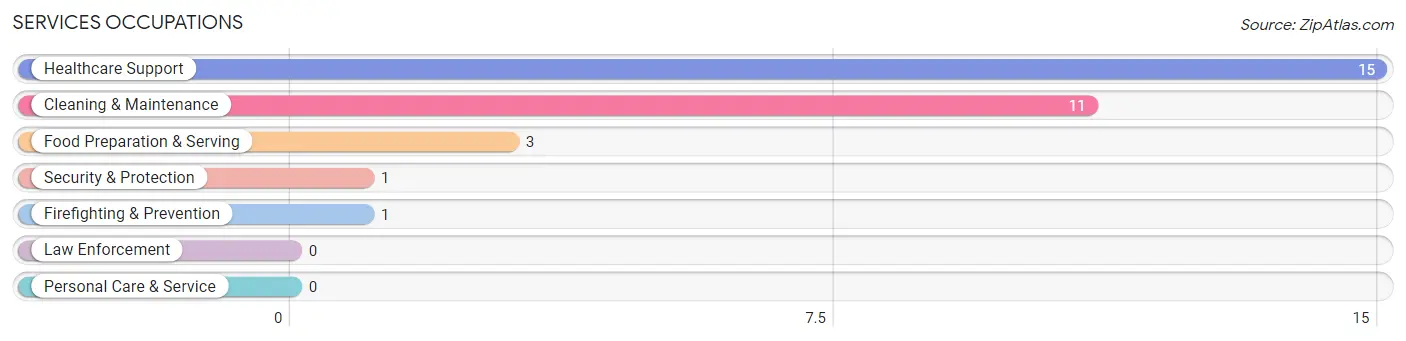
Services Occupations
The most common Services occupations in Alliance are Healthcare Support (15 | 6.2%), Cleaning & Maintenance (11 | 4.6%), Food Preparation & Serving (3 | 1.2%), Security & Protection (1 | 0.4%), and Firefighting & Prevention (1 | 0.4%).
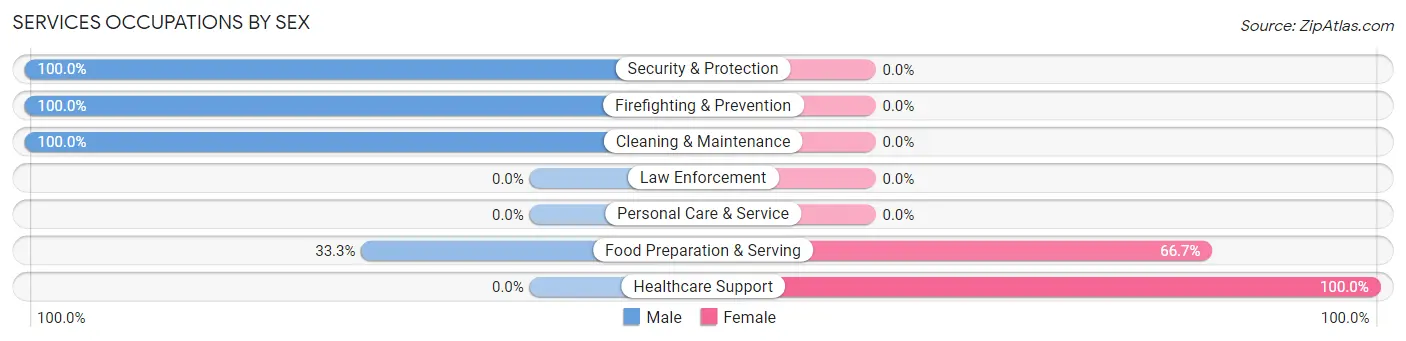
Services Occupations by Sex
Within the Services occupations in Alliance, the most male-oriented occupations are Security & Protection (100.0%), Firefighting & Prevention (100.0%), and Cleaning & Maintenance (100.0%), while the most female-oriented occupations are Healthcare Support (100.0%), and Food Preparation & Serving (66.7%).
| Occupation | Male | Female |
| Healthcare Support | 0 (0.0%) | 15 (100.0%) |
| Security & Protection | 1 (100.0%) | 0 (0.0%) |
| Firefighting & Prevention | 1 (100.0%) | 0 (0.0%) |
| Law Enforcement | 0 (0.0%) | 0 (0.0%) |
| Food Preparation & Serving | 1 (33.3%) | 2 (66.7%) |
| Cleaning & Maintenance | 11 (100.0%) | 0 (0.0%) |
| Personal Care & Service | 0 (0.0%) | 0 (0.0%) |
| Total (Category) | 13 (43.3%) | 17 (56.7%) |
| Total (Overall) | 130 (53.9%) | 111 (46.1%) |
Sales and Office Occupations
The most common Sales and Office occupations in Alliance are Sales & Related (34 | 14.1%), and Office & Administration (6 | 2.5%).
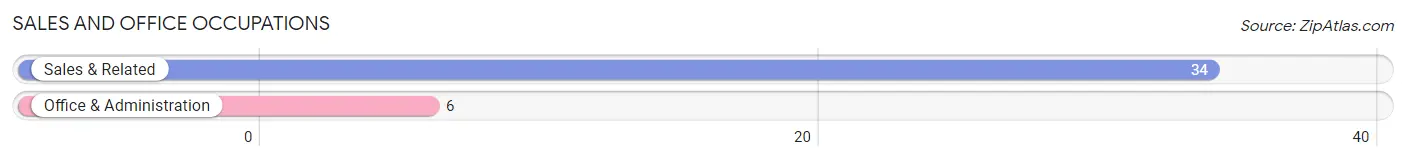
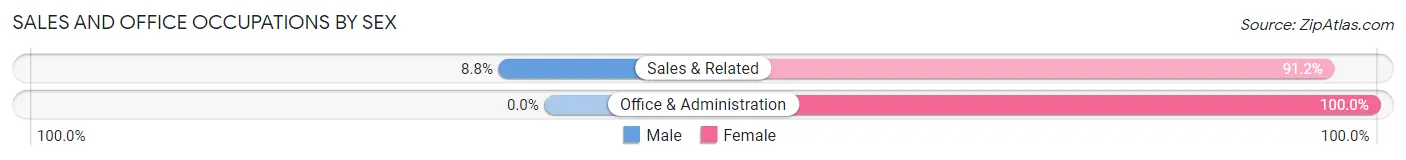
Sales and Office Occupations by Sex
| Occupation | Male | Female |
| Sales & Related | 3 (8.8%) | 31 (91.2%) |
| Office & Administration | 0 (0.0%) | 6 (100.0%) |
| Total (Category) | 3 (7.5%) | 37 (92.5%) |
| Total (Overall) | 130 (53.9%) | 111 (46.1%) |
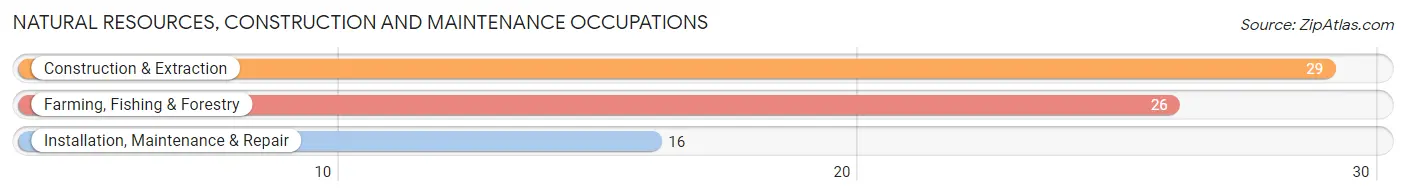
Natural Resources, Construction and Maintenance Occupations
The most common Natural Resources, Construction and Maintenance occupations in Alliance are Construction & Extraction (29 | 12.0%), Farming, Fishing & Forestry (26 | 10.8%), and Installation, Maintenance & Repair (16 | 6.6%).
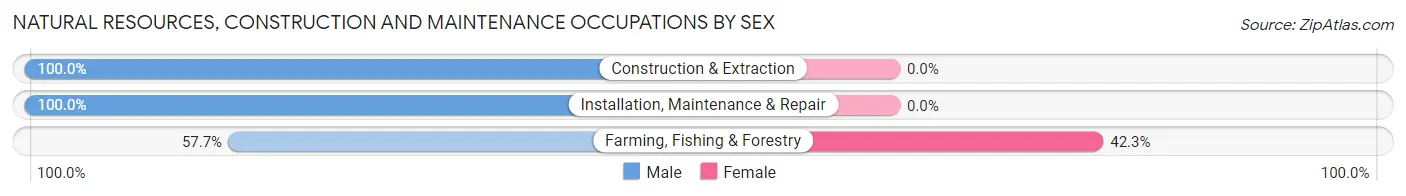
Natural Resources, Construction and Maintenance Occupations by Sex
| Occupation | Male | Female |
| Farming, Fishing & Forestry | 15 (57.7%) | 11 (42.3%) |
| Construction & Extraction | 29 (100.0%) | 0 (0.0%) |
| Installation, Maintenance & Repair | 16 (100.0%) | 0 (0.0%) |
| Total (Category) | 60 (84.5%) | 11 (15.5%) |
| Total (Overall) | 130 (53.9%) | 111 (46.1%) |
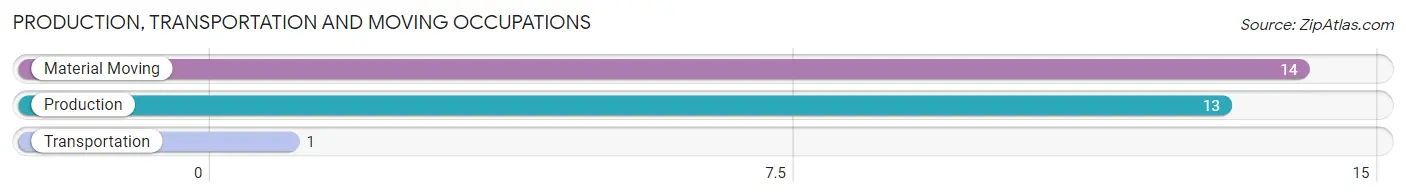
Production, Transportation and Moving Occupations
The most common Production, Transportation and Moving occupations in Alliance are Material Moving (14 | 5.8%), Production (13 | 5.4%), and Transportation (1 | 0.4%).
Production, Transportation and Moving Occupations by Sex
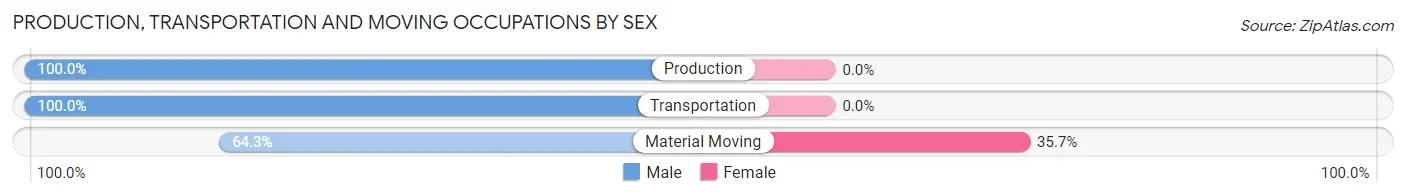
| Occupation | Male | Female |
| Production | 13 (100.0%) | 0 (0.0%) |
| Transportation | 1 (100.0%) | 0 (0.0%) |
| Material Moving | 9 (64.3%) | 5 (35.7%) |
| Total (Category) | 23 (82.1%) | 5 (17.9%) |
| Total (Overall) | 130 (53.9%) | 111 (46.1%) |
Employment Industries by Sex in Alliance
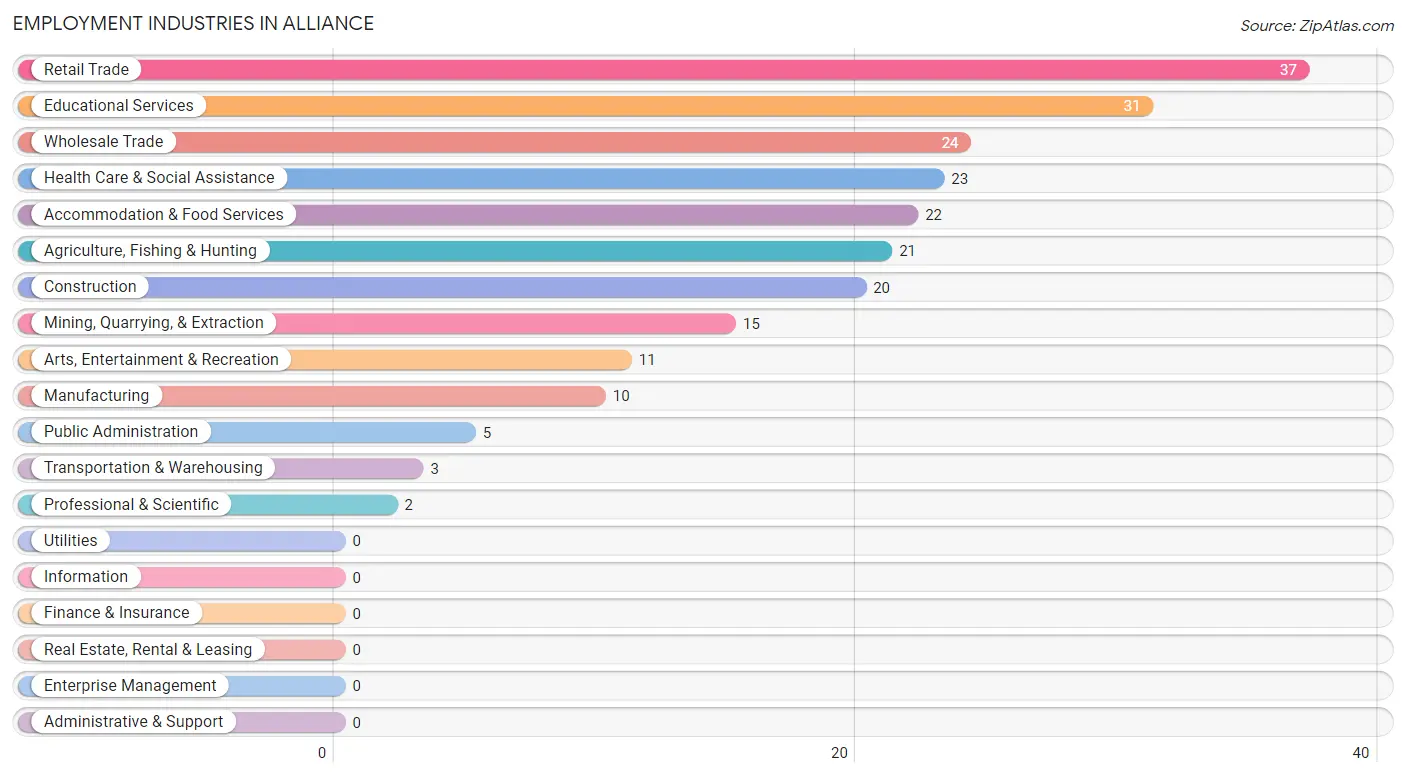
Employment Industries in Alliance
The major employment industries in Alliance include Retail Trade (37 | 15.3%), Educational Services (31 | 12.9%), Wholesale Trade (24 | 10.0%), Health Care & Social Assistance (23 | 9.5%), and Accommodation & Food Services (22 | 9.1%).
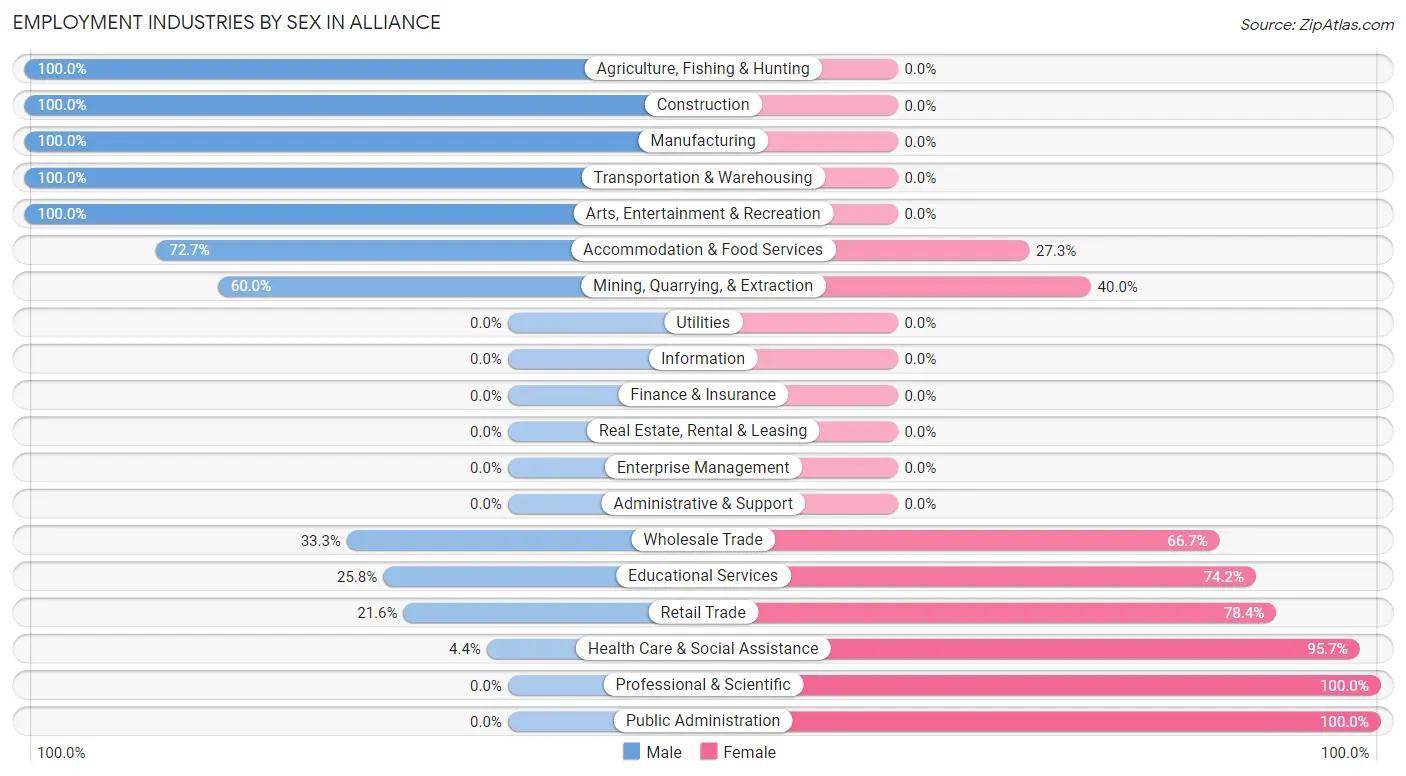
Employment Industries by Sex in Alliance
The Alliance industries that see more men than women are Agriculture, Fishing & Hunting (100.0%), Construction (100.0%), and Manufacturing (100.0%), whereas the industries that tend to have a higher number of women are Professional & Scientific (100.0%), Public Administration (100.0%), and Health Care & Social Assistance (95.7%).
| Industry | Male | Female |
| Agriculture, Fishing & Hunting | 21 (100.0%) | 0 (0.0%) |
| Mining, Quarrying, & Extraction | 9 (60.0%) | 6 (40.0%) |
| Construction | 20 (100.0%) | 0 (0.0%) |
| Manufacturing | 10 (100.0%) | 0 (0.0%) |
| Wholesale Trade | 8 (33.3%) | 16 (66.7%) |
| Retail Trade | 8 (21.6%) | 29 (78.4%) |
| Transportation & Warehousing | 3 (100.0%) | 0 (0.0%) |
| Utilities | 0 (0.0%) | 0 (0.0%) |
| Information | 0 (0.0%) | 0 (0.0%) |
| Finance & Insurance | 0 (0.0%) | 0 (0.0%) |
| Real Estate, Rental & Leasing | 0 (0.0%) | 0 (0.0%) |
| Professional & Scientific | 0 (0.0%) | 2 (100.0%) |
| Enterprise Management | 0 (0.0%) | 0 (0.0%) |
| Administrative & Support | 0 (0.0%) | 0 (0.0%) |
| Educational Services | 8 (25.8%) | 23 (74.2%) |
| Health Care & Social Assistance | 1 (4.3%) | 22 (95.7%) |
| Arts, Entertainment & Recreation | 11 (100.0%) | 0 (0.0%) |
| Accommodation & Food Services | 16 (72.7%) | 6 (27.3%) |
| Public Administration | 0 (0.0%) | 5 (100.0%) |
| Total | 130 (53.9%) | 111 (46.1%) |
Education in Alliance
School Enrollment in Alliance
The most common levels of schooling among the 106 students in Alliance are high school (48 | 45.3%), college / undergraduate (26 | 24.5%), and middle school (17 | 16.0%).
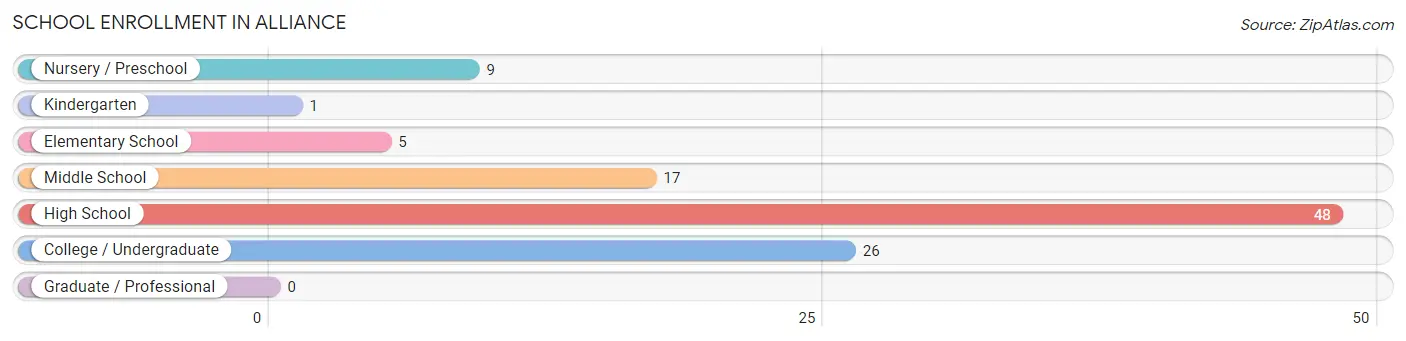
| School Level | # Students | % Students |
| Nursery / Preschool | 9 | 8.5% |
| Kindergarten | 1 | 0.9% |
| Elementary School | 5 | 4.7% |
| Middle School | 17 | 16.0% |
| High School | 48 | 45.3% |
| College / Undergraduate | 26 | 24.5% |
| Graduate / Professional | 0 | 0.0% |
| Total | 106 | 100.0% |
School Enrollment by Age by Funding Source in Alliance
Out of a total of 106 students who are enrolled in schools in Alliance, 11 (10.4%) attend a private institution, while the remaining 95 (89.6%) are enrolled in public schools. The age group of 18 to 19 year olds has the highest likelihood of being enrolled in private schools, with 8 (50.0% in the age bracket) enrolled. Conversely, the age group of 10 to 14 year olds has the lowest likelihood of being enrolled in a private school, with 17 (100.0% in the age bracket) attending a public institution.
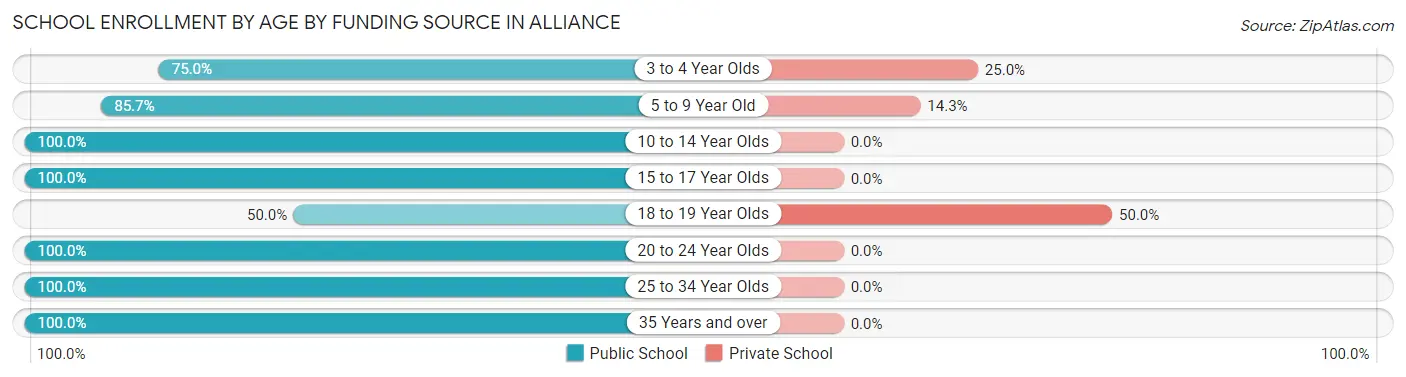
| Age Bracket | Public School | Private School |
| 3 to 4 Year Olds | 6 (75.0%) | 2 (25.0%) |
| 5 to 9 Year Old | 6 (85.7%) | 1 (14.3%) |
| 10 to 14 Year Olds | 17 (100.0%) | 0 (0.0%) |
| 15 to 17 Year Olds | 40 (100.0%) | 0 (0.0%) |
| 18 to 19 Year Olds | 8 (50.0%) | 8 (50.0%) |
| 20 to 24 Year Olds | 3 (100.0%) | 0 (0.0%) |
| 25 to 34 Year Olds | 11 (100.0%) | 0 (0.0%) |
| 35 Years and over | 4 (100.0%) | 0 (0.0%) |
| Total | 95 (89.6%) | 11 (10.4%) |
Educational Attainment by Field of Study in Alliance
Business (17 | 23.6%), science & technology (13 | 18.1%), education (13 | 18.1%), literature & languages (10 | 13.9%), and engineering (7 | 9.7%) are the most common fields of study among 72 individuals in Alliance who have obtained a bachelor's degree or higher.
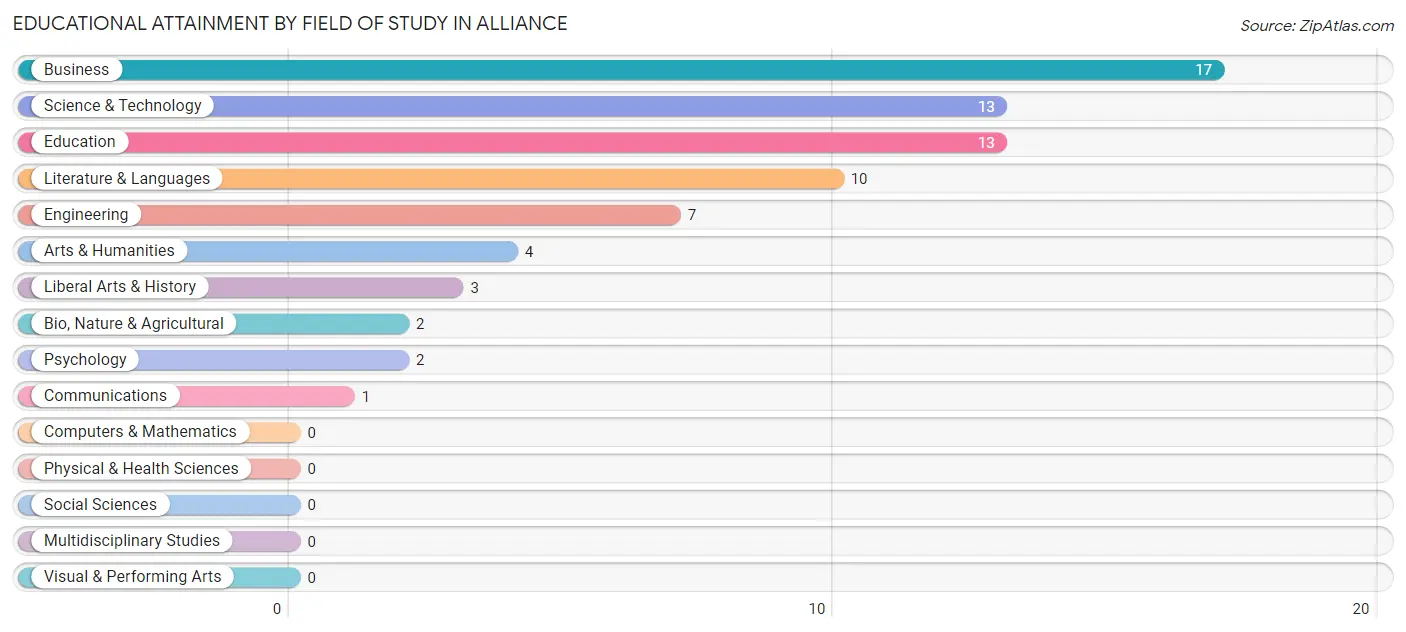
| Field of Study | # Graduates | % Graduates |
| Computers & Mathematics | 0 | 0.0% |
| Bio, Nature & Agricultural | 2 | 2.8% |
| Physical & Health Sciences | 0 | 0.0% |
| Psychology | 2 | 2.8% |
| Social Sciences | 0 | 0.0% |
| Engineering | 7 | 9.7% |
| Multidisciplinary Studies | 0 | 0.0% |
| Science & Technology | 13 | 18.1% |
| Business | 17 | 23.6% |
| Education | 13 | 18.1% |
| Literature & Languages | 10 | 13.9% |
| Liberal Arts & History | 3 | 4.2% |
| Visual & Performing Arts | 0 | 0.0% |
| Communications | 1 | 1.4% |
| Arts & Humanities | 4 | 5.6% |
| Total | 72 | 100.0% |
Transportation & Commute in Alliance
Vehicle Availability by Sex in Alliance
The most prevalent vehicle ownership categories in Alliance are males with 3 vehicles (68, accounting for 52.3%) and females with 3 vehicles (42, making up 61.3%).
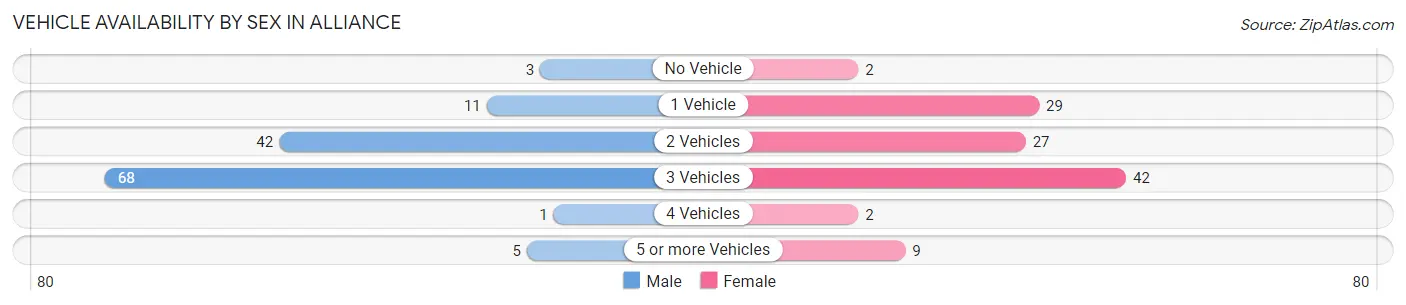
| Vehicles Available | Male | Female |
| No Vehicle | 3 (2.3%) | 2 (1.8%) |
| 1 Vehicle | 11 (8.5%) | 29 (26.1%) |
| 2 Vehicles | 42 (32.3%) | 27 (24.3%) |
| 3 Vehicles | 68 (52.3%) | 42 (37.8%) |
| 4 Vehicles | 1 (0.8%) | 2 (1.8%) |
| 5 or more Vehicles | 5 (3.8%) | 9 (8.1%) |
| Total | 130 (100.0%) | 111 (100.0%) |
Commute Time in Alliance
The most frequently occuring commute durations in Alliance are 5 to 9 minutes (49 commuters, 24.1%), 15 to 19 minutes (28 commuters, 13.8%), and 25 to 29 minutes (28 commuters, 13.8%).
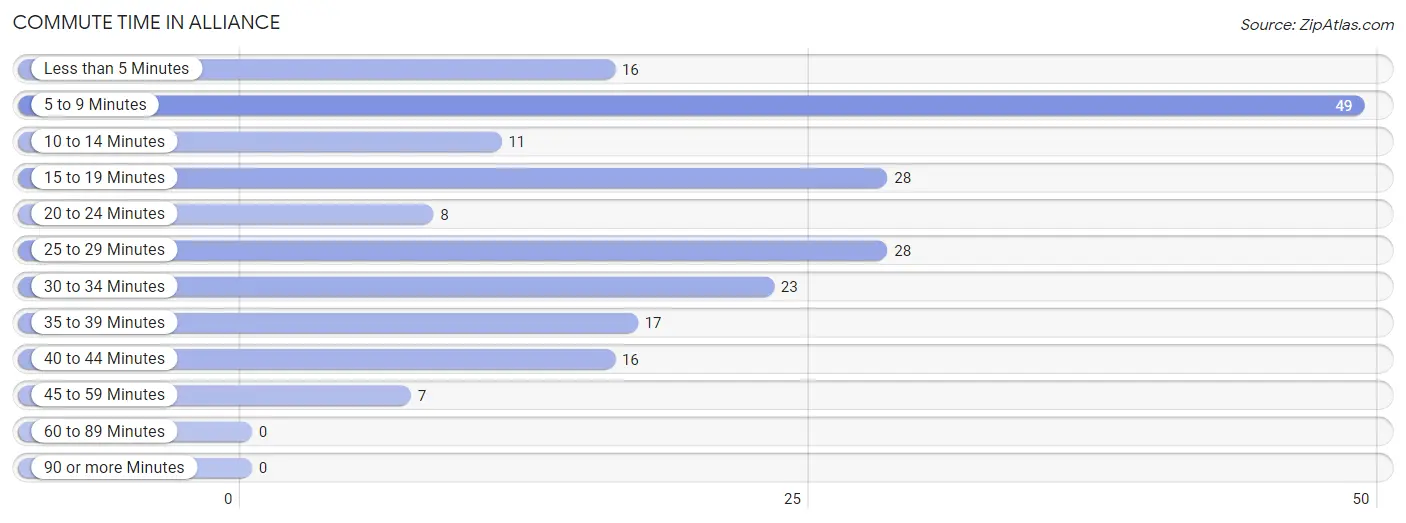
| Commute Time | # Commuters | % Commuters |
| Less than 5 Minutes | 16 | 7.9% |
| 5 to 9 Minutes | 49 | 24.1% |
| 10 to 14 Minutes | 11 | 5.4% |
| 15 to 19 Minutes | 28 | 13.8% |
| 20 to 24 Minutes | 8 | 3.9% |
| 25 to 29 Minutes | 28 | 13.8% |
| 30 to 34 Minutes | 23 | 11.3% |
| 35 to 39 Minutes | 17 | 8.4% |
| 40 to 44 Minutes | 16 | 7.9% |
| 45 to 59 Minutes | 7 | 3.5% |
| 60 to 89 Minutes | 0 | 0.0% |
| 90 or more Minutes | 0 | 0.0% |
Commute Time by Sex in Alliance
The most common commute times in Alliance are 25 to 29 minutes (24 commuters, 22.4%) for males and 5 to 9 minutes (34 commuters, 35.4%) for females.
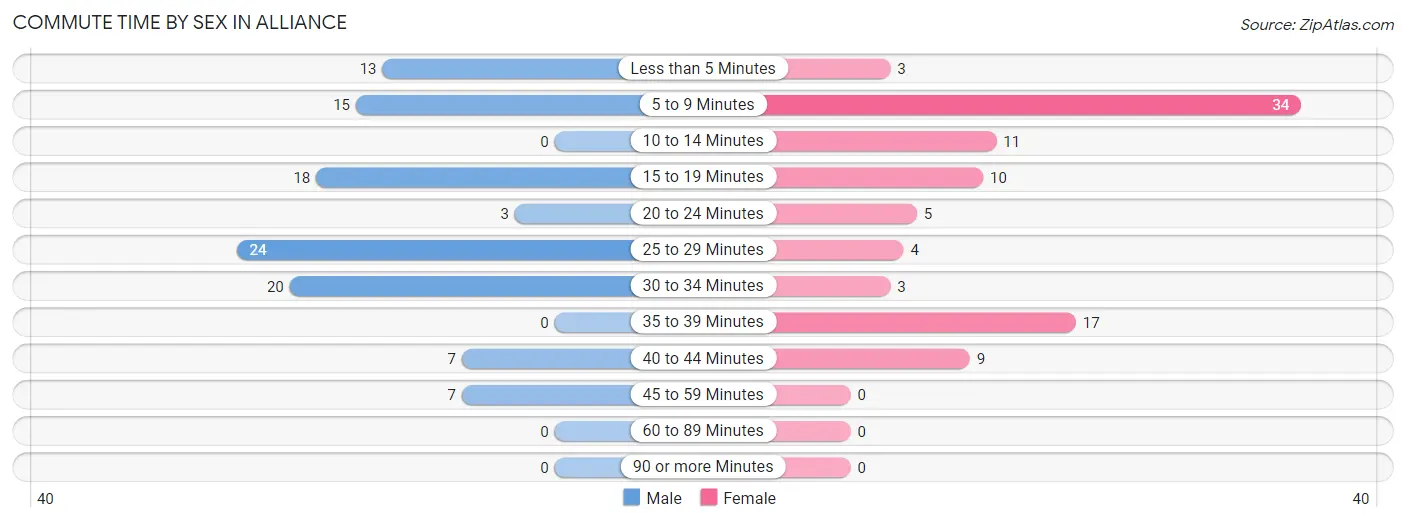
| Commute Time | Male | Female |
| Less than 5 Minutes | 13 (12.1%) | 3 (3.1%) |
| 5 to 9 Minutes | 15 (14.0%) | 34 (35.4%) |
| 10 to 14 Minutes | 0 (0.0%) | 11 (11.5%) |
| 15 to 19 Minutes | 18 (16.8%) | 10 (10.4%) |
| 20 to 24 Minutes | 3 (2.8%) | 5 (5.2%) |
| 25 to 29 Minutes | 24 (22.4%) | 4 (4.2%) |
| 30 to 34 Minutes | 20 (18.7%) | 3 (3.1%) |
| 35 to 39 Minutes | 0 (0.0%) | 17 (17.7%) |
| 40 to 44 Minutes | 7 (6.5%) | 9 (9.4%) |
| 45 to 59 Minutes | 7 (6.5%) | 0 (0.0%) |
| 60 to 89 Minutes | 0 (0.0%) | 0 (0.0%) |
| 90 or more Minutes | 0 (0.0%) | 0 (0.0%) |
Time of Departure to Work by Sex in Alliance
The most frequent times of departure to work in Alliance are 7:00 AM to 7:29 AM (48, 44.9%) for males and 8:00 AM to 8:29 AM (21, 21.9%) for females.
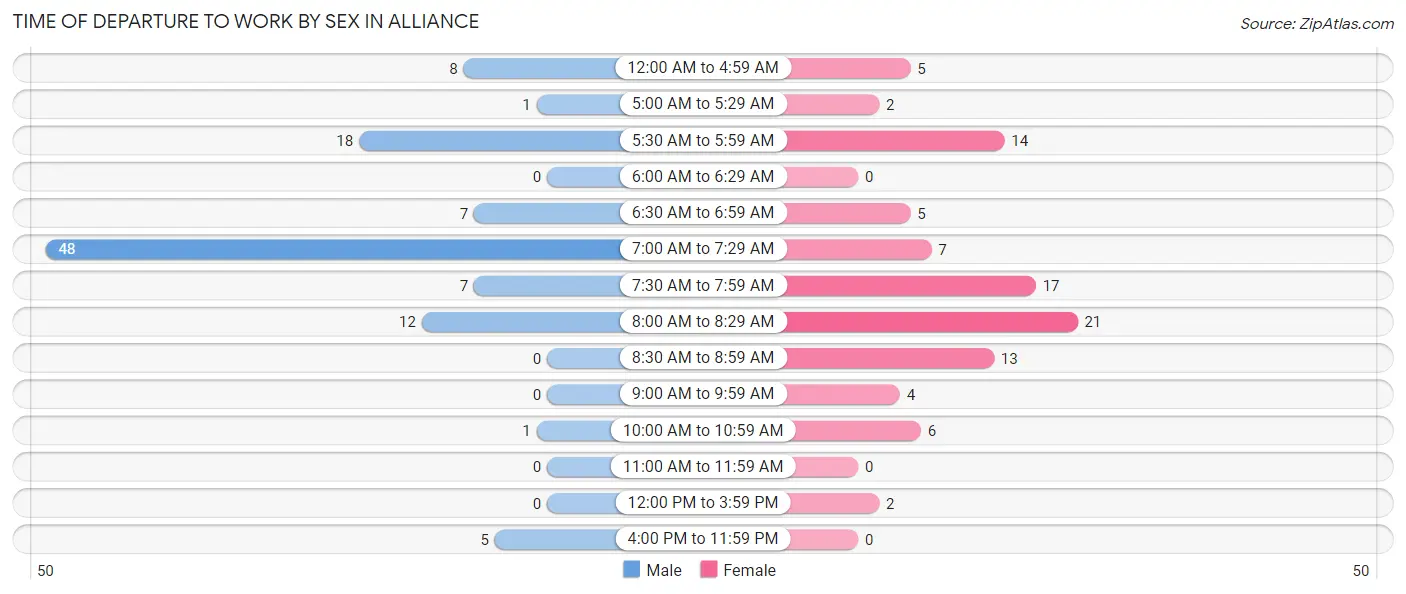
| Time of Departure | Male | Female |
| 12:00 AM to 4:59 AM | 8 (7.5%) | 5 (5.2%) |
| 5:00 AM to 5:29 AM | 1 (0.9%) | 2 (2.1%) |
| 5:30 AM to 5:59 AM | 18 (16.8%) | 14 (14.6%) |
| 6:00 AM to 6:29 AM | 0 (0.0%) | 0 (0.0%) |
| 6:30 AM to 6:59 AM | 7 (6.5%) | 5 (5.2%) |
| 7:00 AM to 7:29 AM | 48 (44.9%) | 7 (7.3%) |
| 7:30 AM to 7:59 AM | 7 (6.5%) | 17 (17.7%) |
| 8:00 AM to 8:29 AM | 12 (11.2%) | 21 (21.9%) |
| 8:30 AM to 8:59 AM | 0 (0.0%) | 13 (13.5%) |
| 9:00 AM to 9:59 AM | 0 (0.0%) | 4 (4.2%) |
| 10:00 AM to 10:59 AM | 1 (0.9%) | 6 (6.2%) |
| 11:00 AM to 11:59 AM | 0 (0.0%) | 0 (0.0%) |
| 12:00 PM to 3:59 PM | 0 (0.0%) | 2 (2.1%) |
| 4:00 PM to 11:59 PM | 5 (4.7%) | 0 (0.0%) |
| Total | 107 (100.0%) | 96 (100.0%) |
Housing Occupancy in Alliance
Occupancy by Ownership in Alliance
Of the total 345 dwellings in Alliance, owner-occupied units account for 248 (71.9%), while renter-occupied units make up 97 (28.1%).
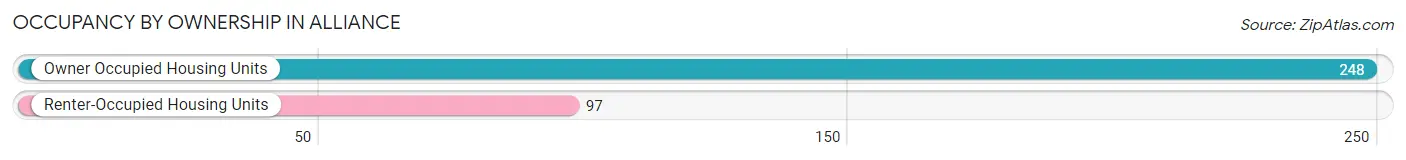
| Occupancy | # Housing Units | % Housing Units |
| Owner Occupied Housing Units | 248 | 71.9% |
| Renter-Occupied Housing Units | 97 | 28.1% |
| Total Occupied Housing Units | 345 | 100.0% |
Occupancy by Household Size in Alliance
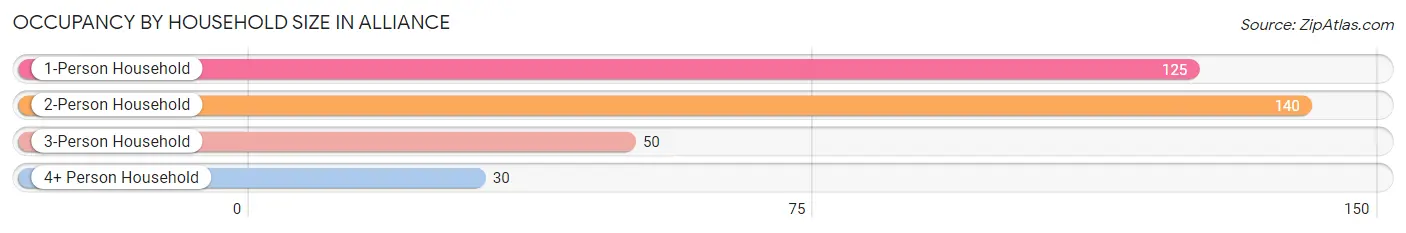
| Household Size | # Housing Units | % Housing Units |
| 1-Person Household | 125 | 36.2% |
| 2-Person Household | 140 | 40.6% |
| 3-Person Household | 50 | 14.5% |
| 4+ Person Household | 30 | 8.7% |
| Total Housing Units | 345 | 100.0% |
Occupancy by Ownership by Household Size in Alliance
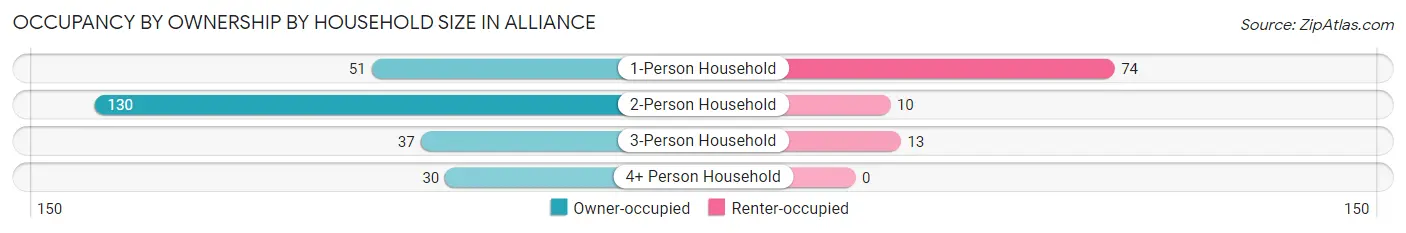
| Household Size | Owner-occupied | Renter-occupied |
| 1-Person Household | 51 (40.8%) | 74 (59.2%) |
| 2-Person Household | 130 (92.9%) | 10 (7.1%) |
| 3-Person Household | 37 (74.0%) | 13 (26.0%) |
| 4+ Person Household | 30 (100.0%) | 0 (0.0%) |
| Total Housing Units | 248 (71.9%) | 97 (28.1%) |
Occupancy by Educational Attainment in Alliance
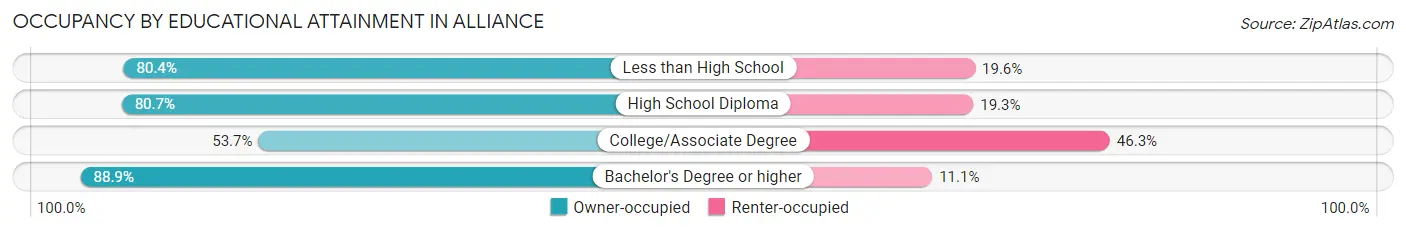
| Household Size | Owner-occupied | Renter-occupied |
| Less than High School | 41 (80.4%) | 10 (19.6%) |
| High School Diploma | 109 (80.7%) | 26 (19.3%) |
| College/Associate Degree | 66 (53.7%) | 57 (46.3%) |
| Bachelor's Degree or higher | 32 (88.9%) | 4 (11.1%) |
Occupancy by Age of Householder in Alliance
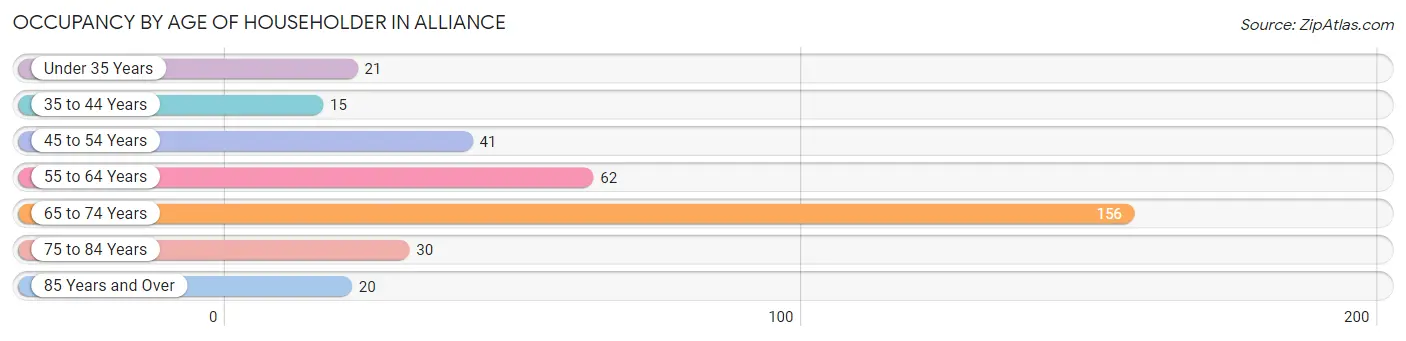
| Age Bracket | # Households | % Households |
| Under 35 Years | 21 | 6.1% |
| 35 to 44 Years | 15 | 4.3% |
| 45 to 54 Years | 41 | 11.9% |
| 55 to 64 Years | 62 | 18.0% |
| 65 to 74 Years | 156 | 45.2% |
| 75 to 84 Years | 30 | 8.7% |
| 85 Years and Over | 20 | 5.8% |
| Total | 345 | 100.0% |
Housing Finances in Alliance
Median Income by Occupancy in Alliance
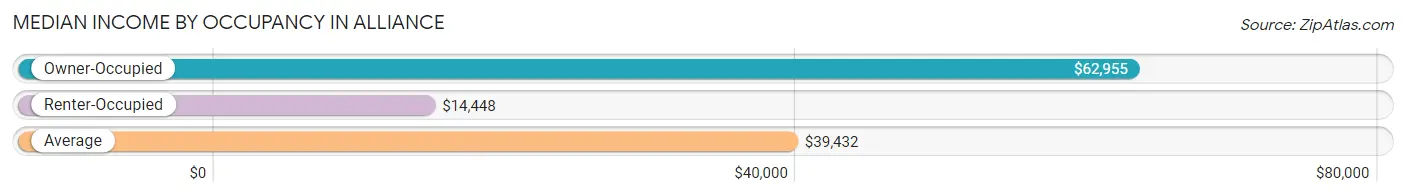
| Occupancy Type | # Households | Median Income |
| Owner-Occupied | 248 (71.9%) | $62,955 |
| Renter-Occupied | 97 (28.1%) | $14,448 |
| Average | 345 (100.0%) | $39,432 |
Occupancy by Householder Income Bracket in Alliance
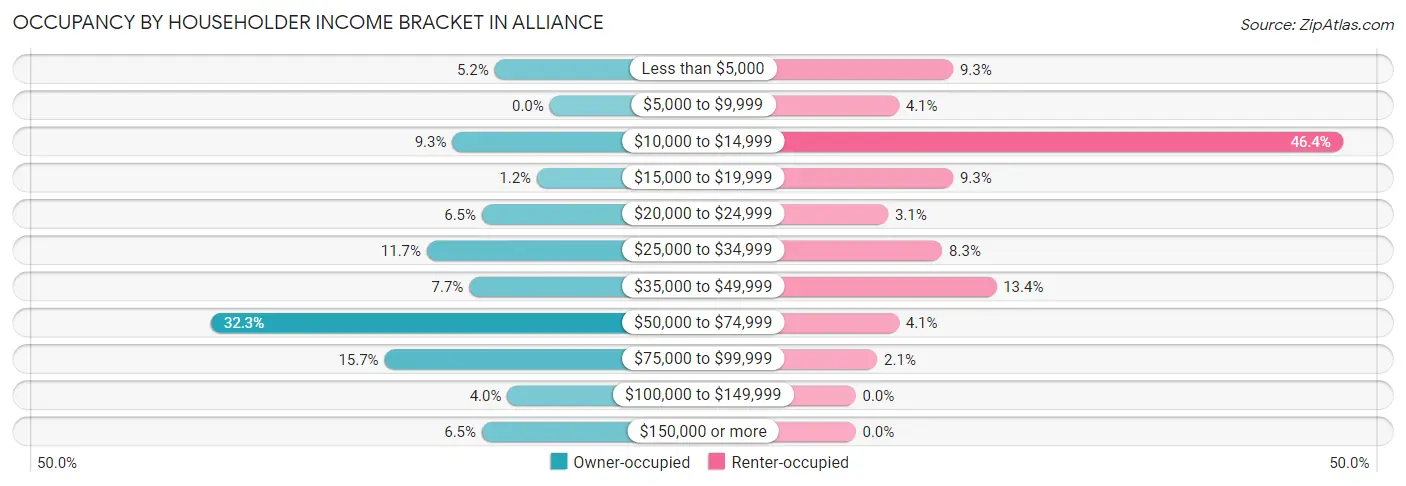
| Income Bracket | Owner-occupied | Renter-occupied |
| Less than $5,000 | 13 (5.2%) | 9 (9.3%) |
| $5,000 to $9,999 | 0 (0.0%) | 4 (4.1%) |
| $10,000 to $14,999 | 23 (9.3%) | 45 (46.4%) |
| $15,000 to $19,999 | 3 (1.2%) | 9 (9.3%) |
| $20,000 to $24,999 | 16 (6.5%) | 3 (3.1%) |
| $25,000 to $34,999 | 29 (11.7%) | 8 (8.3%) |
| $35,000 to $49,999 | 19 (7.7%) | 13 (13.4%) |
| $50,000 to $74,999 | 80 (32.3%) | 4 (4.1%) |
| $75,000 to $99,999 | 39 (15.7%) | 2 (2.1%) |
| $100,000 to $149,999 | 10 (4.0%) | 0 (0.0%) |
| $150,000 or more | 16 (6.5%) | 0 (0.0%) |
| Total | 248 (100.0%) | 97 (100.0%) |
Monthly Housing Cost Tiers in Alliance
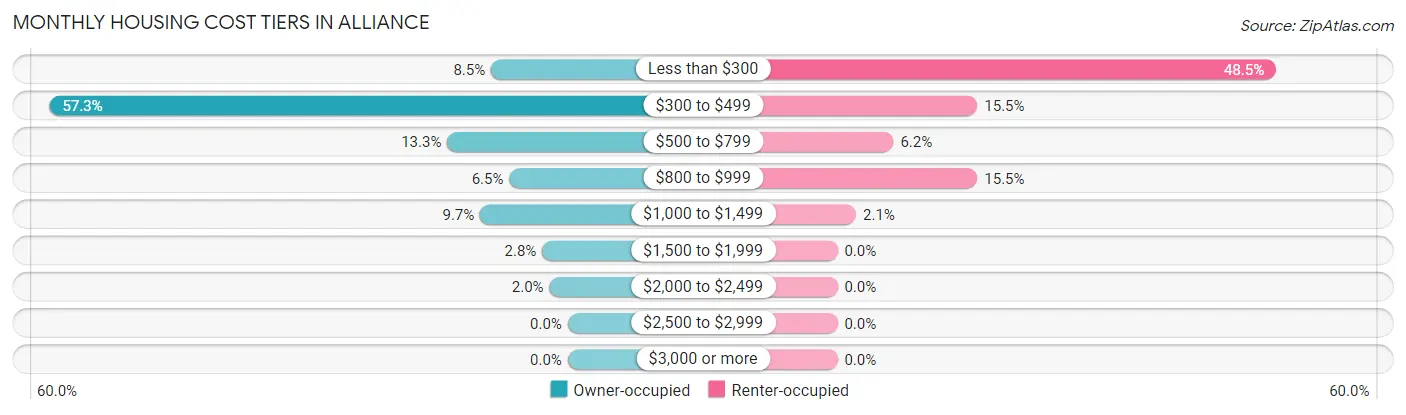
| Monthly Cost | Owner-occupied | Renter-occupied |
| Less than $300 | 21 (8.5%) | 47 (48.4%) |
| $300 to $499 | 142 (57.3%) | 15 (15.5%) |
| $500 to $799 | 33 (13.3%) | 6 (6.2%) |
| $800 to $999 | 16 (6.5%) | 15 (15.5%) |
| $1,000 to $1,499 | 24 (9.7%) | 2 (2.1%) |
| $1,500 to $1,999 | 7 (2.8%) | 0 (0.0%) |
| $2,000 to $2,499 | 5 (2.0%) | 0 (0.0%) |
| $2,500 to $2,999 | 0 (0.0%) | 0 (0.0%) |
| $3,000 or more | 0 (0.0%) | 0 (0.0%) |
| Total | 248 (100.0%) | 97 (100.0%) |
Physical Housing Characteristics in Alliance
Housing Structures in Alliance
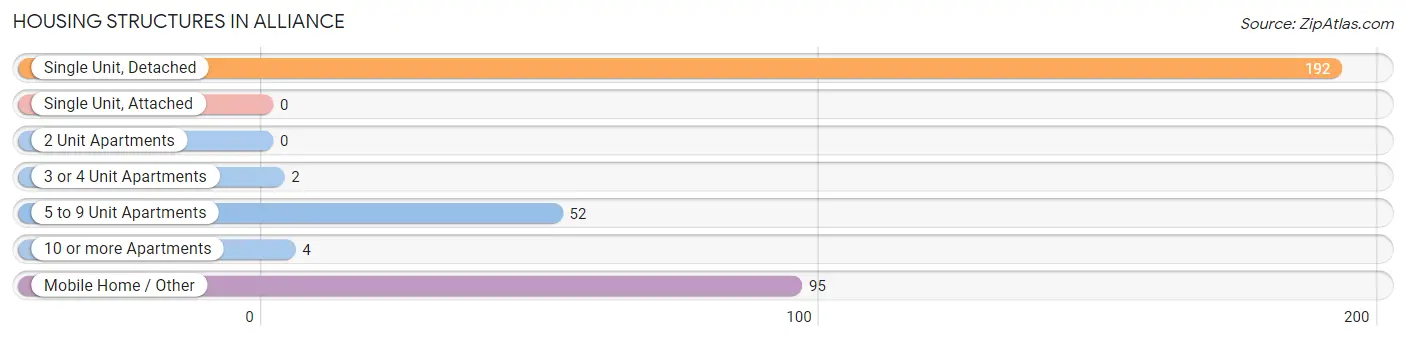
| Structure Type | # Housing Units | % Housing Units |
| Single Unit, Detached | 192 | 55.6% |
| Single Unit, Attached | 0 | 0.0% |
| 2 Unit Apartments | 0 | 0.0% |
| 3 or 4 Unit Apartments | 2 | 0.6% |
| 5 to 9 Unit Apartments | 52 | 15.1% |
| 10 or more Apartments | 4 | 1.2% |
| Mobile Home / Other | 95 | 27.5% |
| Total | 345 | 100.0% |
Housing Structures by Occupancy in Alliance
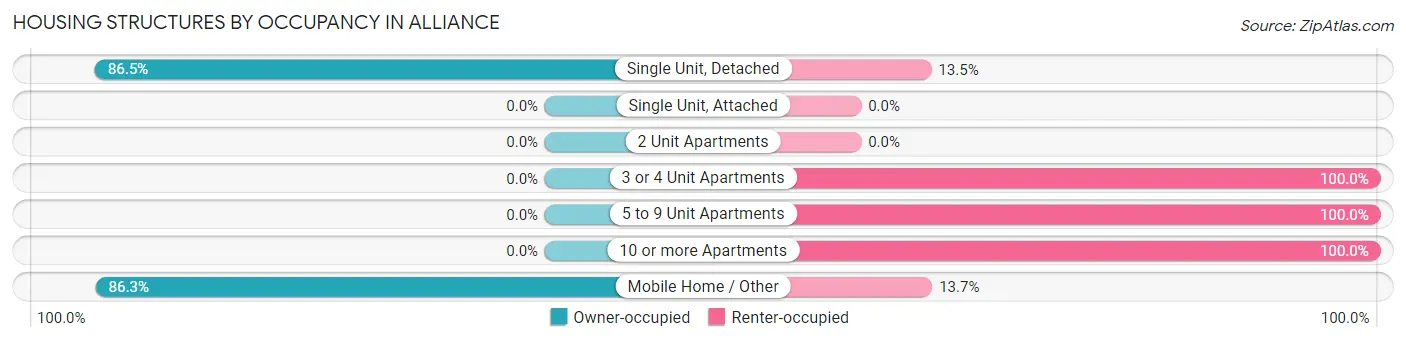
| Structure Type | Owner-occupied | Renter-occupied |
| Single Unit, Detached | 166 (86.5%) | 26 (13.5%) |
| Single Unit, Attached | 0 (0.0%) | 0 (0.0%) |
| 2 Unit Apartments | 0 (0.0%) | 0 (0.0%) |
| 3 or 4 Unit Apartments | 0 (0.0%) | 2 (100.0%) |
| 5 to 9 Unit Apartments | 0 (0.0%) | 52 (100.0%) |
| 10 or more Apartments | 0 (0.0%) | 4 (100.0%) |
| Mobile Home / Other | 82 (86.3%) | 13 (13.7%) |
| Total | 248 (71.9%) | 97 (28.1%) |
Housing Structures by Number of Rooms in Alliance
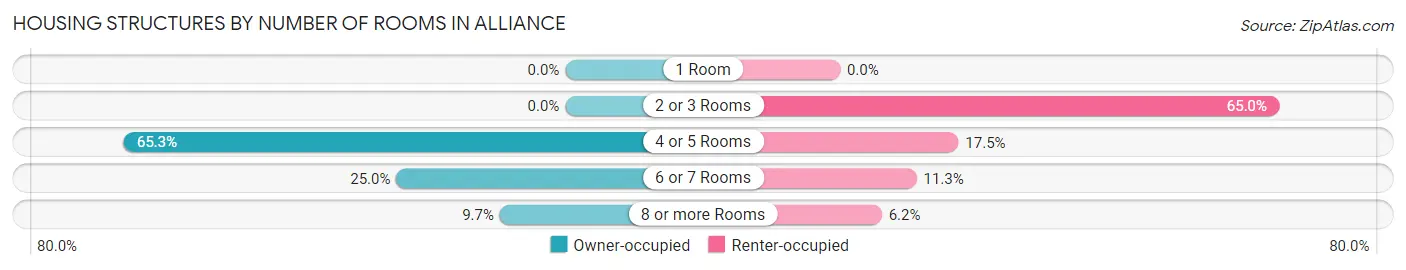
| Number of Rooms | Owner-occupied | Renter-occupied |
| 1 Room | 0 (0.0%) | 0 (0.0%) |
| 2 or 3 Rooms | 0 (0.0%) | 63 (64.9%) |
| 4 or 5 Rooms | 162 (65.3%) | 17 (17.5%) |
| 6 or 7 Rooms | 62 (25.0%) | 11 (11.3%) |
| 8 or more Rooms | 24 (9.7%) | 6 (6.2%) |
| Total | 248 (100.0%) | 97 (100.0%) |
Housing Structure by Heating Type in Alliance
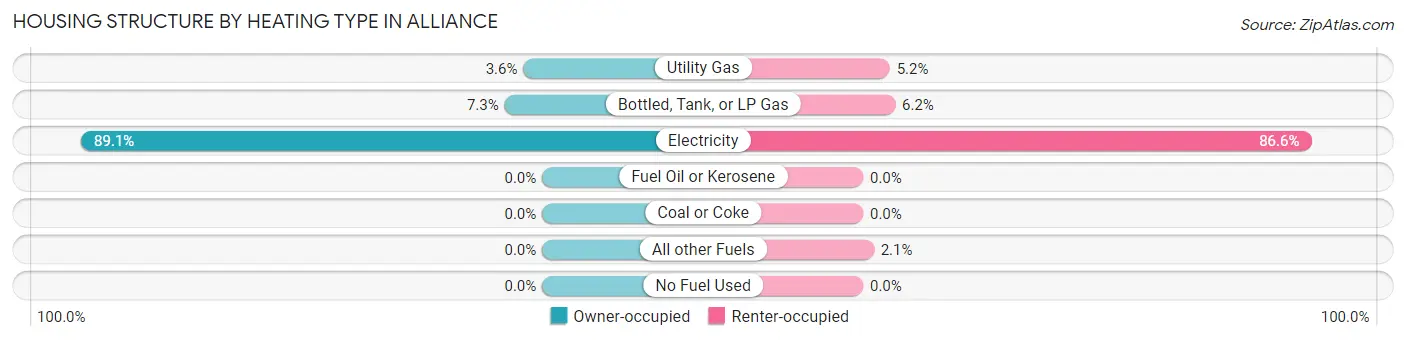
| Heating Type | Owner-occupied | Renter-occupied |
| Utility Gas | 9 (3.6%) | 5 (5.1%) |
| Bottled, Tank, or LP Gas | 18 (7.3%) | 6 (6.2%) |
| Electricity | 221 (89.1%) | 84 (86.6%) |
| Fuel Oil or Kerosene | 0 (0.0%) | 0 (0.0%) |
| Coal or Coke | 0 (0.0%) | 0 (0.0%) |
| All other Fuels | 0 (0.0%) | 2 (2.1%) |
| No Fuel Used | 0 (0.0%) | 0 (0.0%) |
| Total | 248 (100.0%) | 97 (100.0%) |
Household Vehicle Usage in Alliance
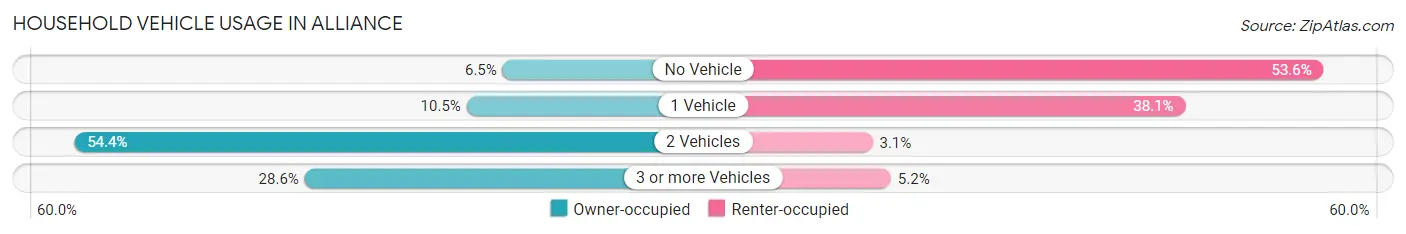
| Vehicles per Household | Owner-occupied | Renter-occupied |
| No Vehicle | 16 (6.5%) | 52 (53.6%) |
| 1 Vehicle | 26 (10.5%) | 37 (38.1%) |
| 2 Vehicles | 135 (54.4%) | 3 (3.1%) |
| 3 or more Vehicles | 71 (28.6%) | 5 (5.1%) |
| Total | 248 (100.0%) | 97 (100.0%) |
Real Estate & Mortgages in Alliance
Real Estate and Mortgage Overview in Alliance
| Characteristic | Without Mortgage | With Mortgage |
| Housing Units | 204 | 44 |
| Median Property Value | $92,000 | $148,200 |
| Median Household Income | $62,545 | $10 |
| Monthly Housing Costs | $412 | $0 |
| Real Estate Taxes | $881 | $0 |
Property Value by Mortgage Status in Alliance
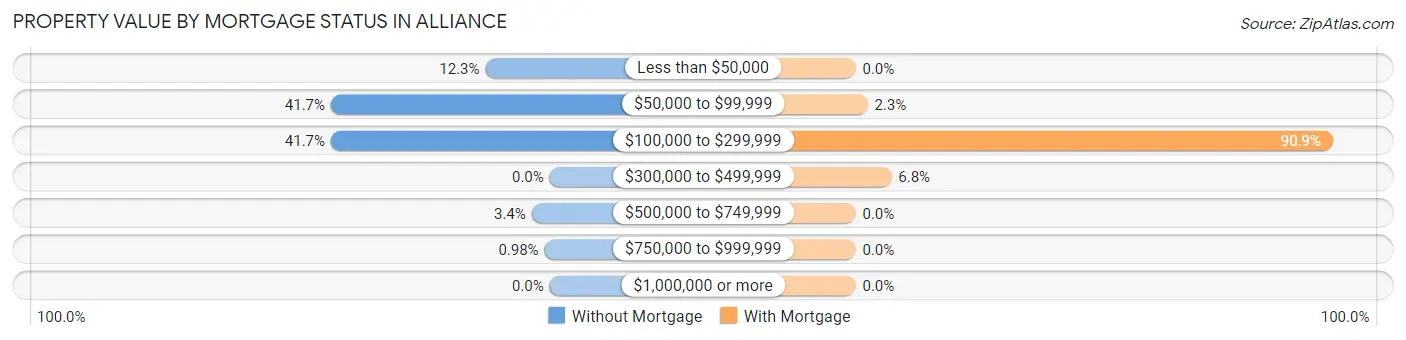
| Property Value | Without Mortgage | With Mortgage |
| Less than $50,000 | 25 (12.2%) | 0 (0.0%) |
| $50,000 to $99,999 | 85 (41.7%) | 1 (2.3%) |
| $100,000 to $299,999 | 85 (41.7%) | 40 (90.9%) |
| $300,000 to $499,999 | 0 (0.0%) | 3 (6.8%) |
| $500,000 to $749,999 | 7 (3.4%) | 0 (0.0%) |
| $750,000 to $999,999 | 2 (1.0%) | 0 (0.0%) |
| $1,000,000 or more | 0 (0.0%) | 0 (0.0%) |
| Total | 204 (100.0%) | 44 (100.0%) |
Household Income by Mortgage Status in Alliance
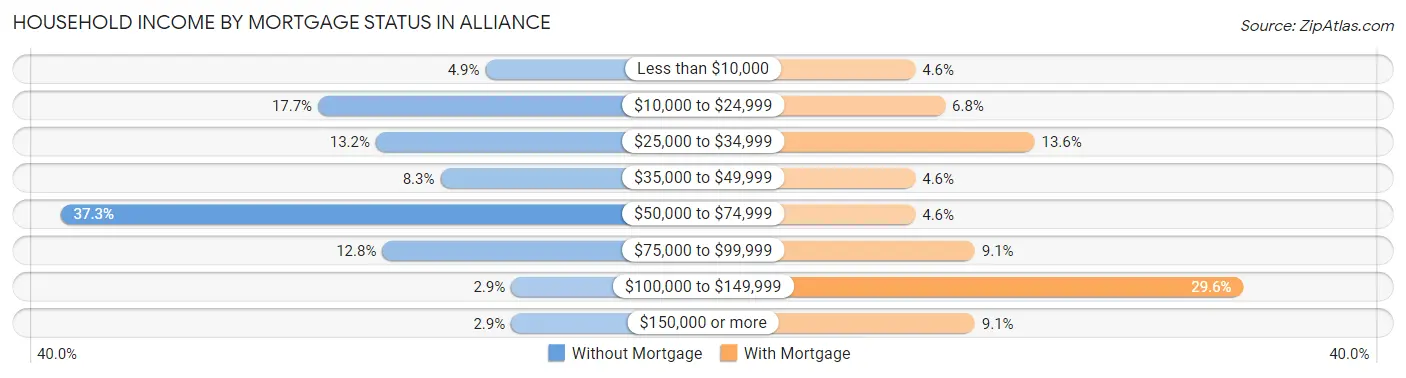
| Household Income | Without Mortgage | With Mortgage |
| Less than $10,000 | 10 (4.9%) | 2 (4.5%) |
| $10,000 to $24,999 | 36 (17.6%) | 3 (6.8%) |
| $25,000 to $34,999 | 27 (13.2%) | 6 (13.6%) |
| $35,000 to $49,999 | 17 (8.3%) | 2 (4.5%) |
| $50,000 to $74,999 | 76 (37.2%) | 2 (4.5%) |
| $75,000 to $99,999 | 26 (12.8%) | 4 (9.1%) |
| $100,000 to $149,999 | 6 (2.9%) | 13 (29.5%) |
| $150,000 or more | 6 (2.9%) | 4 (9.1%) |
| Total | 204 (100.0%) | 44 (100.0%) |
Property Value to Household Income Ratio in Alliance
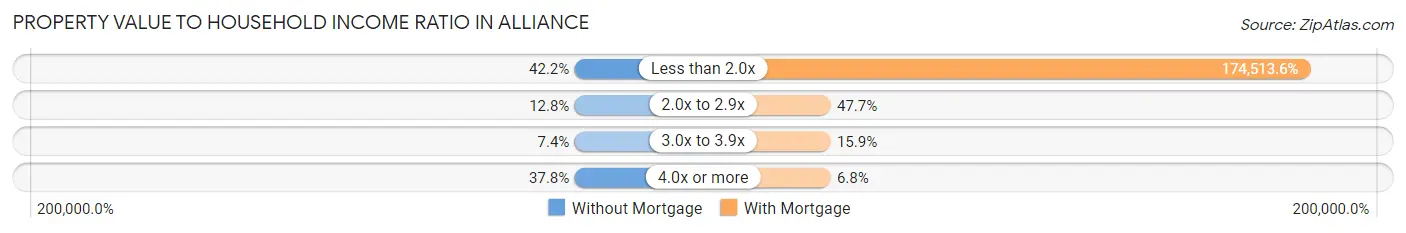
| Value-to-Income Ratio | Without Mortgage | With Mortgage |
| Less than 2.0x | 86 (42.2%) | 76,786 (174,513.6%) |
| 2.0x to 2.9x | 26 (12.8%) | 21 (47.7%) |
| 3.0x to 3.9x | 15 (7.3%) | 7 (15.9%) |
| 4.0x or more | 77 (37.8%) | 3 (6.8%) |
| Total | 204 (100.0%) | 44 (100.0%) |
Real Estate Taxes by Mortgage Status in Alliance
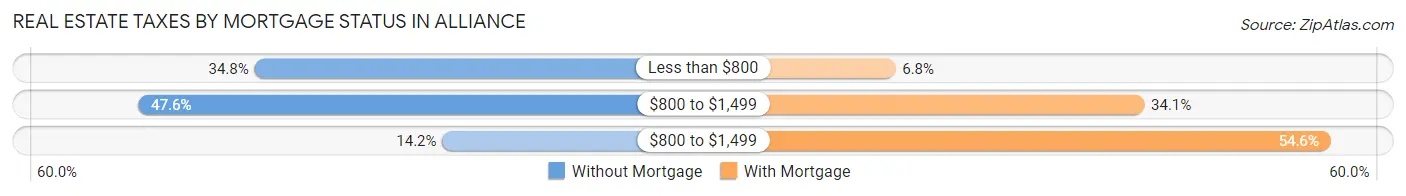
| Property Taxes | Without Mortgage | With Mortgage |
| Less than $800 | 71 (34.8%) | 3 (6.8%) |
| $800 to $1,499 | 97 (47.5%) | 15 (34.1%) |
| $800 to $1,499 | 29 (14.2%) | 24 (54.5%) |
| Total | 204 (100.0%) | 44 (100.0%) |
Health & Disability in Alliance
Health Insurance Coverage by Age in Alliance
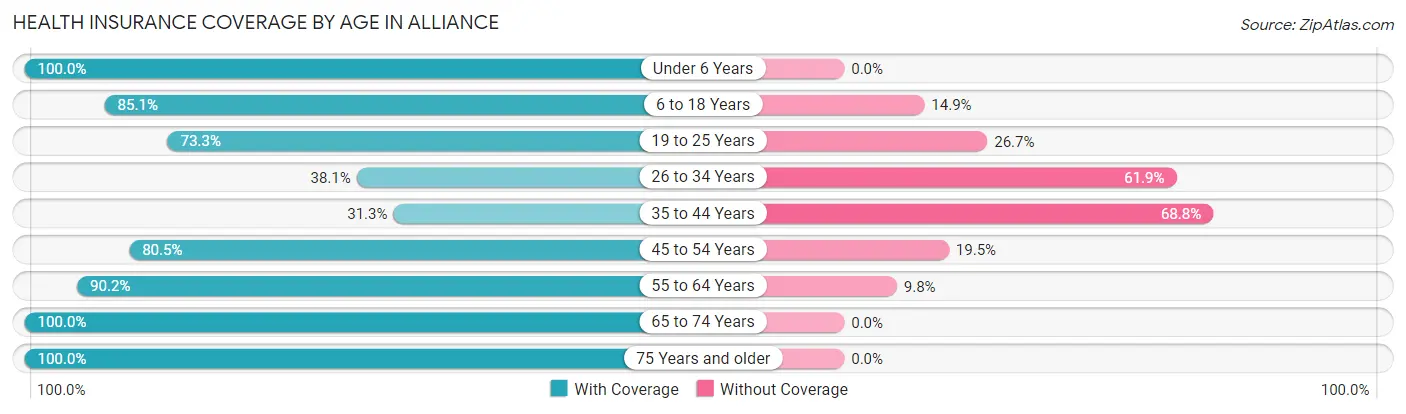
| Age Bracket | With Coverage | Without Coverage |
| Under 6 Years | 46 (100.0%) | 0 (0.0%) |
| 6 to 18 Years | 74 (85.1%) | 13 (14.9%) |
| 19 to 25 Years | 33 (73.3%) | 12 (26.7%) |
| 26 to 34 Years | 16 (38.1%) | 26 (61.9%) |
| 35 to 44 Years | 10 (31.2%) | 22 (68.8%) |
| 45 to 54 Years | 66 (80.5%) | 16 (19.5%) |
| 55 to 64 Years | 92 (90.2%) | 10 (9.8%) |
| 65 to 74 Years | 187 (100.0%) | 0 (0.0%) |
| 75 Years and older | 185 (100.0%) | 0 (0.0%) |
| Total | 709 (87.7%) | 99 (12.2%) |
Health Insurance Coverage by Citizenship Status in Alliance
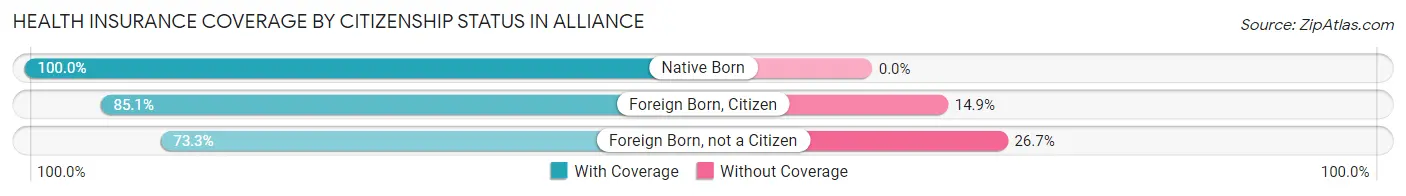
| Citizenship Status | With Coverage | Without Coverage |
| Native Born | 46 (100.0%) | 0 (0.0%) |
| Foreign Born, Citizen | 74 (85.1%) | 13 (14.9%) |
| Foreign Born, not a Citizen | 33 (73.3%) | 12 (26.7%) |
Health Insurance Coverage by Household Income in Alliance
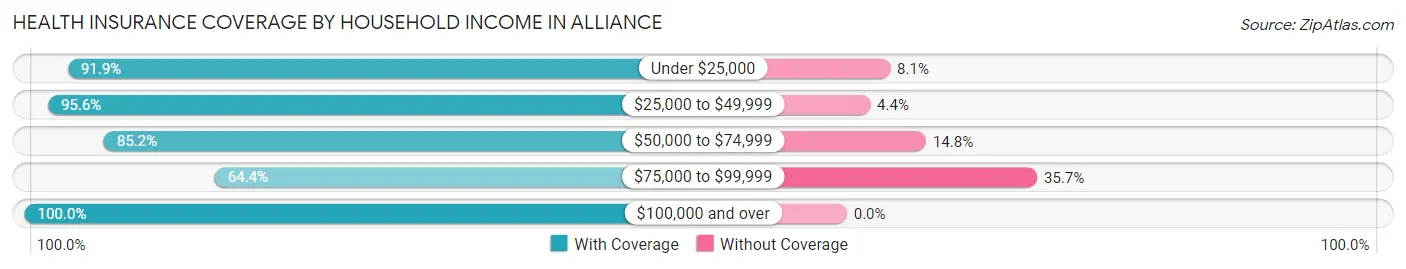
| Household Income | With Coverage | Without Coverage |
| Under $25,000 | 147 (91.9%) | 13 (8.1%) |
| $25,000 to $49,999 | 153 (95.6%) | 7 (4.4%) |
| $50,000 to $74,999 | 218 (85.2%) | 38 (14.8%) |
| $75,000 to $99,999 | 74 (64.3%) | 41 (35.6%) |
| $100,000 and over | 85 (100.0%) | 0 (0.0%) |
Public vs Private Health Insurance Coverage by Age in Alliance
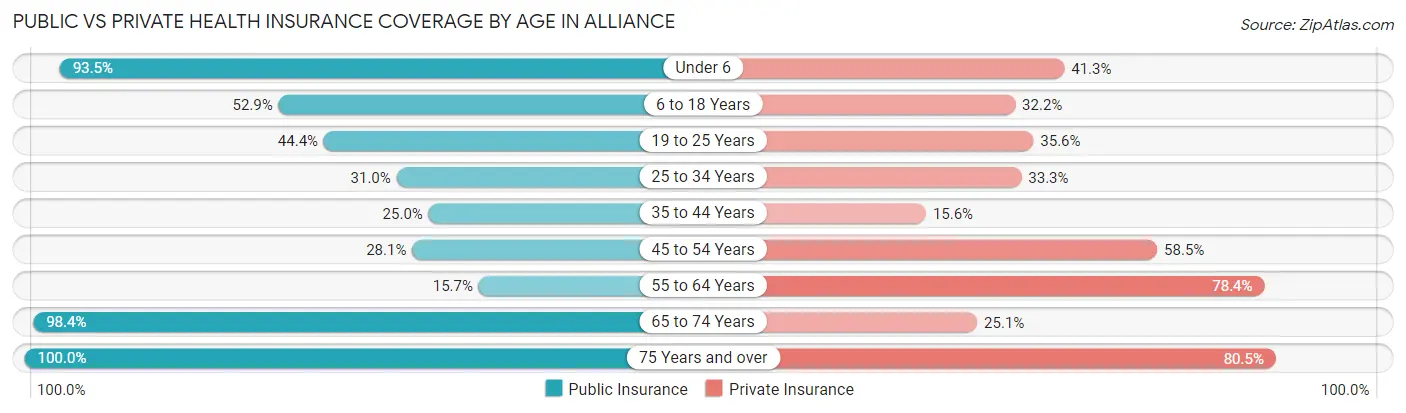
| Age Bracket | Public Insurance | Private Insurance |
| Under 6 | 43 (93.5%) | 19 (41.3%) |
| 6 to 18 Years | 46 (52.9%) | 28 (32.2%) |
| 19 to 25 Years | 20 (44.4%) | 16 (35.6%) |
| 25 to 34 Years | 13 (30.9%) | 14 (33.3%) |
| 35 to 44 Years | 8 (25.0%) | 5 (15.6%) |
| 45 to 54 Years | 23 (28.1%) | 48 (58.5%) |
| 55 to 64 Years | 16 (15.7%) | 80 (78.4%) |
| 65 to 74 Years | 184 (98.4%) | 47 (25.1%) |
| 75 Years and over | 185 (100.0%) | 149 (80.5%) |
| Total | 538 (66.6%) | 406 (50.2%) |
Disability Status by Sex by Age in Alliance
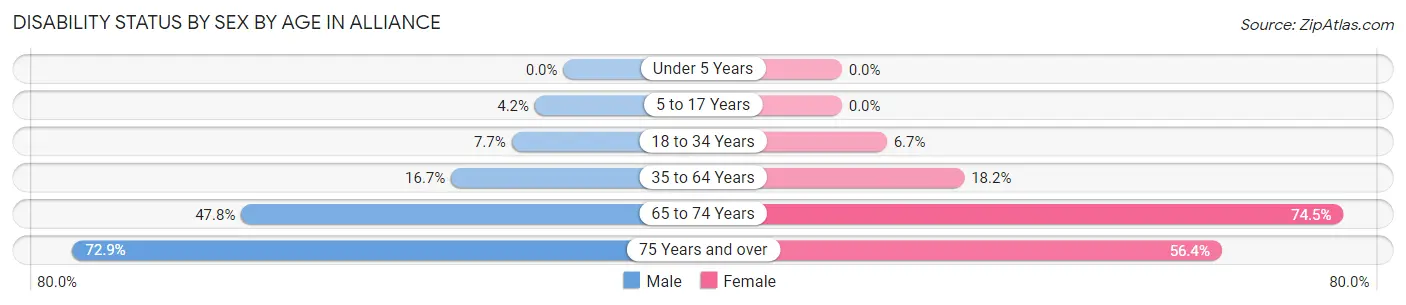
| Age Bracket | Male | Female |
| Under 5 Years | 0 (0.0%) | 0 (0.0%) |
| 5 to 17 Years | 3 (4.2%) | 0 (0.0%) |
| 18 to 34 Years | 5 (7.7%) | 2 (6.7%) |
| 35 to 64 Years | 14 (16.7%) | 24 (18.2%) |
| 65 to 74 Years | 22 (47.8%) | 105 (74.5%) |
| 75 Years and over | 78 (72.9%) | 44 (56.4%) |
Disability Class by Sex by Age in Alliance
Disability Class: Hearing Difficulty
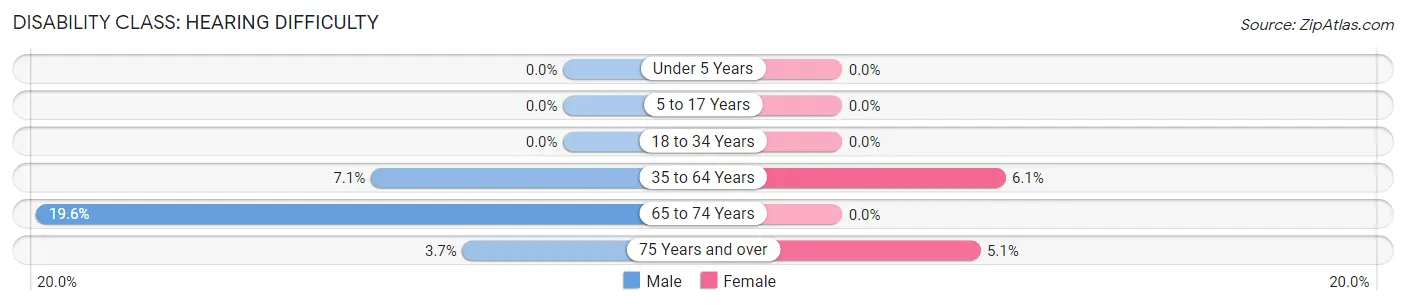
| Age Bracket | Male | Female |
| Under 5 Years | 0 (0.0%) | 0 (0.0%) |
| 5 to 17 Years | 0 (0.0%) | 0 (0.0%) |
| 18 to 34 Years | 0 (0.0%) | 0 (0.0%) |
| 35 to 64 Years | 6 (7.1%) | 8 (6.1%) |
| 65 to 74 Years | 9 (19.6%) | 0 (0.0%) |
| 75 Years and over | 4 (3.7%) | 4 (5.1%) |
Disability Class: Vision Difficulty
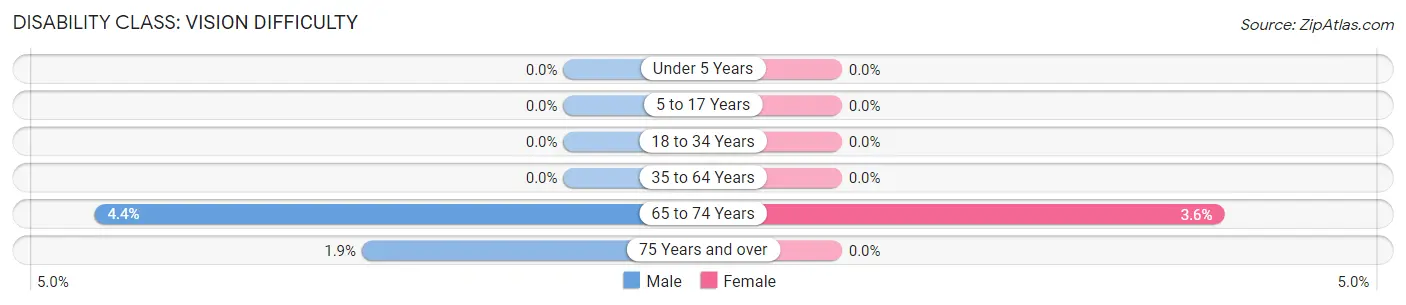
| Age Bracket | Male | Female |
| Under 5 Years | 0 (0.0%) | 0 (0.0%) |
| 5 to 17 Years | 0 (0.0%) | 0 (0.0%) |
| 18 to 34 Years | 0 (0.0%) | 0 (0.0%) |
| 35 to 64 Years | 0 (0.0%) | 0 (0.0%) |
| 65 to 74 Years | 2 (4.3%) | 5 (3.5%) |
| 75 Years and over | 2 (1.9%) | 0 (0.0%) |
Disability Class: Cognitive Difficulty
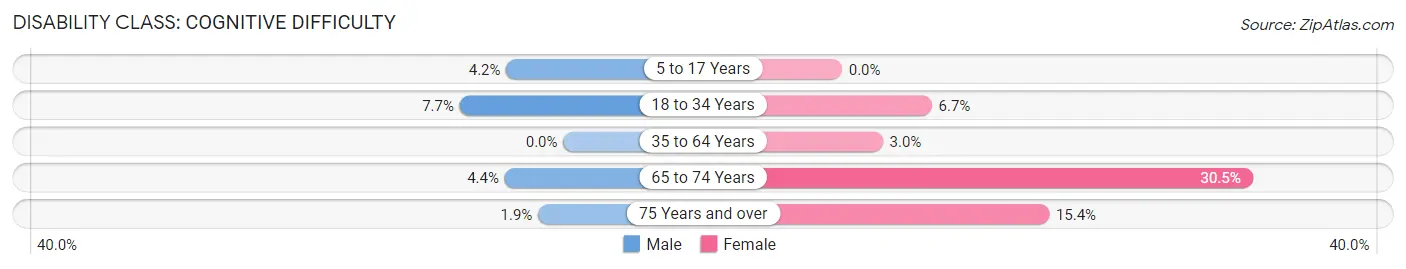
| Age Bracket | Male | Female |
| 5 to 17 Years | 3 (4.2%) | 0 (0.0%) |
| 18 to 34 Years | 5 (7.7%) | 2 (6.7%) |
| 35 to 64 Years | 0 (0.0%) | 4 (3.0%) |
| 65 to 74 Years | 2 (4.3%) | 43 (30.5%) |
| 75 Years and over | 2 (1.9%) | 12 (15.4%) |
Disability Class: Ambulatory Difficulty
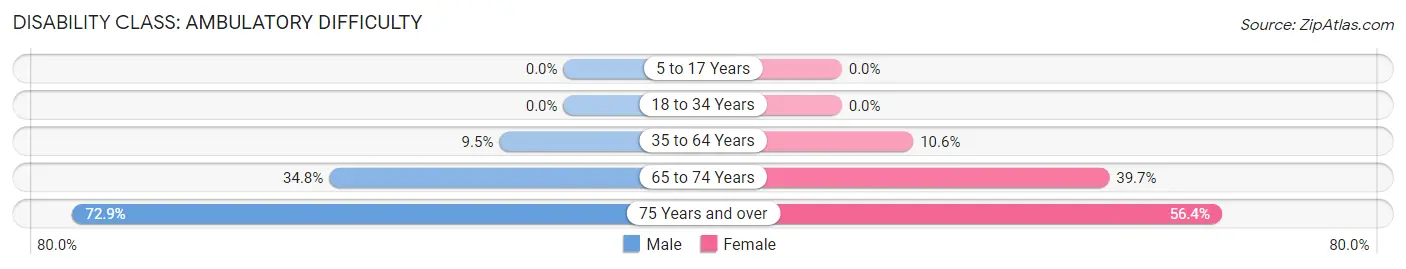
| Age Bracket | Male | Female |
| 5 to 17 Years | 0 (0.0%) | 0 (0.0%) |
| 18 to 34 Years | 0 (0.0%) | 0 (0.0%) |
| 35 to 64 Years | 8 (9.5%) | 14 (10.6%) |
| 65 to 74 Years | 16 (34.8%) | 56 (39.7%) |
| 75 Years and over | 78 (72.9%) | 44 (56.4%) |
Disability Class: Self-Care Difficulty
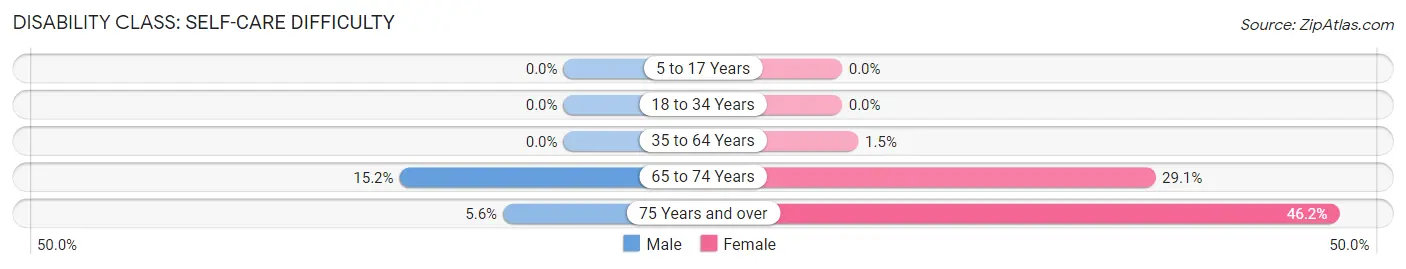
| Age Bracket | Male | Female |
| 5 to 17 Years | 0 (0.0%) | 0 (0.0%) |
| 18 to 34 Years | 0 (0.0%) | 0 (0.0%) |
| 35 to 64 Years | 0 (0.0%) | 2 (1.5%) |
| 65 to 74 Years | 7 (15.2%) | 41 (29.1%) |
| 75 Years and over | 6 (5.6%) | 36 (46.2%) |
Technology Access in Alliance
Computing Device Access in Alliance
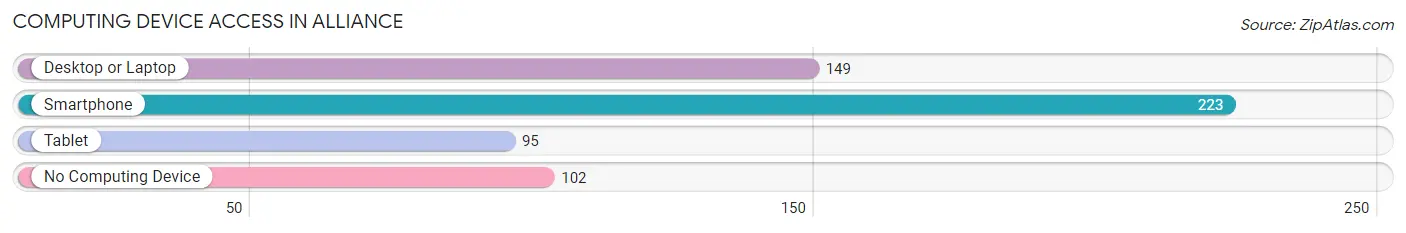
| Device Type | # Households | % Households |
| Desktop or Laptop | 149 | 43.2% |
| Smartphone | 223 | 64.6% |
| Tablet | 95 | 27.5% |
| No Computing Device | 102 | 29.6% |
| Total | 345 | 100.0% |
Internet Access in Alliance
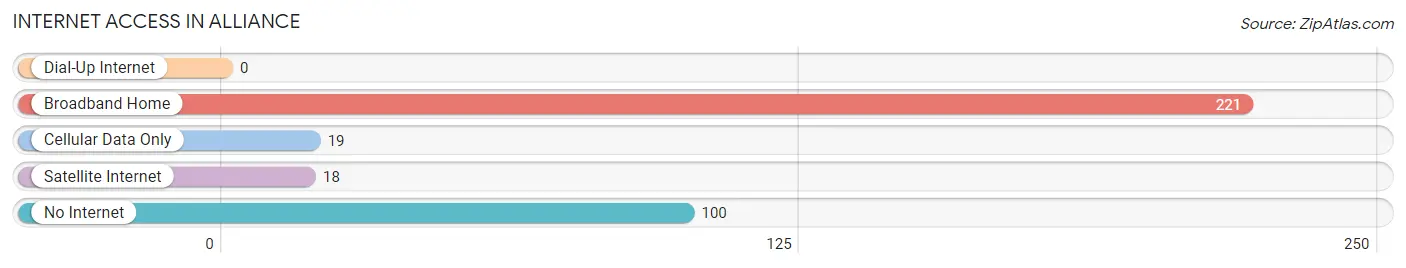
| Internet Type | # Households | % Households |
| Dial-Up Internet | 0 | 0.0% |
| Broadband Home | 221 | 64.1% |
| Cellular Data Only | 19 | 5.5% |
| Satellite Internet | 18 | 5.2% |
| No Internet | 100 | 29.0% |
| Total | 345 | 100.0% |
Alliance Summary
Alliance, North Carolina is a small town located in the western part of the state, in the foothills of the Blue Ridge Mountains. It is situated in the Catawba County, and is part of the Hickory-Lenoir-Morganton Metropolitan Statistical Area. The town has a population of approximately 1,500 people, and is known for its rural charm and friendly atmosphere.
History
Alliance was founded in 1891 by a group of settlers from the nearby town of Hickory. The town was named after the Alliance Manufacturing Company, which was established in the area in 1892. The company was a major employer in the area, and provided jobs for many of the town’s residents. The town was incorporated in 1895, and the first mayor was elected in 1896.
In the early 1900s, Alliance was a thriving community, with a variety of businesses and industries. The town was home to several mills, a furniture factory, a canning factory, and a brickyard. The town also had a number of stores, including a general store, a drug store, and a hardware store.
In the 1950s, the town began to decline as many of the businesses and industries moved away. The Alliance Manufacturing Company closed in the 1960s, and the town’s population began to decline. In the 1970s, the town began to experience a resurgence, as new businesses and industries moved into the area.
Geography
Alliance is located in the western part of Catawba County, in the foothills of the Blue Ridge Mountains. The town is situated at an elevation of 1,000 feet, and is surrounded by rolling hills and forests. The town is located near the Catawba River, and is approximately 25 miles from the city of Hickory.
Economy
Alliance’s economy is largely based on agriculture and tourism. The town is home to several farms, and the surrounding area is known for its apple orchards and vineyards. The town also has a number of small businesses, including restaurants, shops, and a hardware store.
The town is also home to a number of tourist attractions, including the Catawba River, the Hickory Motor Speedway, and the Hickory Museum of Art. The town is also home to a number of festivals and events, including the Catawba County Fair and the Hickory Crawdads baseball games.
Demographics
As of the 2010 census, the population of Alliance was 1,500. The town is predominantly white, with a small African American population. The median household income is $35,000, and the median home value is $125,000. The town has a low unemployment rate, and the majority of the population is employed in the agricultural and tourism industries.
Common Questions
What is the Total Population of Alliance?
Total Population of Alliance is 842.
What is the Total Male Population of Alliance?
Total Male Population of Alliance is 415.
What is the Total Female Population of Alliance?
Total Female Population of Alliance is 427.
What is the Ratio of Males per 100 Females in Alliance?
There are 97.19 Males per 100 Females in Alliance.
What is the Ratio of Females per 100 Males in Alliance?
There are 102.89 Females per 100 Males in Alliance.
What is the Median Population Age in Alliance?
Median Population Age in Alliance is 63.5 Years.
What is the Average Family Size in Alliance
Average Family Size in Alliance is 2.9 People.
What is the Average Household Size in Alliance
Average Household Size in Alliance is 2.2 People.
What is Per Capita Income in Alliance?
Per Capita income in Alliance is $23,186.
What is the Median Family Income in Alliance?
Median Family Income in Alliance is $63,227.
What is the Median Household income in Alliance?
Median Household Income in Alliance is $39,432.
What is Income or Wage Gap in Alliance?
Income or Wage Gap in Alliance is 35.3%.
Women in Alliance earn 64.7 cents for every dollar earned by a man.
What is Family Income Deficit in Alliance?
Family Income Deficit in Alliance is $8,982.
Families that are below poverty line in Alliance earn $8,982 less on average than the poverty threshold level.
What is Inequality or Gini Index in Alliance?
Inequality or Gini Index in Alliance is 0.45.
How Large is the Labor Force in Alliance?
There are 259 People in the Labor Forcein in Alliance.
What is the Percentage of People in the Labor Force in Alliance?
33.5% of People are in the Labor Force in Alliance.
What is the Unemployment Rate in Alliance?
Unemployment Rate in Alliance is 6.9%.