Carolina Shores, NC
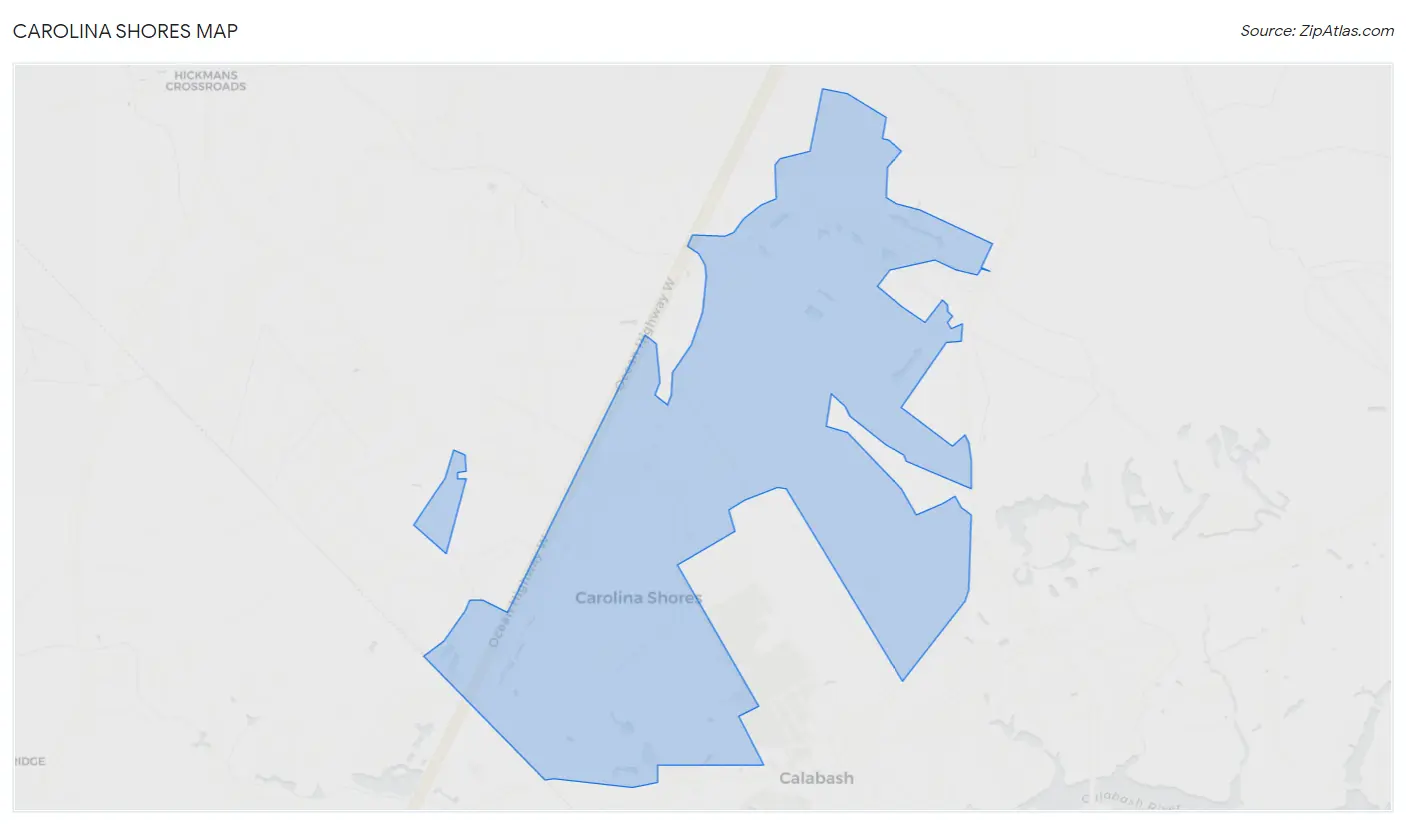
Carolina Shores Map
Carolina Shores Overview
4,643
TOTAL POPULATION
2,279
MALE POPULATION
2,364
FEMALE POPULATION
96.40
MALES / 100 FEMALES
103.73
FEMALES / 100 MALES
65.5
MEDIAN AGE
2.3
AVG FAMILY SIZE
2.0
AVG HOUSEHOLD SIZE
$43,920
PER CAPITA INCOME
$88,741
AVG FAMILY INCOME
$77,259
AVG HOUSEHOLD INCOME
22.0%
WAGE / INCOME GAP [ % ]
78.0¢/ $1
WAGE / INCOME GAP [ $ ]
0.35
INEQUALITY / GINI INDEX
1,728
LABOR FORCE [ PEOPLE ]
39.5%
PERCENT IN LABOR FORCE
7.7%
UNEMPLOYMENT RATE
Carolina Shores Area Codes
Race in Carolina Shores
The most populous races in Carolina Shores are White / Caucasian (4,315 | 92.9%), Some other Race (165 | 3.5%), and Two or more Races (149 | 3.2%).
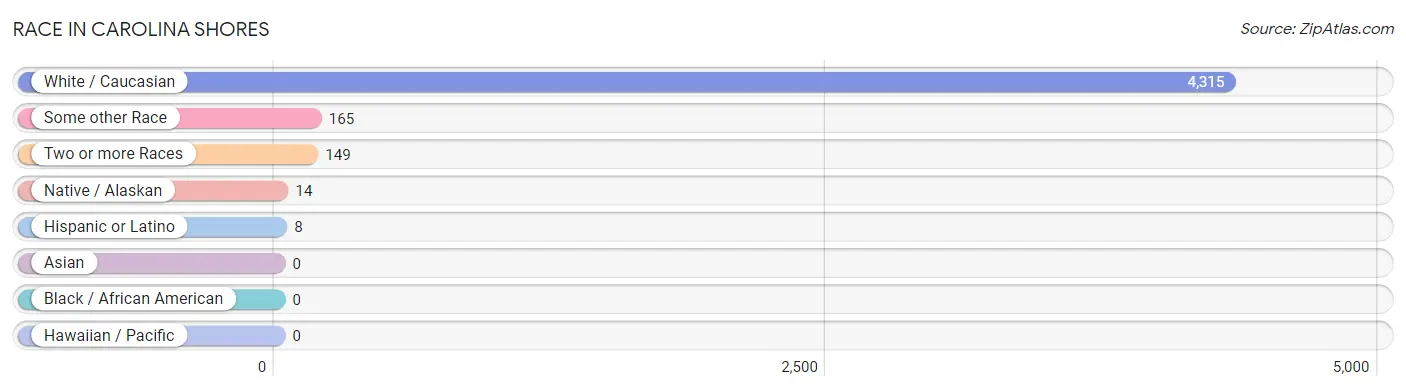
| Race | # Population | % Population |
| Asian | 0 | 0.0% |
| Black / African American | 0 | 0.0% |
| Hawaiian / Pacific | 0 | 0.0% |
| Hispanic or Latino | 8 | 0.2% |
| Native / Alaskan | 14 | 0.3% |
| White / Caucasian | 4,315 | 92.9% |
| Two or more Races | 149 | 3.2% |
| Some other Race | 165 | 3.5% |
| Total | 4,643 | 100.0% |
Ancestry in Carolina Shores
The most populous ancestries reported in Carolina Shores are Irish (1,017 | 21.9%), German (966 | 20.8%), English (759 | 16.4%), Italian (750 | 16.2%), and American (346 | 7.4%), together accounting for 82.7% of all Carolina Shores residents.
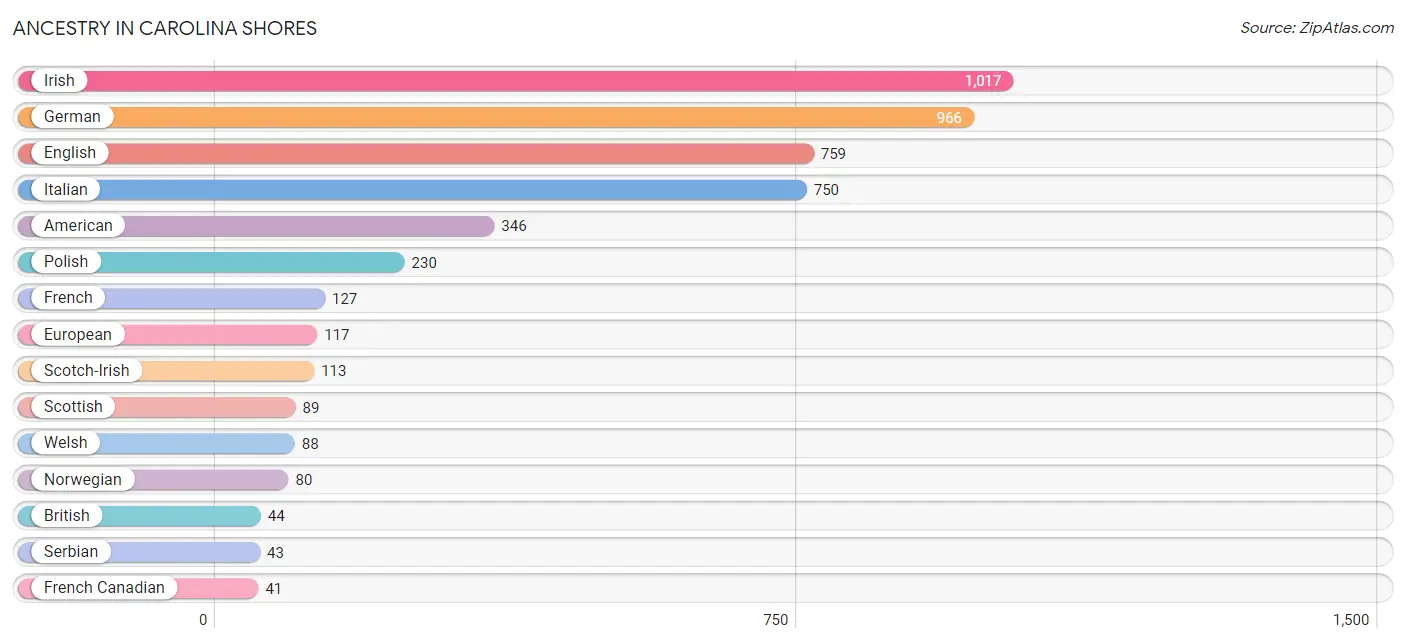
| Ancestry | # Population | % Population |
| American | 346 | 7.4% |
| Armenian | 18 | 0.4% |
| British | 44 | 0.9% |
| Canadian | 36 | 0.8% |
| Cherokee | 14 | 0.3% |
| Czech | 15 | 0.3% |
| Czechoslovakian | 16 | 0.3% |
| Danish | 24 | 0.5% |
| English | 759 | 16.4% |
| European | 117 | 2.5% |
| French | 127 | 2.7% |
| French Canadian | 41 | 0.9% |
| German | 966 | 20.8% |
| Hungarian | 26 | 0.6% |
| Irish | 1,017 | 21.9% |
| Italian | 750 | 16.2% |
| Norwegian | 80 | 1.7% |
| Polish | 230 | 5.0% |
| Puerto Rican | 8 | 0.2% |
| Scotch-Irish | 113 | 2.4% |
| Scottish | 89 | 1.9% |
| Serbian | 43 | 0.9% |
| Slovak | 15 | 0.3% |
| Slovene | 11 | 0.2% |
| Swedish | 17 | 0.4% |
| Swiss | 14 | 0.3% |
| Ukrainian | 14 | 0.3% |
| Welsh | 88 | 1.9% | View All 28 Rows |
Immigrants in Carolina Shores
The most numerous immigrant groups reported in Carolina Shores came from Europe (103 | 2.2%), Northern Europe (62 | 1.3%), Eastern Europe (26 | 0.6%), Hungary (26 | 0.6%), and Ireland (16 | 0.3%), together accounting for 5.0% of all Carolina Shores residents.
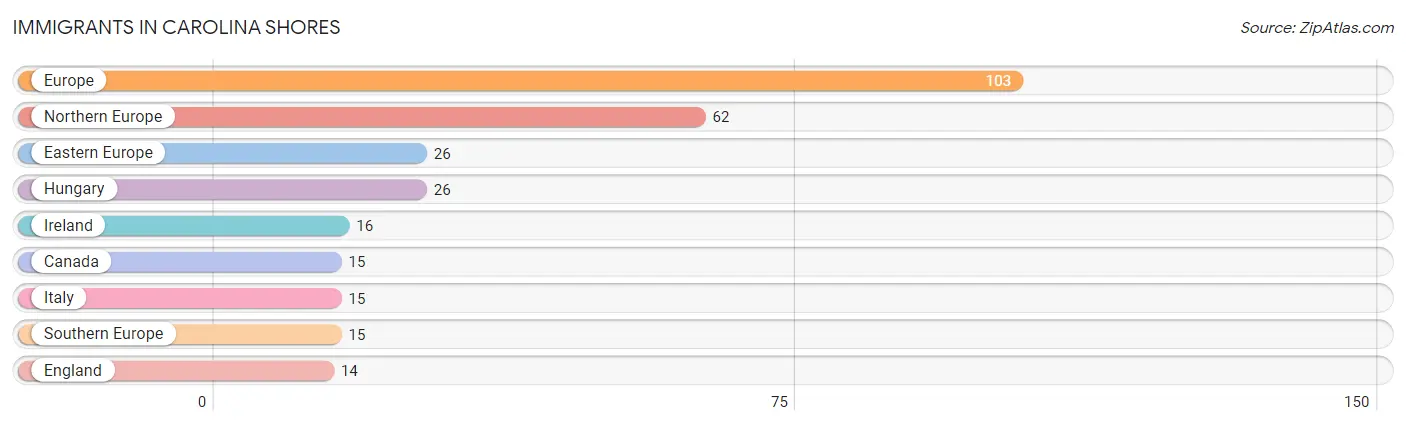
| Immigration Origin | # Population | % Population |
| Canada | 15 | 0.3% |
| Eastern Europe | 26 | 0.6% |
| England | 14 | 0.3% |
| Europe | 103 | 2.2% |
| Hungary | 26 | 0.6% |
| Ireland | 16 | 0.3% |
| Italy | 15 | 0.3% |
| Northern Europe | 62 | 1.3% |
| Southern Europe | 15 | 0.3% | View All 9 Rows |
Sex and Age in Carolina Shores
Sex and Age in Carolina Shores
The most populous age groups in Carolina Shores are 70 to 74 Years (374 | 16.4%) for men and 60 to 64 Years (482 | 20.4%) for women.
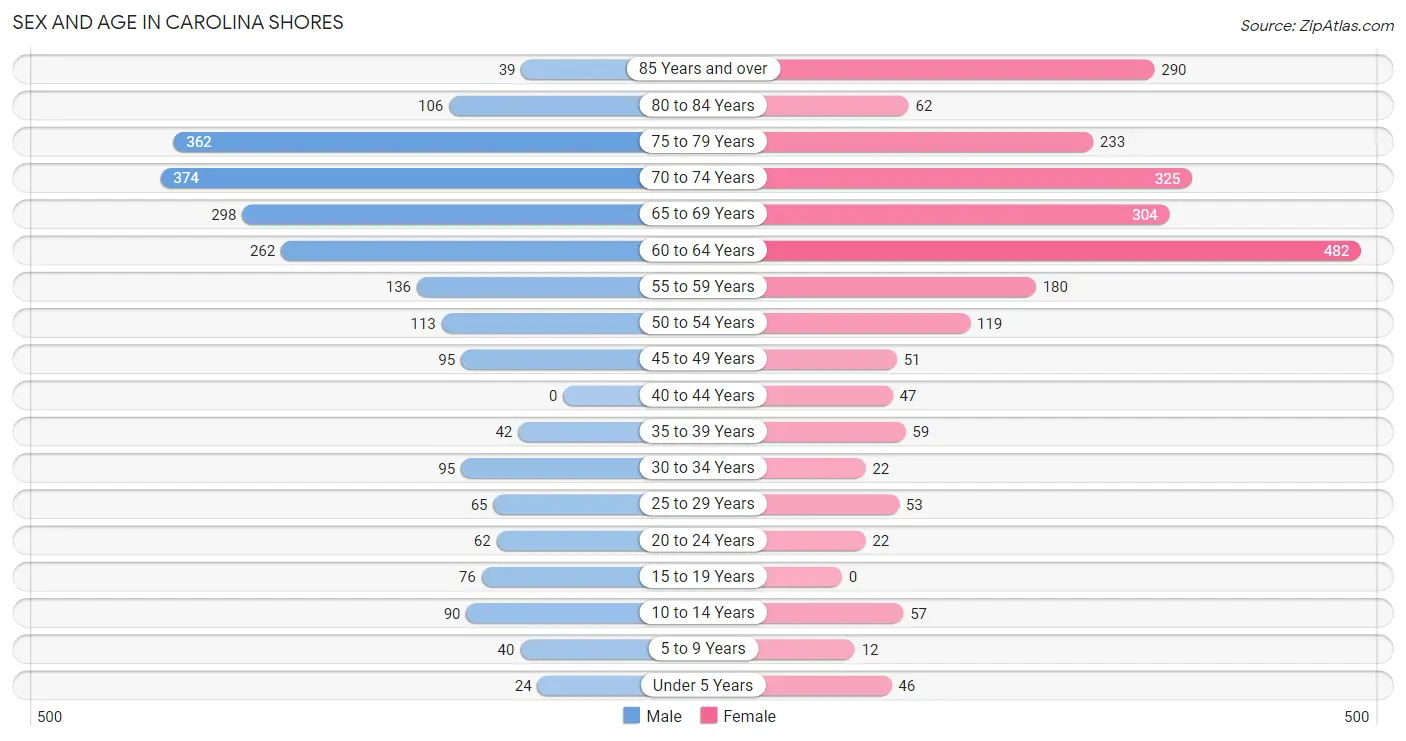
| Age Bracket | Male | Female |
| Under 5 Years | 24 (1.1%) | 46 (1.9%) |
| 5 to 9 Years | 40 (1.8%) | 12 (0.5%) |
| 10 to 14 Years | 90 (4.0%) | 57 (2.4%) |
| 15 to 19 Years | 76 (3.3%) | 0 (0.0%) |
| 20 to 24 Years | 62 (2.7%) | 22 (0.9%) |
| 25 to 29 Years | 65 (2.9%) | 53 (2.2%) |
| 30 to 34 Years | 95 (4.2%) | 22 (0.9%) |
| 35 to 39 Years | 42 (1.8%) | 59 (2.5%) |
| 40 to 44 Years | 0 (0.0%) | 47 (2.0%) |
| 45 to 49 Years | 95 (4.2%) | 51 (2.2%) |
| 50 to 54 Years | 113 (5.0%) | 119 (5.0%) |
| 55 to 59 Years | 136 (6.0%) | 180 (7.6%) |
| 60 to 64 Years | 262 (11.5%) | 482 (20.4%) |
| 65 to 69 Years | 298 (13.1%) | 304 (12.9%) |
| 70 to 74 Years | 374 (16.4%) | 325 (13.8%) |
| 75 to 79 Years | 362 (15.9%) | 233 (9.9%) |
| 80 to 84 Years | 106 (4.6%) | 62 (2.6%) |
| 85 Years and over | 39 (1.7%) | 290 (12.3%) |
| Total | 2,279 (100.0%) | 2,364 (100.0%) |
Families and Households in Carolina Shores
Median Family Size in Carolina Shores
The median family size in Carolina Shores is 2.30 persons per family, with single male/father families (42 | 2.5%) accounting for the largest median family size of 2.79 persons per family. On the other hand, single female/mother families (187 | 11.1%) represent the smallest median family size with 1.36 persons per family.
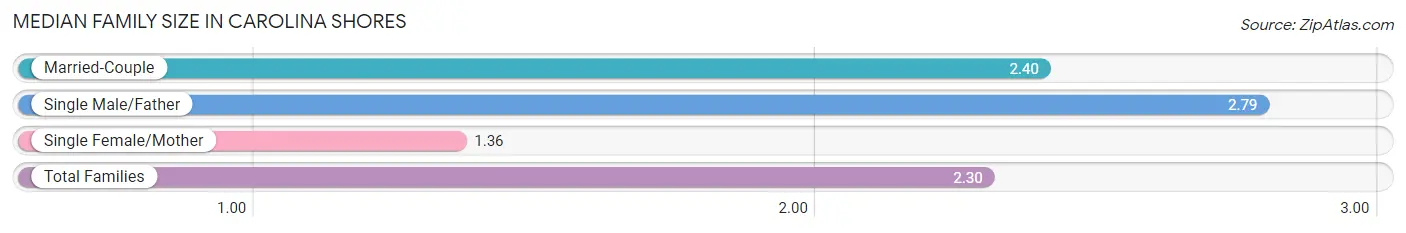
| Family Type | # Families | Family Size |
| Married-Couple | 1,452 (86.4%) | 2.40 |
| Single Male/Father | 42 (2.5%) | 2.79 |
| Single Female/Mother | 187 (11.1%) | 1.36 |
| Total Families | 1,681 (100.0%) | 2.30 |
Median Household Size in Carolina Shores
The median household size in Carolina Shores is 1.97 persons per household, with single male/father households (42 | 1.8%) accounting for the largest median household size of 3 persons per household. non-family households (673 | 28.6%) represent the smallest median household size with 1.11 persons per household.
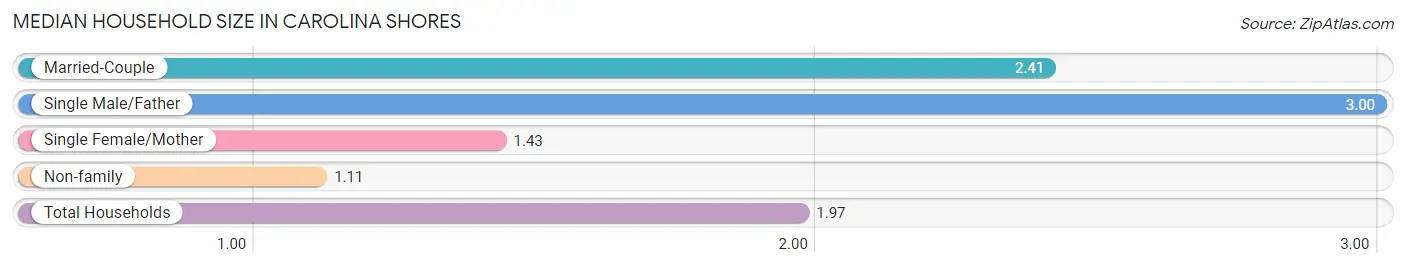
| Household Type | # Households | Household Size |
| Married-Couple | 1,452 (61.7%) | 2.41 |
| Single Male/Father | 42 (1.8%) | 3.00 |
| Single Female/Mother | 187 (7.9%) | 1.43 |
| Non-family | 673 (28.6%) | 1.11 |
| Total Households | 2,354 (100.0%) | 1.97 |
Household Size by Marriage Status in Carolina Shores
Out of a total of 2,354 households in Carolina Shores, 1,681 (71.4%) are family households, while 673 (28.6%) are nonfamily households. The most numerous type of family households are 2-person households, comprising 1,354, and the most common type of nonfamily households are 1-person households, comprising 556.
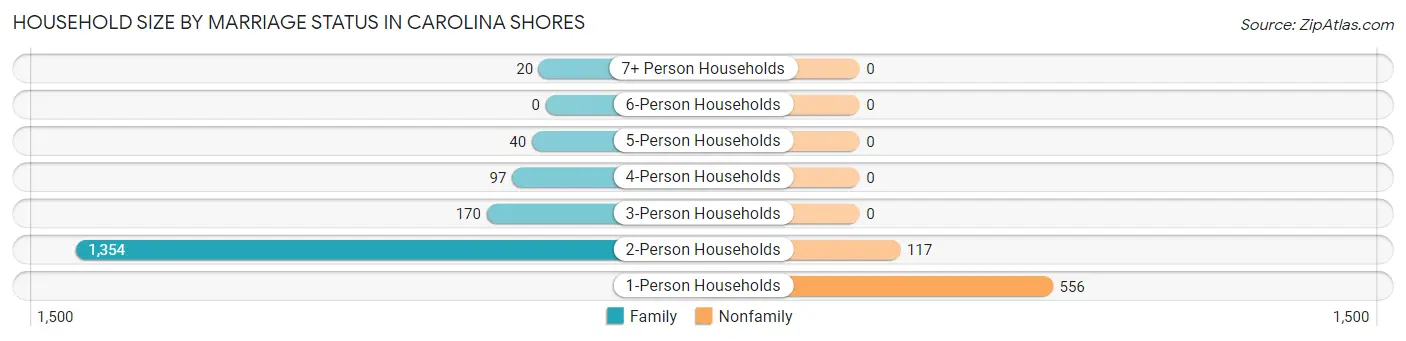
| Household Size | Family Households | Nonfamily Households |
| 1-Person Households | - | 556 (23.6%) |
| 2-Person Households | 1,354 (57.5%) | 117 (5.0%) |
| 3-Person Households | 170 (7.2%) | 0 (0.0%) |
| 4-Person Households | 97 (4.1%) | 0 (0.0%) |
| 5-Person Households | 40 (1.7%) | 0 (0.0%) |
| 6-Person Households | 0 (0.0%) | 0 (0.0%) |
| 7+ Person Households | 20 (0.9%) | 0 (0.0%) |
| Total | 1,681 (71.4%) | 673 (28.6%) |
Female Fertility in Carolina Shores
Fertility by Age in Carolina Shores
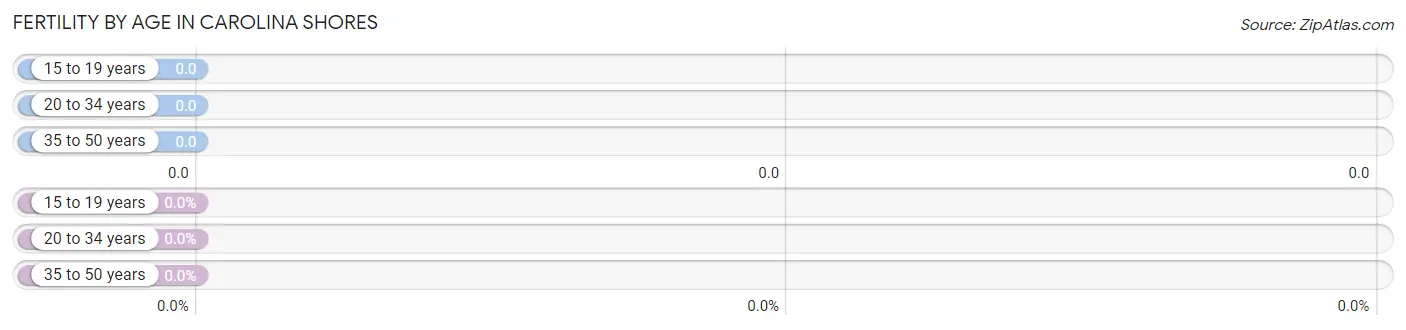
| Age Bracket | Women with Births | Births / 1,000 Women |
| 15 to 19 years | 0 (0.0%) | 0.0 |
| 20 to 34 years | 0 (0.0%) | 0.0 |
| 35 to 50 years | 0 (0.0%) | 0.0 |
| Total | 0 (0.0%) | 0.0 |
Fertility by Age by Marriage Status in Carolina Shores
| Age Bracket | Married | Unmarried |
| 15 to 19 years | 0 (0.0%) | 0 (0.0%) |
| 20 to 34 years | 0 (0.0%) | 0 (0.0%) |
| 35 to 50 years | 0 (0.0%) | 0 (0.0%) |
| Total | 0 (0.0%) | 0 (0.0%) |
Fertility by Education in Carolina Shores
| Educational Attainment | Women with Births | Births / 1,000 Women |
| Less than High School | 0 (0.0%) | 0.0 |
| High School Diploma | 0 (0.0%) | 0.0 |
| College or Associate's Degree | 0 (0.0%) | 0.0 |
| Bachelor's Degree | 0 (0.0%) | 0.0 |
| Graduate Degree | 0 (0.0%) | 0.0 |
| Total | 0 (0.0%) | 0.0 |
Fertility by Education by Marriage Status in Carolina Shores
| Educational Attainment | Married | Unmarried |
| Less than High School | 0 (0.0%) | 0 (0.0%) |
| High School Diploma | 0 (0.0%) | 0 (0.0%) |
| College or Associate's Degree | 0 (0.0%) | 0 (0.0%) |
| Bachelor's Degree | 0 (0.0%) | 0 (0.0%) |
| Graduate Degree | 0 (0.0%) | 0 (0.0%) |
| Total | 0 (0.0%) | 0 (0.0%) |
Income in Carolina Shores
Income Overview in Carolina Shores
Per Capita Income in Carolina Shores is $43,920, while median incomes of families and households are $88,741 and $77,259 respectively.
| Characteristic | Number | Measure |
| Per Capita Income | 4,643 | $43,920 |
| Median Family Income | 1,681 | $88,741 |
| Mean Family Income | 1,681 | $98,578 |
| Median Household Income | 2,354 | $77,259 |
| Mean Household Income | 2,354 | $87,949 |
| Income Deficit | 1,681 | $0 |
| Wage / Income Gap (%) | 4,643 | 21.97% |
| Wage / Income Gap ($) | 4,643 | 78.03¢ per $1 |
| Gini / Inequality Index | 4,643 | 0.35 |
Earnings by Sex in Carolina Shores
Average Earnings in Carolina Shores are $33,418, $28,018 for men and $35,909 for women, a difference of 22.0%.
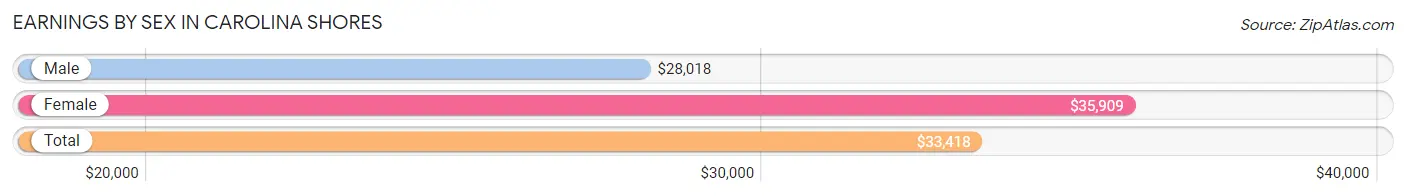
| Sex | Number | Average Earnings |
| Male | 1,039 (57.8%) | $28,018 |
| Female | 760 (42.2%) | $35,909 |
| Total | 1,799 (100.0%) | $33,418 |
Earnings by Sex by Income Bracket in Carolina Shores
The most common earnings brackets in Carolina Shores are $100,000+ for men (204 | 19.6%) and $55,000 to $64,999 for women (90 | 11.8%).
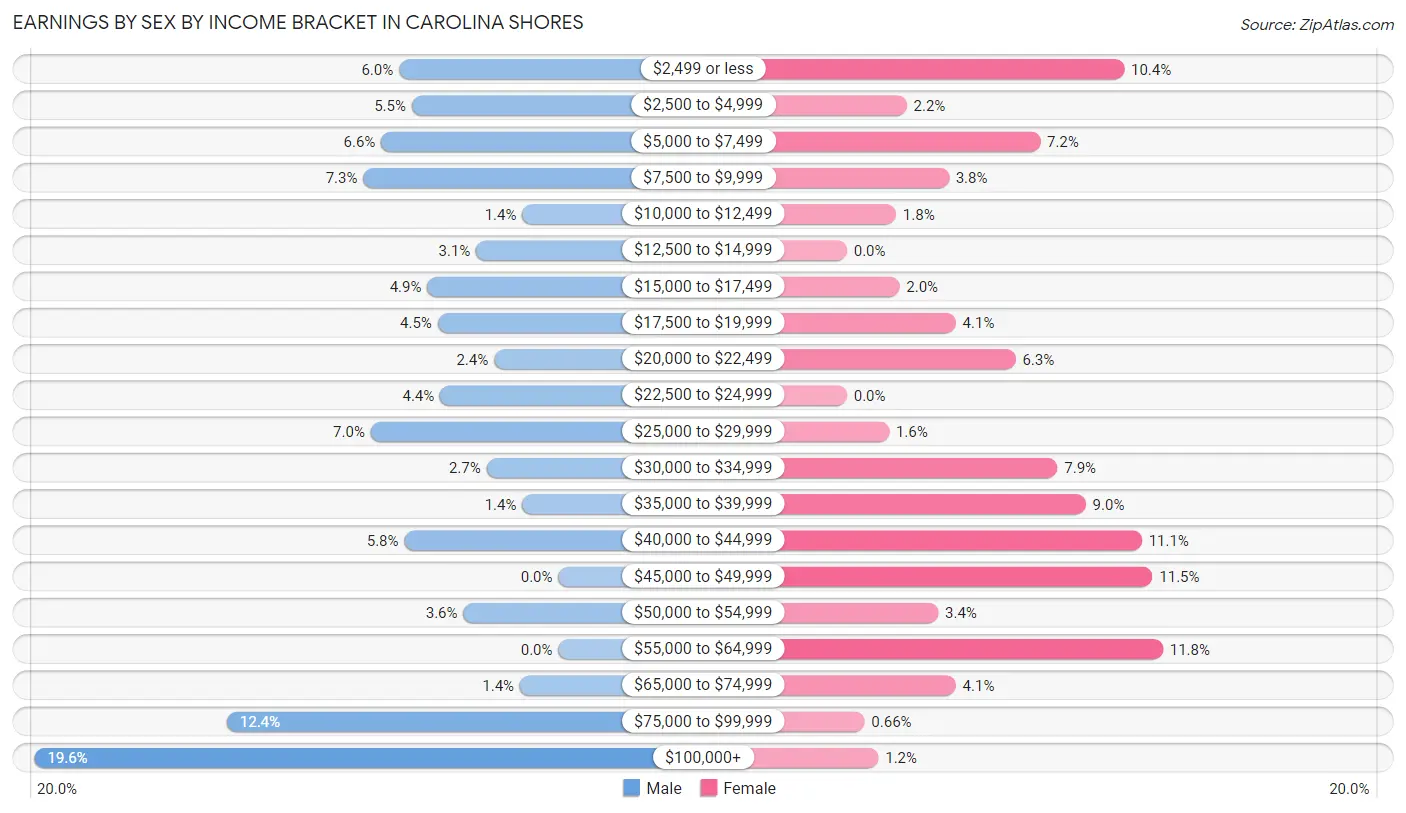
| Income | Male | Female |
| $2,499 or less | 62 (6.0%) | 79 (10.4%) |
| $2,500 to $4,999 | 57 (5.5%) | 17 (2.2%) |
| $5,000 to $7,499 | 69 (6.6%) | 55 (7.2%) |
| $7,500 to $9,999 | 76 (7.3%) | 29 (3.8%) |
| $10,000 to $12,499 | 14 (1.3%) | 14 (1.8%) |
| $12,500 to $14,999 | 32 (3.1%) | 0 (0.0%) |
| $15,000 to $17,499 | 51 (4.9%) | 15 (2.0%) |
| $17,500 to $19,999 | 47 (4.5%) | 31 (4.1%) |
| $20,000 to $22,499 | 25 (2.4%) | 48 (6.3%) |
| $22,500 to $24,999 | 46 (4.4%) | 0 (0.0%) |
| $25,000 to $29,999 | 73 (7.0%) | 12 (1.6%) |
| $30,000 to $34,999 | 28 (2.7%) | 60 (7.9%) |
| $35,000 to $39,999 | 14 (1.3%) | 68 (8.9%) |
| $40,000 to $44,999 | 60 (5.8%) | 84 (11.1%) |
| $45,000 to $49,999 | 0 (0.0%) | 87 (11.5%) |
| $50,000 to $54,999 | 37 (3.6%) | 26 (3.4%) |
| $55,000 to $64,999 | 0 (0.0%) | 90 (11.8%) |
| $65,000 to $74,999 | 15 (1.4%) | 31 (4.1%) |
| $75,000 to $99,999 | 129 (12.4%) | 5 (0.7%) |
| $100,000+ | 204 (19.6%) | 9 (1.2%) |
| Total | 1,039 (100.0%) | 760 (100.0%) |
Earnings by Sex by Educational Attainment in Carolina Shores
Average earnings in Carolina Shores are $34,732 for men and $36,409 for women, a difference of 4.6%. Men with an educational attainment of high school diploma enjoy the highest average annual earnings of $23,555, while those with high school diploma education earn the least with $23,555. Women with an educational attainment of graduate degree earn the most with the average annual earnings of $59,375, while those with high school diploma education have the smallest earnings of $30,469.
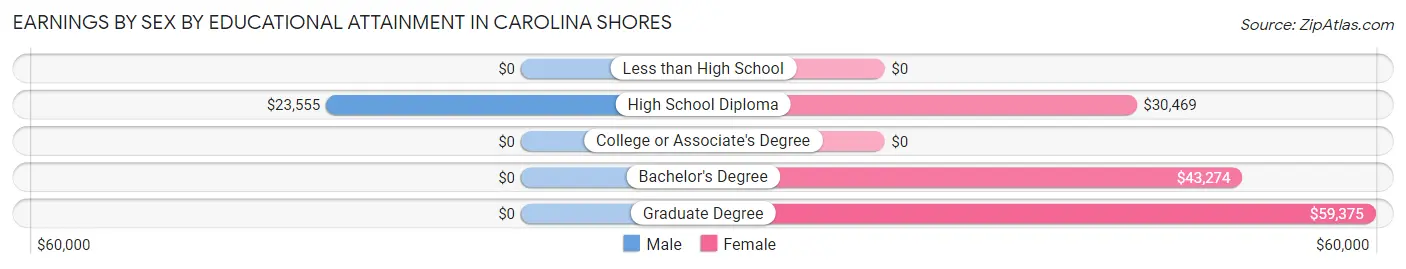
| Educational Attainment | Male Income | Female Income |
| Less than High School | - | - |
| High School Diploma | $23,555 | $30,469 |
| College or Associate's Degree | - | - |
| Bachelor's Degree | - | - |
| Graduate Degree | - | - |
| Total | $34,732 | $36,409 |
Family Income in Carolina Shores
Family Income Brackets in Carolina Shores
According to the Carolina Shores family income data, there are 550 families falling into the $75,000 to $99,999 income range, which is the most common income bracket and makes up 32.7% of all families.
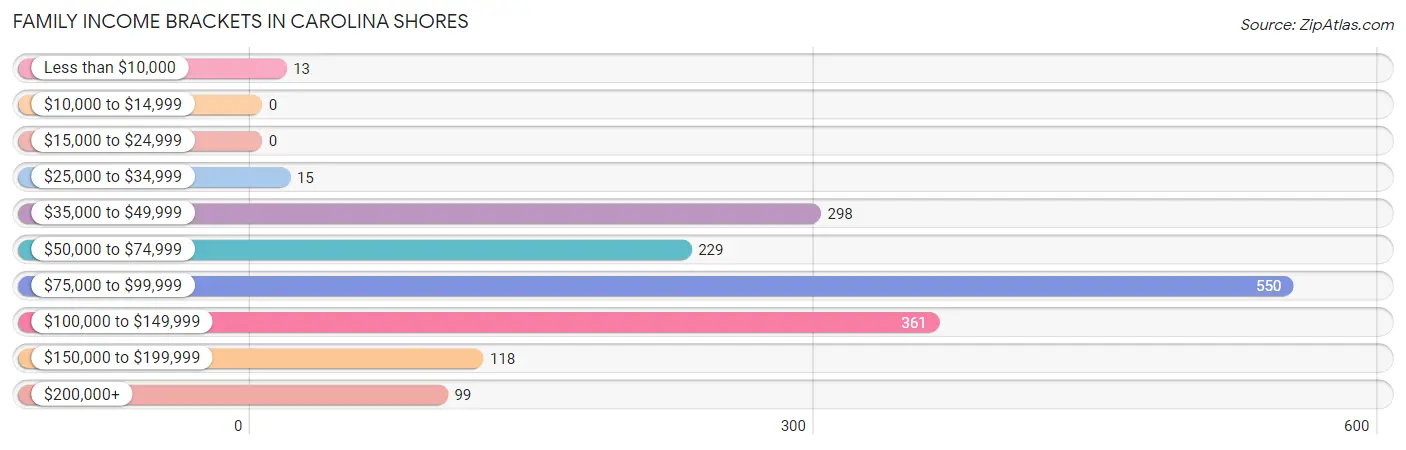
| Income Bracket | # Families | % Families |
| Less than $10,000 | 13 | 0.8% |
| $10,000 to $14,999 | 0 | 0.0% |
| $15,000 to $24,999 | 0 | 0.0% |
| $25,000 to $34,999 | 15 | 0.9% |
| $35,000 to $49,999 | 298 | 17.7% |
| $50,000 to $74,999 | 229 | 13.6% |
| $75,000 to $99,999 | 550 | 32.7% |
| $100,000 to $149,999 | 361 | 21.5% |
| $150,000 to $199,999 | 118 | 7.0% |
| $200,000+ | 99 | 5.9% |
Family Income by Famaliy Size in Carolina Shores
4-person families (75 | 4.5%) account for the highest median family income in Carolina Shores with $121,964 per family, while 2-person families (1,354 | 80.5%) have the highest median income of $42,242 per family member.
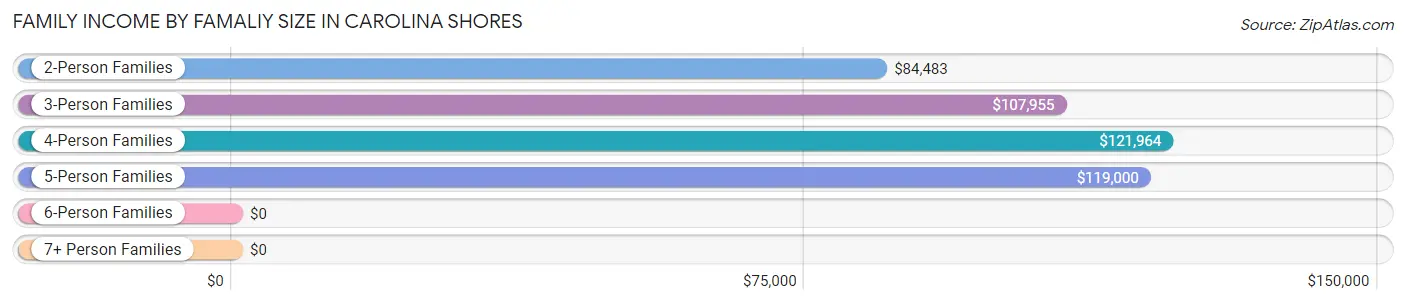
| Income Bracket | # Families | Median Income |
| 2-Person Families | 1,354 (80.5%) | $84,483 |
| 3-Person Families | 192 (11.4%) | $107,955 |
| 4-Person Families | 75 (4.5%) | $121,964 |
| 5-Person Families | 40 (2.4%) | $119,000 |
| 6-Person Families | 0 (0.0%) | $0 |
| 7+ Person Families | 20 (1.2%) | $0 |
| Total | 1,681 (100.0%) | $88,741 |
Family Income by Number of Earners in Carolina Shores
The median family income in Carolina Shores is $88,741, with families comprising 3+ earners (88) having the highest median family income of $121,429, while families with 1 earner (646) have the lowest median family income of $77,500, accounting for 5.2% and 38.4% of families, respectively.
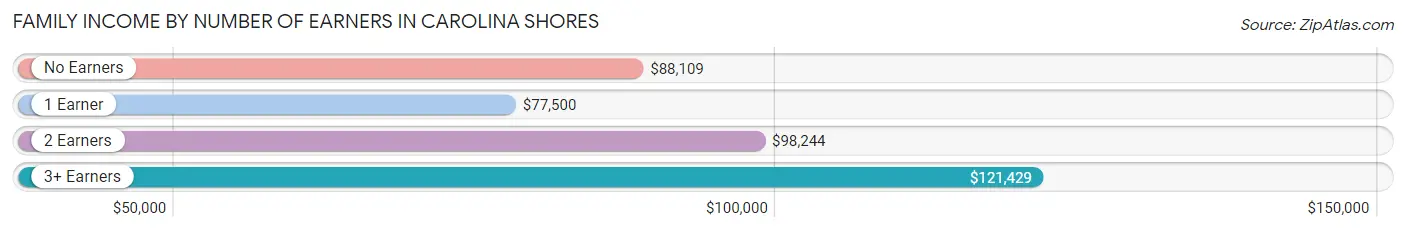
| Number of Earners | # Families | Median Income |
| No Earners | 626 (37.2%) | $88,109 |
| 1 Earner | 646 (38.4%) | $77,500 |
| 2 Earners | 321 (19.1%) | $98,244 |
| 3+ Earners | 88 (5.2%) | $121,429 |
| Total | 1,681 (100.0%) | $88,741 |
Household Income in Carolina Shores
Household Income Brackets in Carolina Shores
With 572 households falling in the category, the $75,000 to $99,999 income range is the most frequent in Carolina Shores, accounting for 24.3% of all households.
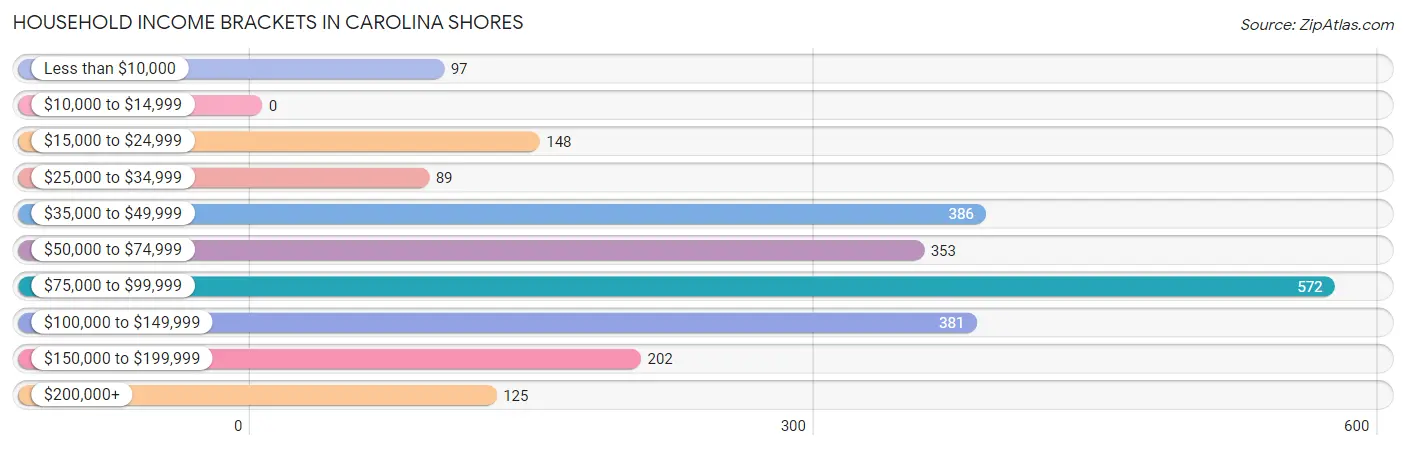
| Income Bracket | # Households | % Households |
| Less than $10,000 | 97 | 4.1% |
| $10,000 to $14,999 | 0 | 0.0% |
| $15,000 to $24,999 | 148 | 6.3% |
| $25,000 to $34,999 | 89 | 3.8% |
| $35,000 to $49,999 | 386 | 16.4% |
| $50,000 to $74,999 | 353 | 15.0% |
| $75,000 to $99,999 | 572 | 24.3% |
| $100,000 to $149,999 | 381 | 16.2% |
| $150,000 to $199,999 | 202 | 8.6% |
| $200,000+ | 125 | 5.3% |
Household Income by Householder Age in Carolina Shores
The median household income in Carolina Shores is $77,259, with the highest median household income of $115,114 found in the 45 to 64 years age bracket for the primary householder. A total of 787 households (33.4%) fall into this category.
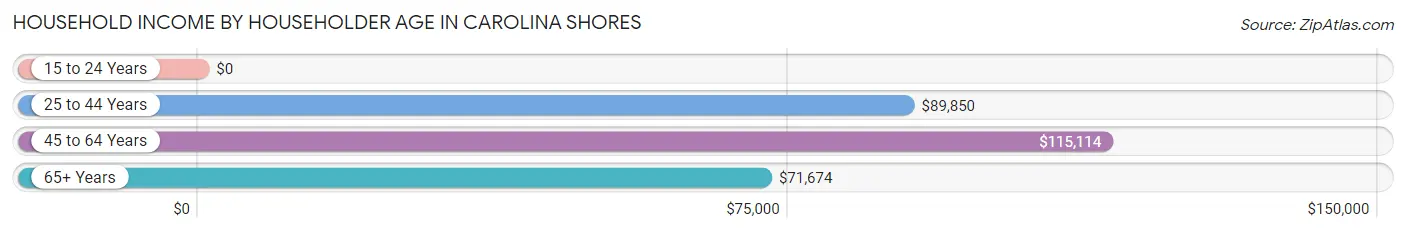
| Income Bracket | # Households | Median Income |
| 15 to 24 Years | 0 (0.0%) | $0 |
| 25 to 44 Years | 93 (4.0%) | $89,850 |
| 45 to 64 Years | 787 (33.4%) | $115,114 |
| 65+ Years | 1,474 (62.6%) | $71,674 |
| Total | 2,354 (100.0%) | $77,259 |
Poverty in Carolina Shores
Income Below Poverty by Sex and Age in Carolina Shores
With 0.6% poverty level for males and 4.1% for females among the residents of Carolina Shores, 45 to 54 year old males and 75 year old and over females are the most vulnerable to poverty, with 14 males (6.7%) and 54 females (9.2%) in their respective age groups living below the poverty level.
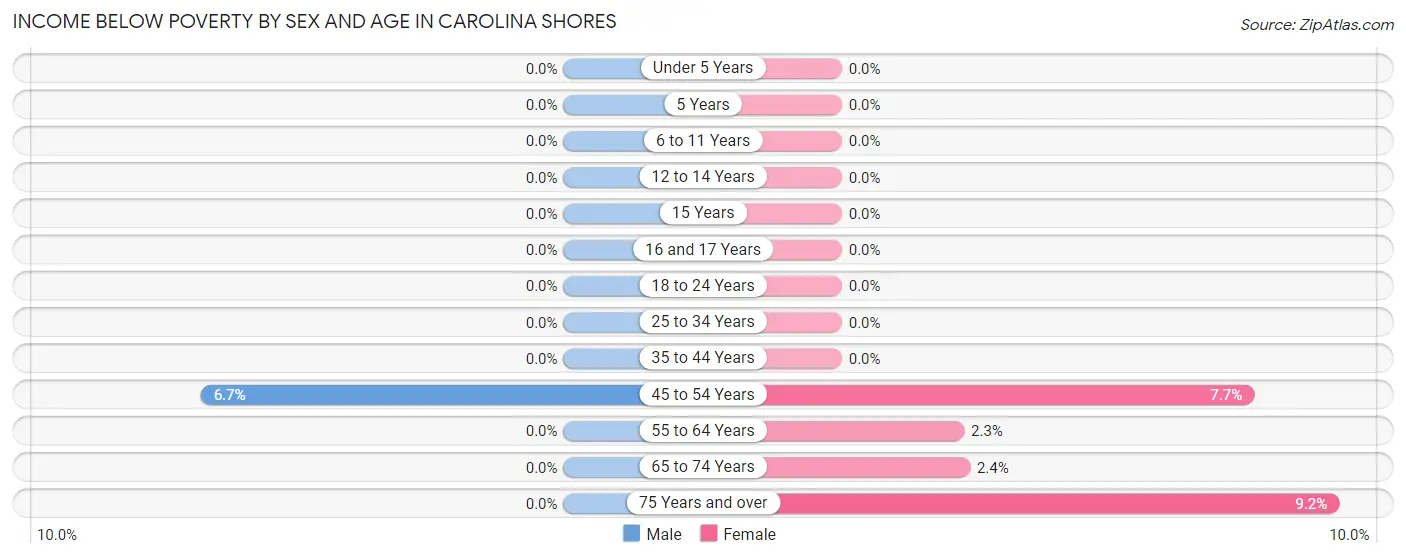
| Age Bracket | Male | Female |
| Under 5 Years | 0 (0.0%) | 0 (0.0%) |
| 5 Years | 0 (0.0%) | 0 (0.0%) |
| 6 to 11 Years | 0 (0.0%) | 0 (0.0%) |
| 12 to 14 Years | 0 (0.0%) | 0 (0.0%) |
| 15 Years | 0 (0.0%) | 0 (0.0%) |
| 16 and 17 Years | 0 (0.0%) | 0 (0.0%) |
| 18 to 24 Years | 0 (0.0%) | 0 (0.0%) |
| 25 to 34 Years | 0 (0.0%) | 0 (0.0%) |
| 35 to 44 Years | 0 (0.0%) | 0 (0.0%) |
| 45 to 54 Years | 14 (6.7%) | 13 (7.6%) |
| 55 to 64 Years | 0 (0.0%) | 15 (2.3%) |
| 65 to 74 Years | 0 (0.0%) | 15 (2.4%) |
| 75 Years and over | 0 (0.0%) | 54 (9.2%) |
| Total | 14 (0.6%) | 97 (4.1%) |
Income Above Poverty by Sex and Age in Carolina Shores
According to the poverty statistics in Carolina Shores, males aged under 5 years and females aged under 5 years are the age groups that are most secure financially, with 100.0% of males and 100.0% of females in these age groups living above the poverty line.
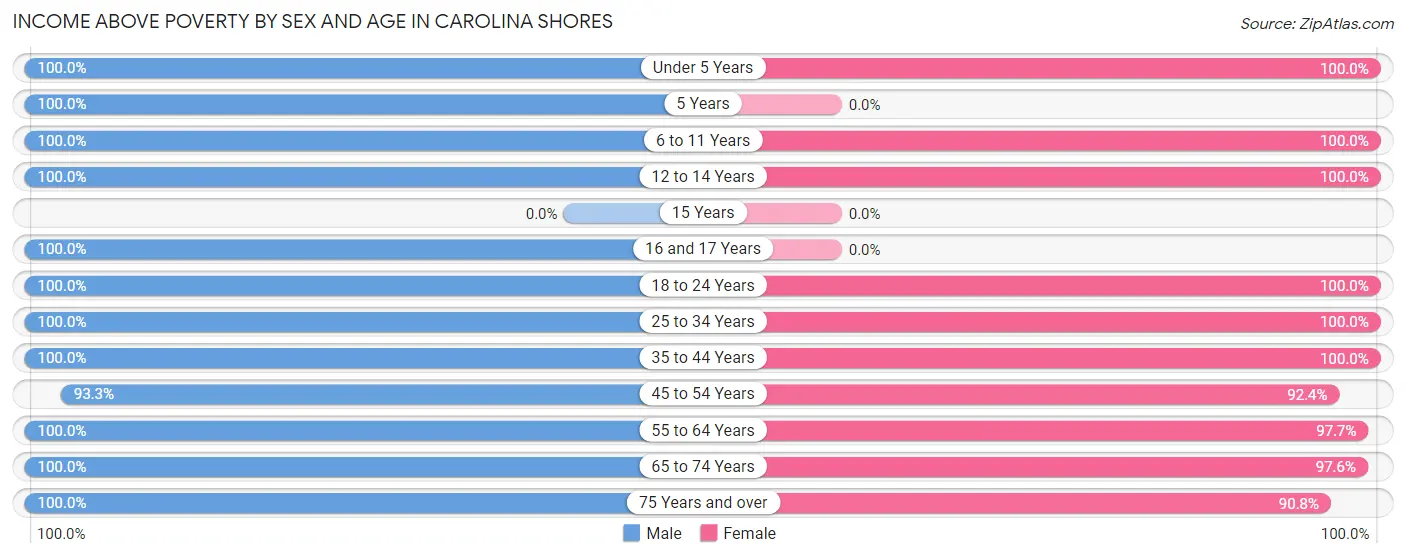
| Age Bracket | Male | Female |
| Under 5 Years | 24 (100.0%) | 46 (100.0%) |
| 5 Years | 13 (100.0%) | 0 (0.0%) |
| 6 to 11 Years | 60 (100.0%) | 30 (100.0%) |
| 12 to 14 Years | 57 (100.0%) | 39 (100.0%) |
| 15 Years | 0 (0.0%) | 0 (0.0%) |
| 16 and 17 Years | 36 (100.0%) | 0 (0.0%) |
| 18 to 24 Years | 102 (100.0%) | 22 (100.0%) |
| 25 to 34 Years | 160 (100.0%) | 75 (100.0%) |
| 35 to 44 Years | 42 (100.0%) | 106 (100.0%) |
| 45 to 54 Years | 194 (93.3%) | 157 (92.3%) |
| 55 to 64 Years | 398 (100.0%) | 647 (97.7%) |
| 65 to 74 Years | 672 (100.0%) | 614 (97.6%) |
| 75 Years and over | 507 (100.0%) | 531 (90.8%) |
| Total | 2,265 (99.4%) | 2,267 (95.9%) |
Income Below Poverty Among Married-Couple Families in Carolina Shores
The poverty statistics for married-couple families in Carolina Shores show that 0.9% or 13 of the total 1,452 families live below the poverty line. Families with no children have the highest poverty rate of 1.0%, comprising of 13 families. On the other hand, families with 1 or 2 children have the lowest poverty rate of 0.0%, which includes 0 families.
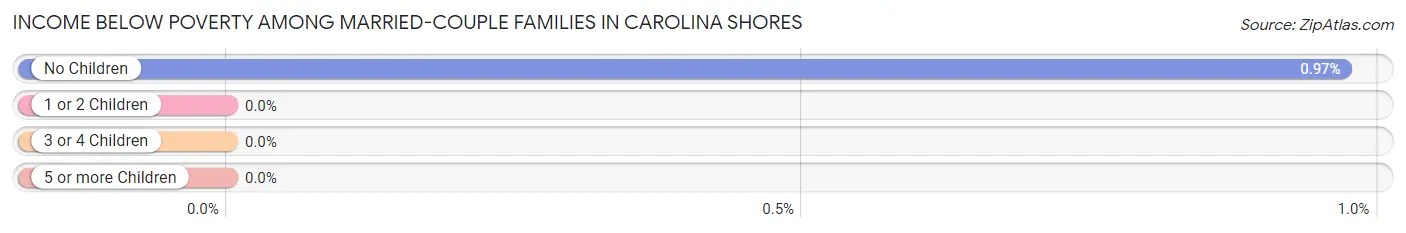
| Children | Above Poverty | Below Poverty |
| No Children | 1,325 (99.0%) | 13 (1.0%) |
| 1 or 2 Children | 79 (100.0%) | 0 (0.0%) |
| 3 or 4 Children | 24 (100.0%) | 0 (0.0%) |
| 5 or more Children | 11 (100.0%) | 0 (0.0%) |
| Total | 1,439 (99.1%) | 13 (0.9%) |
Income Below Poverty Among Single-Parent Households in Carolina Shores
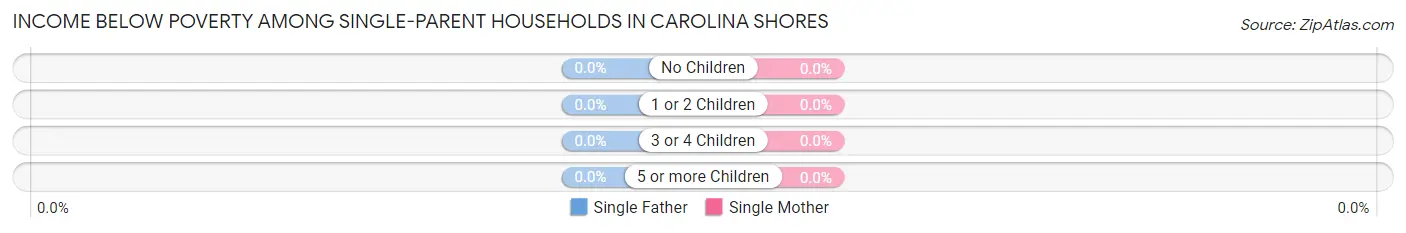
| Children | Single Father | Single Mother |
| No Children | 0 (0.0%) | 0 (0.0%) |
| 1 or 2 Children | 0 (0.0%) | 0 (0.0%) |
| 3 or 4 Children | 0 (0.0%) | 0 (0.0%) |
| 5 or more Children | 0 (0.0%) | 0 (0.0%) |
| Total | 0 (0.0%) | 0 (0.0%) |
Income Below Poverty Among Married-Couple vs Single-Parent Households in Carolina Shores
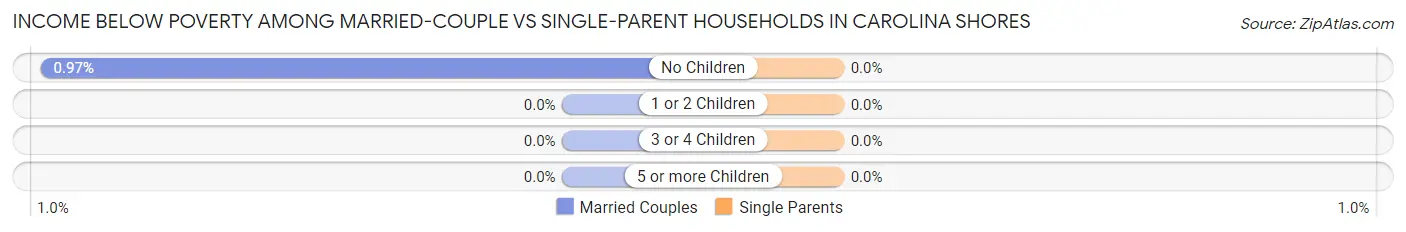
| Children | Married-Couple Families | Single-Parent Households |
| No Children | 13 (1.0%) | 0 (0.0%) |
| 1 or 2 Children | 0 (0.0%) | 0 (0.0%) |
| 3 or 4 Children | 0 (0.0%) | 0 (0.0%) |
| 5 or more Children | 0 (0.0%) | 0 (0.0%) |
| Total | 13 (0.9%) | 0 (0.0%) |
Employment Characteristics in Carolina Shores
Employment by Class of Employer in Carolina Shores
Among the 1,596 employed individuals in Carolina Shores, private company employees (1,273 | 79.8%), local government employees (126 | 7.9%), and self-employed (not incorporated) (85 | 5.3%) make up the most common classes of employment.
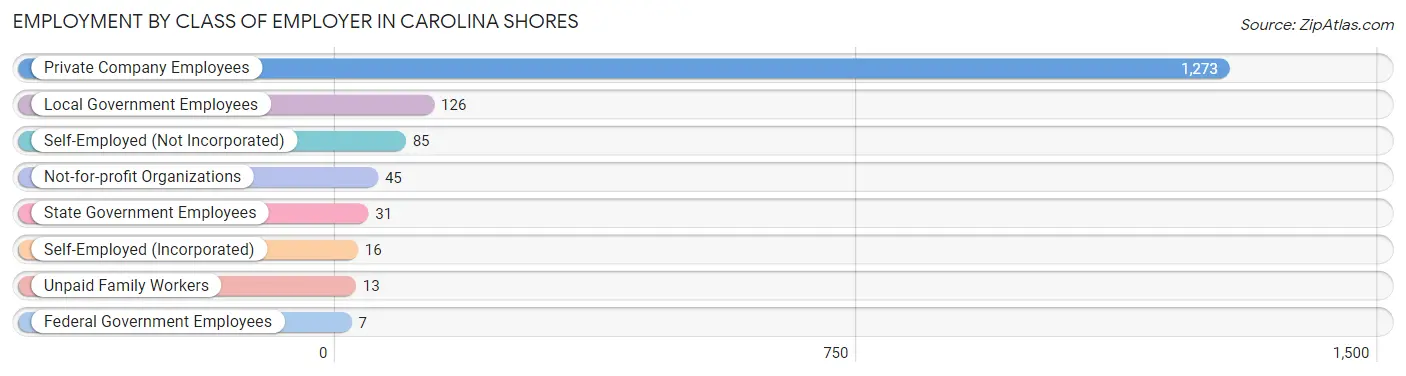
| Employer Class | # Employees | % Employees |
| Private Company Employees | 1,273 | 79.8% |
| Self-Employed (Incorporated) | 16 | 1.0% |
| Self-Employed (Not Incorporated) | 85 | 5.3% |
| Not-for-profit Organizations | 45 | 2.8% |
| Local Government Employees | 126 | 7.9% |
| State Government Employees | 31 | 1.9% |
| Federal Government Employees | 7 | 0.4% |
| Unpaid Family Workers | 13 | 0.8% |
| Total | 1,596 | 100.0% |
Employment Status by Age in Carolina Shores
According to the labor force statistics for Carolina Shores, out of the total population over 16 years of age (4,374), 39.5% or 1,728 individuals are in the labor force, with 7.7% or 133 of them unemployed. The age group with the highest labor force participation rate is 20 to 24 years, with 100.0% or 84 individuals in the labor force. Within the labor force, the 45 to 54 years age range has the highest percentage of unemployed individuals, with 16.2% or 57 of them being unemployed.
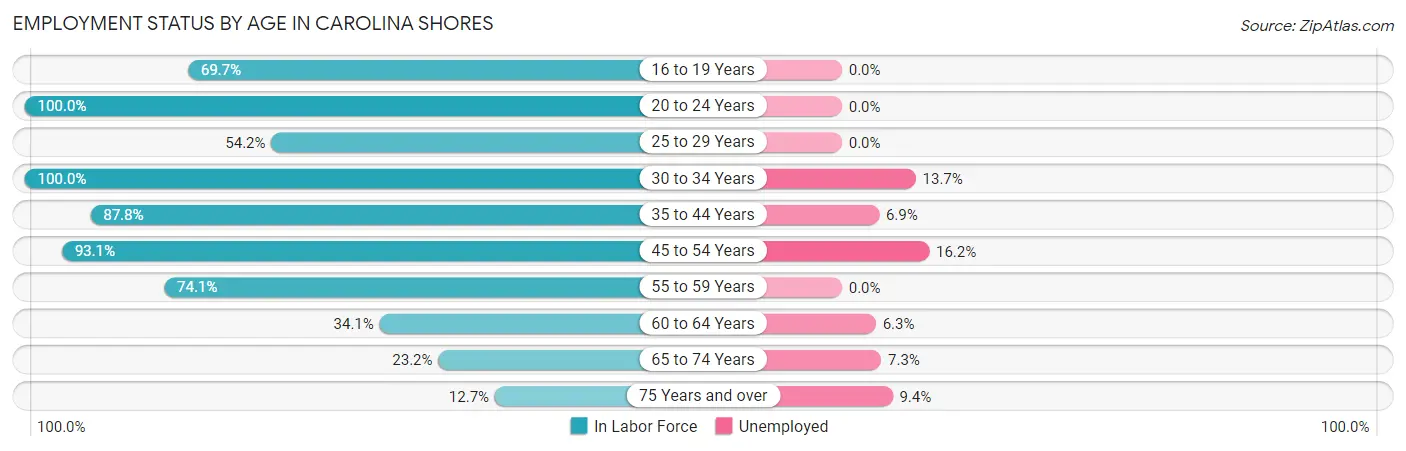
| Age Bracket | In Labor Force | Unemployed |
| 16 to 19 Years | 53 (69.7%) | 0 (0.0%) |
| 20 to 24 Years | 84 (100.0%) | 0 (0.0%) |
| 25 to 29 Years | 64 (54.2%) | 0 (0.0%) |
| 30 to 34 Years | 117 (100.0%) | 16 (13.7%) |
| 35 to 44 Years | 130 (87.8%) | 9 (6.9%) |
| 45 to 54 Years | 352 (93.1%) | 57 (16.2%) |
| 55 to 59 Years | 234 (74.1%) | 0 (0.0%) |
| 60 to 64 Years | 254 (34.1%) | 16 (6.3%) |
| 65 to 74 Years | 302 (23.2%) | 22 (7.3%) |
| 75 Years and over | 139 (12.7%) | 13 (9.4%) |
| Total | 1,728 (39.5%) | 133 (7.7%) |
Employment Status by Educational Attainment in Carolina Shores
According to labor force statistics for Carolina Shores, 63.2% of individuals (1,151) out of the total population between 25 and 64 years of age (1,821) are in the labor force, with 8.5% or 98 of them being unemployed. The group with the highest labor force participation rate are those with the educational attainment of bachelor's degree or higher, with 80.7% or 401 individuals in the labor force. Within the labor force, individuals with high school diploma education have the highest percentage of unemployment, with 19.6% or 62 of them being unemployed.
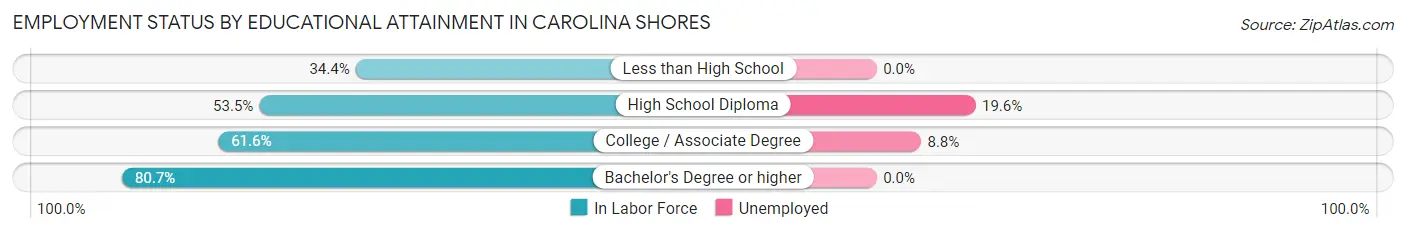
| Educational Attainment | In Labor Force | Unemployed |
| Less than High School | 22 (34.4%) | 0 (0.0%) |
| High School Diploma | 317 (53.5%) | 116 (19.6%) |
| College / Associate Degree | 411 (61.6%) | 59 (8.8%) |
| Bachelor's Degree or higher | 401 (80.7%) | 0 (0.0%) |
| Total | 1,151 (63.2%) | 155 (8.5%) |
Employment Occupations by Sex in Carolina Shores
Management, Business, Science and Arts Occupations
The most common Management, Business, Science and Arts occupations in Carolina Shores are Community & Social Service (206 | 12.9%), Management (175 | 11.0%), Computers, Engineering & Science (153 | 9.6%), Education Instruction & Library (124 | 7.8%), and Computers & Mathematics (123 | 7.7%).
Management, Business, Science and Arts Occupations by Sex
Within the Management, Business, Science and Arts occupations in Carolina Shores, the most male-oriented occupations are Architecture & Engineering (100.0%), Legal Services & Support (100.0%), and Arts, Media & Entertainment (100.0%), while the most female-oriented occupations are Health Diagnosing & Treating (100.0%), Education Instruction & Library (93.5%), and Business & Financial (71.0%).
| Occupation | Male | Female |
| Management | 119 (68.0%) | 56 (32.0%) |
| Business & Financial | 18 (29.0%) | 44 (71.0%) |
| Computers, Engineering & Science | 131 (85.6%) | 22 (14.4%) |
| Computers & Mathematics | 101 (82.1%) | 22 (17.9%) |
| Architecture & Engineering | 30 (100.0%) | 0 (0.0%) |
| Life, Physical & Social Science | 0 (0.0%) | 0 (0.0%) |
| Community & Social Service | 90 (43.7%) | 116 (56.3%) |
| Education, Arts & Media | 0 (0.0%) | 0 (0.0%) |
| Legal Services & Support | 11 (100.0%) | 0 (0.0%) |
| Education Instruction & Library | 8 (6.5%) | 116 (93.5%) |
| Arts, Media & Entertainment | 71 (100.0%) | 0 (0.0%) |
| Health Diagnosing & Treating | 0 (0.0%) | 86 (100.0%) |
| Health Technologists | 0 (0.0%) | 0 (0.0%) |
| Total (Category) | 358 (52.5%) | 324 (47.5%) |
| Total (Overall) | 908 (56.9%) | 688 (43.1%) |
Services Occupations
The most common Services occupations in Carolina Shores are Food Preparation & Serving (138 | 8.6%), Personal Care & Service (52 | 3.3%), Healthcare Support (39 | 2.4%), Cleaning & Maintenance (21 | 1.3%), and Security & Protection (16 | 1.0%).
Services Occupations by Sex
Within the Services occupations in Carolina Shores, the most male-oriented occupations are Security & Protection (100.0%), Firefighting & Prevention (100.0%), and Cleaning & Maintenance (100.0%), while the most female-oriented occupations are Healthcare Support (100.0%), Food Preparation & Serving (31.2%), and Personal Care & Service (13.5%).
| Occupation | Male | Female |
| Healthcare Support | 0 (0.0%) | 39 (100.0%) |
| Security & Protection | 16 (100.0%) | 0 (0.0%) |
| Firefighting & Prevention | 16 (100.0%) | 0 (0.0%) |
| Law Enforcement | 0 (0.0%) | 0 (0.0%) |
| Food Preparation & Serving | 95 (68.8%) | 43 (31.2%) |
| Cleaning & Maintenance | 21 (100.0%) | 0 (0.0%) |
| Personal Care & Service | 45 (86.5%) | 7 (13.5%) |
| Total (Category) | 177 (66.5%) | 89 (33.5%) |
| Total (Overall) | 908 (56.9%) | 688 (43.1%) |
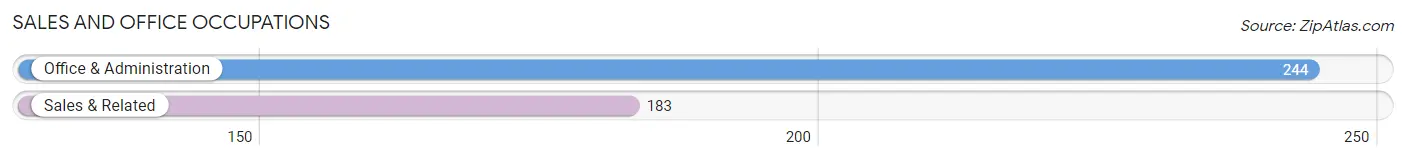
Sales and Office Occupations
The most common Sales and Office occupations in Carolina Shores are Office & Administration (244 | 15.3%), and Sales & Related (183 | 11.5%).
Sales and Office Occupations by Sex
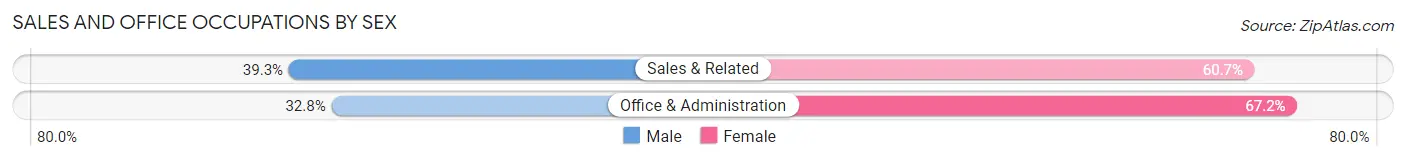
| Occupation | Male | Female |
| Sales & Related | 72 (39.3%) | 111 (60.7%) |
| Office & Administration | 80 (32.8%) | 164 (67.2%) |
| Total (Category) | 152 (35.6%) | 275 (64.4%) |
| Total (Overall) | 908 (56.9%) | 688 (43.1%) |
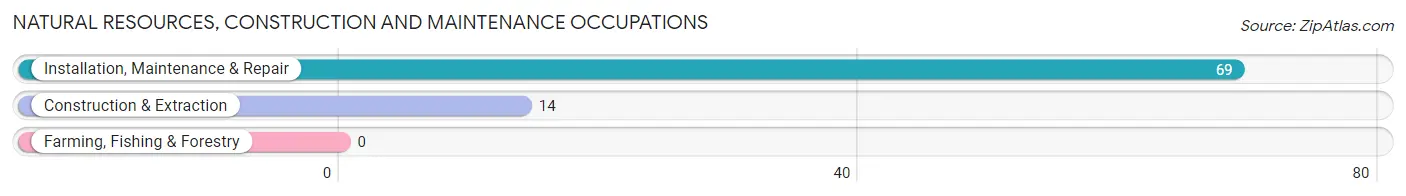
Natural Resources, Construction and Maintenance Occupations
The most common Natural Resources, Construction and Maintenance occupations in Carolina Shores are Installation, Maintenance & Repair (69 | 4.3%), and Construction & Extraction (14 | 0.9%).
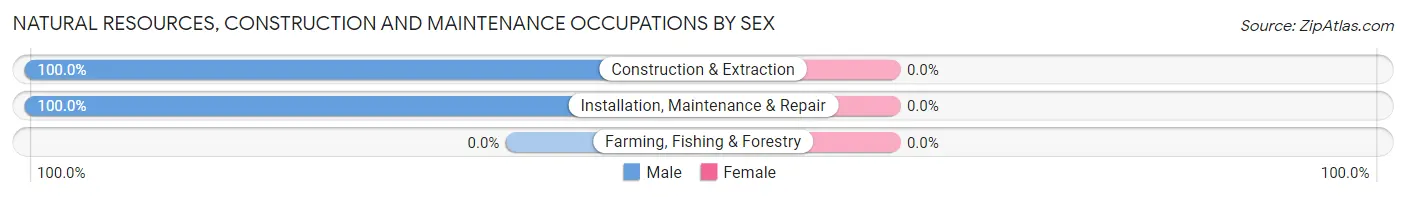
Natural Resources, Construction and Maintenance Occupations by Sex
| Occupation | Male | Female |
| Farming, Fishing & Forestry | 0 (0.0%) | 0 (0.0%) |
| Construction & Extraction | 14 (100.0%) | 0 (0.0%) |
| Installation, Maintenance & Repair | 69 (100.0%) | 0 (0.0%) |
| Total (Category) | 83 (100.0%) | 0 (0.0%) |
| Total (Overall) | 908 (56.9%) | 688 (43.1%) |
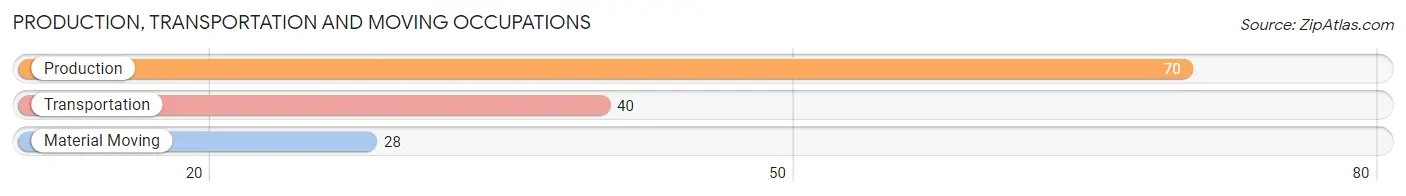
Production, Transportation and Moving Occupations
The most common Production, Transportation and Moving occupations in Carolina Shores are Production (70 | 4.4%), Transportation (40 | 2.5%), and Material Moving (28 | 1.8%).
Production, Transportation and Moving Occupations by Sex
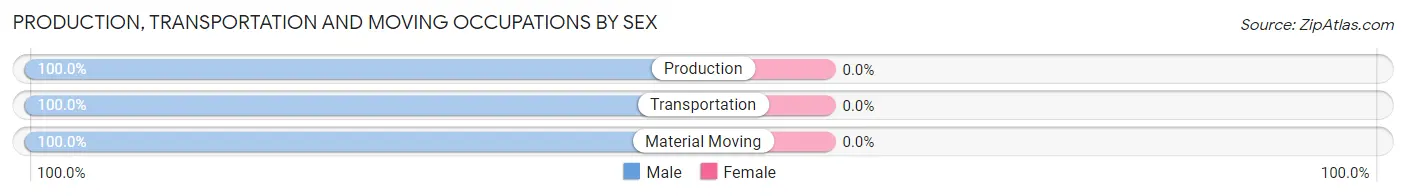
| Occupation | Male | Female |
| Production | 70 (100.0%) | 0 (0.0%) |
| Transportation | 40 (100.0%) | 0 (0.0%) |
| Material Moving | 28 (100.0%) | 0 (0.0%) |
| Total (Category) | 138 (100.0%) | 0 (0.0%) |
| Total (Overall) | 908 (56.9%) | 688 (43.1%) |
Employment Industries by Sex in Carolina Shores
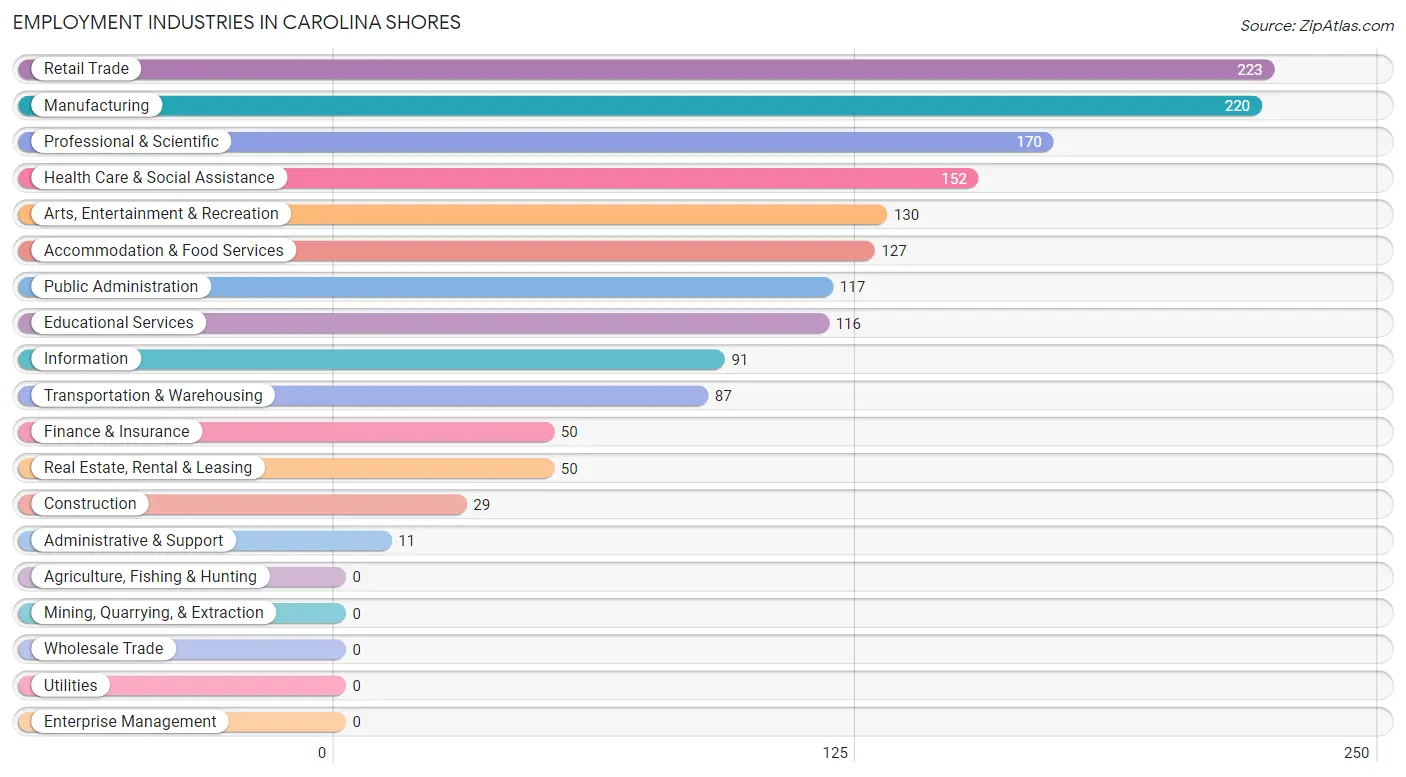
Employment Industries in Carolina Shores
The major employment industries in Carolina Shores include Retail Trade (223 | 14.0%), Manufacturing (220 | 13.8%), Professional & Scientific (170 | 10.6%), Health Care & Social Assistance (152 | 9.5%), and Arts, Entertainment & Recreation (130 | 8.2%).
Employment Industries by Sex in Carolina Shores
The Carolina Shores industries that see more men than women are Construction (100.0%), Administrative & Support (100.0%), and Information (94.5%), whereas the industries that tend to have a higher number of women are Educational Services (93.1%), Health Care & Social Assistance (89.5%), and Public Administration (82.1%).
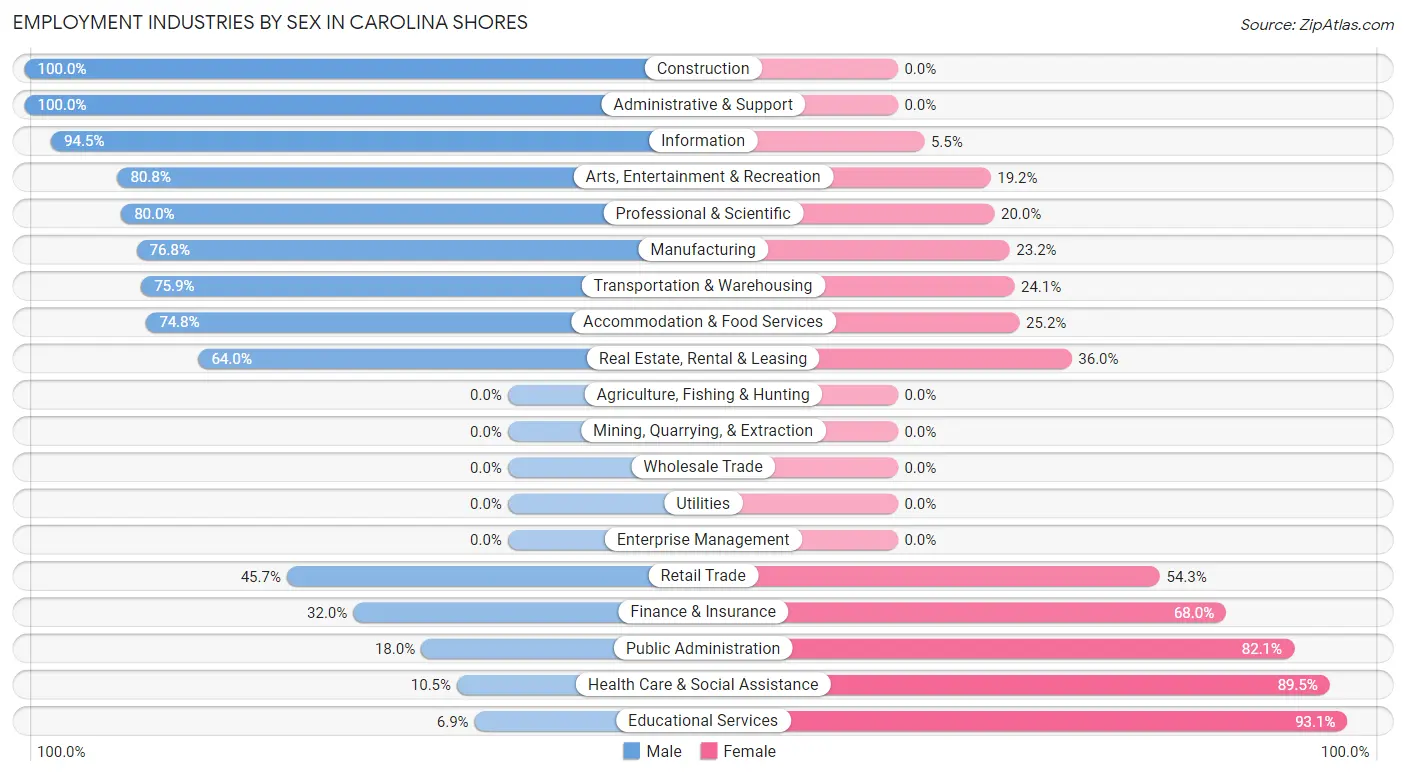
| Industry | Male | Female |
| Agriculture, Fishing & Hunting | 0 (0.0%) | 0 (0.0%) |
| Mining, Quarrying, & Extraction | 0 (0.0%) | 0 (0.0%) |
| Construction | 29 (100.0%) | 0 (0.0%) |
| Manufacturing | 169 (76.8%) | 51 (23.2%) |
| Wholesale Trade | 0 (0.0%) | 0 (0.0%) |
| Retail Trade | 102 (45.7%) | 121 (54.3%) |
| Transportation & Warehousing | 66 (75.9%) | 21 (24.1%) |
| Utilities | 0 (0.0%) | 0 (0.0%) |
| Information | 86 (94.5%) | 5 (5.5%) |
| Finance & Insurance | 16 (32.0%) | 34 (68.0%) |
| Real Estate, Rental & Leasing | 32 (64.0%) | 18 (36.0%) |
| Professional & Scientific | 136 (80.0%) | 34 (20.0%) |
| Enterprise Management | 0 (0.0%) | 0 (0.0%) |
| Administrative & Support | 11 (100.0%) | 0 (0.0%) |
| Educational Services | 8 (6.9%) | 108 (93.1%) |
| Health Care & Social Assistance | 16 (10.5%) | 136 (89.5%) |
| Arts, Entertainment & Recreation | 105 (80.8%) | 25 (19.2%) |
| Accommodation & Food Services | 95 (74.8%) | 32 (25.2%) |
| Public Administration | 21 (17.9%) | 96 (82.1%) |
| Total | 908 (56.9%) | 688 (43.1%) |
Education in Carolina Shores
School Enrollment in Carolina Shores
The most common levels of schooling among the 375 students in Carolina Shores are middle school (115 | 30.7%), college / undergraduate (91 | 24.3%), and elementary school (59 | 15.7%).
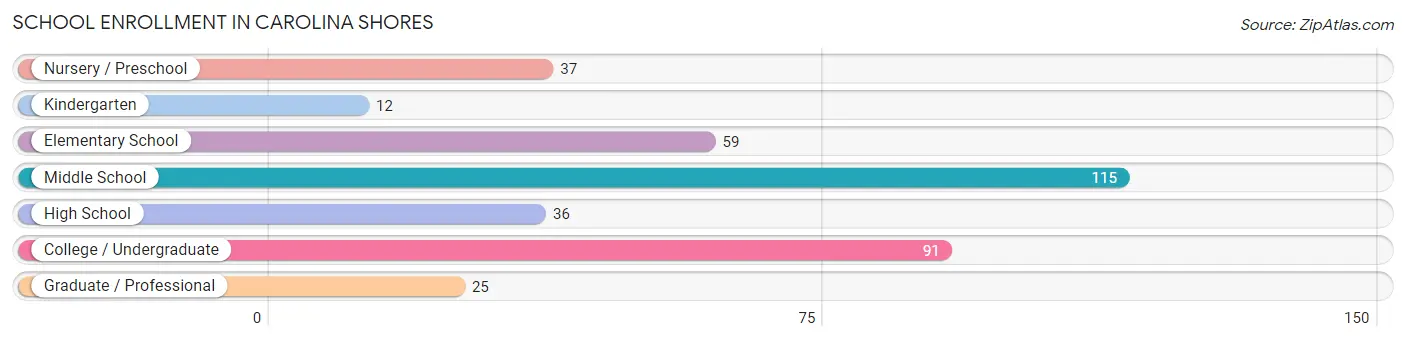
| School Level | # Students | % Students |
| Nursery / Preschool | 37 | 9.9% |
| Kindergarten | 12 | 3.2% |
| Elementary School | 59 | 15.7% |
| Middle School | 115 | 30.7% |
| High School | 36 | 9.6% |
| College / Undergraduate | 91 | 24.3% |
| Graduate / Professional | 25 | 6.7% |
| Total | 375 | 100.0% |
School Enrollment by Age by Funding Source in Carolina Shores
Out of a total of 375 students who are enrolled in schools in Carolina Shores, 50 (13.3%) attend a private institution, while the remaining 325 (86.7%) are enrolled in public schools. The age group of 3 to 4 year olds has the highest likelihood of being enrolled in private schools, with 15 (62.5% in the age bracket) enrolled. Conversely, the age group of 10 to 14 year olds has the lowest likelihood of being enrolled in a private school, with 147 (100.0% in the age bracket) attending a public institution.
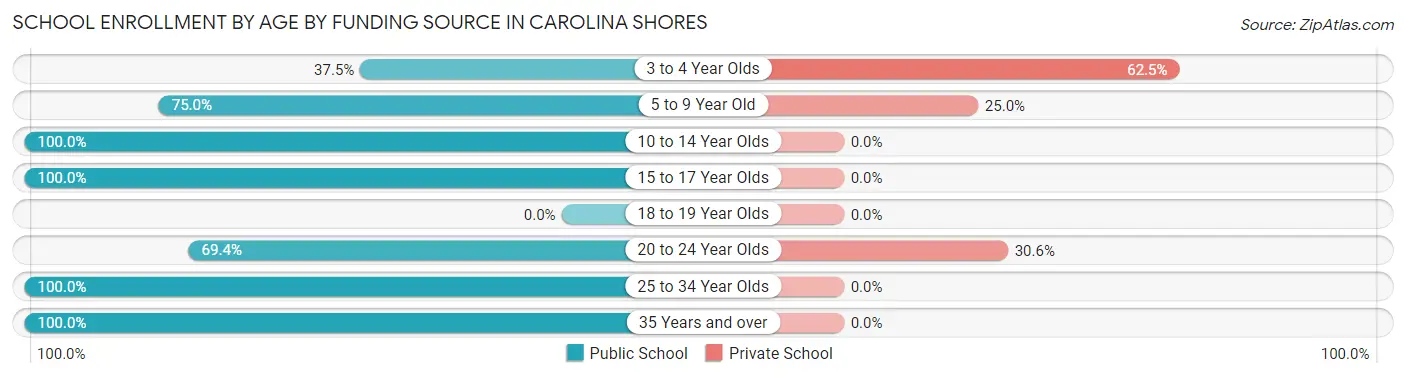
| Age Bracket | Public School | Private School |
| 3 to 4 Year Olds | 9 (37.5%) | 15 (62.5%) |
| 5 to 9 Year Old | 39 (75.0%) | 13 (25.0%) |
| 10 to 14 Year Olds | 147 (100.0%) | 0 (0.0%) |
| 15 to 17 Year Olds | 36 (100.0%) | 0 (0.0%) |
| 18 to 19 Year Olds | 0 (0.0%) | 0 (0.0%) |
| 20 to 24 Year Olds | 50 (69.4%) | 22 (30.6%) |
| 25 to 34 Year Olds | 18 (100.0%) | 0 (0.0%) |
| 35 Years and over | 26 (100.0%) | 0 (0.0%) |
| Total | 325 (86.7%) | 50 (13.3%) |
Educational Attainment by Field of Study in Carolina Shores
Business (286 | 23.5%), education (210 | 17.2%), social sciences (131 | 10.8%), engineering (105 | 8.6%), and science & technology (103 | 8.5%) are the most common fields of study among 1,218 individuals in Carolina Shores who have obtained a bachelor's degree or higher.
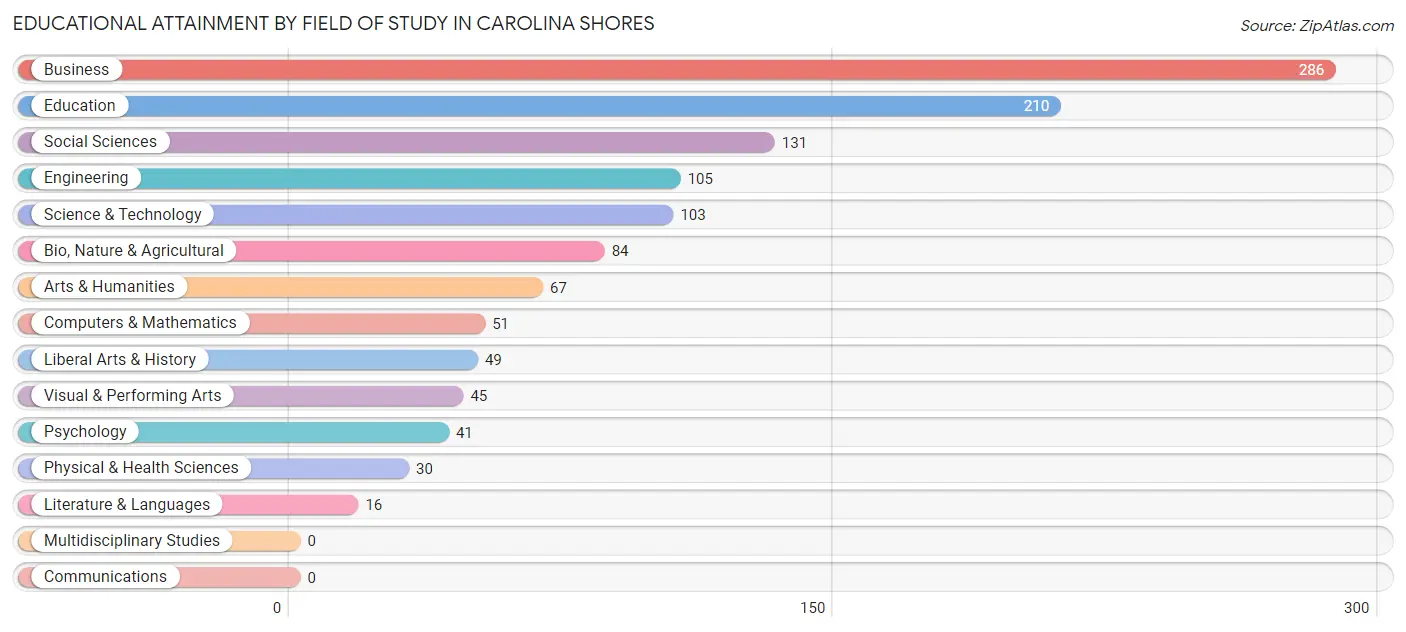
| Field of Study | # Graduates | % Graduates |
| Computers & Mathematics | 51 | 4.2% |
| Bio, Nature & Agricultural | 84 | 6.9% |
| Physical & Health Sciences | 30 | 2.5% |
| Psychology | 41 | 3.4% |
| Social Sciences | 131 | 10.8% |
| Engineering | 105 | 8.6% |
| Multidisciplinary Studies | 0 | 0.0% |
| Science & Technology | 103 | 8.5% |
| Business | 286 | 23.5% |
| Education | 210 | 17.2% |
| Literature & Languages | 16 | 1.3% |
| Liberal Arts & History | 49 | 4.0% |
| Visual & Performing Arts | 45 | 3.7% |
| Communications | 0 | 0.0% |
| Arts & Humanities | 67 | 5.5% |
| Total | 1,218 | 100.0% |
Transportation & Commute in Carolina Shores
Vehicle Availability by Sex in Carolina Shores
The most prevalent vehicle ownership categories in Carolina Shores are males with 2 vehicles (474, accounting for 52.2%) and females with 2 vehicles (376, making up 68.9%).
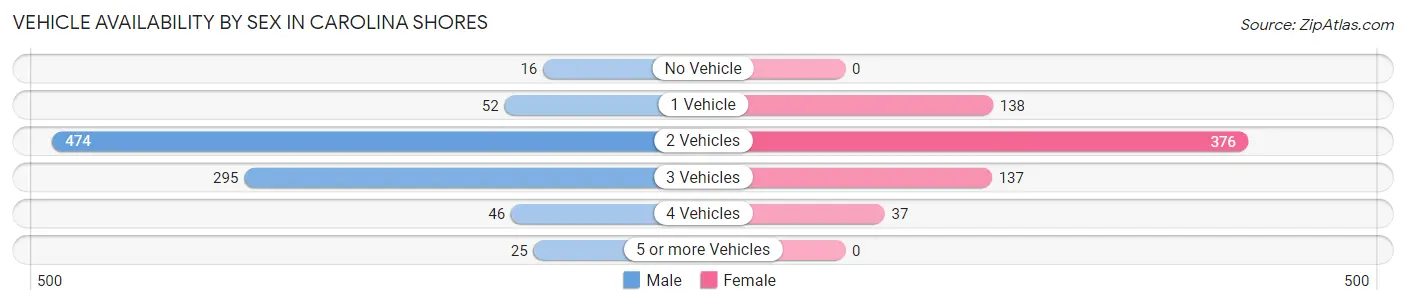
| Vehicles Available | Male | Female |
| No Vehicle | 16 (1.8%) | 0 (0.0%) |
| 1 Vehicle | 52 (5.7%) | 138 (20.1%) |
| 2 Vehicles | 474 (52.2%) | 376 (54.6%) |
| 3 Vehicles | 295 (32.5%) | 137 (19.9%) |
| 4 Vehicles | 46 (5.1%) | 37 (5.4%) |
| 5 or more Vehicles | 25 (2.8%) | 0 (0.0%) |
| Total | 908 (100.0%) | 688 (100.0%) |
Commute Time in Carolina Shores
The most frequently occuring commute durations in Carolina Shores are 10 to 14 minutes (361 commuters, 29.0%), 15 to 19 minutes (176 commuters, 14.1%), and 5 to 9 minutes (156 commuters, 12.5%).
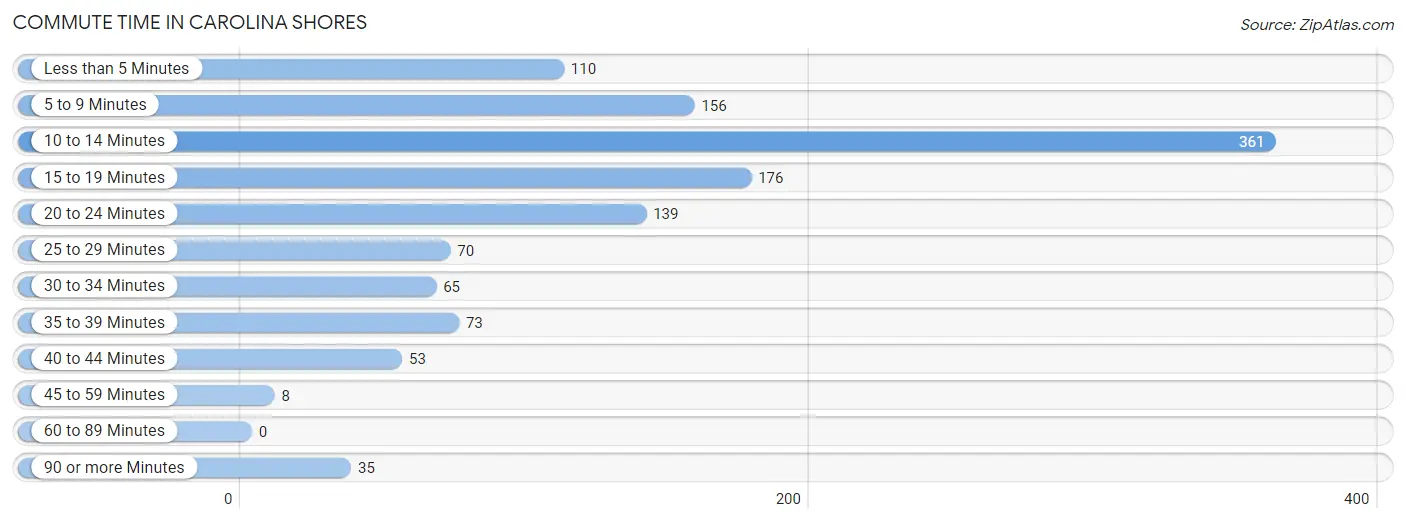
| Commute Time | # Commuters | % Commuters |
| Less than 5 Minutes | 110 | 8.8% |
| 5 to 9 Minutes | 156 | 12.5% |
| 10 to 14 Minutes | 361 | 29.0% |
| 15 to 19 Minutes | 176 | 14.1% |
| 20 to 24 Minutes | 139 | 11.2% |
| 25 to 29 Minutes | 70 | 5.6% |
| 30 to 34 Minutes | 65 | 5.2% |
| 35 to 39 Minutes | 73 | 5.9% |
| 40 to 44 Minutes | 53 | 4.3% |
| 45 to 59 Minutes | 8 | 0.6% |
| 60 to 89 Minutes | 0 | 0.0% |
| 90 or more Minutes | 35 | 2.8% |
Commute Time by Sex in Carolina Shores
The most common commute times in Carolina Shores are 10 to 14 minutes (201 commuters, 28.3%) for males and 10 to 14 minutes (160 commuters, 29.8%) for females.
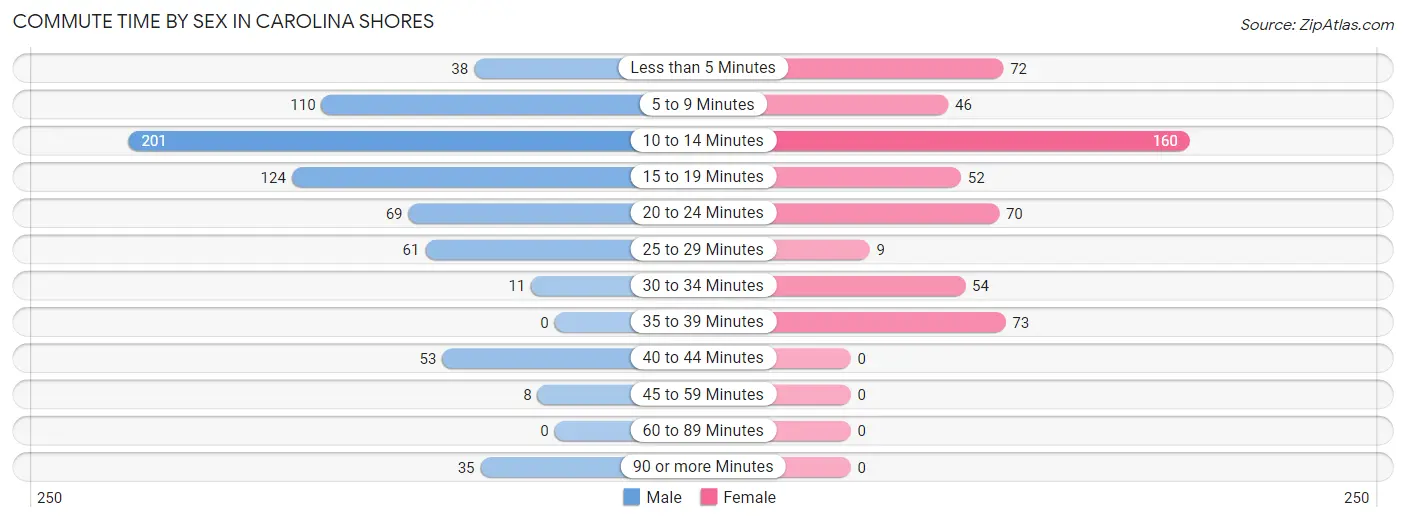
| Commute Time | Male | Female |
| Less than 5 Minutes | 38 (5.3%) | 72 (13.4%) |
| 5 to 9 Minutes | 110 (15.5%) | 46 (8.6%) |
| 10 to 14 Minutes | 201 (28.3%) | 160 (29.8%) |
| 15 to 19 Minutes | 124 (17.5%) | 52 (9.7%) |
| 20 to 24 Minutes | 69 (9.7%) | 70 (13.1%) |
| 25 to 29 Minutes | 61 (8.6%) | 9 (1.7%) |
| 30 to 34 Minutes | 11 (1.5%) | 54 (10.1%) |
| 35 to 39 Minutes | 0 (0.0%) | 73 (13.6%) |
| 40 to 44 Minutes | 53 (7.5%) | 0 (0.0%) |
| 45 to 59 Minutes | 8 (1.1%) | 0 (0.0%) |
| 60 to 89 Minutes | 0 (0.0%) | 0 (0.0%) |
| 90 or more Minutes | 35 (4.9%) | 0 (0.0%) |
Time of Departure to Work by Sex in Carolina Shores
The most frequent times of departure to work in Carolina Shores are 8:00 AM to 8:29 AM (136, 19.2%) for males and 6:30 AM to 6:59 AM (109, 20.3%) for females.
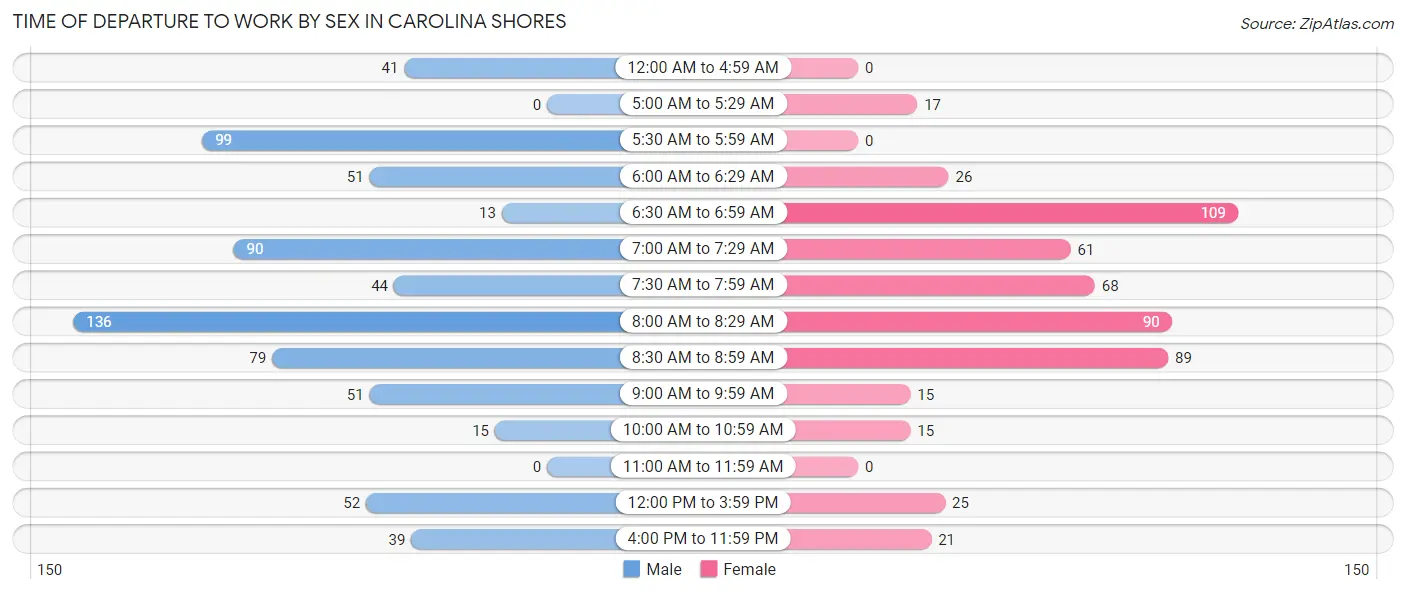
| Time of Departure | Male | Female |
| 12:00 AM to 4:59 AM | 41 (5.8%) | 0 (0.0%) |
| 5:00 AM to 5:29 AM | 0 (0.0%) | 17 (3.2%) |
| 5:30 AM to 5:59 AM | 99 (13.9%) | 0 (0.0%) |
| 6:00 AM to 6:29 AM | 51 (7.2%) | 26 (4.9%) |
| 6:30 AM to 6:59 AM | 13 (1.8%) | 109 (20.3%) |
| 7:00 AM to 7:29 AM | 90 (12.7%) | 61 (11.4%) |
| 7:30 AM to 7:59 AM | 44 (6.2%) | 68 (12.7%) |
| 8:00 AM to 8:29 AM | 136 (19.2%) | 90 (16.8%) |
| 8:30 AM to 8:59 AM | 79 (11.1%) | 89 (16.6%) |
| 9:00 AM to 9:59 AM | 51 (7.2%) | 15 (2.8%) |
| 10:00 AM to 10:59 AM | 15 (2.1%) | 15 (2.8%) |
| 11:00 AM to 11:59 AM | 0 (0.0%) | 0 (0.0%) |
| 12:00 PM to 3:59 PM | 52 (7.3%) | 25 (4.7%) |
| 4:00 PM to 11:59 PM | 39 (5.5%) | 21 (3.9%) |
| Total | 710 (100.0%) | 536 (100.0%) |
Housing Occupancy in Carolina Shores
Occupancy by Ownership in Carolina Shores
Of the total 2,354 dwellings in Carolina Shores, owner-occupied units account for 2,255 (95.8%), while renter-occupied units make up 99 (4.2%).
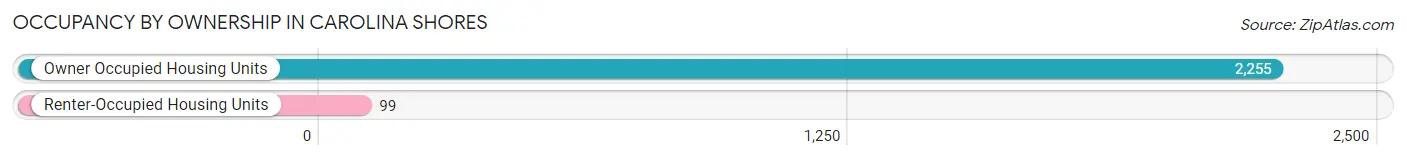
| Occupancy | # Housing Units | % Housing Units |
| Owner Occupied Housing Units | 2,255 | 95.8% |
| Renter-Occupied Housing Units | 99 | 4.2% |
| Total Occupied Housing Units | 2,354 | 100.0% |
Occupancy by Household Size in Carolina Shores
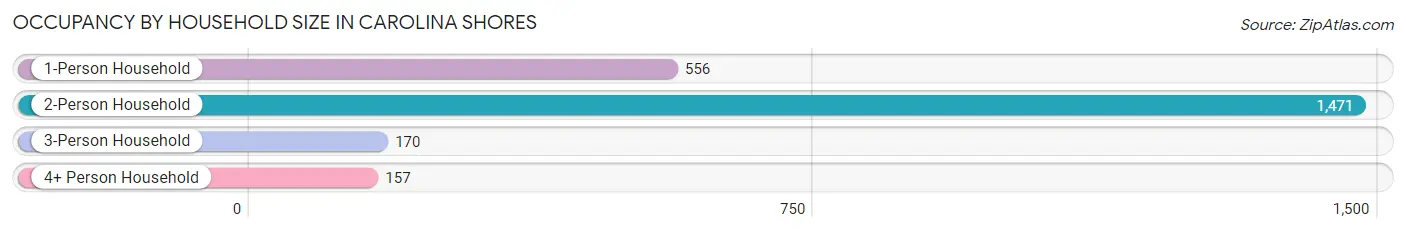
| Household Size | # Housing Units | % Housing Units |
| 1-Person Household | 556 | 23.6% |
| 2-Person Household | 1,471 | 62.5% |
| 3-Person Household | 170 | 7.2% |
| 4+ Person Household | 157 | 6.7% |
| Total Housing Units | 2,354 | 100.0% |
Occupancy by Ownership by Household Size in Carolina Shores
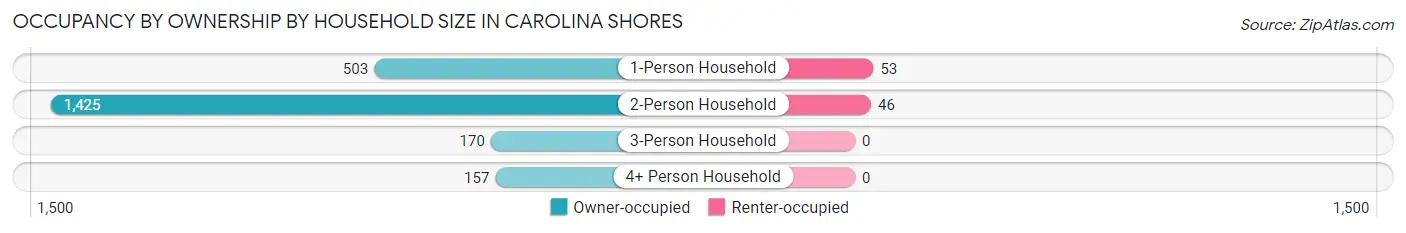
| Household Size | Owner-occupied | Renter-occupied |
| 1-Person Household | 503 (90.5%) | 53 (9.5%) |
| 2-Person Household | 1,425 (96.9%) | 46 (3.1%) |
| 3-Person Household | 170 (100.0%) | 0 (0.0%) |
| 4+ Person Household | 157 (100.0%) | 0 (0.0%) |
| Total Housing Units | 2,255 (95.8%) | 99 (4.2%) |
Occupancy by Educational Attainment in Carolina Shores
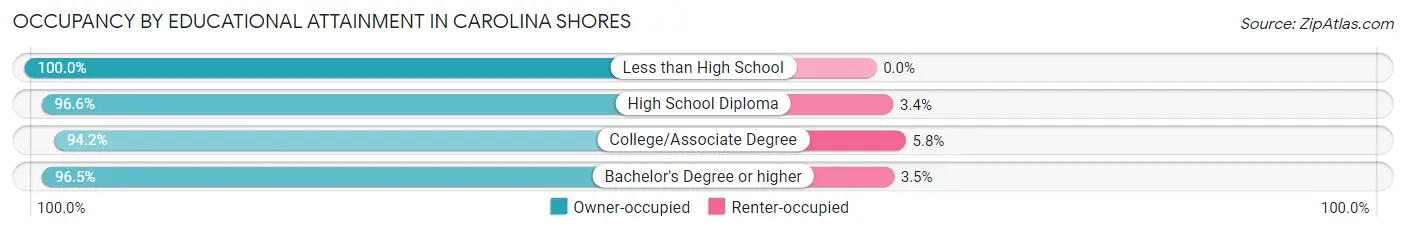
| Household Size | Owner-occupied | Renter-occupied |
| Less than High School | 17 (100.0%) | 0 (0.0%) |
| High School Diploma | 832 (96.6%) | 29 (3.4%) |
| College/Associate Degree | 743 (94.2%) | 46 (5.8%) |
| Bachelor's Degree or higher | 663 (96.5%) | 24 (3.5%) |
Occupancy by Age of Householder in Carolina Shores
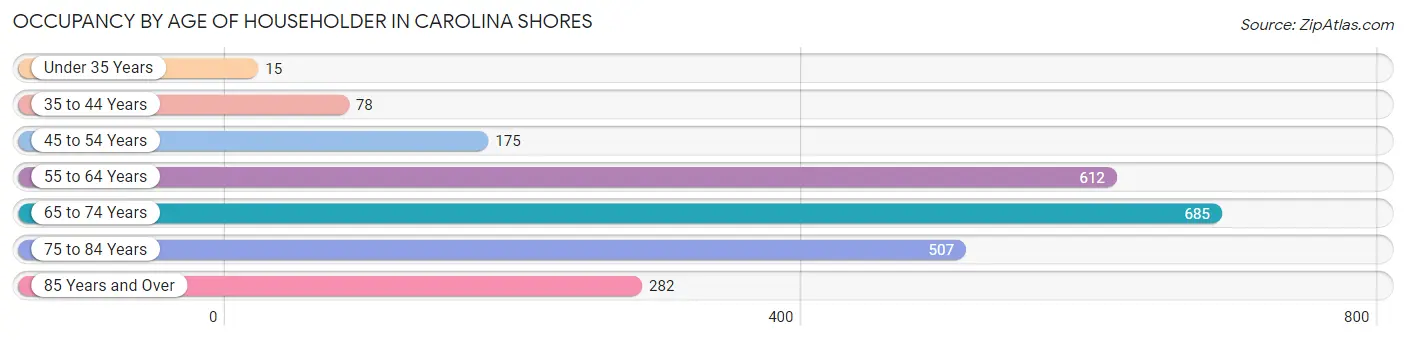
| Age Bracket | # Households | % Households |
| Under 35 Years | 15 | 0.6% |
| 35 to 44 Years | 78 | 3.3% |
| 45 to 54 Years | 175 | 7.4% |
| 55 to 64 Years | 612 | 26.0% |
| 65 to 74 Years | 685 | 29.1% |
| 75 to 84 Years | 507 | 21.5% |
| 85 Years and Over | 282 | 12.0% |
| Total | 2,354 | 100.0% |
Housing Finances in Carolina Shores
Median Income by Occupancy in Carolina Shores
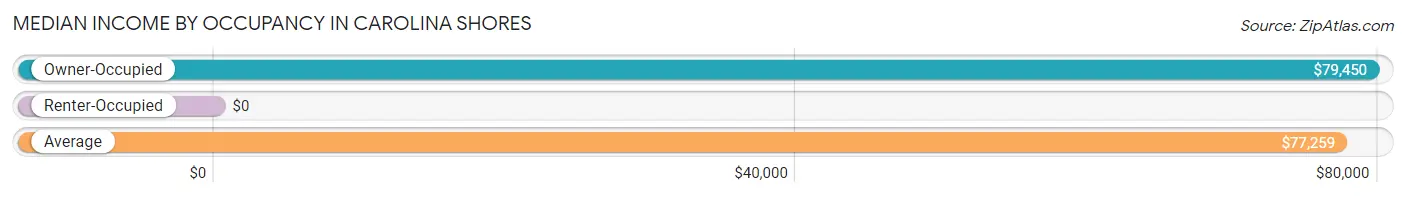
| Occupancy Type | # Households | Median Income |
| Owner-Occupied | 2,255 (95.8%) | $79,450 |
| Renter-Occupied | 99 (4.2%) | $0 |
| Average | 2,354 (100.0%) | $77,259 |
Occupancy by Householder Income Bracket in Carolina Shores
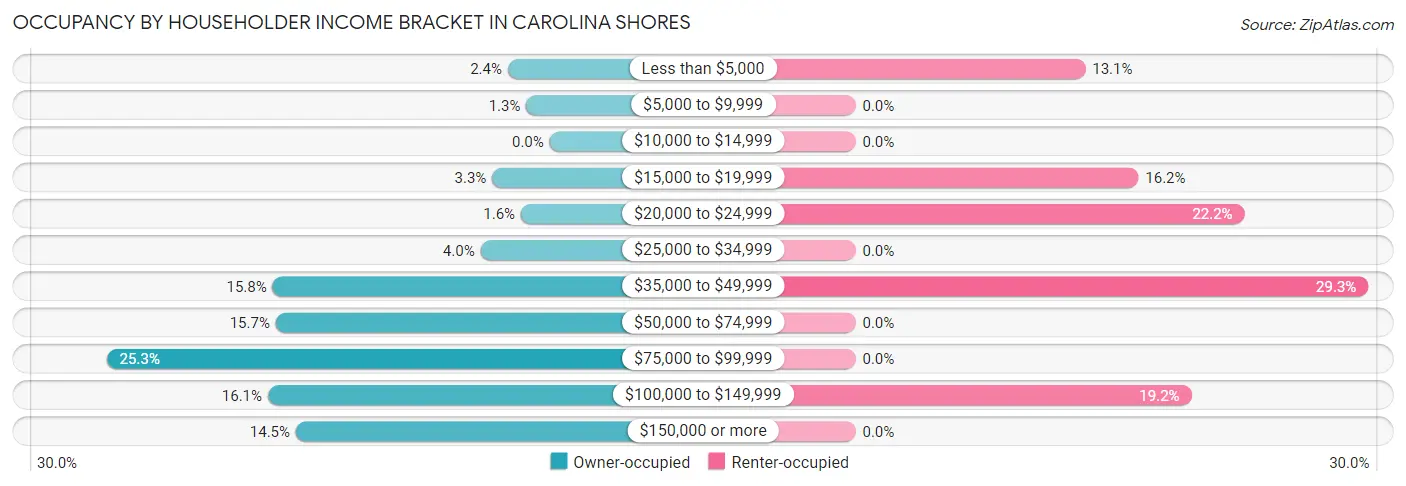
| Income Bracket | Owner-occupied | Renter-occupied |
| Less than $5,000 | 54 (2.4%) | 13 (13.1%) |
| $5,000 to $9,999 | 30 (1.3%) | 0 (0.0%) |
| $10,000 to $14,999 | 0 (0.0%) | 0 (0.0%) |
| $15,000 to $19,999 | 74 (3.3%) | 16 (16.2%) |
| $20,000 to $24,999 | 37 (1.6%) | 22 (22.2%) |
| $25,000 to $34,999 | 89 (4.0%) | 0 (0.0%) |
| $35,000 to $49,999 | 357 (15.8%) | 29 (29.3%) |
| $50,000 to $74,999 | 353 (15.7%) | 0 (0.0%) |
| $75,000 to $99,999 | 571 (25.3%) | 0 (0.0%) |
| $100,000 to $149,999 | 363 (16.1%) | 19 (19.2%) |
| $150,000 or more | 327 (14.5%) | 0 (0.0%) |
| Total | 2,255 (100.0%) | 99 (100.0%) |
Monthly Housing Cost Tiers in Carolina Shores
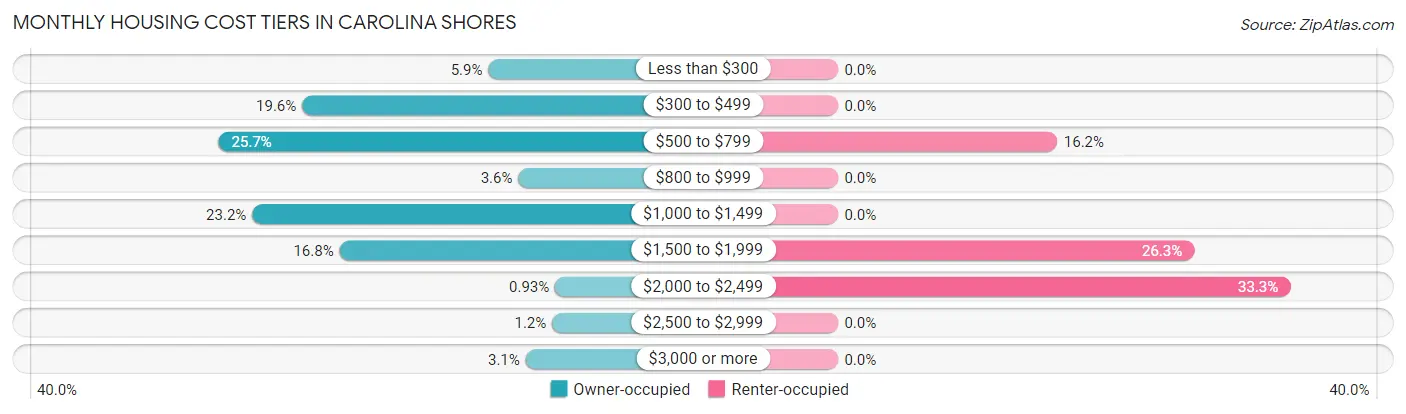
| Monthly Cost | Owner-occupied | Renter-occupied |
| Less than $300 | 132 (5.9%) | 0 (0.0%) |
| $300 to $499 | 441 (19.6%) | 0 (0.0%) |
| $500 to $799 | 580 (25.7%) | 16 (16.2%) |
| $800 to $999 | 82 (3.6%) | 0 (0.0%) |
| $1,000 to $1,499 | 524 (23.2%) | 0 (0.0%) |
| $1,500 to $1,999 | 379 (16.8%) | 26 (26.3%) |
| $2,000 to $2,499 | 21 (0.9%) | 33 (33.3%) |
| $2,500 to $2,999 | 26 (1.1%) | 0 (0.0%) |
| $3,000 or more | 70 (3.1%) | 0 (0.0%) |
| Total | 2,255 (100.0%) | 99 (100.0%) |
Physical Housing Characteristics in Carolina Shores
Housing Structures in Carolina Shores
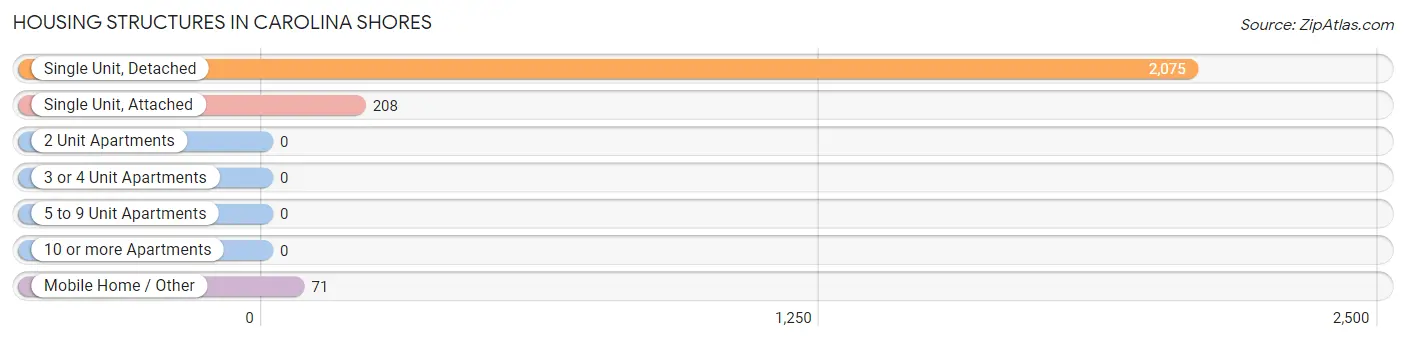
| Structure Type | # Housing Units | % Housing Units |
| Single Unit, Detached | 2,075 | 88.1% |
| Single Unit, Attached | 208 | 8.8% |
| 2 Unit Apartments | 0 | 0.0% |
| 3 or 4 Unit Apartments | 0 | 0.0% |
| 5 to 9 Unit Apartments | 0 | 0.0% |
| 10 or more Apartments | 0 | 0.0% |
| Mobile Home / Other | 71 | 3.0% |
| Total | 2,354 | 100.0% |
Housing Structures by Occupancy in Carolina Shores
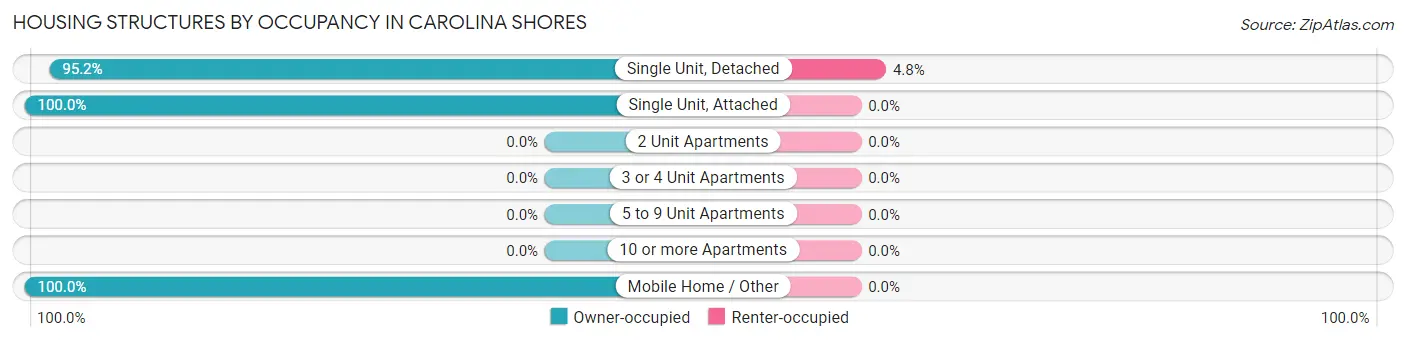
| Structure Type | Owner-occupied | Renter-occupied |
| Single Unit, Detached | 1,976 (95.2%) | 99 (4.8%) |
| Single Unit, Attached | 208 (100.0%) | 0 (0.0%) |
| 2 Unit Apartments | 0 (0.0%) | 0 (0.0%) |
| 3 or 4 Unit Apartments | 0 (0.0%) | 0 (0.0%) |
| 5 to 9 Unit Apartments | 0 (0.0%) | 0 (0.0%) |
| 10 or more Apartments | 0 (0.0%) | 0 (0.0%) |
| Mobile Home / Other | 71 (100.0%) | 0 (0.0%) |
| Total | 2,255 (95.8%) | 99 (4.2%) |
Housing Structures by Number of Rooms in Carolina Shores
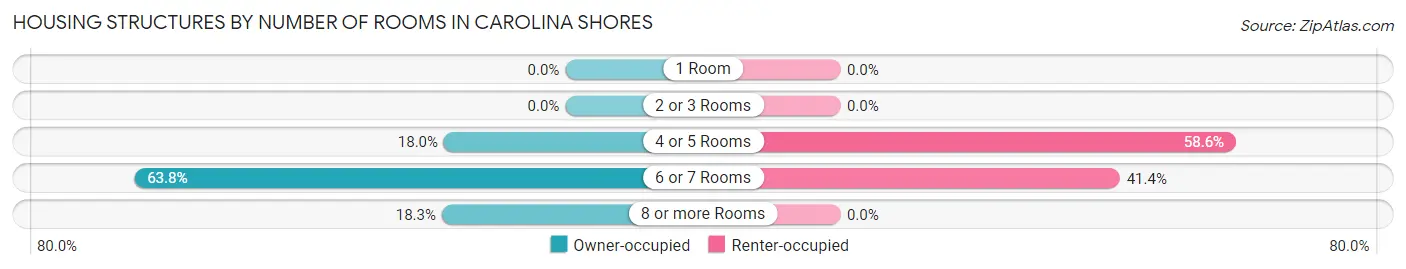
| Number of Rooms | Owner-occupied | Renter-occupied |
| 1 Room | 0 (0.0%) | 0 (0.0%) |
| 2 or 3 Rooms | 0 (0.0%) | 0 (0.0%) |
| 4 or 5 Rooms | 405 (18.0%) | 58 (58.6%) |
| 6 or 7 Rooms | 1,438 (63.8%) | 41 (41.4%) |
| 8 or more Rooms | 412 (18.3%) | 0 (0.0%) |
| Total | 2,255 (100.0%) | 99 (100.0%) |
Housing Structure by Heating Type in Carolina Shores
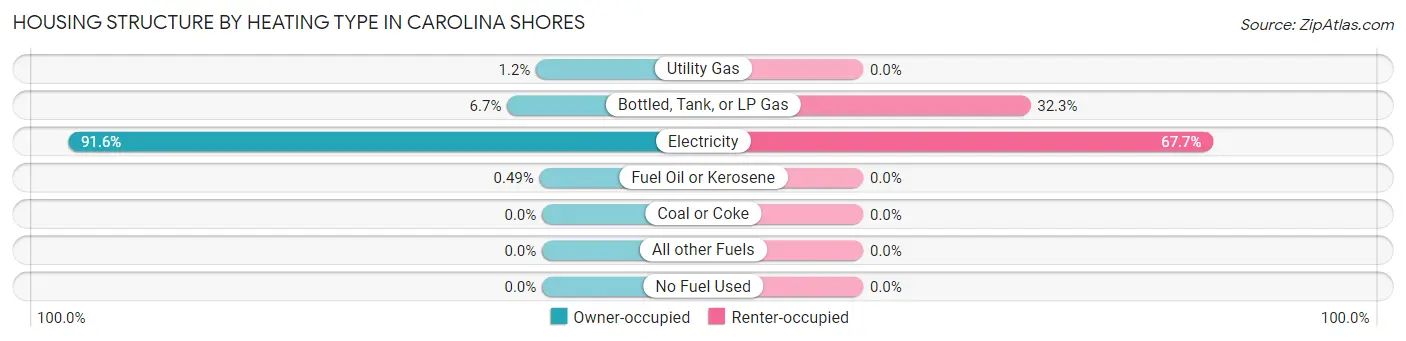
| Heating Type | Owner-occupied | Renter-occupied |
| Utility Gas | 26 (1.1%) | 0 (0.0%) |
| Bottled, Tank, or LP Gas | 152 (6.7%) | 32 (32.3%) |
| Electricity | 2,066 (91.6%) | 67 (67.7%) |
| Fuel Oil or Kerosene | 11 (0.5%) | 0 (0.0%) |
| Coal or Coke | 0 (0.0%) | 0 (0.0%) |
| All other Fuels | 0 (0.0%) | 0 (0.0%) |
| No Fuel Used | 0 (0.0%) | 0 (0.0%) |
| Total | 2,255 (100.0%) | 99 (100.0%) |
Household Vehicle Usage in Carolina Shores
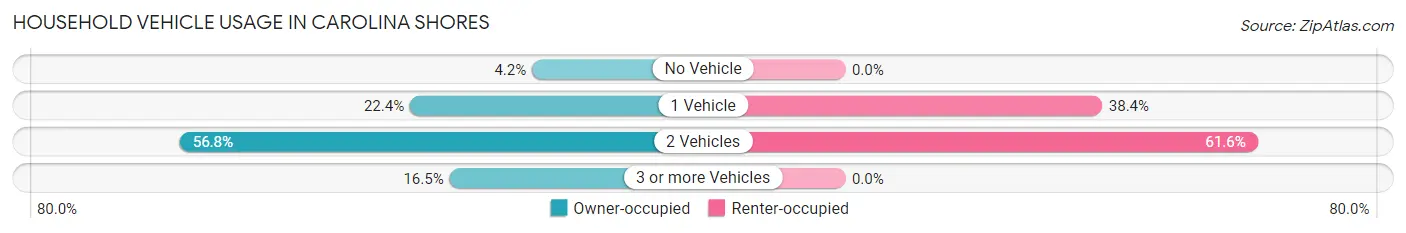
| Vehicles per Household | Owner-occupied | Renter-occupied |
| No Vehicle | 95 (4.2%) | 0 (0.0%) |
| 1 Vehicle | 506 (22.4%) | 38 (38.4%) |
| 2 Vehicles | 1,281 (56.8%) | 61 (61.6%) |
| 3 or more Vehicles | 373 (16.5%) | 0 (0.0%) |
| Total | 2,255 (100.0%) | 99 (100.0%) |
Real Estate & Mortgages in Carolina Shores
Real Estate and Mortgage Overview in Carolina Shores
| Characteristic | Without Mortgage | With Mortgage |
| Housing Units | 964 | 1,291 |
| Median Property Value | $251,600 | $247,700 |
| Median Household Income | $70,377 | $267 |
| Monthly Housing Costs | $501 | $70 |
| Real Estate Taxes | $1,265 | $0 |
Property Value by Mortgage Status in Carolina Shores
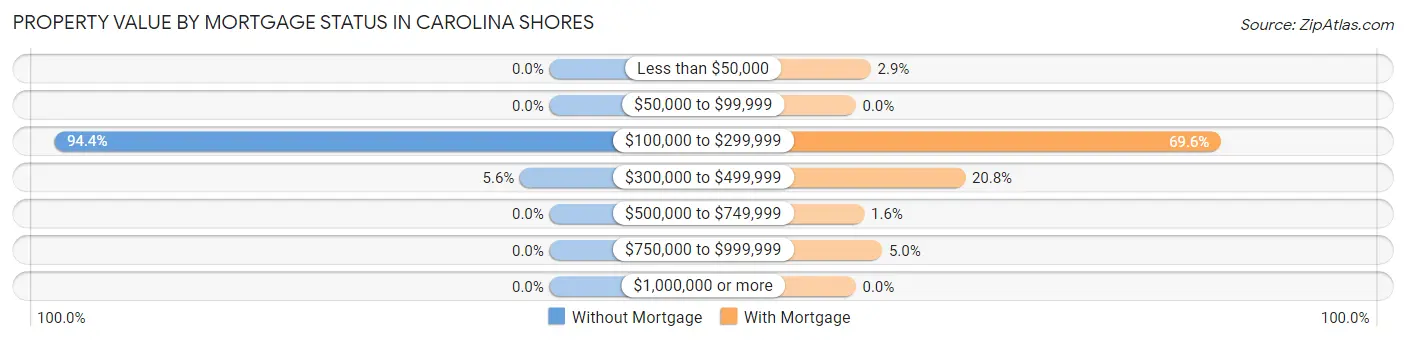
| Property Value | Without Mortgage | With Mortgage |
| Less than $50,000 | 0 (0.0%) | 37 (2.9%) |
| $50,000 to $99,999 | 0 (0.0%) | 0 (0.0%) |
| $100,000 to $299,999 | 910 (94.4%) | 899 (69.6%) |
| $300,000 to $499,999 | 54 (5.6%) | 269 (20.8%) |
| $500,000 to $749,999 | 0 (0.0%) | 21 (1.6%) |
| $750,000 to $999,999 | 0 (0.0%) | 65 (5.0%) |
| $1,000,000 or more | 0 (0.0%) | 0 (0.0%) |
| Total | 964 (100.0%) | 1,291 (100.0%) |
Household Income by Mortgage Status in Carolina Shores
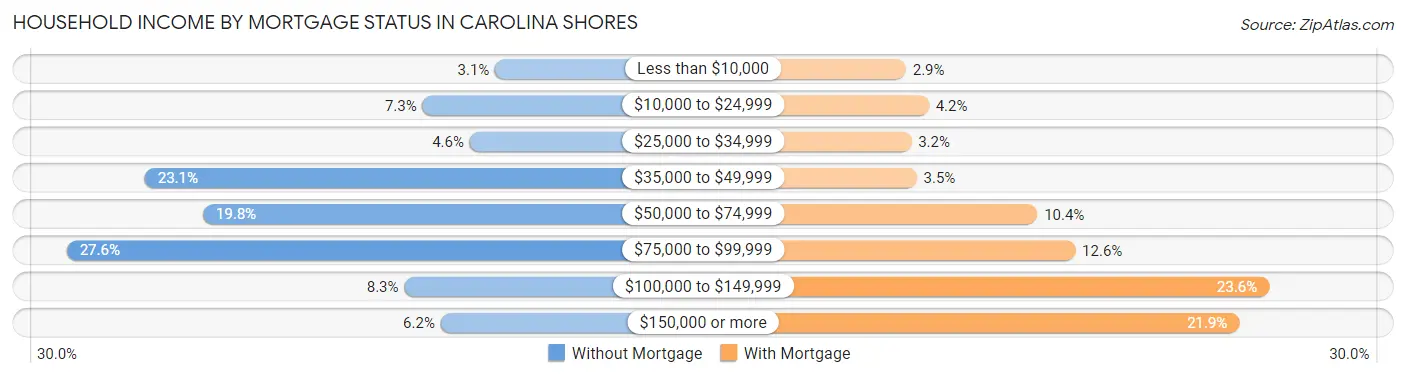
| Household Income | Without Mortgage | With Mortgage |
| Less than $10,000 | 30 (3.1%) | 37 (2.9%) |
| $10,000 to $24,999 | 70 (7.3%) | 54 (4.2%) |
| $25,000 to $34,999 | 44 (4.6%) | 41 (3.2%) |
| $35,000 to $49,999 | 223 (23.1%) | 45 (3.5%) |
| $50,000 to $74,999 | 191 (19.8%) | 134 (10.4%) |
| $75,000 to $99,999 | 266 (27.6%) | 162 (12.6%) |
| $100,000 to $149,999 | 80 (8.3%) | 305 (23.6%) |
| $150,000 or more | 60 (6.2%) | 283 (21.9%) |
| Total | 964 (100.0%) | 1,291 (100.0%) |
Property Value to Household Income Ratio in Carolina Shores
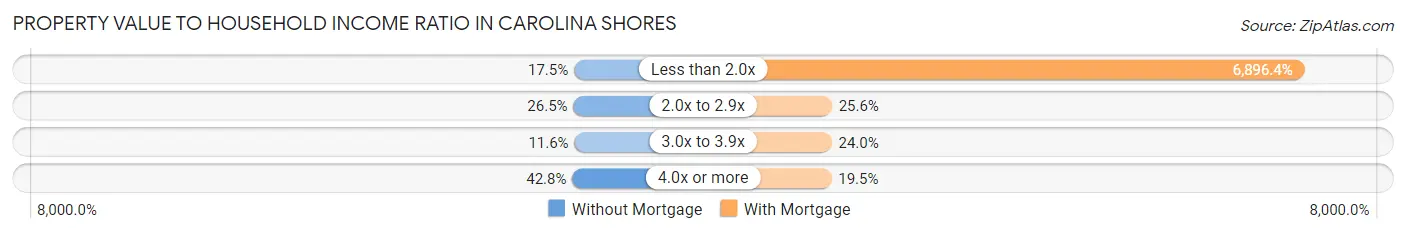
| Value-to-Income Ratio | Without Mortgage | With Mortgage |
| Less than 2.0x | 169 (17.5%) | 89,033 (6,896.4%) |
| 2.0x to 2.9x | 255 (26.5%) | 330 (25.6%) |
| 3.0x to 3.9x | 112 (11.6%) | 310 (24.0%) |
| 4.0x or more | 413 (42.8%) | 252 (19.5%) |
| Total | 964 (100.0%) | 1,291 (100.0%) |
Real Estate Taxes by Mortgage Status in Carolina Shores
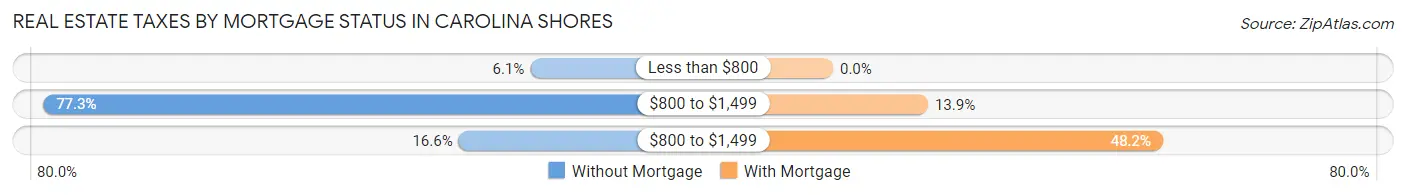
| Property Taxes | Without Mortgage | With Mortgage |
| Less than $800 | 59 (6.1%) | 0 (0.0%) |
| $800 to $1,499 | 745 (77.3%) | 179 (13.9%) |
| $800 to $1,499 | 160 (16.6%) | 622 (48.2%) |
| Total | 964 (100.0%) | 1,291 (100.0%) |
Health & Disability in Carolina Shores
Health Insurance Coverage by Age in Carolina Shores
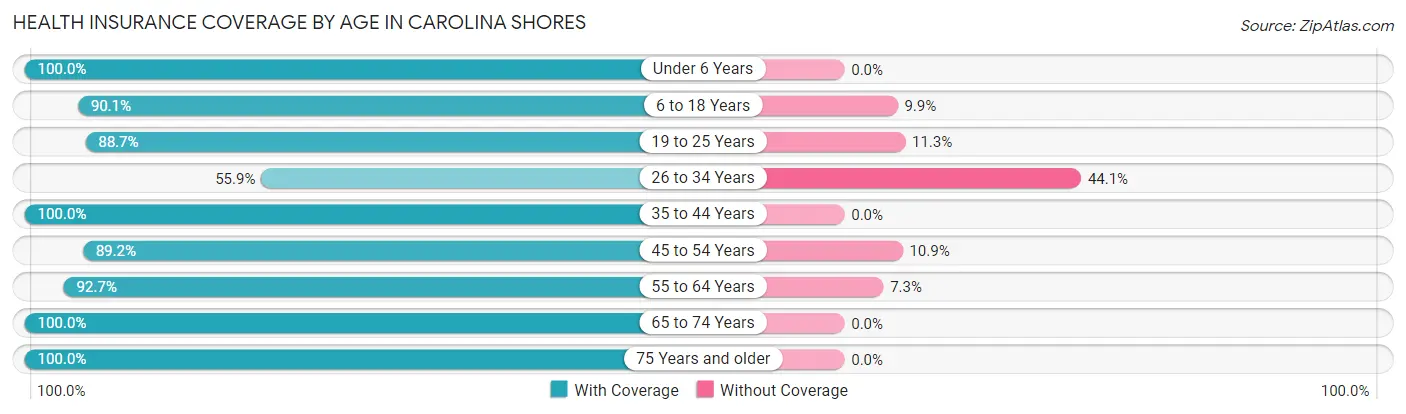
| Age Bracket | With Coverage | Without Coverage |
| Under 6 Years | 83 (100.0%) | 0 (0.0%) |
| 6 to 18 Years | 236 (90.1%) | 26 (9.9%) |
| 19 to 25 Years | 94 (88.7%) | 12 (11.3%) |
| 26 to 34 Years | 119 (55.9%) | 94 (44.1%) |
| 35 to 44 Years | 148 (100.0%) | 0 (0.0%) |
| 45 to 54 Years | 337 (89.1%) | 41 (10.8%) |
| 55 to 64 Years | 983 (92.7%) | 77 (7.3%) |
| 65 to 74 Years | 1,301 (100.0%) | 0 (0.0%) |
| 75 Years and older | 1,092 (100.0%) | 0 (0.0%) |
| Total | 4,393 (94.6%) | 250 (5.4%) |
Health Insurance Coverage by Citizenship Status in Carolina Shores
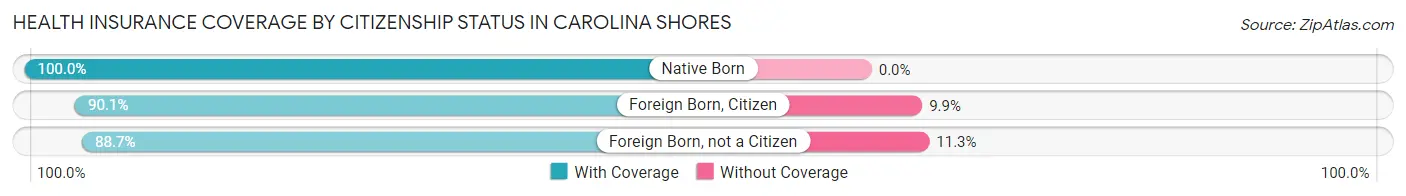
| Citizenship Status | With Coverage | Without Coverage |
| Native Born | 83 (100.0%) | 0 (0.0%) |
| Foreign Born, Citizen | 236 (90.1%) | 26 (9.9%) |
| Foreign Born, not a Citizen | 94 (88.7%) | 12 (11.3%) |
Health Insurance Coverage by Household Income in Carolina Shores
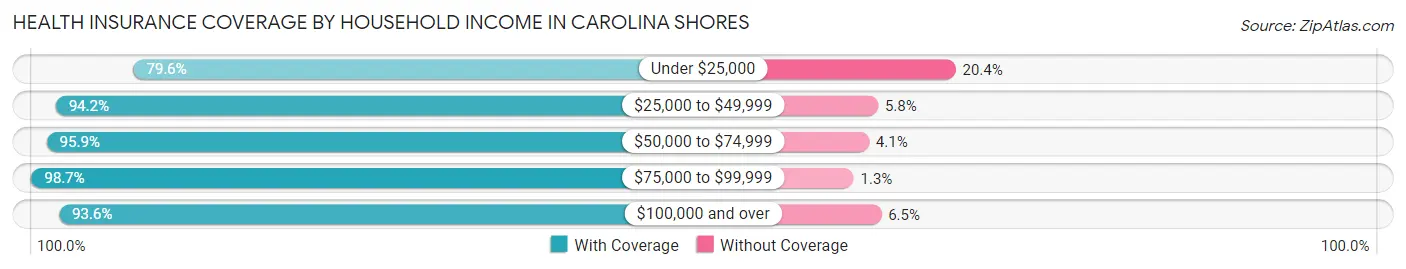
| Household Income | With Coverage | Without Coverage |
| Under $25,000 | 207 (79.6%) | 53 (20.4%) |
| $25,000 to $49,999 | 613 (94.2%) | 38 (5.8%) |
| $50,000 to $74,999 | 695 (95.9%) | 30 (4.1%) |
| $75,000 to $99,999 | 1,240 (98.7%) | 16 (1.3%) |
| $100,000 and over | 1,638 (93.5%) | 113 (6.5%) |
Public vs Private Health Insurance Coverage by Age in Carolina Shores
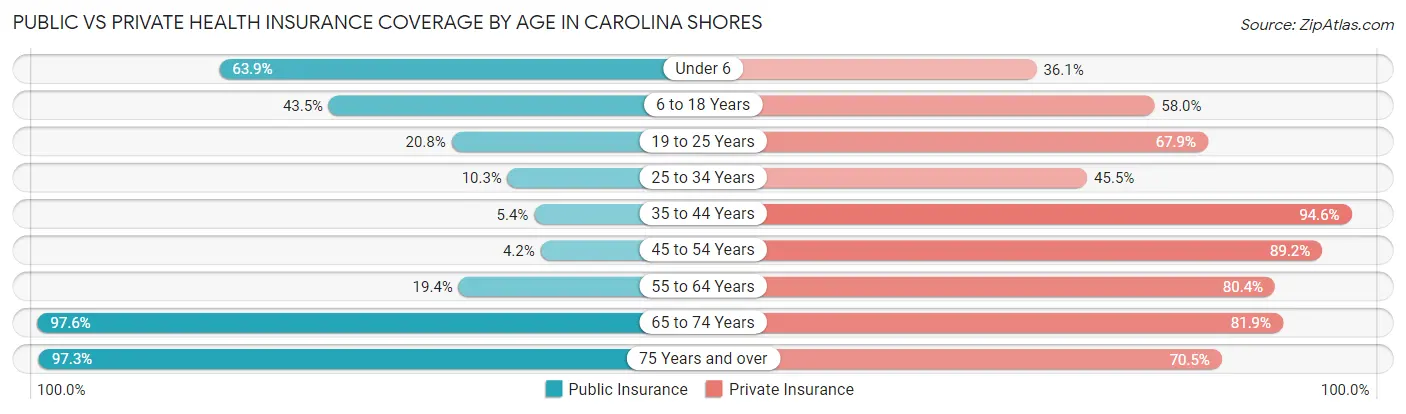
| Age Bracket | Public Insurance | Private Insurance |
| Under 6 | 53 (63.9%) | 30 (36.1%) |
| 6 to 18 Years | 114 (43.5%) | 152 (58.0%) |
| 19 to 25 Years | 22 (20.7%) | 72 (67.9%) |
| 25 to 34 Years | 22 (10.3%) | 97 (45.5%) |
| 35 to 44 Years | 8 (5.4%) | 140 (94.6%) |
| 45 to 54 Years | 16 (4.2%) | 337 (89.1%) |
| 55 to 64 Years | 206 (19.4%) | 852 (80.4%) |
| 65 to 74 Years | 1,270 (97.6%) | 1,065 (81.9%) |
| 75 Years and over | 1,063 (97.3%) | 770 (70.5%) |
| Total | 2,774 (59.8%) | 3,515 (75.7%) |
Disability Status by Sex by Age in Carolina Shores
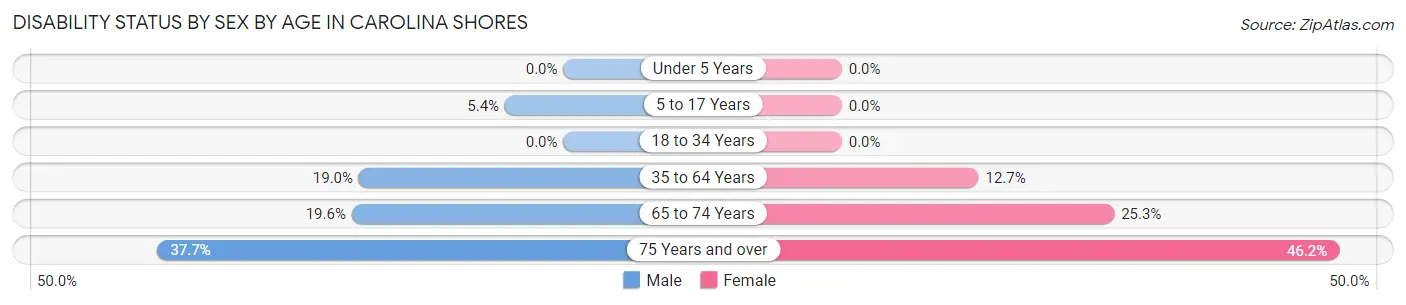
| Age Bracket | Male | Female |
| Under 5 Years | 0 (0.0%) | 0 (0.0%) |
| 5 to 17 Years | 9 (5.4%) | 0 (0.0%) |
| 18 to 34 Years | 0 (0.0%) | 0 (0.0%) |
| 35 to 64 Years | 123 (19.0%) | 119 (12.7%) |
| 65 to 74 Years | 132 (19.6%) | 159 (25.3%) |
| 75 Years and over | 191 (37.7%) | 270 (46.2%) |
Disability Class by Sex by Age in Carolina Shores
Disability Class: Hearing Difficulty
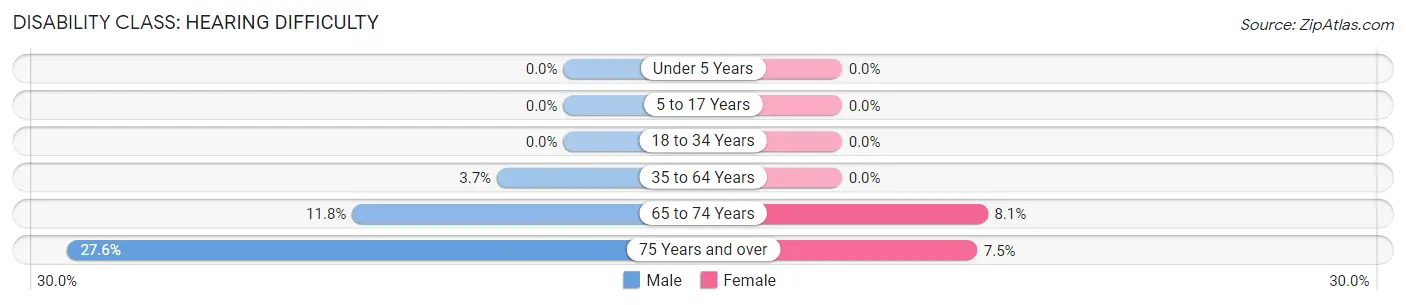
| Age Bracket | Male | Female |
| Under 5 Years | 0 (0.0%) | 0 (0.0%) |
| 5 to 17 Years | 0 (0.0%) | 0 (0.0%) |
| 18 to 34 Years | 0 (0.0%) | 0 (0.0%) |
| 35 to 64 Years | 24 (3.7%) | 0 (0.0%) |
| 65 to 74 Years | 79 (11.8%) | 51 (8.1%) |
| 75 Years and over | 140 (27.6%) | 44 (7.5%) |
Disability Class: Vision Difficulty
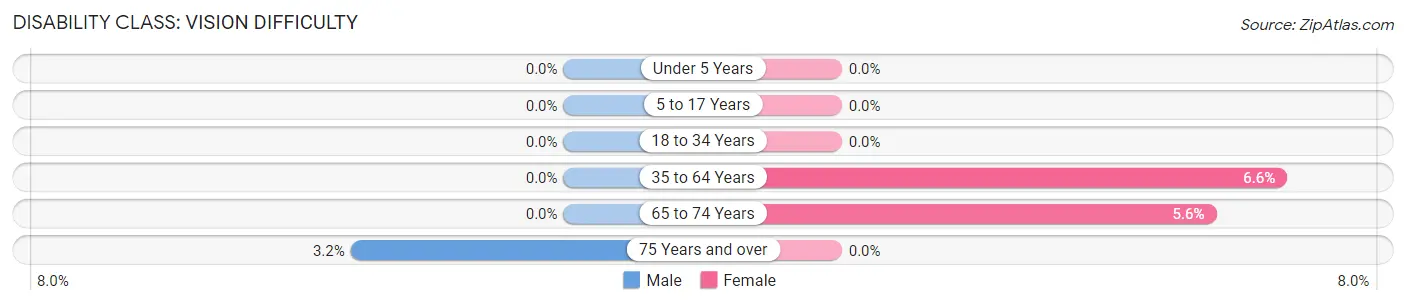
| Age Bracket | Male | Female |
| Under 5 Years | 0 (0.0%) | 0 (0.0%) |
| 5 to 17 Years | 0 (0.0%) | 0 (0.0%) |
| 18 to 34 Years | 0 (0.0%) | 0 (0.0%) |
| 35 to 64 Years | 0 (0.0%) | 62 (6.6%) |
| 65 to 74 Years | 0 (0.0%) | 35 (5.6%) |
| 75 Years and over | 16 (3.2%) | 0 (0.0%) |
Disability Class: Cognitive Difficulty
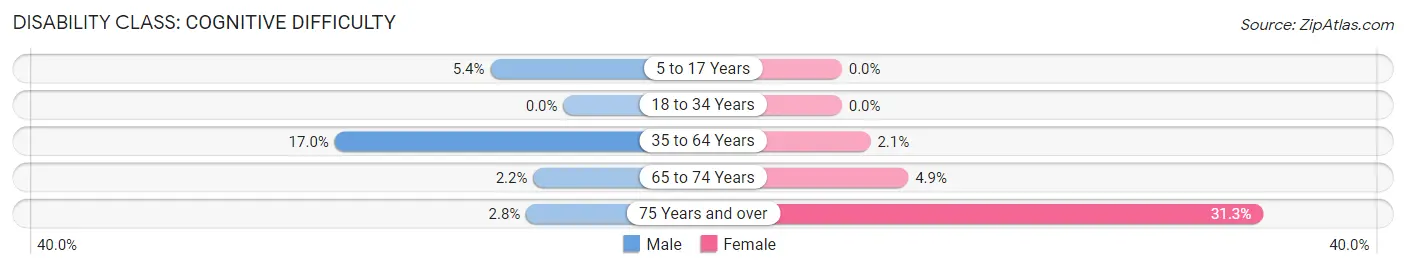
| Age Bracket | Male | Female |
| 5 to 17 Years | 9 (5.4%) | 0 (0.0%) |
| 18 to 34 Years | 0 (0.0%) | 0 (0.0%) |
| 35 to 64 Years | 110 (17.0%) | 20 (2.1%) |
| 65 to 74 Years | 15 (2.2%) | 31 (4.9%) |
| 75 Years and over | 14 (2.8%) | 183 (31.3%) |
Disability Class: Ambulatory Difficulty
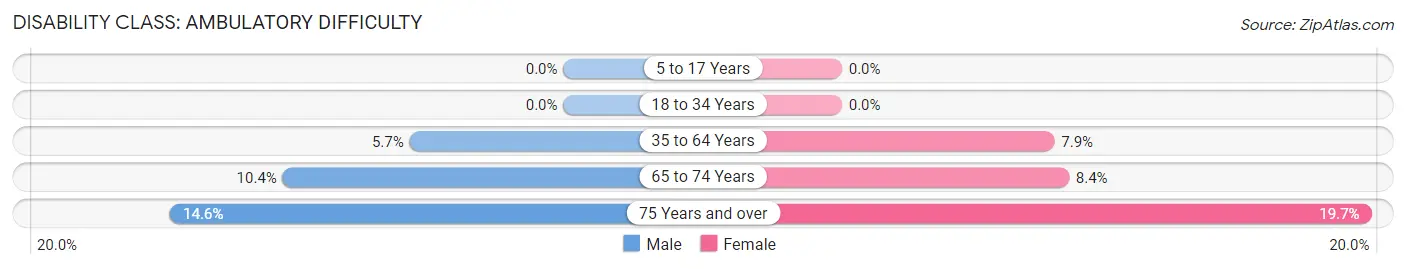
| Age Bracket | Male | Female |
| 5 to 17 Years | 0 (0.0%) | 0 (0.0%) |
| 18 to 34 Years | 0 (0.0%) | 0 (0.0%) |
| 35 to 64 Years | 37 (5.7%) | 74 (7.9%) |
| 65 to 74 Years | 70 (10.4%) | 53 (8.4%) |
| 75 Years and over | 74 (14.6%) | 115 (19.7%) |
Disability Class: Self-Care Difficulty
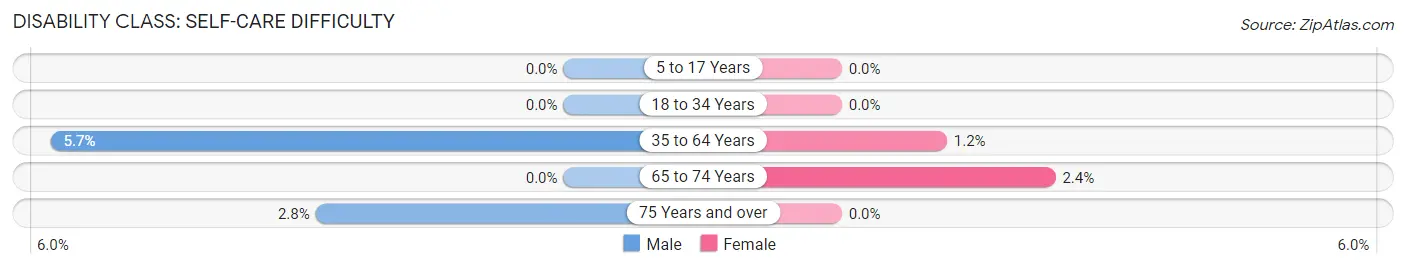
| Age Bracket | Male | Female |
| 5 to 17 Years | 0 (0.0%) | 0 (0.0%) |
| 18 to 34 Years | 0 (0.0%) | 0 (0.0%) |
| 35 to 64 Years | 37 (5.7%) | 11 (1.2%) |
| 65 to 74 Years | 0 (0.0%) | 15 (2.4%) |
| 75 Years and over | 14 (2.8%) | 0 (0.0%) |
Technology Access in Carolina Shores
Computing Device Access in Carolina Shores
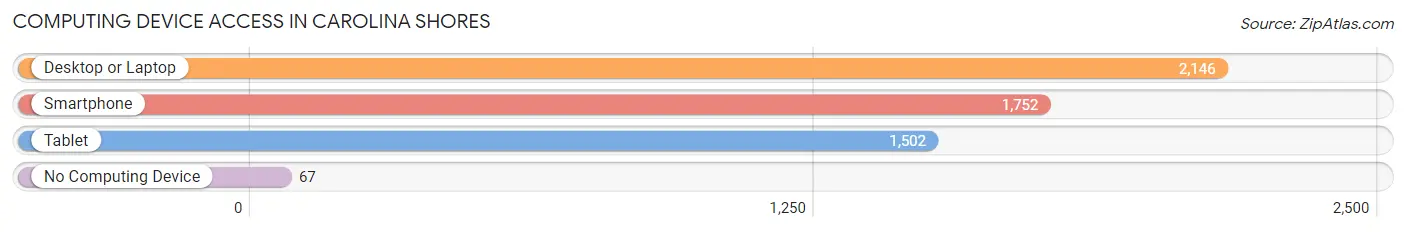
| Device Type | # Households | % Households |
| Desktop or Laptop | 2,146 | 91.2% |
| Smartphone | 1,752 | 74.4% |
| Tablet | 1,502 | 63.8% |
| No Computing Device | 67 | 2.9% |
| Total | 2,354 | 100.0% |
Internet Access in Carolina Shores
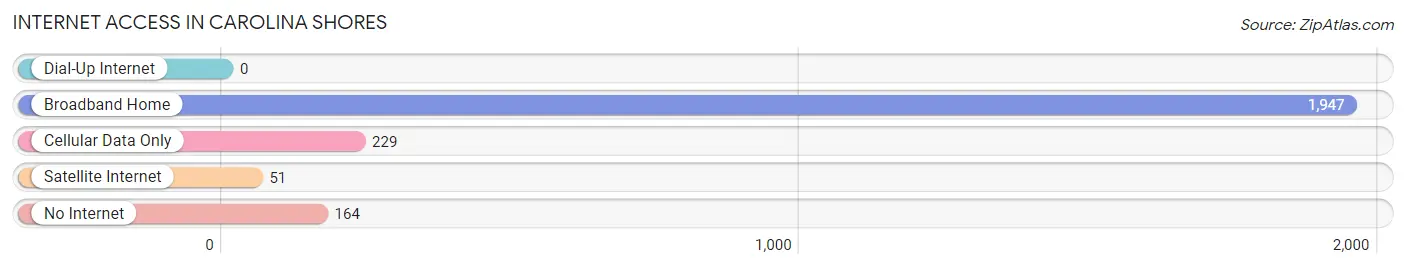
| Internet Type | # Households | % Households |
| Dial-Up Internet | 0 | 0.0% |
| Broadband Home | 1,947 | 82.7% |
| Cellular Data Only | 229 | 9.7% |
| Satellite Internet | 51 | 2.2% |
| No Internet | 164 | 7.0% |
| Total | 2,354 | 100.0% |
Carolina Shores Summary
Carolina Shores is a small town located in Brunswick County, North Carolina. It is situated on the Intracoastal Waterway, just south of the North Carolina-South Carolina border. The town was founded in the late 1950s and has since grown to a population of approximately 3,000 people.
Geography
Carolina Shores is located in the southeastern corner of North Carolina, just south of the North Carolina-South Carolina border. It is situated on the Intracoastal Waterway, which is a navigable waterway that runs along the Atlantic Coast from Maine to Florida. The town is bordered by the towns of Calabash and Sunset Beach to the north, and the city of Southport to the south. The town is approximately 20 miles south of Wilmington, North Carolina, and approximately 40 miles north of Myrtle Beach, South Carolina.
The town is situated on a peninsula, with the Intracoastal Waterway to the east and the Atlantic Ocean to the south. The town is surrounded by a variety of natural habitats, including salt marshes, maritime forests, and estuaries. The town is also home to a variety of wildlife, including deer, foxes, raccoons, and a variety of birds.
History
Carolina Shores was founded in the late 1950s by a group of developers from New York. The developers purchased a large tract of land on the Intracoastal Waterway and began to develop the area into a residential community. The town was originally named “Carolina Shores Estates” and was intended to be a retirement community.
The town quickly grew in popularity and by the early 1960s, the population had grown to over 1,000 people. The town was incorporated in 1962 and the name was changed to “Carolina Shores”.
In the late 1960s, the town began to experience rapid growth as more and more people moved to the area. By the early 1970s, the population had grown to over 3,000 people.
Economy
The economy of Carolina Shores is largely based on tourism and retirement. The town is home to a variety of resorts, hotels, and restaurants, which attract visitors from all over the world. The town is also home to a number of retirement communities, which attract retirees from all over the United States.
The town is also home to a variety of small businesses, including retail stores, restaurants, and professional services. The town is also home to a number of marinas, which provide services to boaters from all over the world.
Demographics
As of the 2010 census, the population of Carolina Shores was 3,068. The population is predominantly white (90.2%), with a small percentage of African Americans (4.2%) and Hispanics (2.7%). The median household income is $45,000, and the median age is 54.
Conclusion
Carolina Shores is a small town located in Brunswick County, North Carolina. It is situated on the Intracoastal Waterway, just south of the North Carolina-South Carolina border. The town was founded in the late 1950s and has since grown to a population of approximately 3,000 people. The economy of Carolina Shores is largely based on tourism and retirement, and the town is home to a variety of resorts, hotels, and restaurants. The population is predominantly white, with a small percentage of African Americans and Hispanics.
Common Questions
What is the Total Population of Carolina Shores?
Total Population of Carolina Shores is 4,643.
What is the Total Male Population of Carolina Shores?
Total Male Population of Carolina Shores is 2,279.
What is the Total Female Population of Carolina Shores?
Total Female Population of Carolina Shores is 2,364.
What is the Ratio of Males per 100 Females in Carolina Shores?
There are 96.40 Males per 100 Females in Carolina Shores.
What is the Ratio of Females per 100 Males in Carolina Shores?
There are 103.73 Females per 100 Males in Carolina Shores.
What is the Median Population Age in Carolina Shores?
Median Population Age in Carolina Shores is 65.5 Years.
What is the Average Family Size in Carolina Shores
Average Family Size in Carolina Shores is 2.3 People.
What is the Average Household Size in Carolina Shores
Average Household Size in Carolina Shores is 2.0 People.
What is Per Capita Income in Carolina Shores?
Per Capita income in Carolina Shores is $43,920.
What is the Median Family Income in Carolina Shores?
Median Family Income in Carolina Shores is $88,741.
What is the Median Household income in Carolina Shores?
Median Household Income in Carolina Shores is $77,259.
What is Income or Wage Gap in Carolina Shores?
Income or Wage Gap in Carolina Shores is 22.0%.
Women in Carolina Shores earn 78.0 cents for every dollar earned by a man.
What is Inequality or Gini Index in Carolina Shores?
Inequality or Gini Index in Carolina Shores is 0.35.
How Large is the Labor Force in Carolina Shores?
There are 1,728 People in the Labor Forcein in Carolina Shores.
What is the Percentage of People in the Labor Force in Carolina Shores?
39.5% of People are in the Labor Force in Carolina Shores.
What is the Unemployment Rate in Carolina Shores?
Unemployment Rate in Carolina Shores is 7.7%.