Westport, NC
Westport Map
Westport Overview
4,570
TOTAL POPULATION
2,255
MALE POPULATION
2,315
FEMALE POPULATION
97.41
MALES / 100 FEMALES
102.66
FEMALES / 100 MALES
49.7
MEDIAN AGE
2.8
AVG FAMILY SIZE
2.5
AVG HOUSEHOLD SIZE
$66,922
PER CAPITA INCOME
$147,000
AVG FAMILY INCOME
$136,290
AVG HOUSEHOLD INCOME
59.2%
WAGE / INCOME GAP [ % ]
40.8¢/ $1
WAGE / INCOME GAP [ $ ]
0.39
INEQUALITY / GINI INDEX
2,094
LABOR FORCE [ PEOPLE ]
54.1%
PERCENT IN LABOR FORCE
6.2%
UNEMPLOYMENT RATE
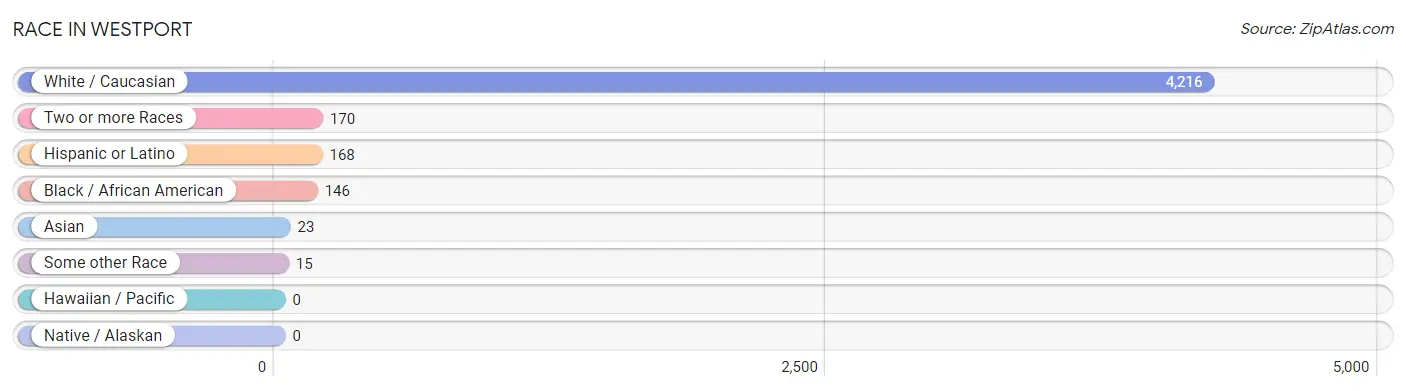
Race in Westport
The most populous races in Westport are White / Caucasian (4,216 | 92.2%), Two or more Races (170 | 3.7%), and Hispanic or Latino (168 | 3.7%).
| Race | # Population | % Population |
| Asian | 23 | 0.5% |
| Black / African American | 146 | 3.2% |
| Hawaiian / Pacific | 0 | 0.0% |
| Hispanic or Latino | 168 | 3.7% |
| Native / Alaskan | 0 | 0.0% |
| White / Caucasian | 4,216 | 92.2% |
| Two or more Races | 170 | 3.7% |
| Some other Race | 15 | 0.3% |
| Total | 4,570 | 100.0% |
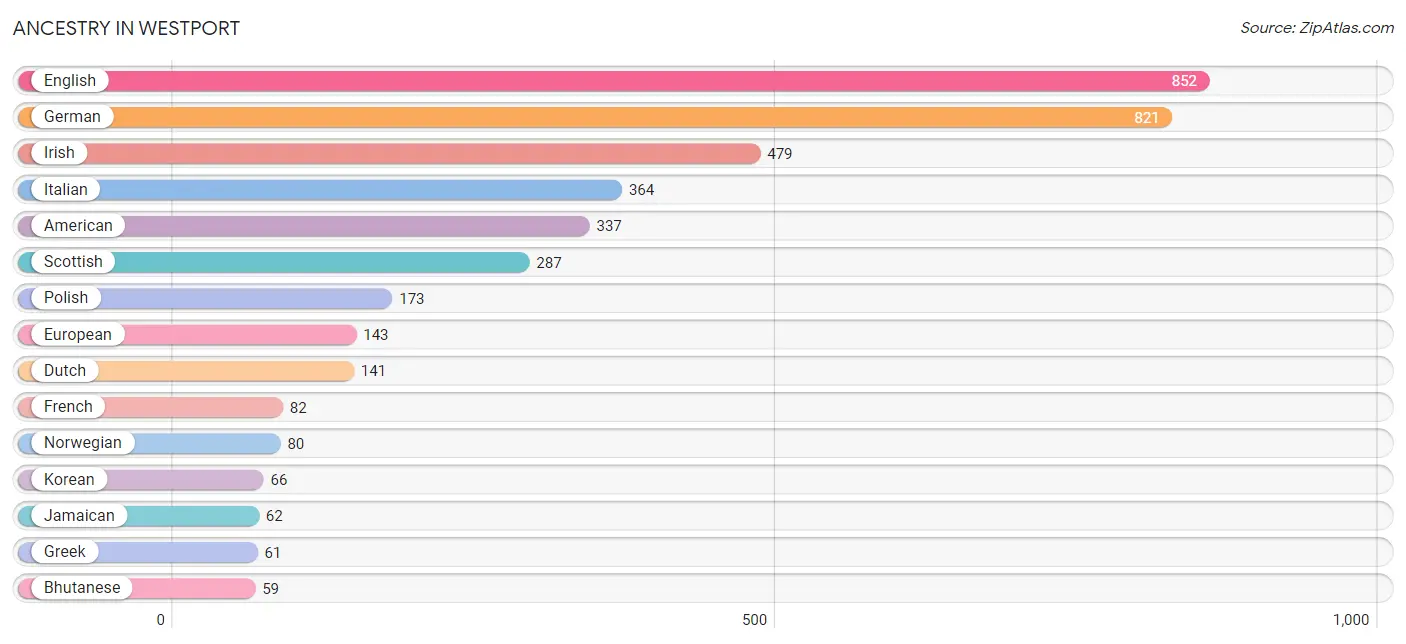
Ancestry in Westport
The most populous ancestries reported in Westport are English (852 | 18.6%), German (821 | 18.0%), Irish (479 | 10.5%), Italian (364 | 8.0%), and American (337 | 7.4%), together accounting for 62.4% of all Westport residents.
| Ancestry | # Population | % Population |
| American | 337 | 7.4% |
| Australian | 19 | 0.4% |
| Austrian | 28 | 0.6% |
| Bhutanese | 59 | 1.3% |
| British | 45 | 1.0% |
| Burmese | 22 | 0.5% |
| Cuban | 14 | 0.3% |
| Czech | 8 | 0.2% |
| Danish | 14 | 0.3% |
| Dominican | 21 | 0.5% |
| Dutch | 141 | 3.1% |
| Eastern European | 23 | 0.5% |
| English | 852 | 18.6% |
| European | 143 | 3.1% |
| French | 82 | 1.8% |
| French Canadian | 18 | 0.4% |
| German | 821 | 18.0% |
| Greek | 61 | 1.3% |
| Hungarian | 9 | 0.2% |
| Indian (Asian) | 7 | 0.2% |
| Irish | 479 | 10.5% |
| Italian | 364 | 8.0% |
| Jamaican | 62 | 1.4% |
| Korean | 66 | 1.4% |
| Laotian | 59 | 1.3% |
| Lithuanian | 11 | 0.2% |
| Lumbee | 18 | 0.4% |
| Mexican | 59 | 1.3% |
| Northern European | 22 | 0.5% |
| Norwegian | 80 | 1.8% |
| Peruvian | 59 | 1.3% |
| Polish | 173 | 3.8% |
| Puerto Rican | 15 | 0.3% |
| Russian | 56 | 1.2% |
| Scandinavian | 8 | 0.2% |
| Scotch-Irish | 40 | 0.9% |
| Scottish | 287 | 6.3% |
| South American | 59 | 1.3% |
| Swedish | 24 | 0.5% |
| Ukrainian | 24 | 0.5% |
| Welsh | 14 | 0.3% | View All 41 Rows |
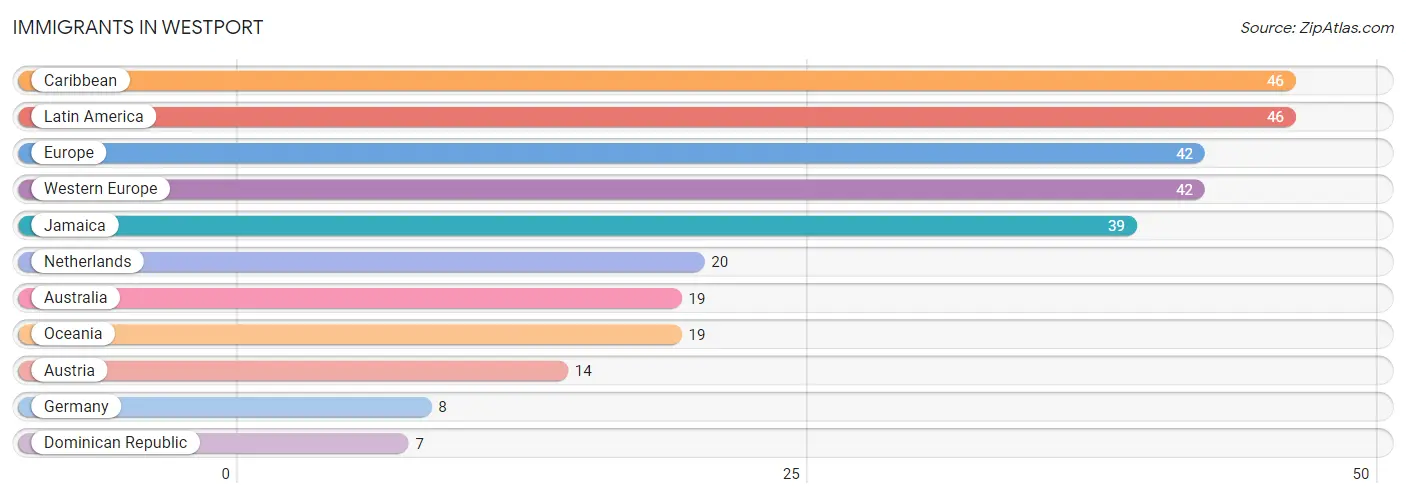
Immigrants in Westport
The most numerous immigrant groups reported in Westport came from Caribbean (46 | 1.0%), Latin America (46 | 1.0%), Europe (42 | 0.9%), Western Europe (42 | 0.9%), and Jamaica (39 | 0.9%), together accounting for 4.7% of all Westport residents.
| Immigration Origin | # Population | % Population |
| Australia | 19 | 0.4% |
| Austria | 14 | 0.3% |
| Caribbean | 46 | 1.0% |
| Dominican Republic | 7 | 0.2% |
| Europe | 42 | 0.9% |
| Germany | 8 | 0.2% |
| Jamaica | 39 | 0.9% |
| Latin America | 46 | 1.0% |
| Netherlands | 20 | 0.4% |
| Oceania | 19 | 0.4% |
| Western Europe | 42 | 0.9% | View All 11 Rows |
Sex and Age in Westport
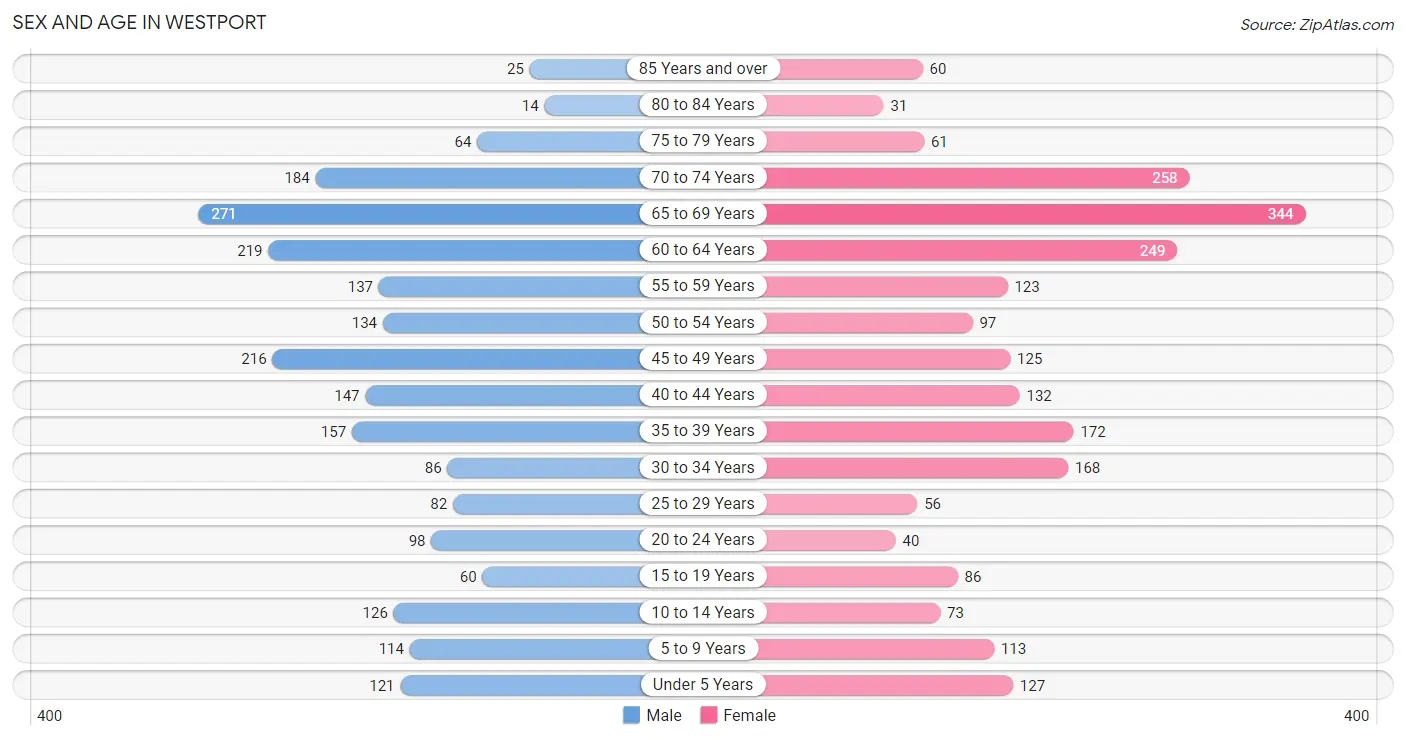
Sex and Age in Westport
The most populous age groups in Westport are 65 to 69 Years (271 | 12.0%) for men and 65 to 69 Years (344 | 14.9%) for women.
| Age Bracket | Male | Female |
| Under 5 Years | 121 (5.4%) | 127 (5.5%) |
| 5 to 9 Years | 114 (5.1%) | 113 (4.9%) |
| 10 to 14 Years | 126 (5.6%) | 73 (3.2%) |
| 15 to 19 Years | 60 (2.7%) | 86 (3.7%) |
| 20 to 24 Years | 98 (4.3%) | 40 (1.7%) |
| 25 to 29 Years | 82 (3.6%) | 56 (2.4%) |
| 30 to 34 Years | 86 (3.8%) | 168 (7.3%) |
| 35 to 39 Years | 157 (7.0%) | 172 (7.4%) |
| 40 to 44 Years | 147 (6.5%) | 132 (5.7%) |
| 45 to 49 Years | 216 (9.6%) | 125 (5.4%) |
| 50 to 54 Years | 134 (5.9%) | 97 (4.2%) |
| 55 to 59 Years | 137 (6.1%) | 123 (5.3%) |
| 60 to 64 Years | 219 (9.7%) | 249 (10.8%) |
| 65 to 69 Years | 271 (12.0%) | 344 (14.9%) |
| 70 to 74 Years | 184 (8.2%) | 258 (11.1%) |
| 75 to 79 Years | 64 (2.8%) | 61 (2.6%) |
| 80 to 84 Years | 14 (0.6%) | 31 (1.3%) |
| 85 Years and over | 25 (1.1%) | 60 (2.6%) |
| Total | 2,255 (100.0%) | 2,315 (100.0%) |
Families and Households in Westport
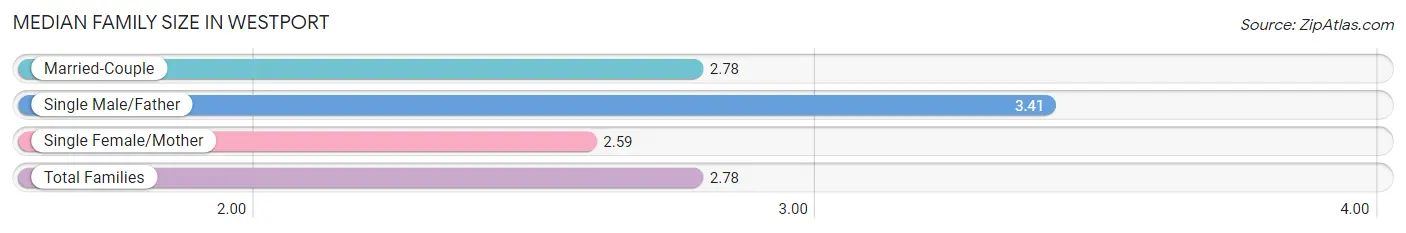
Median Family Size in Westport
The median family size in Westport is 2.78 persons per family, with single male/father families (27 | 1.8%) accounting for the largest median family size of 3.41 persons per family. On the other hand, single female/mother families (128 | 8.5%) represent the smallest median family size with 2.59 persons per family.
| Family Type | # Families | Family Size |
| Married-Couple | 1,345 (89.7%) | 2.78 |
| Single Male/Father | 27 (1.8%) | 3.41 |
| Single Female/Mother | 128 (8.5%) | 2.59 |
| Total Families | 1,500 (100.0%) | 2.78 |
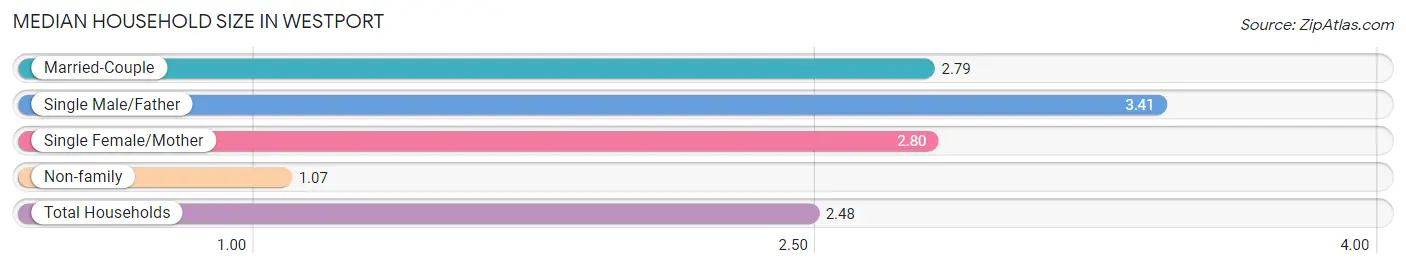
Median Household Size in Westport
The median household size in Westport is 2.48 persons per household, with single male/father households (27 | 1.5%) accounting for the largest median household size of 3.41 persons per household. non-family households (342 | 18.6%) represent the smallest median household size with 1.07 persons per household.
| Household Type | # Households | Household Size |
| Married-Couple | 1,345 (73.0%) | 2.79 |
| Single Male/Father | 27 (1.5%) | 3.41 |
| Single Female/Mother | 128 (7.0%) | 2.80 |
| Non-family | 342 (18.6%) | 1.07 |
| Total Households | 1,842 (100.0%) | 2.48 |
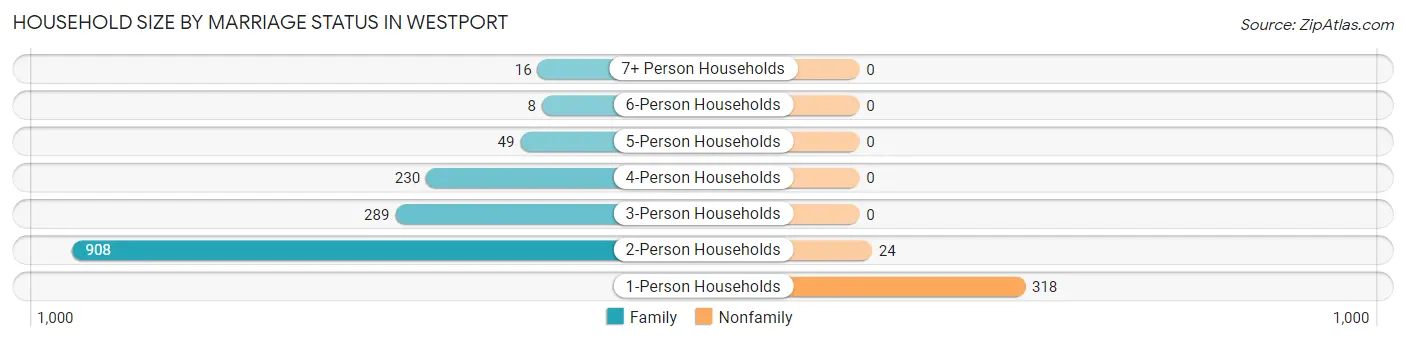
Household Size by Marriage Status in Westport
Out of a total of 1,842 households in Westport, 1,500 (81.4%) are family households, while 342 (18.6%) are nonfamily households. The most numerous type of family households are 2-person households, comprising 908, and the most common type of nonfamily households are 1-person households, comprising 318.
| Household Size | Family Households | Nonfamily Households |
| 1-Person Households | - | 318 (17.3%) |
| 2-Person Households | 908 (49.3%) | 24 (1.3%) |
| 3-Person Households | 289 (15.7%) | 0 (0.0%) |
| 4-Person Households | 230 (12.5%) | 0 (0.0%) |
| 5-Person Households | 49 (2.7%) | 0 (0.0%) |
| 6-Person Households | 8 (0.4%) | 0 (0.0%) |
| 7+ Person Households | 16 (0.9%) | 0 (0.0%) |
| Total | 1,500 (81.4%) | 342 (18.6%) |
Female Fertility in Westport
Fertility by Age in Westport
Average fertility rate in Westport is 57.0 births per 1,000 women. Women in the age bracket of 35 to 50 years have the highest fertility rate with 79.0 births per 1,000 women. Women in the age bracket of 35 to 50 years acount for 78.3% of all women with births.
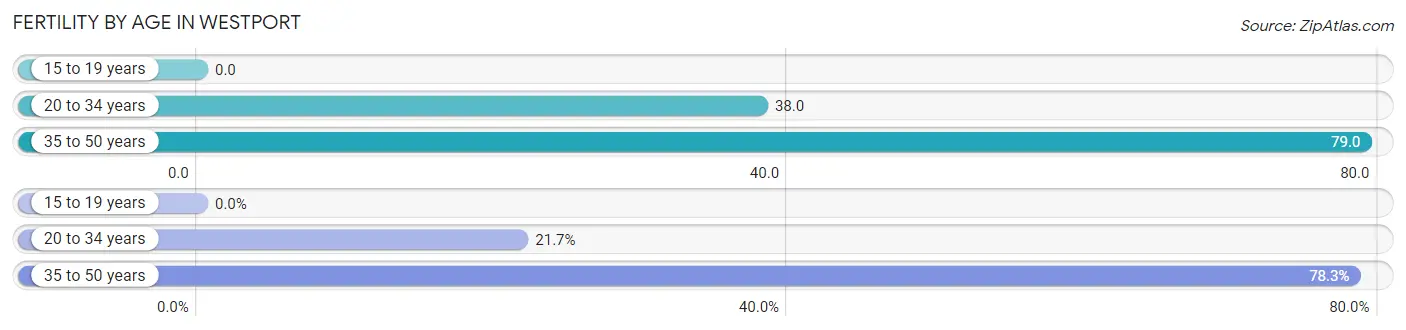
| Age Bracket | Women with Births | Births / 1,000 Women |
| 15 to 19 years | 0 (0.0%) | 0.0 |
| 20 to 34 years | 10 (21.7%) | 38.0 |
| 35 to 50 years | 36 (78.3%) | 79.0 |
| Total | 46 (100.0%) | 57.0 |
Fertility by Age by Marriage Status in Westport
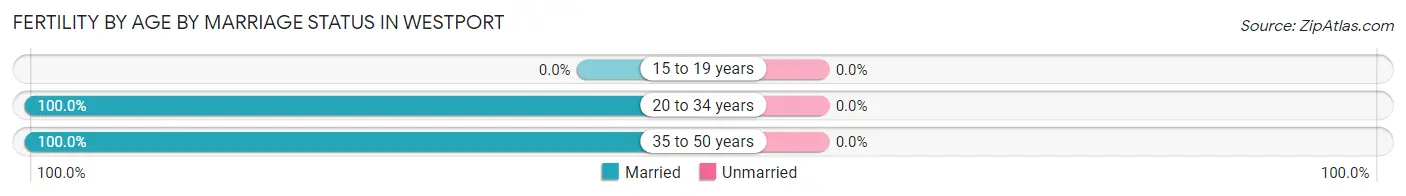
| Age Bracket | Married | Unmarried |
| 15 to 19 years | 0 (0.0%) | 0 (0.0%) |
| 20 to 34 years | 10 (100.0%) | 0 (0.0%) |
| 35 to 50 years | 36 (100.0%) | 0 (0.0%) |
| Total | 46 (100.0%) | 0 (0.0%) |
Fertility by Education in Westport
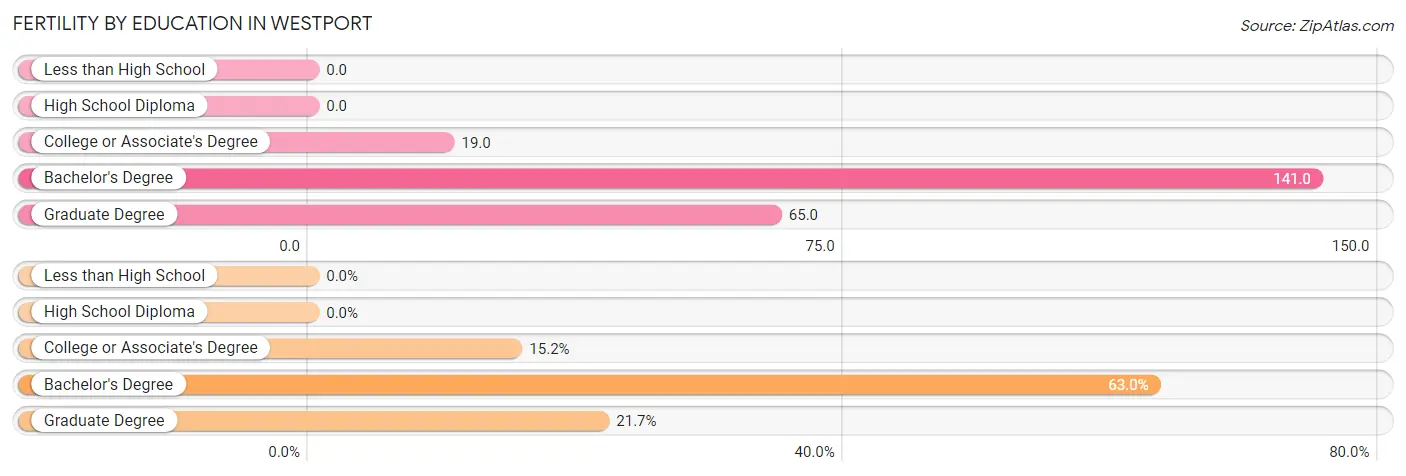
| Educational Attainment | Women with Births | Births / 1,000 Women |
| Less than High School | 0 (0.0%) | 0.0 |
| High School Diploma | 0 (0.0%) | 0.0 |
| College or Associate's Degree | 7 (15.2%) | 19.0 |
| Bachelor's Degree | 29 (63.0%) | 141.0 |
| Graduate Degree | 10 (21.7%) | 65.0 |
| Total | 46 (100.0%) | 57.0 |
Fertility by Education by Marriage Status in Westport
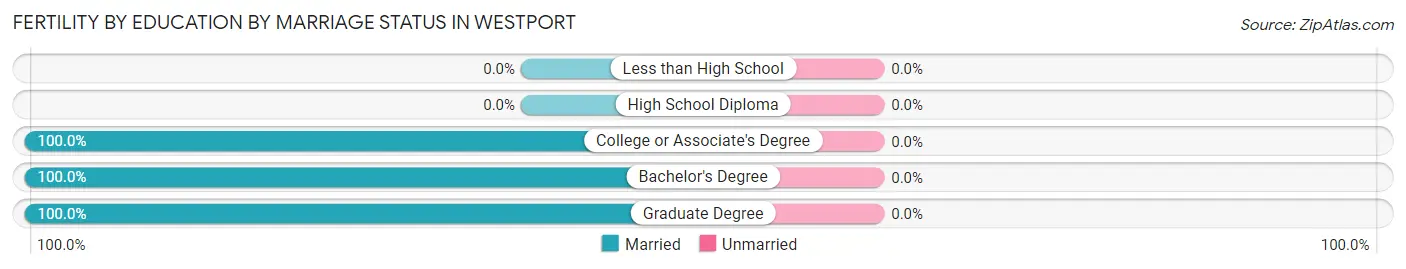
| Educational Attainment | Married | Unmarried |
| Less than High School | 0 (0.0%) | 0 (0.0%) |
| High School Diploma | 0 (0.0%) | 0 (0.0%) |
| College or Associate's Degree | 7 (100.0%) | 0 (0.0%) |
| Bachelor's Degree | 29 (100.0%) | 0 (0.0%) |
| Graduate Degree | 10 (100.0%) | 0 (0.0%) |
| Total | 46 (100.0%) | 0 (0.0%) |
Income in Westport
Income Overview in Westport
Per Capita Income in Westport is $66,922, while median incomes of families and households are $147,000 and $136,290 respectively.
| Characteristic | Number | Measure |
| Per Capita Income | 4,570 | $66,922 |
| Median Family Income | 1,500 | $147,000 |
| Mean Family Income | 1,500 | $182,510 |
| Median Household Income | 1,842 | $136,290 |
| Mean Household Income | 1,842 | $165,676 |
| Income Deficit | 1,500 | $0 |
| Wage / Income Gap (%) | 4,570 | 59.18% |
| Wage / Income Gap ($) | 4,570 | 40.82¢ per $1 |
| Gini / Inequality Index | 4,570 | 0.39 |
Earnings by Sex in Westport
Average Earnings in Westport are $77,955, $101,490 for men and $41,429 for women, a difference of 59.2%.
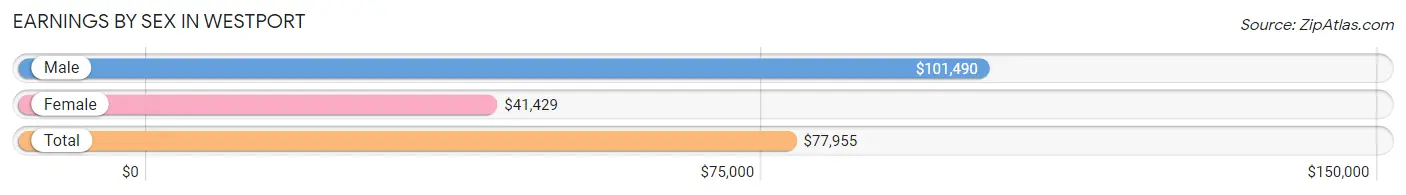
| Sex | Number | Average Earnings |
| Male | 1,342 (58.9%) | $101,490 |
| Female | 936 (41.1%) | $41,429 |
| Total | 2,278 (100.0%) | $77,955 |
Earnings by Sex by Income Bracket in Westport
The most common earnings brackets in Westport are $100,000+ for men (702 | 52.3%) and $100,000+ for women (240 | 25.6%).
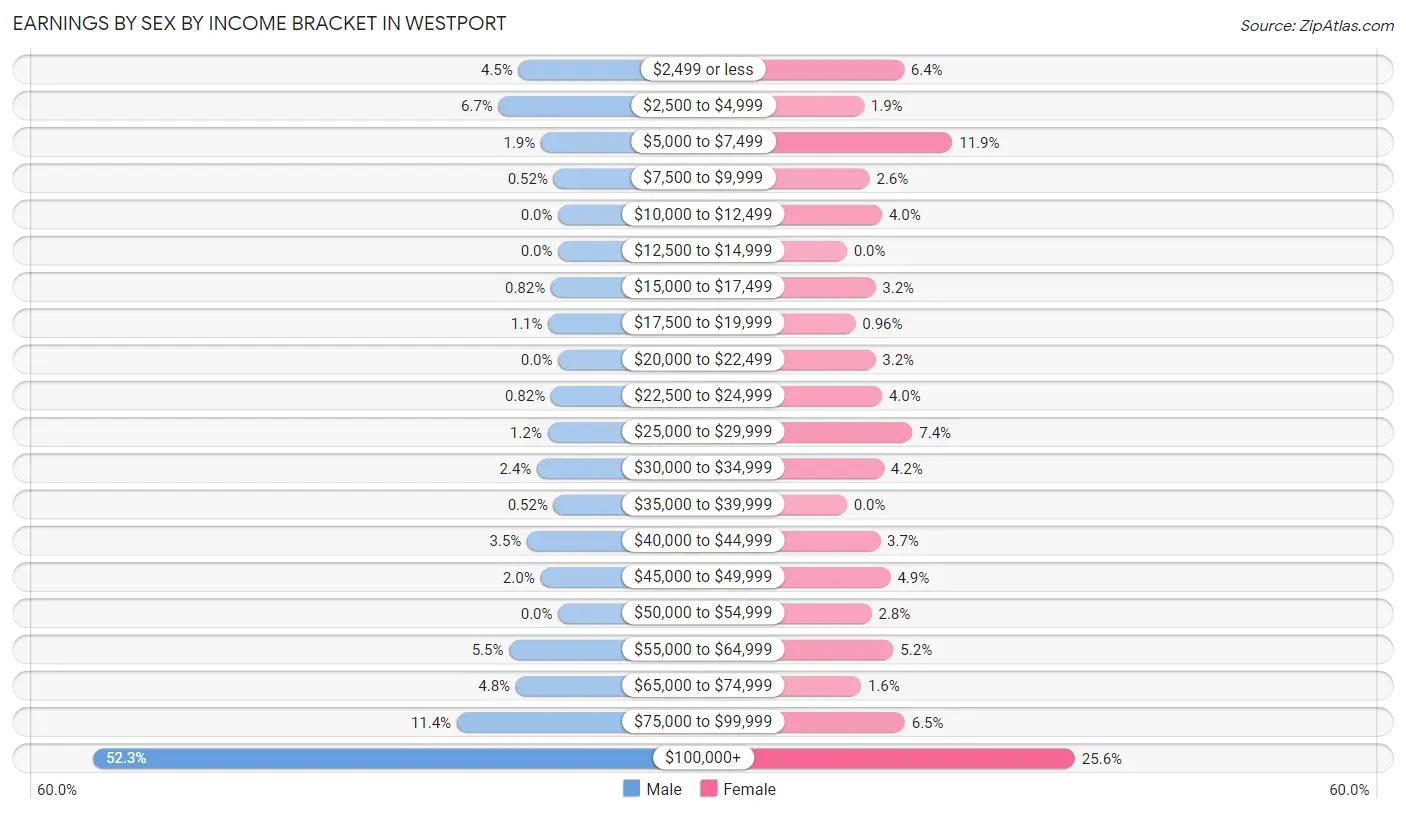
| Income | Male | Female |
| $2,499 or less | 60 (4.5%) | 60 (6.4%) |
| $2,500 to $4,999 | 90 (6.7%) | 18 (1.9%) |
| $5,000 to $7,499 | 26 (1.9%) | 111 (11.9%) |
| $7,500 to $9,999 | 7 (0.5%) | 24 (2.6%) |
| $10,000 to $12,499 | 0 (0.0%) | 37 (4.0%) |
| $12,500 to $14,999 | 0 (0.0%) | 0 (0.0%) |
| $15,000 to $17,499 | 11 (0.8%) | 30 (3.2%) |
| $17,500 to $19,999 | 15 (1.1%) | 9 (1.0%) |
| $20,000 to $22,499 | 0 (0.0%) | 30 (3.2%) |
| $22,500 to $24,999 | 11 (0.8%) | 37 (4.0%) |
| $25,000 to $29,999 | 16 (1.2%) | 69 (7.4%) |
| $30,000 to $34,999 | 32 (2.4%) | 39 (4.2%) |
| $35,000 to $39,999 | 7 (0.5%) | 0 (0.0%) |
| $40,000 to $44,999 | 47 (3.5%) | 35 (3.7%) |
| $45,000 to $49,999 | 27 (2.0%) | 46 (4.9%) |
| $50,000 to $54,999 | 0 (0.0%) | 26 (2.8%) |
| $55,000 to $64,999 | 74 (5.5%) | 49 (5.2%) |
| $65,000 to $74,999 | 64 (4.8%) | 15 (1.6%) |
| $75,000 to $99,999 | 153 (11.4%) | 61 (6.5%) |
| $100,000+ | 702 (52.3%) | 240 (25.6%) |
| Total | 1,342 (100.0%) | 936 (100.0%) |
Earnings by Sex by Educational Attainment in Westport
Average earnings in Westport are $113,534 for men and $45,272 for women, a difference of 60.1%. Men with an educational attainment of graduate degree enjoy the highest average annual earnings of $162,692, while those with high school diploma education earn the least with $57,904. Women with an educational attainment of graduate degree earn the most with the average annual earnings of $165,313, while those with high school diploma education have the smallest earnings of $25,536.
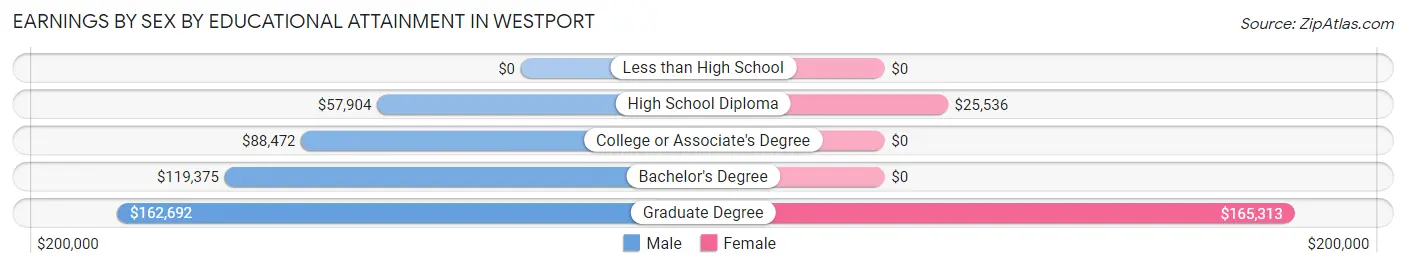
| Educational Attainment | Male Income | Female Income |
| Less than High School | - | - |
| High School Diploma | $57,904 | $25,536 |
| College or Associate's Degree | $88,472 | $0 |
| Bachelor's Degree | $119,375 | $0 |
| Graduate Degree | $162,692 | $165,313 |
| Total | $113,534 | $45,272 |
Family Income in Westport
Family Income Brackets in Westport
According to the Westport family income data, there are 470 families falling into the $200,000+ income range, which is the most common income bracket and makes up 31.3% of all families.
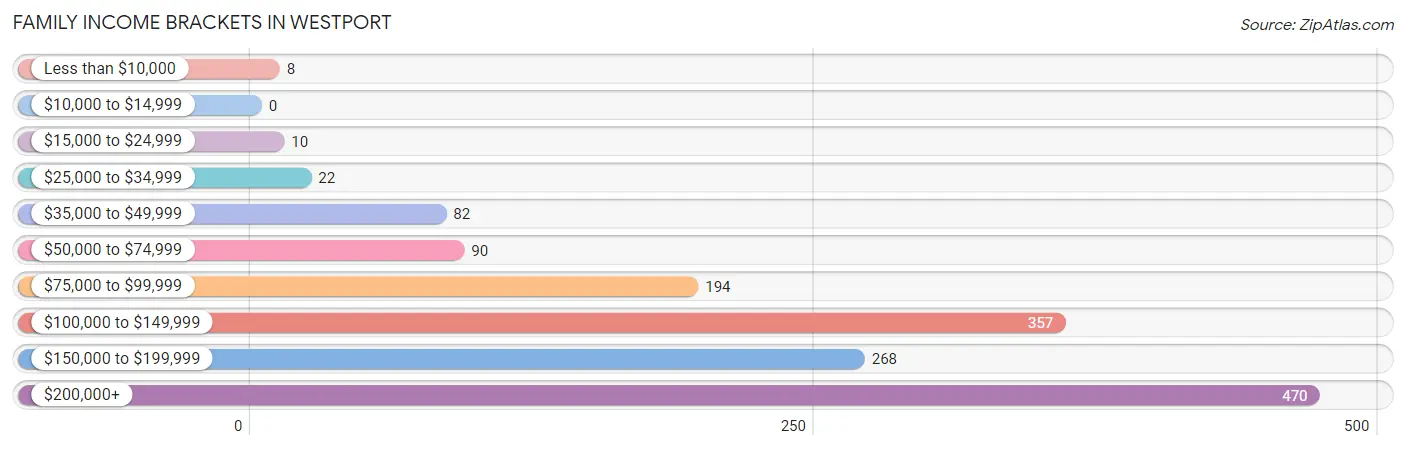
| Income Bracket | # Families | % Families |
| Less than $10,000 | 8 | 0.5% |
| $10,000 to $14,999 | 0 | 0.0% |
| $15,000 to $24,999 | 10 | 0.7% |
| $25,000 to $34,999 | 22 | 1.5% |
| $35,000 to $49,999 | 82 | 5.5% |
| $50,000 to $74,999 | 90 | 6.0% |
| $75,000 to $99,999 | 194 | 12.9% |
| $100,000 to $149,999 | 357 | 23.8% |
| $150,000 to $199,999 | 268 | 17.9% |
| $200,000+ | 470 | 31.3% |
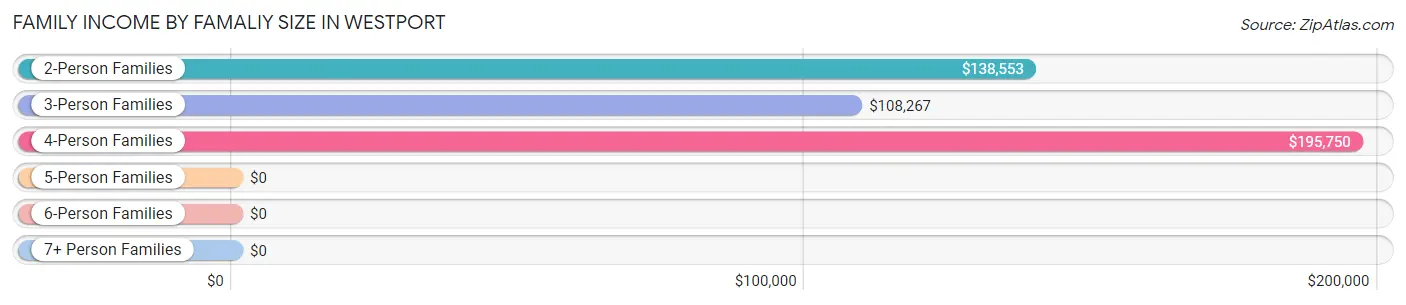
Family Income by Famaliy Size in Westport
4-person families (239 | 15.9%) account for the highest median family income in Westport with $195,750 per family, while 2-person families (934 | 62.3%) have the highest median income of $69,276 per family member.
| Income Bracket | # Families | Median Income |
| 2-Person Families | 934 (62.3%) | $138,553 |
| 3-Person Families | 263 (17.5%) | $108,267 |
| 4-Person Families | 239 (15.9%) | $195,750 |
| 5-Person Families | 40 (2.7%) | $0 |
| 6-Person Families | 8 (0.5%) | $0 |
| 7+ Person Families | 16 (1.1%) | $0 |
| Total | 1,500 (100.0%) | $147,000 |
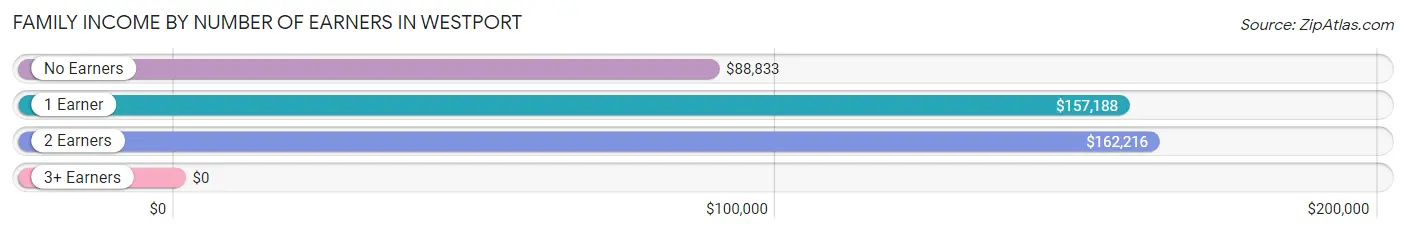
Family Income by Number of Earners in Westport
| Number of Earners | # Families | Median Income |
| No Earners | 292 (19.5%) | $88,833 |
| 1 Earner | 521 (34.7%) | $157,188 |
| 2 Earners | 631 (42.1%) | $162,216 |
| 3+ Earners | 56 (3.7%) | $0 |
| Total | 1,500 (100.0%) | $147,000 |
Household Income in Westport
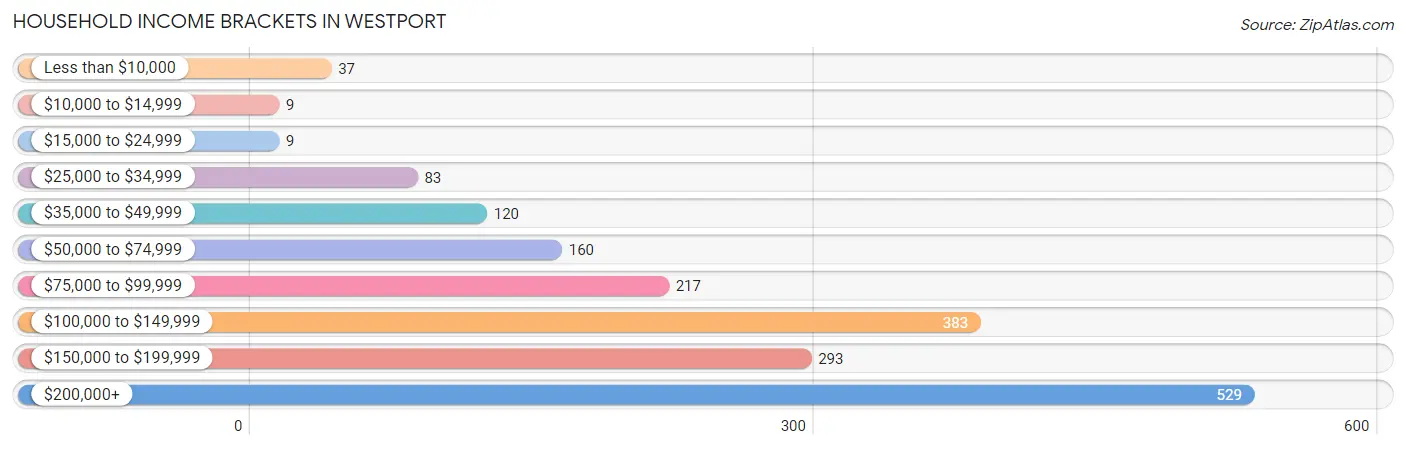
Household Income Brackets in Westport
With 529 households falling in the category, the $200,000+ income range is the most frequent in Westport, accounting for 28.7% of all households. In contrast, only 9 households (0.5%) fall into the $10,000 to $14,999 income bracket, making it the least populous group.
| Income Bracket | # Households | % Households |
| Less than $10,000 | 37 | 2.0% |
| $10,000 to $14,999 | 9 | 0.5% |
| $15,000 to $24,999 | 9 | 0.5% |
| $25,000 to $34,999 | 83 | 4.5% |
| $35,000 to $49,999 | 120 | 6.5% |
| $50,000 to $74,999 | 160 | 8.7% |
| $75,000 to $99,999 | 217 | 11.8% |
| $100,000 to $149,999 | 383 | 20.8% |
| $150,000 to $199,999 | 293 | 15.9% |
| $200,000+ | 529 | 28.7% |
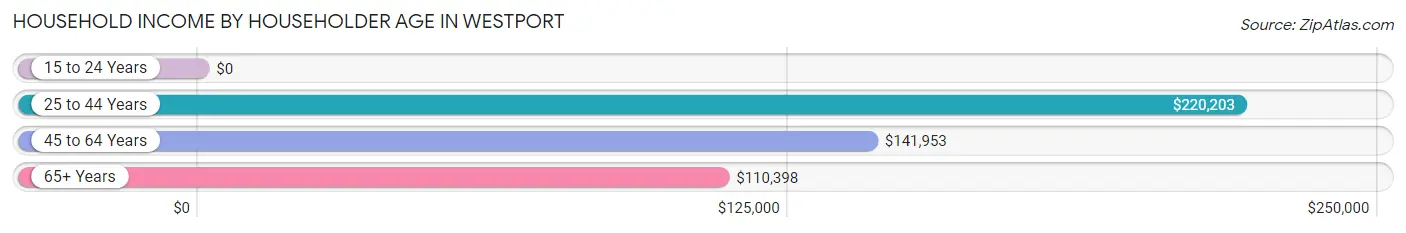
Household Income by Householder Age in Westport
The median household income in Westport is $136,290, with the highest median household income of $220,203 found in the 25 to 44 years age bracket for the primary householder. A total of 368 households (20.0%) fall into this category.
| Income Bracket | # Households | Median Income |
| 15 to 24 Years | 0 (0.0%) | $0 |
| 25 to 44 Years | 368 (20.0%) | $220,203 |
| 45 to 64 Years | 731 (39.7%) | $141,953 |
| 65+ Years | 743 (40.3%) | $110,398 |
| Total | 1,842 (100.0%) | $136,290 |
Poverty in Westport
Income Below Poverty by Sex and Age in Westport
With 1.2% poverty level for males and 1.7% for females among the residents of Westport, 65 to 74 year old males and 55 to 64 year old females are the most vulnerable to poverty, with 17 males (3.7%) and 19 females (5.1%) in their respective age groups living below the poverty level.
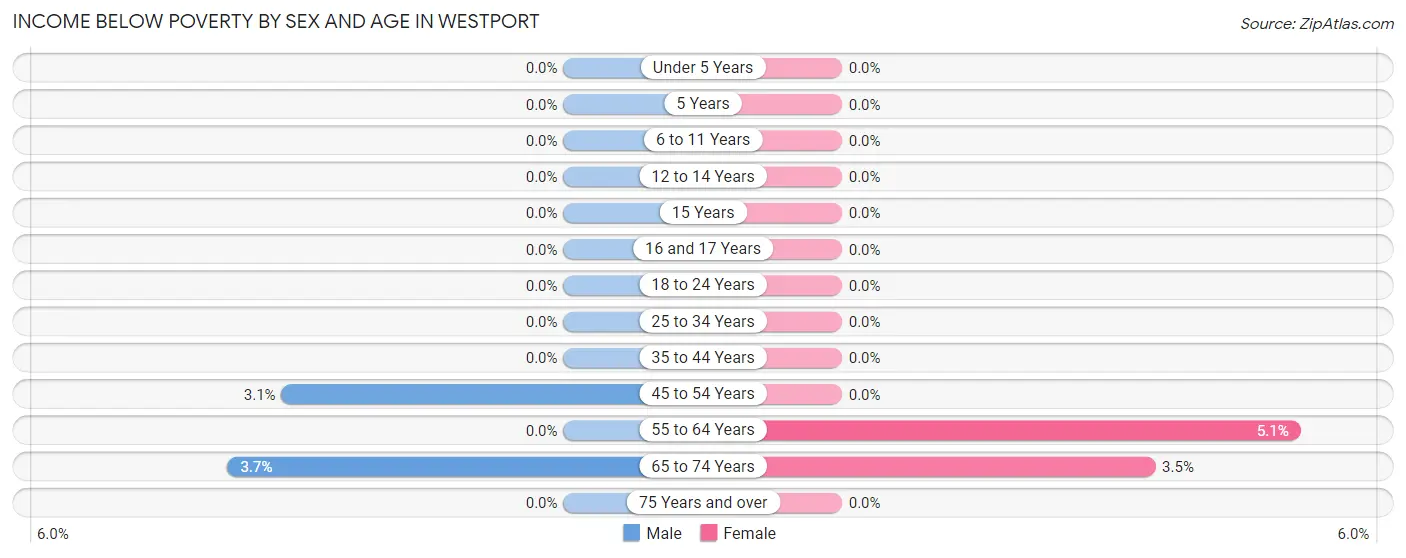
| Age Bracket | Male | Female |
| Under 5 Years | 0 (0.0%) | 0 (0.0%) |
| 5 Years | 0 (0.0%) | 0 (0.0%) |
| 6 to 11 Years | 0 (0.0%) | 0 (0.0%) |
| 12 to 14 Years | 0 (0.0%) | 0 (0.0%) |
| 15 Years | 0 (0.0%) | 0 (0.0%) |
| 16 and 17 Years | 0 (0.0%) | 0 (0.0%) |
| 18 to 24 Years | 0 (0.0%) | 0 (0.0%) |
| 25 to 34 Years | 0 (0.0%) | 0 (0.0%) |
| 35 to 44 Years | 0 (0.0%) | 0 (0.0%) |
| 45 to 54 Years | 11 (3.1%) | 0 (0.0%) |
| 55 to 64 Years | 0 (0.0%) | 19 (5.1%) |
| 65 to 74 Years | 17 (3.7%) | 21 (3.5%) |
| 75 Years and over | 0 (0.0%) | 0 (0.0%) |
| Total | 28 (1.2%) | 40 (1.7%) |
Income Above Poverty by Sex and Age in Westport
According to the poverty statistics in Westport, males aged under 5 years and females aged under 5 years are the age groups that are most secure financially, with 100.0% of males and 100.0% of females in these age groups living above the poverty line.
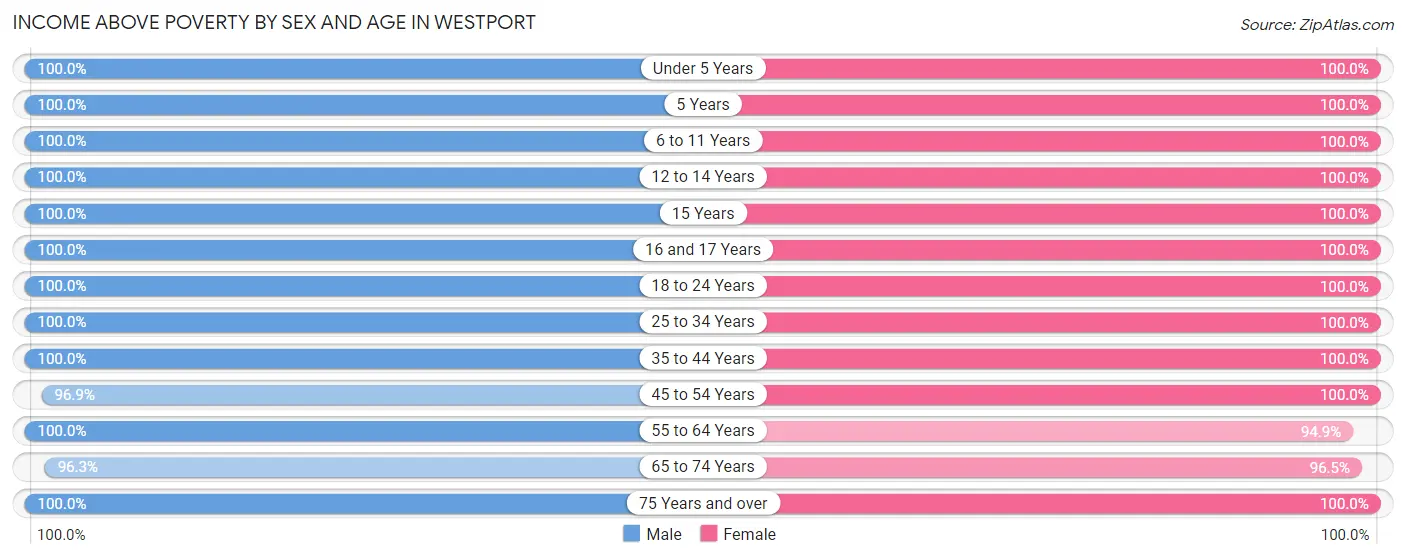
| Age Bracket | Male | Female |
| Under 5 Years | 121 (100.0%) | 114 (100.0%) |
| 5 Years | 47 (100.0%) | 25 (100.0%) |
| 6 to 11 Years | 114 (100.0%) | 129 (100.0%) |
| 12 to 14 Years | 79 (100.0%) | 32 (100.0%) |
| 15 Years | 20 (100.0%) | 6 (100.0%) |
| 16 and 17 Years | 17 (100.0%) | 32 (100.0%) |
| 18 to 24 Years | 121 (100.0%) | 88 (100.0%) |
| 25 to 34 Years | 168 (100.0%) | 224 (100.0%) |
| 35 to 44 Years | 304 (100.0%) | 304 (100.0%) |
| 45 to 54 Years | 339 (96.9%) | 222 (100.0%) |
| 55 to 64 Years | 356 (100.0%) | 353 (94.9%) |
| 65 to 74 Years | 438 (96.3%) | 581 (96.5%) |
| 75 Years and over | 103 (100.0%) | 152 (100.0%) |
| Total | 2,227 (98.8%) | 2,262 (98.3%) |
Income Below Poverty Among Married-Couple Families in Westport
The poverty statistics for married-couple families in Westport show that 0.6% or 8 of the total 1,345 families live below the poverty line. Families with no children have the highest poverty rate of 0.8%, comprising of 8 families. On the other hand, families with 1 or 2 children have the lowest poverty rate of 0.0%, which includes 0 families.
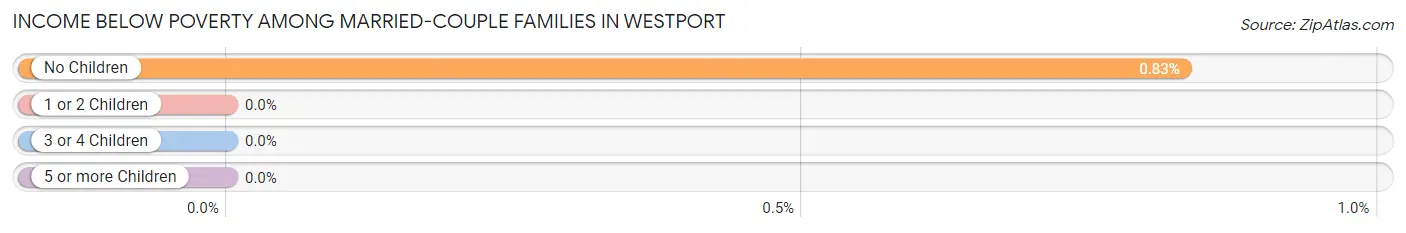
| Children | Above Poverty | Below Poverty |
| No Children | 952 (99.2%) | 8 (0.8%) |
| 1 or 2 Children | 321 (100.0%) | 0 (0.0%) |
| 3 or 4 Children | 48 (100.0%) | 0 (0.0%) |
| 5 or more Children | 16 (100.0%) | 0 (0.0%) |
| Total | 1,337 (99.4%) | 8 (0.6%) |
Income Below Poverty Among Single-Parent Households in Westport
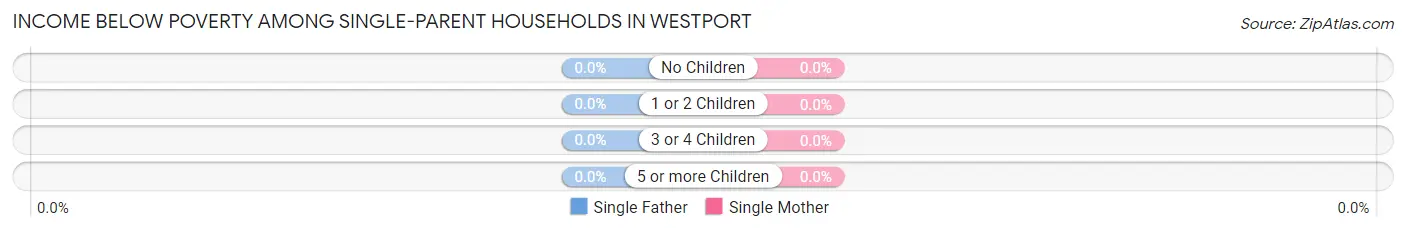
| Children | Single Father | Single Mother |
| No Children | 0 (0.0%) | 0 (0.0%) |
| 1 or 2 Children | 0 (0.0%) | 0 (0.0%) |
| 3 or 4 Children | 0 (0.0%) | 0 (0.0%) |
| 5 or more Children | 0 (0.0%) | 0 (0.0%) |
| Total | 0 (0.0%) | 0 (0.0%) |
Income Below Poverty Among Married-Couple vs Single-Parent Households in Westport
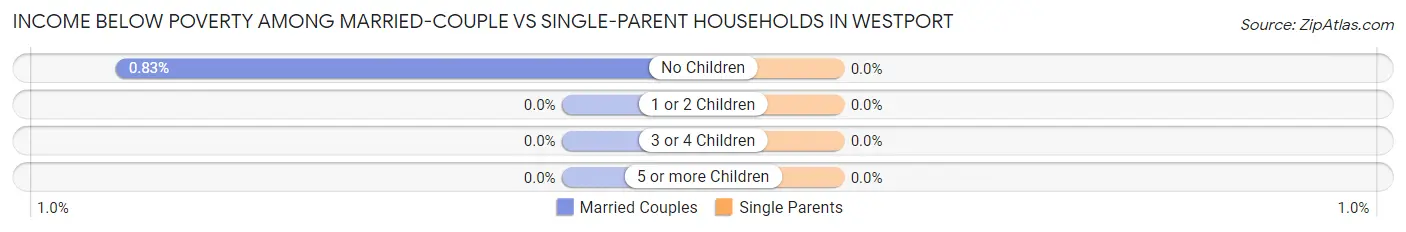
| Children | Married-Couple Families | Single-Parent Households |
| No Children | 8 (0.8%) | 0 (0.0%) |
| 1 or 2 Children | 0 (0.0%) | 0 (0.0%) |
| 3 or 4 Children | 0 (0.0%) | 0 (0.0%) |
| 5 or more Children | 0 (0.0%) | 0 (0.0%) |
| Total | 8 (0.6%) | 0 (0.0%) |
Employment Characteristics in Westport
Employment by Class of Employer in Westport
Among the 1,949 employed individuals in Westport, private company employees (1,383 | 71.0%), self-employed (incorporated) (137 | 7.0%), and self-employed (not incorporated) (125 | 6.4%) make up the most common classes of employment.
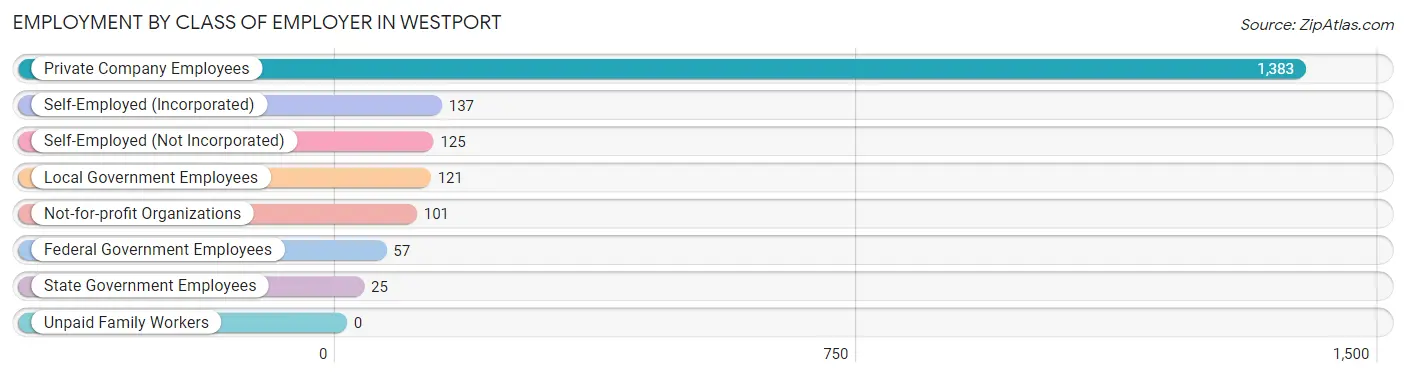
| Employer Class | # Employees | % Employees |
| Private Company Employees | 1,383 | 71.0% |
| Self-Employed (Incorporated) | 137 | 7.0% |
| Self-Employed (Not Incorporated) | 125 | 6.4% |
| Not-for-profit Organizations | 101 | 5.2% |
| Local Government Employees | 121 | 6.2% |
| State Government Employees | 25 | 1.3% |
| Federal Government Employees | 57 | 2.9% |
| Unpaid Family Workers | 0 | 0.0% |
| Total | 1,949 | 100.0% |
Employment Status by Age in Westport
According to the labor force statistics for Westport, out of the total population over 16 years of age (3,870), 54.1% or 2,094 individuals are in the labor force, with 6.2% or 130 of them unemployed. The age group with the highest labor force participation rate is 20 to 24 years, with 94.9% or 131 individuals in the labor force. Within the labor force, the 16 to 19 years age range has the highest percentage of unemployed individuals, with 54.5% or 12 of them being unemployed.
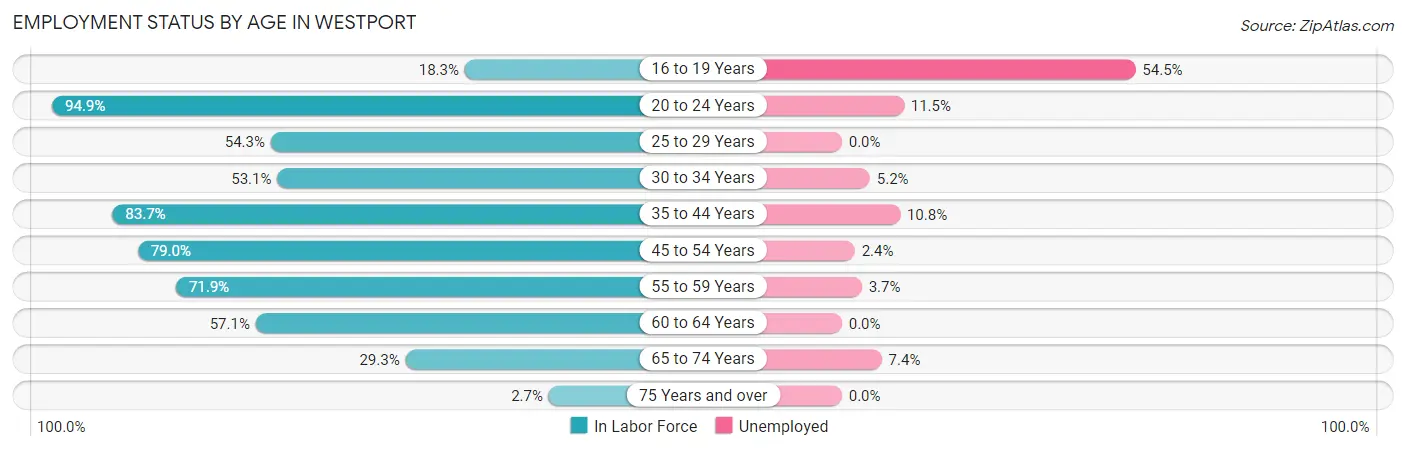
| Age Bracket | In Labor Force | Unemployed |
| 16 to 19 Years | 22 (18.3%) | 12 (54.5%) |
| 20 to 24 Years | 131 (94.9%) | 15 (11.5%) |
| 25 to 29 Years | 75 (54.3%) | 0 (0.0%) |
| 30 to 34 Years | 135 (53.1%) | 7 (5.2%) |
| 35 to 44 Years | 509 (83.7%) | 55 (10.8%) |
| 45 to 54 Years | 452 (79.0%) | 11 (2.4%) |
| 55 to 59 Years | 187 (71.9%) | 7 (3.7%) |
| 60 to 64 Years | 267 (57.1%) | 0 (0.0%) |
| 65 to 74 Years | 310 (29.3%) | 23 (7.4%) |
| 75 Years and over | 7 (2.7%) | 0 (0.0%) |
| Total | 2,094 (54.1%) | 130 (6.2%) |
Employment Status by Educational Attainment in Westport
According to labor force statistics for Westport, 70.7% of individuals (1,626) out of the total population between 25 and 64 years of age (2,300) are in the labor force, with 4.9% or 80 of them being unemployed. The group with the highest labor force participation rate are those with the educational attainment of less than high school, with 100.0% or 19 individuals in the labor force. Within the labor force, individuals with college / associate degree education have the highest percentage of unemployment, with 13.4% or 63 of them being unemployed.
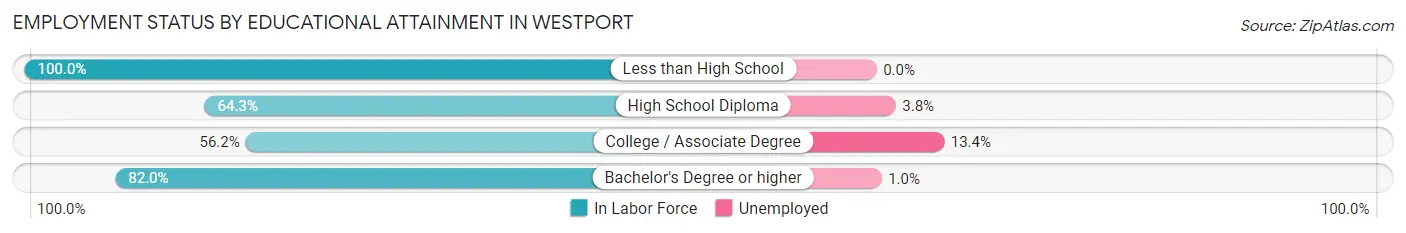
| Educational Attainment | In Labor Force | Unemployed |
| Less than High School | 19 (100.0%) | 0 (0.0%) |
| High School Diploma | 182 (64.3%) | 11 (3.8%) |
| College / Associate Degree | 469 (56.2%) | 112 (13.4%) |
| Bachelor's Degree or higher | 954 (82.0%) | 12 (1.0%) |
| Total | 1,626 (70.7%) | 113 (4.9%) |
Employment Occupations by Sex in Westport
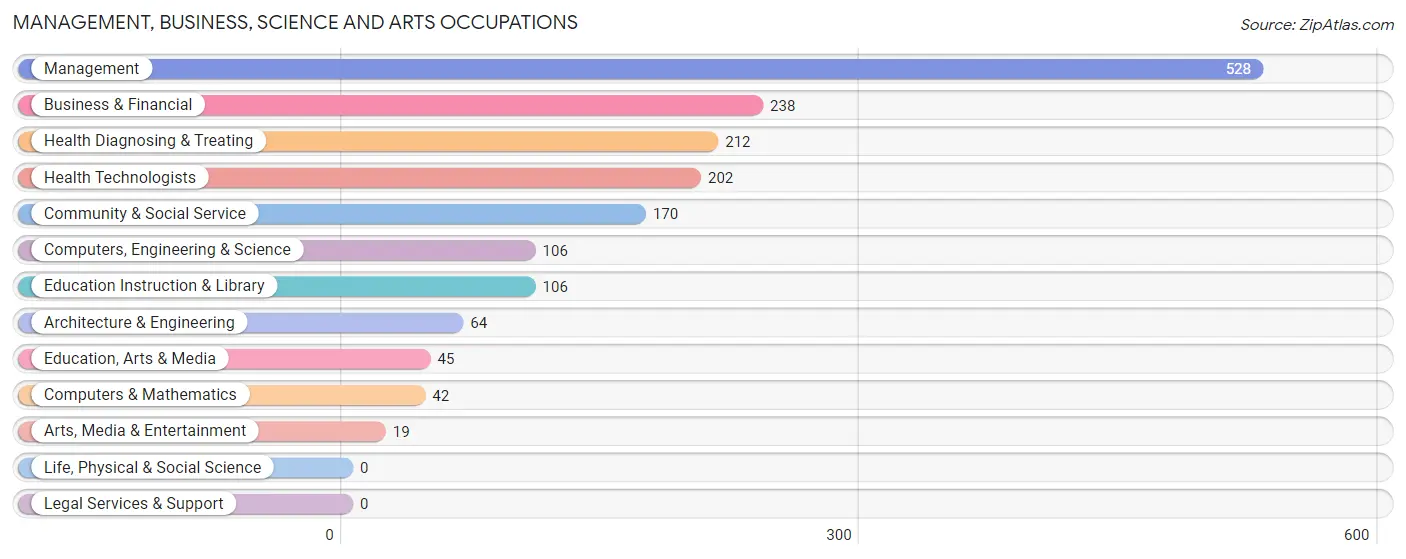
Management, Business, Science and Arts Occupations
The most common Management, Business, Science and Arts occupations in Westport are Management (528 | 26.9%), Business & Financial (238 | 12.1%), Health Diagnosing & Treating (212 | 10.8%), Health Technologists (202 | 10.3%), and Community & Social Service (170 | 8.6%).
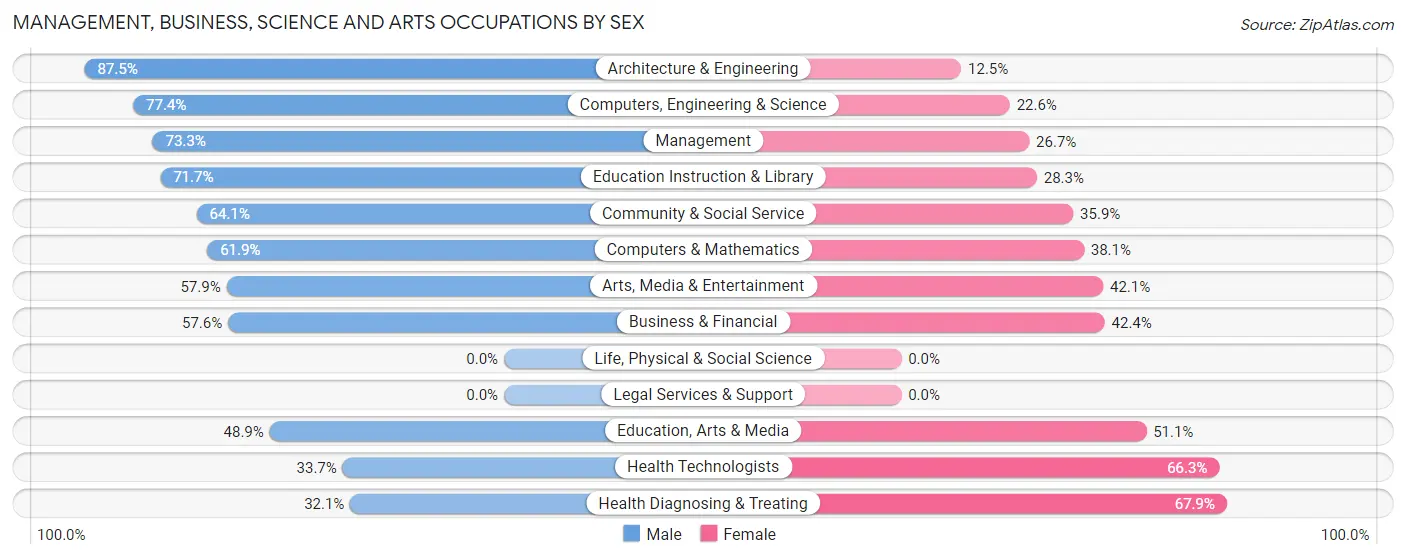
Management, Business, Science and Arts Occupations by Sex
Within the Management, Business, Science and Arts occupations in Westport, the most male-oriented occupations are Architecture & Engineering (87.5%), Computers, Engineering & Science (77.4%), and Management (73.3%), while the most female-oriented occupations are Health Diagnosing & Treating (67.9%), Health Technologists (66.3%), and Education, Arts & Media (51.1%).
| Occupation | Male | Female |
| Management | 387 (73.3%) | 141 (26.7%) |
| Business & Financial | 137 (57.6%) | 101 (42.4%) |
| Computers, Engineering & Science | 82 (77.4%) | 24 (22.6%) |
| Computers & Mathematics | 26 (61.9%) | 16 (38.1%) |
| Architecture & Engineering | 56 (87.5%) | 8 (12.5%) |
| Life, Physical & Social Science | 0 (0.0%) | 0 (0.0%) |
| Community & Social Service | 109 (64.1%) | 61 (35.9%) |
| Education, Arts & Media | 22 (48.9%) | 23 (51.1%) |
| Legal Services & Support | 0 (0.0%) | 0 (0.0%) |
| Education Instruction & Library | 76 (71.7%) | 30 (28.3%) |
| Arts, Media & Entertainment | 11 (57.9%) | 8 (42.1%) |
| Health Diagnosing & Treating | 68 (32.1%) | 144 (67.9%) |
| Health Technologists | 68 (33.7%) | 134 (66.3%) |
| Total (Category) | 783 (62.4%) | 471 (37.6%) |
| Total (Overall) | 1,243 (63.3%) | 722 (36.7%) |
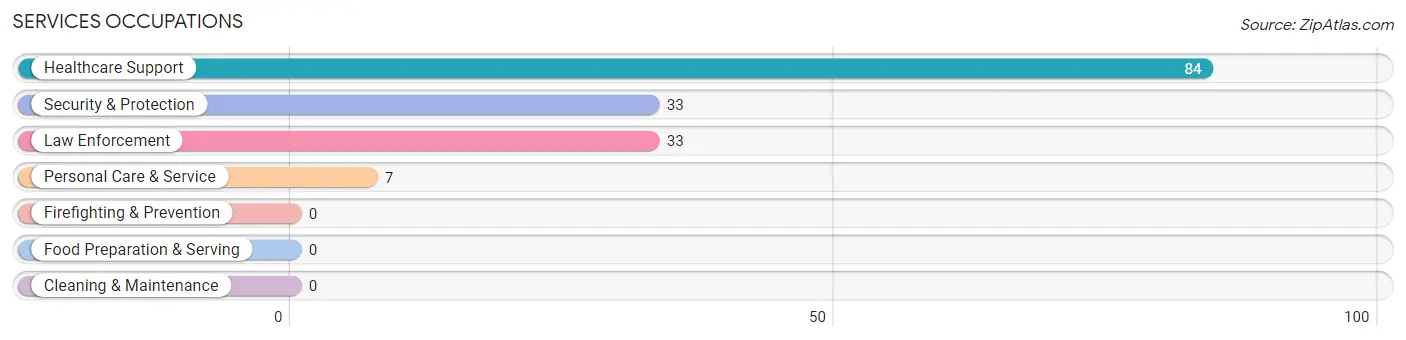
Services Occupations
The most common Services occupations in Westport are Healthcare Support (84 | 4.3%), Security & Protection (33 | 1.7%), Law Enforcement (33 | 1.7%), and Personal Care & Service (7 | 0.4%).
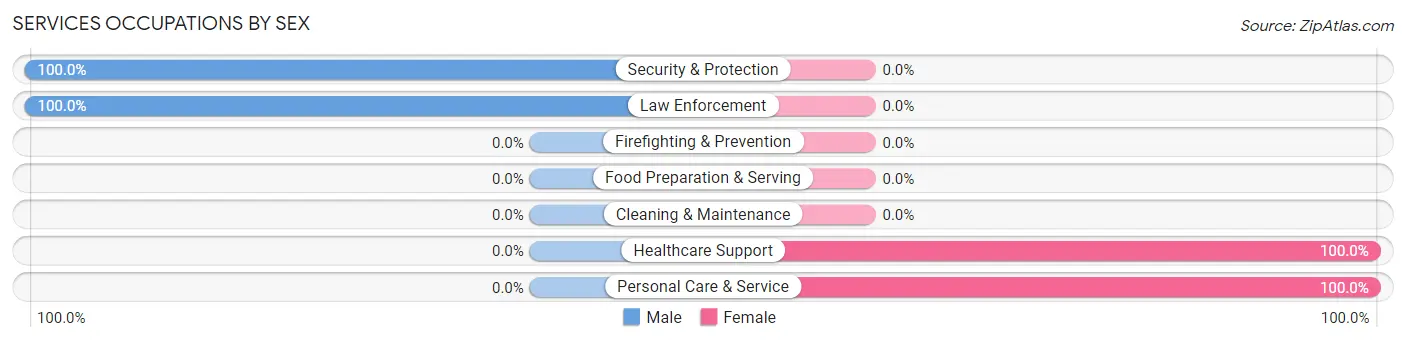
Services Occupations by Sex
Within the Services occupations in Westport, the most male-oriented occupations are Security & Protection (100.0%), and Law Enforcement (100.0%), while the most female-oriented occupations are Healthcare Support (100.0%), and Personal Care & Service (100.0%).
| Occupation | Male | Female |
| Healthcare Support | 0 (0.0%) | 84 (100.0%) |
| Security & Protection | 33 (100.0%) | 0 (0.0%) |
| Firefighting & Prevention | 0 (0.0%) | 0 (0.0%) |
| Law Enforcement | 33 (100.0%) | 0 (0.0%) |
| Food Preparation & Serving | 0 (0.0%) | 0 (0.0%) |
| Cleaning & Maintenance | 0 (0.0%) | 0 (0.0%) |
| Personal Care & Service | 0 (0.0%) | 7 (100.0%) |
| Total (Category) | 33 (26.6%) | 91 (73.4%) |
| Total (Overall) | 1,243 (63.3%) | 722 (36.7%) |
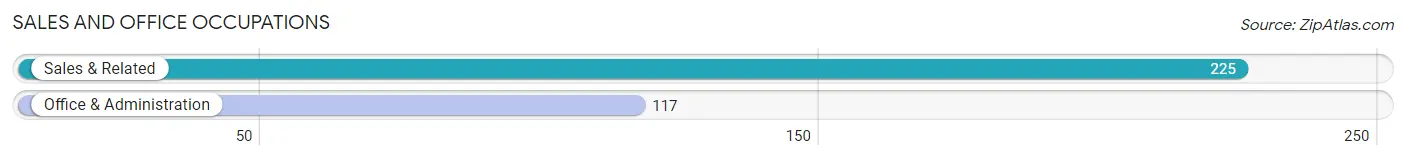
Sales and Office Occupations
The most common Sales and Office occupations in Westport are Sales & Related (225 | 11.5%), and Office & Administration (117 | 5.9%).
Sales and Office Occupations by Sex
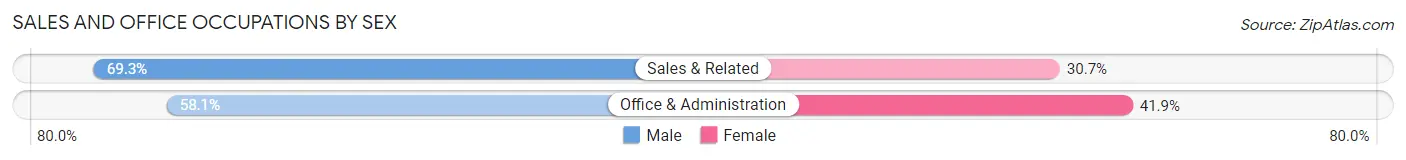
| Occupation | Male | Female |
| Sales & Related | 156 (69.3%) | 69 (30.7%) |
| Office & Administration | 68 (58.1%) | 49 (41.9%) |
| Total (Category) | 224 (65.5%) | 118 (34.5%) |
| Total (Overall) | 1,243 (63.3%) | 722 (36.7%) |
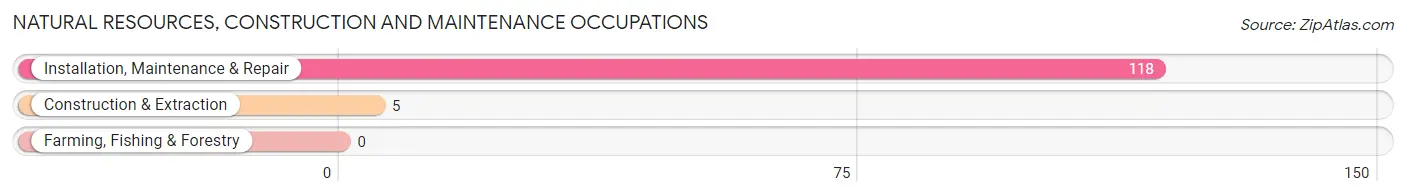
Natural Resources, Construction and Maintenance Occupations
The most common Natural Resources, Construction and Maintenance occupations in Westport are Installation, Maintenance & Repair (118 | 6.0%), and Construction & Extraction (5 | 0.3%).
Natural Resources, Construction and Maintenance Occupations by Sex
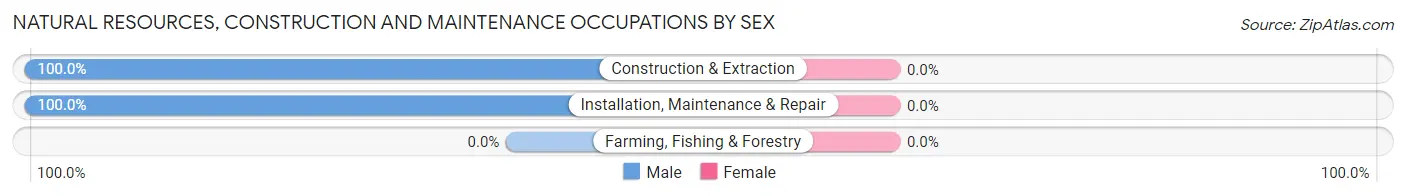
| Occupation | Male | Female |
| Farming, Fishing & Forestry | 0 (0.0%) | 0 (0.0%) |
| Construction & Extraction | 5 (100.0%) | 0 (0.0%) |
| Installation, Maintenance & Repair | 118 (100.0%) | 0 (0.0%) |
| Total (Category) | 123 (100.0%) | 0 (0.0%) |
| Total (Overall) | 1,243 (63.3%) | 722 (36.7%) |
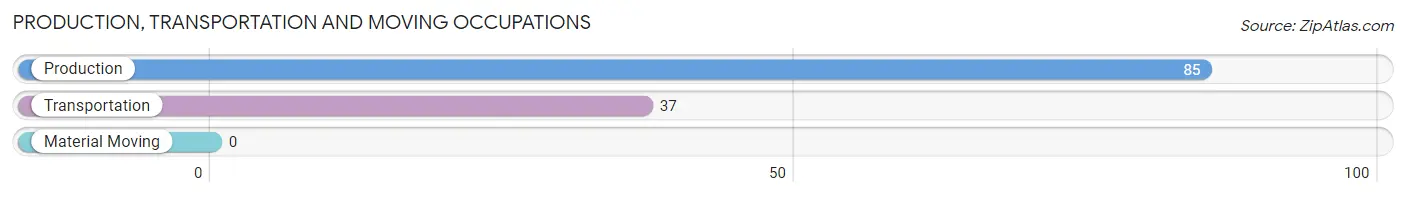
Production, Transportation and Moving Occupations
The most common Production, Transportation and Moving occupations in Westport are Production (85 | 4.3%), and Transportation (37 | 1.9%).
Production, Transportation and Moving Occupations by Sex
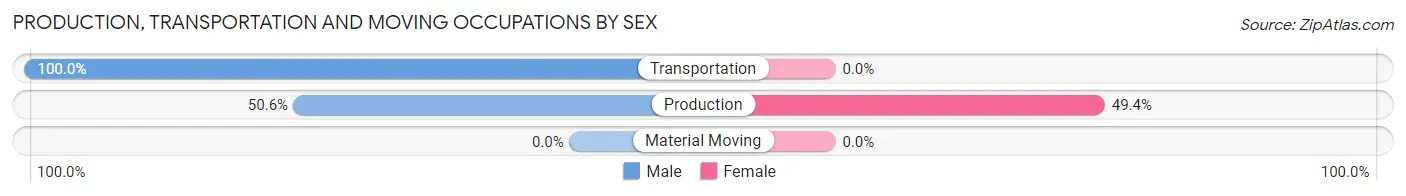
| Occupation | Male | Female |
| Production | 43 (50.6%) | 42 (49.4%) |
| Transportation | 37 (100.0%) | 0 (0.0%) |
| Material Moving | 0 (0.0%) | 0 (0.0%) |
| Total (Category) | 80 (65.6%) | 42 (34.4%) |
| Total (Overall) | 1,243 (63.3%) | 722 (36.7%) |
Employment Industries by Sex in Westport
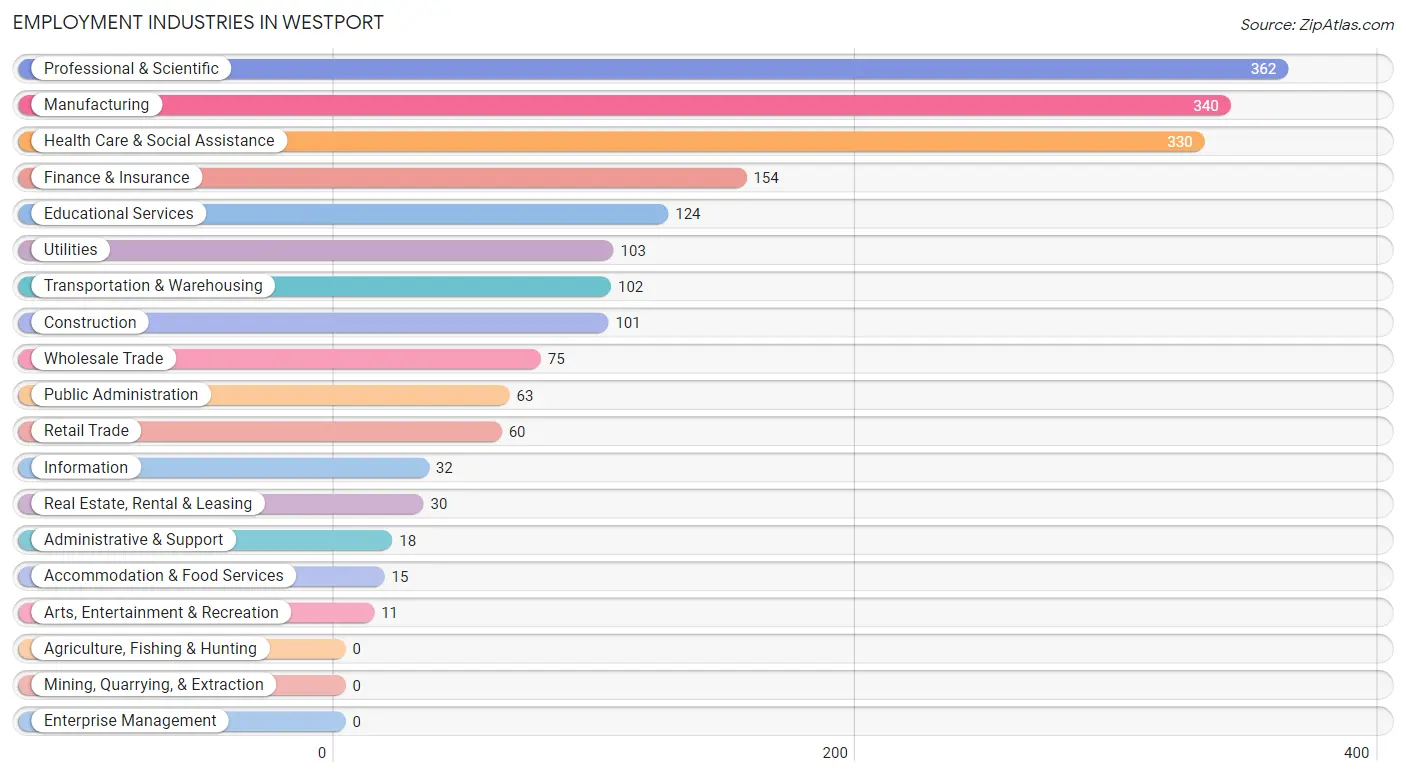
Employment Industries in Westport
The major employment industries in Westport include Professional & Scientific (362 | 18.4%), Manufacturing (340 | 17.3%), Health Care & Social Assistance (330 | 16.8%), Finance & Insurance (154 | 7.8%), and Educational Services (124 | 6.3%).
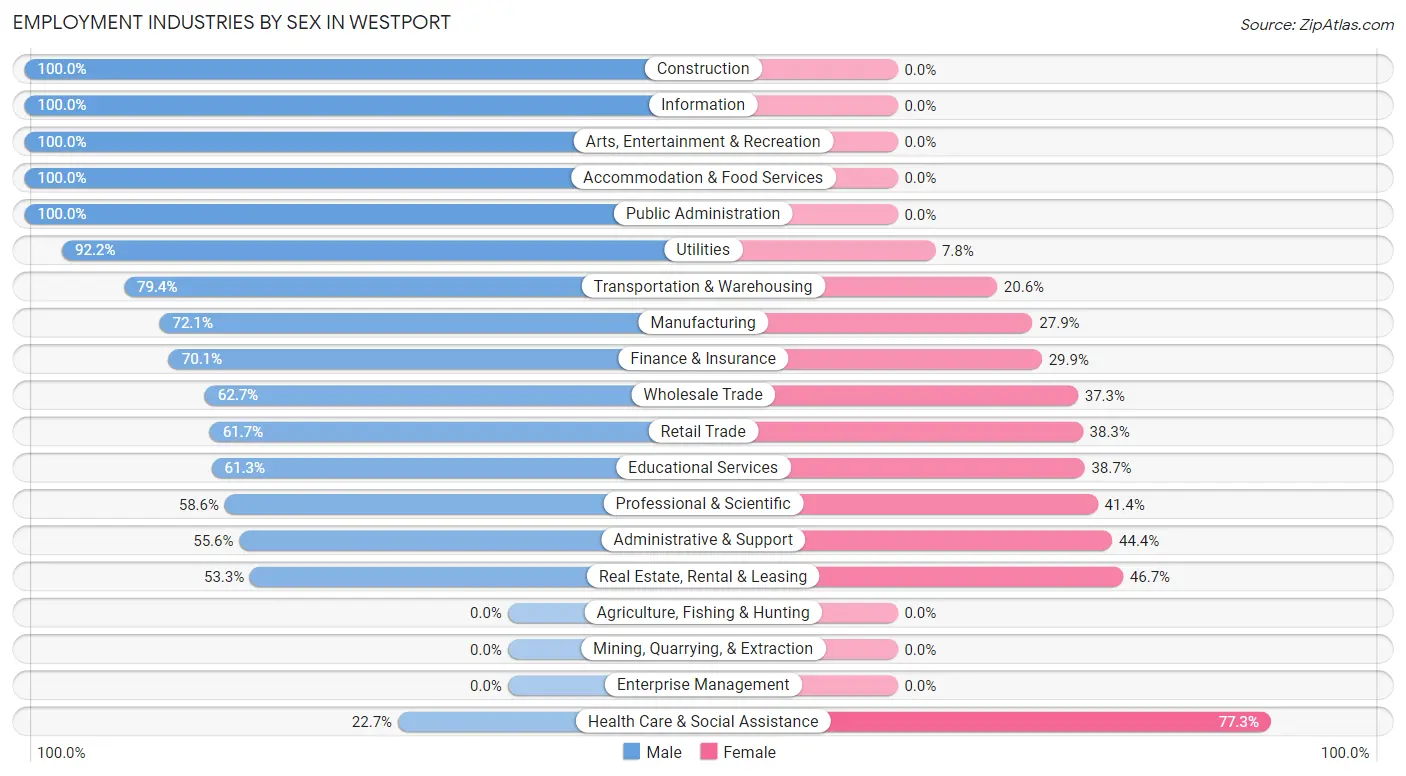
Employment Industries by Sex in Westport
The Westport industries that see more men than women are Construction (100.0%), Information (100.0%), and Arts, Entertainment & Recreation (100.0%), whereas the industries that tend to have a higher number of women are Health Care & Social Assistance (77.3%), Real Estate, Rental & Leasing (46.7%), and Administrative & Support (44.4%).
| Industry | Male | Female |
| Agriculture, Fishing & Hunting | 0 (0.0%) | 0 (0.0%) |
| Mining, Quarrying, & Extraction | 0 (0.0%) | 0 (0.0%) |
| Construction | 101 (100.0%) | 0 (0.0%) |
| Manufacturing | 245 (72.1%) | 95 (27.9%) |
| Wholesale Trade | 47 (62.7%) | 28 (37.3%) |
| Retail Trade | 37 (61.7%) | 23 (38.3%) |
| Transportation & Warehousing | 81 (79.4%) | 21 (20.6%) |
| Utilities | 95 (92.2%) | 8 (7.8%) |
| Information | 32 (100.0%) | 0 (0.0%) |
| Finance & Insurance | 108 (70.1%) | 46 (29.9%) |
| Real Estate, Rental & Leasing | 16 (53.3%) | 14 (46.7%) |
| Professional & Scientific | 212 (58.6%) | 150 (41.4%) |
| Enterprise Management | 0 (0.0%) | 0 (0.0%) |
| Administrative & Support | 10 (55.6%) | 8 (44.4%) |
| Educational Services | 76 (61.3%) | 48 (38.7%) |
| Health Care & Social Assistance | 75 (22.7%) | 255 (77.3%) |
| Arts, Entertainment & Recreation | 11 (100.0%) | 0 (0.0%) |
| Accommodation & Food Services | 15 (100.0%) | 0 (0.0%) |
| Public Administration | 63 (100.0%) | 0 (0.0%) |
| Total | 1,243 (63.3%) | 722 (36.7%) |
Education in Westport
School Enrollment in Westport
The most common levels of schooling among the 812 students in Westport are college / undergraduate (225 | 27.7%), elementary school (171 | 21.1%), and middle school (134 | 16.5%).
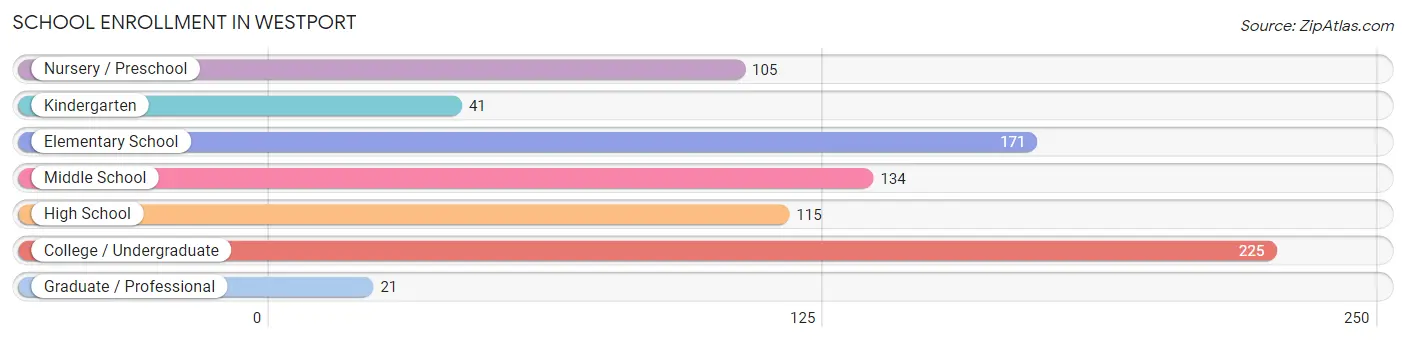
| School Level | # Students | % Students |
| Nursery / Preschool | 105 | 12.9% |
| Kindergarten | 41 | 5.1% |
| Elementary School | 171 | 21.1% |
| Middle School | 134 | 16.5% |
| High School | 115 | 14.2% |
| College / Undergraduate | 225 | 27.7% |
| Graduate / Professional | 21 | 2.6% |
| Total | 812 | 100.0% |
School Enrollment by Age by Funding Source in Westport
Out of a total of 812 students who are enrolled in schools in Westport, 156 (19.2%) attend a private institution, while the remaining 656 (80.8%) are enrolled in public schools. The age group of 3 to 4 year olds has the highest likelihood of being enrolled in private schools, with 26 (61.9% in the age bracket) enrolled. Conversely, the age group of 10 to 14 year olds has the lowest likelihood of being enrolled in a private school, with 199 (100.0% in the age bracket) attending a public institution.
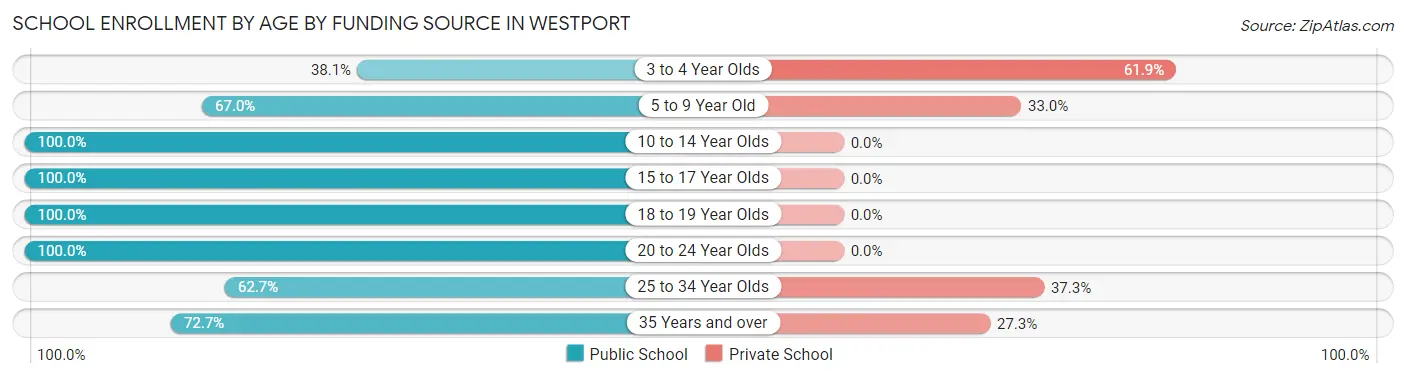
| Age Bracket | Public School | Private School |
| 3 to 4 Year Olds | 16 (38.1%) | 26 (61.9%) |
| 5 to 9 Year Old | 152 (67.0%) | 75 (33.0%) |
| 10 to 14 Year Olds | 199 (100.0%) | 0 (0.0%) |
| 15 to 17 Year Olds | 75 (100.0%) | 0 (0.0%) |
| 18 to 19 Year Olds | 71 (100.0%) | 0 (0.0%) |
| 20 to 24 Year Olds | 21 (100.0%) | 0 (0.0%) |
| 25 to 34 Year Olds | 42 (62.7%) | 25 (37.3%) |
| 35 Years and over | 80 (72.7%) | 30 (27.3%) |
| Total | 656 (80.8%) | 156 (19.2%) |
Educational Attainment by Field of Study in Westport
Business (532 | 27.7%), engineering (314 | 16.4%), education (221 | 11.5%), bio, nature & agricultural (179 | 9.3%), and science & technology (176 | 9.2%) are the most common fields of study among 1,921 individuals in Westport who have obtained a bachelor's degree or higher.
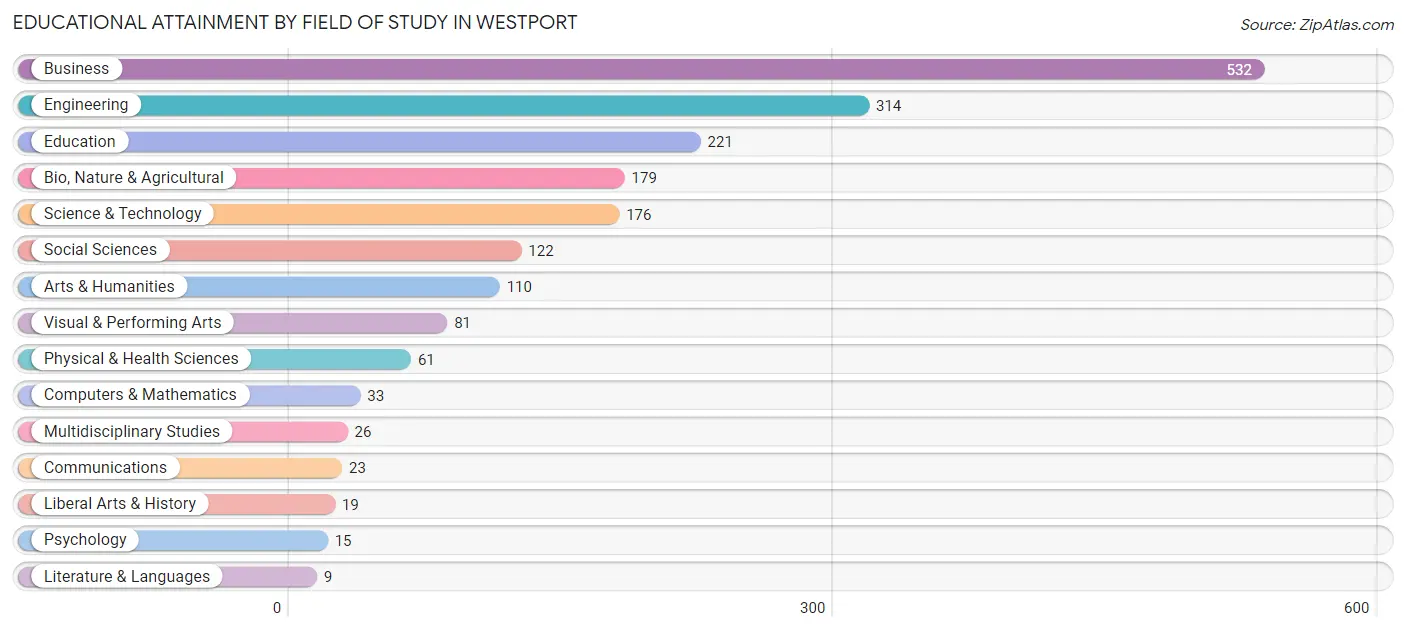
| Field of Study | # Graduates | % Graduates |
| Computers & Mathematics | 33 | 1.7% |
| Bio, Nature & Agricultural | 179 | 9.3% |
| Physical & Health Sciences | 61 | 3.2% |
| Psychology | 15 | 0.8% |
| Social Sciences | 122 | 6.4% |
| Engineering | 314 | 16.4% |
| Multidisciplinary Studies | 26 | 1.3% |
| Science & Technology | 176 | 9.2% |
| Business | 532 | 27.7% |
| Education | 221 | 11.5% |
| Literature & Languages | 9 | 0.5% |
| Liberal Arts & History | 19 | 1.0% |
| Visual & Performing Arts | 81 | 4.2% |
| Communications | 23 | 1.2% |
| Arts & Humanities | 110 | 5.7% |
| Total | 1,921 | 100.0% |
Transportation & Commute in Westport
Vehicle Availability by Sex in Westport
The most prevalent vehicle ownership categories in Westport are males with 2 vehicles (717, accounting for 58.0%) and females with 2 vehicles (389, making up 100.6%).
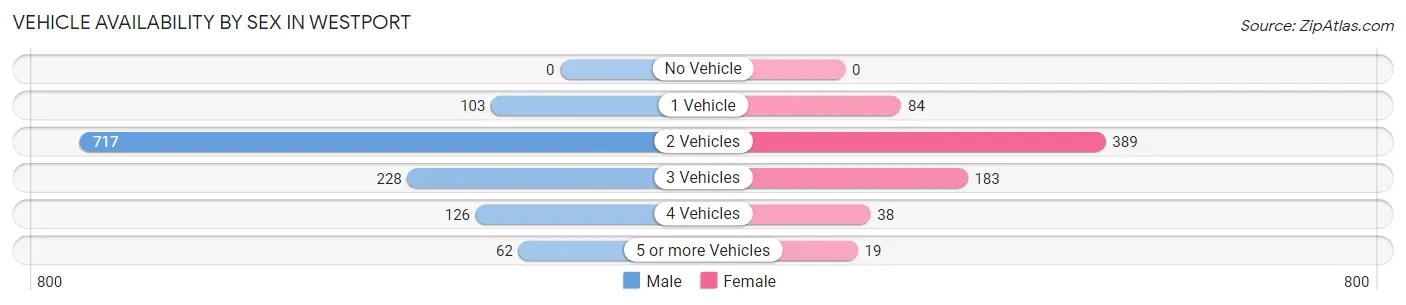
| Vehicles Available | Male | Female |
| No Vehicle | 0 (0.0%) | 0 (0.0%) |
| 1 Vehicle | 103 (8.3%) | 84 (11.8%) |
| 2 Vehicles | 717 (58.0%) | 389 (54.6%) |
| 3 Vehicles | 228 (18.4%) | 183 (25.7%) |
| 4 Vehicles | 126 (10.2%) | 38 (5.3%) |
| 5 or more Vehicles | 62 (5.0%) | 19 (2.7%) |
| Total | 1,236 (100.0%) | 713 (100.0%) |
Commute Time in Westport
The most frequently occuring commute durations in Westport are 45 to 59 minutes (328 commuters, 24.9%), 30 to 34 minutes (193 commuters, 14.6%), and 60 to 89 minutes (185 commuters, 14.0%).
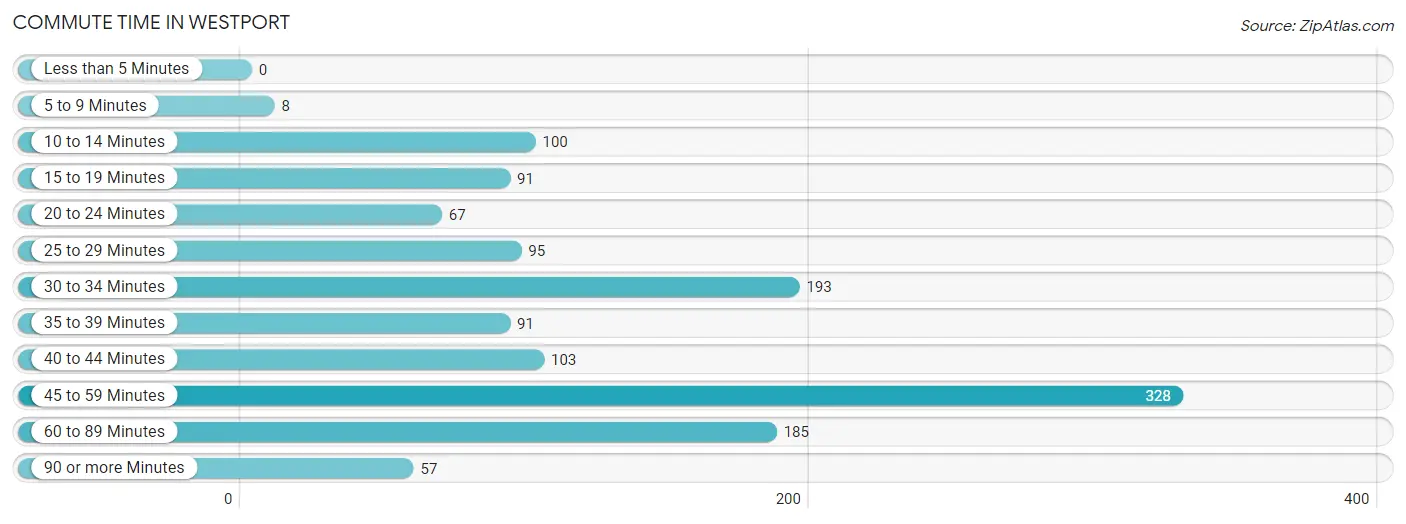
| Commute Time | # Commuters | % Commuters |
| Less than 5 Minutes | 0 | 0.0% |
| 5 to 9 Minutes | 8 | 0.6% |
| 10 to 14 Minutes | 100 | 7.6% |
| 15 to 19 Minutes | 91 | 6.9% |
| 20 to 24 Minutes | 67 | 5.1% |
| 25 to 29 Minutes | 95 | 7.2% |
| 30 to 34 Minutes | 193 | 14.6% |
| 35 to 39 Minutes | 91 | 6.9% |
| 40 to 44 Minutes | 103 | 7.8% |
| 45 to 59 Minutes | 328 | 24.9% |
| 60 to 89 Minutes | 185 | 14.0% |
| 90 or more Minutes | 57 | 4.3% |
Commute Time by Sex in Westport
The most common commute times in Westport are 30 to 34 minutes (178 commuters, 21.1%) for males and 45 to 59 minutes (162 commuters, 34.0%) for females.
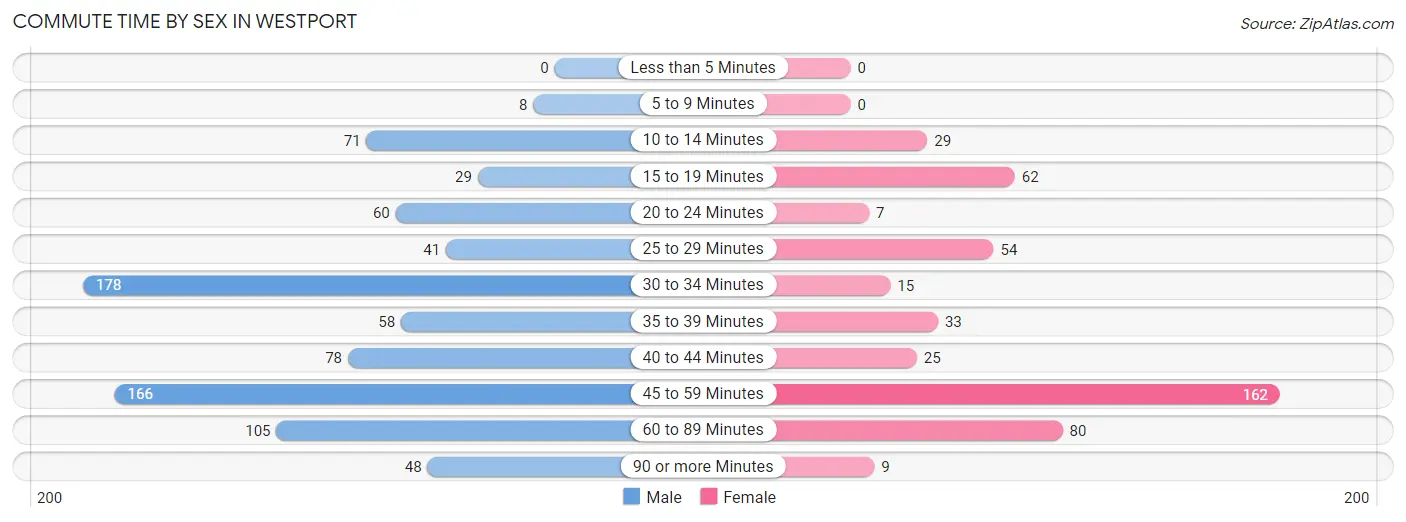
| Commute Time | Male | Female |
| Less than 5 Minutes | 0 (0.0%) | 0 (0.0%) |
| 5 to 9 Minutes | 8 (0.9%) | 0 (0.0%) |
| 10 to 14 Minutes | 71 (8.4%) | 29 (6.1%) |
| 15 to 19 Minutes | 29 (3.4%) | 62 (13.0%) |
| 20 to 24 Minutes | 60 (7.1%) | 7 (1.5%) |
| 25 to 29 Minutes | 41 (4.9%) | 54 (11.3%) |
| 30 to 34 Minutes | 178 (21.1%) | 15 (3.2%) |
| 35 to 39 Minutes | 58 (6.9%) | 33 (6.9%) |
| 40 to 44 Minutes | 78 (9.3%) | 25 (5.2%) |
| 45 to 59 Minutes | 166 (19.7%) | 162 (34.0%) |
| 60 to 89 Minutes | 105 (12.5%) | 80 (16.8%) |
| 90 or more Minutes | 48 (5.7%) | 9 (1.9%) |
Time of Departure to Work by Sex in Westport
The most frequent times of departure to work in Westport are 7:00 AM to 7:29 AM (213, 25.3%) for males and 7:00 AM to 7:29 AM (243, 51.0%) for females.
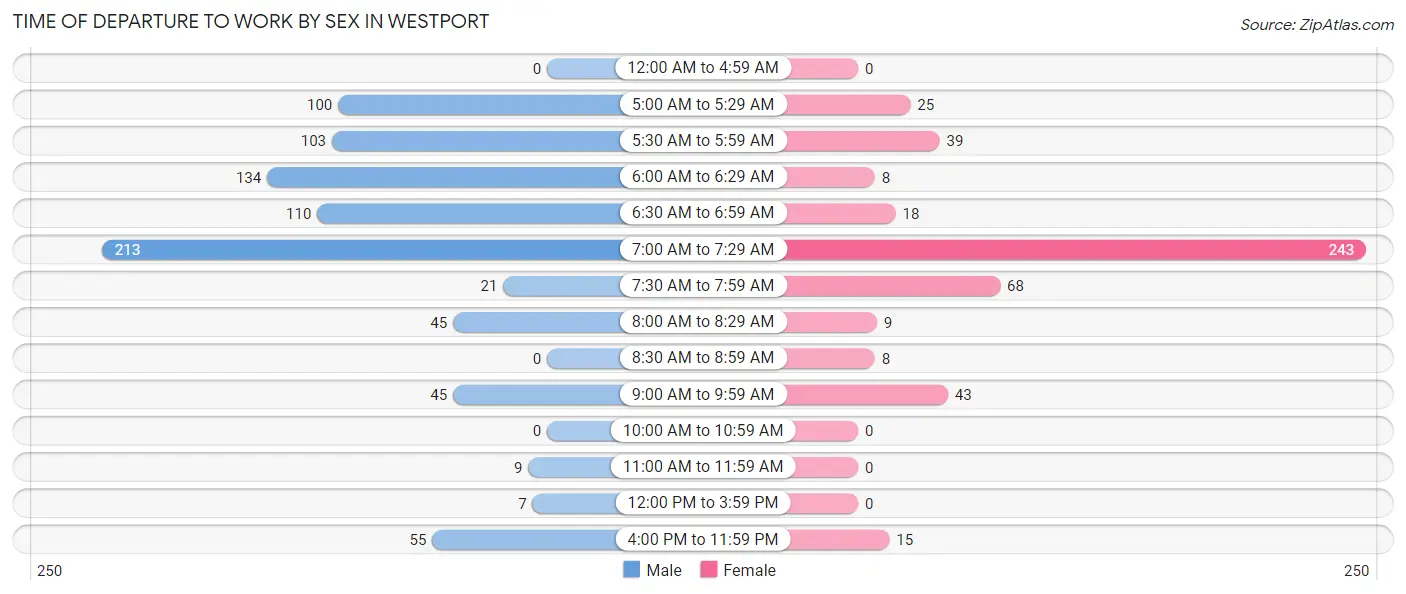
| Time of Departure | Male | Female |
| 12:00 AM to 4:59 AM | 0 (0.0%) | 0 (0.0%) |
| 5:00 AM to 5:29 AM | 100 (11.9%) | 25 (5.2%) |
| 5:30 AM to 5:59 AM | 103 (12.2%) | 39 (8.2%) |
| 6:00 AM to 6:29 AM | 134 (15.9%) | 8 (1.7%) |
| 6:30 AM to 6:59 AM | 110 (13.1%) | 18 (3.8%) |
| 7:00 AM to 7:29 AM | 213 (25.3%) | 243 (51.0%) |
| 7:30 AM to 7:59 AM | 21 (2.5%) | 68 (14.3%) |
| 8:00 AM to 8:29 AM | 45 (5.3%) | 9 (1.9%) |
| 8:30 AM to 8:59 AM | 0 (0.0%) | 8 (1.7%) |
| 9:00 AM to 9:59 AM | 45 (5.3%) | 43 (9.0%) |
| 10:00 AM to 10:59 AM | 0 (0.0%) | 0 (0.0%) |
| 11:00 AM to 11:59 AM | 9 (1.1%) | 0 (0.0%) |
| 12:00 PM to 3:59 PM | 7 (0.8%) | 0 (0.0%) |
| 4:00 PM to 11:59 PM | 55 (6.5%) | 15 (3.2%) |
| Total | 842 (100.0%) | 476 (100.0%) |
Housing Occupancy in Westport
Occupancy by Ownership in Westport
Of the total 1,842 dwellings in Westport, owner-occupied units account for 1,773 (96.3%), while renter-occupied units make up 69 (3.7%).
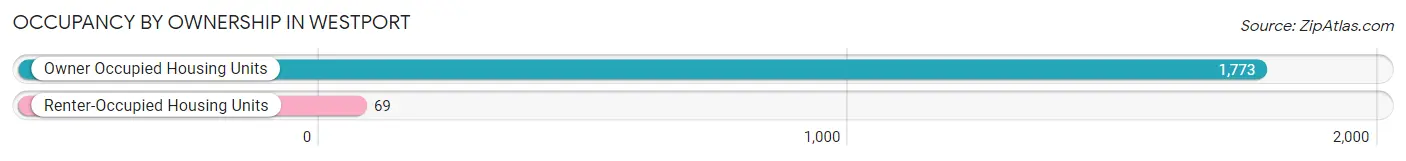
| Occupancy | # Housing Units | % Housing Units |
| Owner Occupied Housing Units | 1,773 | 96.3% |
| Renter-Occupied Housing Units | 69 | 3.7% |
| Total Occupied Housing Units | 1,842 | 100.0% |
Occupancy by Household Size in Westport
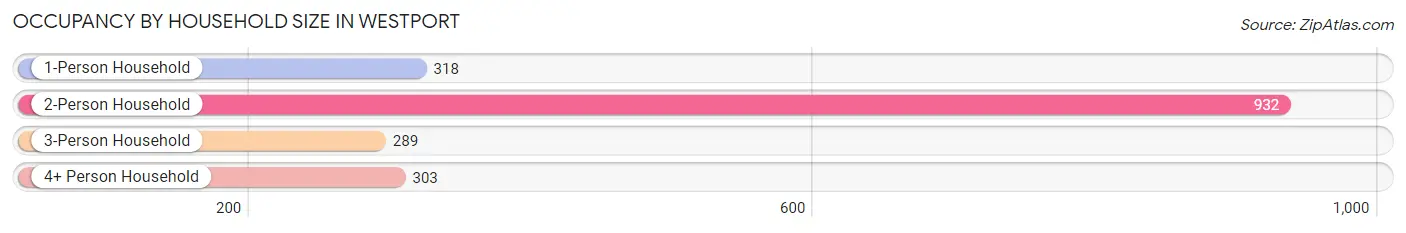
| Household Size | # Housing Units | % Housing Units |
| 1-Person Household | 318 | 17.3% |
| 2-Person Household | 932 | 50.6% |
| 3-Person Household | 289 | 15.7% |
| 4+ Person Household | 303 | 16.5% |
| Total Housing Units | 1,842 | 100.0% |
Occupancy by Ownership by Household Size in Westport
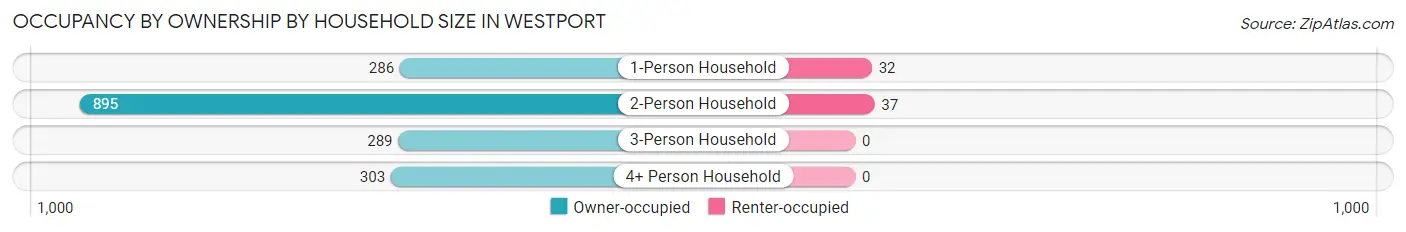
| Household Size | Owner-occupied | Renter-occupied |
| 1-Person Household | 286 (89.9%) | 32 (10.1%) |
| 2-Person Household | 895 (96.0%) | 37 (4.0%) |
| 3-Person Household | 289 (100.0%) | 0 (0.0%) |
| 4+ Person Household | 303 (100.0%) | 0 (0.0%) |
| Total Housing Units | 1,773 (96.3%) | 69 (3.7%) |
Occupancy by Educational Attainment in Westport
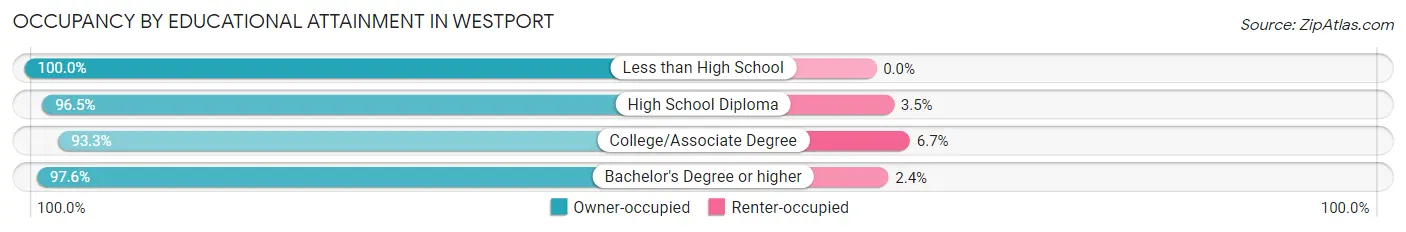
| Household Size | Owner-occupied | Renter-occupied |
| Less than High School | 27 (100.0%) | 0 (0.0%) |
| High School Diploma | 248 (96.5%) | 9 (3.5%) |
| College/Associate Degree | 489 (93.3%) | 35 (6.7%) |
| Bachelor's Degree or higher | 1,009 (97.6%) | 25 (2.4%) |
Occupancy by Age of Householder in Westport
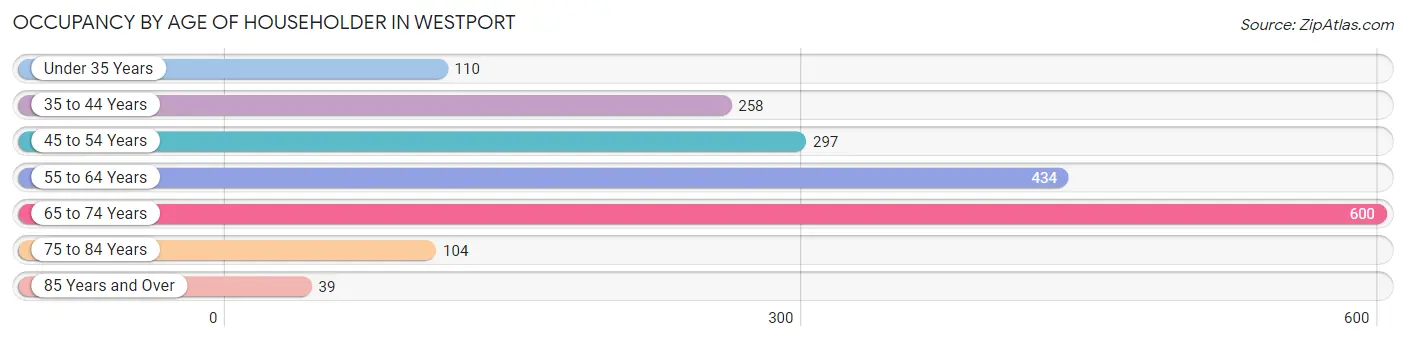
| Age Bracket | # Households | % Households |
| Under 35 Years | 110 | 6.0% |
| 35 to 44 Years | 258 | 14.0% |
| 45 to 54 Years | 297 | 16.1% |
| 55 to 64 Years | 434 | 23.6% |
| 65 to 74 Years | 600 | 32.6% |
| 75 to 84 Years | 104 | 5.7% |
| 85 Years and Over | 39 | 2.1% |
| Total | 1,842 | 100.0% |
Housing Finances in Westport
Median Income by Occupancy in Westport
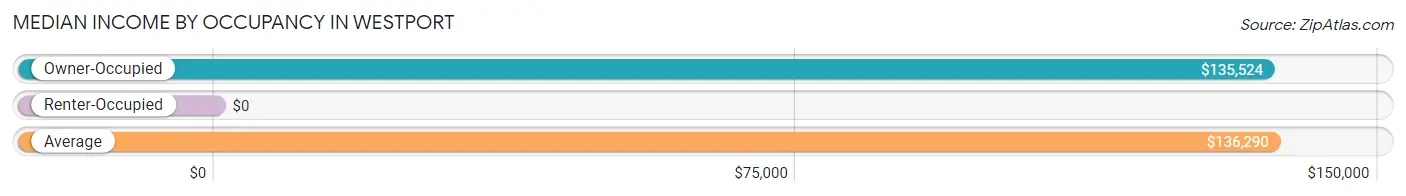
| Occupancy Type | # Households | Median Income |
| Owner-Occupied | 1,773 (96.3%) | $135,524 |
| Renter-Occupied | 69 (3.7%) | $0 |
| Average | 1,842 (100.0%) | $136,290 |
Occupancy by Householder Income Bracket in Westport
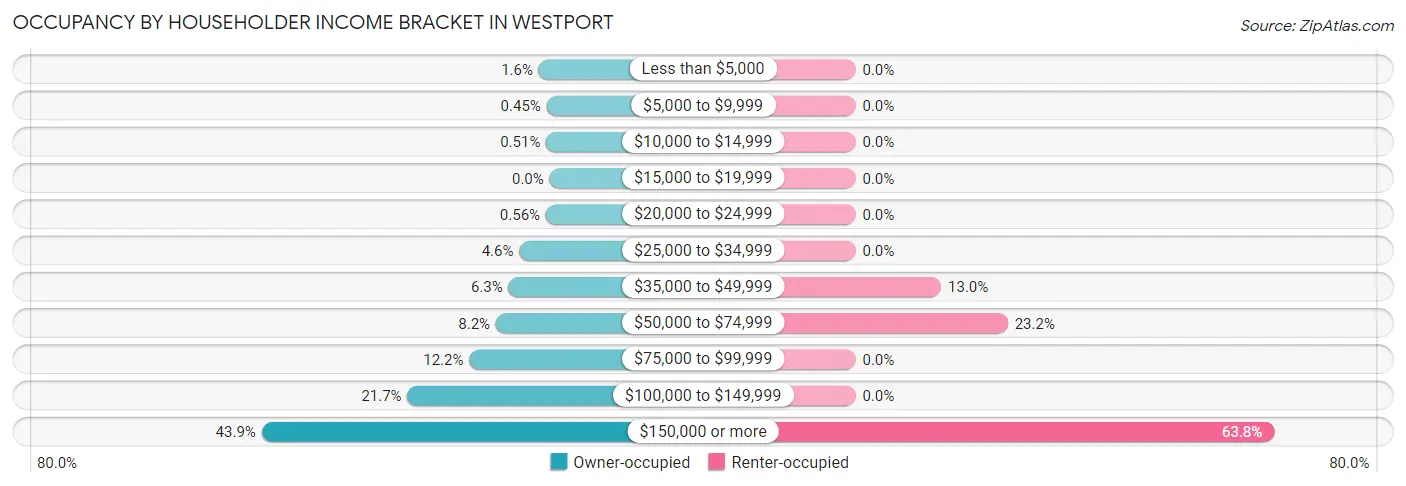
| Income Bracket | Owner-occupied | Renter-occupied |
| Less than $5,000 | 29 (1.6%) | 0 (0.0%) |
| $5,000 to $9,999 | 8 (0.4%) | 0 (0.0%) |
| $10,000 to $14,999 | 9 (0.5%) | 0 (0.0%) |
| $15,000 to $19,999 | 0 (0.0%) | 0 (0.0%) |
| $20,000 to $24,999 | 10 (0.6%) | 0 (0.0%) |
| $25,000 to $34,999 | 82 (4.6%) | 0 (0.0%) |
| $35,000 to $49,999 | 111 (6.3%) | 9 (13.0%) |
| $50,000 to $74,999 | 145 (8.2%) | 16 (23.2%) |
| $75,000 to $99,999 | 217 (12.2%) | 0 (0.0%) |
| $100,000 to $149,999 | 384 (21.7%) | 0 (0.0%) |
| $150,000 or more | 778 (43.9%) | 44 (63.8%) |
| Total | 1,773 (100.0%) | 69 (100.0%) |
Monthly Housing Cost Tiers in Westport
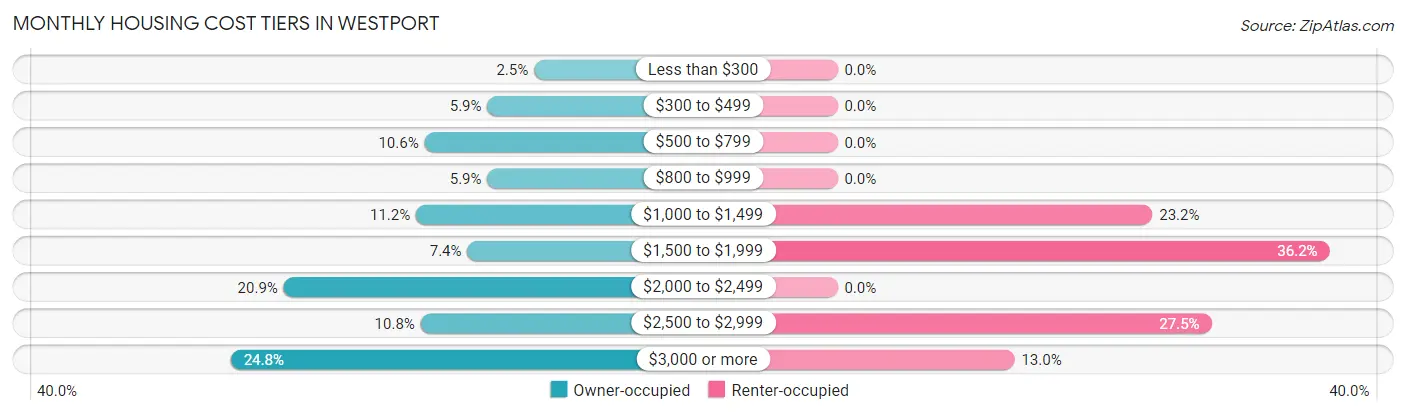
| Monthly Cost | Owner-occupied | Renter-occupied |
| Less than $300 | 44 (2.5%) | 0 (0.0%) |
| $300 to $499 | 105 (5.9%) | 0 (0.0%) |
| $500 to $799 | 187 (10.5%) | 0 (0.0%) |
| $800 to $999 | 105 (5.9%) | 0 (0.0%) |
| $1,000 to $1,499 | 198 (11.2%) | 16 (23.2%) |
| $1,500 to $1,999 | 131 (7.4%) | 25 (36.2%) |
| $2,000 to $2,499 | 371 (20.9%) | 0 (0.0%) |
| $2,500 to $2,999 | 192 (10.8%) | 19 (27.5%) |
| $3,000 or more | 440 (24.8%) | 9 (13.0%) |
| Total | 1,773 (100.0%) | 69 (100.0%) |
Physical Housing Characteristics in Westport
Housing Structures in Westport
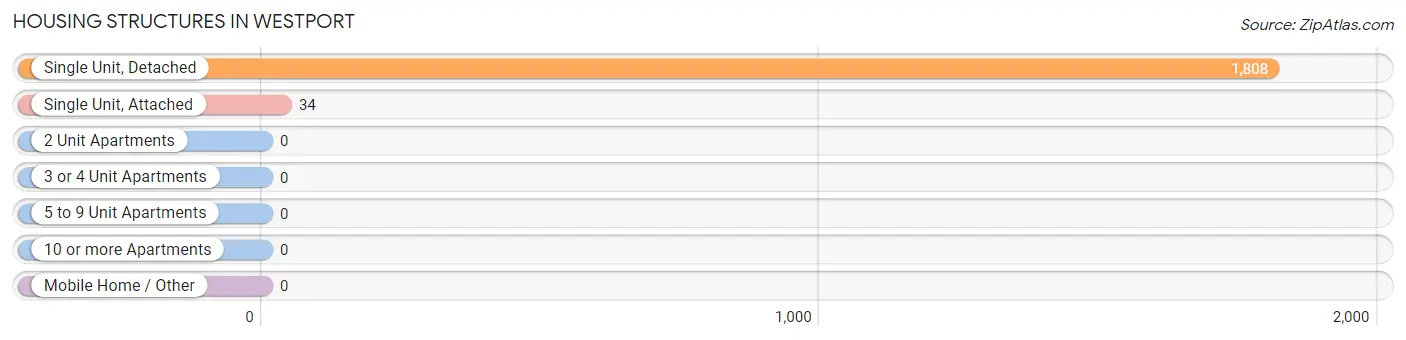
| Structure Type | # Housing Units | % Housing Units |
| Single Unit, Detached | 1,808 | 98.2% |
| Single Unit, Attached | 34 | 1.8% |
| 2 Unit Apartments | 0 | 0.0% |
| 3 or 4 Unit Apartments | 0 | 0.0% |
| 5 to 9 Unit Apartments | 0 | 0.0% |
| 10 or more Apartments | 0 | 0.0% |
| Mobile Home / Other | 0 | 0.0% |
| Total | 1,842 | 100.0% |
Housing Structures by Occupancy in Westport
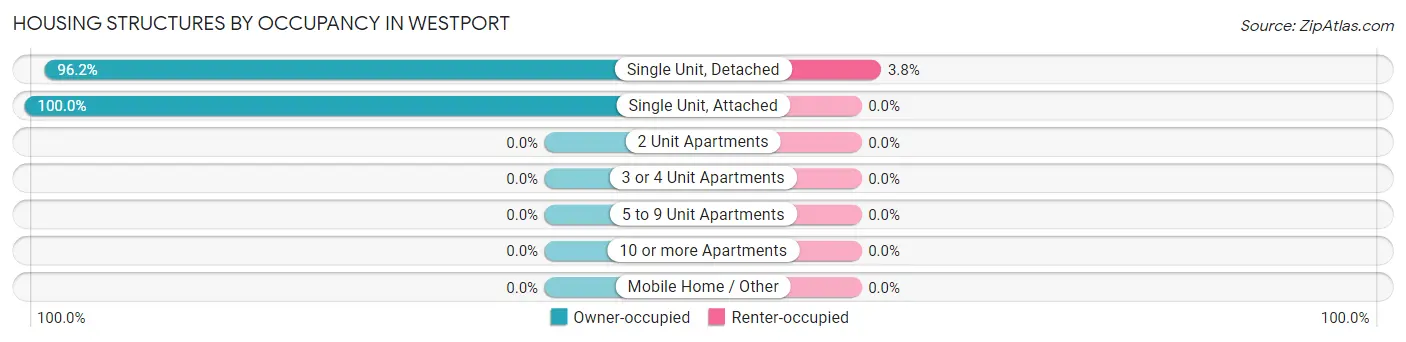
| Structure Type | Owner-occupied | Renter-occupied |
| Single Unit, Detached | 1,739 (96.2%) | 69 (3.8%) |
| Single Unit, Attached | 34 (100.0%) | 0 (0.0%) |
| 2 Unit Apartments | 0 (0.0%) | 0 (0.0%) |
| 3 or 4 Unit Apartments | 0 (0.0%) | 0 (0.0%) |
| 5 to 9 Unit Apartments | 0 (0.0%) | 0 (0.0%) |
| 10 or more Apartments | 0 (0.0%) | 0 (0.0%) |
| Mobile Home / Other | 0 (0.0%) | 0 (0.0%) |
| Total | 1,773 (96.3%) | 69 (3.7%) |
Housing Structures by Number of Rooms in Westport
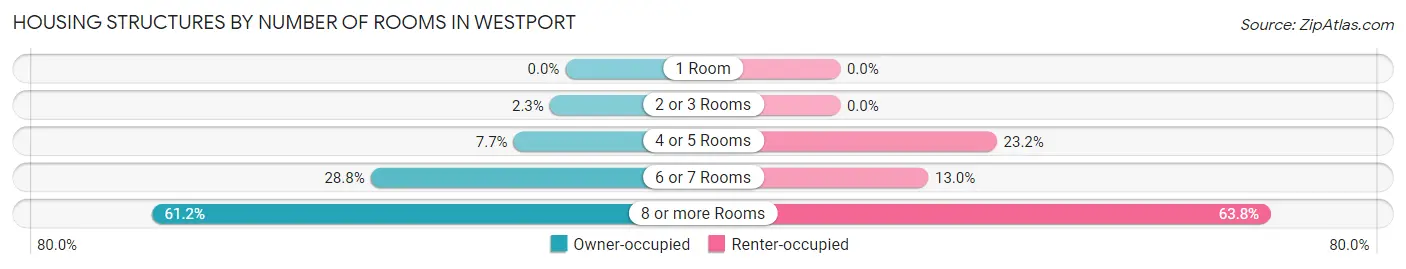
| Number of Rooms | Owner-occupied | Renter-occupied |
| 1 Room | 0 (0.0%) | 0 (0.0%) |
| 2 or 3 Rooms | 41 (2.3%) | 0 (0.0%) |
| 4 or 5 Rooms | 136 (7.7%) | 16 (23.2%) |
| 6 or 7 Rooms | 511 (28.8%) | 9 (13.0%) |
| 8 or more Rooms | 1,085 (61.2%) | 44 (63.8%) |
| Total | 1,773 (100.0%) | 69 (100.0%) |
Housing Structure by Heating Type in Westport
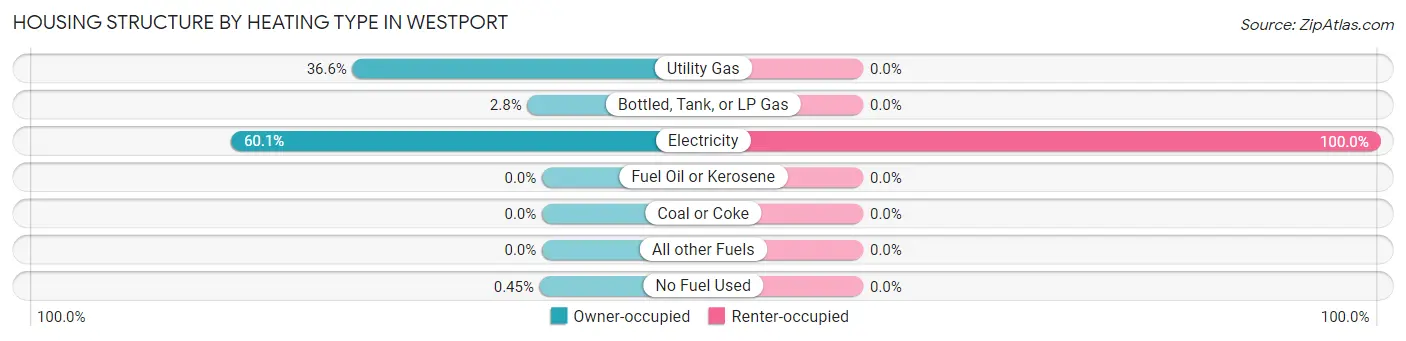
| Heating Type | Owner-occupied | Renter-occupied |
| Utility Gas | 649 (36.6%) | 0 (0.0%) |
| Bottled, Tank, or LP Gas | 50 (2.8%) | 0 (0.0%) |
| Electricity | 1,066 (60.1%) | 69 (100.0%) |
| Fuel Oil or Kerosene | 0 (0.0%) | 0 (0.0%) |
| Coal or Coke | 0 (0.0%) | 0 (0.0%) |
| All other Fuels | 0 (0.0%) | 0 (0.0%) |
| No Fuel Used | 8 (0.4%) | 0 (0.0%) |
| Total | 1,773 (100.0%) | 69 (100.0%) |
Household Vehicle Usage in Westport
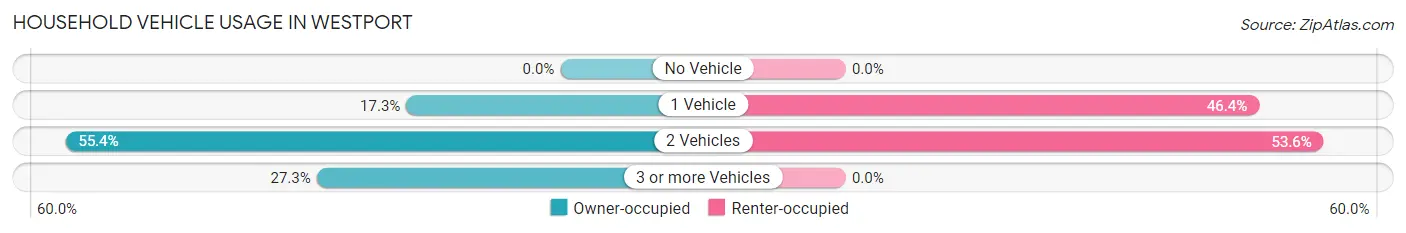
| Vehicles per Household | Owner-occupied | Renter-occupied |
| No Vehicle | 0 (0.0%) | 0 (0.0%) |
| 1 Vehicle | 306 (17.3%) | 32 (46.4%) |
| 2 Vehicles | 983 (55.4%) | 37 (53.6%) |
| 3 or more Vehicles | 484 (27.3%) | 0 (0.0%) |
| Total | 1,773 (100.0%) | 69 (100.0%) |
Real Estate & Mortgages in Westport
Real Estate and Mortgage Overview in Westport
| Characteristic | Without Mortgage | With Mortgage |
| Housing Units | 471 | 1,302 |
| Median Property Value | $535,000 | $496,400 |
| Median Household Income | $89,917 | $628 |
| Monthly Housing Costs | $649 | $432 |
| Real Estate Taxes | $3,195 | $28 |
Property Value by Mortgage Status in Westport
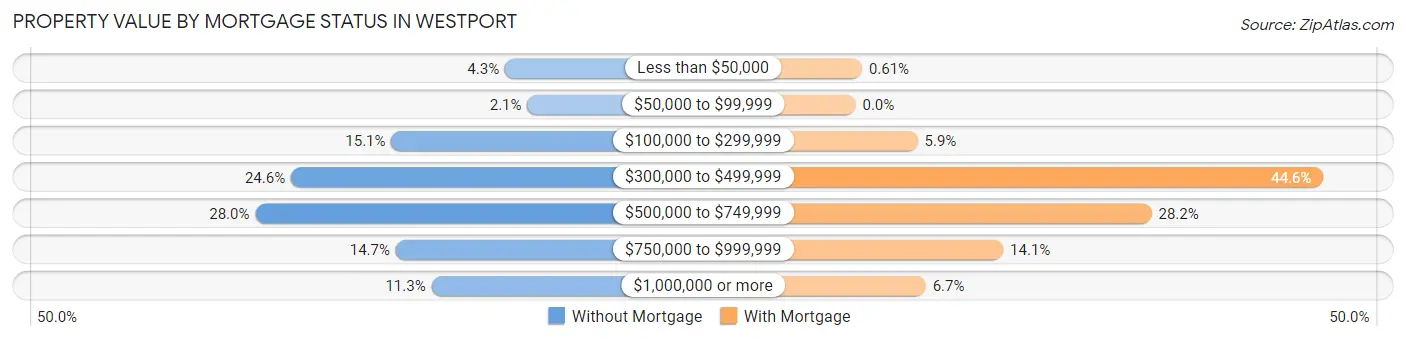
| Property Value | Without Mortgage | With Mortgage |
| Less than $50,000 | 20 (4.3%) | 8 (0.6%) |
| $50,000 to $99,999 | 10 (2.1%) | 0 (0.0%) |
| $100,000 to $299,999 | 71 (15.1%) | 77 (5.9%) |
| $300,000 to $499,999 | 116 (24.6%) | 580 (44.6%) |
| $500,000 to $749,999 | 132 (28.0%) | 367 (28.2%) |
| $750,000 to $999,999 | 69 (14.6%) | 183 (14.1%) |
| $1,000,000 or more | 53 (11.3%) | 87 (6.7%) |
| Total | 471 (100.0%) | 1,302 (100.0%) |
Household Income by Mortgage Status in Westport
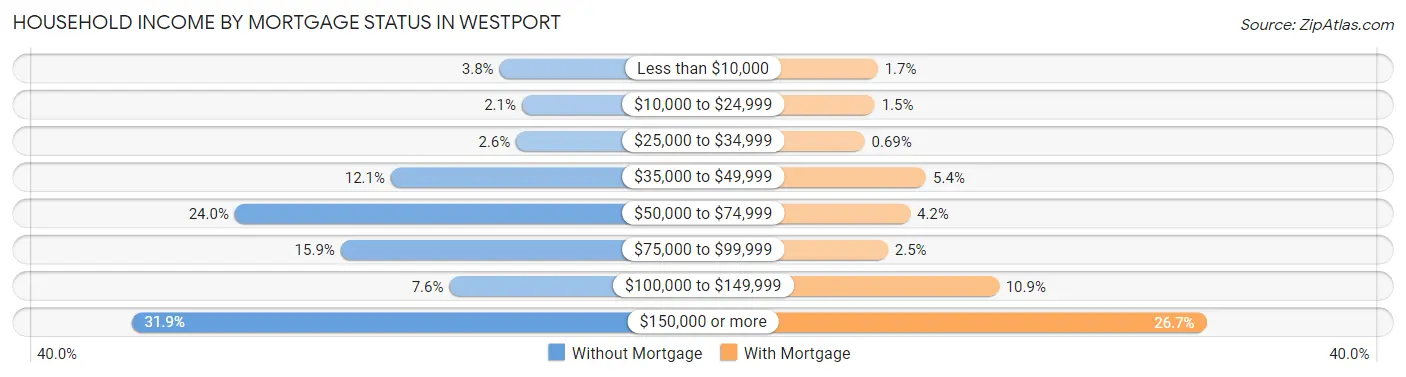
| Household Income | Without Mortgage | With Mortgage |
| Less than $10,000 | 18 (3.8%) | 22 (1.7%) |
| $10,000 to $24,999 | 10 (2.1%) | 19 (1.5%) |
| $25,000 to $34,999 | 12 (2.5%) | 9 (0.7%) |
| $35,000 to $49,999 | 57 (12.1%) | 70 (5.4%) |
| $50,000 to $74,999 | 113 (24.0%) | 54 (4.2%) |
| $75,000 to $99,999 | 75 (15.9%) | 32 (2.5%) |
| $100,000 to $149,999 | 36 (7.6%) | 142 (10.9%) |
| $150,000 or more | 150 (31.9%) | 348 (26.7%) |
| Total | 471 (100.0%) | 1,302 (100.0%) |
Property Value to Household Income Ratio in Westport
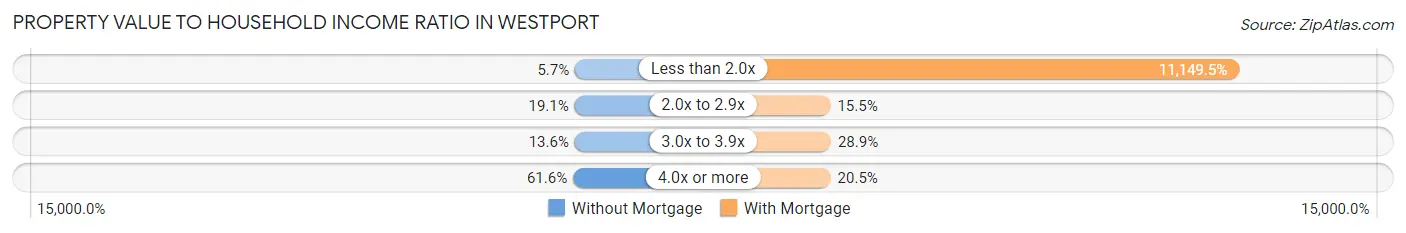
| Value-to-Income Ratio | Without Mortgage | With Mortgage |
| Less than 2.0x | 27 (5.7%) | 145,167 (11,149.5%) |
| 2.0x to 2.9x | 90 (19.1%) | 202 (15.5%) |
| 3.0x to 3.9x | 64 (13.6%) | 376 (28.9%) |
| 4.0x or more | 290 (61.6%) | 267 (20.5%) |
| Total | 471 (100.0%) | 1,302 (100.0%) |
Real Estate Taxes by Mortgage Status in Westport

| Property Taxes | Without Mortgage | With Mortgage |
| Less than $800 | 29 (6.2%) | 19 (1.5%) |
| $800 to $1,499 | 45 (9.6%) | 0 (0.0%) |
| $800 to $1,499 | 397 (84.3%) | 76 (5.8%) |
| Total | 471 (100.0%) | 1,302 (100.0%) |
Health & Disability in Westport
Health Insurance Coverage by Age in Westport
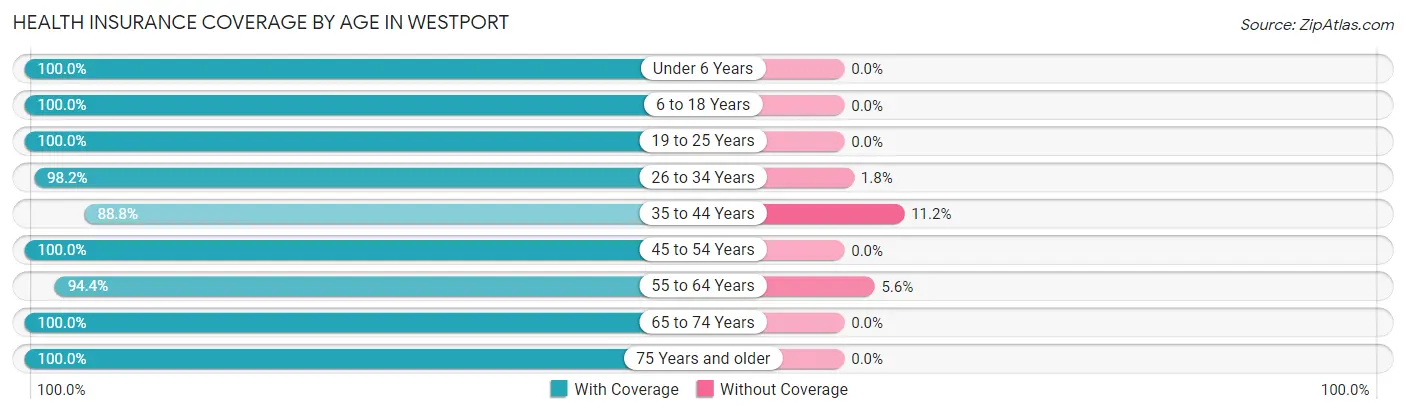
| Age Bracket | With Coverage | Without Coverage |
| Under 6 Years | 320 (100.0%) | 0 (0.0%) |
| 6 to 18 Years | 461 (100.0%) | 0 (0.0%) |
| 19 to 25 Years | 177 (100.0%) | 0 (0.0%) |
| 26 to 34 Years | 385 (98.2%) | 7 (1.8%) |
| 35 to 44 Years | 540 (88.8%) | 68 (11.2%) |
| 45 to 54 Years | 572 (100.0%) | 0 (0.0%) |
| 55 to 64 Years | 687 (94.4%) | 41 (5.6%) |
| 65 to 74 Years | 1,057 (100.0%) | 0 (0.0%) |
| 75 Years and older | 255 (100.0%) | 0 (0.0%) |
| Total | 4,454 (97.5%) | 116 (2.5%) |
Health Insurance Coverage by Citizenship Status in Westport

| Citizenship Status | With Coverage | Without Coverage |
| Native Born | 320 (100.0%) | 0 (0.0%) |
| Foreign Born, Citizen | 461 (100.0%) | 0 (0.0%) |
| Foreign Born, not a Citizen | 177 (100.0%) | 0 (0.0%) |
Health Insurance Coverage by Household Income in Westport
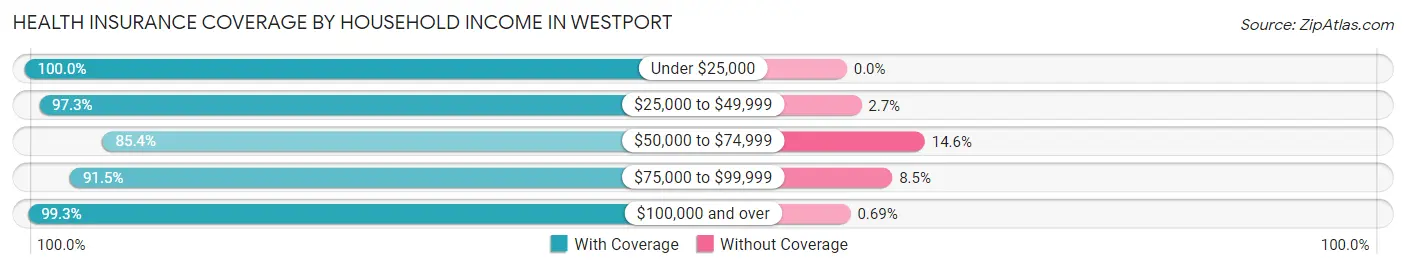
| Household Income | With Coverage | Without Coverage |
| Under $25,000 | 78 (100.0%) | 0 (0.0%) |
| $25,000 to $49,999 | 356 (97.3%) | 10 (2.7%) |
| $50,000 to $74,999 | 222 (85.4%) | 38 (14.6%) |
| $75,000 to $99,999 | 484 (91.5%) | 45 (8.5%) |
| $100,000 and over | 3,314 (99.3%) | 23 (0.7%) |
Public vs Private Health Insurance Coverage by Age in Westport
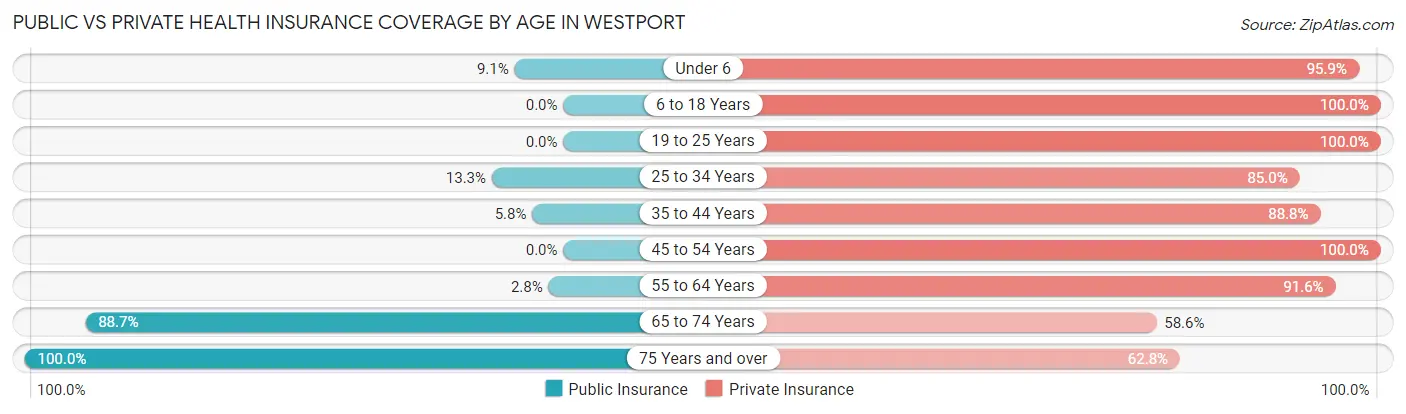
| Age Bracket | Public Insurance | Private Insurance |
| Under 6 | 29 (9.1%) | 307 (95.9%) |
| 6 to 18 Years | 0 (0.0%) | 461 (100.0%) |
| 19 to 25 Years | 0 (0.0%) | 177 (100.0%) |
| 25 to 34 Years | 52 (13.3%) | 333 (85.0%) |
| 35 to 44 Years | 35 (5.8%) | 540 (88.8%) |
| 45 to 54 Years | 0 (0.0%) | 572 (100.0%) |
| 55 to 64 Years | 20 (2.8%) | 667 (91.6%) |
| 65 to 74 Years | 938 (88.7%) | 619 (58.6%) |
| 75 Years and over | 255 (100.0%) | 160 (62.7%) |
| Total | 1,329 (29.1%) | 3,836 (83.9%) |
Disability Status by Sex by Age in Westport
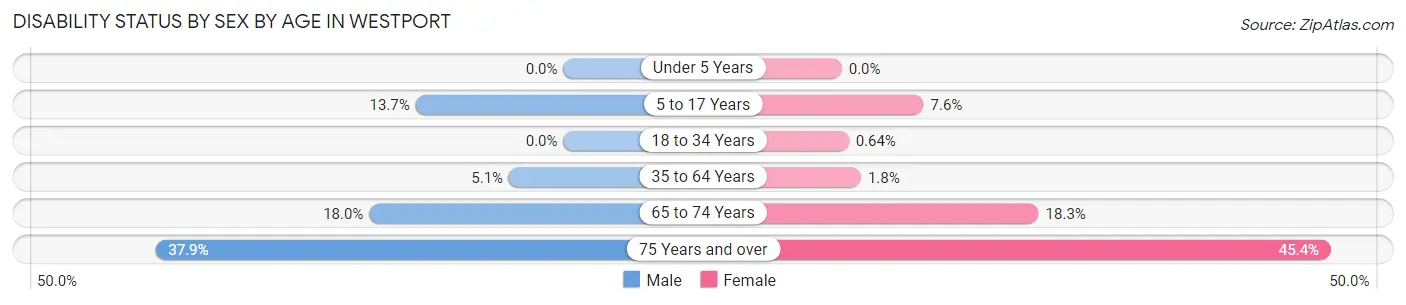
| Age Bracket | Male | Female |
| Under 5 Years | 0 (0.0%) | 0 (0.0%) |
| 5 to 17 Years | 38 (13.7%) | 17 (7.6%) |
| 18 to 34 Years | 0 (0.0%) | 2 (0.6%) |
| 35 to 64 Years | 51 (5.1%) | 16 (1.8%) |
| 65 to 74 Years | 82 (18.0%) | 110 (18.3%) |
| 75 Years and over | 39 (37.9%) | 69 (45.4%) |
Disability Class by Sex by Age in Westport
Disability Class: Hearing Difficulty
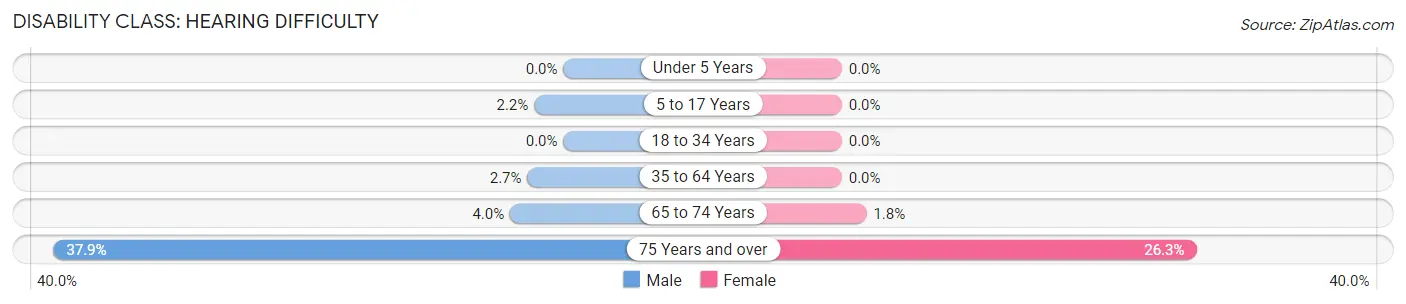
| Age Bracket | Male | Female |
| Under 5 Years | 0 (0.0%) | 0 (0.0%) |
| 5 to 17 Years | 6 (2.2%) | 0 (0.0%) |
| 18 to 34 Years | 0 (0.0%) | 0 (0.0%) |
| 35 to 64 Years | 27 (2.7%) | 0 (0.0%) |
| 65 to 74 Years | 18 (4.0%) | 11 (1.8%) |
| 75 Years and over | 39 (37.9%) | 40 (26.3%) |
Disability Class: Vision Difficulty
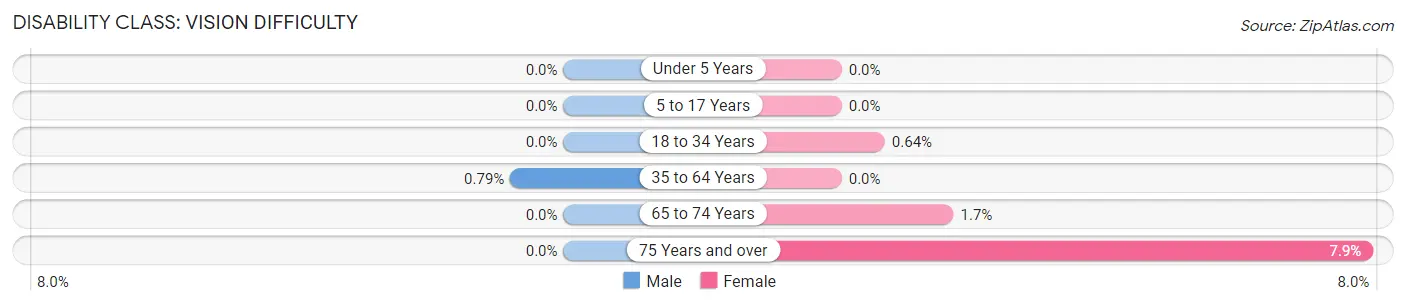
| Age Bracket | Male | Female |
| Under 5 Years | 0 (0.0%) | 0 (0.0%) |
| 5 to 17 Years | 0 (0.0%) | 0 (0.0%) |
| 18 to 34 Years | 0 (0.0%) | 2 (0.6%) |
| 35 to 64 Years | 8 (0.8%) | 0 (0.0%) |
| 65 to 74 Years | 0 (0.0%) | 10 (1.7%) |
| 75 Years and over | 0 (0.0%) | 12 (7.9%) |
Disability Class: Cognitive Difficulty
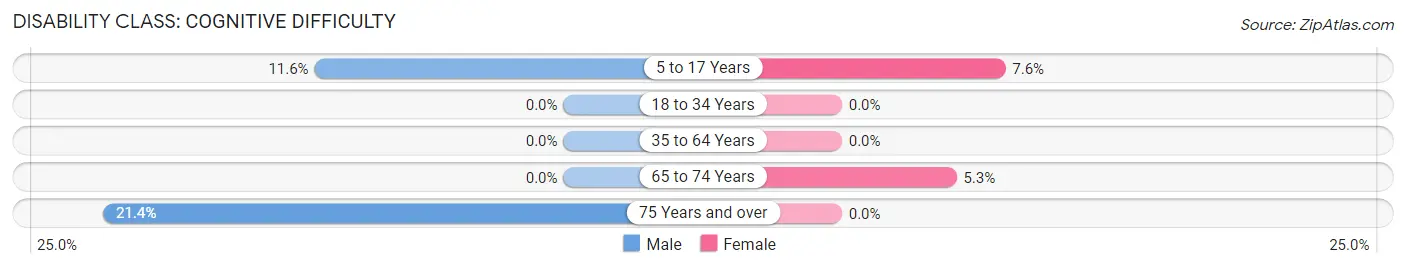
| Age Bracket | Male | Female |
| 5 to 17 Years | 32 (11.6%) | 17 (7.6%) |
| 18 to 34 Years | 0 (0.0%) | 0 (0.0%) |
| 35 to 64 Years | 0 (0.0%) | 0 (0.0%) |
| 65 to 74 Years | 0 (0.0%) | 32 (5.3%) |
| 75 Years and over | 22 (21.4%) | 0 (0.0%) |
Disability Class: Ambulatory Difficulty
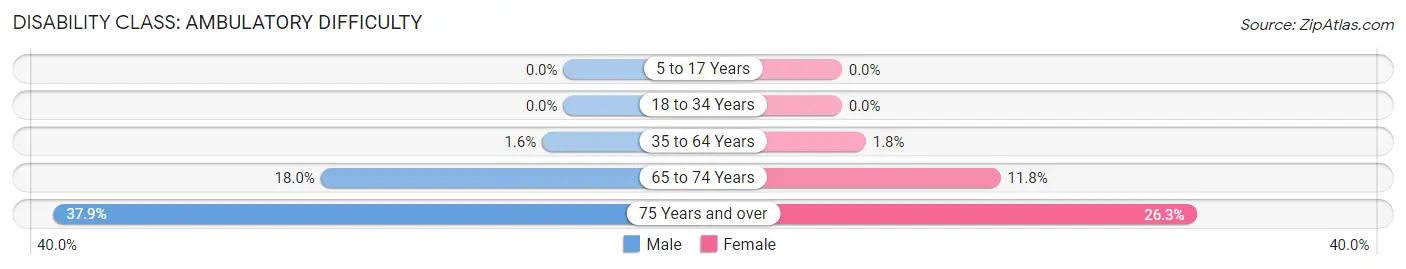
| Age Bracket | Male | Female |
| 5 to 17 Years | 0 (0.0%) | 0 (0.0%) |
| 18 to 34 Years | 0 (0.0%) | 0 (0.0%) |
| 35 to 64 Years | 16 (1.6%) | 16 (1.8%) |
| 65 to 74 Years | 82 (18.0%) | 71 (11.8%) |
| 75 Years and over | 39 (37.9%) | 40 (26.3%) |
Disability Class: Self-Care Difficulty
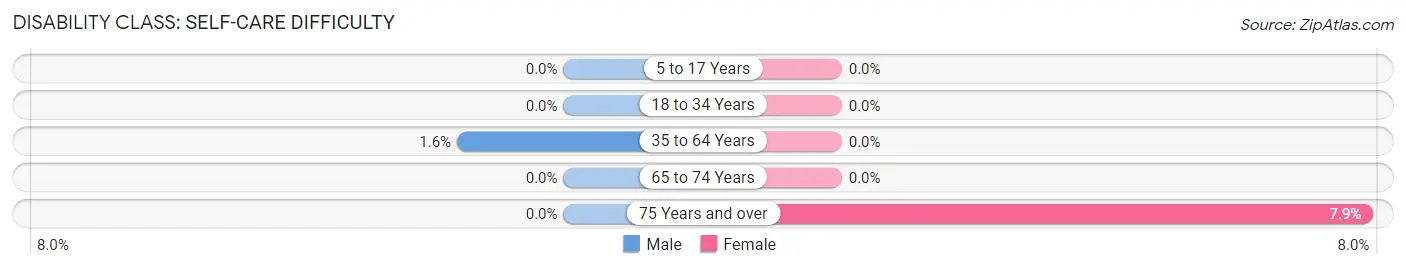
| Age Bracket | Male | Female |
| 5 to 17 Years | 0 (0.0%) | 0 (0.0%) |
| 18 to 34 Years | 0 (0.0%) | 0 (0.0%) |
| 35 to 64 Years | 16 (1.6%) | 0 (0.0%) |
| 65 to 74 Years | 0 (0.0%) | 0 (0.0%) |
| 75 Years and over | 0 (0.0%) | 12 (7.9%) |
Technology Access in Westport
Computing Device Access in Westport
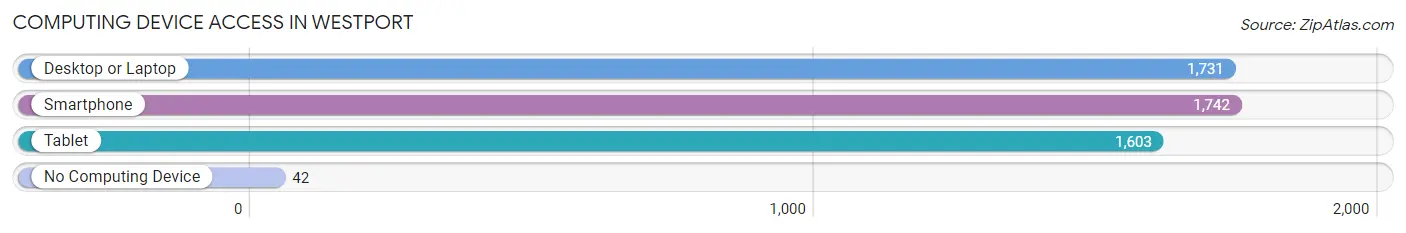
| Device Type | # Households | % Households |
| Desktop or Laptop | 1,731 | 94.0% |
| Smartphone | 1,742 | 94.6% |
| Tablet | 1,603 | 87.0% |
| No Computing Device | 42 | 2.3% |
| Total | 1,842 | 100.0% |
Internet Access in Westport
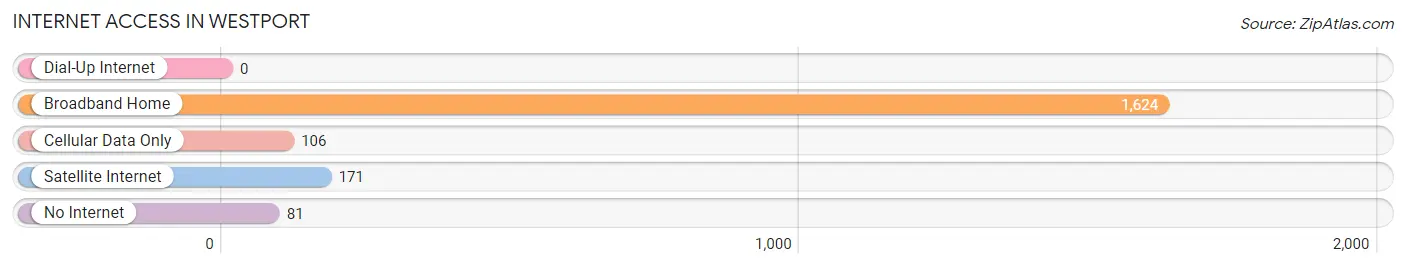
| Internet Type | # Households | % Households |
| Dial-Up Internet | 0 | 0.0% |
| Broadband Home | 1,624 | 88.2% |
| Cellular Data Only | 106 | 5.8% |
| Satellite Internet | 171 | 9.3% |
| No Internet | 81 | 4.4% |
| Total | 1,842 | 100.0% |
Westport Summary
Westport is a small town located in the state of North Carolina, in the United States. It is situated in the western part of the state, in the foothills of the Blue Ridge Mountains. The town is located in the Yadkin Valley region, and is part of the Winston-Salem metropolitan area. Westport was founded in 1845 and has a population of approximately 1,000 people.
History
Westport was founded in 1845 by a group of settlers from the nearby town of Wilkesboro. The settlers were looking for a place to settle and start a new life, and they chose the area around Westport because of its fertile soil and abundant natural resources. The town was named after the nearby West Fork River, which was named after the nearby West Fork Mountains.
The town quickly grew and prospered, and by the late 19th century, it had become a major center for the production of tobacco, cotton, and other agricultural products. The town also had a thriving lumber industry, and several mills were built in the area.
In the early 20th century, Westport experienced a period of decline, as the tobacco and cotton industries began to decline. However, the town was able to rebound in the mid-20th century, thanks to the growth of the nearby cities of Winston-Salem and Greensboro.
Geography
Westport is located in the western part of North Carolina, in the foothills of the Blue Ridge Mountains. The town is situated in the Yadkin Valley region, and is part of the Winston-Salem metropolitan area. The town is located at an elevation of 1,000 feet above sea level, and is surrounded by rolling hills and forests.
The town is located near several major highways, including Interstate 40, US Highway 421, and US Highway 52. The nearest major airport is the Piedmont Triad International Airport, located about 40 miles away in Greensboro.
Economy
Westport’s economy is largely based on agriculture and tourism. The town is home to several farms, which produce a variety of crops, including tobacco, cotton, corn, and soybeans. The town is also home to several wineries, which produce a variety of wines.
The town is also home to several small businesses, including restaurants, shops, and other services. The town is also home to several manufacturing companies, which produce a variety of products, including furniture, textiles, and electronics.
Demographics
As of the 2010 census, Westport had a population of 1,000 people. The town is predominantly white, with about 95% of the population being white. The town also has a small African American population, with about 4% of the population being African American. The town also has a small Hispanic population, with about 1% of the population being Hispanic.
The median household income in Westport is $37,000, and the median home value is $125,000. The town has a low unemployment rate, with only about 4% of the population being unemployed. The town also has a low poverty rate, with only about 8% of the population living below the poverty line.
Common Questions
What is the Total Population of Westport?
Total Population of Westport is 4,570.
What is the Total Male Population of Westport?
Total Male Population of Westport is 2,255.
What is the Total Female Population of Westport?
Total Female Population of Westport is 2,315.
What is the Ratio of Males per 100 Females in Westport?
There are 97.41 Males per 100 Females in Westport.
What is the Ratio of Females per 100 Males in Westport?
There are 102.66 Females per 100 Males in Westport.
What is the Median Population Age in Westport?
Median Population Age in Westport is 49.7 Years.
What is the Average Family Size in Westport
Average Family Size in Westport is 2.8 People.
What is the Average Household Size in Westport
Average Household Size in Westport is 2.5 People.
What is Per Capita Income in Westport?
Per Capita income in Westport is $66,922.
What is the Median Family Income in Westport?
Median Family Income in Westport is $147,000.
What is the Median Household income in Westport?
Median Household Income in Westport is $136,290.
What is Income or Wage Gap in Westport?
Income or Wage Gap in Westport is 59.2%.
Women in Westport earn 40.8 cents for every dollar earned by a man.
What is Inequality or Gini Index in Westport?
Inequality or Gini Index in Westport is 0.39.
How Large is the Labor Force in Westport?
There are 2,094 People in the Labor Forcein in Westport.
What is the Percentage of People in the Labor Force in Westport?
54.1% of People are in the Labor Force in Westport.
What is the Unemployment Rate in Westport?
Unemployment Rate in Westport is 6.2%.