Cricket, NC
Cricket Map
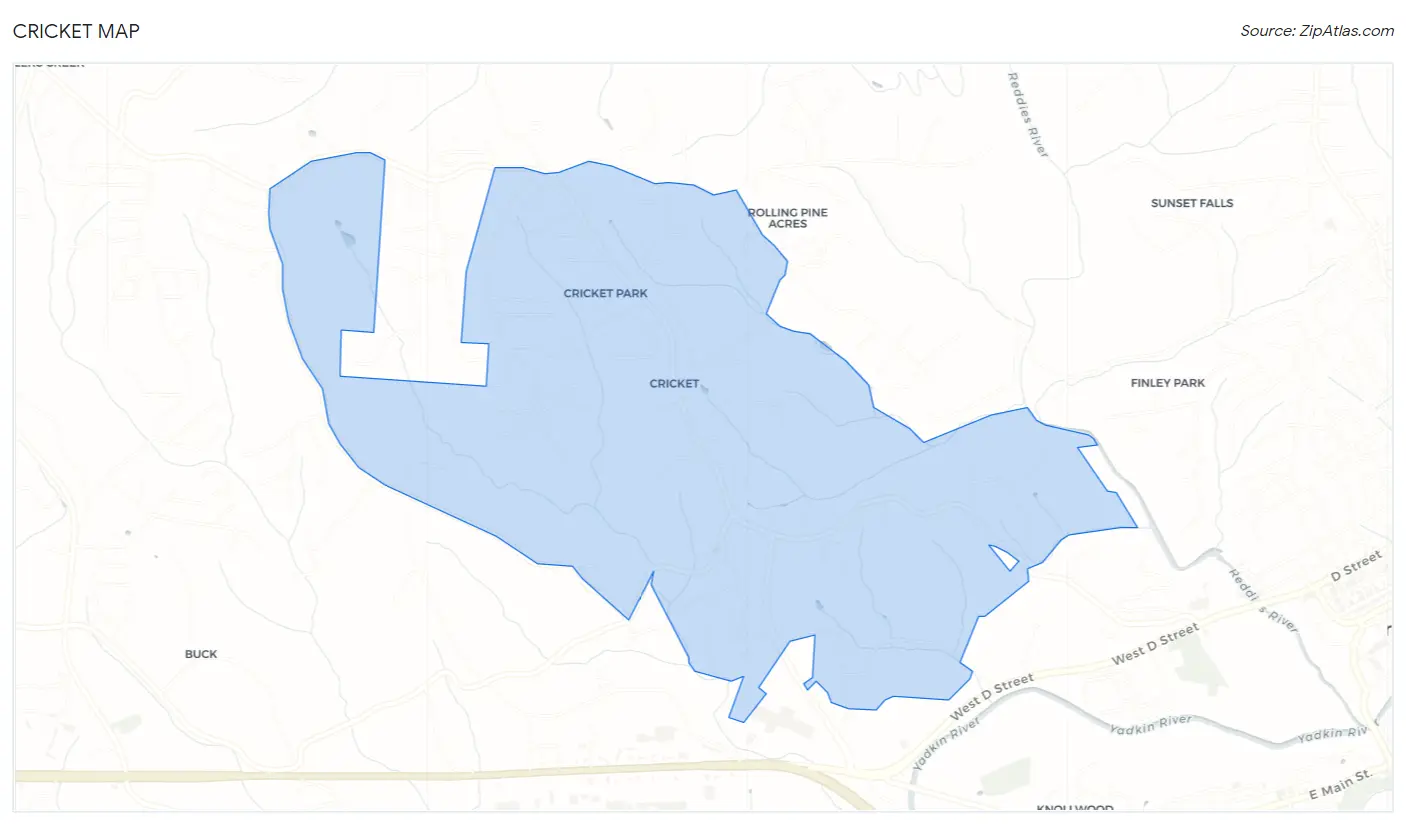
Cricket Overview
2,491
TOTAL POPULATION
1,236
MALE POPULATION
1,255
FEMALE POPULATION
98.49
MALES / 100 FEMALES
101.54
FEMALES / 100 MALES
28.1
MEDIAN AGE
3.1
AVG FAMILY SIZE
2.9
AVG HOUSEHOLD SIZE
$20,238
PER CAPITA INCOME
$45,804
AVG FAMILY INCOME
$45,536
AVG HOUSEHOLD INCOME
0.30
INEQUALITY / GINI INDEX
1,229
LABOR FORCE [ PEOPLE ]
62.4%
PERCENT IN LABOR FORCE
6.8%
UNEMPLOYMENT RATE
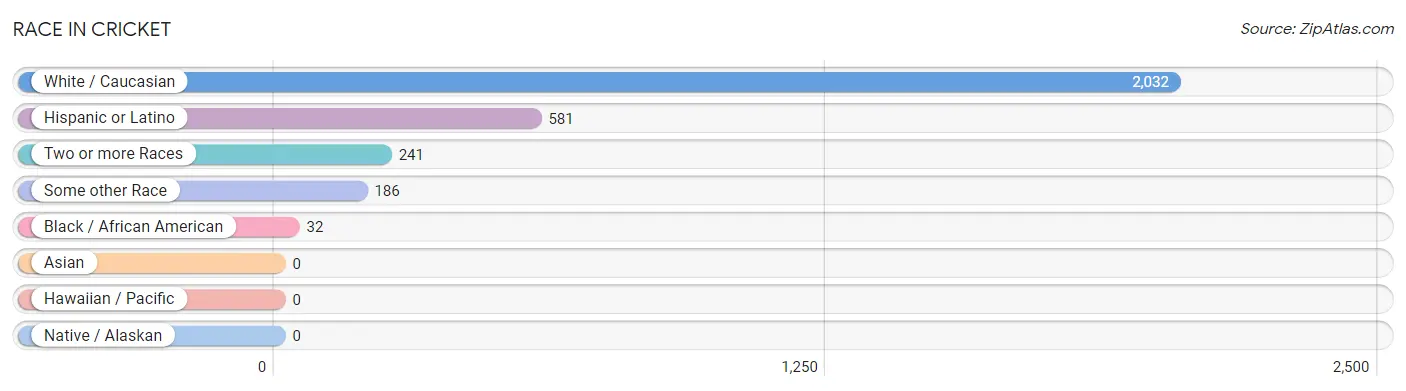
Race in Cricket
The most populous races in Cricket are White / Caucasian (2,032 | 81.6%), Hispanic or Latino (581 | 23.3%), and Two or more Races (241 | 9.7%).
| Race | # Population | % Population |
| Asian | 0 | 0.0% |
| Black / African American | 32 | 1.3% |
| Hawaiian / Pacific | 0 | 0.0% |
| Hispanic or Latino | 581 | 23.3% |
| Native / Alaskan | 0 | 0.0% |
| White / Caucasian | 2,032 | 81.6% |
| Two or more Races | 241 | 9.7% |
| Some other Race | 186 | 7.5% |
| Total | 2,491 | 100.0% |
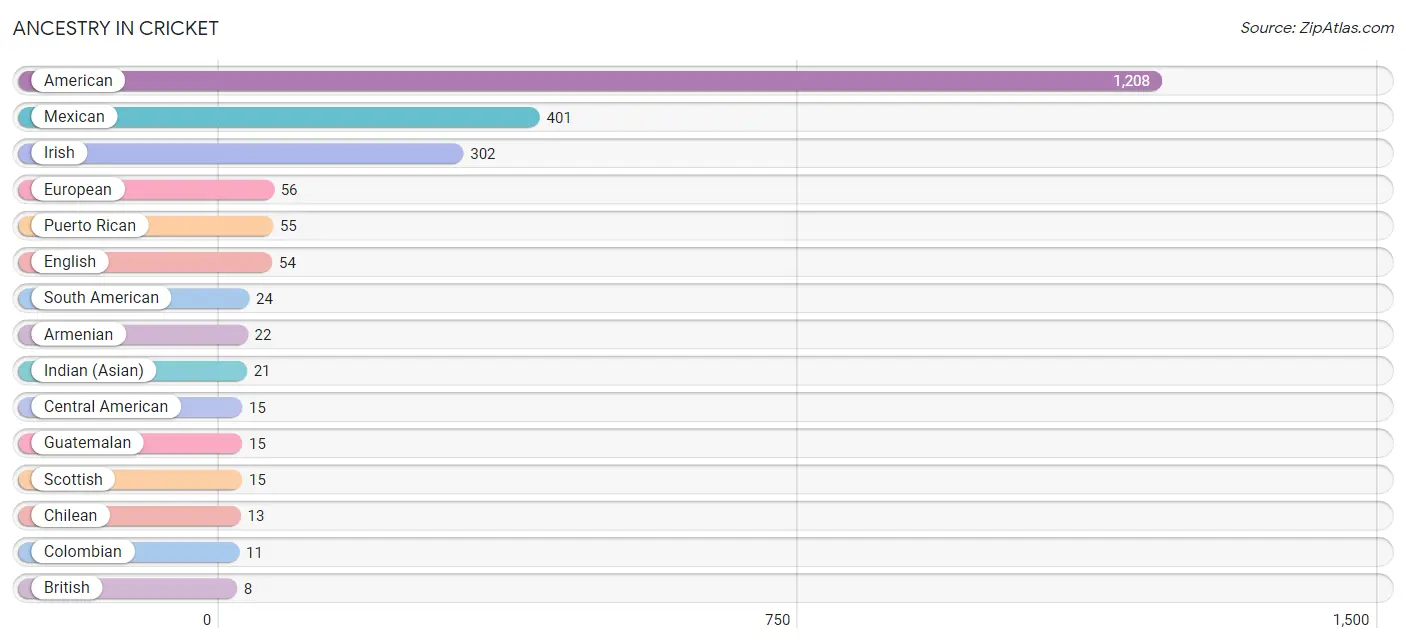
Ancestry in Cricket
The most populous ancestries reported in Cricket are American (1,208 | 48.5%), Mexican (401 | 16.1%), Irish (302 | 12.1%), European (56 | 2.2%), and Puerto Rican (55 | 2.2%), together accounting for 81.2% of all Cricket residents.
| Ancestry | # Population | % Population |
| American | 1,208 | 48.5% |
| Armenian | 22 | 0.9% |
| British | 8 | 0.3% |
| Central American | 15 | 0.6% |
| Chilean | 13 | 0.5% |
| Colombian | 11 | 0.4% |
| English | 54 | 2.2% |
| European | 56 | 2.2% |
| French | 7 | 0.3% |
| Guatemalan | 15 | 0.6% |
| Indian (Asian) | 21 | 0.8% |
| Irish | 302 | 12.1% |
| Mexican | 401 | 16.1% |
| Puerto Rican | 55 | 2.2% |
| Scotch-Irish | 8 | 0.3% |
| Scottish | 15 | 0.6% |
| South American | 24 | 1.0% | View All 17 Rows |
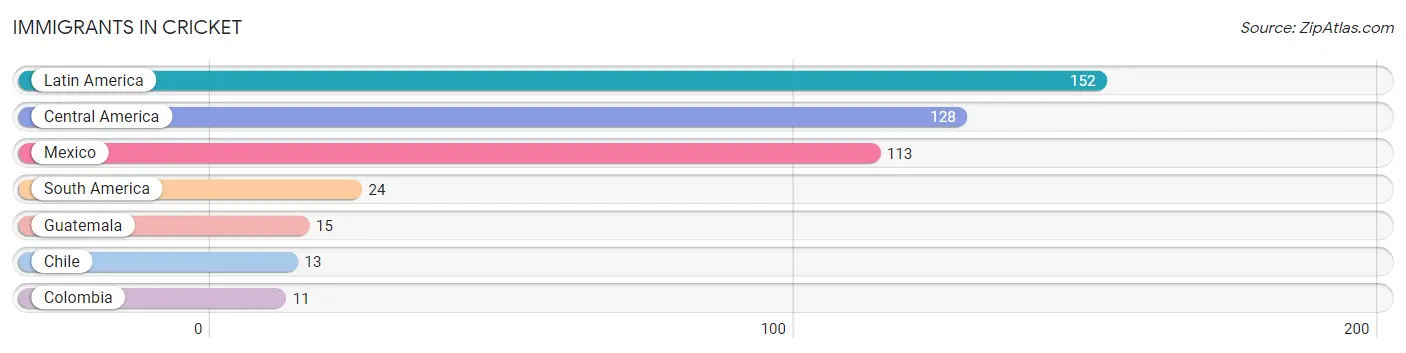
Immigrants in Cricket
The most numerous immigrant groups reported in Cricket came from Latin America (152 | 6.1%), Central America (128 | 5.1%), Mexico (113 | 4.5%), South America (24 | 1.0%), and Guatemala (15 | 0.6%), together accounting for 17.3% of all Cricket residents.
| Immigration Origin | # Population | % Population |
| Central America | 128 | 5.1% |
| Chile | 13 | 0.5% |
| Colombia | 11 | 0.4% |
| Guatemala | 15 | 0.6% |
| Latin America | 152 | 6.1% |
| Mexico | 113 | 4.5% |
| South America | 24 | 1.0% | View All 7 Rows |
Sex and Age in Cricket
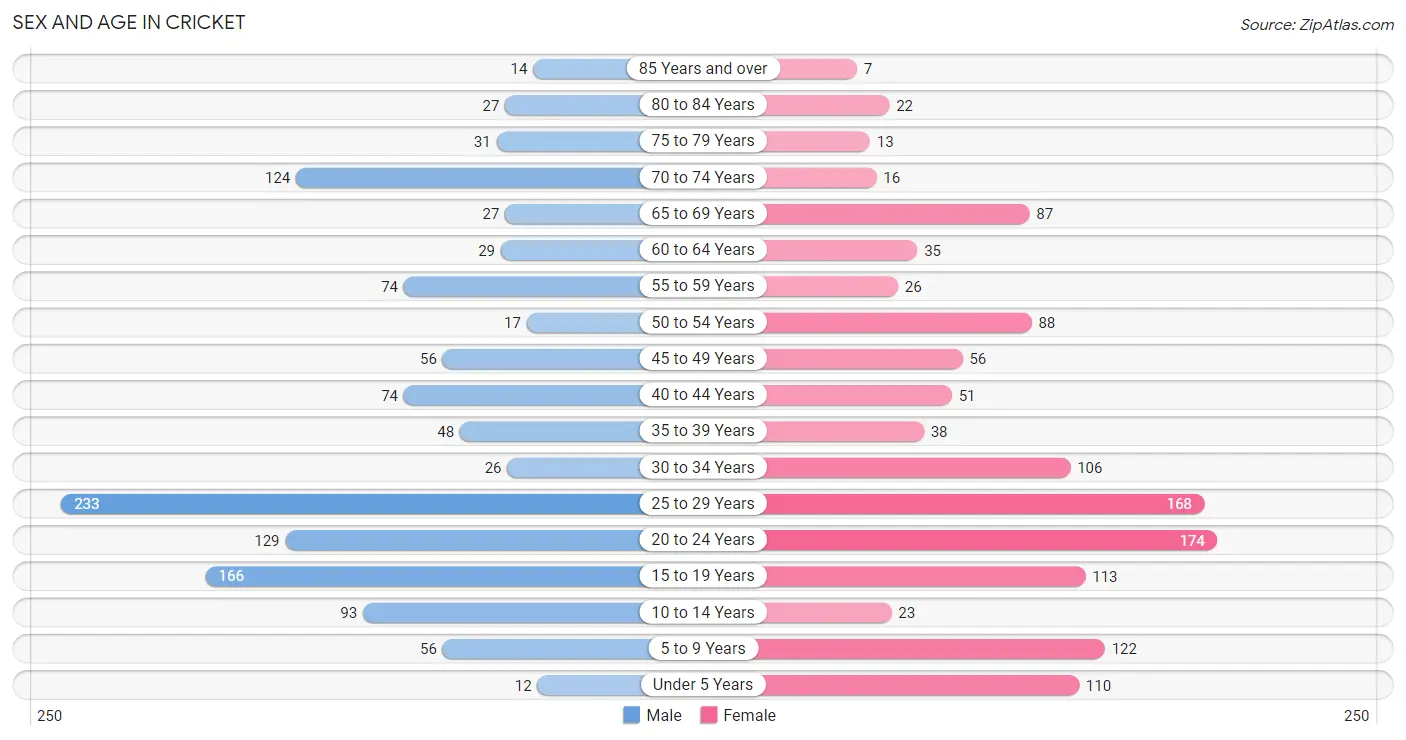
Sex and Age in Cricket
The most populous age groups in Cricket are 25 to 29 Years (233 | 18.9%) for men and 20 to 24 Years (174 | 13.9%) for women.
| Age Bracket | Male | Female |
| Under 5 Years | 12 (1.0%) | 110 (8.8%) |
| 5 to 9 Years | 56 (4.5%) | 122 (9.7%) |
| 10 to 14 Years | 93 (7.5%) | 23 (1.8%) |
| 15 to 19 Years | 166 (13.4%) | 113 (9.0%) |
| 20 to 24 Years | 129 (10.4%) | 174 (13.9%) |
| 25 to 29 Years | 233 (18.9%) | 168 (13.4%) |
| 30 to 34 Years | 26 (2.1%) | 106 (8.5%) |
| 35 to 39 Years | 48 (3.9%) | 38 (3.0%) |
| 40 to 44 Years | 74 (6.0%) | 51 (4.1%) |
| 45 to 49 Years | 56 (4.5%) | 56 (4.5%) |
| 50 to 54 Years | 17 (1.4%) | 88 (7.0%) |
| 55 to 59 Years | 74 (6.0%) | 26 (2.1%) |
| 60 to 64 Years | 29 (2.4%) | 35 (2.8%) |
| 65 to 69 Years | 27 (2.2%) | 87 (6.9%) |
| 70 to 74 Years | 124 (10.0%) | 16 (1.3%) |
| 75 to 79 Years | 31 (2.5%) | 13 (1.0%) |
| 80 to 84 Years | 27 (2.2%) | 22 (1.8%) |
| 85 Years and over | 14 (1.1%) | 7 (0.6%) |
| Total | 1,236 (100.0%) | 1,255 (100.0%) |
Families and Households in Cricket
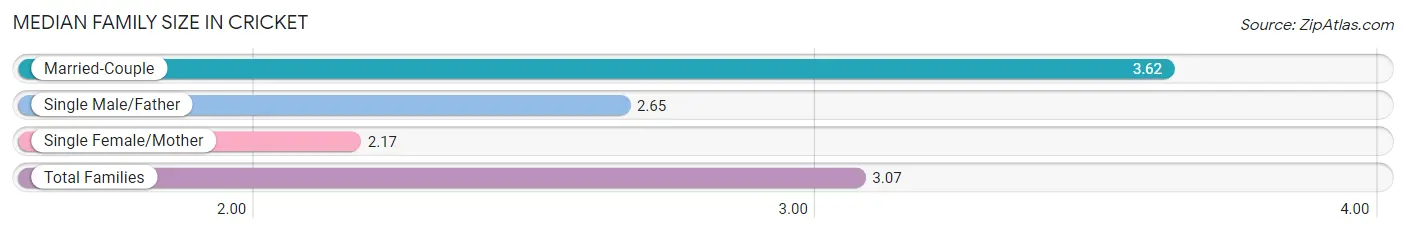
Median Family Size in Cricket
The median family size in Cricket is 3.07 persons per family, with married-couple families (355 | 59.3%) accounting for the largest median family size of 3.62 persons per family. On the other hand, single female/mother families (201 | 33.6%) represent the smallest median family size with 2.17 persons per family.
| Family Type | # Families | Family Size |
| Married-Couple | 355 (59.3%) | 3.62 |
| Single Male/Father | 43 (7.2%) | 2.65 |
| Single Female/Mother | 201 (33.6%) | 2.17 |
| Total Families | 599 (100.0%) | 3.07 |
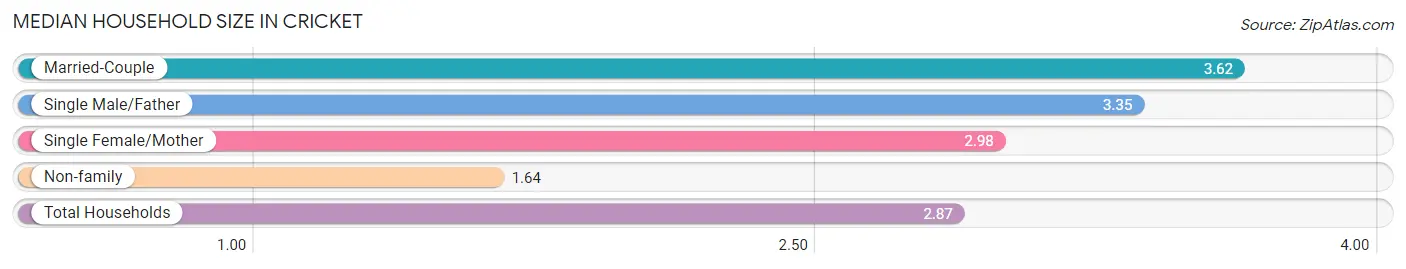
Median Household Size in Cricket
The median household size in Cricket is 2.87 persons per household, with married-couple households (355 | 41.6%) accounting for the largest median household size of 3.62 persons per household. non-family households (255 | 29.9%) represent the smallest median household size with 1.64 persons per household.
| Household Type | # Households | Household Size |
| Married-Couple | 355 (41.6%) | 3.62 |
| Single Male/Father | 43 (5.0%) | 3.35 |
| Single Female/Mother | 201 (23.5%) | 2.98 |
| Non-family | 255 (29.9%) | 1.64 |
| Total Households | 854 (100.0%) | 2.87 |
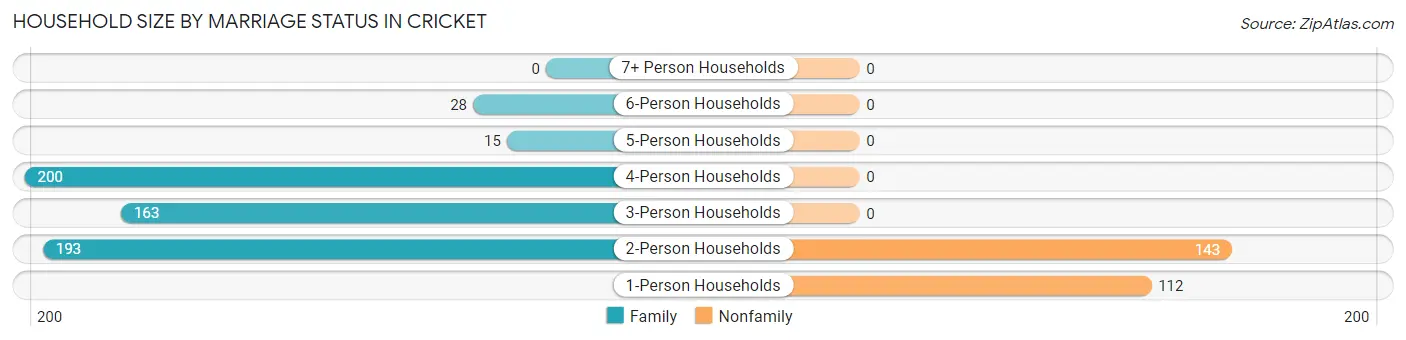
Household Size by Marriage Status in Cricket
Out of a total of 854 households in Cricket, 599 (70.1%) are family households, while 255 (29.9%) are nonfamily households. The most numerous type of family households are 4-person households, comprising 200, and the most common type of nonfamily households are 2-person households, comprising 143.
| Household Size | Family Households | Nonfamily Households |
| 1-Person Households | - | 112 (13.1%) |
| 2-Person Households | 193 (22.6%) | 143 (16.7%) |
| 3-Person Households | 163 (19.1%) | 0 (0.0%) |
| 4-Person Households | 200 (23.4%) | 0 (0.0%) |
| 5-Person Households | 15 (1.8%) | 0 (0.0%) |
| 6-Person Households | 28 (3.3%) | 0 (0.0%) |
| 7+ Person Households | 0 (0.0%) | 0 (0.0%) |
| Total | 599 (70.1%) | 255 (29.9%) |
Female Fertility in Cricket
Fertility by Age in Cricket
Average fertility rate in Cricket is 27.0 births per 1,000 women. Women in the age bracket of 20 to 34 years have the highest fertility rate with 45.0 births per 1,000 women. Women in the age bracket of 20 to 34 years acount for 100.0% of all women with births.
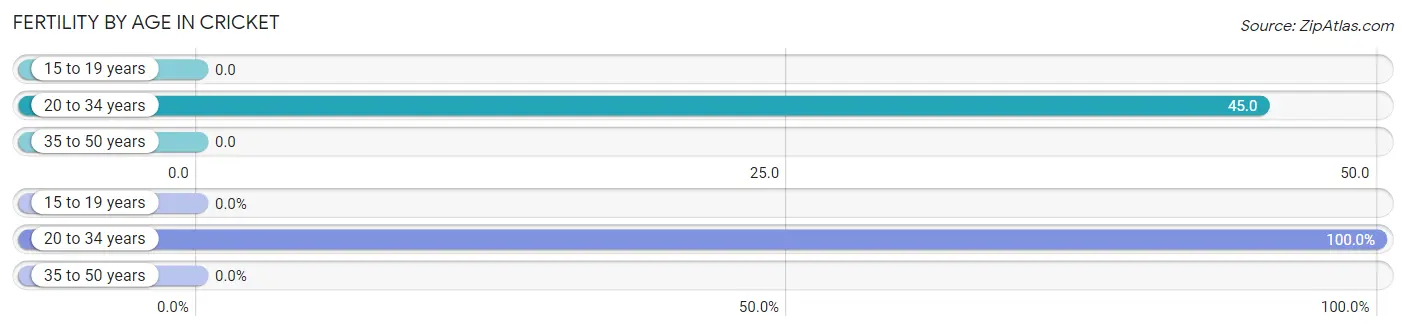
| Age Bracket | Women with Births | Births / 1,000 Women |
| 15 to 19 years | 0 (0.0%) | 0.0 |
| 20 to 34 years | 20 (100.0%) | 45.0 |
| 35 to 50 years | 0 (0.0%) | 0.0 |
| Total | 20 (100.0%) | 27.0 |
Fertility by Age by Marriage Status in Cricket
75.0% of women with births (20) in Cricket are married. The highest percentage of unmarried women with births falls into 20 to 34 years age bracket with 25.0% of them unmarried at the time of birth, while the lowest percentage of unmarried women with births belong to 20 to 34 years age bracket with 25.0% of them unmarried.
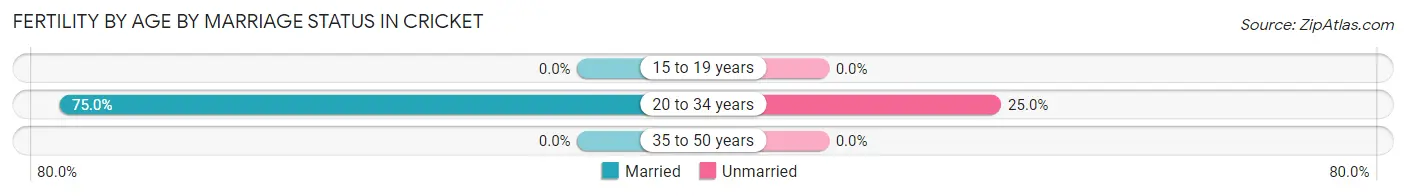
| Age Bracket | Married | Unmarried |
| 15 to 19 years | 0 (0.0%) | 0 (0.0%) |
| 20 to 34 years | 15 (75.0%) | 5 (25.0%) |
| 35 to 50 years | 0 (0.0%) | 0 (0.0%) |
| Total | 15 (75.0%) | 5 (25.0%) |
Fertility by Education in Cricket
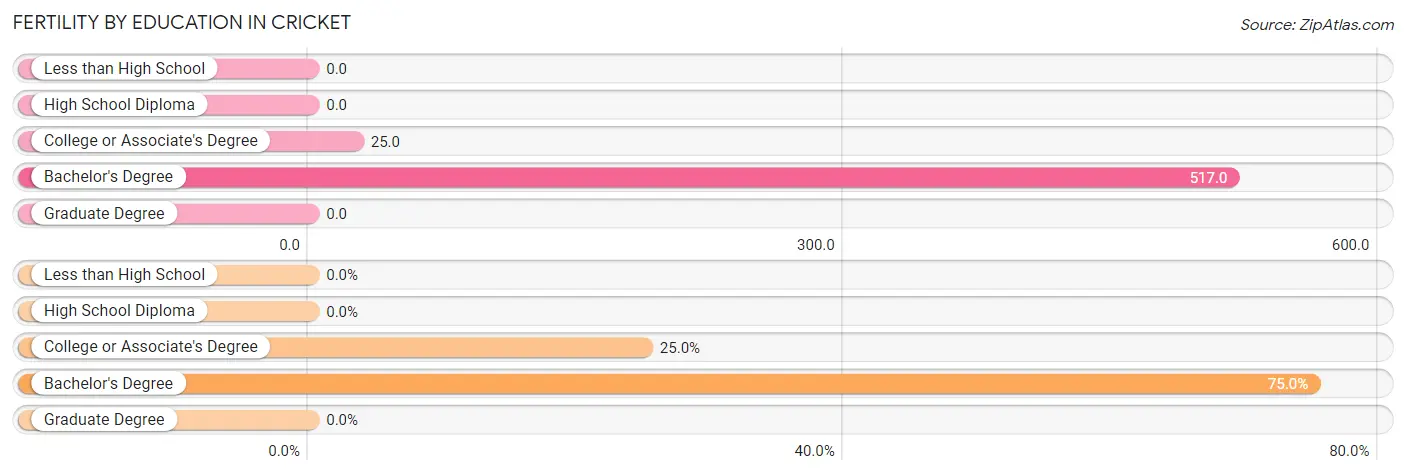
| Educational Attainment | Women with Births | Births / 1,000 Women |
| Less than High School | 0 (0.0%) | 0.0 |
| High School Diploma | 0 (0.0%) | 0.0 |
| College or Associate's Degree | 5 (25.0%) | 25.0 |
| Bachelor's Degree | 15 (75.0%) | 517.0 |
| Graduate Degree | 0 (0.0%) | 0.0 |
| Total | 20 (100.0%) | 27.0 |
Fertility by Education by Marriage Status in Cricket
25.0% of women with births in Cricket are unmarried. Women with the educational attainment of bachelor's degree are most likely to be married with 100.0% of them married at childbirth, while women with the educational attainment of college or associate's degree are least likely to be married with 100.0% of them unmarried at childbirth.
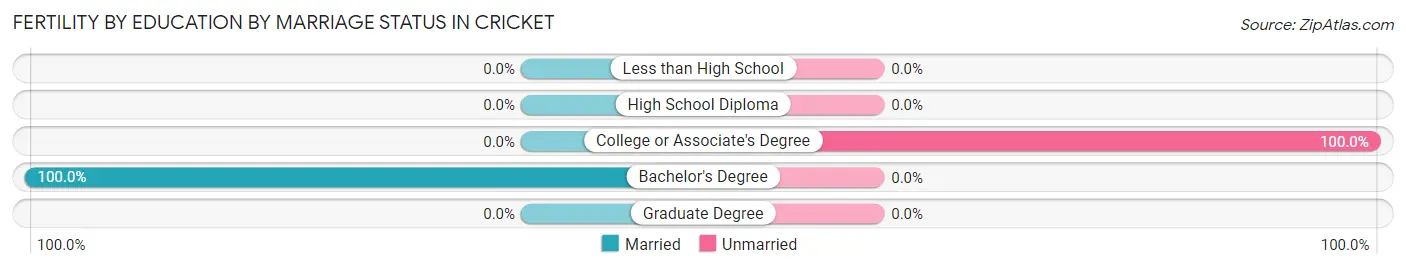
| Educational Attainment | Married | Unmarried |
| Less than High School | 0 (0.0%) | 0 (0.0%) |
| High School Diploma | 0 (0.0%) | 0 (0.0%) |
| College or Associate's Degree | 0 (0.0%) | 5 (100.0%) |
| Bachelor's Degree | 15 (100.0%) | 0 (0.0%) |
| Graduate Degree | 0 (0.0%) | 0 (0.0%) |
| Total | 15 (75.0%) | 5 (25.0%) |
Income in Cricket
Income Overview in Cricket
Per Capita Income in Cricket is $20,238, while median incomes of families and households are $45,804 and $45,536 respectively.
| Characteristic | Number | Measure |
| Per Capita Income | 2,491 | $20,238 |
| Median Family Income | 599 | $45,804 |
| Mean Family Income | 599 | $51,595 |
| Median Household Income | 854 | $45,536 |
| Mean Household Income | 854 | $56,450 |
| Income Deficit | 599 | $0 |
| Wage / Income Gap (%) | 2,491 | 0.00% |
| Wage / Income Gap ($) | 2,491 | 100.00¢ per $1 |
| Gini / Inequality Index | 2,491 | 0.30 |
Earnings by Sex in Cricket
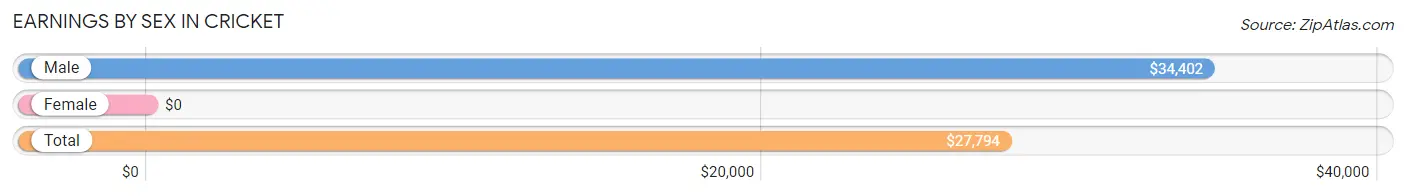
| Sex | Number | Average Earnings |
| Male | 645 (51.8%) | $34,402 |
| Female | 599 (48.1%) | $0 |
| Total | 1,244 (100.0%) | $27,794 |
Earnings by Sex by Income Bracket in Cricket
The most common earnings brackets in Cricket are $30,000 to $34,999 for men (172 | 26.7%) and $2,499 or less for women (178 | 29.7%).
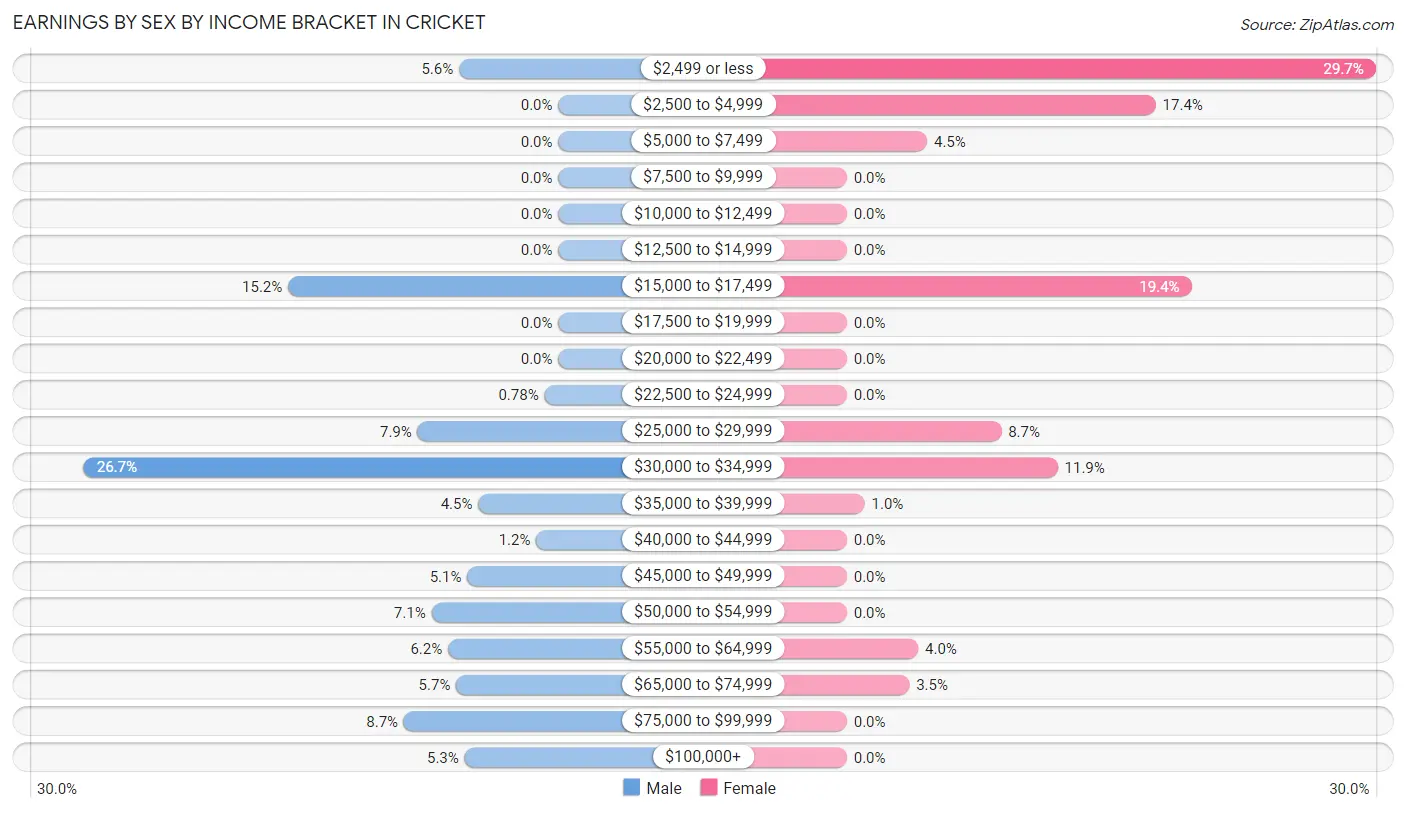
| Income | Male | Female |
| $2,499 or less | 36 (5.6%) | 178 (29.7%) |
| $2,500 to $4,999 | 0 (0.0%) | 104 (17.4%) |
| $5,000 to $7,499 | 0 (0.0%) | 27 (4.5%) |
| $7,500 to $9,999 | 0 (0.0%) | 0 (0.0%) |
| $10,000 to $12,499 | 0 (0.0%) | 0 (0.0%) |
| $12,500 to $14,999 | 0 (0.0%) | 0 (0.0%) |
| $15,000 to $17,499 | 98 (15.2%) | 116 (19.4%) |
| $17,500 to $19,999 | 0 (0.0%) | 0 (0.0%) |
| $20,000 to $22,499 | 0 (0.0%) | 0 (0.0%) |
| $22,500 to $24,999 | 5 (0.8%) | 0 (0.0%) |
| $25,000 to $29,999 | 51 (7.9%) | 52 (8.7%) |
| $30,000 to $34,999 | 172 (26.7%) | 71 (11.8%) |
| $35,000 to $39,999 | 29 (4.5%) | 6 (1.0%) |
| $40,000 to $44,999 | 8 (1.2%) | 0 (0.0%) |
| $45,000 to $49,999 | 33 (5.1%) | 0 (0.0%) |
| $50,000 to $54,999 | 46 (7.1%) | 0 (0.0%) |
| $55,000 to $64,999 | 40 (6.2%) | 24 (4.0%) |
| $65,000 to $74,999 | 37 (5.7%) | 21 (3.5%) |
| $75,000 to $99,999 | 56 (8.7%) | 0 (0.0%) |
| $100,000+ | 34 (5.3%) | 0 (0.0%) |
| Total | 645 (100.0%) | 599 (100.0%) |
Earnings by Sex by Educational Attainment in Cricket
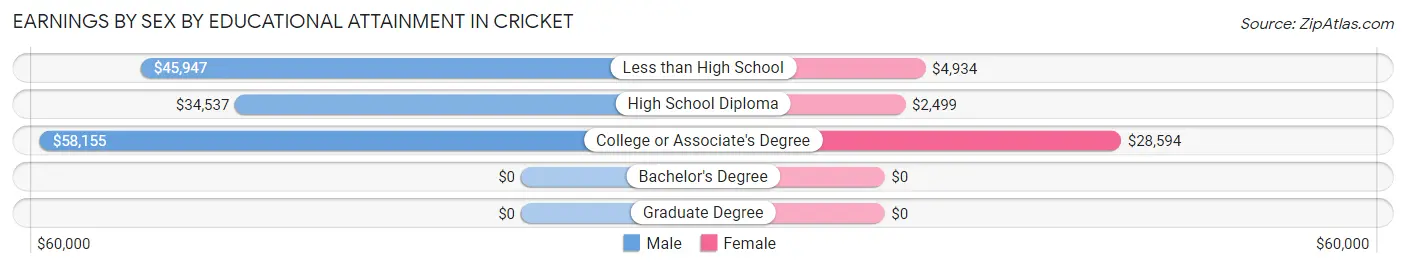
| Educational Attainment | Male Income | Female Income |
| Less than High School | $45,947 | $4,934 |
| High School Diploma | $34,537 | $2,499 |
| College or Associate's Degree | $58,155 | $28,594 |
| Bachelor's Degree | - | - |
| Graduate Degree | - | - |
| Total | $38,077 | $0 |
Family Income in Cricket
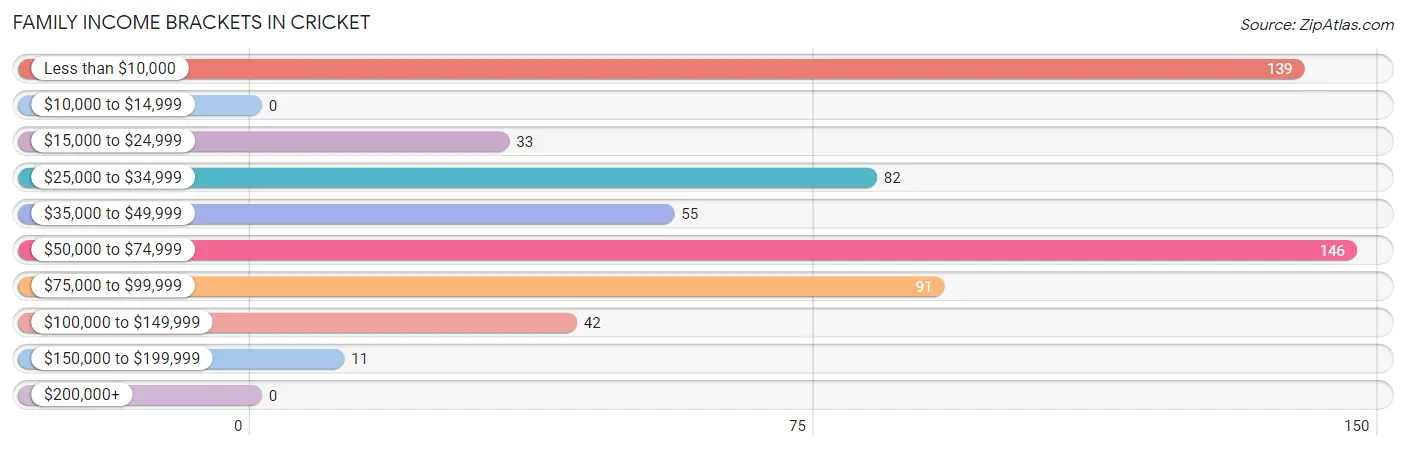
Family Income Brackets in Cricket
According to the Cricket family income data, there are 146 families falling into the $50,000 to $74,999 income range, which is the most common income bracket and makes up 24.4% of all families.
| Income Bracket | # Families | % Families |
| Less than $10,000 | 139 | 23.2% |
| $10,000 to $14,999 | 0 | 0.0% |
| $15,000 to $24,999 | 33 | 5.5% |
| $25,000 to $34,999 | 82 | 13.7% |
| $35,000 to $49,999 | 55 | 9.2% |
| $50,000 to $74,999 | 146 | 24.4% |
| $75,000 to $99,999 | 91 | 15.2% |
| $100,000 to $149,999 | 42 | 7.0% |
| $150,000 to $199,999 | 11 | 1.8% |
| $200,000+ | 0 | 0.0% |
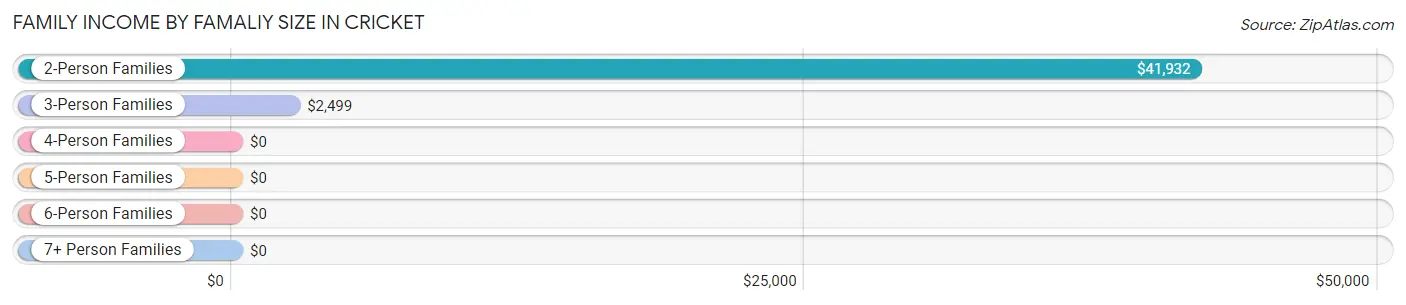
Family Income by Famaliy Size in Cricket
2-person families (224 | 37.4%) account for the highest median family income in Cricket with $41,932 per family, while 2-person families (224 | 37.4%) have the highest median income of $20,966 per family member.
| Income Bracket | # Families | Median Income |
| 2-Person Families | 224 (37.4%) | $41,932 |
| 3-Person Families | 271 (45.2%) | $2,499 |
| 4-Person Families | 61 (10.2%) | $0 |
| 5-Person Families | 15 (2.5%) | $0 |
| 6-Person Families | 28 (4.7%) | $0 |
| 7+ Person Families | 0 (0.0%) | $0 |
| Total | 599 (100.0%) | $45,804 |
Family Income by Number of Earners in Cricket
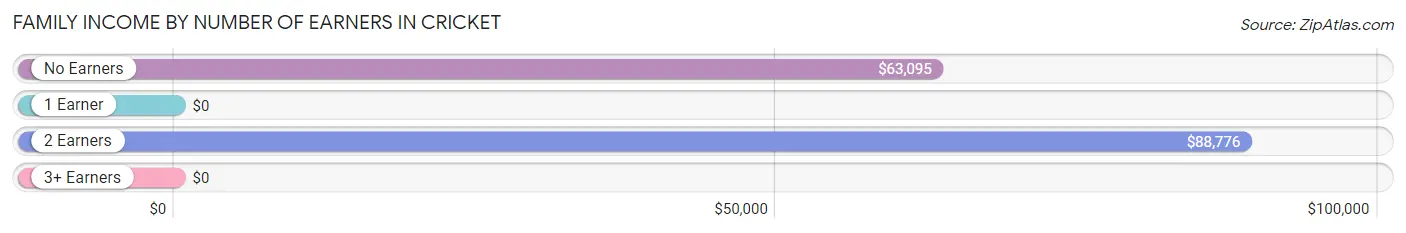
| Number of Earners | # Families | Median Income |
| No Earners | 130 (21.7%) | $63,095 |
| 1 Earner | 283 (47.2%) | $0 |
| 2 Earners | 171 (28.5%) | $88,776 |
| 3+ Earners | 15 (2.5%) | $0 |
| Total | 599 (100.0%) | $45,804 |
Household Income in Cricket
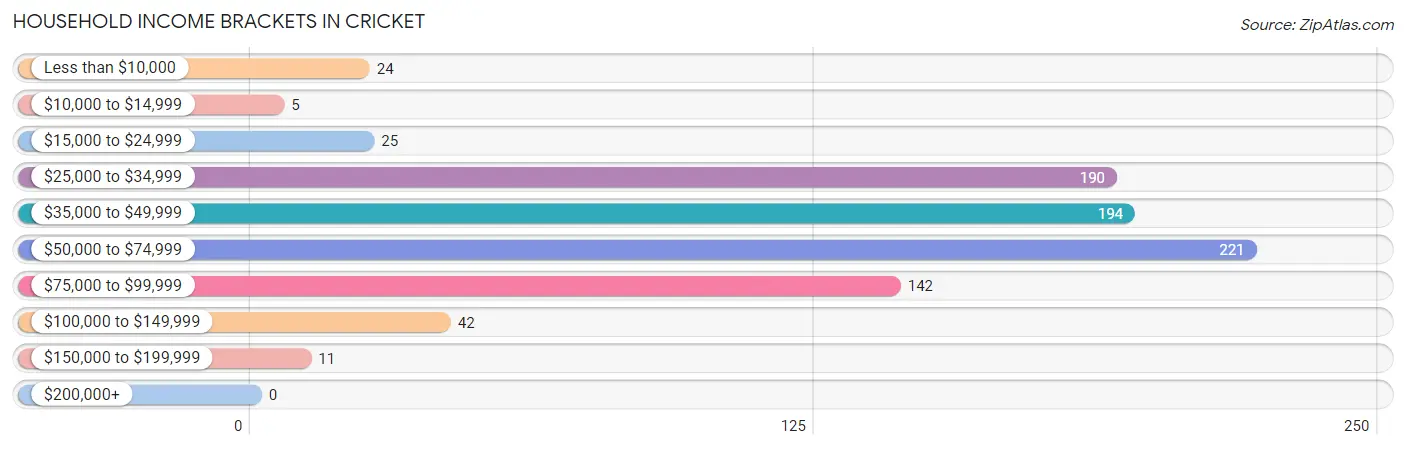
Household Income Brackets in Cricket
With 221 households falling in the category, the $50,000 to $74,999 income range is the most frequent in Cricket, accounting for 25.9% of all households.
| Income Bracket | # Households | % Households |
| Less than $10,000 | 24 | 2.8% |
| $10,000 to $14,999 | 5 | 0.6% |
| $15,000 to $24,999 | 25 | 2.9% |
| $25,000 to $34,999 | 190 | 22.2% |
| $35,000 to $49,999 | 194 | 22.7% |
| $50,000 to $74,999 | 221 | 25.9% |
| $75,000 to $99,999 | 142 | 16.6% |
| $100,000 to $149,999 | 42 | 4.9% |
| $150,000 to $199,999 | 11 | 1.3% |
| $200,000+ | 0 | 0.0% |
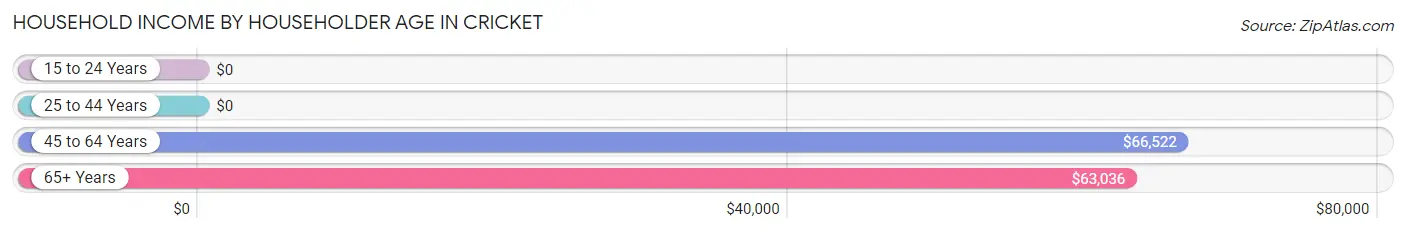
Household Income by Householder Age in Cricket
The median household income in Cricket is $45,536, with the highest median household income of $66,522 found in the 45 to 64 years age bracket for the primary householder. A total of 250 households (29.3%) fall into this category. Meanwhile, the 15 to 24 years age bracket for the primary householder has the lowest median household income of $0, with 122 households (14.3%) in this group.
| Income Bracket | # Households | Median Income |
| 15 to 24 Years | 122 (14.3%) | $0 |
| 25 to 44 Years | 304 (35.6%) | $0 |
| 45 to 64 Years | 250 (29.3%) | $66,522 |
| 65+ Years | 178 (20.8%) | $63,036 |
| Total | 854 (100.0%) | $45,536 |
Poverty in Cricket
Income Below Poverty by Sex and Age in Cricket
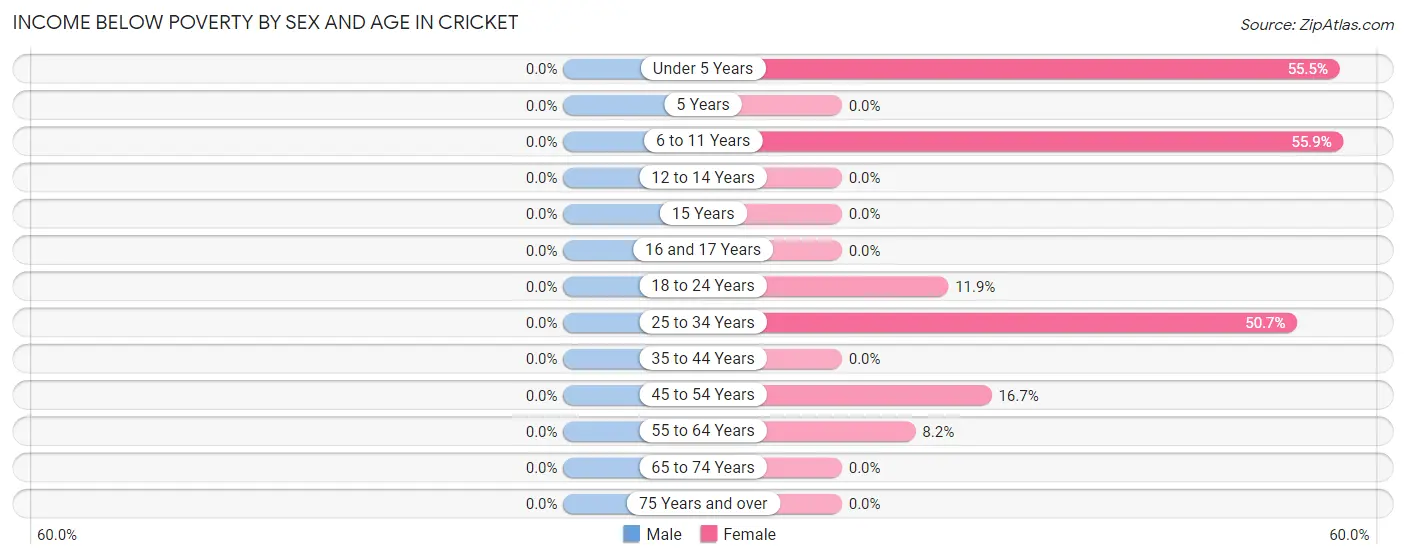
| Age Bracket | Male | Female |
| Under 5 Years | 0 (0.0%) | 61 (55.4%) |
| 5 Years | 0 (0.0%) | 0 (0.0%) |
| 6 to 11 Years | 0 (0.0%) | 76 (55.9%) |
| 12 to 14 Years | 0 (0.0%) | 0 (0.0%) |
| 15 Years | 0 (0.0%) | 0 (0.0%) |
| 16 and 17 Years | 0 (0.0%) | 0 (0.0%) |
| 18 to 24 Years | 0 (0.0%) | 25 (11.8%) |
| 25 to 34 Years | 0 (0.0%) | 139 (50.7%) |
| 35 to 44 Years | 0 (0.0%) | 0 (0.0%) |
| 45 to 54 Years | 0 (0.0%) | 24 (16.7%) |
| 55 to 64 Years | 0 (0.0%) | 5 (8.2%) |
| 65 to 74 Years | 0 (0.0%) | 0 (0.0%) |
| 75 Years and over | 0 (0.0%) | 0 (0.0%) |
| Total | 0 (0.0%) | 330 (26.3%) |
Income Above Poverty by Sex and Age in Cricket
According to the poverty statistics in Cricket, males aged under 5 years and females aged 12 to 14 years are the age groups that are most secure financially, with 100.0% of males and 100.0% of females in these age groups living above the poverty line.
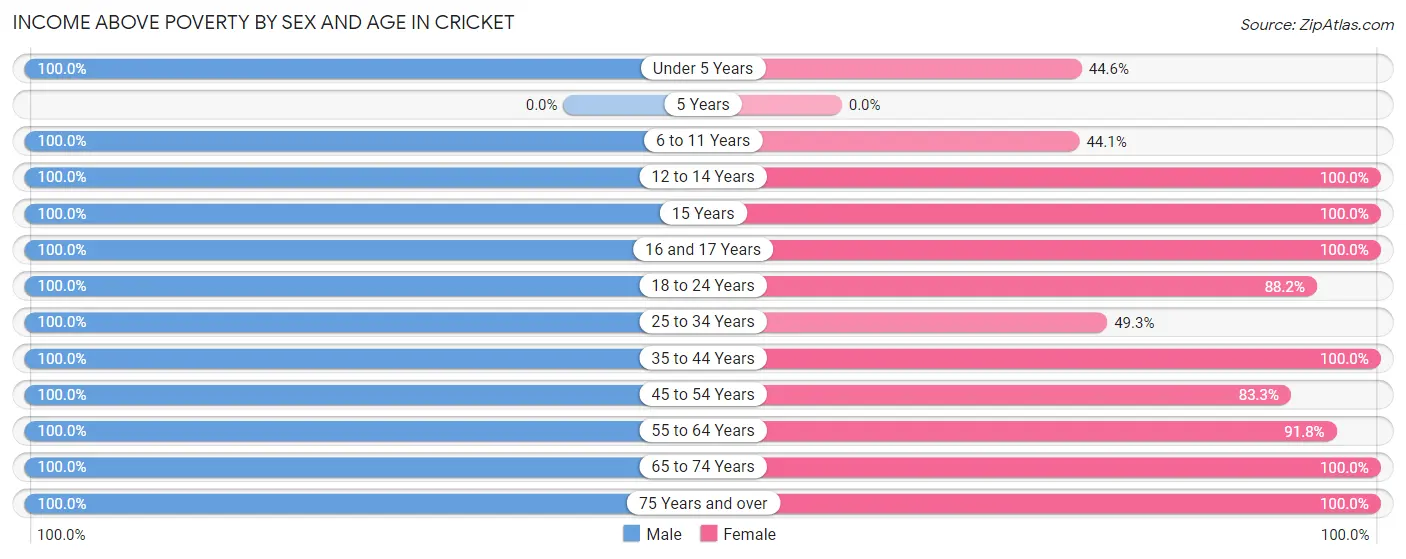
| Age Bracket | Male | Female |
| Under 5 Years | 12 (100.0%) | 49 (44.6%) |
| 5 Years | 0 (0.0%) | 0 (0.0%) |
| 6 to 11 Years | 56 (100.0%) | 60 (44.1%) |
| 12 to 14 Years | 93 (100.0%) | 9 (100.0%) |
| 15 Years | 68 (100.0%) | 37 (100.0%) |
| 16 and 17 Years | 63 (100.0%) | 39 (100.0%) |
| 18 to 24 Years | 164 (100.0%) | 186 (88.1%) |
| 25 to 34 Years | 259 (100.0%) | 135 (49.3%) |
| 35 to 44 Years | 122 (100.0%) | 89 (100.0%) |
| 45 to 54 Years | 73 (100.0%) | 120 (83.3%) |
| 55 to 64 Years | 103 (100.0%) | 56 (91.8%) |
| 65 to 74 Years | 129 (100.0%) | 103 (100.0%) |
| 75 Years and over | 50 (100.0%) | 42 (100.0%) |
| Total | 1,192 (100.0%) | 925 (73.7%) |
Income Below Poverty Among Married-Couple Families in Cricket
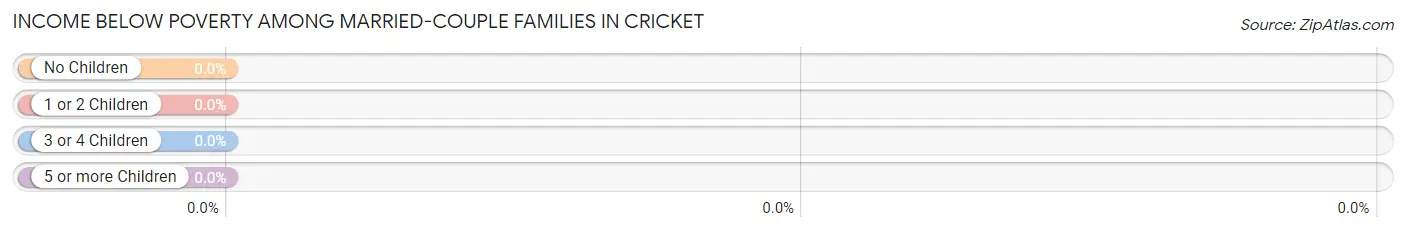
| Children | Above Poverty | Below Poverty |
| No Children | 172 (100.0%) | 0 (0.0%) |
| 1 or 2 Children | 155 (100.0%) | 0 (0.0%) |
| 3 or 4 Children | 28 (100.0%) | 0 (0.0%) |
| 5 or more Children | 0 (0.0%) | 0 (0.0%) |
| Total | 355 (100.0%) | 0 (0.0%) |
Income Below Poverty Among Single-Parent Households in Cricket
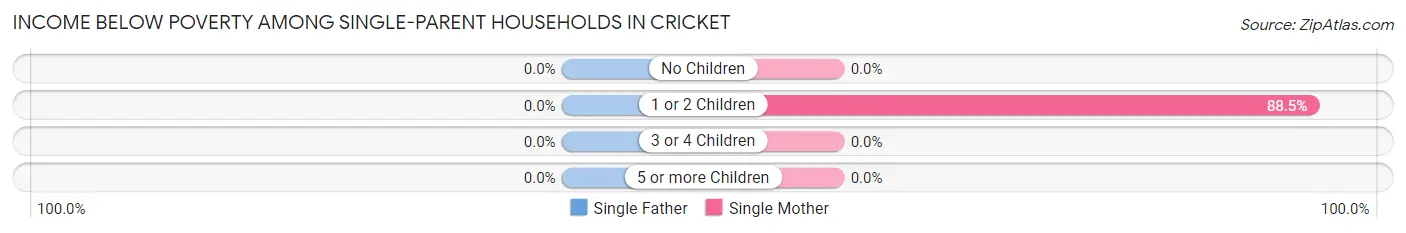
| Children | Single Father | Single Mother |
| No Children | 0 (0.0%) | 0 (0.0%) |
| 1 or 2 Children | 0 (0.0%) | 139 (88.5%) |
| 3 or 4 Children | 0 (0.0%) | 0 (0.0%) |
| 5 or more Children | 0 (0.0%) | 0 (0.0%) |
| Total | 0 (0.0%) | 139 (69.2%) |
Income Below Poverty Among Married-Couple vs Single-Parent Households in Cricket
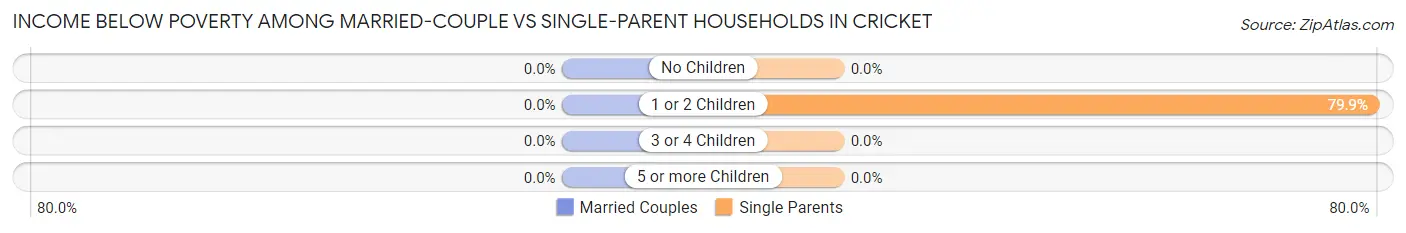
| Children | Married-Couple Families | Single-Parent Households |
| No Children | 0 (0.0%) | 0 (0.0%) |
| 1 or 2 Children | 0 (0.0%) | 139 (79.9%) |
| 3 or 4 Children | 0 (0.0%) | 0 (0.0%) |
| 5 or more Children | 0 (0.0%) | 0 (0.0%) |
| Total | 0 (0.0%) | 139 (57.0%) |
Employment Characteristics in Cricket
Employment by Class of Employer in Cricket
Among the 1,120 employed individuals in Cricket, private company employees (964 | 86.1%), self-employed (not incorporated) (65 | 5.8%), and local government employees (60 | 5.4%) make up the most common classes of employment.
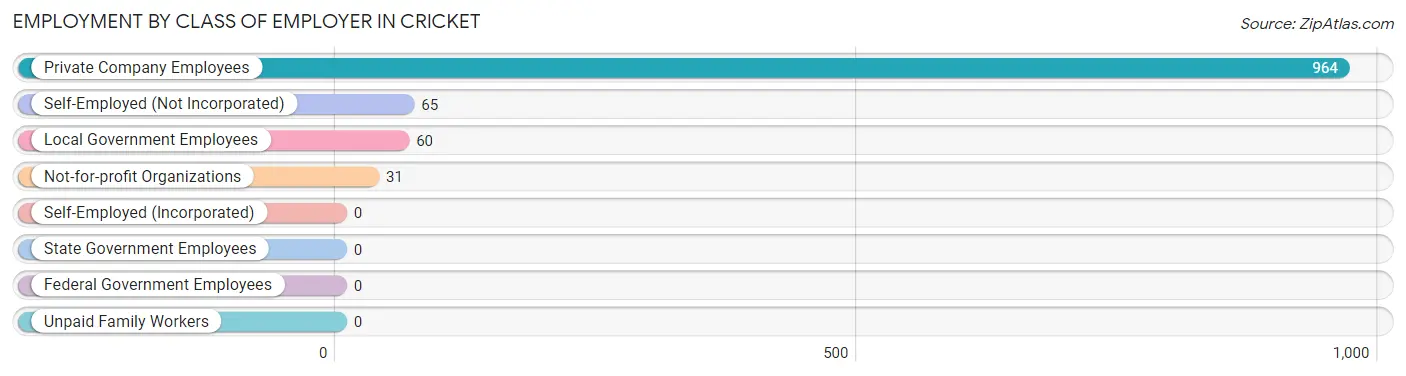
| Employer Class | # Employees | % Employees |
| Private Company Employees | 964 | 86.1% |
| Self-Employed (Incorporated) | 0 | 0.0% |
| Self-Employed (Not Incorporated) | 65 | 5.8% |
| Not-for-profit Organizations | 31 | 2.8% |
| Local Government Employees | 60 | 5.4% |
| State Government Employees | 0 | 0.0% |
| Federal Government Employees | 0 | 0.0% |
| Unpaid Family Workers | 0 | 0.0% |
| Total | 1,120 | 100.0% |
Employment Status by Age in Cricket
According to the labor force statistics for Cricket, out of the total population over 16 years of age (1,970), 62.4% or 1,229 individuals are in the labor force, with 6.8% or 84 of them unemployed. The age group with the highest labor force participation rate is 25 to 29 years, with 100.0% or 401 individuals in the labor force. Within the labor force, the 30 to 34 years age range has the highest percentage of unemployed individuals, with 70.0% or 42 of them being unemployed.
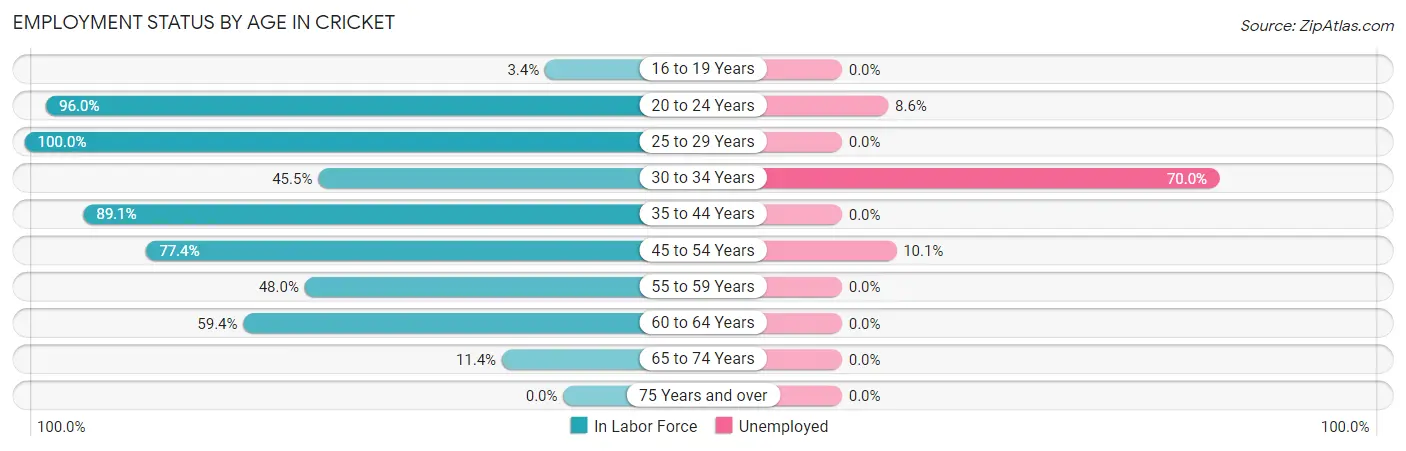
| Age Bracket | In Labor Force | Unemployed |
| 16 to 19 Years | 6 (3.4%) | 0 (0.0%) |
| 20 to 24 Years | 291 (96.0%) | 25 (8.6%) |
| 25 to 29 Years | 401 (100.0%) | 0 (0.0%) |
| 30 to 34 Years | 60 (45.5%) | 42 (70.0%) |
| 35 to 44 Years | 188 (89.1%) | 0 (0.0%) |
| 45 to 54 Years | 168 (77.4%) | 17 (10.1%) |
| 55 to 59 Years | 48 (48.0%) | 0 (0.0%) |
| 60 to 64 Years | 38 (59.4%) | 0 (0.0%) |
| 65 to 74 Years | 29 (11.4%) | 0 (0.0%) |
| 75 Years and over | 0 (0.0%) | 0 (0.0%) |
| Total | 1,229 (62.4%) | 84 (6.8%) |
Employment Status by Educational Attainment in Cricket
According to labor force statistics for Cricket, 80.3% of individuals (903) out of the total population between 25 and 64 years of age (1,125) are in the labor force, with 6.5% or 59 of them being unemployed. The group with the highest labor force participation rate are those with the educational attainment of college / associate degree, with 94.2% or 162 individuals in the labor force. Within the labor force, individuals with less than high school education have the highest percentage of unemployment, with 27.1% or 42 of them being unemployed.
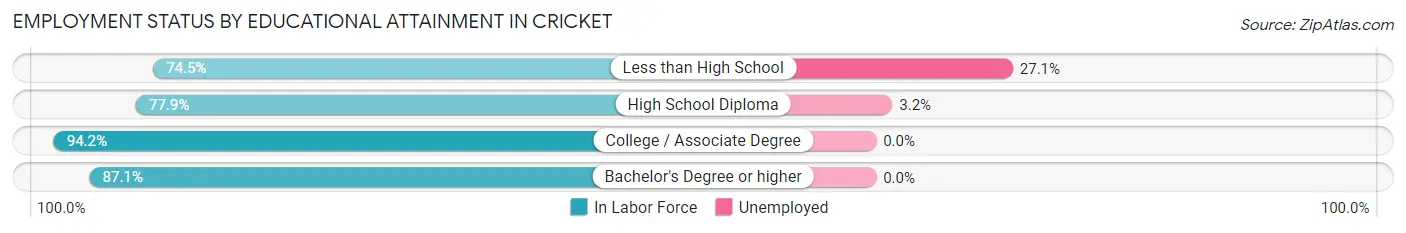
| Educational Attainment | In Labor Force | Unemployed |
| Less than High School | 155 (74.5%) | 56 (27.1%) |
| High School Diploma | 532 (77.9%) | 22 (3.2%) |
| College / Associate Degree | 162 (94.2%) | 0 (0.0%) |
| Bachelor's Degree or higher | 54 (87.1%) | 0 (0.0%) |
| Total | 903 (80.3%) | 73 (6.5%) |
Employment Occupations by Sex in Cricket
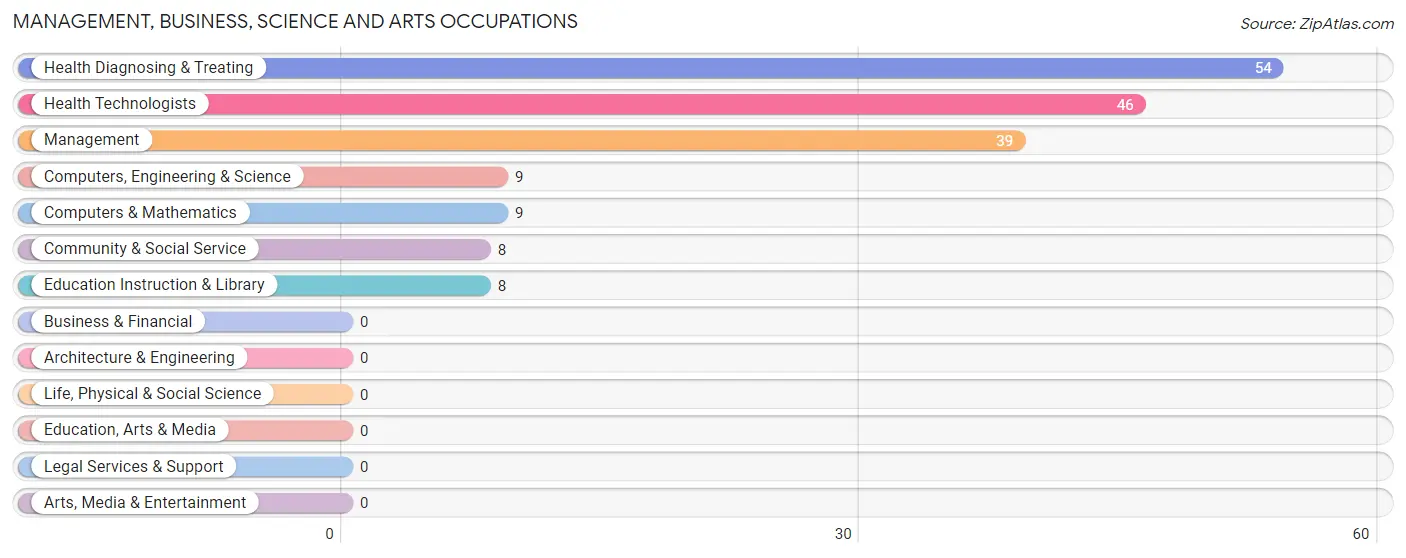
Management, Business, Science and Arts Occupations
The most common Management, Business, Science and Arts occupations in Cricket are Health Diagnosing & Treating (54 | 4.7%), Health Technologists (46 | 4.0%), Management (39 | 3.4%), Computers, Engineering & Science (9 | 0.8%), and Computers & Mathematics (9 | 0.8%).
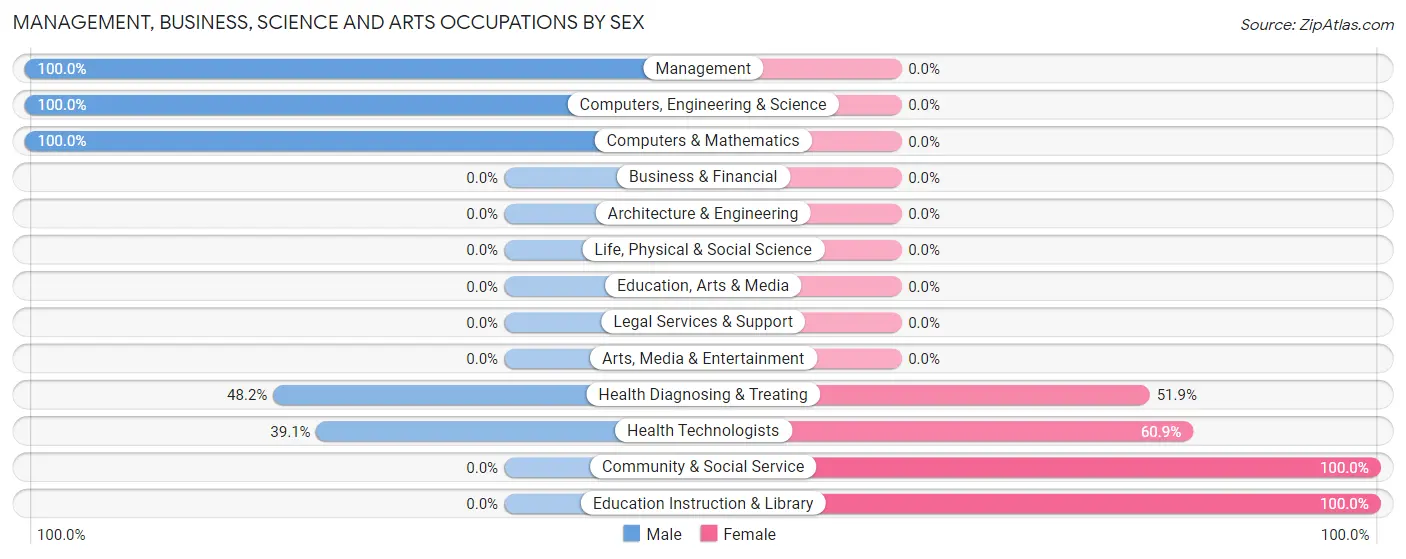
Management, Business, Science and Arts Occupations by Sex
Within the Management, Business, Science and Arts occupations in Cricket, the most male-oriented occupations are Management (100.0%), Computers, Engineering & Science (100.0%), and Computers & Mathematics (100.0%), while the most female-oriented occupations are Community & Social Service (100.0%), Education Instruction & Library (100.0%), and Health Technologists (60.9%).
| Occupation | Male | Female |
| Management | 39 (100.0%) | 0 (0.0%) |
| Business & Financial | 0 (0.0%) | 0 (0.0%) |
| Computers, Engineering & Science | 9 (100.0%) | 0 (0.0%) |
| Computers & Mathematics | 9 (100.0%) | 0 (0.0%) |
| Architecture & Engineering | 0 (0.0%) | 0 (0.0%) |
| Life, Physical & Social Science | 0 (0.0%) | 0 (0.0%) |
| Community & Social Service | 0 (0.0%) | 8 (100.0%) |
| Education, Arts & Media | 0 (0.0%) | 0 (0.0%) |
| Legal Services & Support | 0 (0.0%) | 0 (0.0%) |
| Education Instruction & Library | 0 (0.0%) | 8 (100.0%) |
| Arts, Media & Entertainment | 0 (0.0%) | 0 (0.0%) |
| Health Diagnosing & Treating | 26 (48.1%) | 28 (51.8%) |
| Health Technologists | 18 (39.1%) | 28 (60.9%) |
| Total (Category) | 74 (67.3%) | 36 (32.7%) |
| Total (Overall) | 637 (55.6%) | 508 (44.4%) |
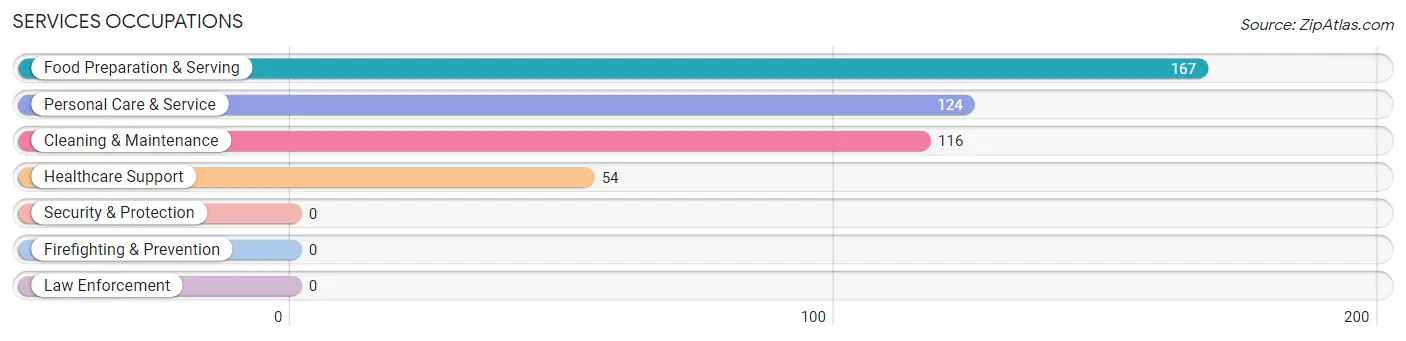
Services Occupations
The most common Services occupations in Cricket are Food Preparation & Serving (167 | 14.6%), Personal Care & Service (124 | 10.8%), Cleaning & Maintenance (116 | 10.1%), and Healthcare Support (54 | 4.7%).
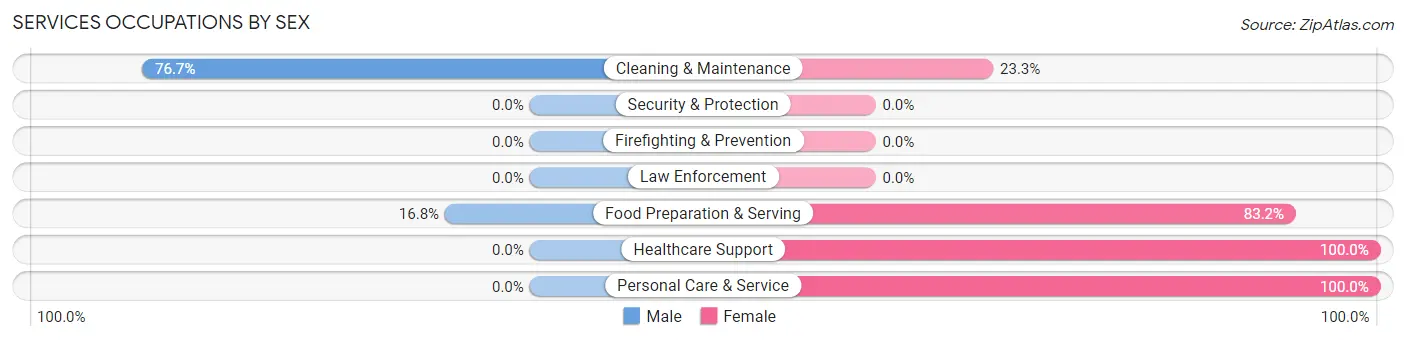
Services Occupations by Sex
Within the Services occupations in Cricket, the most male-oriented occupations are Cleaning & Maintenance (76.7%), and Food Preparation & Serving (16.8%), while the most female-oriented occupations are Healthcare Support (100.0%), Personal Care & Service (100.0%), and Food Preparation & Serving (83.2%).
| Occupation | Male | Female |
| Healthcare Support | 0 (0.0%) | 54 (100.0%) |
| Security & Protection | 0 (0.0%) | 0 (0.0%) |
| Firefighting & Prevention | 0 (0.0%) | 0 (0.0%) |
| Law Enforcement | 0 (0.0%) | 0 (0.0%) |
| Food Preparation & Serving | 28 (16.8%) | 139 (83.2%) |
| Cleaning & Maintenance | 89 (76.7%) | 27 (23.3%) |
| Personal Care & Service | 0 (0.0%) | 124 (100.0%) |
| Total (Category) | 117 (25.4%) | 344 (74.6%) |
| Total (Overall) | 637 (55.6%) | 508 (44.4%) |
Sales and Office Occupations
The most common Sales and Office occupations in Cricket are Sales & Related (129 | 11.3%), and Office & Administration (40 | 3.5%).
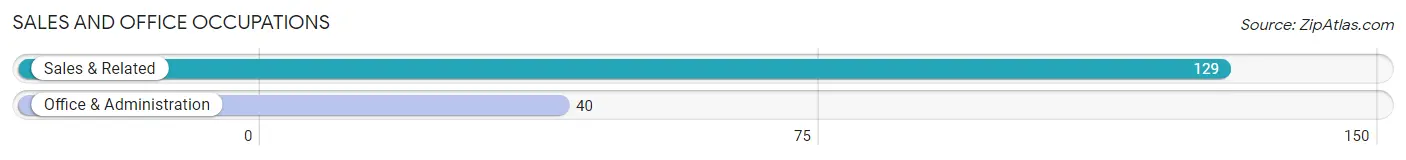
Sales and Office Occupations by Sex
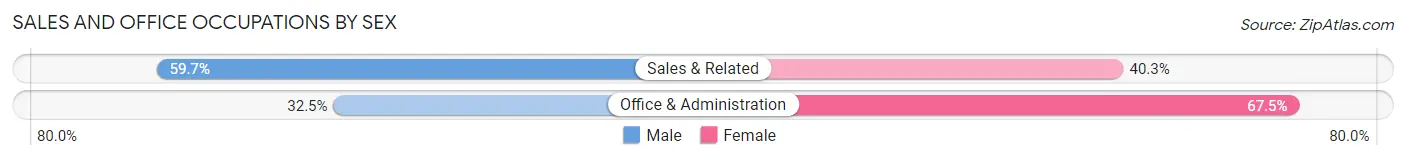
| Occupation | Male | Female |
| Sales & Related | 77 (59.7%) | 52 (40.3%) |
| Office & Administration | 13 (32.5%) | 27 (67.5%) |
| Total (Category) | 90 (53.2%) | 79 (46.8%) |
| Total (Overall) | 637 (55.6%) | 508 (44.4%) |
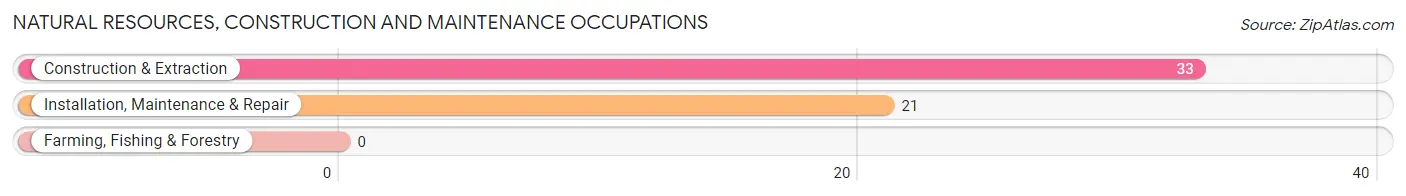
Natural Resources, Construction and Maintenance Occupations
The most common Natural Resources, Construction and Maintenance occupations in Cricket are Construction & Extraction (33 | 2.9%), and Installation, Maintenance & Repair (21 | 1.8%).
Natural Resources, Construction and Maintenance Occupations by Sex
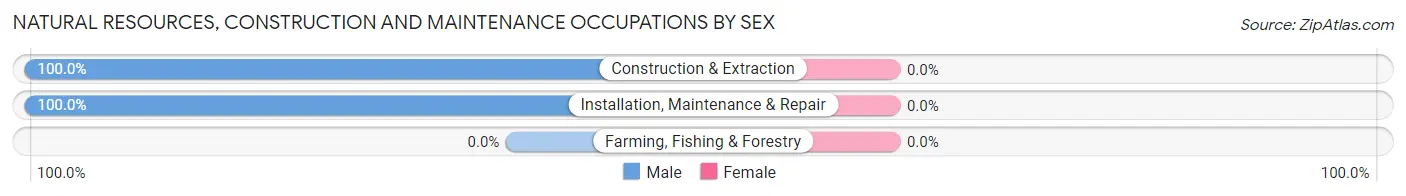
| Occupation | Male | Female |
| Farming, Fishing & Forestry | 0 (0.0%) | 0 (0.0%) |
| Construction & Extraction | 33 (100.0%) | 0 (0.0%) |
| Installation, Maintenance & Repair | 21 (100.0%) | 0 (0.0%) |
| Total (Category) | 54 (100.0%) | 0 (0.0%) |
| Total (Overall) | 637 (55.6%) | 508 (44.4%) |
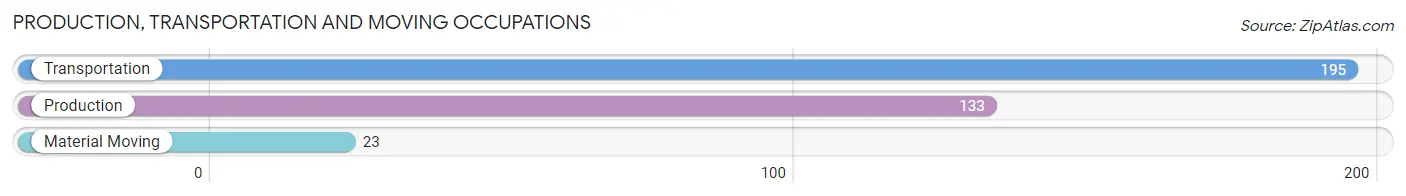
Production, Transportation and Moving Occupations
The most common Production, Transportation and Moving occupations in Cricket are Transportation (195 | 17.0%), Production (133 | 11.6%), and Material Moving (23 | 2.0%).
Production, Transportation and Moving Occupations by Sex
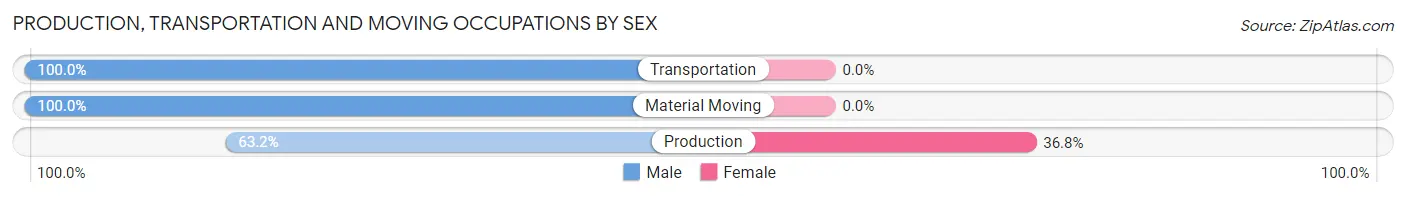
| Occupation | Male | Female |
| Production | 84 (63.2%) | 49 (36.8%) |
| Transportation | 195 (100.0%) | 0 (0.0%) |
| Material Moving | 23 (100.0%) | 0 (0.0%) |
| Total (Category) | 302 (86.0%) | 49 (14.0%) |
| Total (Overall) | 637 (55.6%) | 508 (44.4%) |
Employment Industries by Sex in Cricket
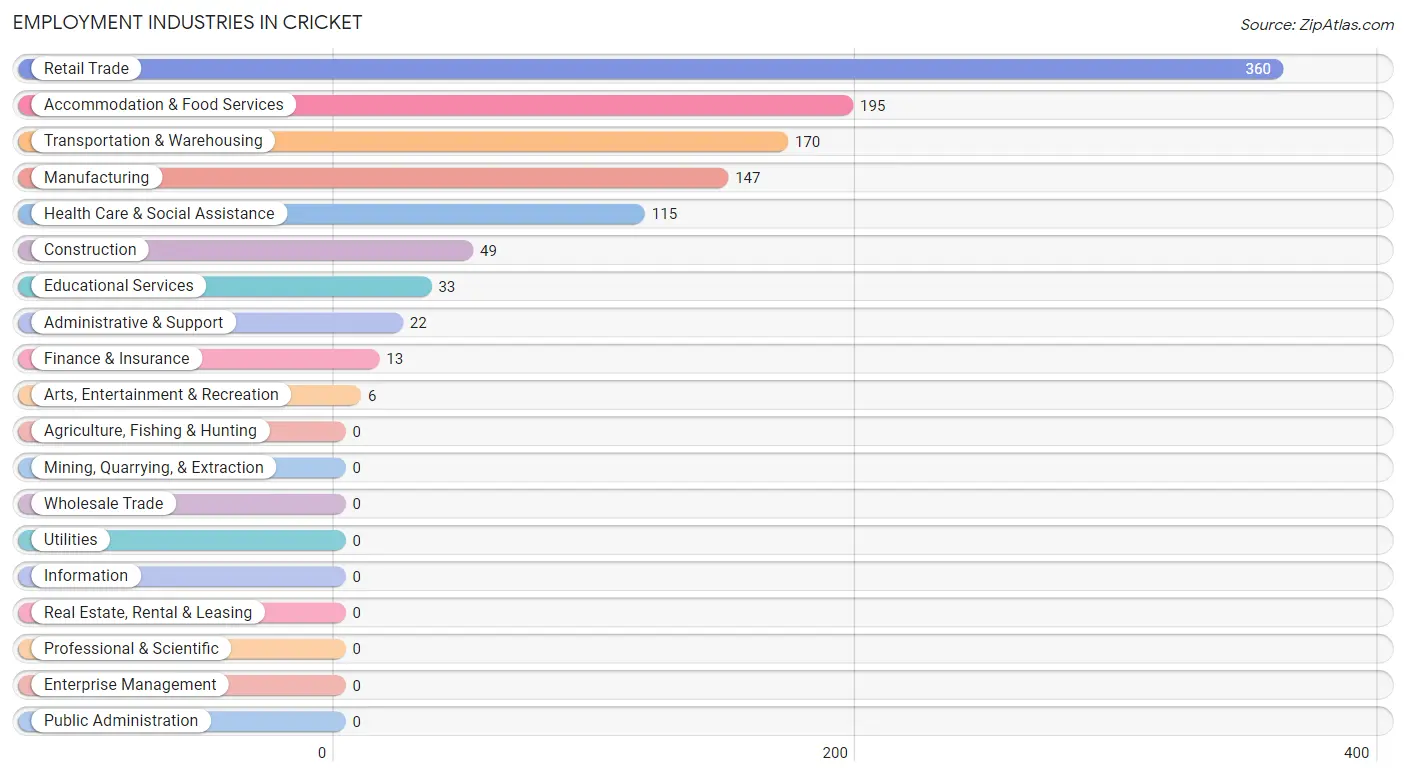
Employment Industries in Cricket
The major employment industries in Cricket include Retail Trade (360 | 31.4%), Accommodation & Food Services (195 | 17.0%), Transportation & Warehousing (170 | 14.8%), Manufacturing (147 | 12.8%), and Health Care & Social Assistance (115 | 10.0%).
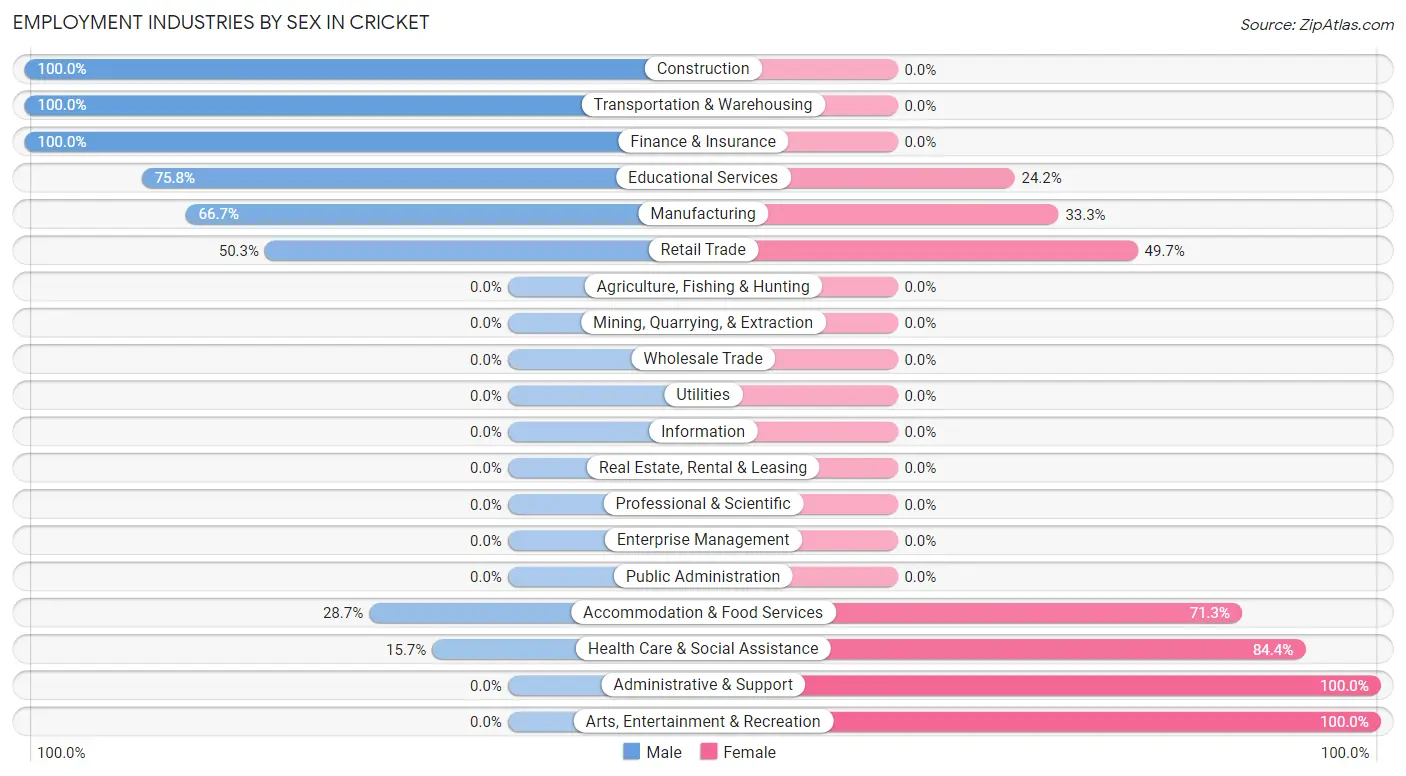
Employment Industries by Sex in Cricket
The Cricket industries that see more men than women are Construction (100.0%), Transportation & Warehousing (100.0%), and Finance & Insurance (100.0%), whereas the industries that tend to have a higher number of women are Administrative & Support (100.0%), Arts, Entertainment & Recreation (100.0%), and Health Care & Social Assistance (84.4%).
| Industry | Male | Female |
| Agriculture, Fishing & Hunting | 0 (0.0%) | 0 (0.0%) |
| Mining, Quarrying, & Extraction | 0 (0.0%) | 0 (0.0%) |
| Construction | 49 (100.0%) | 0 (0.0%) |
| Manufacturing | 98 (66.7%) | 49 (33.3%) |
| Wholesale Trade | 0 (0.0%) | 0 (0.0%) |
| Retail Trade | 181 (50.3%) | 179 (49.7%) |
| Transportation & Warehousing | 170 (100.0%) | 0 (0.0%) |
| Utilities | 0 (0.0%) | 0 (0.0%) |
| Information | 0 (0.0%) | 0 (0.0%) |
| Finance & Insurance | 13 (100.0%) | 0 (0.0%) |
| Real Estate, Rental & Leasing | 0 (0.0%) | 0 (0.0%) |
| Professional & Scientific | 0 (0.0%) | 0 (0.0%) |
| Enterprise Management | 0 (0.0%) | 0 (0.0%) |
| Administrative & Support | 0 (0.0%) | 22 (100.0%) |
| Educational Services | 25 (75.8%) | 8 (24.2%) |
| Health Care & Social Assistance | 18 (15.7%) | 97 (84.4%) |
| Arts, Entertainment & Recreation | 0 (0.0%) | 6 (100.0%) |
| Accommodation & Food Services | 56 (28.7%) | 139 (71.3%) |
| Public Administration | 0 (0.0%) | 0 (0.0%) |
| Total | 637 (55.6%) | 508 (44.4%) |
Education in Cricket
School Enrollment in Cricket
The most common levels of schooling among the 807 students in Cricket are college / undergraduate (277 | 34.3%), high school (228 | 28.2%), and elementary school (169 | 20.9%).
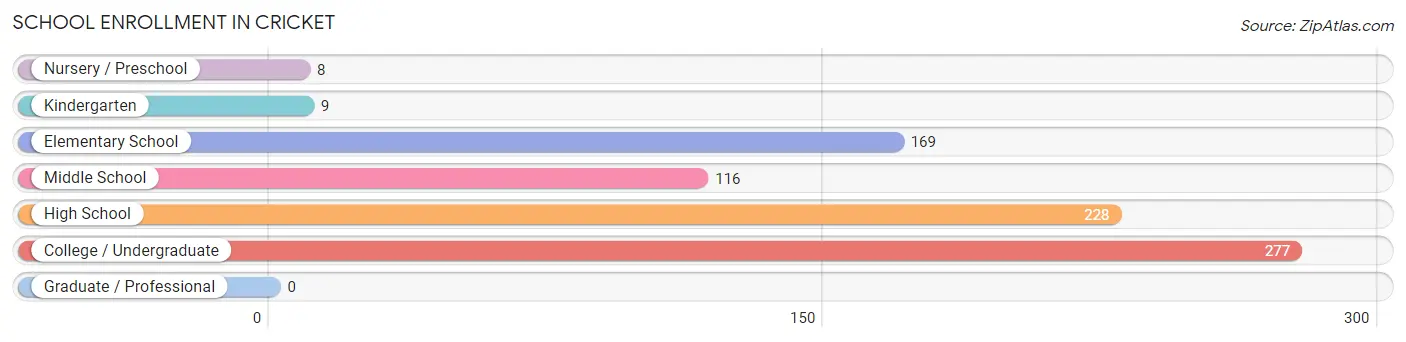
| School Level | # Students | % Students |
| Nursery / Preschool | 8 | 1.0% |
| Kindergarten | 9 | 1.1% |
| Elementary School | 169 | 20.9% |
| Middle School | 116 | 14.4% |
| High School | 228 | 28.2% |
| College / Undergraduate | 277 | 34.3% |
| Graduate / Professional | 0 | 0.0% |
| Total | 807 | 100.0% |
School Enrollment by Age by Funding Source in Cricket
Out of a total of 807 students who are enrolled in schools in Cricket, 39 (4.8%) attend a private institution, while the remaining 768 (95.2%) are enrolled in public schools. The age group of 35 years and over has the highest likelihood of being enrolled in private schools, with 8 (32.0% in the age bracket) enrolled. Conversely, the age group of 3 to 4 year olds has the lowest likelihood of being enrolled in a private school, with 8 (100.0% in the age bracket) attending a public institution.
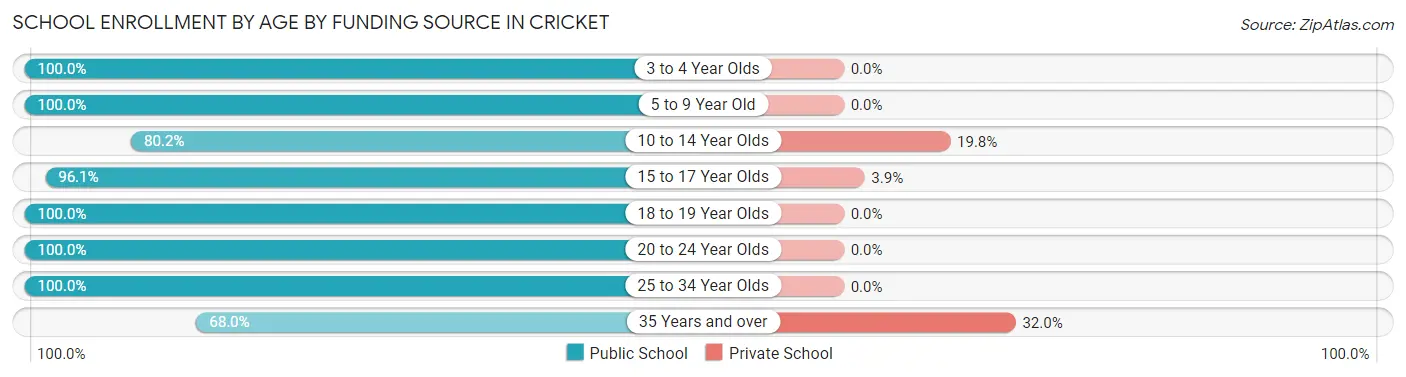
| Age Bracket | Public School | Private School |
| 3 to 4 Year Olds | 8 (100.0%) | 0 (0.0%) |
| 5 to 9 Year Old | 178 (100.0%) | 0 (0.0%) |
| 10 to 14 Year Olds | 93 (80.2%) | 23 (19.8%) |
| 15 to 17 Year Olds | 199 (96.1%) | 8 (3.9%) |
| 18 to 19 Year Olds | 37 (100.0%) | 0 (0.0%) |
| 20 to 24 Year Olds | 217 (100.0%) | 0 (0.0%) |
| 25 to 34 Year Olds | 19 (100.0%) | 0 (0.0%) |
| 35 Years and over | 17 (68.0%) | 8 (32.0%) |
| Total | 768 (95.2%) | 39 (4.8%) |
Educational Attainment by Field of Study in Cricket
Bio, nature & agricultural (65 | 29.0%), education (60 | 26.8%), science & technology (23 | 10.3%), communications (23 | 10.3%), and engineering (22 | 9.8%) are the most common fields of study among 224 individuals in Cricket who have obtained a bachelor's degree or higher.
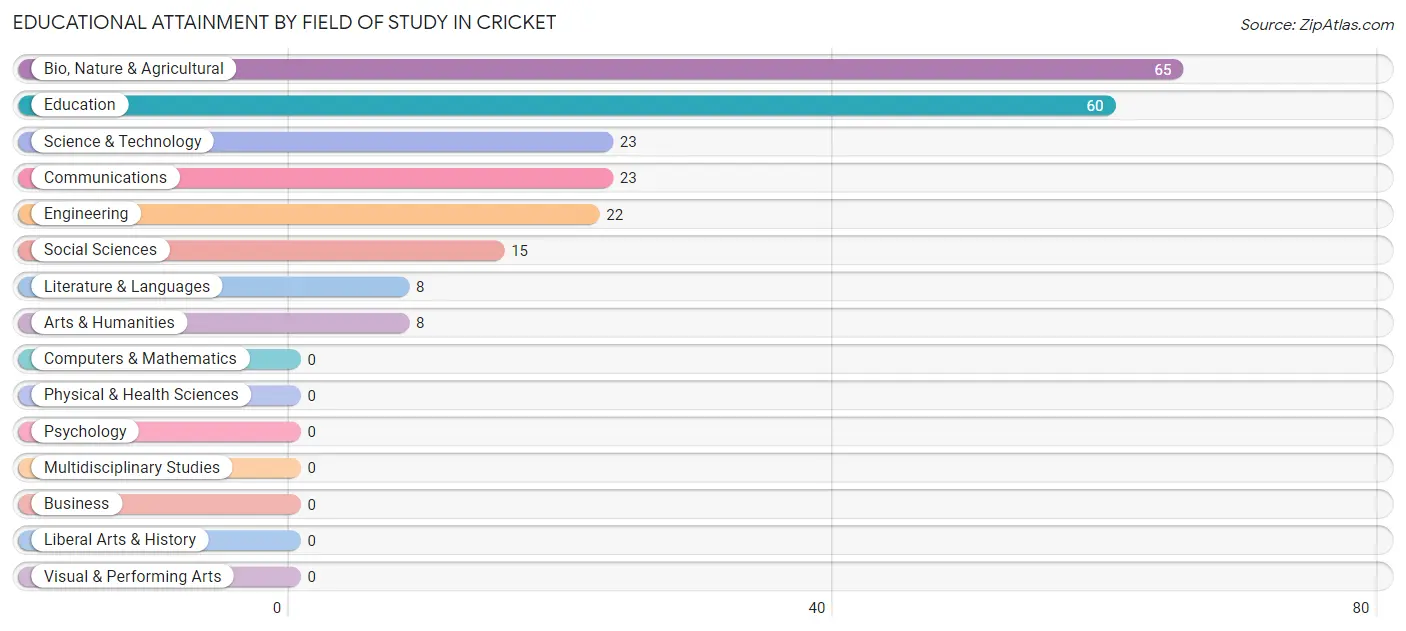
| Field of Study | # Graduates | % Graduates |
| Computers & Mathematics | 0 | 0.0% |
| Bio, Nature & Agricultural | 65 | 29.0% |
| Physical & Health Sciences | 0 | 0.0% |
| Psychology | 0 | 0.0% |
| Social Sciences | 15 | 6.7% |
| Engineering | 22 | 9.8% |
| Multidisciplinary Studies | 0 | 0.0% |
| Science & Technology | 23 | 10.3% |
| Business | 0 | 0.0% |
| Education | 60 | 26.8% |
| Literature & Languages | 8 | 3.6% |
| Liberal Arts & History | 0 | 0.0% |
| Visual & Performing Arts | 0 | 0.0% |
| Communications | 23 | 10.3% |
| Arts & Humanities | 8 | 3.6% |
| Total | 224 | 100.0% |
Transportation & Commute in Cricket
Vehicle Availability by Sex in Cricket
The most prevalent vehicle ownership categories in Cricket are males with 2 vehicles (343, accounting for 56.0%) and females with 2 vehicles (346, making up 67.5%).
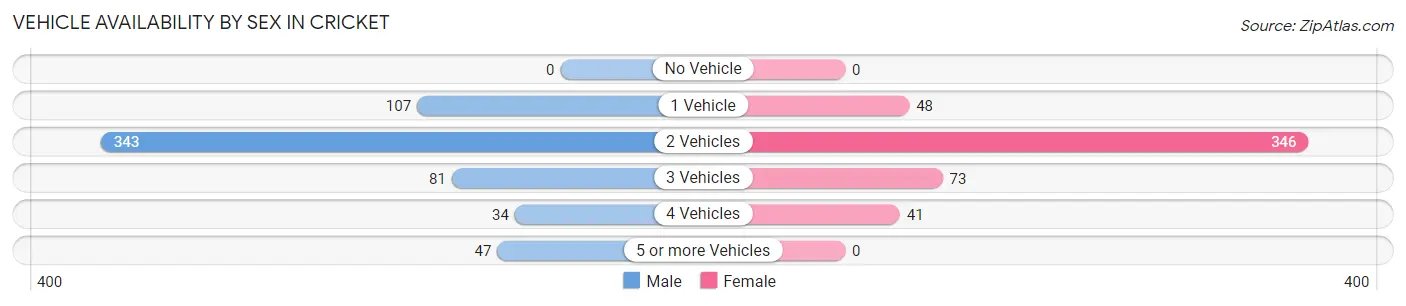
| Vehicles Available | Male | Female |
| No Vehicle | 0 (0.0%) | 0 (0.0%) |
| 1 Vehicle | 107 (17.5%) | 48 (9.5%) |
| 2 Vehicles | 343 (56.0%) | 346 (68.1%) |
| 3 Vehicles | 81 (13.2%) | 73 (14.4%) |
| 4 Vehicles | 34 (5.6%) | 41 (8.1%) |
| 5 or more Vehicles | 47 (7.7%) | 0 (0.0%) |
| Total | 612 (100.0%) | 508 (100.0%) |
Commute Time in Cricket
The most frequently occuring commute durations in Cricket are 15 to 19 minutes (352 commuters, 31.6%), 30 to 34 minutes (225 commuters, 20.2%), and 5 to 9 minutes (216 commuters, 19.4%).
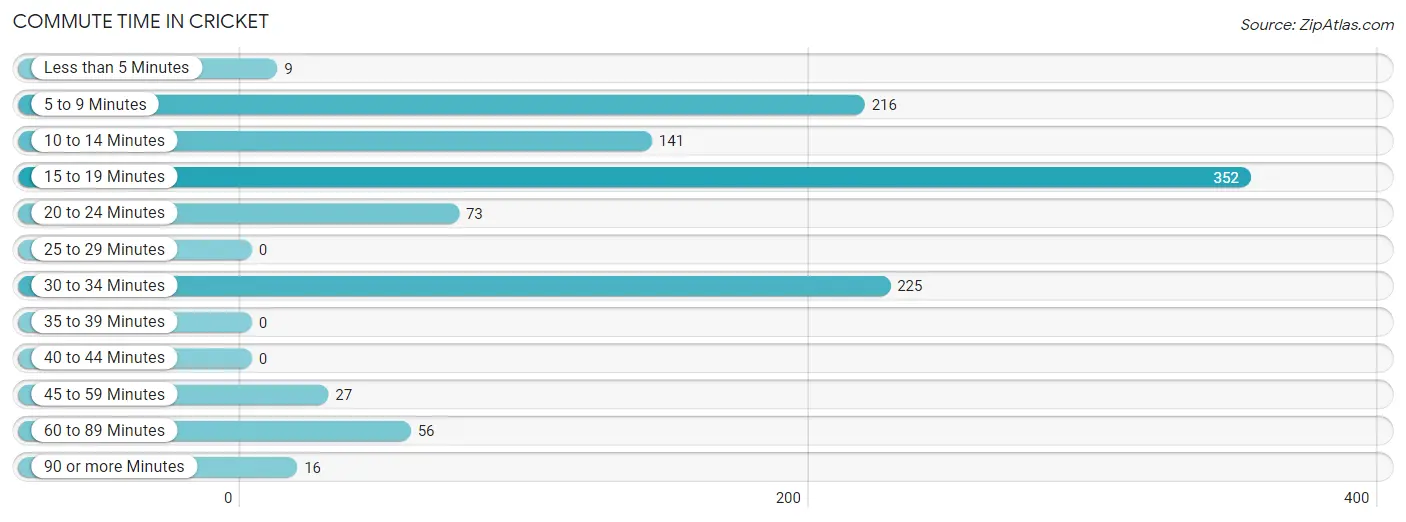
| Commute Time | # Commuters | % Commuters |
| Less than 5 Minutes | 9 | 0.8% |
| 5 to 9 Minutes | 216 | 19.4% |
| 10 to 14 Minutes | 141 | 12.7% |
| 15 to 19 Minutes | 352 | 31.6% |
| 20 to 24 Minutes | 73 | 6.6% |
| 25 to 29 Minutes | 0 | 0.0% |
| 30 to 34 Minutes | 225 | 20.2% |
| 35 to 39 Minutes | 0 | 0.0% |
| 40 to 44 Minutes | 0 | 0.0% |
| 45 to 59 Minutes | 27 | 2.4% |
| 60 to 89 Minutes | 56 | 5.0% |
| 90 or more Minutes | 16 | 1.4% |
Commute Time by Sex in Cricket
The most common commute times in Cricket are 30 to 34 minutes (203 commuters, 33.4%) for males and 15 to 19 minutes (159 commuters, 31.3%) for females.
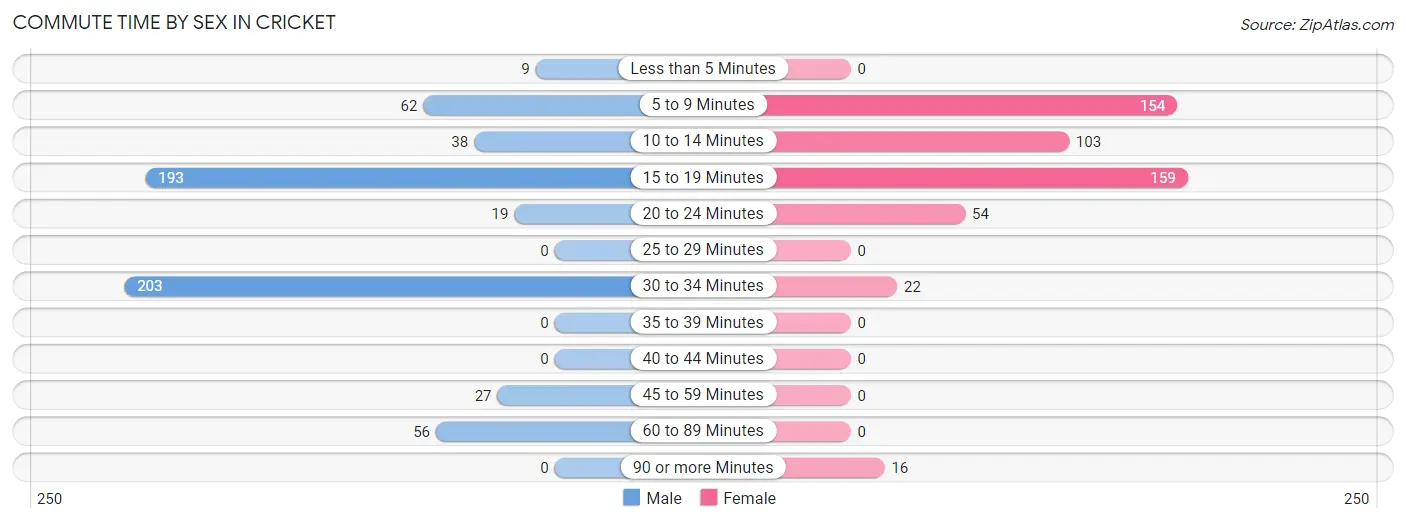
| Commute Time | Male | Female |
| Less than 5 Minutes | 9 (1.5%) | 0 (0.0%) |
| 5 to 9 Minutes | 62 (10.2%) | 154 (30.3%) |
| 10 to 14 Minutes | 38 (6.3%) | 103 (20.3%) |
| 15 to 19 Minutes | 193 (31.8%) | 159 (31.3%) |
| 20 to 24 Minutes | 19 (3.1%) | 54 (10.6%) |
| 25 to 29 Minutes | 0 (0.0%) | 0 (0.0%) |
| 30 to 34 Minutes | 203 (33.4%) | 22 (4.3%) |
| 35 to 39 Minutes | 0 (0.0%) | 0 (0.0%) |
| 40 to 44 Minutes | 0 (0.0%) | 0 (0.0%) |
| 45 to 59 Minutes | 27 (4.4%) | 0 (0.0%) |
| 60 to 89 Minutes | 56 (9.2%) | 0 (0.0%) |
| 90 or more Minutes | 0 (0.0%) | 16 (3.2%) |
Time of Departure to Work by Sex in Cricket
The most frequent times of departure to work in Cricket are 5:30 AM to 5:59 AM (154, 25.4%) for males and 12:00 AM to 4:59 AM (166, 32.7%) for females.
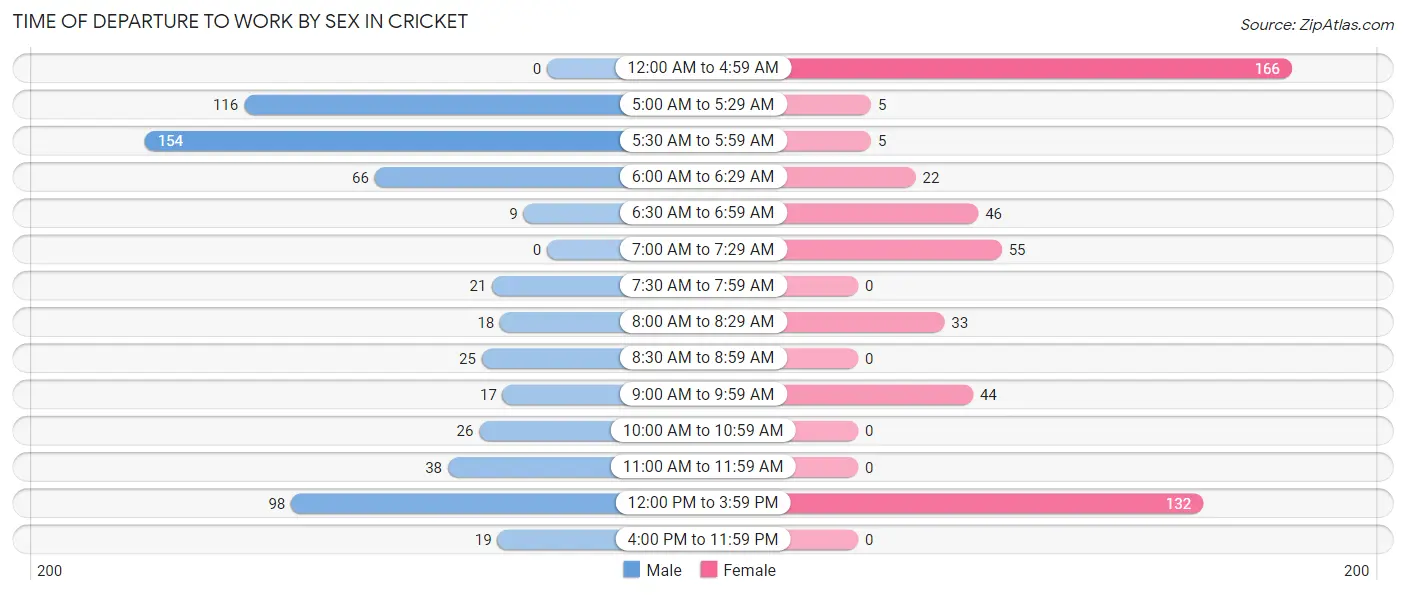
| Time of Departure | Male | Female |
| 12:00 AM to 4:59 AM | 0 (0.0%) | 166 (32.7%) |
| 5:00 AM to 5:29 AM | 116 (19.1%) | 5 (1.0%) |
| 5:30 AM to 5:59 AM | 154 (25.4%) | 5 (1.0%) |
| 6:00 AM to 6:29 AM | 66 (10.9%) | 22 (4.3%) |
| 6:30 AM to 6:59 AM | 9 (1.5%) | 46 (9.1%) |
| 7:00 AM to 7:29 AM | 0 (0.0%) | 55 (10.8%) |
| 7:30 AM to 7:59 AM | 21 (3.5%) | 0 (0.0%) |
| 8:00 AM to 8:29 AM | 18 (3.0%) | 33 (6.5%) |
| 8:30 AM to 8:59 AM | 25 (4.1%) | 0 (0.0%) |
| 9:00 AM to 9:59 AM | 17 (2.8%) | 44 (8.7%) |
| 10:00 AM to 10:59 AM | 26 (4.3%) | 0 (0.0%) |
| 11:00 AM to 11:59 AM | 38 (6.3%) | 0 (0.0%) |
| 12:00 PM to 3:59 PM | 98 (16.1%) | 132 (26.0%) |
| 4:00 PM to 11:59 PM | 19 (3.1%) | 0 (0.0%) |
| Total | 607 (100.0%) | 508 (100.0%) |
Housing Occupancy in Cricket
Occupancy by Ownership in Cricket
Of the total 854 dwellings in Cricket, owner-occupied units account for 436 (51.0%), while renter-occupied units make up 418 (48.9%).
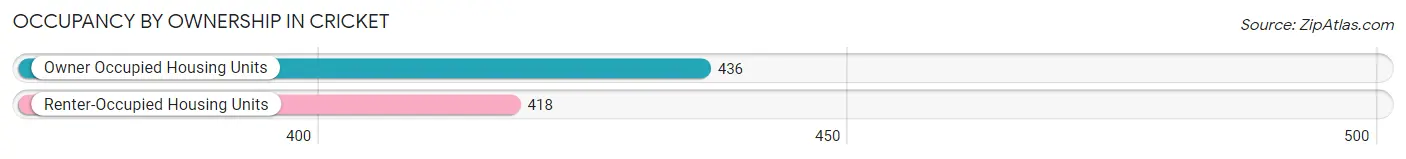
| Occupancy | # Housing Units | % Housing Units |
| Owner Occupied Housing Units | 436 | 51.0% |
| Renter-Occupied Housing Units | 418 | 48.9% |
| Total Occupied Housing Units | 854 | 100.0% |
Occupancy by Household Size in Cricket
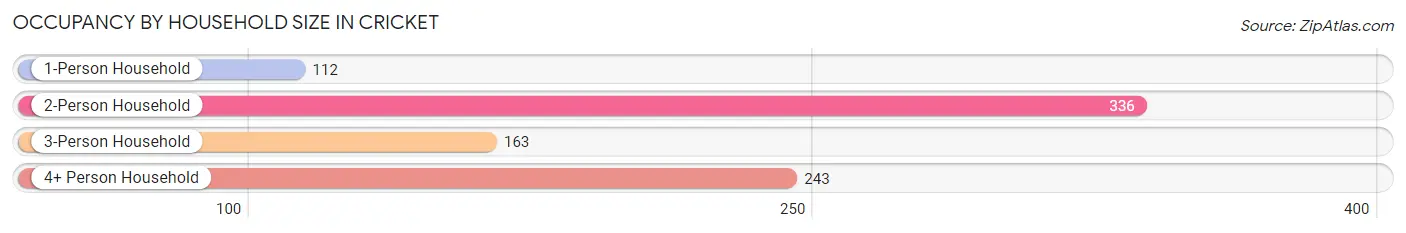
| Household Size | # Housing Units | % Housing Units |
| 1-Person Household | 112 | 13.1% |
| 2-Person Household | 336 | 39.3% |
| 3-Person Household | 163 | 19.1% |
| 4+ Person Household | 243 | 28.4% |
| Total Housing Units | 854 | 100.0% |
Occupancy by Ownership by Household Size in Cricket
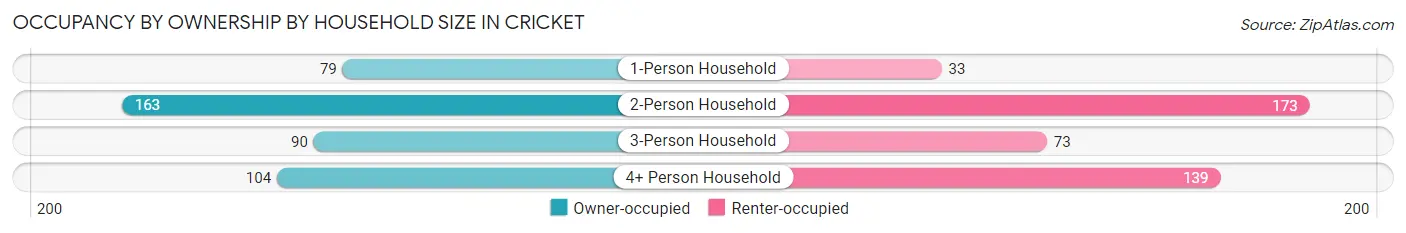
| Household Size | Owner-occupied | Renter-occupied |
| 1-Person Household | 79 (70.5%) | 33 (29.5%) |
| 2-Person Household | 163 (48.5%) | 173 (51.5%) |
| 3-Person Household | 90 (55.2%) | 73 (44.8%) |
| 4+ Person Household | 104 (42.8%) | 139 (57.2%) |
| Total Housing Units | 436 (51.0%) | 418 (48.9%) |
Occupancy by Educational Attainment in Cricket
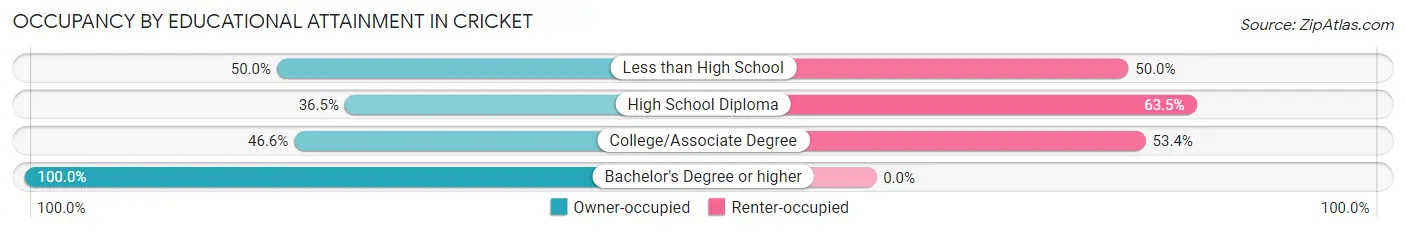
| Household Size | Owner-occupied | Renter-occupied |
| Less than High School | 65 (50.0%) | 65 (50.0%) |
| High School Diploma | 118 (36.5%) | 205 (63.5%) |
| College/Associate Degree | 129 (46.6%) | 148 (53.4%) |
| Bachelor's Degree or higher | 124 (100.0%) | 0 (0.0%) |
Occupancy by Age of Householder in Cricket
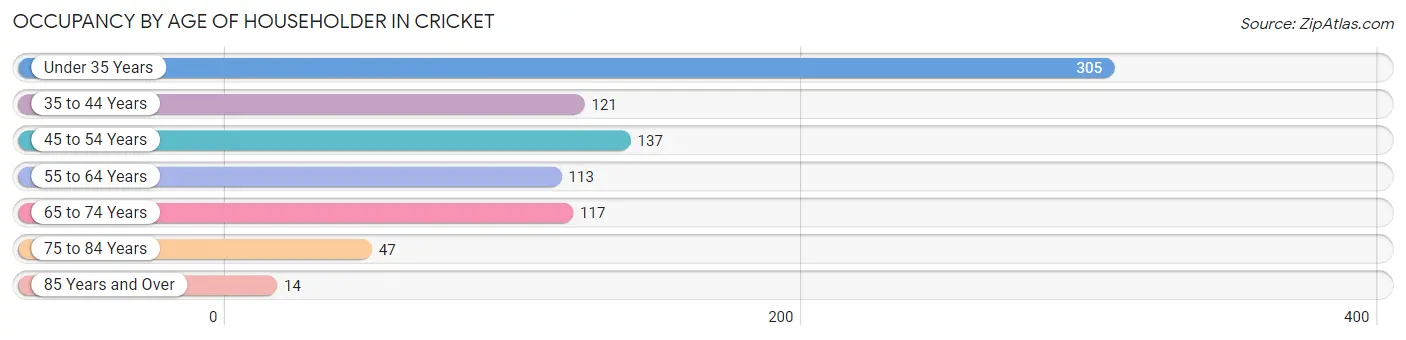
| Age Bracket | # Households | % Households |
| Under 35 Years | 305 | 35.7% |
| 35 to 44 Years | 121 | 14.2% |
| 45 to 54 Years | 137 | 16.0% |
| 55 to 64 Years | 113 | 13.2% |
| 65 to 74 Years | 117 | 13.7% |
| 75 to 84 Years | 47 | 5.5% |
| 85 Years and Over | 14 | 1.6% |
| Total | 854 | 100.0% |
Housing Finances in Cricket
Median Income by Occupancy in Cricket
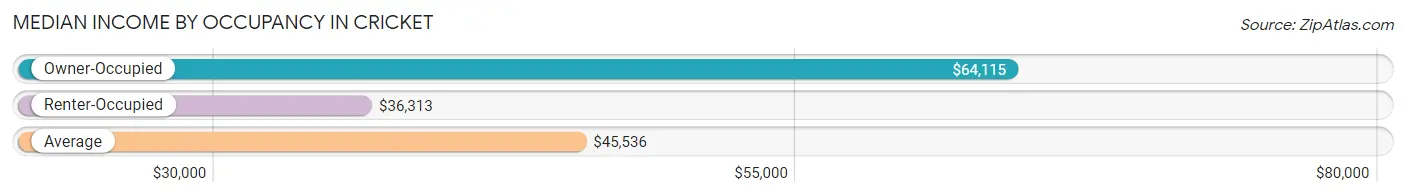
| Occupancy Type | # Households | Median Income |
| Owner-Occupied | 436 (51.0%) | $64,115 |
| Renter-Occupied | 418 (48.9%) | $36,313 |
| Average | 854 (100.0%) | $45,536 |
Occupancy by Householder Income Bracket in Cricket
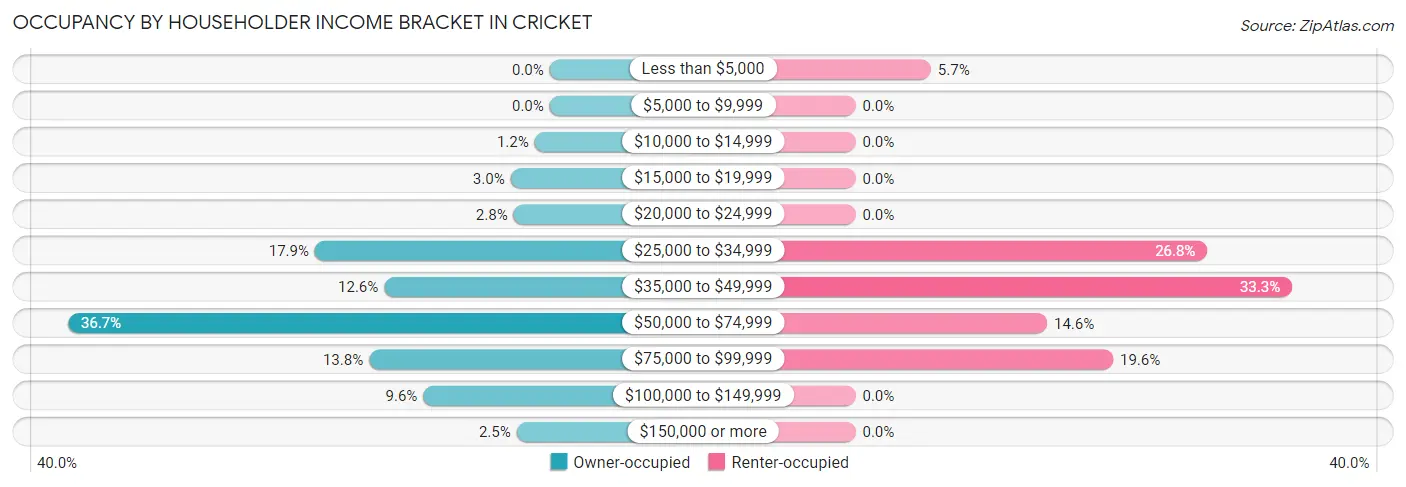
| Income Bracket | Owner-occupied | Renter-occupied |
| Less than $5,000 | 0 (0.0%) | 24 (5.7%) |
| $5,000 to $9,999 | 0 (0.0%) | 0 (0.0%) |
| $10,000 to $14,999 | 5 (1.1%) | 0 (0.0%) |
| $15,000 to $19,999 | 13 (3.0%) | 0 (0.0%) |
| $20,000 to $24,999 | 12 (2.8%) | 0 (0.0%) |
| $25,000 to $34,999 | 78 (17.9%) | 112 (26.8%) |
| $35,000 to $49,999 | 55 (12.6%) | 139 (33.3%) |
| $50,000 to $74,999 | 160 (36.7%) | 61 (14.6%) |
| $75,000 to $99,999 | 60 (13.8%) | 82 (19.6%) |
| $100,000 to $149,999 | 42 (9.6%) | 0 (0.0%) |
| $150,000 or more | 11 (2.5%) | 0 (0.0%) |
| Total | 436 (100.0%) | 418 (100.0%) |
Monthly Housing Cost Tiers in Cricket
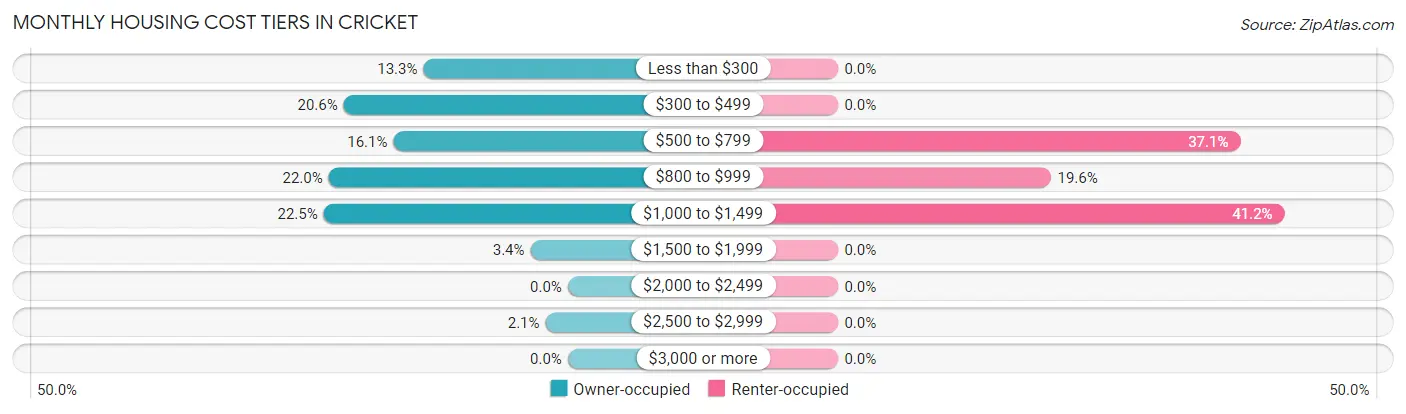
| Monthly Cost | Owner-occupied | Renter-occupied |
| Less than $300 | 58 (13.3%) | 0 (0.0%) |
| $300 to $499 | 90 (20.6%) | 0 (0.0%) |
| $500 to $799 | 70 (16.1%) | 155 (37.1%) |
| $800 to $999 | 96 (22.0%) | 82 (19.6%) |
| $1,000 to $1,499 | 98 (22.5%) | 172 (41.1%) |
| $1,500 to $1,999 | 15 (3.4%) | 0 (0.0%) |
| $2,000 to $2,499 | 0 (0.0%) | 0 (0.0%) |
| $2,500 to $2,999 | 9 (2.1%) | 0 (0.0%) |
| $3,000 or more | 0 (0.0%) | 0 (0.0%) |
| Total | 436 (100.0%) | 418 (100.0%) |
Physical Housing Characteristics in Cricket
Housing Structures in Cricket
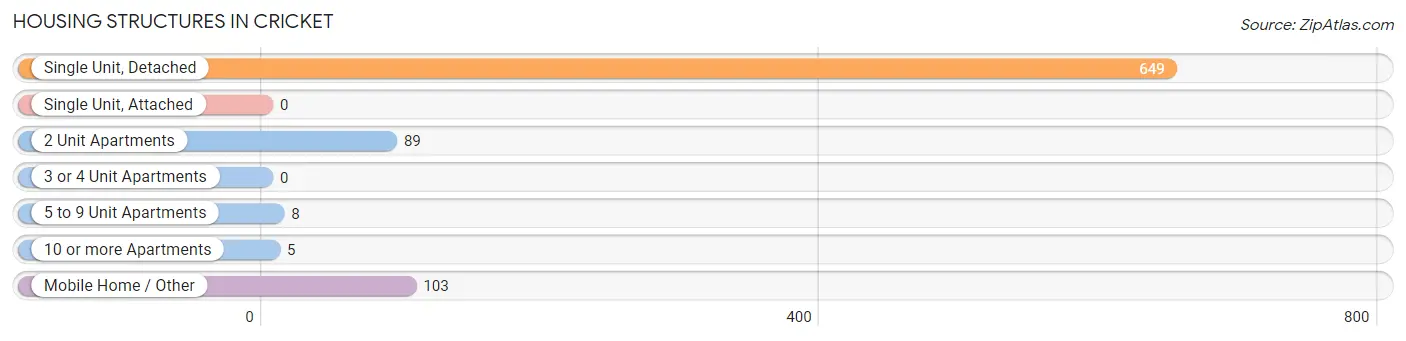
| Structure Type | # Housing Units | % Housing Units |
| Single Unit, Detached | 649 | 76.0% |
| Single Unit, Attached | 0 | 0.0% |
| 2 Unit Apartments | 89 | 10.4% |
| 3 or 4 Unit Apartments | 0 | 0.0% |
| 5 to 9 Unit Apartments | 8 | 0.9% |
| 10 or more Apartments | 5 | 0.6% |
| Mobile Home / Other | 103 | 12.1% |
| Total | 854 | 100.0% |
Housing Structures by Occupancy in Cricket
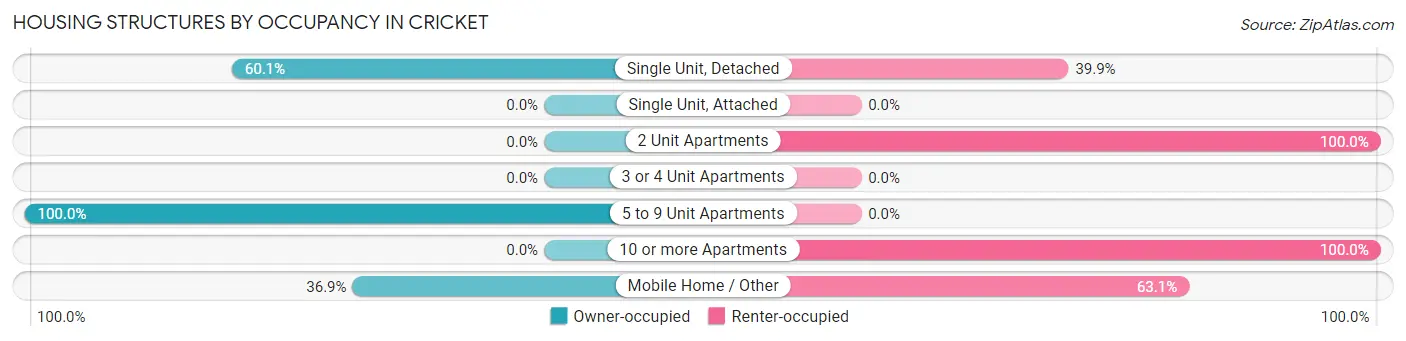
| Structure Type | Owner-occupied | Renter-occupied |
| Single Unit, Detached | 390 (60.1%) | 259 (39.9%) |
| Single Unit, Attached | 0 (0.0%) | 0 (0.0%) |
| 2 Unit Apartments | 0 (0.0%) | 89 (100.0%) |
| 3 or 4 Unit Apartments | 0 (0.0%) | 0 (0.0%) |
| 5 to 9 Unit Apartments | 8 (100.0%) | 0 (0.0%) |
| 10 or more Apartments | 0 (0.0%) | 5 (100.0%) |
| Mobile Home / Other | 38 (36.9%) | 65 (63.1%) |
| Total | 436 (51.0%) | 418 (48.9%) |
Housing Structures by Number of Rooms in Cricket
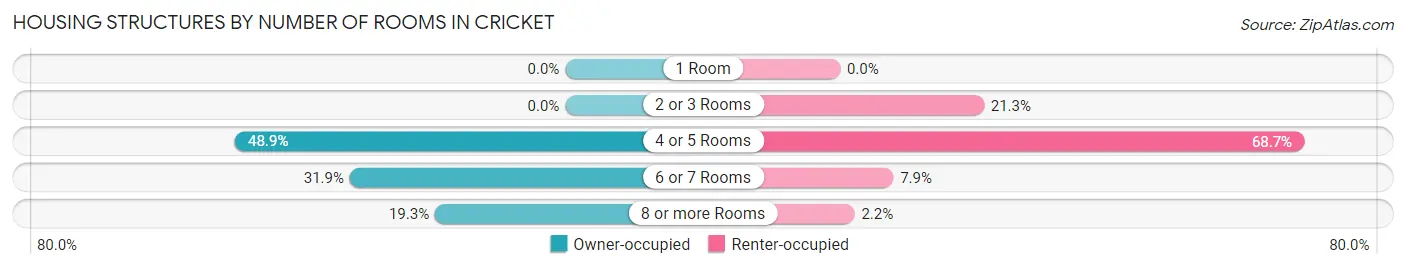
| Number of Rooms | Owner-occupied | Renter-occupied |
| 1 Room | 0 (0.0%) | 0 (0.0%) |
| 2 or 3 Rooms | 0 (0.0%) | 89 (21.3%) |
| 4 or 5 Rooms | 213 (48.8%) | 287 (68.7%) |
| 6 or 7 Rooms | 139 (31.9%) | 33 (7.9%) |
| 8 or more Rooms | 84 (19.3%) | 9 (2.1%) |
| Total | 436 (100.0%) | 418 (100.0%) |
Housing Structure by Heating Type in Cricket
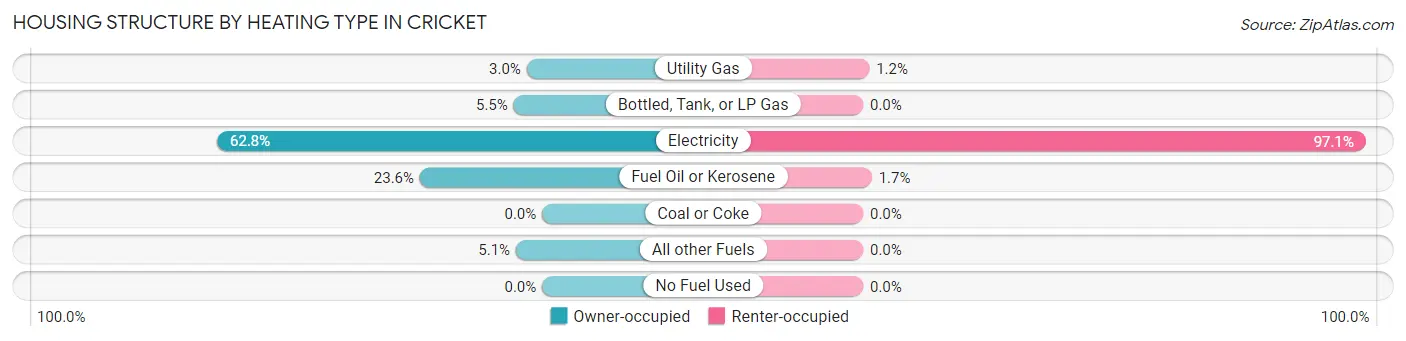
| Heating Type | Owner-occupied | Renter-occupied |
| Utility Gas | 13 (3.0%) | 5 (1.2%) |
| Bottled, Tank, or LP Gas | 24 (5.5%) | 0 (0.0%) |
| Electricity | 274 (62.8%) | 406 (97.1%) |
| Fuel Oil or Kerosene | 103 (23.6%) | 7 (1.7%) |
| Coal or Coke | 0 (0.0%) | 0 (0.0%) |
| All other Fuels | 22 (5.1%) | 0 (0.0%) |
| No Fuel Used | 0 (0.0%) | 0 (0.0%) |
| Total | 436 (100.0%) | 418 (100.0%) |
Household Vehicle Usage in Cricket
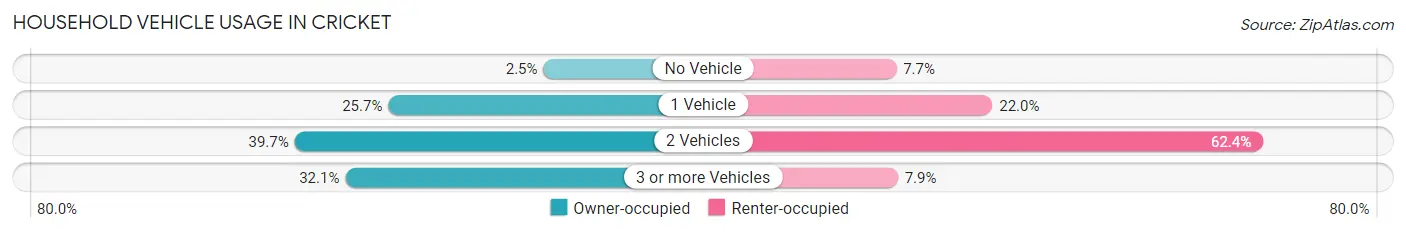
| Vehicles per Household | Owner-occupied | Renter-occupied |
| No Vehicle | 11 (2.5%) | 32 (7.7%) |
| 1 Vehicle | 112 (25.7%) | 92 (22.0%) |
| 2 Vehicles | 173 (39.7%) | 261 (62.4%) |
| 3 or more Vehicles | 140 (32.1%) | 33 (7.9%) |
| Total | 436 (100.0%) | 418 (100.0%) |
Real Estate & Mortgages in Cricket
Real Estate and Mortgage Overview in Cricket
| Characteristic | Without Mortgage | With Mortgage |
| Housing Units | 224 | 212 |
| Median Property Value | $113,600 | $149,600 |
| Median Household Income | - | - |
| Monthly Housing Costs | $390 | $0 |
| Real Estate Taxes | $863 | $0 |
Property Value by Mortgage Status in Cricket
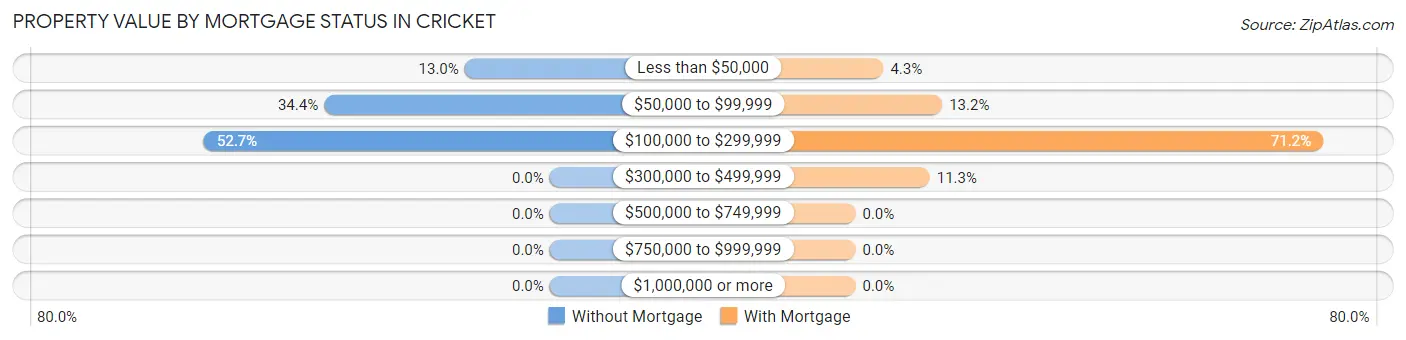
| Property Value | Without Mortgage | With Mortgage |
| Less than $50,000 | 29 (13.0%) | 9 (4.3%) |
| $50,000 to $99,999 | 77 (34.4%) | 28 (13.2%) |
| $100,000 to $299,999 | 118 (52.7%) | 151 (71.2%) |
| $300,000 to $499,999 | 0 (0.0%) | 24 (11.3%) |
| $500,000 to $749,999 | 0 (0.0%) | 0 (0.0%) |
| $750,000 to $999,999 | 0 (0.0%) | 0 (0.0%) |
| $1,000,000 or more | 0 (0.0%) | 0 (0.0%) |
| Total | 224 (100.0%) | 212 (100.0%) |
Household Income by Mortgage Status in Cricket
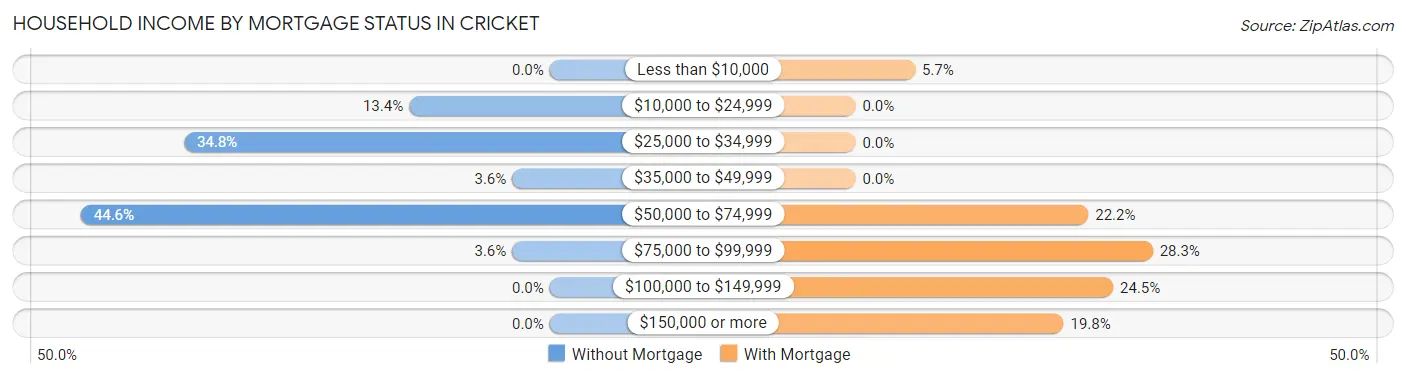
| Household Income | Without Mortgage | With Mortgage |
| Less than $10,000 | 0 (0.0%) | 12 (5.7%) |
| $10,000 to $24,999 | 30 (13.4%) | 0 (0.0%) |
| $25,000 to $34,999 | 78 (34.8%) | 0 (0.0%) |
| $35,000 to $49,999 | 8 (3.6%) | 0 (0.0%) |
| $50,000 to $74,999 | 100 (44.6%) | 47 (22.2%) |
| $75,000 to $99,999 | 8 (3.6%) | 60 (28.3%) |
| $100,000 to $149,999 | 0 (0.0%) | 52 (24.5%) |
| $150,000 or more | 0 (0.0%) | 42 (19.8%) |
| Total | 224 (100.0%) | 212 (100.0%) |
Property Value to Household Income Ratio in Cricket
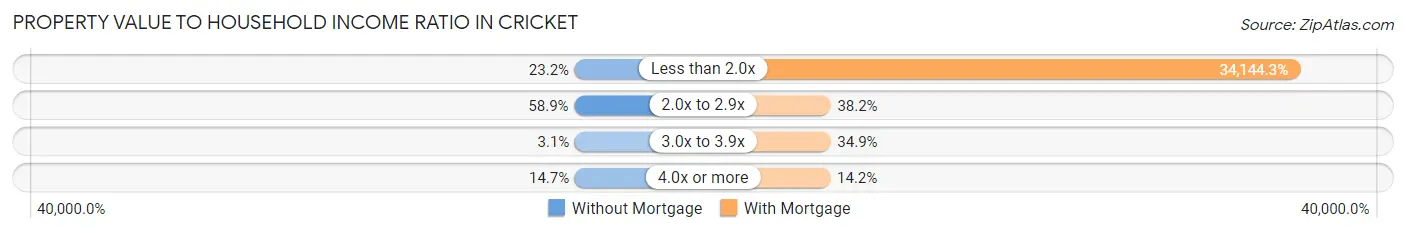
| Value-to-Income Ratio | Without Mortgage | With Mortgage |
| Less than 2.0x | 52 (23.2%) | 72,386 (34,144.3%) |
| 2.0x to 2.9x | 132 (58.9%) | 81 (38.2%) |
| 3.0x to 3.9x | 7 (3.1%) | 74 (34.9%) |
| 4.0x or more | 33 (14.7%) | 30 (14.1%) |
| Total | 224 (100.0%) | 212 (100.0%) |
Real Estate Taxes by Mortgage Status in Cricket
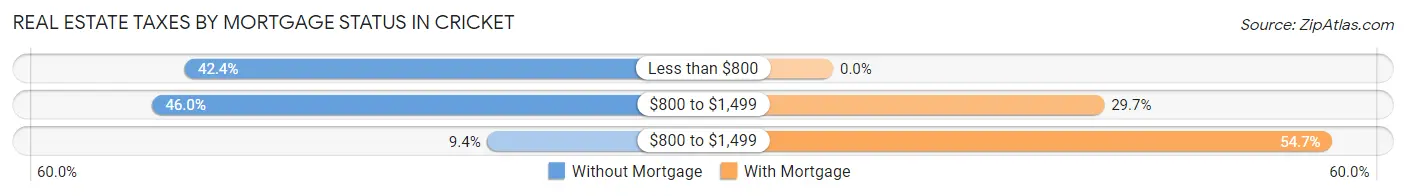
| Property Taxes | Without Mortgage | With Mortgage |
| Less than $800 | 95 (42.4%) | 0 (0.0%) |
| $800 to $1,499 | 103 (46.0%) | 63 (29.7%) |
| $800 to $1,499 | 21 (9.4%) | 116 (54.7%) |
| Total | 224 (100.0%) | 212 (100.0%) |
Health & Disability in Cricket
Health Insurance Coverage by Age in Cricket
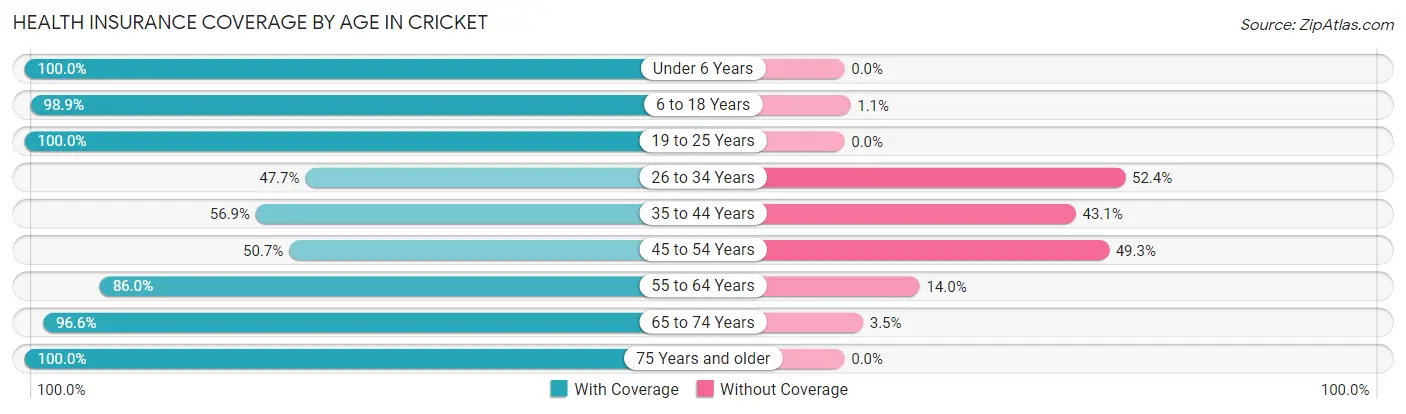
| Age Bracket | With Coverage | Without Coverage |
| Under 6 Years | 122 (100.0%) | 0 (0.0%) |
| 6 to 18 Years | 532 (98.9%) | 6 (1.1%) |
| 19 to 25 Years | 338 (100.0%) | 0 (0.0%) |
| 26 to 34 Years | 254 (47.6%) | 279 (52.3%) |
| 35 to 44 Years | 120 (56.9%) | 91 (43.1%) |
| 45 to 54 Years | 110 (50.7%) | 107 (49.3%) |
| 55 to 64 Years | 141 (86.0%) | 23 (14.0%) |
| 65 to 74 Years | 224 (96.6%) | 8 (3.5%) |
| 75 Years and older | 92 (100.0%) | 0 (0.0%) |
| Total | 1,933 (79.0%) | 514 (21.0%) |
Health Insurance Coverage by Citizenship Status in Cricket
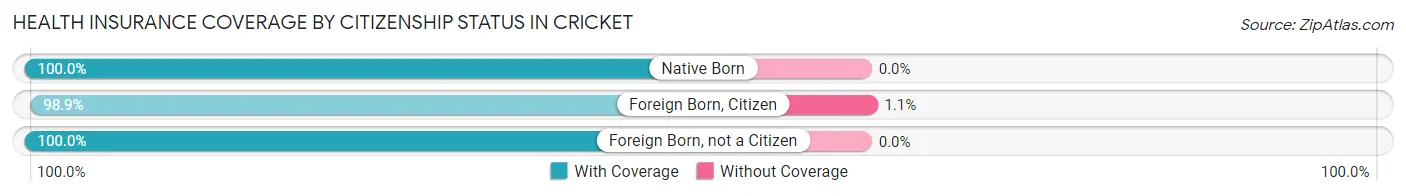
| Citizenship Status | With Coverage | Without Coverage |
| Native Born | 122 (100.0%) | 0 (0.0%) |
| Foreign Born, Citizen | 532 (98.9%) | 6 (1.1%) |
| Foreign Born, not a Citizen | 338 (100.0%) | 0 (0.0%) |
Health Insurance Coverage by Household Income in Cricket
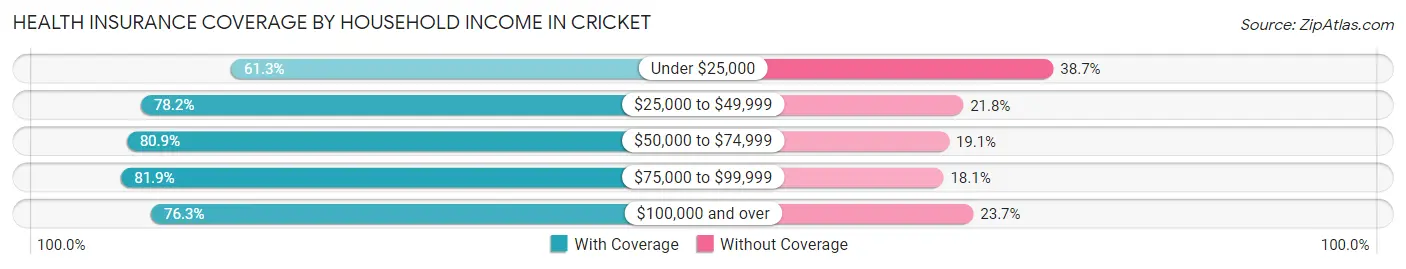
| Household Income | With Coverage | Without Coverage |
| Under $25,000 | 38 (61.3%) | 24 (38.7%) |
| $25,000 to $49,999 | 857 (78.2%) | 239 (21.8%) |
| $50,000 to $74,999 | 524 (80.9%) | 124 (19.1%) |
| $75,000 to $99,999 | 366 (81.9%) | 81 (18.1%) |
| $100,000 and over | 148 (76.3%) | 46 (23.7%) |
Public vs Private Health Insurance Coverage by Age in Cricket
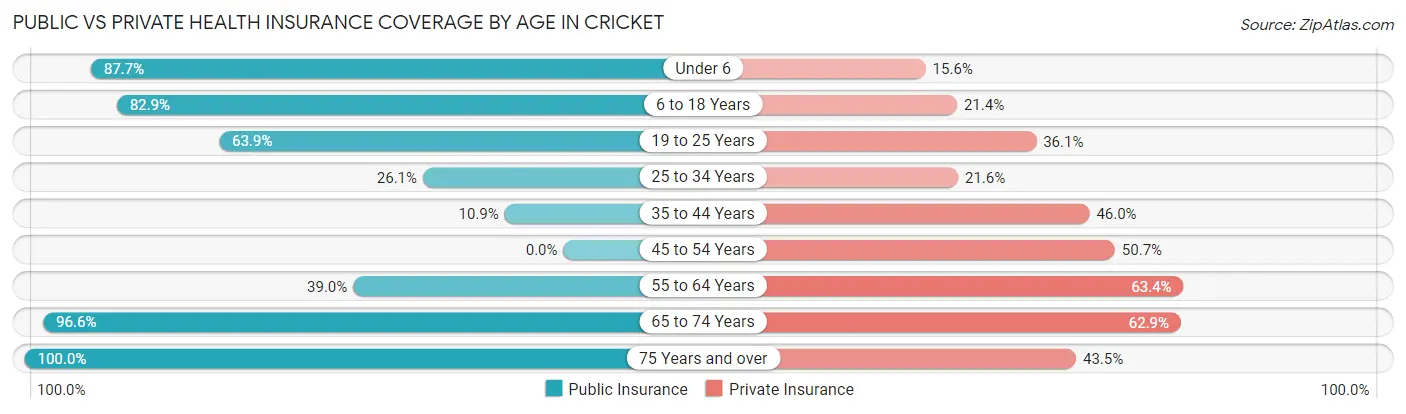
| Age Bracket | Public Insurance | Private Insurance |
| Under 6 | 107 (87.7%) | 19 (15.6%) |
| 6 to 18 Years | 446 (82.9%) | 115 (21.4%) |
| 19 to 25 Years | 216 (63.9%) | 122 (36.1%) |
| 25 to 34 Years | 139 (26.1%) | 115 (21.6%) |
| 35 to 44 Years | 23 (10.9%) | 97 (46.0%) |
| 45 to 54 Years | 0 (0.0%) | 110 (50.7%) |
| 55 to 64 Years | 64 (39.0%) | 104 (63.4%) |
| 65 to 74 Years | 224 (96.6%) | 146 (62.9%) |
| 75 Years and over | 92 (100.0%) | 40 (43.5%) |
| Total | 1,311 (53.6%) | 868 (35.5%) |
Disability Status by Sex by Age in Cricket
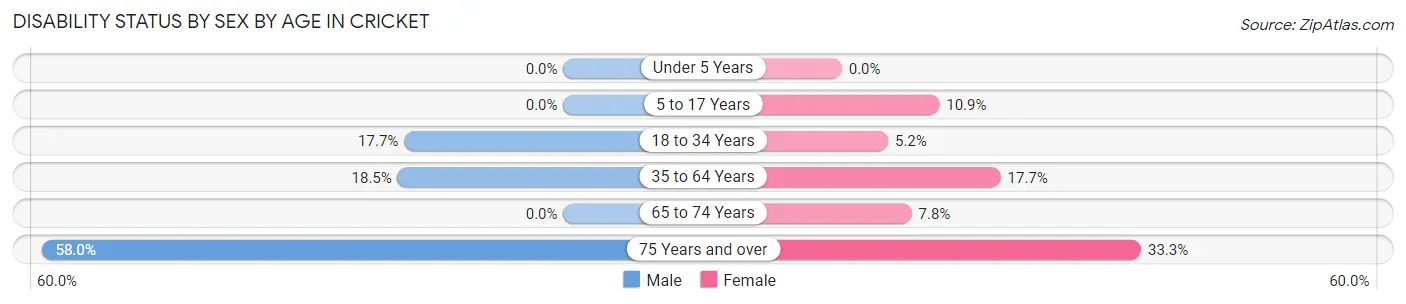
| Age Bracket | Male | Female |
| Under 5 Years | 0 (0.0%) | 0 (0.0%) |
| 5 to 17 Years | 0 (0.0%) | 24 (10.9%) |
| 18 to 34 Years | 75 (17.7%) | 25 (5.1%) |
| 35 to 64 Years | 55 (18.5%) | 52 (17.7%) |
| 65 to 74 Years | 0 (0.0%) | 8 (7.8%) |
| 75 Years and over | 29 (58.0%) | 14 (33.3%) |
Disability Class by Sex by Age in Cricket
Disability Class: Hearing Difficulty
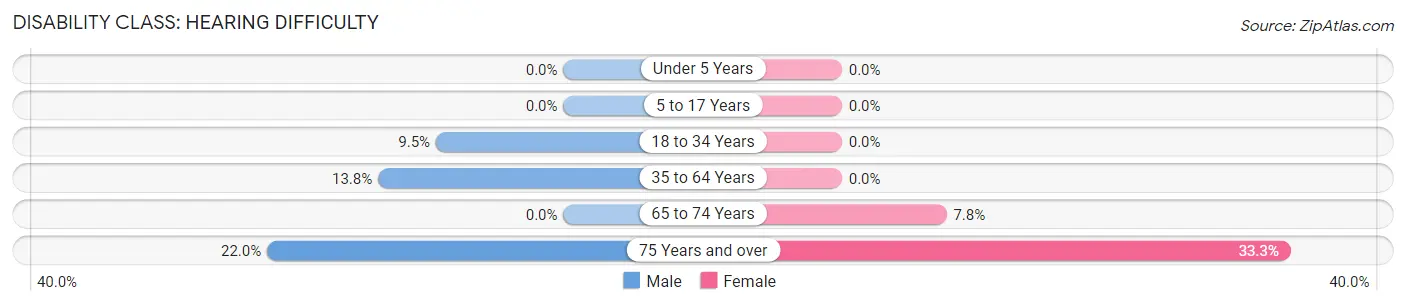
| Age Bracket | Male | Female |
| Under 5 Years | 0 (0.0%) | 0 (0.0%) |
| 5 to 17 Years | 0 (0.0%) | 0 (0.0%) |
| 18 to 34 Years | 40 (9.5%) | 0 (0.0%) |
| 35 to 64 Years | 41 (13.8%) | 0 (0.0%) |
| 65 to 74 Years | 0 (0.0%) | 8 (7.8%) |
| 75 Years and over | 11 (22.0%) | 14 (33.3%) |
Disability Class: Vision Difficulty
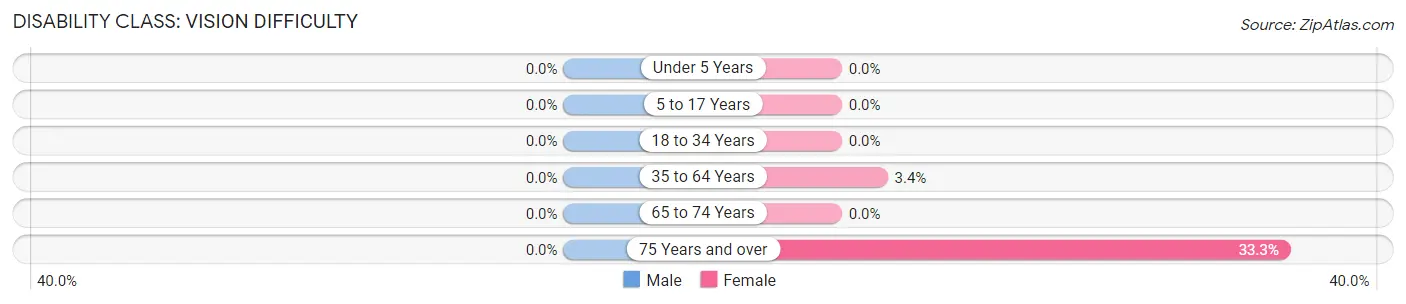
| Age Bracket | Male | Female |
| Under 5 Years | 0 (0.0%) | 0 (0.0%) |
| 5 to 17 Years | 0 (0.0%) | 0 (0.0%) |
| 18 to 34 Years | 0 (0.0%) | 0 (0.0%) |
| 35 to 64 Years | 0 (0.0%) | 10 (3.4%) |
| 65 to 74 Years | 0 (0.0%) | 0 (0.0%) |
| 75 Years and over | 0 (0.0%) | 14 (33.3%) |
Disability Class: Cognitive Difficulty
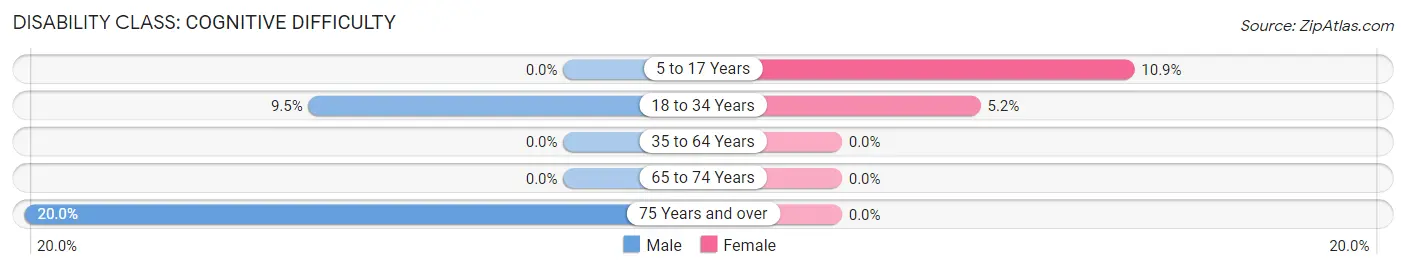
| Age Bracket | Male | Female |
| 5 to 17 Years | 0 (0.0%) | 24 (10.9%) |
| 18 to 34 Years | 40 (9.5%) | 25 (5.1%) |
| 35 to 64 Years | 0 (0.0%) | 0 (0.0%) |
| 65 to 74 Years | 0 (0.0%) | 0 (0.0%) |
| 75 Years and over | 10 (20.0%) | 0 (0.0%) |
Disability Class: Ambulatory Difficulty
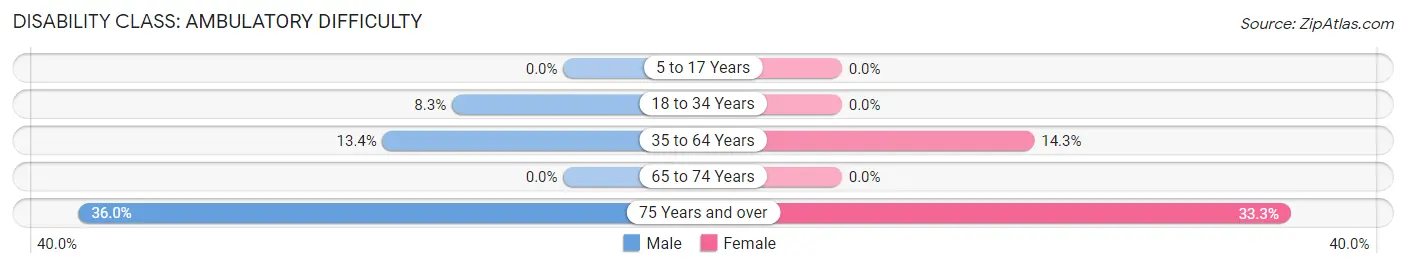
| Age Bracket | Male | Female |
| 5 to 17 Years | 0 (0.0%) | 0 (0.0%) |
| 18 to 34 Years | 35 (8.3%) | 0 (0.0%) |
| 35 to 64 Years | 40 (13.4%) | 42 (14.3%) |
| 65 to 74 Years | 0 (0.0%) | 0 (0.0%) |
| 75 Years and over | 18 (36.0%) | 14 (33.3%) |
Disability Class: Self-Care Difficulty
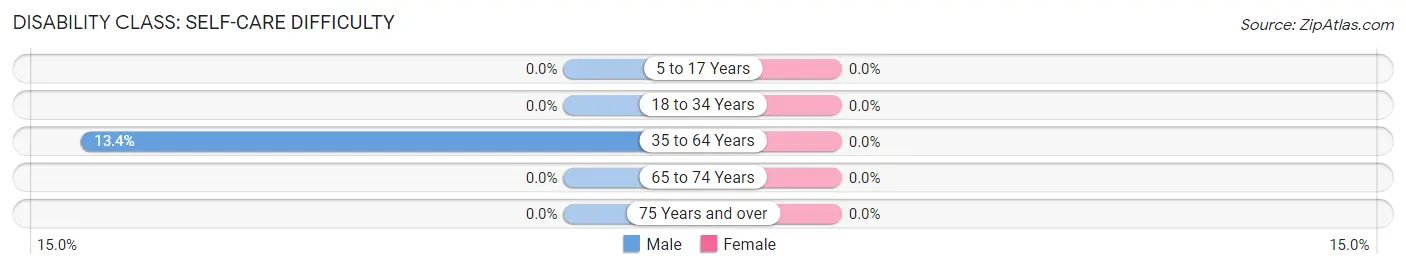
| Age Bracket | Male | Female |
| 5 to 17 Years | 0 (0.0%) | 0 (0.0%) |
| 18 to 34 Years | 0 (0.0%) | 0 (0.0%) |
| 35 to 64 Years | 40 (13.4%) | 0 (0.0%) |
| 65 to 74 Years | 0 (0.0%) | 0 (0.0%) |
| 75 Years and over | 0 (0.0%) | 0 (0.0%) |
Technology Access in Cricket
Computing Device Access in Cricket
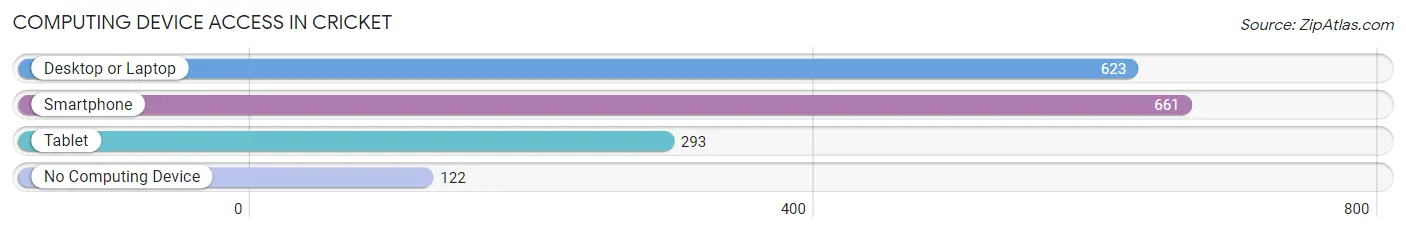
| Device Type | # Households | % Households |
| Desktop or Laptop | 623 | 73.0% |
| Smartphone | 661 | 77.4% |
| Tablet | 293 | 34.3% |
| No Computing Device | 122 | 14.3% |
| Total | 854 | 100.0% |
Internet Access in Cricket
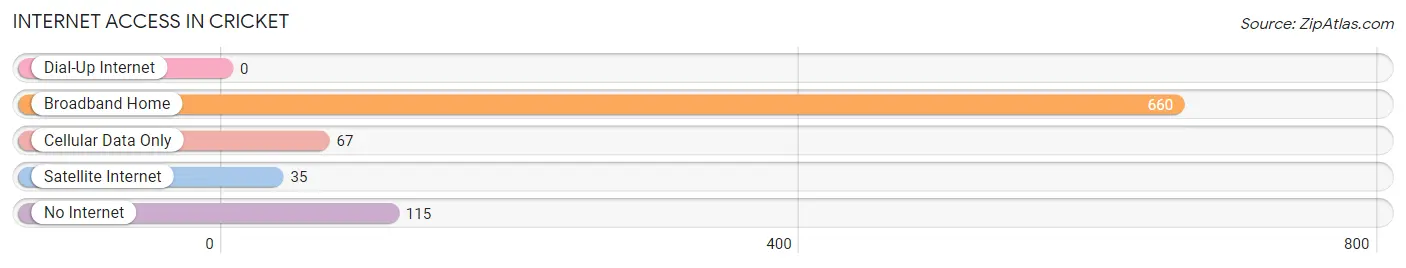
| Internet Type | # Households | % Households |
| Dial-Up Internet | 0 | 0.0% |
| Broadband Home | 660 | 77.3% |
| Cellular Data Only | 67 | 7.9% |
| Satellite Internet | 35 | 4.1% |
| No Internet | 115 | 13.5% |
| Total | 854 | 100.0% |
Cricket Summary
Cricket is a small town located in Chatham County, North Carolina. It is situated in the Piedmont region of the state, approximately 20 miles south of Chapel Hill and 30 miles northwest of Raleigh. The town has a population of approximately 1,000 people and covers an area of 0.7 square miles.
History
Cricket was founded in 1887 by a group of settlers from the nearby town of Pittsboro. The town was named after the cricket frogs that were abundant in the area. The town was originally a farming community, with tobacco being the main crop. In the early 1900s, the town began to grow and develop, with the construction of a post office, a school, and a general store.
In the 1950s, the town began to experience a period of growth and development. The town was incorporated in 1956 and the population began to increase. In the 1960s, the town began to attract new businesses, including a furniture store, a grocery store, and a hardware store.
Geography
Cricket is located in the Piedmont region of North Carolina, approximately 20 miles south of Chapel Hill and 30 miles northwest of Raleigh. The town is situated in the rolling hills of Chatham County, with the Haw River running through the town. The town is surrounded by forests and farmland, with the nearest major city being Durham, which is approximately 25 miles away.
Economy
The economy of Cricket is largely based on agriculture. The town is home to several farms, which produce a variety of crops, including tobacco, corn, soybeans, and wheat. The town also has several small businesses, including a furniture store, a grocery store, and a hardware store.
Demographics
As of the 2010 census, the population of Cricket was 1,000 people. The racial makeup of the town was 94.2% White, 2.2% African American, 0.7% Native American, 0.7% Asian, and 2.2% from other races. The median household income was $41,250, and the median family income was $50,000.
Conclusion
Cricket is a small town located in Chatham County, North Carolina. It is situated in the Piedmont region of the state, approximately 20 miles south of Chapel Hill and 30 miles northwest of Raleigh. The town has a population of approximately 1,000 people and covers an area of 0.7 square miles. The economy of Cricket is largely based on agriculture, with the town being home to several farms. The racial makeup of the town is 94.2% White, 2.2% African American, 0.7% Native American, 0.7% Asian, and 2.2% from other races. The median household income was $41,250, and the median family income was $50,000.
Common Questions
What is the Total Population of Cricket?
Total Population of Cricket is 2,491.
What is the Total Male Population of Cricket?
Total Male Population of Cricket is 1,236.
What is the Total Female Population of Cricket?
Total Female Population of Cricket is 1,255.
What is the Ratio of Males per 100 Females in Cricket?
There are 98.49 Males per 100 Females in Cricket.
What is the Ratio of Females per 100 Males in Cricket?
There are 101.54 Females per 100 Males in Cricket.
What is the Median Population Age in Cricket?
Median Population Age in Cricket is 28.1 Years.
What is the Average Family Size in Cricket
Average Family Size in Cricket is 3.1 People.
What is the Average Household Size in Cricket
Average Household Size in Cricket is 2.9 People.
What is Per Capita Income in Cricket?
Per Capita income in Cricket is $20,238.
What is the Median Family Income in Cricket?
Median Family Income in Cricket is $45,804.
What is the Median Household income in Cricket?
Median Household Income in Cricket is $45,536.
What is Inequality or Gini Index in Cricket?
Inequality or Gini Index in Cricket is 0.30.
How Large is the Labor Force in Cricket?
There are 1,229 People in the Labor Forcein in Cricket.
What is the Percentage of People in the Labor Force in Cricket?
62.4% of People are in the Labor Force in Cricket.
What is the Unemployment Rate in Cricket?
Unemployment Rate in Cricket is 6.8%.