Balfour, NC
Balfour Map
Balfour Overview
1,142
TOTAL POPULATION
577
MALE POPULATION
565
FEMALE POPULATION
102.12
MALES / 100 FEMALES
97.92
FEMALES / 100 MALES
37.5
MEDIAN AGE
2.7
AVG FAMILY SIZE
2.3
AVG HOUSEHOLD SIZE
$44,382
PER CAPITA INCOME
$93,393
AVG FAMILY INCOME
$69,643
AVG HOUSEHOLD INCOME
18.4%
WAGE / INCOME GAP [ % ]
81.6¢/ $1
WAGE / INCOME GAP [ $ ]
0.48
INEQUALITY / GINI INDEX
713
LABOR FORCE [ PEOPLE ]
70.0%
PERCENT IN LABOR FORCE
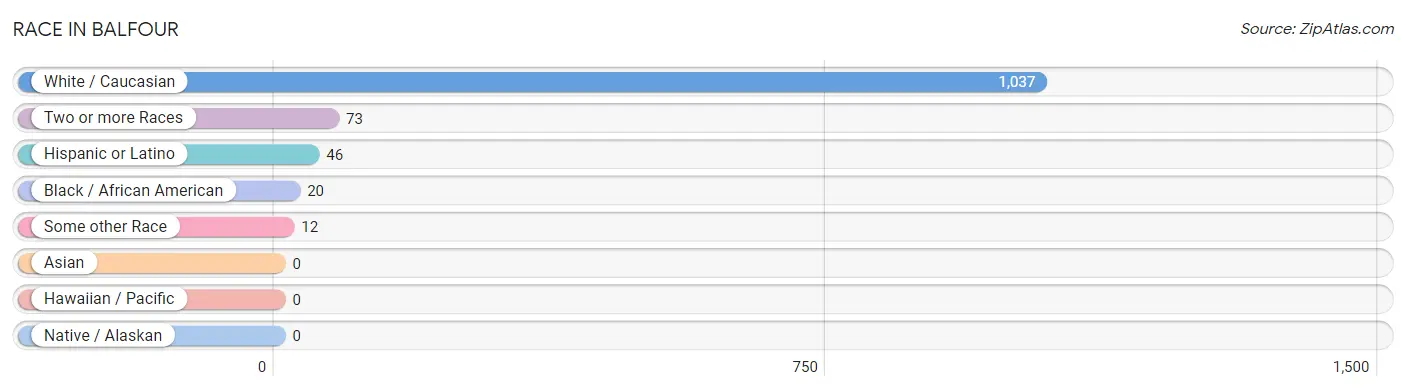
Race in Balfour
The most populous races in Balfour are White / Caucasian (1,037 | 90.8%), Two or more Races (73 | 6.4%), and Hispanic or Latino (46 | 4.0%).
| Race | # Population | % Population |
| Asian | 0 | 0.0% |
| Black / African American | 20 | 1.8% |
| Hawaiian / Pacific | 0 | 0.0% |
| Hispanic or Latino | 46 | 4.0% |
| Native / Alaskan | 0 | 0.0% |
| White / Caucasian | 1,037 | 90.8% |
| Two or more Races | 73 | 6.4% |
| Some other Race | 12 | 1.1% |
| Total | 1,142 | 100.0% |
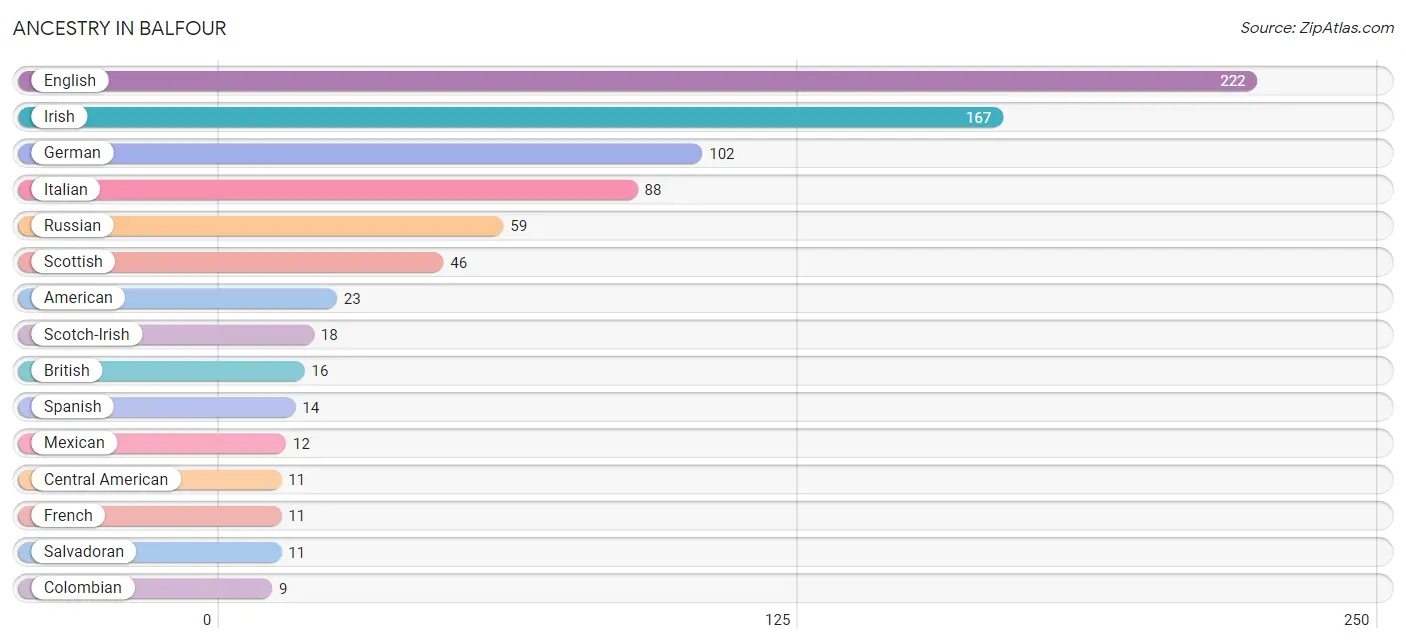
Ancestry in Balfour
The most populous ancestries reported in Balfour are English (222 | 19.4%), Irish (167 | 14.6%), German (102 | 8.9%), Italian (88 | 7.7%), and Russian (59 | 5.2%), together accounting for 55.9% of all Balfour residents.
| Ancestry | # Population | % Population |
| American | 23 | 2.0% |
| British | 16 | 1.4% |
| Central American | 11 | 1.0% |
| Colombian | 9 | 0.8% |
| Danish | 7 | 0.6% |
| English | 222 | 19.4% |
| European | 7 | 0.6% |
| French | 11 | 1.0% |
| German | 102 | 8.9% |
| Hungarian | 7 | 0.6% |
| Irish | 167 | 14.6% |
| Italian | 88 | 7.7% |
| Mexican | 12 | 1.1% |
| Northern European | 6 | 0.5% |
| Norwegian | 8 | 0.7% |
| Russian | 59 | 5.2% |
| Salvadoran | 11 | 1.0% |
| Scandinavian | 6 | 0.5% |
| Scotch-Irish | 18 | 1.6% |
| Scottish | 46 | 4.0% |
| South American | 9 | 0.8% |
| Spanish | 14 | 1.2% | View All 22 Rows |
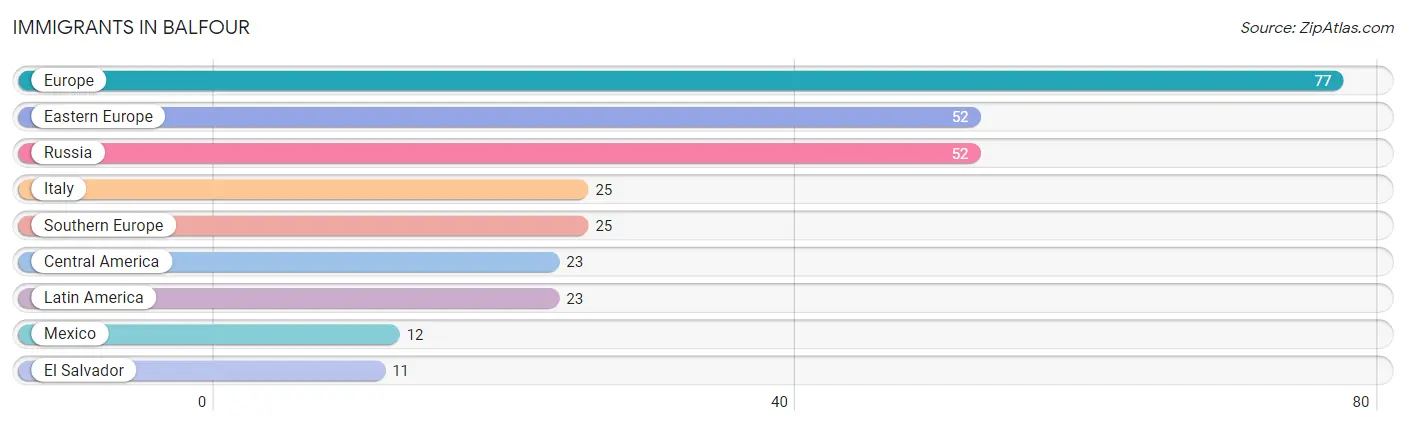
Immigrants in Balfour
The most numerous immigrant groups reported in Balfour came from Europe (77 | 6.7%), Eastern Europe (52 | 4.5%), Russia (52 | 4.5%), Italy (25 | 2.2%), and Southern Europe (25 | 2.2%), together accounting for 20.2% of all Balfour residents.
| Immigration Origin | # Population | % Population |
| Central America | 23 | 2.0% |
| Eastern Europe | 52 | 4.5% |
| El Salvador | 11 | 1.0% |
| Europe | 77 | 6.7% |
| Italy | 25 | 2.2% |
| Latin America | 23 | 2.0% |
| Mexico | 12 | 1.1% |
| Russia | 52 | 4.5% |
| Southern Europe | 25 | 2.2% | View All 9 Rows |
Sex and Age in Balfour
Sex and Age in Balfour
The most populous age groups in Balfour are 35 to 39 Years (79 | 13.7%) for men and 30 to 34 Years (110 | 19.5%) for women.
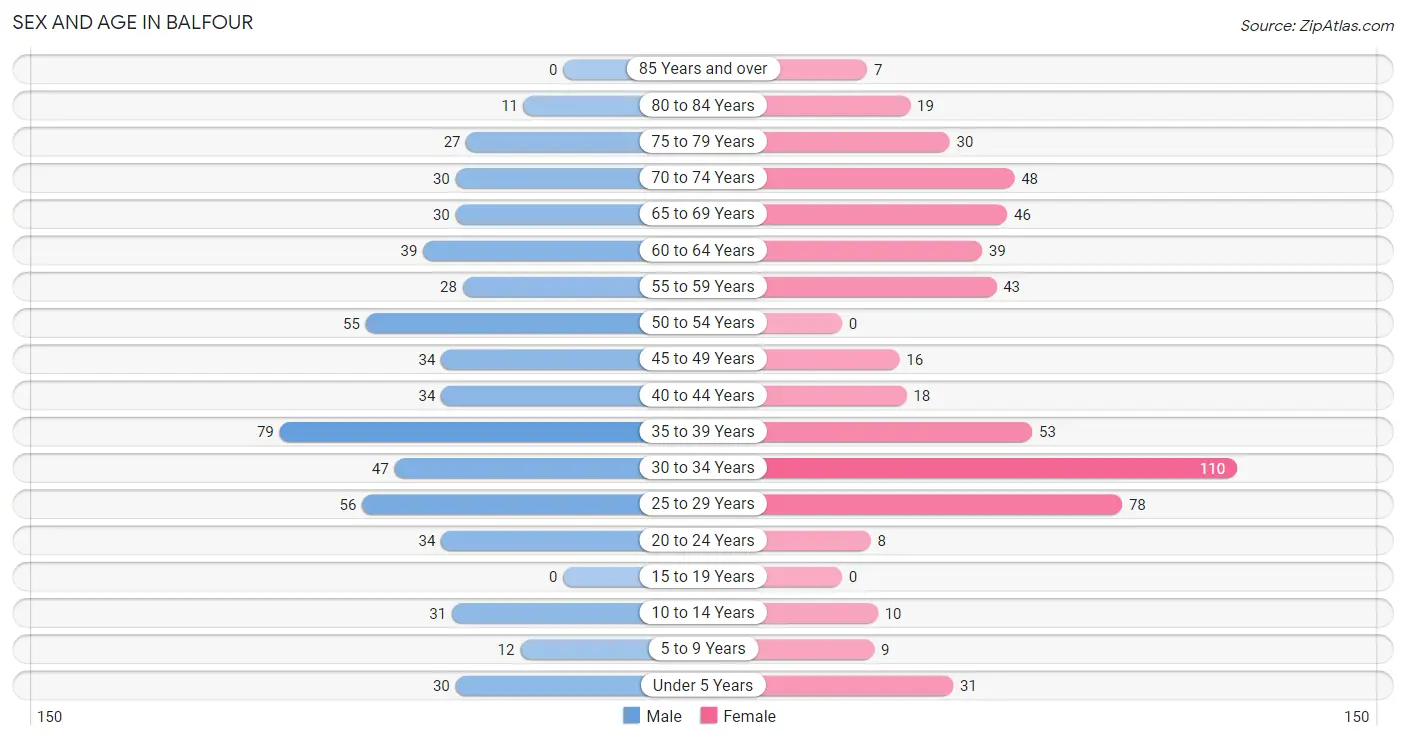
| Age Bracket | Male | Female |
| Under 5 Years | 30 (5.2%) | 31 (5.5%) |
| 5 to 9 Years | 12 (2.1%) | 9 (1.6%) |
| 10 to 14 Years | 31 (5.4%) | 10 (1.8%) |
| 15 to 19 Years | 0 (0.0%) | 0 (0.0%) |
| 20 to 24 Years | 34 (5.9%) | 8 (1.4%) |
| 25 to 29 Years | 56 (9.7%) | 78 (13.8%) |
| 30 to 34 Years | 47 (8.2%) | 110 (19.5%) |
| 35 to 39 Years | 79 (13.7%) | 53 (9.4%) |
| 40 to 44 Years | 34 (5.9%) | 18 (3.2%) |
| 45 to 49 Years | 34 (5.9%) | 16 (2.8%) |
| 50 to 54 Years | 55 (9.5%) | 0 (0.0%) |
| 55 to 59 Years | 28 (4.9%) | 43 (7.6%) |
| 60 to 64 Years | 39 (6.8%) | 39 (6.9%) |
| 65 to 69 Years | 30 (5.2%) | 46 (8.1%) |
| 70 to 74 Years | 30 (5.2%) | 48 (8.5%) |
| 75 to 79 Years | 27 (4.7%) | 30 (5.3%) |
| 80 to 84 Years | 11 (1.9%) | 19 (3.4%) |
| 85 Years and over | 0 (0.0%) | 7 (1.2%) |
| Total | 577 (100.0%) | 565 (100.0%) |
Families and Households in Balfour
Median Family Size in Balfour
The median family size in Balfour is 2.69 persons per family, with married-couple families (249 | 78.1%) accounting for the largest median family size of 2.79 persons per family. On the other hand, single male/father families (8 | 2.5%) represent the smallest median family size with 2.25 persons per family.
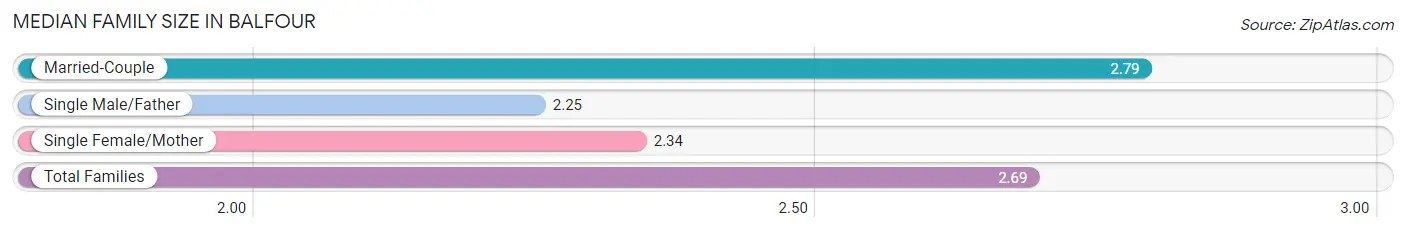
| Family Type | # Families | Family Size |
| Married-Couple | 249 (78.1%) | 2.79 |
| Single Male/Father | 8 (2.5%) | 2.25 |
| Single Female/Mother | 62 (19.4%) | 2.34 |
| Total Families | 319 (100.0%) | 2.69 |
Median Household Size in Balfour
The median household size in Balfour is 2.29 persons per household, with married-couple households (249 | 50.0%) accounting for the largest median household size of 3 persons per household. non-family households (179 | 35.9%) represent the smallest median household size with 1.24 persons per household.
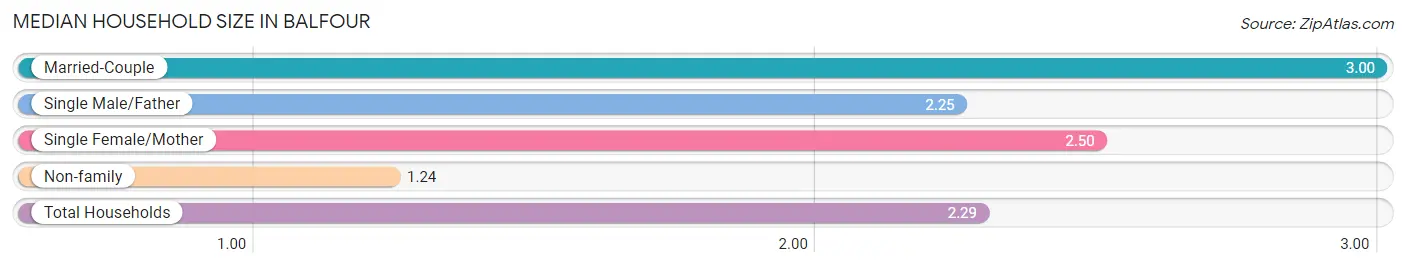
| Household Type | # Households | Household Size |
| Married-Couple | 249 (50.0%) | 3.00 |
| Single Male/Father | 8 (1.6%) | 2.25 |
| Single Female/Mother | 62 (12.4%) | 2.50 |
| Non-family | 179 (35.9%) | 1.24 |
| Total Households | 498 (100.0%) | 2.29 |
Household Size by Marriage Status in Balfour
Out of a total of 498 households in Balfour, 319 (64.1%) are family households, while 179 (35.9%) are nonfamily households. The most numerous type of family households are 2-person households, comprising 188, and the most common type of nonfamily households are 1-person households, comprising 147.
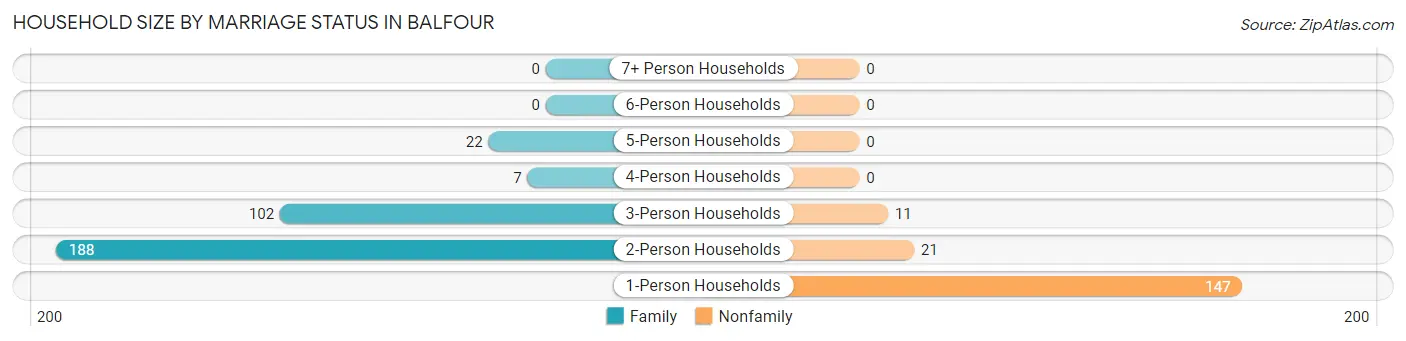
| Household Size | Family Households | Nonfamily Households |
| 1-Person Households | - | 147 (29.5%) |
| 2-Person Households | 188 (37.8%) | 21 (4.2%) |
| 3-Person Households | 102 (20.5%) | 11 (2.2%) |
| 4-Person Households | 7 (1.4%) | 0 (0.0%) |
| 5-Person Households | 22 (4.4%) | 0 (0.0%) |
| 6-Person Households | 0 (0.0%) | 0 (0.0%) |
| 7+ Person Households | 0 (0.0%) | 0 (0.0%) |
| Total | 319 (64.1%) | 179 (35.9%) |
Female Fertility in Balfour
Fertility by Age in Balfour
Average fertility rate in Balfour is 85.0 births per 1,000 women. Women in the age bracket of 20 to 34 years have the highest fertility rate with 122.0 births per 1,000 women. Women in the age bracket of 20 to 34 years acount for 100.0% of all women with births.
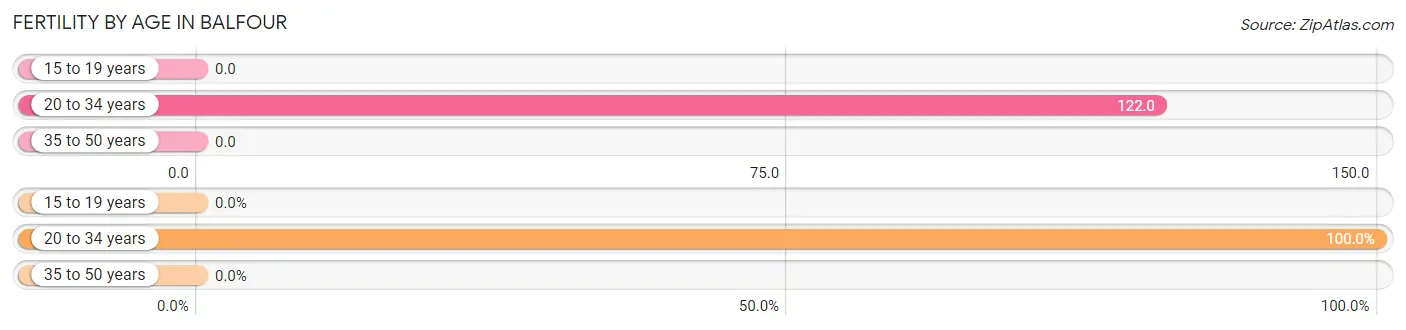
| Age Bracket | Women with Births | Births / 1,000 Women |
| 15 to 19 years | 0 (0.0%) | 0.0 |
| 20 to 34 years | 24 (100.0%) | 122.0 |
| 35 to 50 years | 0 (0.0%) | 0.0 |
| Total | 24 (100.0%) | 85.0 |
Fertility by Age by Marriage Status in Balfour
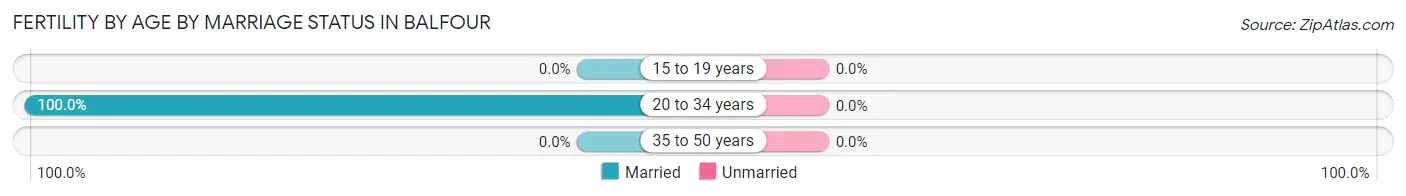
| Age Bracket | Married | Unmarried |
| 15 to 19 years | 0 (0.0%) | 0 (0.0%) |
| 20 to 34 years | 24 (100.0%) | 0 (0.0%) |
| 35 to 50 years | 0 (0.0%) | 0 (0.0%) |
| Total | 24 (100.0%) | 0 (0.0%) |
Fertility by Education in Balfour
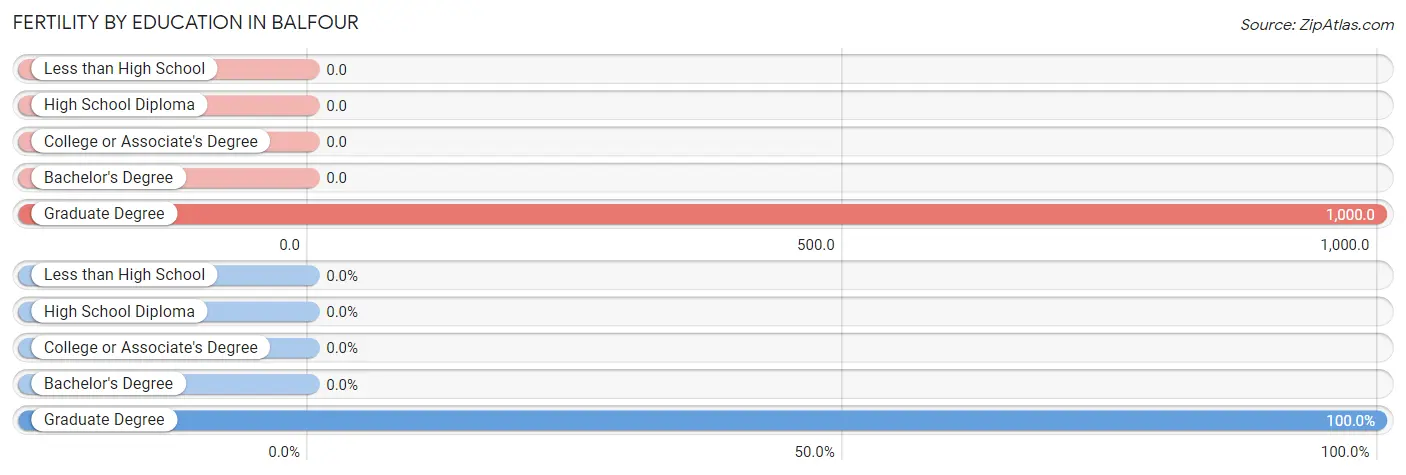
| Educational Attainment | Women with Births | Births / 1,000 Women |
| Less than High School | 0 (0.0%) | 0.0 |
| High School Diploma | 0 (0.0%) | 0.0 |
| College or Associate's Degree | 0 (0.0%) | 0.0 |
| Bachelor's Degree | 0 (0.0%) | 0.0 |
| Graduate Degree | 24 (100.0%) | 1,000.0 |
| Total | 24 (100.0%) | 85.0 |
Fertility by Education by Marriage Status in Balfour
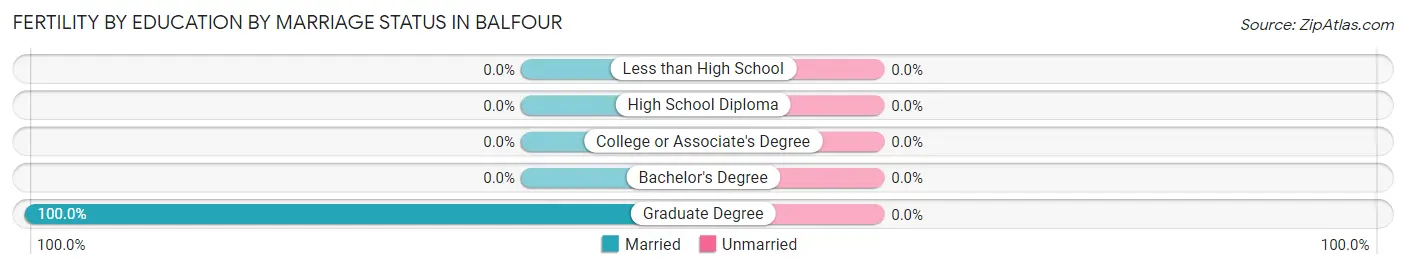
| Educational Attainment | Married | Unmarried |
| Less than High School | 0 (0.0%) | 0 (0.0%) |
| High School Diploma | 0 (0.0%) | 0 (0.0%) |
| College or Associate's Degree | 0 (0.0%) | 0 (0.0%) |
| Bachelor's Degree | 0 (0.0%) | 0 (0.0%) |
| Graduate Degree | 24 (100.0%) | 0 (0.0%) |
| Total | 24 (100.0%) | 0 (0.0%) |
Income in Balfour
Income Overview in Balfour
Per Capita Income in Balfour is $44,382, while median incomes of families and households are $93,393 and $69,643 respectively.
| Characteristic | Number | Measure |
| Per Capita Income | 1,142 | $44,382 |
| Median Family Income | 319 | $93,393 |
| Mean Family Income | 319 | $126,276 |
| Median Household Income | 498 | $69,643 |
| Mean Household Income | 498 | $100,368 |
| Income Deficit | 319 | $0 |
| Wage / Income Gap (%) | 1,142 | 18.37% |
| Wage / Income Gap ($) | 1,142 | 81.63¢ per $1 |
| Gini / Inequality Index | 1,142 | 0.48 |
Earnings by Sex in Balfour
Average Earnings in Balfour are $29,828, $32,396 for men and $26,444 for women, a difference of 18.4%.
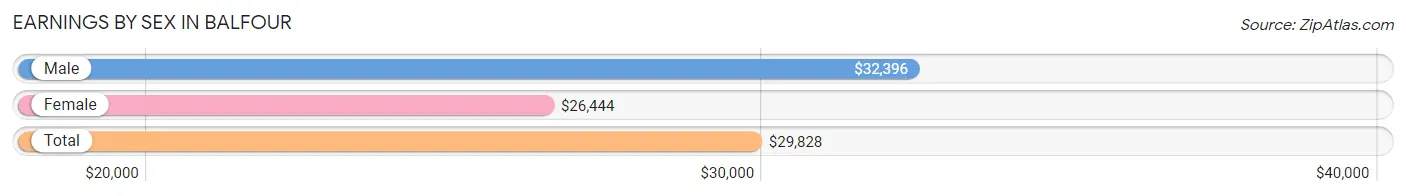
| Sex | Number | Average Earnings |
| Male | 368 (49.7%) | $32,396 |
| Female | 372 (50.3%) | $26,444 |
| Total | 740 (100.0%) | $29,828 |
Earnings by Sex by Income Bracket in Balfour
The most common earnings brackets in Balfour are $30,000 to $34,999 for men (56 | 15.2%) and $25,000 to $29,999 for women (74 | 19.9%).
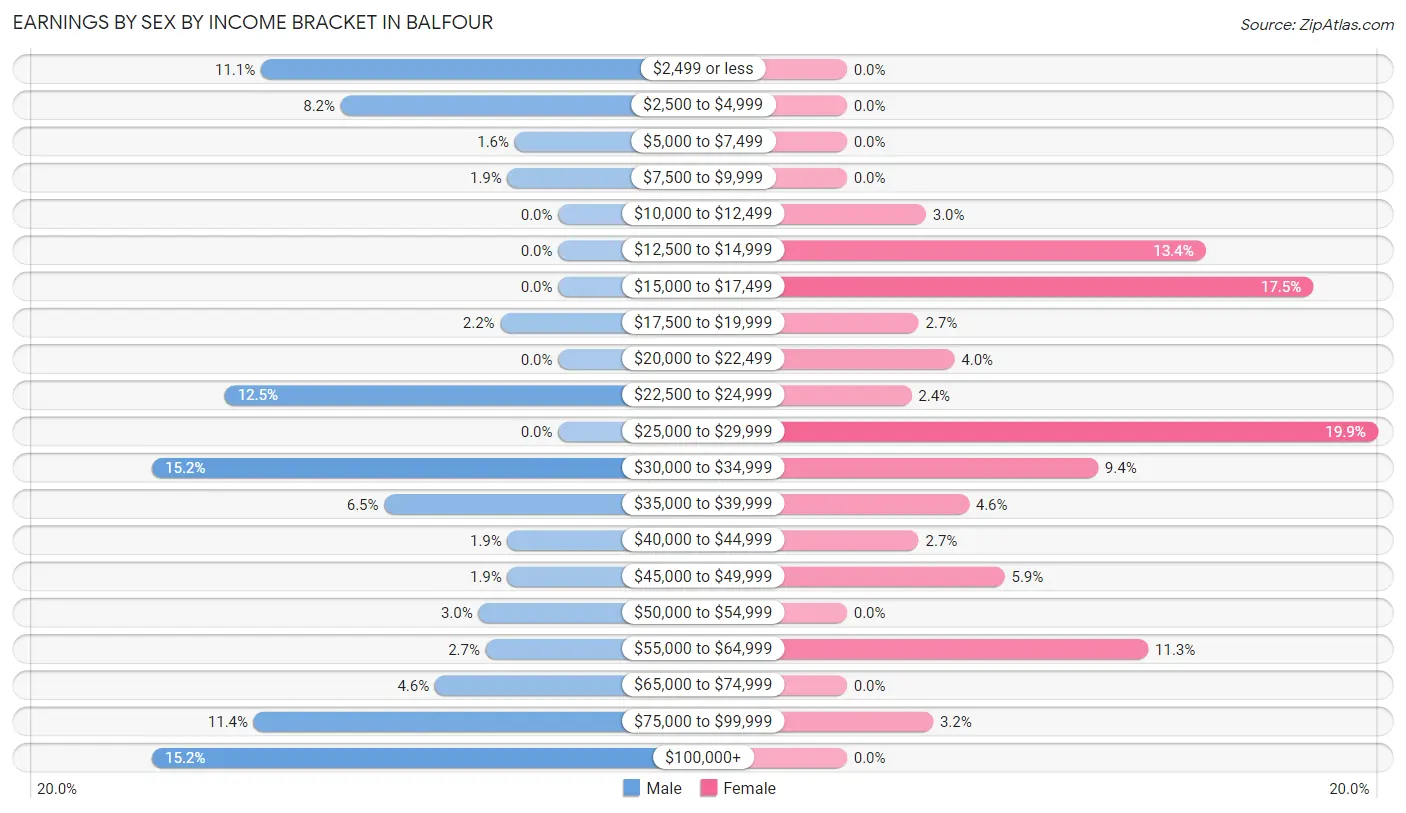
| Income | Male | Female |
| $2,499 or less | 41 (11.1%) | 0 (0.0%) |
| $2,500 to $4,999 | 30 (8.2%) | 0 (0.0%) |
| $5,000 to $7,499 | 6 (1.6%) | 0 (0.0%) |
| $7,500 to $9,999 | 7 (1.9%) | 0 (0.0%) |
| $10,000 to $12,499 | 0 (0.0%) | 11 (3.0%) |
| $12,500 to $14,999 | 0 (0.0%) | 50 (13.4%) |
| $15,000 to $17,499 | 0 (0.0%) | 65 (17.5%) |
| $17,500 to $19,999 | 8 (2.2%) | 10 (2.7%) |
| $20,000 to $22,499 | 0 (0.0%) | 15 (4.0%) |
| $22,500 to $24,999 | 46 (12.5%) | 9 (2.4%) |
| $25,000 to $29,999 | 0 (0.0%) | 74 (19.9%) |
| $30,000 to $34,999 | 56 (15.2%) | 35 (9.4%) |
| $35,000 to $39,999 | 24 (6.5%) | 17 (4.6%) |
| $40,000 to $44,999 | 7 (1.9%) | 10 (2.7%) |
| $45,000 to $49,999 | 7 (1.9%) | 22 (5.9%) |
| $50,000 to $54,999 | 11 (3.0%) | 0 (0.0%) |
| $55,000 to $64,999 | 10 (2.7%) | 42 (11.3%) |
| $65,000 to $74,999 | 17 (4.6%) | 0 (0.0%) |
| $75,000 to $99,999 | 42 (11.4%) | 12 (3.2%) |
| $100,000+ | 56 (15.2%) | 0 (0.0%) |
| Total | 368 (100.0%) | 372 (100.0%) |
Earnings by Sex by Educational Attainment in Balfour
Average earnings in Balfour are $32,396 for men and $26,486 for women, a difference of 18.2%. Men with an educational attainment of college or associate's degree enjoy the highest average annual earnings of $70,809, while those with bachelor's degree education earn the least with $35,341. Women with an educational attainment of bachelor's degree earn the most with the average annual earnings of $26,298, while those with high school diploma education have the smallest earnings of $25,568.
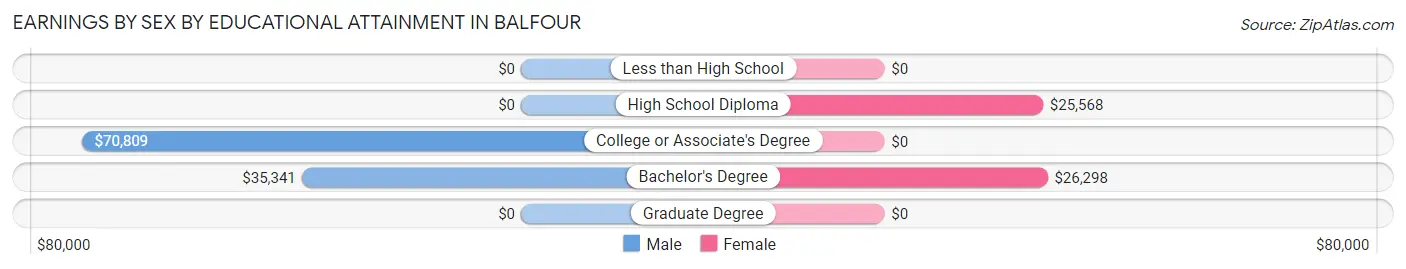
| Educational Attainment | Male Income | Female Income |
| Less than High School | - | - |
| High School Diploma | - | - |
| College or Associate's Degree | $70,809 | $0 |
| Bachelor's Degree | $35,341 | $26,298 |
| Graduate Degree | - | - |
| Total | $32,396 | $26,486 |
Family Income in Balfour
Family Income Brackets in Balfour
According to the Balfour family income data, there are 82 families falling into the $50,000 to $74,999 income range, which is the most common income bracket and makes up 25.7% of all families.
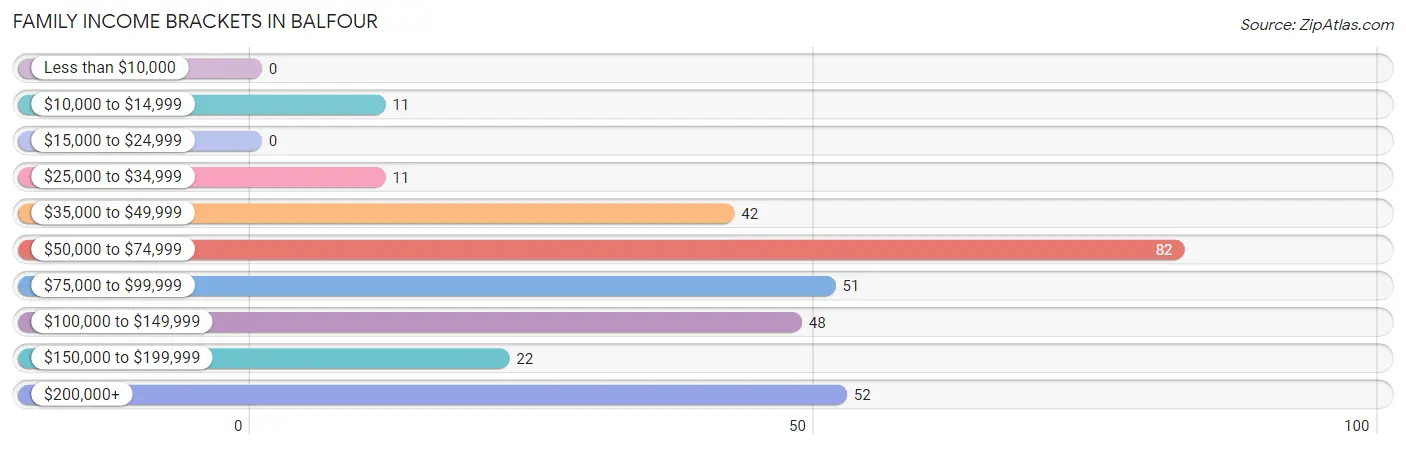
| Income Bracket | # Families | % Families |
| Less than $10,000 | 0 | 0.0% |
| $10,000 to $14,999 | 11 | 3.4% |
| $15,000 to $24,999 | 0 | 0.0% |
| $25,000 to $34,999 | 11 | 3.4% |
| $35,000 to $49,999 | 42 | 13.2% |
| $50,000 to $74,999 | 82 | 25.7% |
| $75,000 to $99,999 | 51 | 16.0% |
| $100,000 to $149,999 | 48 | 15.0% |
| $150,000 to $199,999 | 22 | 6.9% |
| $200,000+ | 52 | 16.3% |
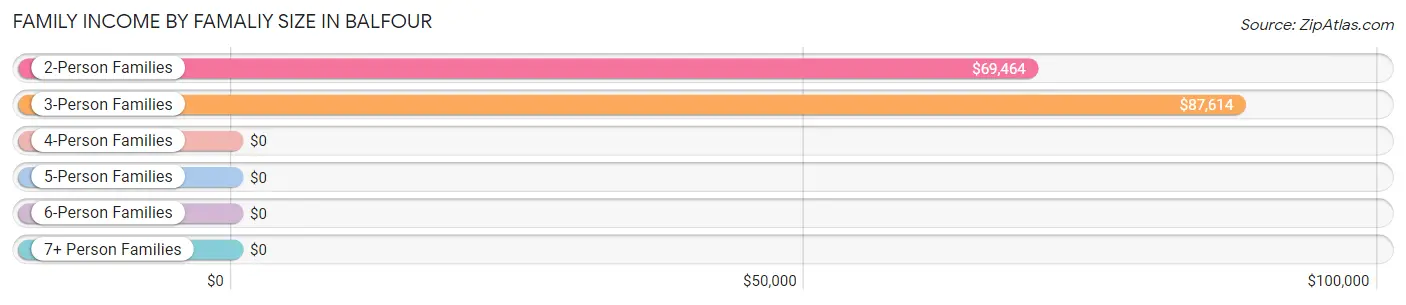
Family Income by Famaliy Size in Balfour
3-person families (91 | 28.5%) account for the highest median family income in Balfour with $87,614 per family, while 2-person families (199 | 62.4%) have the highest median income of $34,732 per family member.
| Income Bracket | # Families | Median Income |
| 2-Person Families | 199 (62.4%) | $69,464 |
| 3-Person Families | 91 (28.5%) | $87,614 |
| 4-Person Families | 29 (9.1%) | $0 |
| 5-Person Families | 0 (0.0%) | $0 |
| 6-Person Families | 0 (0.0%) | $0 |
| 7+ Person Families | 0 (0.0%) | $0 |
| Total | 319 (100.0%) | $93,393 |
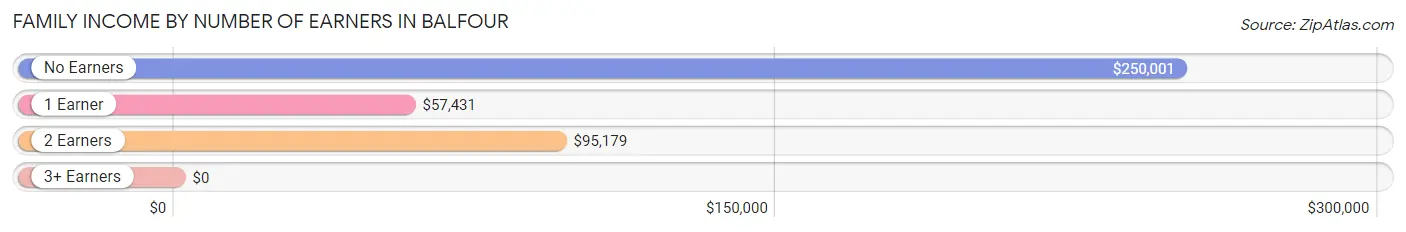
Family Income by Number of Earners in Balfour
| Number of Earners | # Families | Median Income |
| No Earners | 40 (12.5%) | $250,001 |
| 1 Earner | 95 (29.8%) | $57,431 |
| 2 Earners | 171 (53.6%) | $95,179 |
| 3+ Earners | 13 (4.1%) | $0 |
| Total | 319 (100.0%) | $93,393 |
Household Income in Balfour
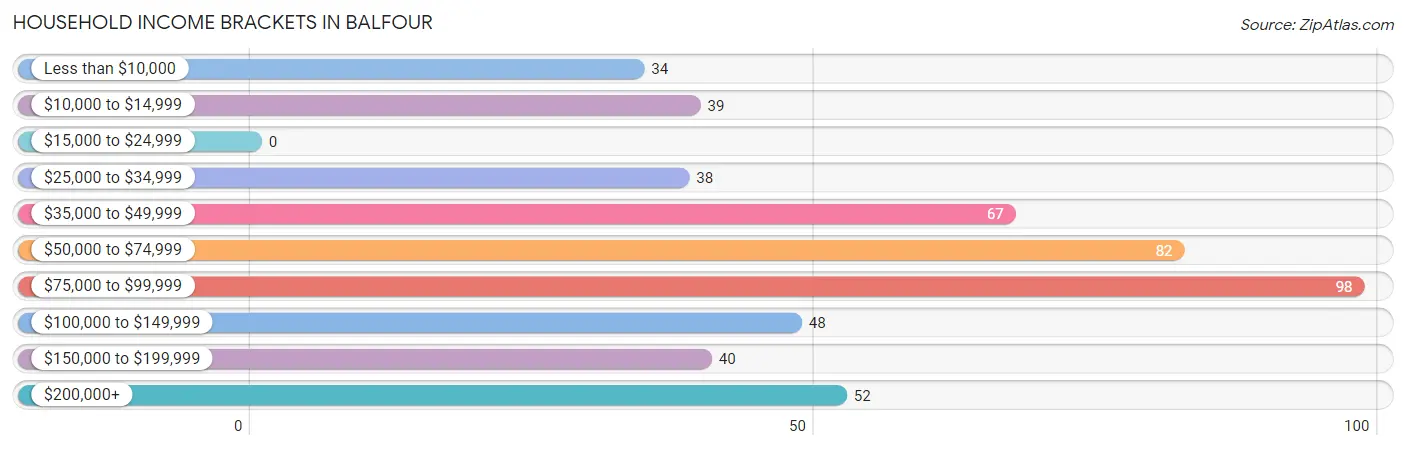
Household Income Brackets in Balfour
With 98 households falling in the category, the $75,000 to $99,999 income range is the most frequent in Balfour, accounting for 19.7% of all households.
| Income Bracket | # Households | % Households |
| Less than $10,000 | 34 | 6.8% |
| $10,000 to $14,999 | 39 | 7.8% |
| $15,000 to $24,999 | 0 | 0.0% |
| $25,000 to $34,999 | 38 | 7.6% |
| $35,000 to $49,999 | 67 | 13.5% |
| $50,000 to $74,999 | 82 | 16.5% |
| $75,000 to $99,999 | 98 | 19.7% |
| $100,000 to $149,999 | 48 | 9.6% |
| $150,000 to $199,999 | 40 | 8.0% |
| $200,000+ | 52 | 10.4% |
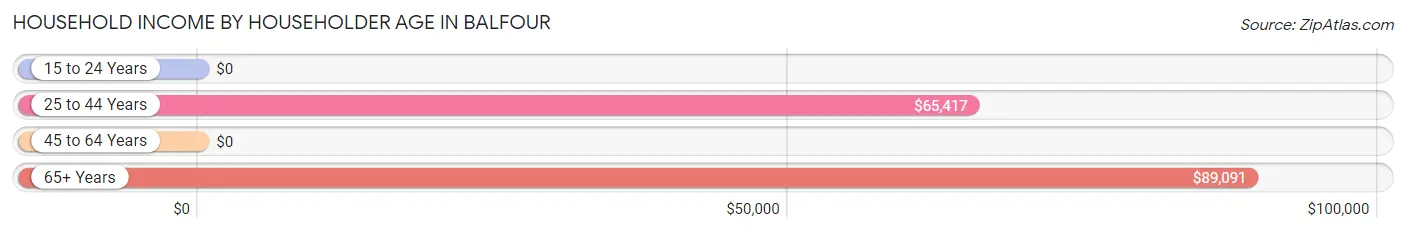
Household Income by Householder Age in Balfour
The median household income in Balfour is $69,643, with the highest median household income of $89,091 found in the 65+ years age bracket for the primary householder. A total of 178 households (35.7%) fall into this category.
| Income Bracket | # Households | Median Income |
| 15 to 24 Years | 0 (0.0%) | $0 |
| 25 to 44 Years | 192 (38.6%) | $65,417 |
| 45 to 64 Years | 128 (25.7%) | $0 |
| 65+ Years | 178 (35.7%) | $89,091 |
| Total | 498 (100.0%) | $69,643 |
Poverty in Balfour
Income Below Poverty by Sex and Age in Balfour
With 11.1% poverty level for males and 7.1% for females among the residents of Balfour, 55 to 64 year old males and 6 to 11 year old females are the most vulnerable to poverty, with 31 males (46.3%) and 10 females (52.6%) in their respective age groups living below the poverty level.
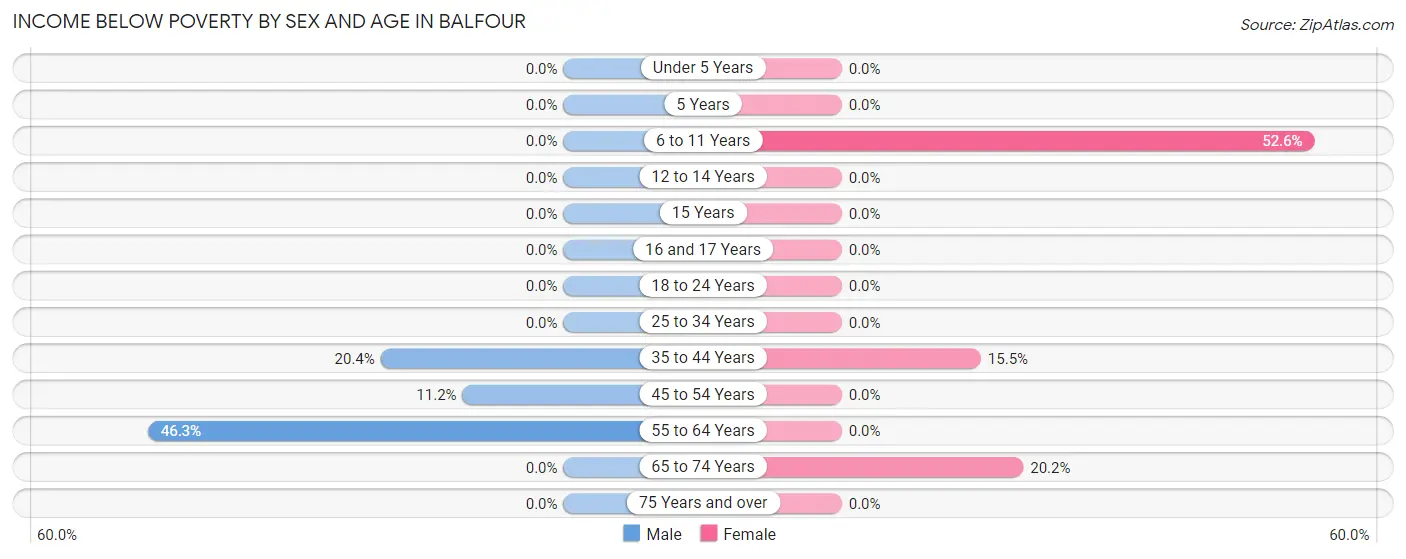
| Age Bracket | Male | Female |
| Under 5 Years | 0 (0.0%) | 0 (0.0%) |
| 5 Years | 0 (0.0%) | 0 (0.0%) |
| 6 to 11 Years | 0 (0.0%) | 10 (52.6%) |
| 12 to 14 Years | 0 (0.0%) | 0 (0.0%) |
| 15 Years | 0 (0.0%) | 0 (0.0%) |
| 16 and 17 Years | 0 (0.0%) | 0 (0.0%) |
| 18 to 24 Years | 0 (0.0%) | 0 (0.0%) |
| 25 to 34 Years | 0 (0.0%) | 0 (0.0%) |
| 35 to 44 Years | 23 (20.3%) | 11 (15.5%) |
| 45 to 54 Years | 10 (11.2%) | 0 (0.0%) |
| 55 to 64 Years | 31 (46.3%) | 0 (0.0%) |
| 65 to 74 Years | 0 (0.0%) | 19 (20.2%) |
| 75 Years and over | 0 (0.0%) | 0 (0.0%) |
| Total | 64 (11.1%) | 40 (7.1%) |
Income Above Poverty by Sex and Age in Balfour
According to the poverty statistics in Balfour, males aged under 5 years and females aged under 5 years are the age groups that are most secure financially, with 100.0% of males and 100.0% of females in these age groups living above the poverty line.
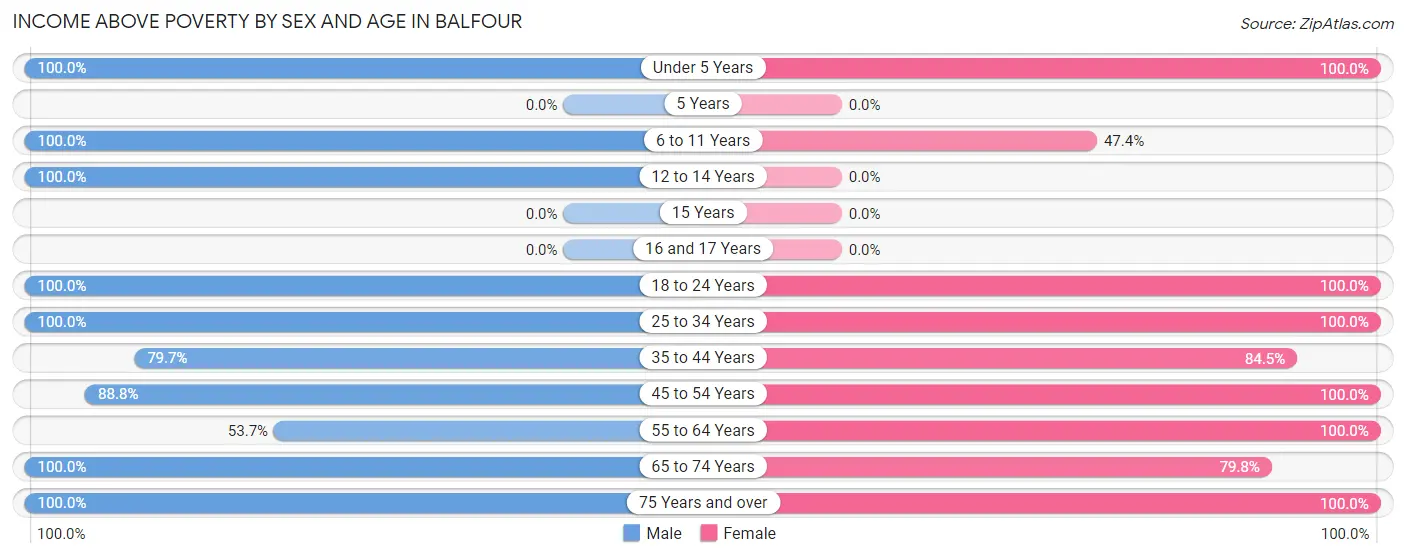
| Age Bracket | Male | Female |
| Under 5 Years | 30 (100.0%) | 31 (100.0%) |
| 5 Years | 0 (0.0%) | 0 (0.0%) |
| 6 to 11 Years | 12 (100.0%) | 9 (47.4%) |
| 12 to 14 Years | 31 (100.0%) | 0 (0.0%) |
| 15 Years | 0 (0.0%) | 0 (0.0%) |
| 16 and 17 Years | 0 (0.0%) | 0 (0.0%) |
| 18 to 24 Years | 34 (100.0%) | 8 (100.0%) |
| 25 to 34 Years | 103 (100.0%) | 188 (100.0%) |
| 35 to 44 Years | 90 (79.6%) | 60 (84.5%) |
| 45 to 54 Years | 79 (88.8%) | 16 (100.0%) |
| 55 to 64 Years | 36 (53.7%) | 82 (100.0%) |
| 65 to 74 Years | 60 (100.0%) | 75 (79.8%) |
| 75 Years and over | 38 (100.0%) | 56 (100.0%) |
| Total | 513 (88.9%) | 525 (92.9%) |
Income Below Poverty Among Married-Couple Families in Balfour
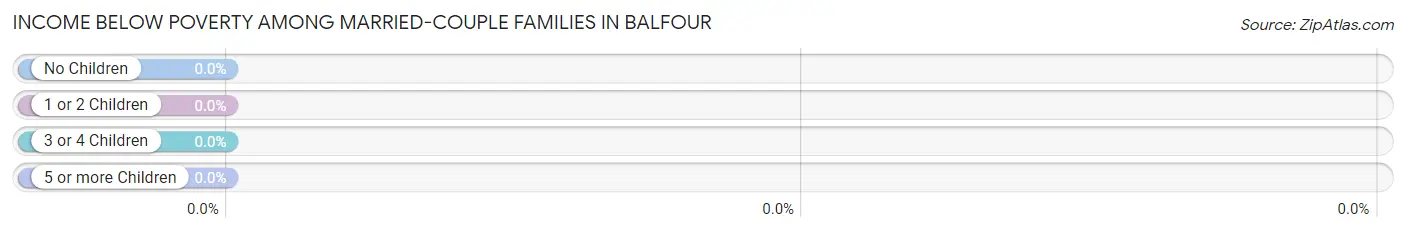
| Children | Above Poverty | Below Poverty |
| No Children | 175 (100.0%) | 0 (0.0%) |
| 1 or 2 Children | 74 (100.0%) | 0 (0.0%) |
| 3 or 4 Children | 0 (0.0%) | 0 (0.0%) |
| 5 or more Children | 0 (0.0%) | 0 (0.0%) |
| Total | 249 (100.0%) | 0 (0.0%) |
Income Below Poverty Among Single-Parent Households in Balfour
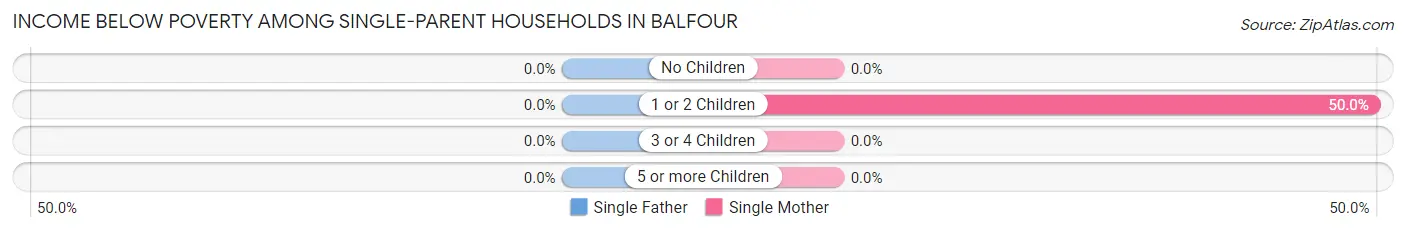
| Children | Single Father | Single Mother |
| No Children | 0 (0.0%) | 0 (0.0%) |
| 1 or 2 Children | 0 (0.0%) | 11 (50.0%) |
| 3 or 4 Children | 0 (0.0%) | 0 (0.0%) |
| 5 or more Children | 0 (0.0%) | 0 (0.0%) |
| Total | 0 (0.0%) | 11 (17.7%) |
Income Below Poverty Among Married-Couple vs Single-Parent Households in Balfour
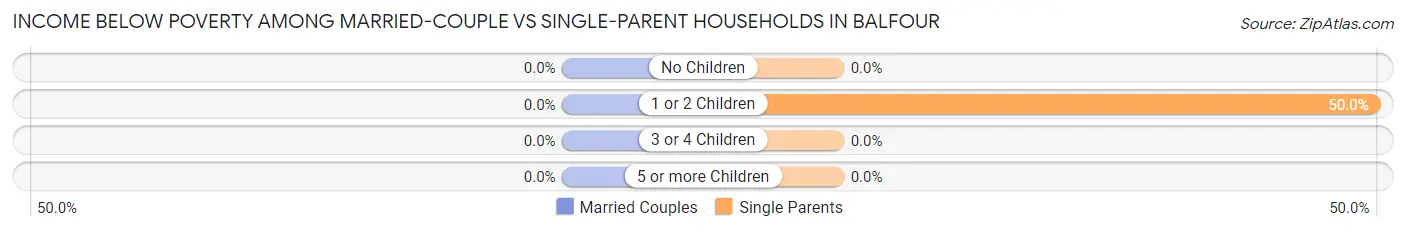
| Children | Married-Couple Families | Single-Parent Households |
| No Children | 0 (0.0%) | 0 (0.0%) |
| 1 or 2 Children | 0 (0.0%) | 11 (50.0%) |
| 3 or 4 Children | 0 (0.0%) | 0 (0.0%) |
| 5 or more Children | 0 (0.0%) | 0 (0.0%) |
| Total | 0 (0.0%) | 11 (15.7%) |
Employment Characteristics in Balfour
Employment by Class of Employer in Balfour
Among the 713 employed individuals in Balfour, private company employees (307 | 43.1%), state government employees (109 | 15.3%), and self-employed (not incorporated) (82 | 11.5%) make up the most common classes of employment.
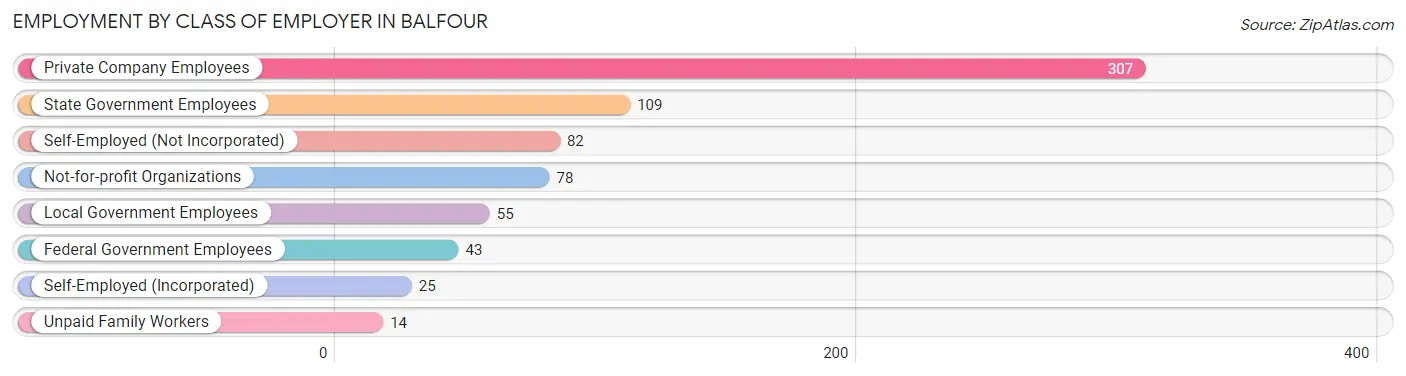
| Employer Class | # Employees | % Employees |
| Private Company Employees | 307 | 43.1% |
| Self-Employed (Incorporated) | 25 | 3.5% |
| Self-Employed (Not Incorporated) | 82 | 11.5% |
| Not-for-profit Organizations | 78 | 10.9% |
| Local Government Employees | 55 | 7.7% |
| State Government Employees | 109 | 15.3% |
| Federal Government Employees | 43 | 6.0% |
| Unpaid Family Workers | 14 | 2.0% |
| Total | 713 | 100.0% |
Employment Status by Age in Balfour
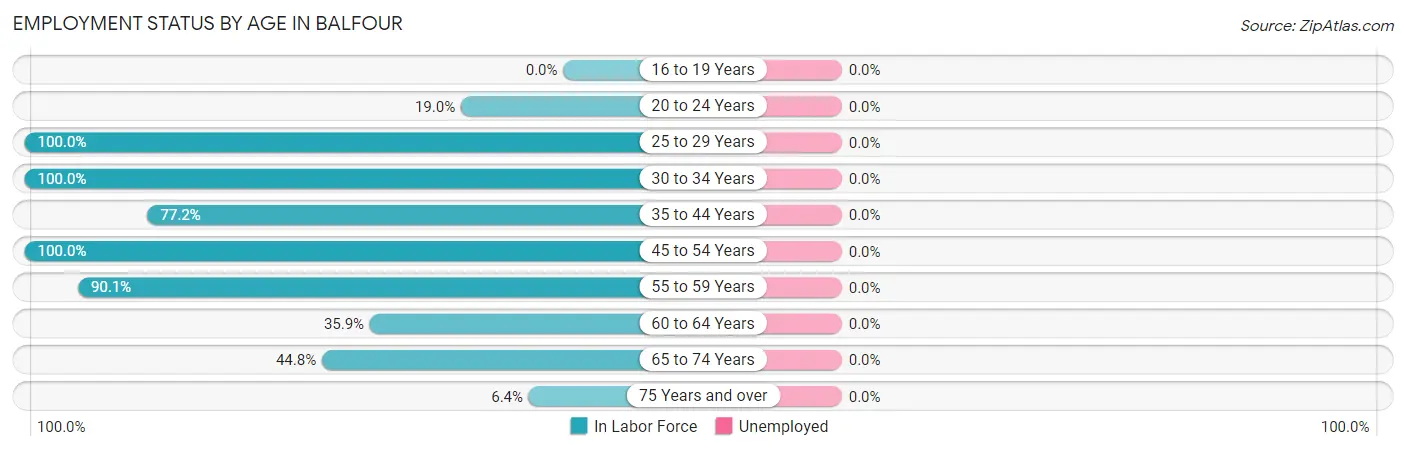
| Age Bracket | In Labor Force | Unemployed |
| 16 to 19 Years | 0 (0.0%) | 0 (0.0%) |
| 20 to 24 Years | 8 (19.0%) | 0 (0.0%) |
| 25 to 29 Years | 134 (100.0%) | 0 (0.0%) |
| 30 to 34 Years | 157 (100.0%) | 0 (0.0%) |
| 35 to 44 Years | 142 (77.2%) | 0 (0.0%) |
| 45 to 54 Years | 105 (100.0%) | 0 (0.0%) |
| 55 to 59 Years | 64 (90.1%) | 0 (0.0%) |
| 60 to 64 Years | 28 (35.9%) | 0 (0.0%) |
| 65 to 74 Years | 69 (44.8%) | 0 (0.0%) |
| 75 Years and over | 6 (6.4%) | 0 (0.0%) |
| Total | 713 (70.0%) | 0 (0.0%) |
Employment Status by Educational Attainment in Balfour
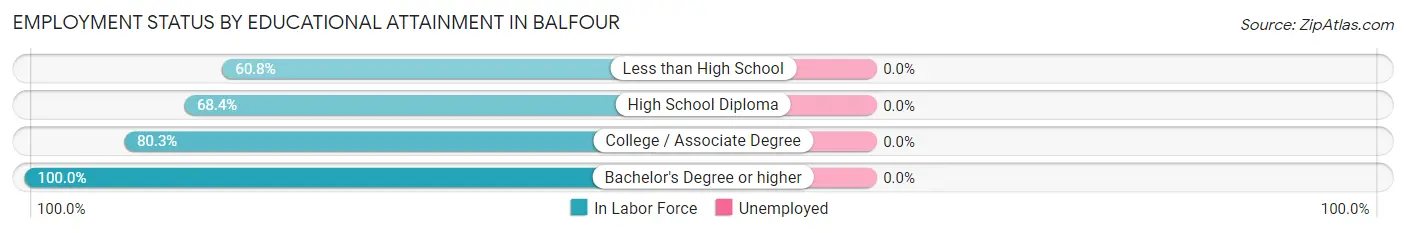
| Educational Attainment | In Labor Force | Unemployed |
| Less than High School | 31 (60.8%) | 0 (0.0%) |
| High School Diploma | 65 (68.4%) | 0 (0.0%) |
| College / Associate Degree | 200 (80.3%) | 0 (0.0%) |
| Bachelor's Degree or higher | 334 (100.0%) | 0 (0.0%) |
| Total | 630 (86.4%) | 0 (0.0%) |
Employment Occupations by Sex in Balfour
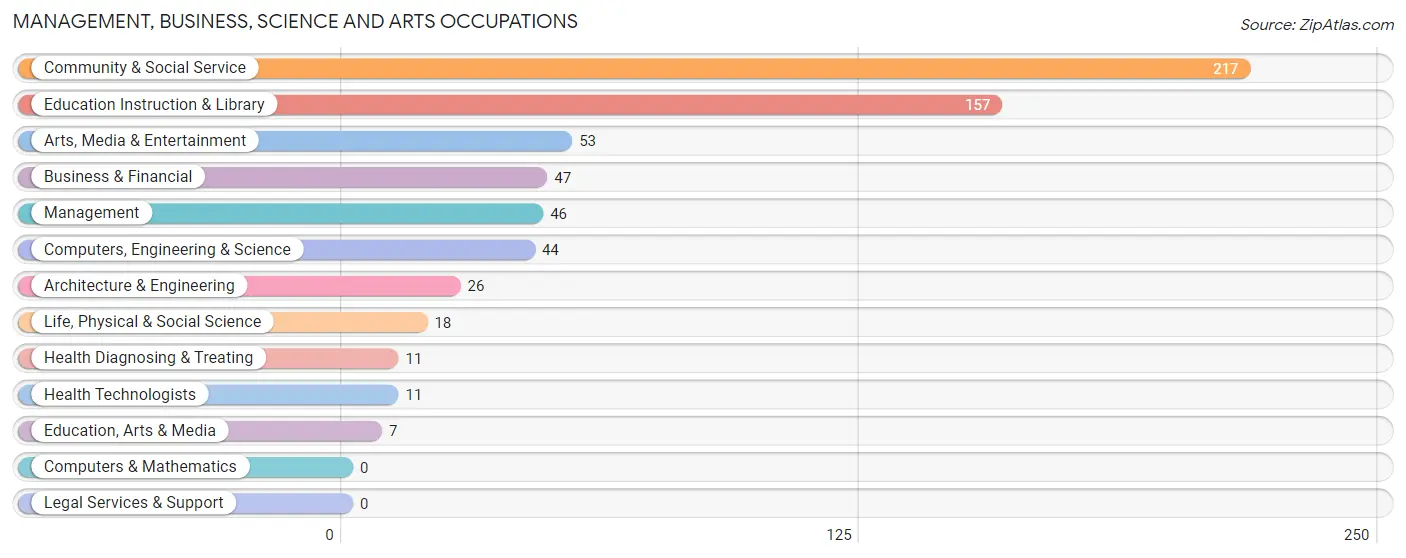
Management, Business, Science and Arts Occupations
The most common Management, Business, Science and Arts occupations in Balfour are Community & Social Service (217 | 30.4%), Education Instruction & Library (157 | 22.0%), Arts, Media & Entertainment (53 | 7.4%), Business & Financial (47 | 6.6%), and Management (46 | 6.5%).
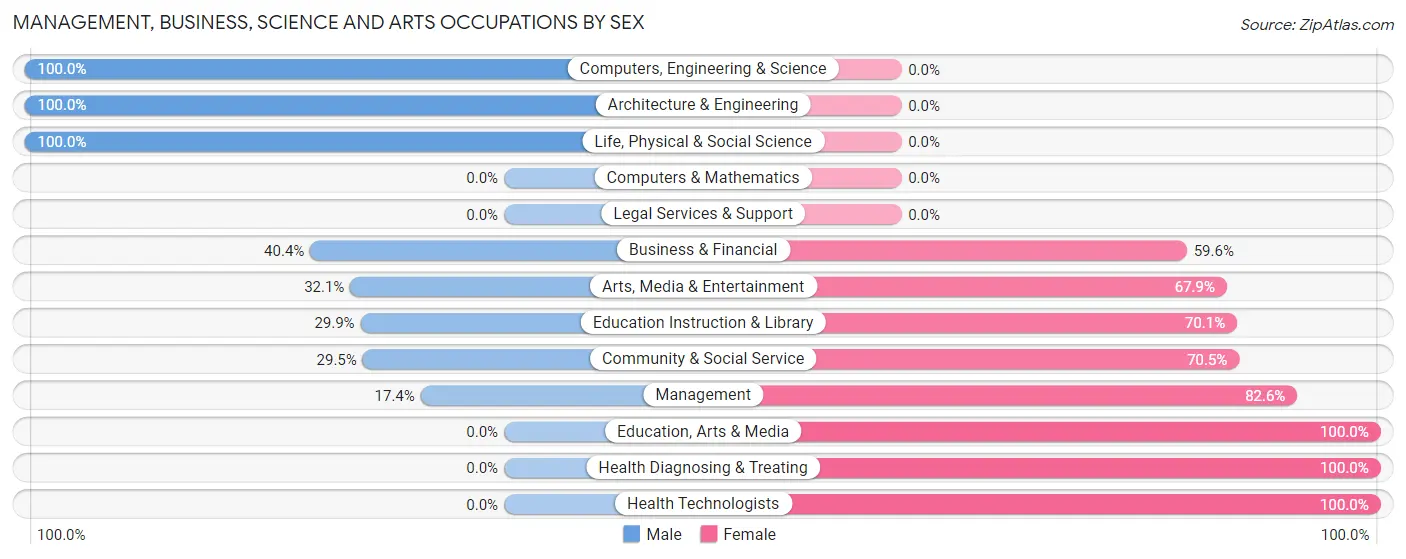
Management, Business, Science and Arts Occupations by Sex
Within the Management, Business, Science and Arts occupations in Balfour, the most male-oriented occupations are Computers, Engineering & Science (100.0%), Architecture & Engineering (100.0%), and Life, Physical & Social Science (100.0%), while the most female-oriented occupations are Education, Arts & Media (100.0%), Health Diagnosing & Treating (100.0%), and Health Technologists (100.0%).
| Occupation | Male | Female |
| Management | 8 (17.4%) | 38 (82.6%) |
| Business & Financial | 19 (40.4%) | 28 (59.6%) |
| Computers, Engineering & Science | 44 (100.0%) | 0 (0.0%) |
| Computers & Mathematics | 0 (0.0%) | 0 (0.0%) |
| Architecture & Engineering | 26 (100.0%) | 0 (0.0%) |
| Life, Physical & Social Science | 18 (100.0%) | 0 (0.0%) |
| Community & Social Service | 64 (29.5%) | 153 (70.5%) |
| Education, Arts & Media | 0 (0.0%) | 7 (100.0%) |
| Legal Services & Support | 0 (0.0%) | 0 (0.0%) |
| Education Instruction & Library | 47 (29.9%) | 110 (70.1%) |
| Arts, Media & Entertainment | 17 (32.1%) | 36 (67.9%) |
| Health Diagnosing & Treating | 0 (0.0%) | 11 (100.0%) |
| Health Technologists | 0 (0.0%) | 11 (100.0%) |
| Total (Category) | 135 (37.0%) | 230 (63.0%) |
| Total (Overall) | 341 (47.8%) | 372 (52.2%) |
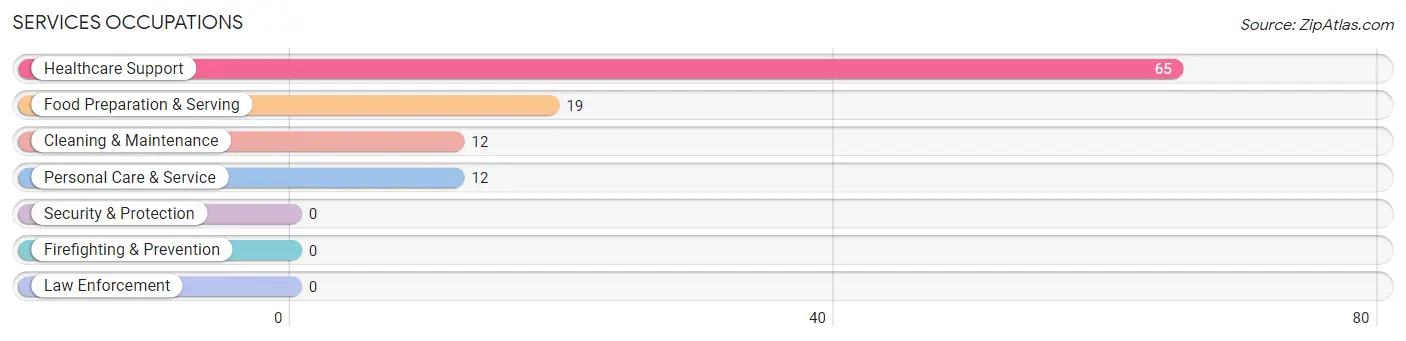
Services Occupations
The most common Services occupations in Balfour are Healthcare Support (65 | 9.1%), Food Preparation & Serving (19 | 2.7%), Cleaning & Maintenance (12 | 1.7%), and Personal Care & Service (12 | 1.7%).
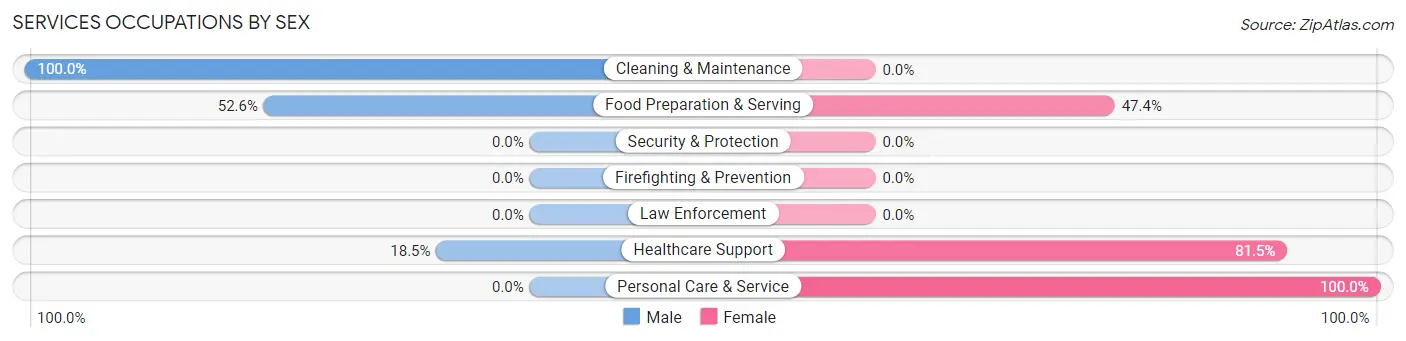
Services Occupations by Sex
Within the Services occupations in Balfour, the most male-oriented occupations are Cleaning & Maintenance (100.0%), Food Preparation & Serving (52.6%), and Healthcare Support (18.5%), while the most female-oriented occupations are Personal Care & Service (100.0%), Healthcare Support (81.5%), and Food Preparation & Serving (47.4%).
| Occupation | Male | Female |
| Healthcare Support | 12 (18.5%) | 53 (81.5%) |
| Security & Protection | 0 (0.0%) | 0 (0.0%) |
| Firefighting & Prevention | 0 (0.0%) | 0 (0.0%) |
| Law Enforcement | 0 (0.0%) | 0 (0.0%) |
| Food Preparation & Serving | 10 (52.6%) | 9 (47.4%) |
| Cleaning & Maintenance | 12 (100.0%) | 0 (0.0%) |
| Personal Care & Service | 0 (0.0%) | 12 (100.0%) |
| Total (Category) | 34 (31.5%) | 74 (68.5%) |
| Total (Overall) | 341 (47.8%) | 372 (52.2%) |
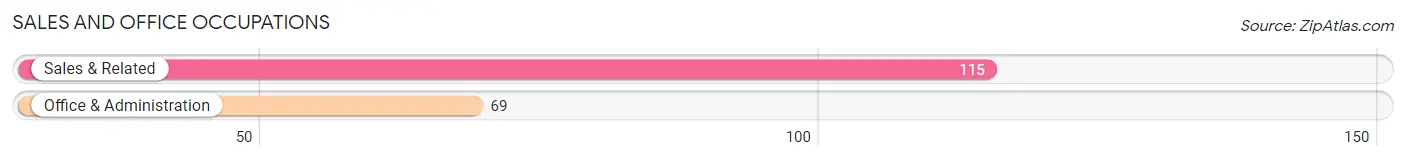
Sales and Office Occupations
The most common Sales and Office occupations in Balfour are Sales & Related (115 | 16.1%), and Office & Administration (69 | 9.7%).
Sales and Office Occupations by Sex
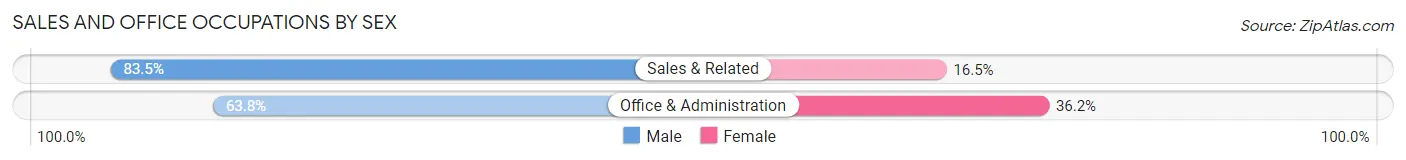
| Occupation | Male | Female |
| Sales & Related | 96 (83.5%) | 19 (16.5%) |
| Office & Administration | 44 (63.8%) | 25 (36.2%) |
| Total (Category) | 140 (76.1%) | 44 (23.9%) |
| Total (Overall) | 341 (47.8%) | 372 (52.2%) |
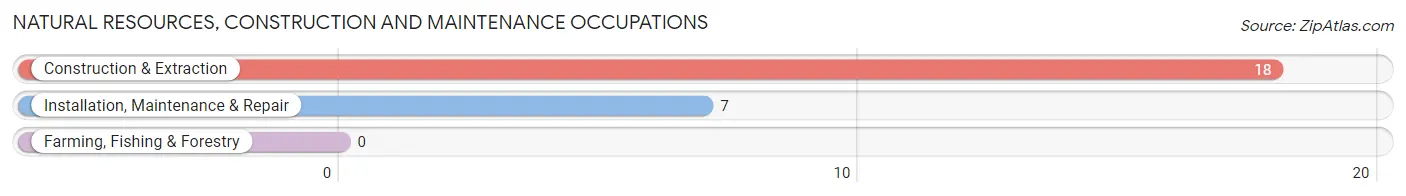
Natural Resources, Construction and Maintenance Occupations
The most common Natural Resources, Construction and Maintenance occupations in Balfour are Construction & Extraction (18 | 2.5%), and Installation, Maintenance & Repair (7 | 1.0%).
Natural Resources, Construction and Maintenance Occupations by Sex
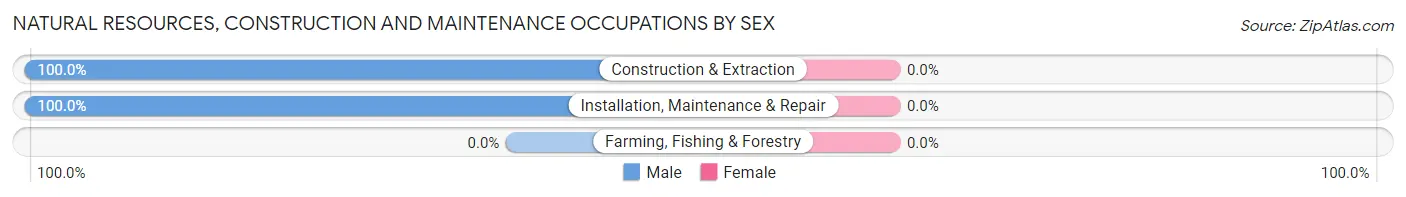
| Occupation | Male | Female |
| Farming, Fishing & Forestry | 0 (0.0%) | 0 (0.0%) |
| Construction & Extraction | 18 (100.0%) | 0 (0.0%) |
| Installation, Maintenance & Repair | 7 (100.0%) | 0 (0.0%) |
| Total (Category) | 25 (100.0%) | 0 (0.0%) |
| Total (Overall) | 341 (47.8%) | 372 (52.2%) |
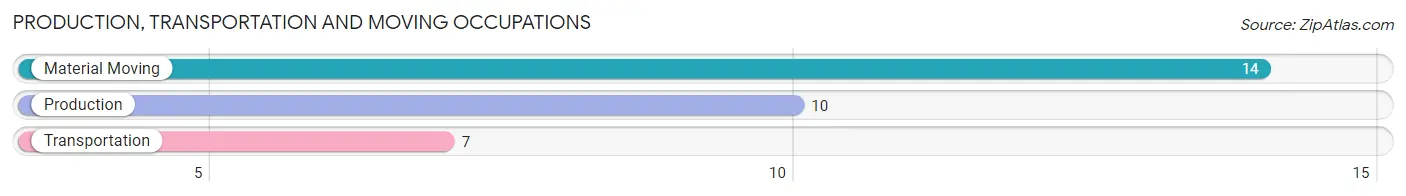
Production, Transportation and Moving Occupations
The most common Production, Transportation and Moving occupations in Balfour are Material Moving (14 | 2.0%), Production (10 | 1.4%), and Transportation (7 | 1.0%).
Production, Transportation and Moving Occupations by Sex
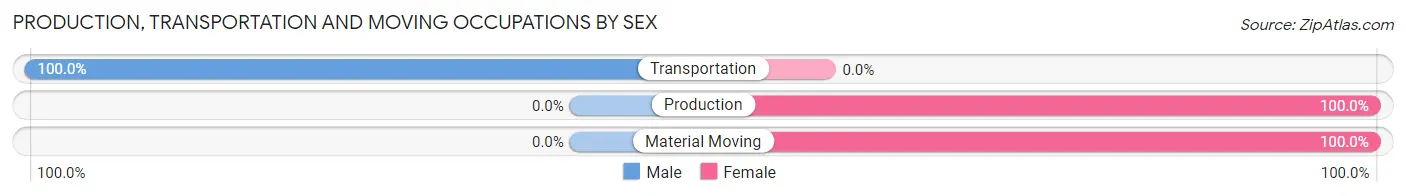
| Occupation | Male | Female |
| Production | 0 (0.0%) | 10 (100.0%) |
| Transportation | 7 (100.0%) | 0 (0.0%) |
| Material Moving | 0 (0.0%) | 14 (100.0%) |
| Total (Category) | 7 (22.6%) | 24 (77.4%) |
| Total (Overall) | 341 (47.8%) | 372 (52.2%) |
Employment Industries by Sex in Balfour
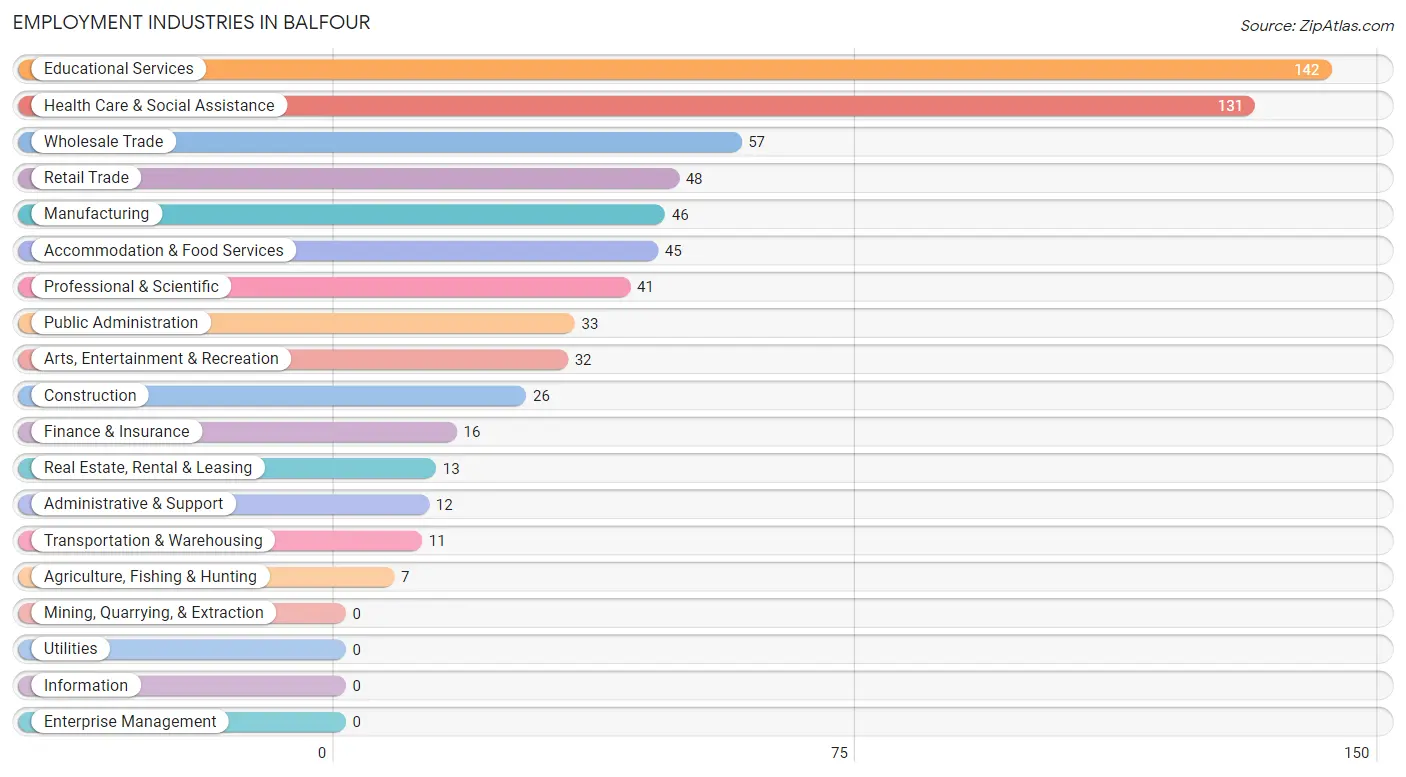
Employment Industries in Balfour
The major employment industries in Balfour include Educational Services (142 | 19.9%), Health Care & Social Assistance (131 | 18.4%), Wholesale Trade (57 | 8.0%), Retail Trade (48 | 6.7%), and Manufacturing (46 | 6.5%).
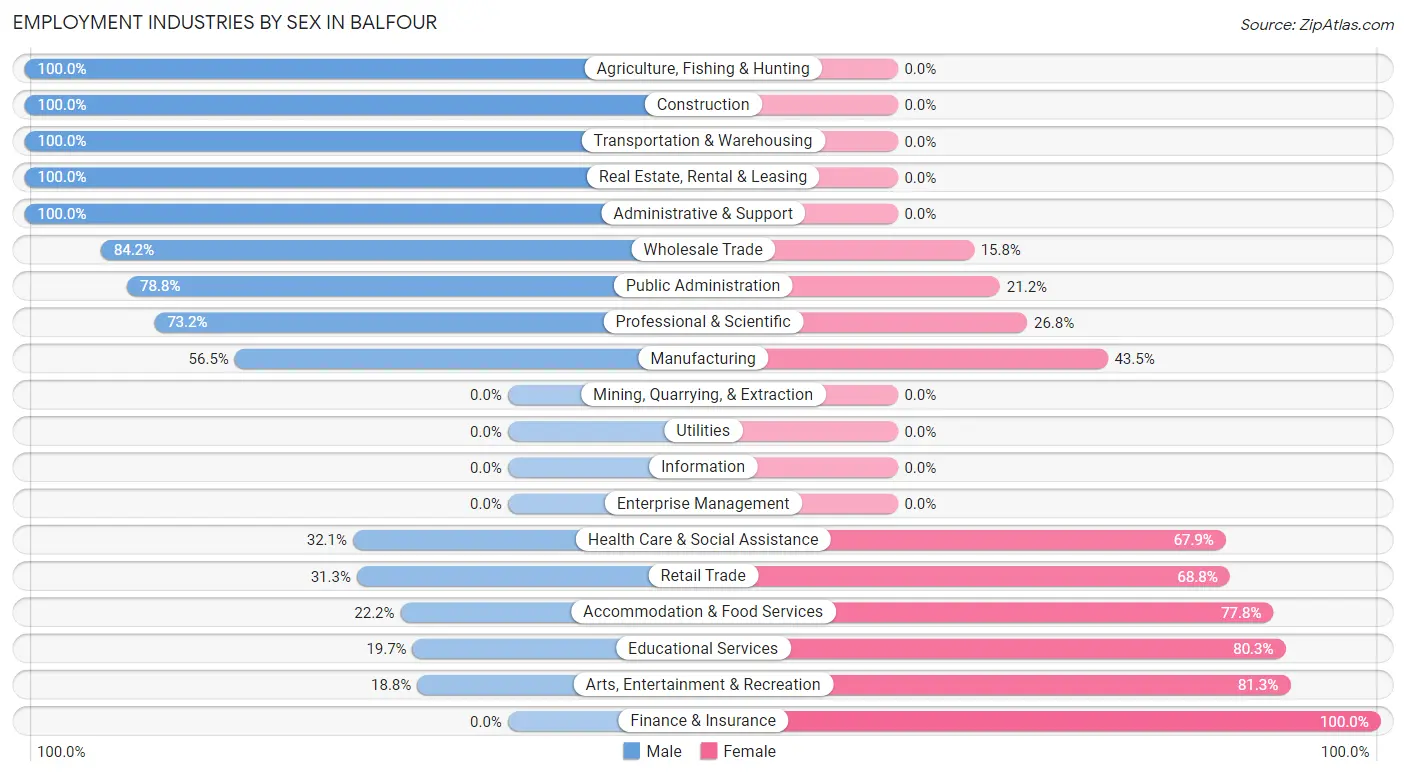
Employment Industries by Sex in Balfour
The Balfour industries that see more men than women are Agriculture, Fishing & Hunting (100.0%), Construction (100.0%), and Transportation & Warehousing (100.0%), whereas the industries that tend to have a higher number of women are Finance & Insurance (100.0%), Arts, Entertainment & Recreation (81.2%), and Educational Services (80.3%).
| Industry | Male | Female |
| Agriculture, Fishing & Hunting | 7 (100.0%) | 0 (0.0%) |
| Mining, Quarrying, & Extraction | 0 (0.0%) | 0 (0.0%) |
| Construction | 26 (100.0%) | 0 (0.0%) |
| Manufacturing | 26 (56.5%) | 20 (43.5%) |
| Wholesale Trade | 48 (84.2%) | 9 (15.8%) |
| Retail Trade | 15 (31.2%) | 33 (68.8%) |
| Transportation & Warehousing | 11 (100.0%) | 0 (0.0%) |
| Utilities | 0 (0.0%) | 0 (0.0%) |
| Information | 0 (0.0%) | 0 (0.0%) |
| Finance & Insurance | 0 (0.0%) | 16 (100.0%) |
| Real Estate, Rental & Leasing | 13 (100.0%) | 0 (0.0%) |
| Professional & Scientific | 30 (73.2%) | 11 (26.8%) |
| Enterprise Management | 0 (0.0%) | 0 (0.0%) |
| Administrative & Support | 12 (100.0%) | 0 (0.0%) |
| Educational Services | 28 (19.7%) | 114 (80.3%) |
| Health Care & Social Assistance | 42 (32.1%) | 89 (67.9%) |
| Arts, Entertainment & Recreation | 6 (18.8%) | 26 (81.2%) |
| Accommodation & Food Services | 10 (22.2%) | 35 (77.8%) |
| Public Administration | 26 (78.8%) | 7 (21.2%) |
| Total | 341 (47.8%) | 372 (52.2%) |
Education in Balfour
School Enrollment in Balfour
The most common levels of schooling among the 185 students in Balfour are graduate / professional (52 | 28.1%), nursery / preschool (37 | 20.0%), and college / undergraduate (34 | 18.4%).
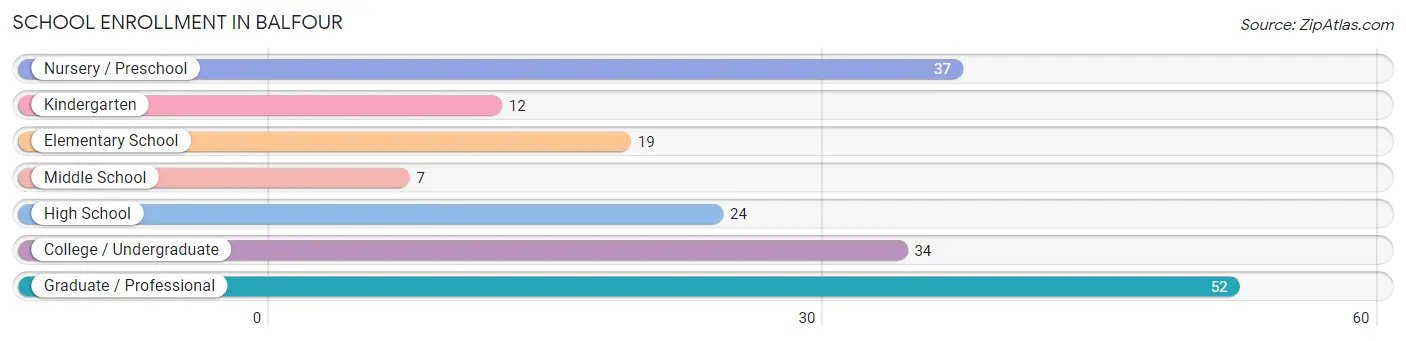
| School Level | # Students | % Students |
| Nursery / Preschool | 37 | 20.0% |
| Kindergarten | 12 | 6.5% |
| Elementary School | 19 | 10.3% |
| Middle School | 7 | 3.8% |
| High School | 24 | 13.0% |
| College / Undergraduate | 34 | 18.4% |
| Graduate / Professional | 52 | 28.1% |
| Total | 185 | 100.0% |
School Enrollment by Age by Funding Source in Balfour
Out of a total of 185 students who are enrolled in schools in Balfour, 71 (38.4%) attend a private institution, while the remaining 114 (61.6%) are enrolled in public schools. The age group of 3 to 4 year olds has the highest likelihood of being enrolled in private schools, with 37 (100.0% in the age bracket) enrolled. Conversely, the age group of 5 to 9 year old has the lowest likelihood of being enrolled in a private school, with 21 (100.0% in the age bracket) attending a public institution.
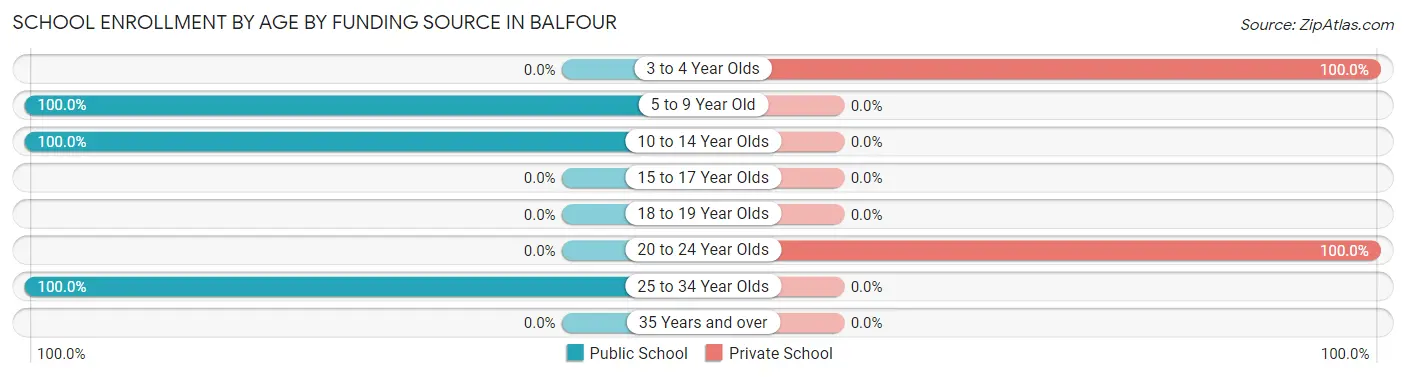
| Age Bracket | Public School | Private School |
| 3 to 4 Year Olds | 0 (0.0%) | 37 (100.0%) |
| 5 to 9 Year Old | 21 (100.0%) | 0 (0.0%) |
| 10 to 14 Year Olds | 41 (100.0%) | 0 (0.0%) |
| 15 to 17 Year Olds | 0 (0.0%) | 0 (0.0%) |
| 18 to 19 Year Olds | 0 (0.0%) | 0 (0.0%) |
| 20 to 24 Year Olds | 0 (0.0%) | 34 (100.0%) |
| 25 to 34 Year Olds | 52 (100.0%) | 0 (0.0%) |
| 35 Years and over | 0 (0.0%) | 0 (0.0%) |
| Total | 114 (61.6%) | 71 (38.4%) |
Educational Attainment by Field of Study in Balfour
Business (99 | 19.6%), engineering (73 | 14.5%), science & technology (65 | 12.9%), education (55 | 10.9%), and computers & mathematics (44 | 8.7%) are the most common fields of study among 504 individuals in Balfour who have obtained a bachelor's degree or higher.
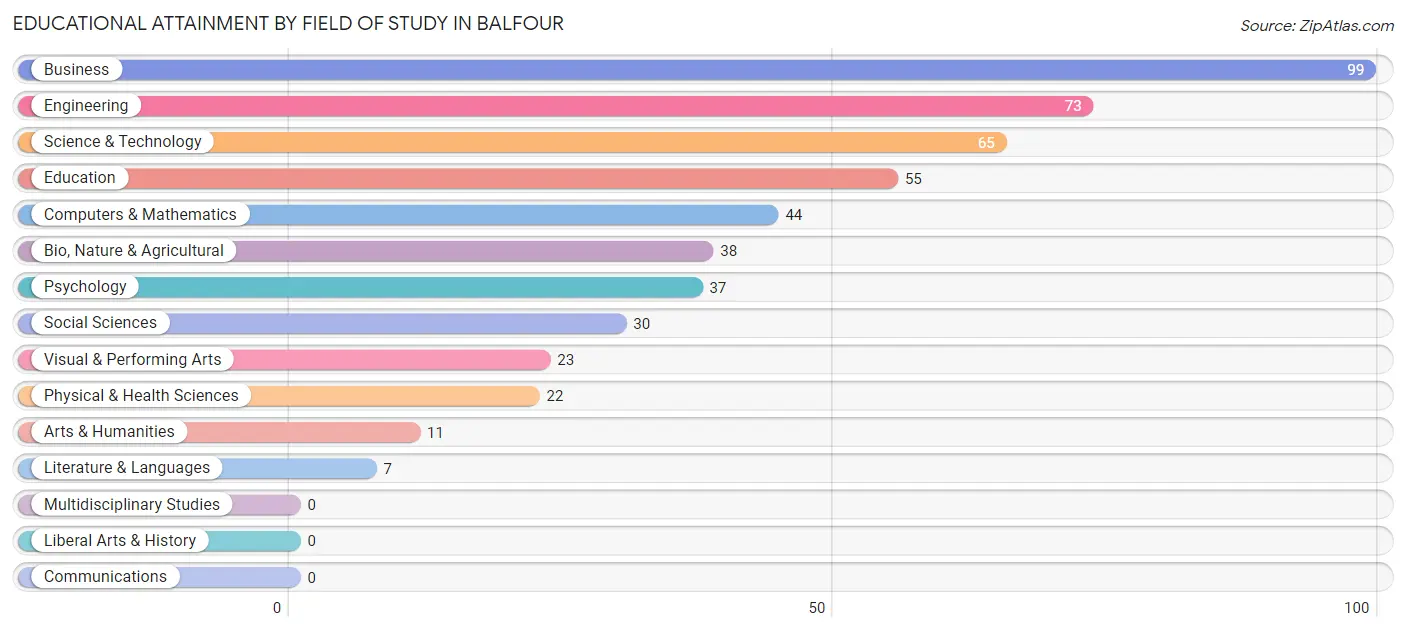
| Field of Study | # Graduates | % Graduates |
| Computers & Mathematics | 44 | 8.7% |
| Bio, Nature & Agricultural | 38 | 7.5% |
| Physical & Health Sciences | 22 | 4.4% |
| Psychology | 37 | 7.3% |
| Social Sciences | 30 | 5.9% |
| Engineering | 73 | 14.5% |
| Multidisciplinary Studies | 0 | 0.0% |
| Science & Technology | 65 | 12.9% |
| Business | 99 | 19.6% |
| Education | 55 | 10.9% |
| Literature & Languages | 7 | 1.4% |
| Liberal Arts & History | 0 | 0.0% |
| Visual & Performing Arts | 23 | 4.6% |
| Communications | 0 | 0.0% |
| Arts & Humanities | 11 | 2.2% |
| Total | 504 | 100.0% |
Transportation & Commute in Balfour
Vehicle Availability by Sex in Balfour
The most prevalent vehicle ownership categories in Balfour are males with 1 vehicle (132, accounting for 38.7%) and females with 1 vehicle (194, making up 35.5%).
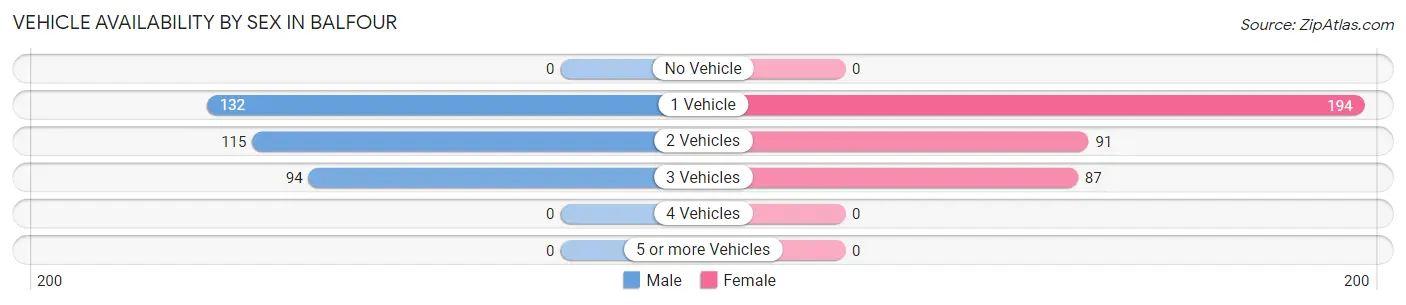
| Vehicles Available | Male | Female |
| No Vehicle | 0 (0.0%) | 0 (0.0%) |
| 1 Vehicle | 132 (38.7%) | 194 (52.1%) |
| 2 Vehicles | 115 (33.7%) | 91 (24.5%) |
| 3 Vehicles | 94 (27.6%) | 87 (23.4%) |
| 4 Vehicles | 0 (0.0%) | 0 (0.0%) |
| 5 or more Vehicles | 0 (0.0%) | 0 (0.0%) |
| Total | 341 (100.0%) | 372 (100.0%) |
Commute Time in Balfour
The most frequently occuring commute durations in Balfour are 10 to 14 minutes (237 commuters, 35.5%), 15 to 19 minutes (199 commuters, 29.8%), and 30 to 34 minutes (76 commuters, 11.4%).
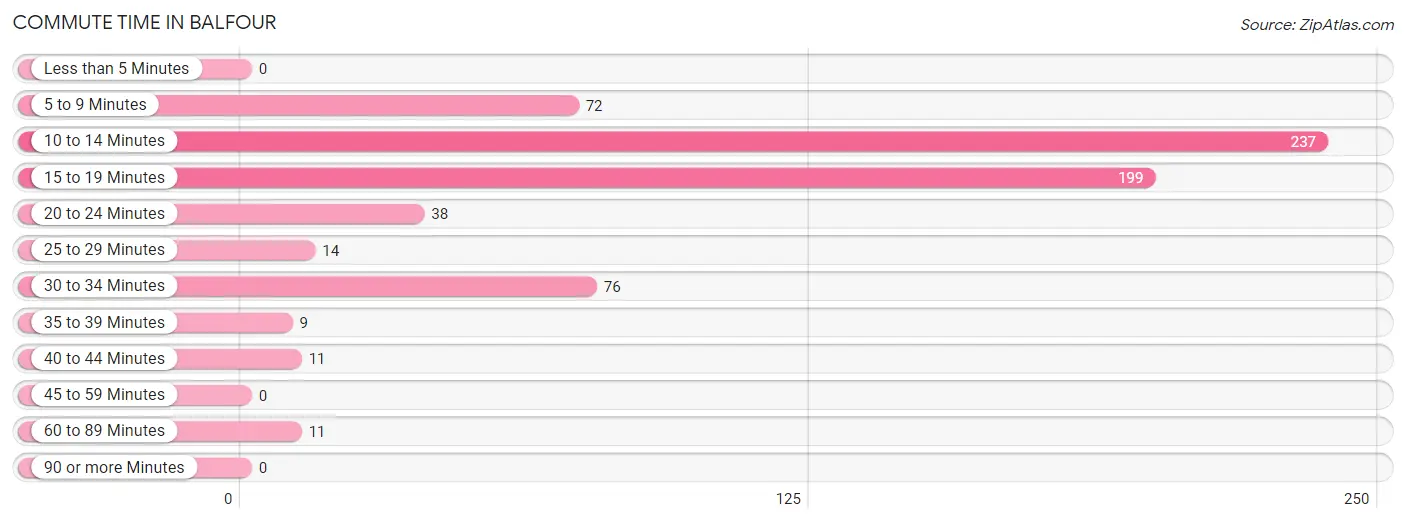
| Commute Time | # Commuters | % Commuters |
| Less than 5 Minutes | 0 | 0.0% |
| 5 to 9 Minutes | 72 | 10.8% |
| 10 to 14 Minutes | 237 | 35.5% |
| 15 to 19 Minutes | 199 | 29.8% |
| 20 to 24 Minutes | 38 | 5.7% |
| 25 to 29 Minutes | 14 | 2.1% |
| 30 to 34 Minutes | 76 | 11.4% |
| 35 to 39 Minutes | 9 | 1.3% |
| 40 to 44 Minutes | 11 | 1.7% |
| 45 to 59 Minutes | 0 | 0.0% |
| 60 to 89 Minutes | 11 | 1.7% |
| 90 or more Minutes | 0 | 0.0% |
Commute Time by Sex in Balfour
The most common commute times in Balfour are 15 to 19 minutes (105 commuters, 34.8%) for males and 10 to 14 minutes (142 commuters, 38.9%) for females.
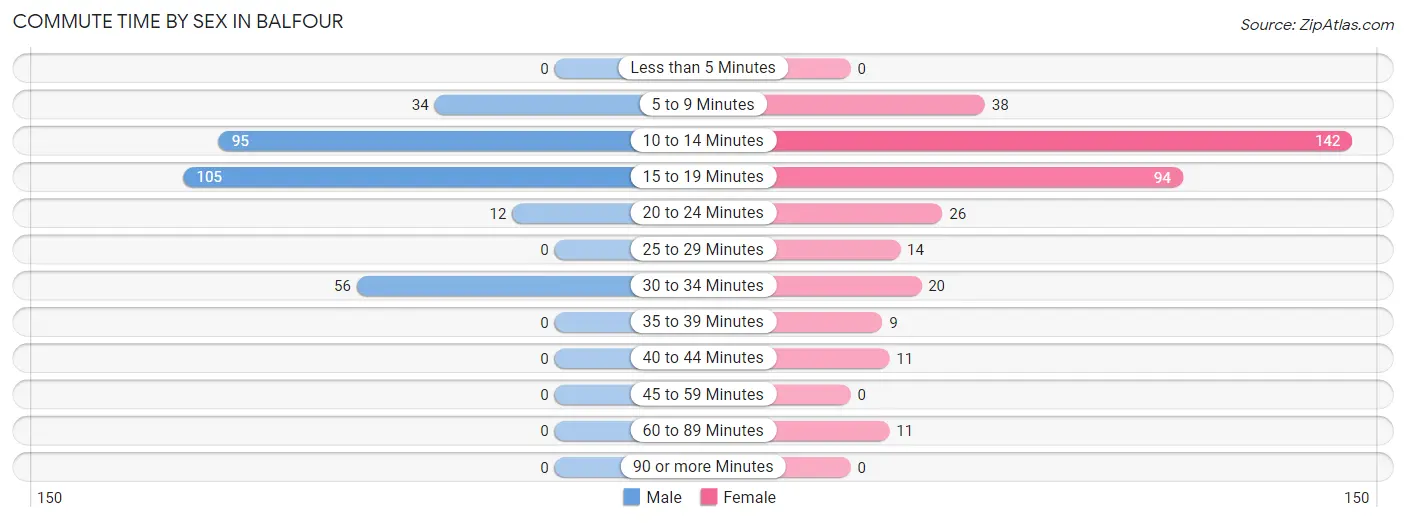
| Commute Time | Male | Female |
| Less than 5 Minutes | 0 (0.0%) | 0 (0.0%) |
| 5 to 9 Minutes | 34 (11.3%) | 38 (10.4%) |
| 10 to 14 Minutes | 95 (31.5%) | 142 (38.9%) |
| 15 to 19 Minutes | 105 (34.8%) | 94 (25.8%) |
| 20 to 24 Minutes | 12 (4.0%) | 26 (7.1%) |
| 25 to 29 Minutes | 0 (0.0%) | 14 (3.8%) |
| 30 to 34 Minutes | 56 (18.5%) | 20 (5.5%) |
| 35 to 39 Minutes | 0 (0.0%) | 9 (2.5%) |
| 40 to 44 Minutes | 0 (0.0%) | 11 (3.0%) |
| 45 to 59 Minutes | 0 (0.0%) | 0 (0.0%) |
| 60 to 89 Minutes | 0 (0.0%) | 11 (3.0%) |
| 90 or more Minutes | 0 (0.0%) | 0 (0.0%) |
Time of Departure to Work by Sex in Balfour
The most frequent times of departure to work in Balfour are 7:00 AM to 7:29 AM (92, 30.5%) for males and 7:00 AM to 7:29 AM (141, 38.6%) for females.
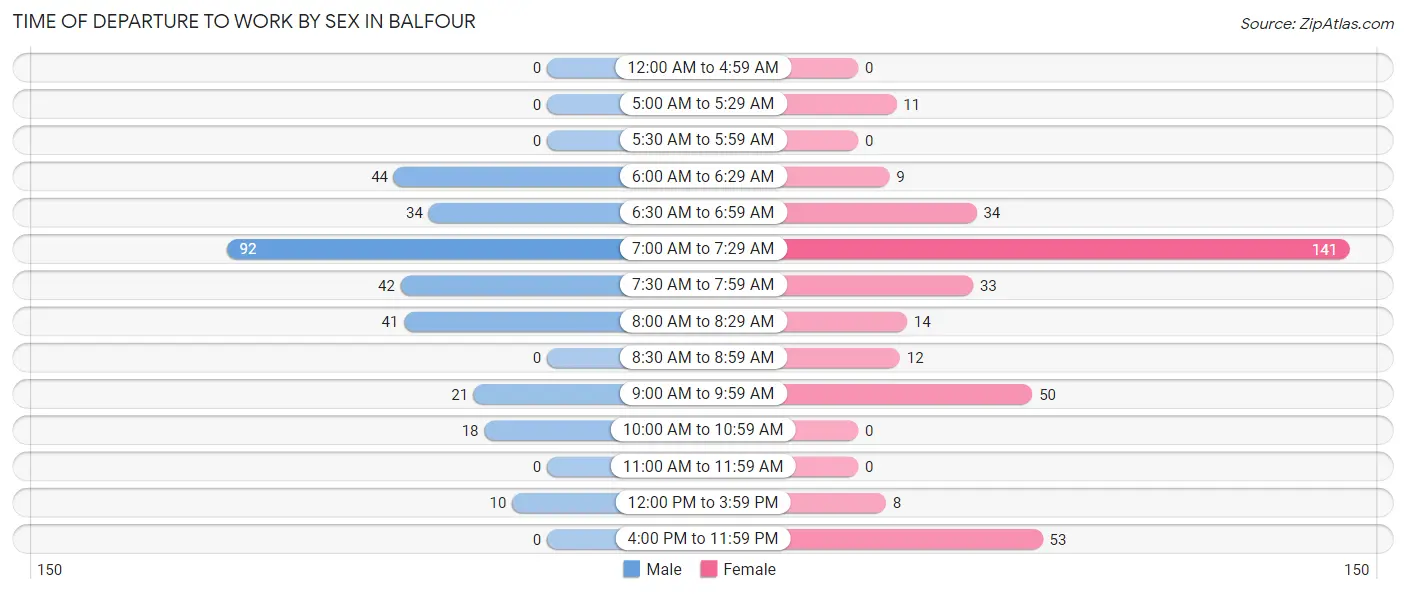
| Time of Departure | Male | Female |
| 12:00 AM to 4:59 AM | 0 (0.0%) | 0 (0.0%) |
| 5:00 AM to 5:29 AM | 0 (0.0%) | 11 (3.0%) |
| 5:30 AM to 5:59 AM | 0 (0.0%) | 0 (0.0%) |
| 6:00 AM to 6:29 AM | 44 (14.6%) | 9 (2.5%) |
| 6:30 AM to 6:59 AM | 34 (11.3%) | 34 (9.3%) |
| 7:00 AM to 7:29 AM | 92 (30.5%) | 141 (38.6%) |
| 7:30 AM to 7:59 AM | 42 (13.9%) | 33 (9.0%) |
| 8:00 AM to 8:29 AM | 41 (13.6%) | 14 (3.8%) |
| 8:30 AM to 8:59 AM | 0 (0.0%) | 12 (3.3%) |
| 9:00 AM to 9:59 AM | 21 (7.0%) | 50 (13.7%) |
| 10:00 AM to 10:59 AM | 18 (6.0%) | 0 (0.0%) |
| 11:00 AM to 11:59 AM | 0 (0.0%) | 0 (0.0%) |
| 12:00 PM to 3:59 PM | 10 (3.3%) | 8 (2.2%) |
| 4:00 PM to 11:59 PM | 0 (0.0%) | 53 (14.5%) |
| Total | 302 (100.0%) | 365 (100.0%) |
Housing Occupancy in Balfour
Occupancy by Ownership in Balfour
Of the total 498 dwellings in Balfour, owner-occupied units account for 339 (68.1%), while renter-occupied units make up 159 (31.9%).
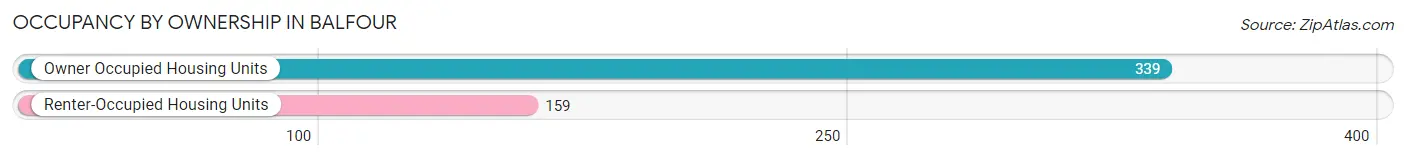
| Occupancy | # Housing Units | % Housing Units |
| Owner Occupied Housing Units | 339 | 68.1% |
| Renter-Occupied Housing Units | 159 | 31.9% |
| Total Occupied Housing Units | 498 | 100.0% |
Occupancy by Household Size in Balfour
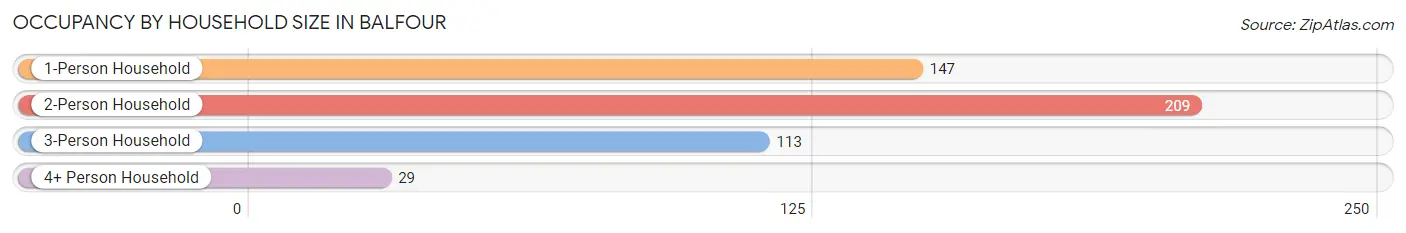
| Household Size | # Housing Units | % Housing Units |
| 1-Person Household | 147 | 29.5% |
| 2-Person Household | 209 | 42.0% |
| 3-Person Household | 113 | 22.7% |
| 4+ Person Household | 29 | 5.8% |
| Total Housing Units | 498 | 100.0% |
Occupancy by Ownership by Household Size in Balfour
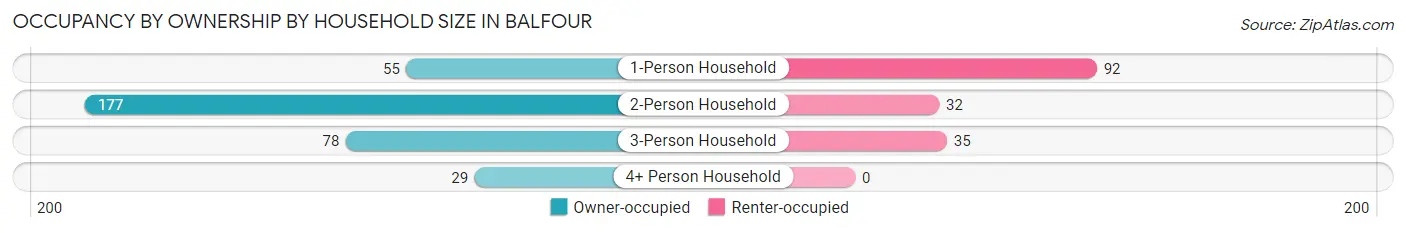
| Household Size | Owner-occupied | Renter-occupied |
| 1-Person Household | 55 (37.4%) | 92 (62.6%) |
| 2-Person Household | 177 (84.7%) | 32 (15.3%) |
| 3-Person Household | 78 (69.0%) | 35 (31.0%) |
| 4+ Person Household | 29 (100.0%) | 0 (0.0%) |
| Total Housing Units | 339 (68.1%) | 159 (31.9%) |
Occupancy by Educational Attainment in Balfour
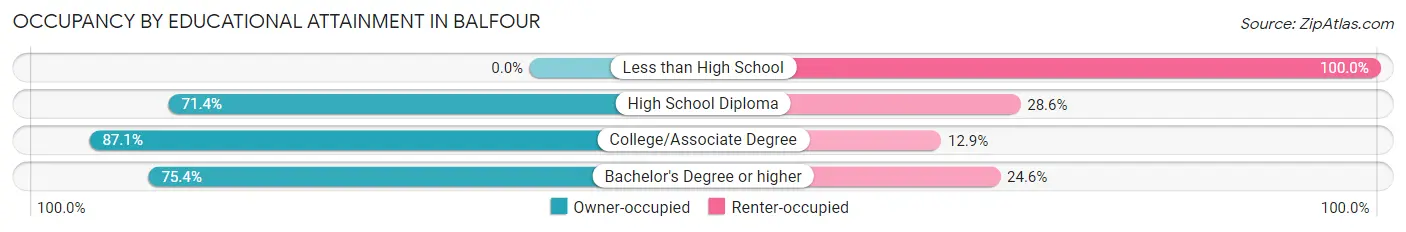
| Household Size | Owner-occupied | Renter-occupied |
| Less than High School | 0 (0.0%) | 62 (100.0%) |
| High School Diploma | 30 (71.4%) | 12 (28.6%) |
| College/Associate Degree | 88 (87.1%) | 13 (12.9%) |
| Bachelor's Degree or higher | 221 (75.4%) | 72 (24.6%) |
Occupancy by Age of Householder in Balfour
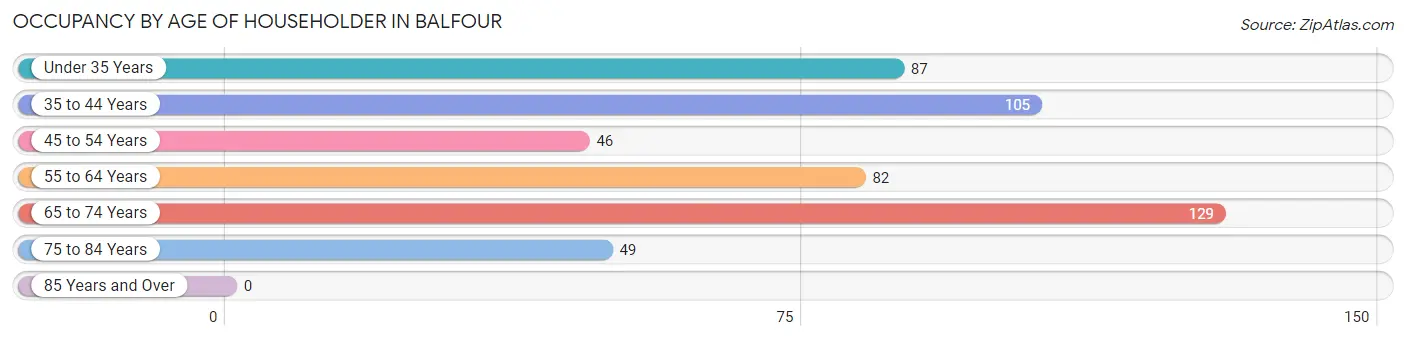
| Age Bracket | # Households | % Households |
| Under 35 Years | 87 | 17.5% |
| 35 to 44 Years | 105 | 21.1% |
| 45 to 54 Years | 46 | 9.2% |
| 55 to 64 Years | 82 | 16.5% |
| 65 to 74 Years | 129 | 25.9% |
| 75 to 84 Years | 49 | 9.8% |
| 85 Years and Over | 0 | 0.0% |
| Total | 498 | 100.0% |
Housing Finances in Balfour
Median Income by Occupancy in Balfour
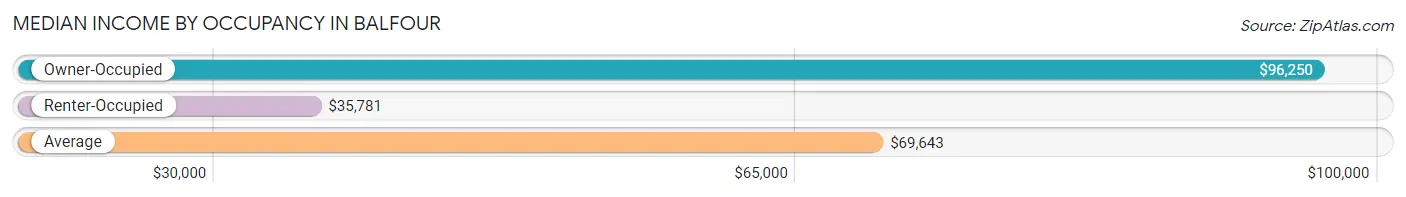
| Occupancy Type | # Households | Median Income |
| Owner-Occupied | 339 (68.1%) | $96,250 |
| Renter-Occupied | 159 (31.9%) | $35,781 |
| Average | 498 (100.0%) | $69,643 |
Occupancy by Householder Income Bracket in Balfour
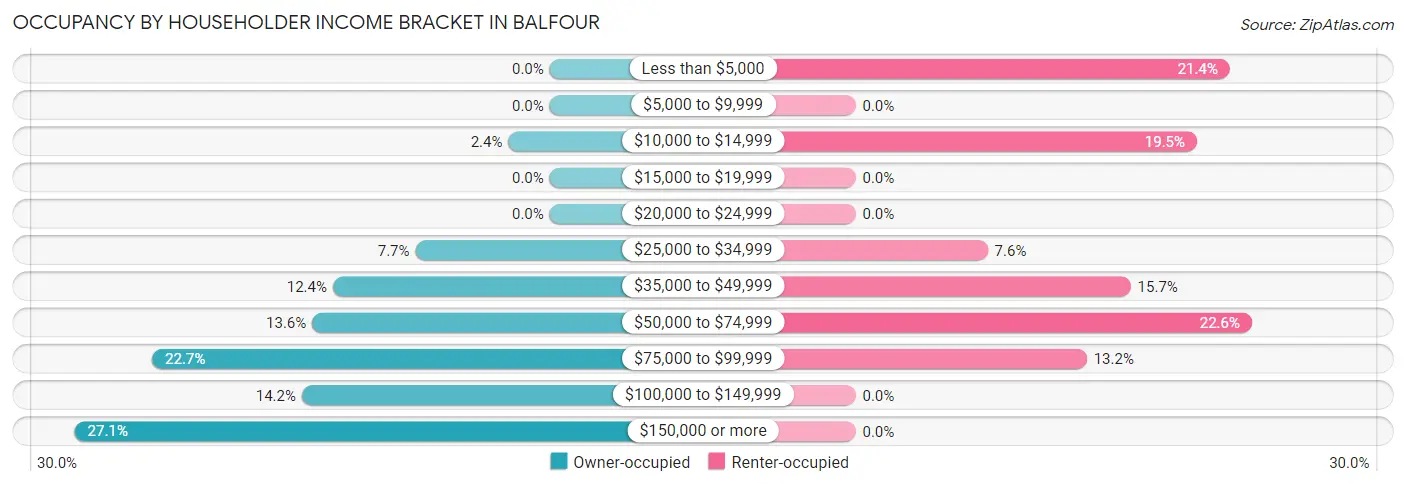
| Income Bracket | Owner-occupied | Renter-occupied |
| Less than $5,000 | 0 (0.0%) | 34 (21.4%) |
| $5,000 to $9,999 | 0 (0.0%) | 0 (0.0%) |
| $10,000 to $14,999 | 8 (2.4%) | 31 (19.5%) |
| $15,000 to $19,999 | 0 (0.0%) | 0 (0.0%) |
| $20,000 to $24,999 | 0 (0.0%) | 0 (0.0%) |
| $25,000 to $34,999 | 26 (7.7%) | 12 (7.5%) |
| $35,000 to $49,999 | 42 (12.4%) | 25 (15.7%) |
| $50,000 to $74,999 | 46 (13.6%) | 36 (22.6%) |
| $75,000 to $99,999 | 77 (22.7%) | 21 (13.2%) |
| $100,000 to $149,999 | 48 (14.2%) | 0 (0.0%) |
| $150,000 or more | 92 (27.1%) | 0 (0.0%) |
| Total | 339 (100.0%) | 159 (100.0%) |
Monthly Housing Cost Tiers in Balfour
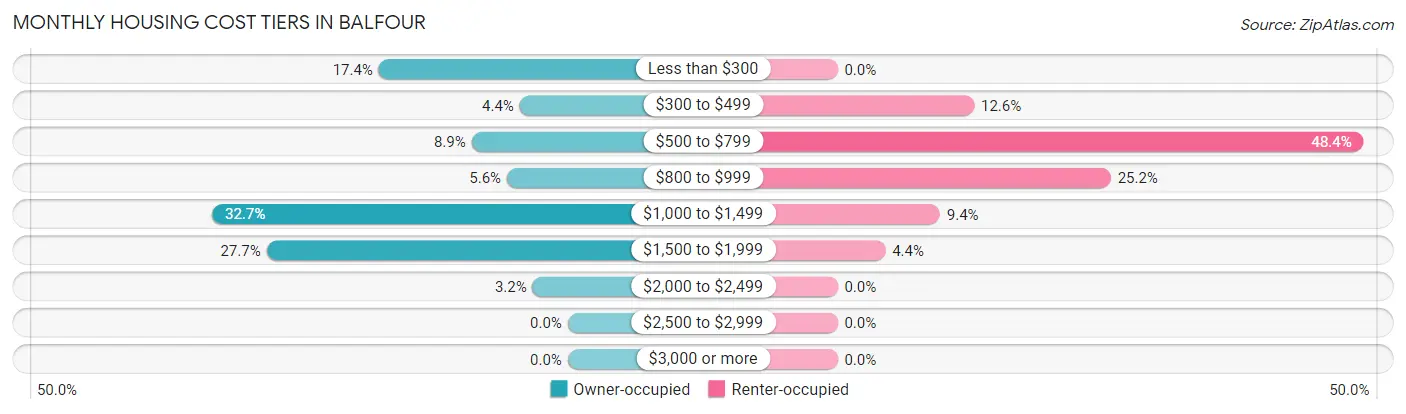
| Monthly Cost | Owner-occupied | Renter-occupied |
| Less than $300 | 59 (17.4%) | 0 (0.0%) |
| $300 to $499 | 15 (4.4%) | 20 (12.6%) |
| $500 to $799 | 30 (8.8%) | 77 (48.4%) |
| $800 to $999 | 19 (5.6%) | 40 (25.2%) |
| $1,000 to $1,499 | 111 (32.7%) | 15 (9.4%) |
| $1,500 to $1,999 | 94 (27.7%) | 7 (4.4%) |
| $2,000 to $2,499 | 11 (3.2%) | 0 (0.0%) |
| $2,500 to $2,999 | 0 (0.0%) | 0 (0.0%) |
| $3,000 or more | 0 (0.0%) | 0 (0.0%) |
| Total | 339 (100.0%) | 159 (100.0%) |
Physical Housing Characteristics in Balfour
Housing Structures in Balfour
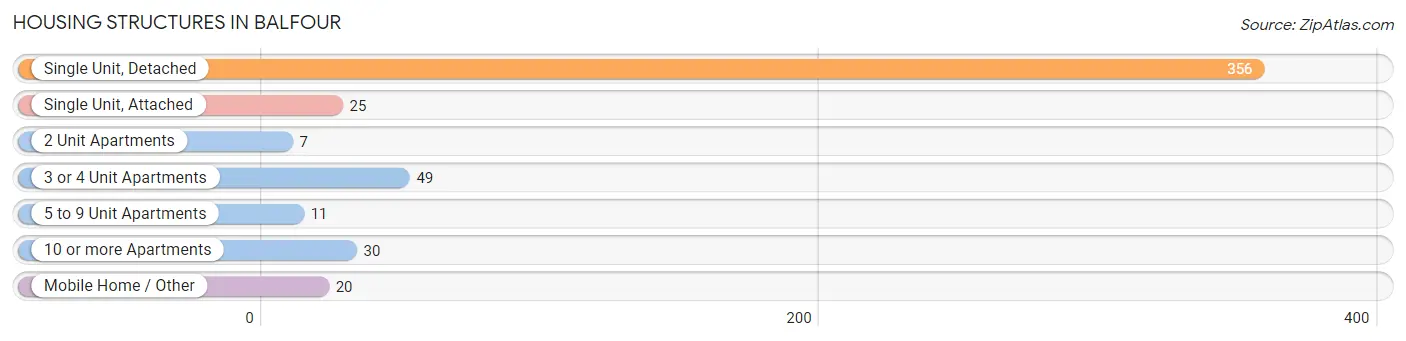
| Structure Type | # Housing Units | % Housing Units |
| Single Unit, Detached | 356 | 71.5% |
| Single Unit, Attached | 25 | 5.0% |
| 2 Unit Apartments | 7 | 1.4% |
| 3 or 4 Unit Apartments | 49 | 9.8% |
| 5 to 9 Unit Apartments | 11 | 2.2% |
| 10 or more Apartments | 30 | 6.0% |
| Mobile Home / Other | 20 | 4.0% |
| Total | 498 | 100.0% |
Housing Structures by Occupancy in Balfour
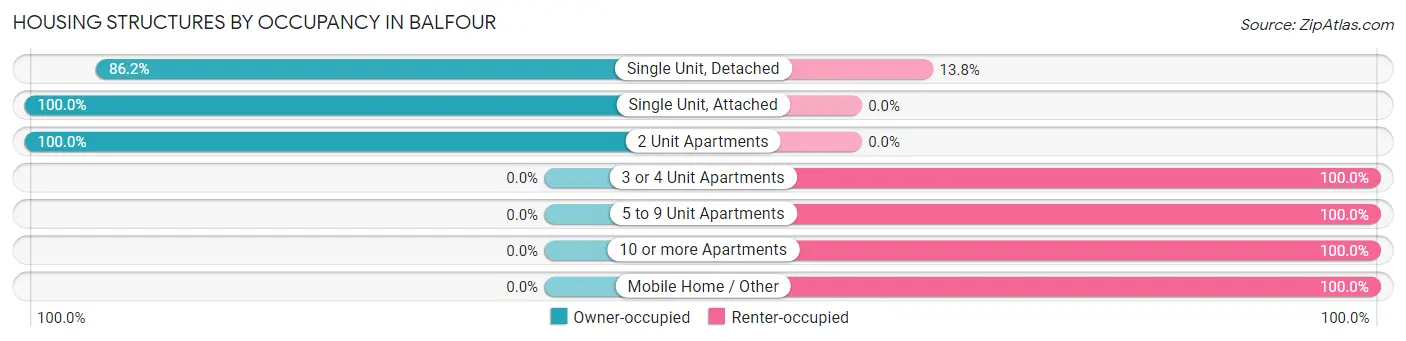
| Structure Type | Owner-occupied | Renter-occupied |
| Single Unit, Detached | 307 (86.2%) | 49 (13.8%) |
| Single Unit, Attached | 25 (100.0%) | 0 (0.0%) |
| 2 Unit Apartments | 7 (100.0%) | 0 (0.0%) |
| 3 or 4 Unit Apartments | 0 (0.0%) | 49 (100.0%) |
| 5 to 9 Unit Apartments | 0 (0.0%) | 11 (100.0%) |
| 10 or more Apartments | 0 (0.0%) | 30 (100.0%) |
| Mobile Home / Other | 0 (0.0%) | 20 (100.0%) |
| Total | 339 (68.1%) | 159 (31.9%) |
Housing Structures by Number of Rooms in Balfour
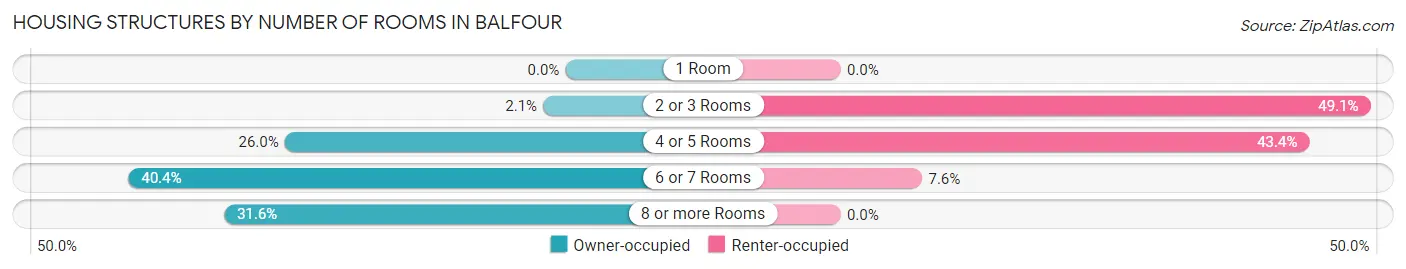
| Number of Rooms | Owner-occupied | Renter-occupied |
| 1 Room | 0 (0.0%) | 0 (0.0%) |
| 2 or 3 Rooms | 7 (2.1%) | 78 (49.1%) |
| 4 or 5 Rooms | 88 (26.0%) | 69 (43.4%) |
| 6 or 7 Rooms | 137 (40.4%) | 12 (7.5%) |
| 8 or more Rooms | 107 (31.6%) | 0 (0.0%) |
| Total | 339 (100.0%) | 159 (100.0%) |
Housing Structure by Heating Type in Balfour
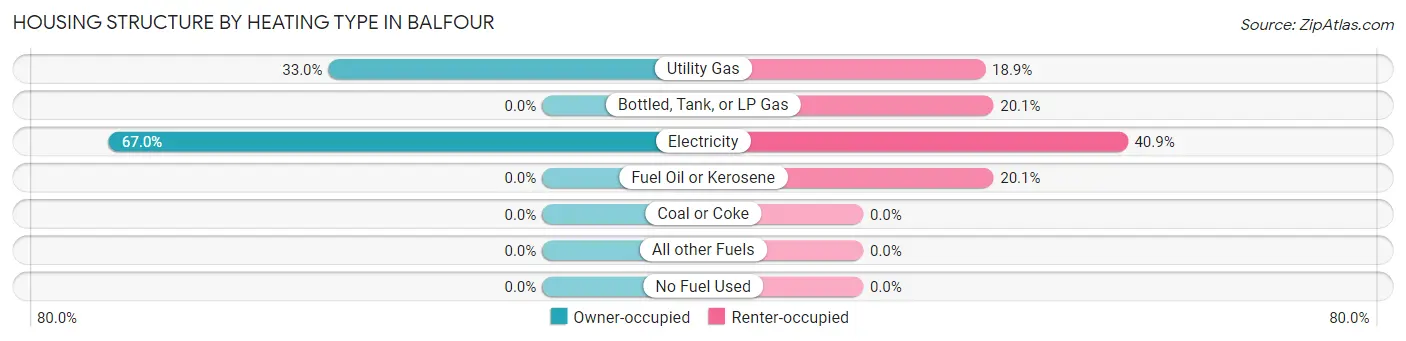
| Heating Type | Owner-occupied | Renter-occupied |
| Utility Gas | 112 (33.0%) | 30 (18.9%) |
| Bottled, Tank, or LP Gas | 0 (0.0%) | 32 (20.1%) |
| Electricity | 227 (67.0%) | 65 (40.9%) |
| Fuel Oil or Kerosene | 0 (0.0%) | 32 (20.1%) |
| Coal or Coke | 0 (0.0%) | 0 (0.0%) |
| All other Fuels | 0 (0.0%) | 0 (0.0%) |
| No Fuel Used | 0 (0.0%) | 0 (0.0%) |
| Total | 339 (100.0%) | 159 (100.0%) |
Household Vehicle Usage in Balfour
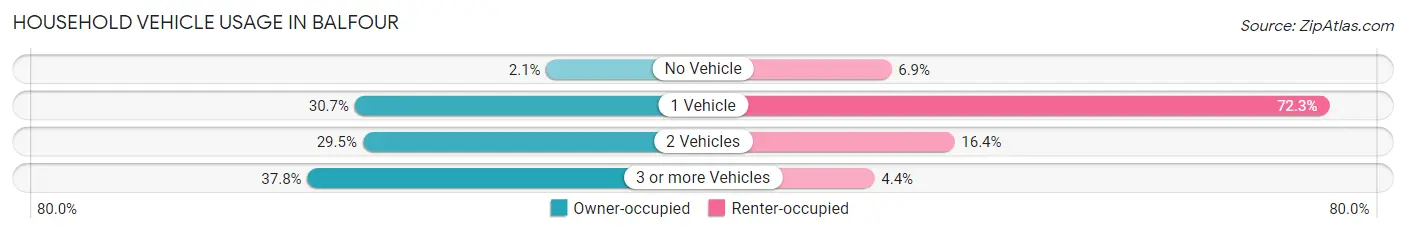
| Vehicles per Household | Owner-occupied | Renter-occupied |
| No Vehicle | 7 (2.1%) | 11 (6.9%) |
| 1 Vehicle | 104 (30.7%) | 115 (72.3%) |
| 2 Vehicles | 100 (29.5%) | 26 (16.4%) |
| 3 or more Vehicles | 128 (37.8%) | 7 (4.4%) |
| Total | 339 (100.0%) | 159 (100.0%) |
Real Estate & Mortgages in Balfour
Real Estate and Mortgage Overview in Balfour
| Characteristic | Without Mortgage | With Mortgage |
| Housing Units | 104 | 235 |
| Median Property Value | $250,000 | $293,600 |
| Median Household Income | - | - |
| Monthly Housing Costs | $292 | $0 |
| Real Estate Taxes | $1,292 | $11 |
Property Value by Mortgage Status in Balfour
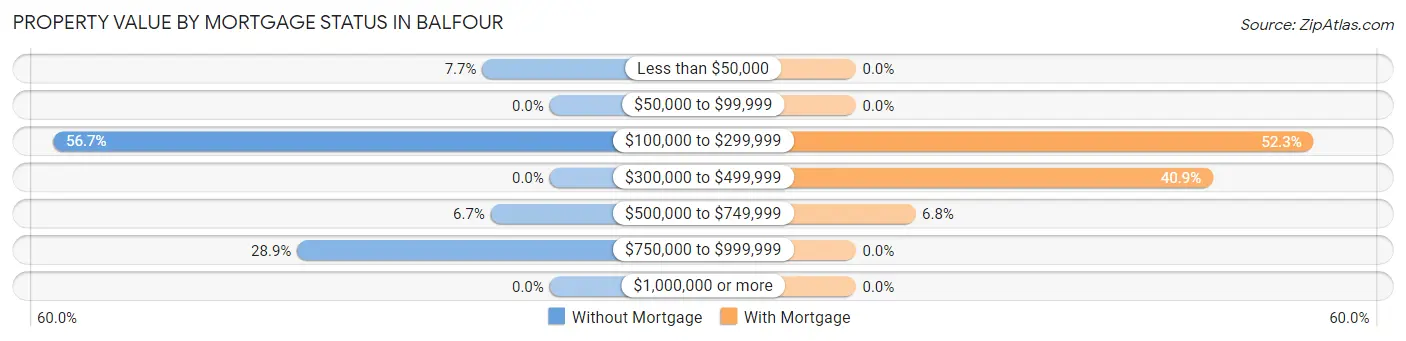
| Property Value | Without Mortgage | With Mortgage |
| Less than $50,000 | 8 (7.7%) | 0 (0.0%) |
| $50,000 to $99,999 | 0 (0.0%) | 0 (0.0%) |
| $100,000 to $299,999 | 59 (56.7%) | 123 (52.3%) |
| $300,000 to $499,999 | 0 (0.0%) | 96 (40.8%) |
| $500,000 to $749,999 | 7 (6.7%) | 16 (6.8%) |
| $750,000 to $999,999 | 30 (28.8%) | 0 (0.0%) |
| $1,000,000 or more | 0 (0.0%) | 0 (0.0%) |
| Total | 104 (100.0%) | 235 (100.0%) |
Household Income by Mortgage Status in Balfour
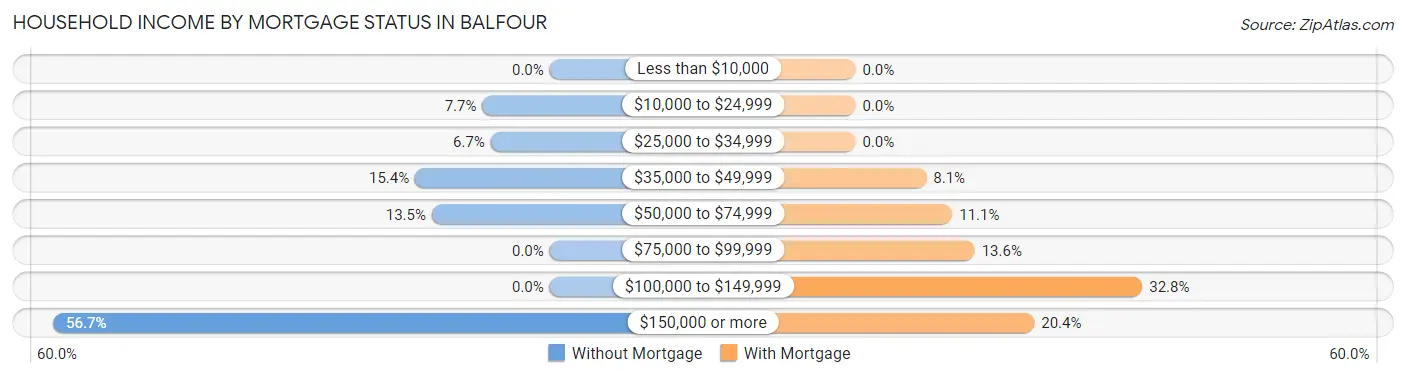
| Household Income | Without Mortgage | With Mortgage |
| Less than $10,000 | 0 (0.0%) | 0 (0.0%) |
| $10,000 to $24,999 | 8 (7.7%) | 0 (0.0%) |
| $25,000 to $34,999 | 7 (6.7%) | 0 (0.0%) |
| $35,000 to $49,999 | 16 (15.4%) | 19 (8.1%) |
| $50,000 to $74,999 | 14 (13.5%) | 26 (11.1%) |
| $75,000 to $99,999 | 0 (0.0%) | 32 (13.6%) |
| $100,000 to $149,999 | 0 (0.0%) | 77 (32.8%) |
| $150,000 or more | 59 (56.7%) | 48 (20.4%) |
| Total | 104 (100.0%) | 235 (100.0%) |
Property Value to Household Income Ratio in Balfour
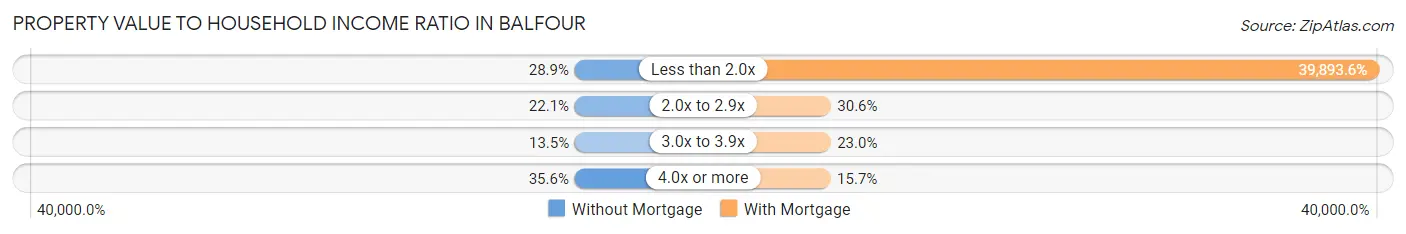
| Value-to-Income Ratio | Without Mortgage | With Mortgage |
| Less than 2.0x | 30 (28.8%) | 93,750 (39,893.6%) |
| 2.0x to 2.9x | 23 (22.1%) | 72 (30.6%) |
| 3.0x to 3.9x | 14 (13.5%) | 54 (23.0%) |
| 4.0x or more | 37 (35.6%) | 37 (15.7%) |
| Total | 104 (100.0%) | 235 (100.0%) |
Real Estate Taxes by Mortgage Status in Balfour
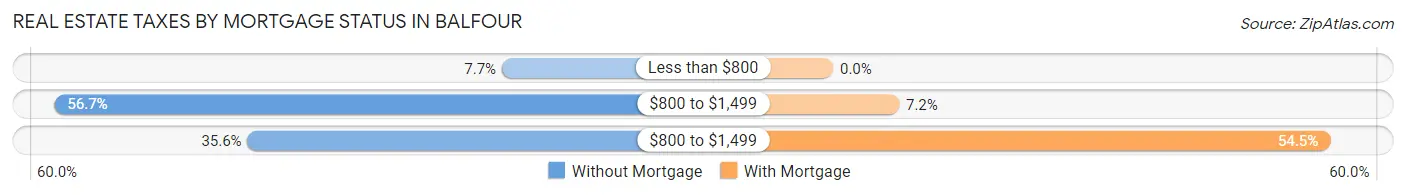
| Property Taxes | Without Mortgage | With Mortgage |
| Less than $800 | 8 (7.7%) | 0 (0.0%) |
| $800 to $1,499 | 59 (56.7%) | 17 (7.2%) |
| $800 to $1,499 | 37 (35.6%) | 128 (54.5%) |
| Total | 104 (100.0%) | 235 (100.0%) |
Health & Disability in Balfour
Health Insurance Coverage by Age in Balfour
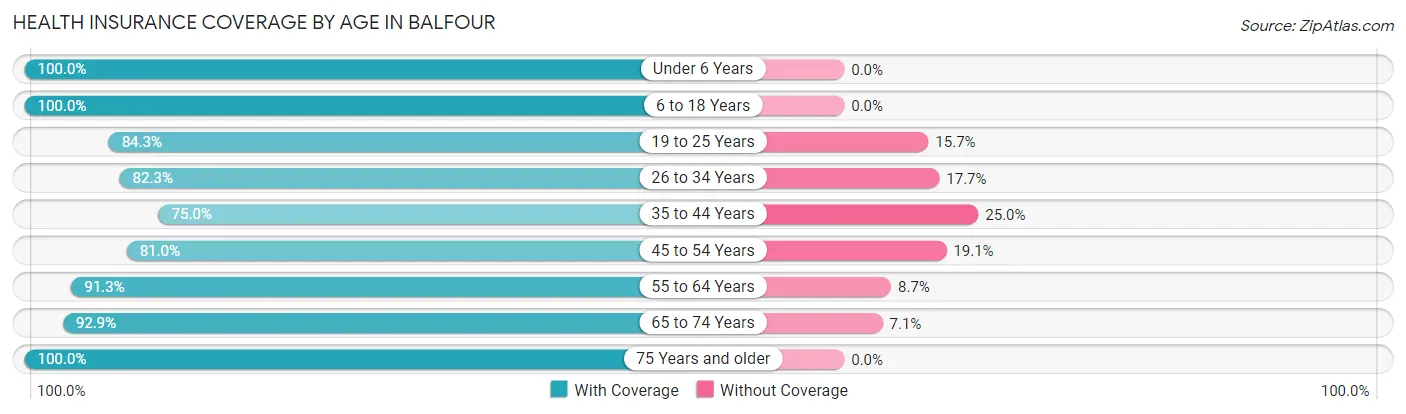
| Age Bracket | With Coverage | Without Coverage |
| Under 6 Years | 61 (100.0%) | 0 (0.0%) |
| 6 to 18 Years | 62 (100.0%) | 0 (0.0%) |
| 19 to 25 Years | 43 (84.3%) | 8 (15.7%) |
| 26 to 34 Years | 232 (82.3%) | 50 (17.7%) |
| 35 to 44 Years | 138 (75.0%) | 46 (25.0%) |
| 45 to 54 Years | 85 (80.9%) | 20 (19.1%) |
| 55 to 64 Years | 136 (91.3%) | 13 (8.7%) |
| 65 to 74 Years | 143 (92.9%) | 11 (7.1%) |
| 75 Years and older | 94 (100.0%) | 0 (0.0%) |
| Total | 994 (87.0%) | 148 (13.0%) |
Health Insurance Coverage by Citizenship Status in Balfour
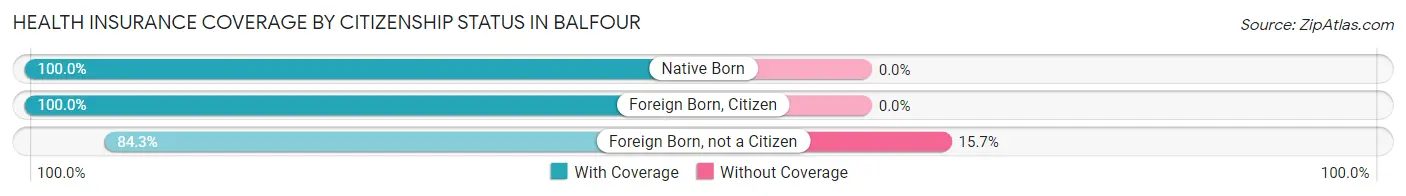
| Citizenship Status | With Coverage | Without Coverage |
| Native Born | 61 (100.0%) | 0 (0.0%) |
| Foreign Born, Citizen | 62 (100.0%) | 0 (0.0%) |
| Foreign Born, not a Citizen | 43 (84.3%) | 8 (15.7%) |
Health Insurance Coverage by Household Income in Balfour
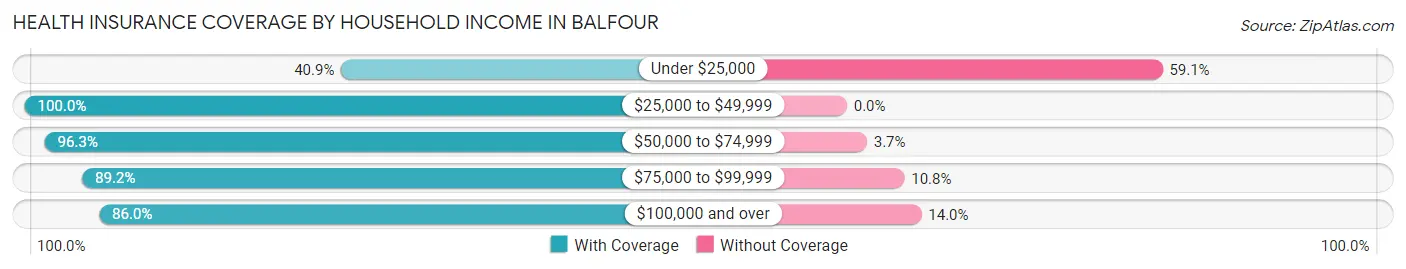
| Household Income | With Coverage | Without Coverage |
| Under $25,000 | 38 (40.9%) | 55 (59.1%) |
| $25,000 to $49,999 | 180 (100.0%) | 0 (0.0%) |
| $50,000 to $74,999 | 206 (96.3%) | 8 (3.7%) |
| $75,000 to $99,999 | 182 (89.2%) | 22 (10.8%) |
| $100,000 and over | 388 (86.0%) | 63 (14.0%) |
Public vs Private Health Insurance Coverage by Age in Balfour
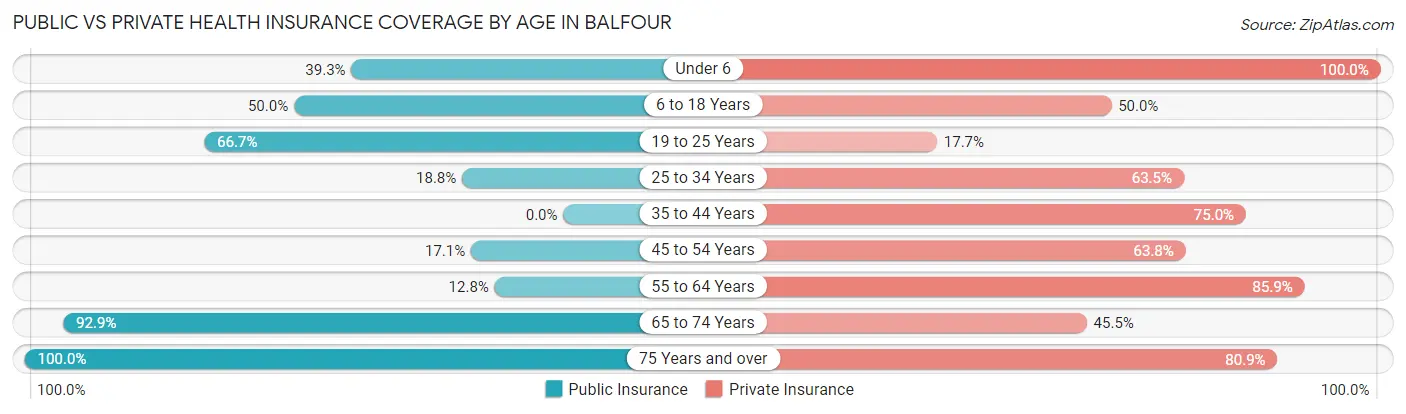
| Age Bracket | Public Insurance | Private Insurance |
| Under 6 | 24 (39.3%) | 61 (100.0%) |
| 6 to 18 Years | 31 (50.0%) | 31 (50.0%) |
| 19 to 25 Years | 34 (66.7%) | 9 (17.6%) |
| 25 to 34 Years | 53 (18.8%) | 179 (63.5%) |
| 35 to 44 Years | 0 (0.0%) | 138 (75.0%) |
| 45 to 54 Years | 18 (17.1%) | 67 (63.8%) |
| 55 to 64 Years | 19 (12.8%) | 128 (85.9%) |
| 65 to 74 Years | 143 (92.9%) | 70 (45.5%) |
| 75 Years and over | 94 (100.0%) | 76 (80.8%) |
| Total | 416 (36.4%) | 759 (66.5%) |
Disability Status by Sex by Age in Balfour
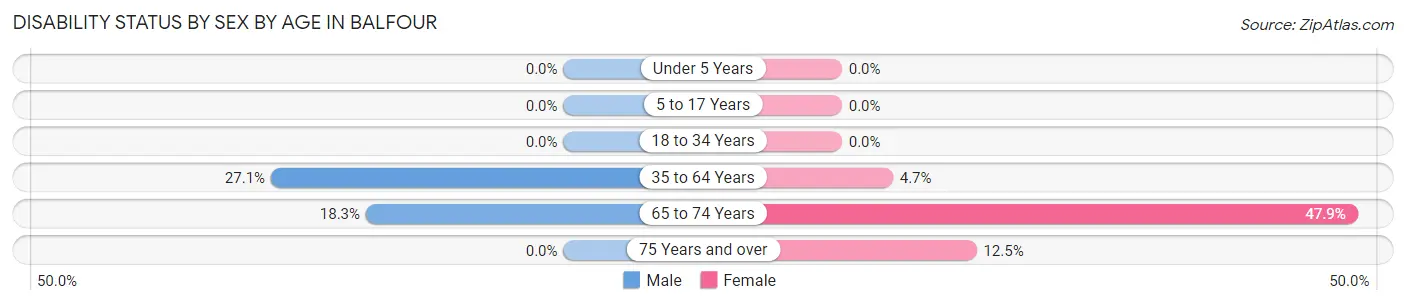
| Age Bracket | Male | Female |
| Under 5 Years | 0 (0.0%) | 0 (0.0%) |
| 5 to 17 Years | 0 (0.0%) | 0 (0.0%) |
| 18 to 34 Years | 0 (0.0%) | 0 (0.0%) |
| 35 to 64 Years | 73 (27.1%) | 8 (4.7%) |
| 65 to 74 Years | 11 (18.3%) | 45 (47.9%) |
| 75 Years and over | 0 (0.0%) | 7 (12.5%) |
Disability Class by Sex by Age in Balfour
Disability Class: Hearing Difficulty
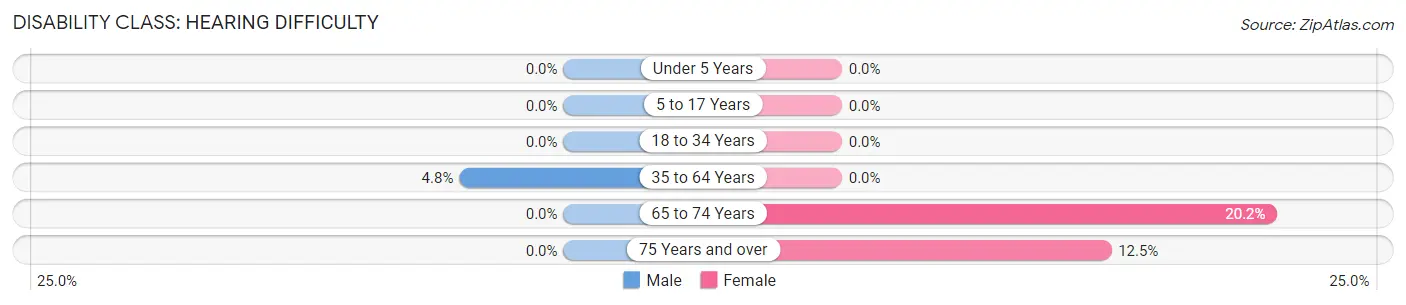
| Age Bracket | Male | Female |
| Under 5 Years | 0 (0.0%) | 0 (0.0%) |
| 5 to 17 Years | 0 (0.0%) | 0 (0.0%) |
| 18 to 34 Years | 0 (0.0%) | 0 (0.0%) |
| 35 to 64 Years | 13 (4.8%) | 0 (0.0%) |
| 65 to 74 Years | 0 (0.0%) | 19 (20.2%) |
| 75 Years and over | 0 (0.0%) | 7 (12.5%) |
Disability Class: Vision Difficulty
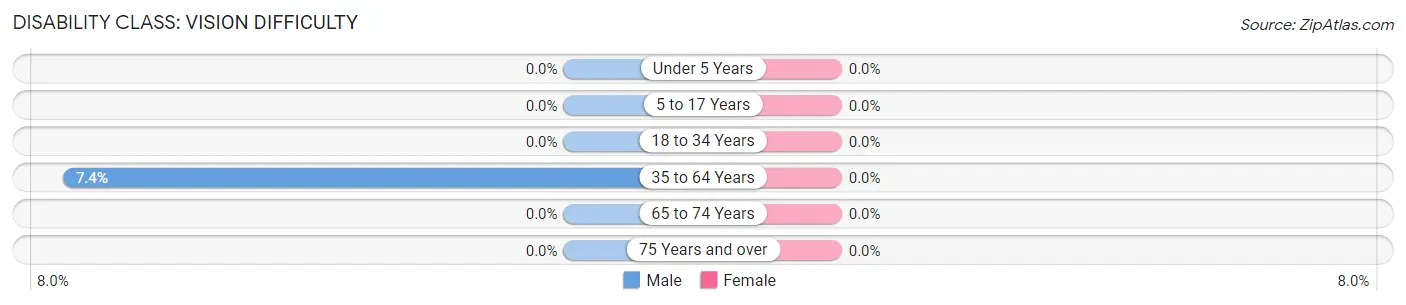
| Age Bracket | Male | Female |
| Under 5 Years | 0 (0.0%) | 0 (0.0%) |
| 5 to 17 Years | 0 (0.0%) | 0 (0.0%) |
| 18 to 34 Years | 0 (0.0%) | 0 (0.0%) |
| 35 to 64 Years | 20 (7.4%) | 0 (0.0%) |
| 65 to 74 Years | 0 (0.0%) | 0 (0.0%) |
| 75 Years and over | 0 (0.0%) | 0 (0.0%) |
Disability Class: Cognitive Difficulty
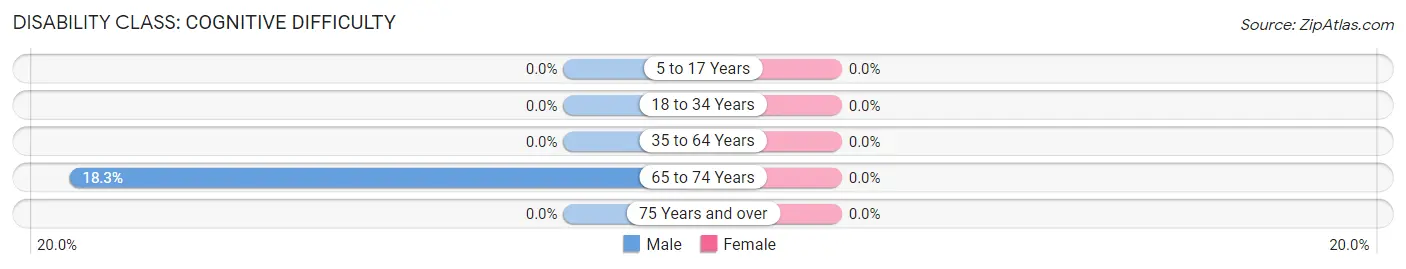
| Age Bracket | Male | Female |
| 5 to 17 Years | 0 (0.0%) | 0 (0.0%) |
| 18 to 34 Years | 0 (0.0%) | 0 (0.0%) |
| 35 to 64 Years | 0 (0.0%) | 0 (0.0%) |
| 65 to 74 Years | 11 (18.3%) | 0 (0.0%) |
| 75 Years and over | 0 (0.0%) | 0 (0.0%) |
Disability Class: Ambulatory Difficulty
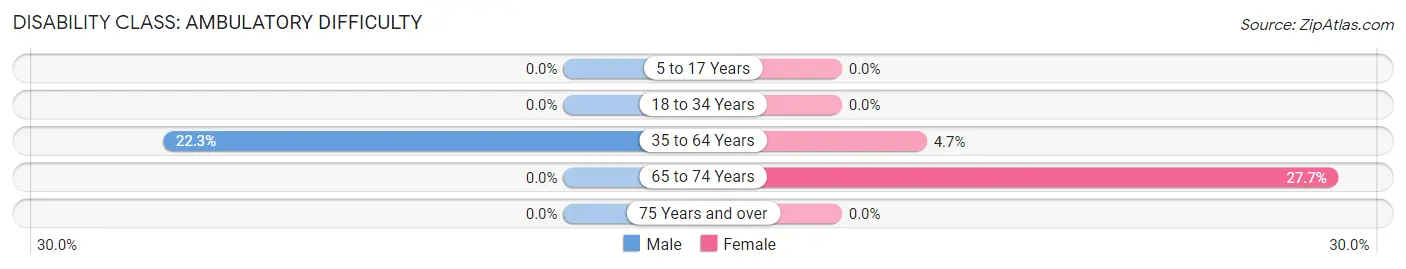
| Age Bracket | Male | Female |
| 5 to 17 Years | 0 (0.0%) | 0 (0.0%) |
| 18 to 34 Years | 0 (0.0%) | 0 (0.0%) |
| 35 to 64 Years | 60 (22.3%) | 8 (4.7%) |
| 65 to 74 Years | 0 (0.0%) | 26 (27.7%) |
| 75 Years and over | 0 (0.0%) | 0 (0.0%) |
Disability Class: Self-Care Difficulty
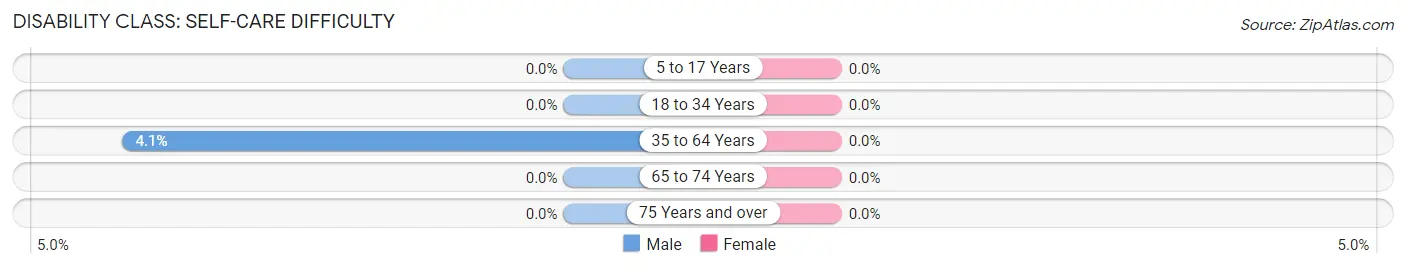
| Age Bracket | Male | Female |
| 5 to 17 Years | 0 (0.0%) | 0 (0.0%) |
| 18 to 34 Years | 0 (0.0%) | 0 (0.0%) |
| 35 to 64 Years | 11 (4.1%) | 0 (0.0%) |
| 65 to 74 Years | 0 (0.0%) | 0 (0.0%) |
| 75 Years and over | 0 (0.0%) | 0 (0.0%) |
Technology Access in Balfour
Computing Device Access in Balfour
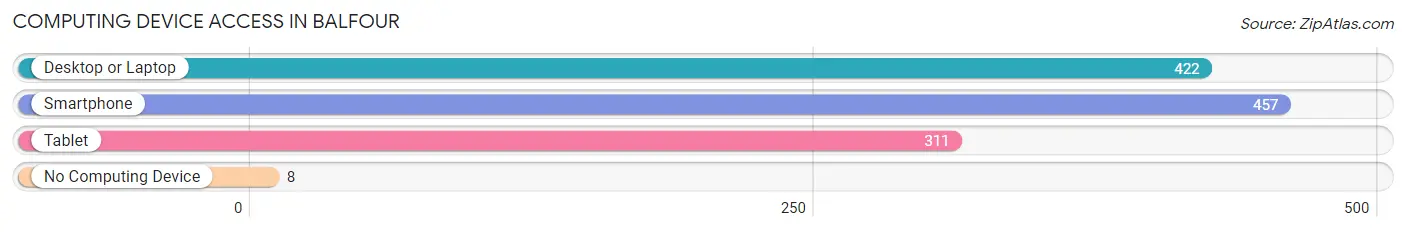
| Device Type | # Households | % Households |
| Desktop or Laptop | 422 | 84.7% |
| Smartphone | 457 | 91.8% |
| Tablet | 311 | 62.5% |
| No Computing Device | 8 | 1.6% |
| Total | 498 | 100.0% |
Internet Access in Balfour
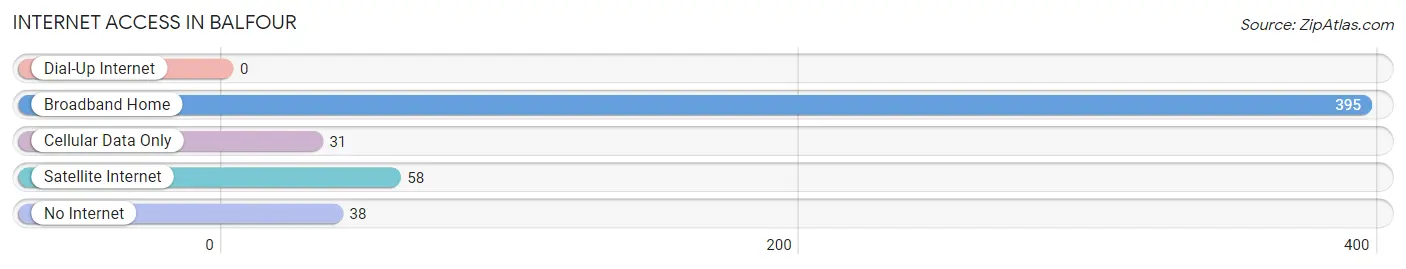
| Internet Type | # Households | % Households |
| Dial-Up Internet | 0 | 0.0% |
| Broadband Home | 395 | 79.3% |
| Cellular Data Only | 31 | 6.2% |
| Satellite Internet | 58 | 11.7% |
| No Internet | 38 | 7.6% |
| Total | 498 | 100.0% |
Balfour Summary
Balfour is a small unincorporated community located in the Blue Ridge Mountains of North Carolina. It is situated in the northwestern corner of Burke County, approximately 20 miles east of Asheville. The community is located along the banks of the Catawba River and is surrounded by the Pisgah National Forest.
History
The area that is now Balfour was first settled in the late 1700s by a group of Scottish immigrants. The community was named after the Balfour family, who were among the first settlers. The Balfours were farmers and operated a grist mill on the Catawba River.
In the early 1900s, the community began to grow as a logging and timber town. The Balfour Lumber Company was established in the area and provided employment for many of the residents. The company operated until the late 1950s when it closed due to a decline in the timber industry.
Geography
Balfour is located in the Blue Ridge Mountains of North Carolina. The community is situated in the northwestern corner of Burke County, approximately 20 miles east of Asheville. The Catawba River runs through the area and is surrounded by the Pisgah National Forest. The area is known for its scenic beauty and is a popular destination for outdoor recreation.
Economy
The economy of Balfour is largely based on tourism and outdoor recreation. The area is home to several campgrounds, hiking trails, and fishing spots. The nearby Pisgah National Forest provides a variety of recreational activities, including camping, hiking, and fishing. The community is also home to several small businesses, including restaurants, stores, and a gas station.
Demographics
As of the 2010 census, the population of Balfour was 1,092. The median age of the population was 44.7 years, and the median household income was $37,917. The racial makeup of the community was 97.3% White, 0.9% African American, 0.3% Native American, 0.2% Asian, and 1.3% from other races.
Conclusion
Balfour is a small unincorporated community located in the Blue Ridge Mountains of North Carolina. It is situated in the northwestern corner of Burke County, approximately 20 miles east of Asheville. The community is surrounded by the Pisgah National Forest and is known for its scenic beauty and outdoor recreation opportunities. The economy of Balfour is largely based on tourism and outdoor recreation, and the population of the community is largely white.
Common Questions
What is the Total Population of Balfour?
Total Population of Balfour is 1,142.
What is the Total Male Population of Balfour?
Total Male Population of Balfour is 577.
What is the Total Female Population of Balfour?
Total Female Population of Balfour is 565.
What is the Ratio of Males per 100 Females in Balfour?
There are 102.12 Males per 100 Females in Balfour.
What is the Ratio of Females per 100 Males in Balfour?
There are 97.92 Females per 100 Males in Balfour.
What is the Median Population Age in Balfour?
Median Population Age in Balfour is 37.5 Years.
What is the Average Family Size in Balfour
Average Family Size in Balfour is 2.7 People.
What is the Average Household Size in Balfour
Average Household Size in Balfour is 2.3 People.
What is Per Capita Income in Balfour?
Per Capita income in Balfour is $44,382.
What is the Median Family Income in Balfour?
Median Family Income in Balfour is $93,393.
What is the Median Household income in Balfour?
Median Household Income in Balfour is $69,643.
What is Income or Wage Gap in Balfour?
Income or Wage Gap in Balfour is 18.4%.
Women in Balfour earn 81.6 cents for every dollar earned by a man.
What is Inequality or Gini Index in Balfour?
Inequality or Gini Index in Balfour is 0.48.
How Large is the Labor Force in Balfour?
There are 713 People in the Labor Forcein in Balfour.
What is the Percentage of People in the Labor Force in Balfour?
70.0% of People are in the Labor Force in Balfour.