Blowing Rock, NC
Blowing Rock Map
Blowing Rock Overview
900
TOTAL POPULATION
392
MALE POPULATION
508
FEMALE POPULATION
77.17
MALES / 100 FEMALES
129.59
FEMALES / 100 MALES
62.4
MEDIAN AGE
2.2
AVG FAMILY SIZE
1.8
AVG HOUSEHOLD SIZE
$80,474
PER CAPITA INCOME
$130,833
AVG FAMILY INCOME
$116,731
AVG HOUSEHOLD INCOME
57.0%
WAGE / INCOME GAP [ % ]
43.0¢/ $1
WAGE / INCOME GAP [ $ ]
0.42
INEQUALITY / GINI INDEX
519
LABOR FORCE [ PEOPLE ]
60.6%
PERCENT IN LABOR FORCE
0.6%
UNEMPLOYMENT RATE
Blowing Rock Zip Codes
Blowing Rock Area Codes
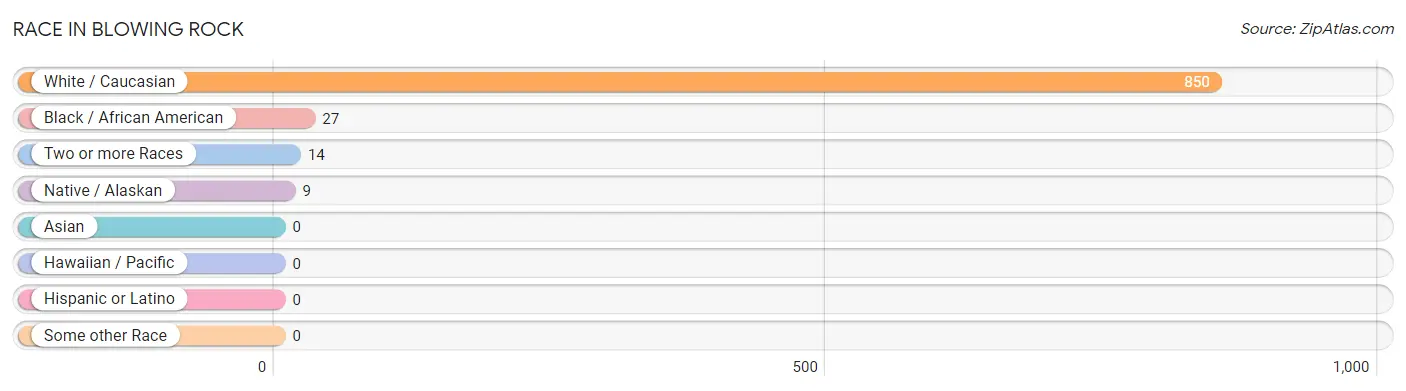
Race in Blowing Rock
The most populous races in Blowing Rock are White / Caucasian (850 | 94.4%), Black / African American (27 | 3.0%), and Two or more Races (14 | 1.6%).
| Race | # Population | % Population |
| Asian | 0 | 0.0% |
| Black / African American | 27 | 3.0% |
| Hawaiian / Pacific | 0 | 0.0% |
| Hispanic or Latino | 0 | 0.0% |
| Native / Alaskan | 9 | 1.0% |
| White / Caucasian | 850 | 94.4% |
| Two or more Races | 14 | 1.6% |
| Some other Race | 0 | 0.0% |
| Total | 900 | 100.0% |
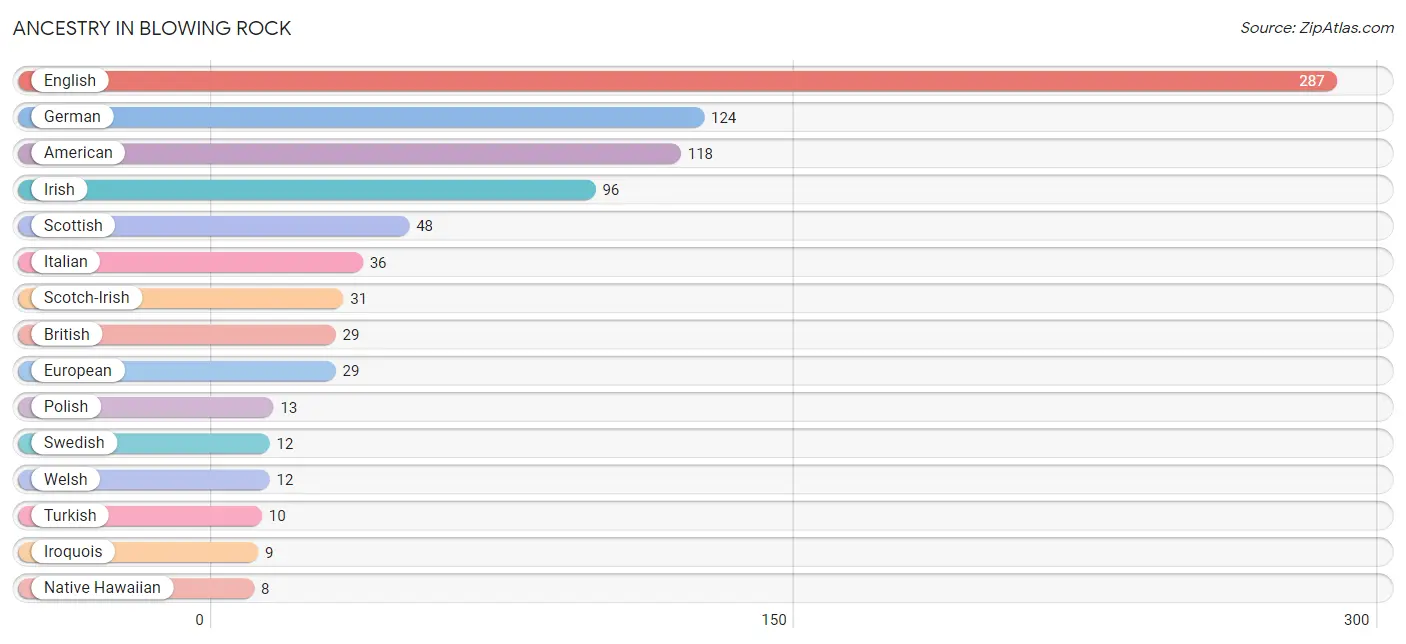
Ancestry in Blowing Rock
The most populous ancestries reported in Blowing Rock are English (287 | 31.9%), German (124 | 13.8%), American (118 | 13.1%), Irish (96 | 10.7%), and Scottish (48 | 5.3%), together accounting for 74.8% of all Blowing Rock residents.
| Ancestry | # Population | % Population |
| American | 118 | 13.1% |
| Austrian | 3 | 0.3% |
| British | 29 | 3.2% |
| Canadian | 3 | 0.3% |
| English | 287 | 31.9% |
| European | 29 | 3.2% |
| French | 2 | 0.2% |
| German | 124 | 13.8% |
| Irish | 96 | 10.7% |
| Iroquois | 9 | 1.0% |
| Italian | 36 | 4.0% |
| Native Hawaiian | 8 | 0.9% |
| Polish | 13 | 1.4% |
| Russian | 3 | 0.3% |
| Scandinavian | 6 | 0.7% |
| Scotch-Irish | 31 | 3.4% |
| Scottish | 48 | 5.3% |
| Swedish | 12 | 1.3% |
| Turkish | 10 | 1.1% |
| Ukrainian | 8 | 0.9% |
| Welsh | 12 | 1.3% | View All 21 Rows |
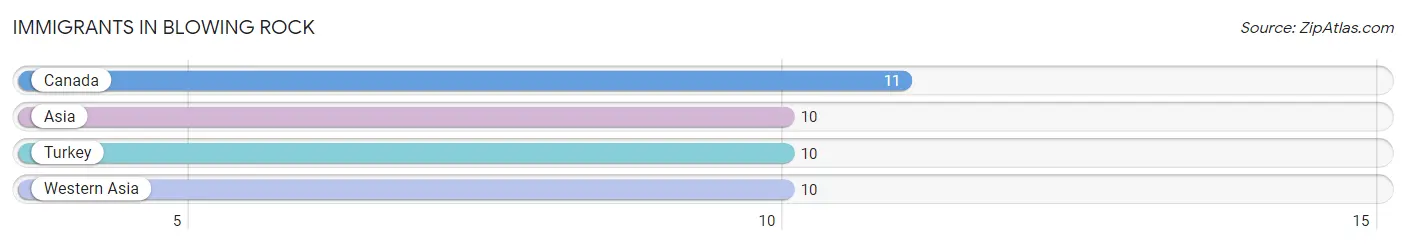
Immigrants in Blowing Rock
The most numerous immigrant groups reported in Blowing Rock came from Canada (11 | 1.2%), Asia (10 | 1.1%), Turkey (10 | 1.1%), and Western Asia (10 | 1.1%), together accounting for 4.5% of all Blowing Rock residents.
| Immigration Origin | # Population | % Population |
| Asia | 10 | 1.1% |
| Canada | 11 | 1.2% |
| Turkey | 10 | 1.1% |
| Western Asia | 10 | 1.1% | View All 4 Rows |
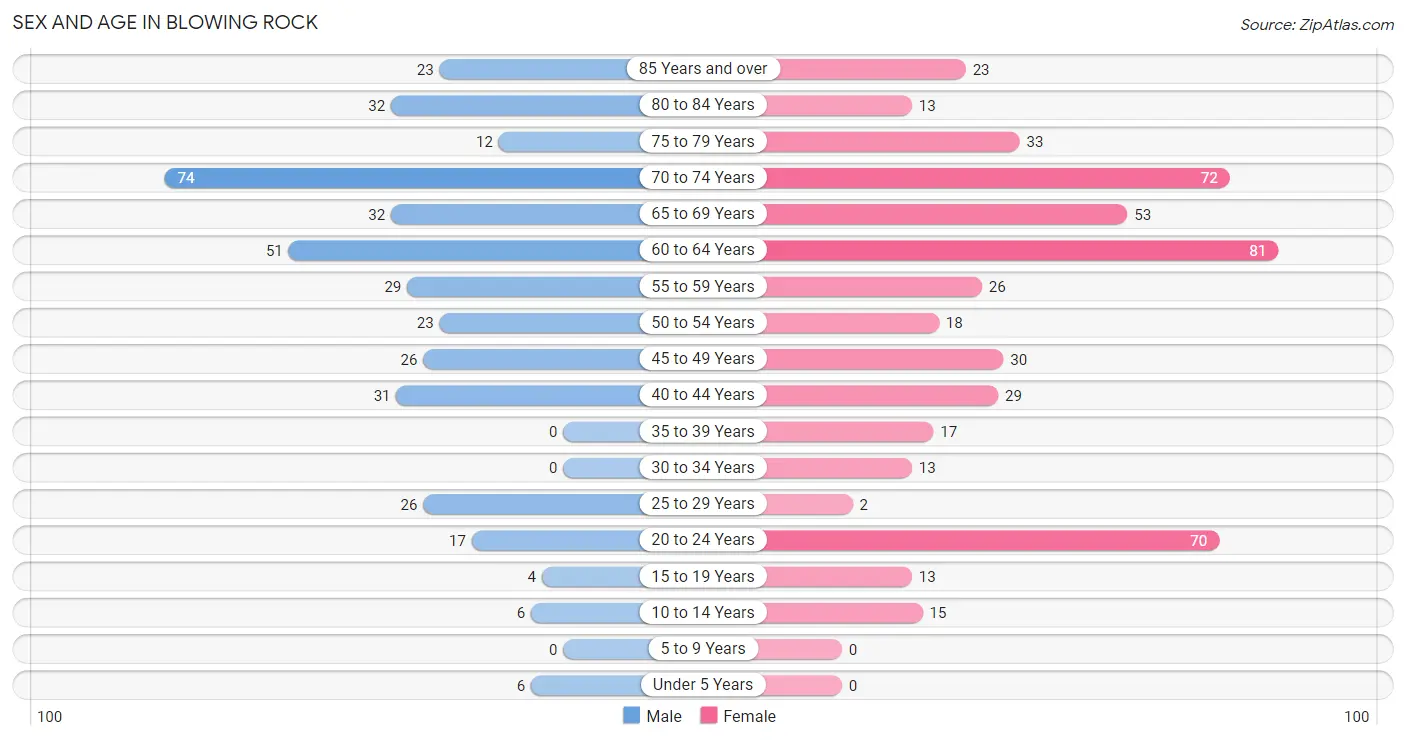
Sex and Age in Blowing Rock
Sex and Age in Blowing Rock
The most populous age groups in Blowing Rock are 70 to 74 Years (74 | 18.9%) for men and 60 to 64 Years (81 | 15.9%) for women.
| Age Bracket | Male | Female |
| Under 5 Years | 6 (1.5%) | 0 (0.0%) |
| 5 to 9 Years | 0 (0.0%) | 0 (0.0%) |
| 10 to 14 Years | 6 (1.5%) | 15 (2.9%) |
| 15 to 19 Years | 4 (1.0%) | 13 (2.6%) |
| 20 to 24 Years | 17 (4.3%) | 70 (13.8%) |
| 25 to 29 Years | 26 (6.6%) | 2 (0.4%) |
| 30 to 34 Years | 0 (0.0%) | 13 (2.6%) |
| 35 to 39 Years | 0 (0.0%) | 17 (3.4%) |
| 40 to 44 Years | 31 (7.9%) | 29 (5.7%) |
| 45 to 49 Years | 26 (6.6%) | 30 (5.9%) |
| 50 to 54 Years | 23 (5.9%) | 18 (3.5%) |
| 55 to 59 Years | 29 (7.4%) | 26 (5.1%) |
| 60 to 64 Years | 51 (13.0%) | 81 (15.9%) |
| 65 to 69 Years | 32 (8.2%) | 53 (10.4%) |
| 70 to 74 Years | 74 (18.9%) | 72 (14.2%) |
| 75 to 79 Years | 12 (3.1%) | 33 (6.5%) |
| 80 to 84 Years | 32 (8.2%) | 13 (2.6%) |
| 85 Years and over | 23 (5.9%) | 23 (4.5%) |
| Total | 392 (100.0%) | 508 (100.0%) |
Families and Households in Blowing Rock
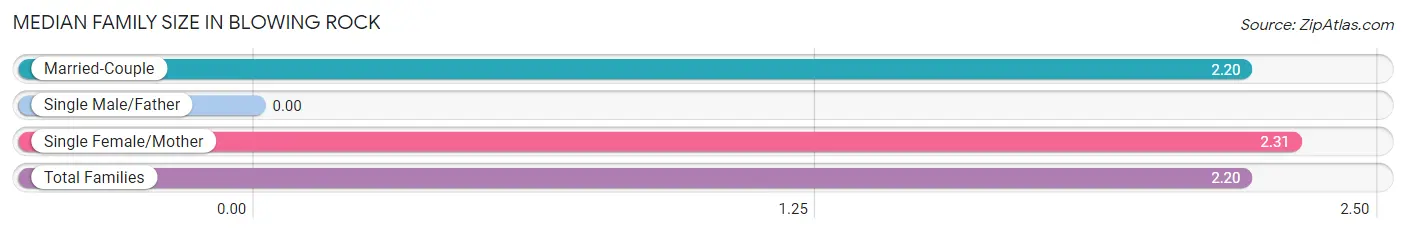
Median Family Size in Blowing Rock
| Family Type | # Families | Family Size |
| Married-Couple | 235 (94.8%) | 2.20 |
| Single Male/Father | 0 (0.0%) | - |
| Single Female/Mother | 13 (5.2%) | 2.31 |
| Total Families | 248 (100.0%) | 2.20 |
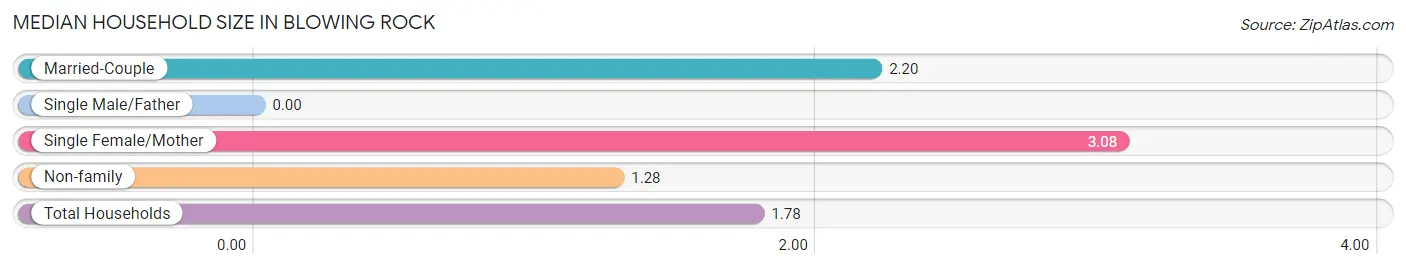
Median Household Size in Blowing Rock
| Household Type | # Households | Household Size |
| Married-Couple | 235 (49.0%) | 2.20 |
| Single Male/Father | 0 (0.0%) | - |
| Single Female/Mother | 13 (2.7%) | 3.08 |
| Non-family | 232 (48.3%) | 1.28 |
| Total Households | 480 (100.0%) | 1.78 |
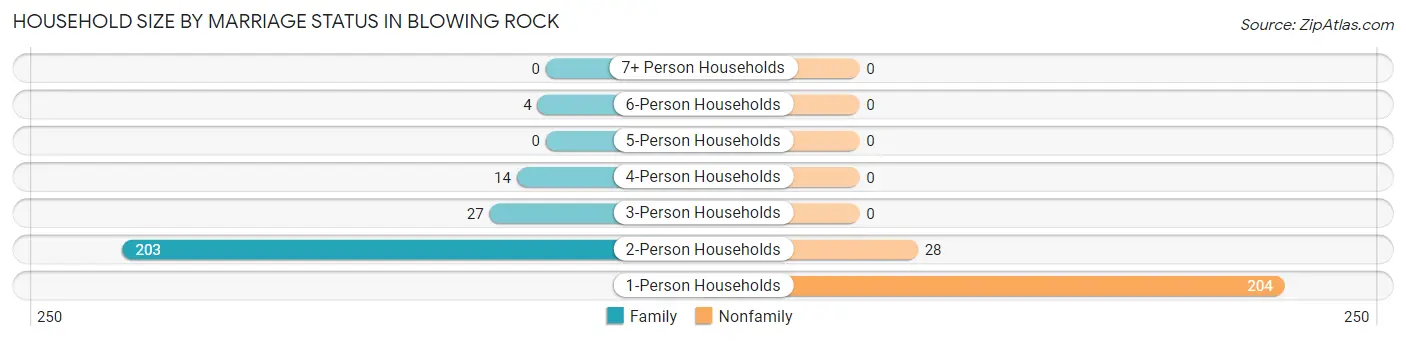
Household Size by Marriage Status in Blowing Rock
Out of a total of 480 households in Blowing Rock, 248 (51.7%) are family households, while 232 (48.3%) are nonfamily households. The most numerous type of family households are 2-person households, comprising 203, and the most common type of nonfamily households are 1-person households, comprising 204.
| Household Size | Family Households | Nonfamily Households |
| 1-Person Households | - | 204 (42.5%) |
| 2-Person Households | 203 (42.3%) | 28 (5.8%) |
| 3-Person Households | 27 (5.6%) | 0 (0.0%) |
| 4-Person Households | 14 (2.9%) | 0 (0.0%) |
| 5-Person Households | 0 (0.0%) | 0 (0.0%) |
| 6-Person Households | 4 (0.8%) | 0 (0.0%) |
| 7+ Person Households | 0 (0.0%) | 0 (0.0%) |
| Total | 248 (51.7%) | 232 (48.3%) |
Female Fertility in Blowing Rock
Fertility by Age in Blowing Rock
| Age Bracket | Women with Births | Births / 1,000 Women |
| 15 to 19 years | 0 (0.0%) | 0.0 |
| 20 to 34 years | 0 (0.0%) | 0.0 |
| 35 to 50 years | 0 (0.0%) | 0.0 |
| Total | 0 (0.0%) | 0.0 |
Fertility by Age by Marriage Status in Blowing Rock
| Age Bracket | Married | Unmarried |
| 15 to 19 years | 0 (0.0%) | 0 (0.0%) |
| 20 to 34 years | 0 (0.0%) | 0 (0.0%) |
| 35 to 50 years | 0 (0.0%) | 0 (0.0%) |
| Total | 0 (0.0%) | 0 (0.0%) |
Fertility by Education in Blowing Rock
| Educational Attainment | Women with Births | Births / 1,000 Women |
| Less than High School | 0 (0.0%) | 0.0 |
| High School Diploma | 0 (0.0%) | 0.0 |
| College or Associate's Degree | 0 (0.0%) | 0.0 |
| Bachelor's Degree | 0 (0.0%) | 0.0 |
| Graduate Degree | 0 (0.0%) | 0.0 |
| Total | 0 (0.0%) | 0.0 |
Fertility by Education by Marriage Status in Blowing Rock
| Educational Attainment | Married | Unmarried |
| Less than High School | 0 (0.0%) | 0 (0.0%) |
| High School Diploma | 0 (0.0%) | 0 (0.0%) |
| College or Associate's Degree | 0 (0.0%) | 0 (0.0%) |
| Bachelor's Degree | 0 (0.0%) | 0 (0.0%) |
| Graduate Degree | 0 (0.0%) | 0 (0.0%) |
| Total | 0 (0.0%) | 0 (0.0%) |
Income in Blowing Rock
Income Overview in Blowing Rock
Per Capita Income in Blowing Rock is $80,474, while median incomes of families and households are $130,833 and $116,731 respectively.
| Characteristic | Number | Measure |
| Per Capita Income | 900 | $80,474 |
| Median Family Income | 248 | $130,833 |
| Mean Family Income | 248 | $190,535 |
| Median Household Income | 480 | $116,731 |
| Mean Household Income | 480 | $149,660 |
| Income Deficit | 248 | $0 |
| Wage / Income Gap (%) | 900 | 57.04% |
| Wage / Income Gap ($) | 900 | 42.96¢ per $1 |
| Gini / Inequality Index | 900 | 0.42 |
Earnings by Sex in Blowing Rock
Average Earnings in Blowing Rock are $53,750, $107,772 for men and $46,302 for women, a difference of 57.0%.
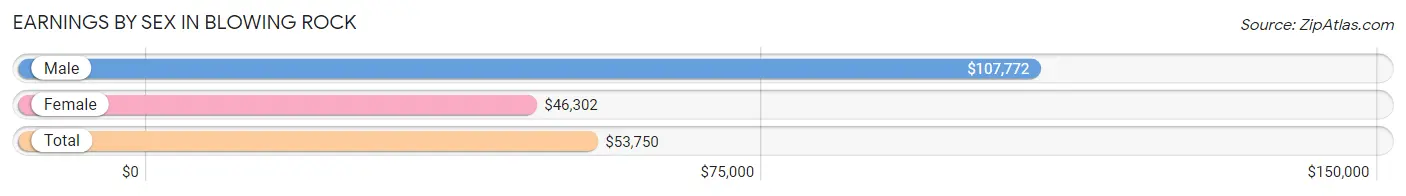
| Sex | Number | Average Earnings |
| Male | 267 (49.9%) | $107,772 |
| Female | 268 (50.1%) | $46,302 |
| Total | 535 (100.0%) | $53,750 |
Earnings by Sex by Income Bracket in Blowing Rock
The most common earnings brackets in Blowing Rock are $100,000+ for men (147 | 55.1%) and $55,000 to $64,999 for women (49 | 18.3%).
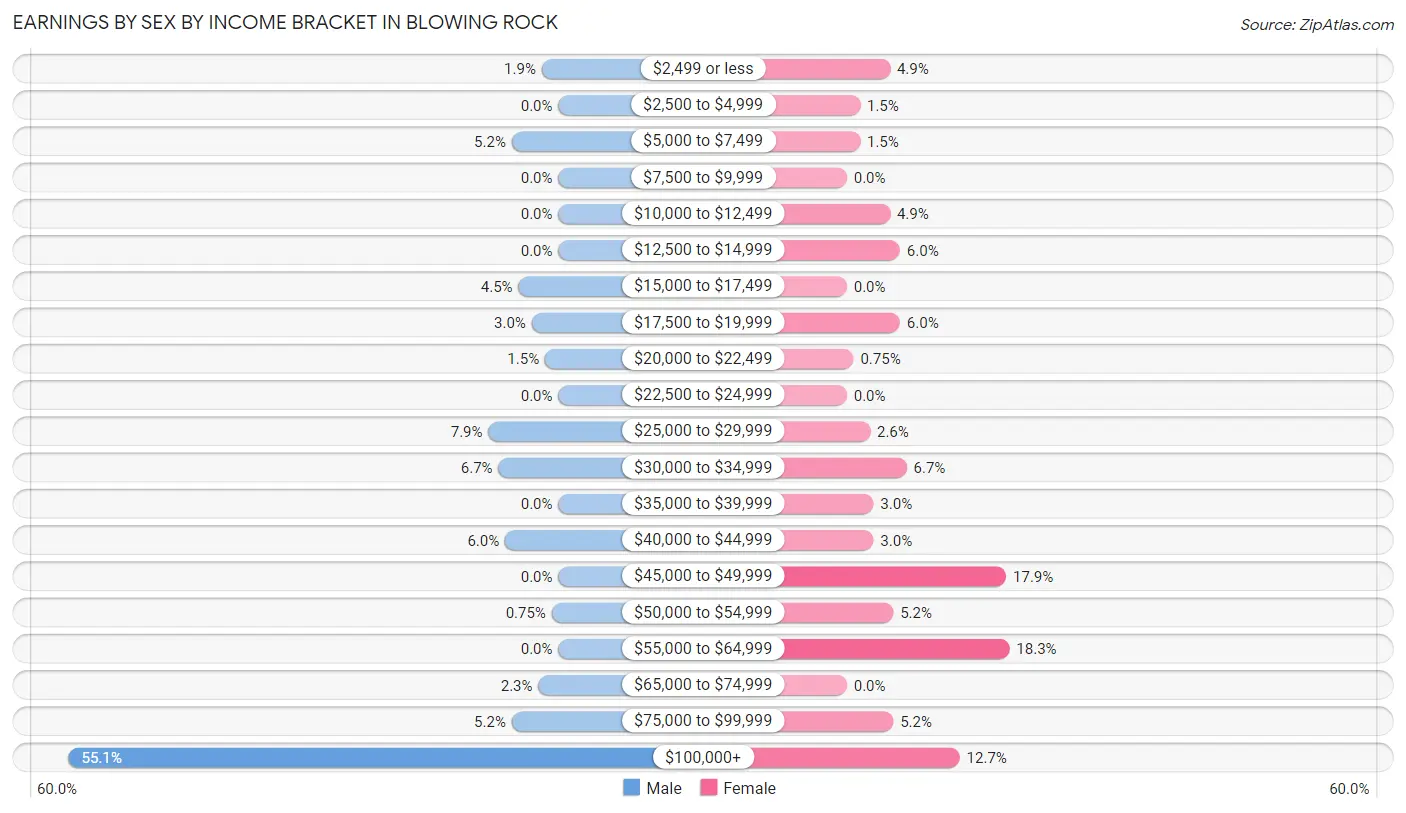
| Income | Male | Female |
| $2,499 or less | 5 (1.9%) | 13 (4.9%) |
| $2,500 to $4,999 | 0 (0.0%) | 4 (1.5%) |
| $5,000 to $7,499 | 14 (5.2%) | 4 (1.5%) |
| $7,500 to $9,999 | 0 (0.0%) | 0 (0.0%) |
| $10,000 to $12,499 | 0 (0.0%) | 13 (4.9%) |
| $12,500 to $14,999 | 0 (0.0%) | 16 (6.0%) |
| $15,000 to $17,499 | 12 (4.5%) | 0 (0.0%) |
| $17,500 to $19,999 | 8 (3.0%) | 16 (6.0%) |
| $20,000 to $22,499 | 4 (1.5%) | 2 (0.7%) |
| $22,500 to $24,999 | 0 (0.0%) | 0 (0.0%) |
| $25,000 to $29,999 | 21 (7.9%) | 7 (2.6%) |
| $30,000 to $34,999 | 18 (6.7%) | 18 (6.7%) |
| $35,000 to $39,999 | 0 (0.0%) | 8 (3.0%) |
| $40,000 to $44,999 | 16 (6.0%) | 8 (3.0%) |
| $45,000 to $49,999 | 0 (0.0%) | 48 (17.9%) |
| $50,000 to $54,999 | 2 (0.7%) | 14 (5.2%) |
| $55,000 to $64,999 | 0 (0.0%) | 49 (18.3%) |
| $65,000 to $74,999 | 6 (2.2%) | 0 (0.0%) |
| $75,000 to $99,999 | 14 (5.2%) | 14 (5.2%) |
| $100,000+ | 147 (55.1%) | 34 (12.7%) |
| Total | 267 (100.0%) | 268 (100.0%) |
Earnings by Sex by Educational Attainment in Blowing Rock
Average earnings in Blowing Rock are $108,424 for men and $54,000 for women, a difference of 50.2%. Men with an educational attainment of bachelor's degree enjoy the highest average annual earnings of $108,333, while those with bachelor's degree education earn the least with $108,333. Women with an educational attainment of graduate degree earn the most with the average annual earnings of $59,135, while those with graduate degree education have the smallest earnings of $59,135.
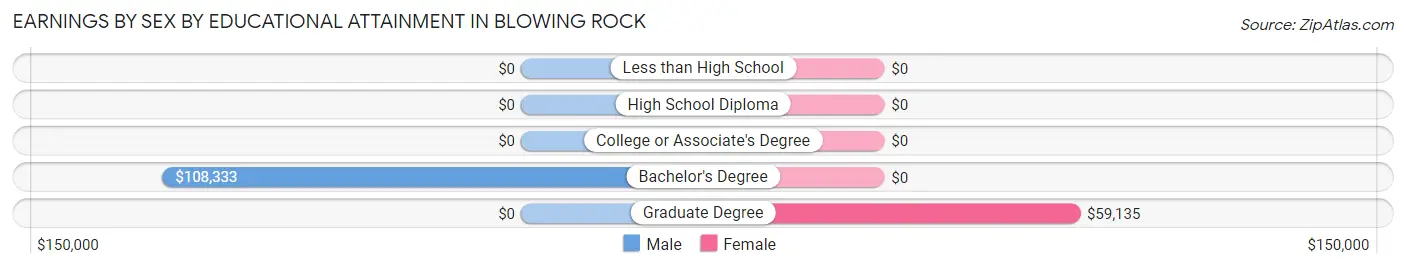
| Educational Attainment | Male Income | Female Income |
| Less than High School | - | - |
| High School Diploma | - | - |
| College or Associate's Degree | - | - |
| Bachelor's Degree | $108,333 | $0 |
| Graduate Degree | - | - |
| Total | $108,424 | $54,000 |
Family Income in Blowing Rock
Family Income Brackets in Blowing Rock
According to the Blowing Rock family income data, there are 106 families falling into the $200,000+ income range, which is the most common income bracket and makes up 42.7% of all families.
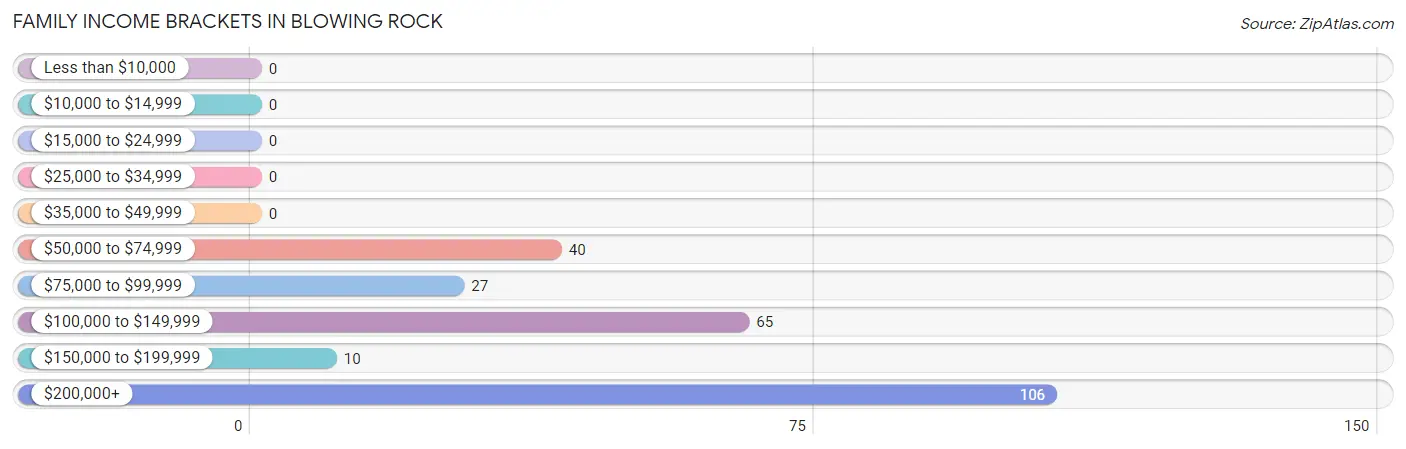
| Income Bracket | # Families | % Families |
| Less than $10,000 | 0 | 0.0% |
| $10,000 to $14,999 | 0 | 0.0% |
| $15,000 to $24,999 | 0 | 0.0% |
| $25,000 to $34,999 | 0 | 0.0% |
| $35,000 to $49,999 | 0 | 0.0% |
| $50,000 to $74,999 | 40 | 16.1% |
| $75,000 to $99,999 | 27 | 10.9% |
| $100,000 to $149,999 | 65 | 26.2% |
| $150,000 to $199,999 | 10 | 4.0% |
| $200,000+ | 106 | 42.7% |
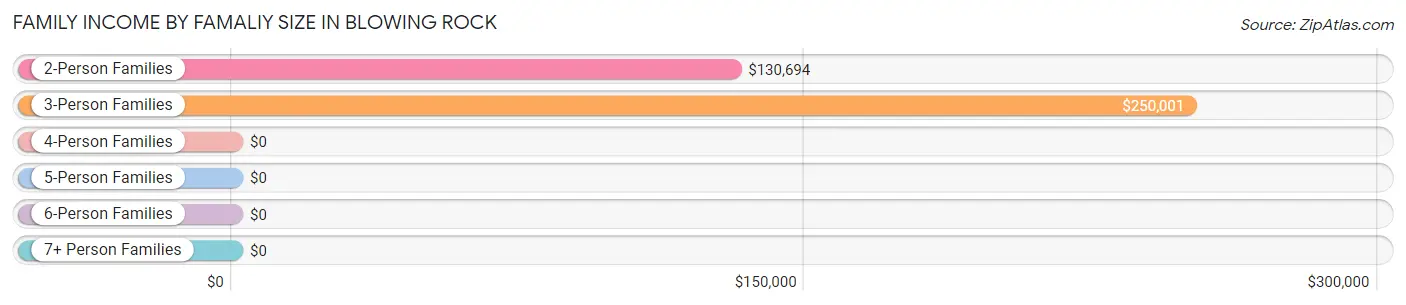
Family Income by Famaliy Size in Blowing Rock
3-person families (19 | 7.7%) account for the highest median family income in Blowing Rock with $250,001 per family, while 3-person families (19 | 7.7%) have the highest median income of $83,334 per family member.
| Income Bracket | # Families | Median Income |
| 2-Person Families | 211 (85.1%) | $130,694 |
| 3-Person Families | 19 (7.7%) | $250,001 |
| 4-Person Families | 14 (5.7%) | $0 |
| 5-Person Families | 0 (0.0%) | $0 |
| 6-Person Families | 4 (1.6%) | $0 |
| 7+ Person Families | 0 (0.0%) | $0 |
| Total | 248 (100.0%) | $130,833 |
Family Income by Number of Earners in Blowing Rock
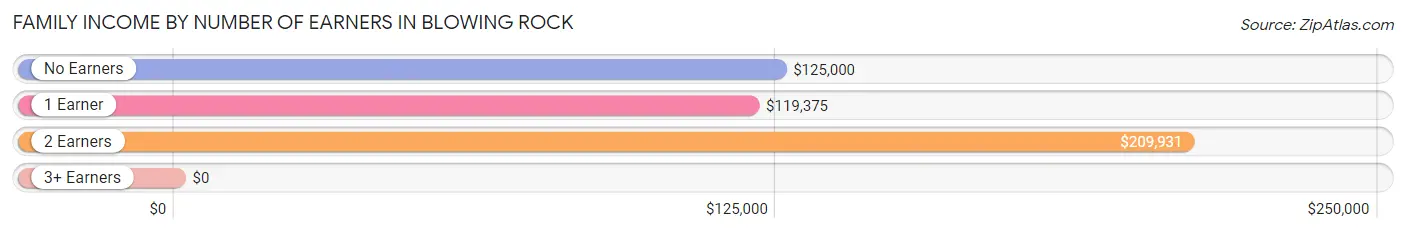
| Number of Earners | # Families | Median Income |
| No Earners | 102 (41.1%) | $125,000 |
| 1 Earner | 41 (16.5%) | $119,375 |
| 2 Earners | 97 (39.1%) | $209,931 |
| 3+ Earners | 8 (3.2%) | $0 |
| Total | 248 (100.0%) | $130,833 |
Household Income in Blowing Rock
Household Income Brackets in Blowing Rock
With 138 households falling in the category, the $200,000+ income range is the most frequent in Blowing Rock, accounting for 28.7% of all households.
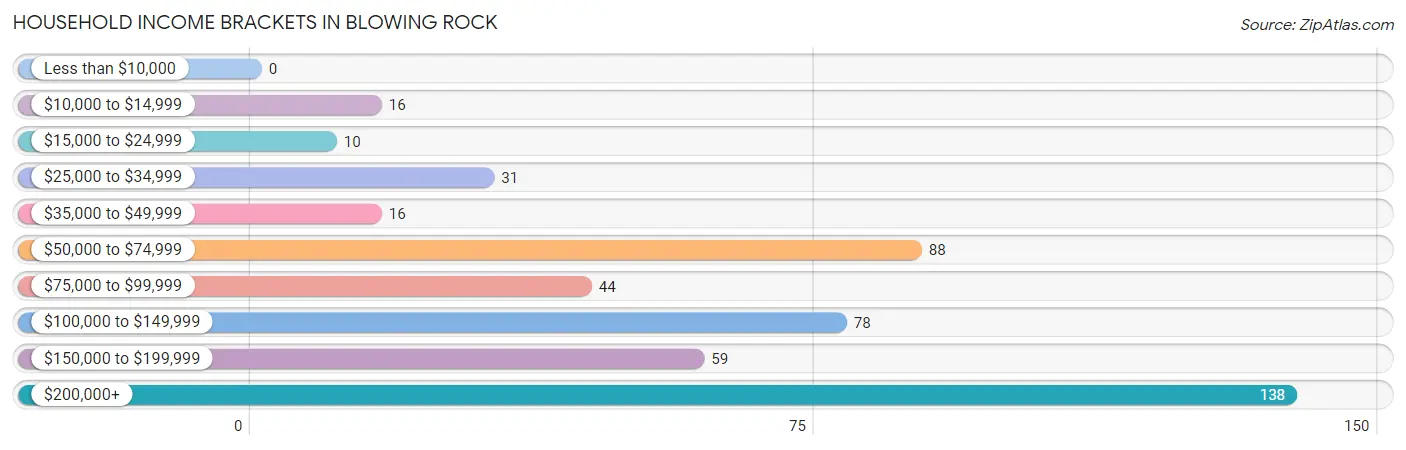
| Income Bracket | # Households | % Households |
| Less than $10,000 | 0 | 0.0% |
| $10,000 to $14,999 | 16 | 3.3% |
| $15,000 to $24,999 | 10 | 2.1% |
| $25,000 to $34,999 | 31 | 6.5% |
| $35,000 to $49,999 | 16 | 3.3% |
| $50,000 to $74,999 | 88 | 18.3% |
| $75,000 to $99,999 | 44 | 9.2% |
| $100,000 to $149,999 | 78 | 16.3% |
| $150,000 to $199,999 | 59 | 12.3% |
| $200,000+ | 138 | 28.8% |
Household Income by Householder Age in Blowing Rock
The median household income in Blowing Rock is $116,731, with the highest median household income of $131,389 found in the 65+ years age bracket for the primary householder. A total of 208 households (43.3%) fall into this category. Meanwhile, the 15 to 24 years age bracket for the primary householder has the lowest median household income of $0, with 12 households (2.5%) in this group.
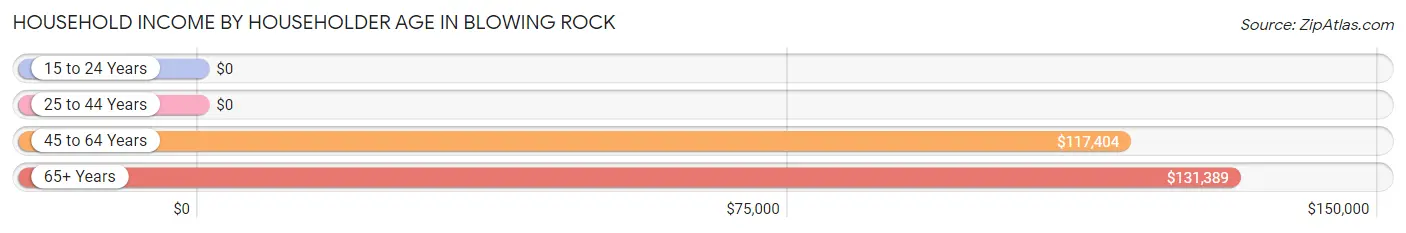
| Income Bracket | # Households | Median Income |
| 15 to 24 Years | 12 (2.5%) | $0 |
| 25 to 44 Years | 67 (14.0%) | $0 |
| 45 to 64 Years | 193 (40.2%) | $117,404 |
| 65+ Years | 208 (43.3%) | $131,389 |
| Total | 480 (100.0%) | $116,731 |
Poverty in Blowing Rock
Income Below Poverty by Sex and Age in Blowing Rock
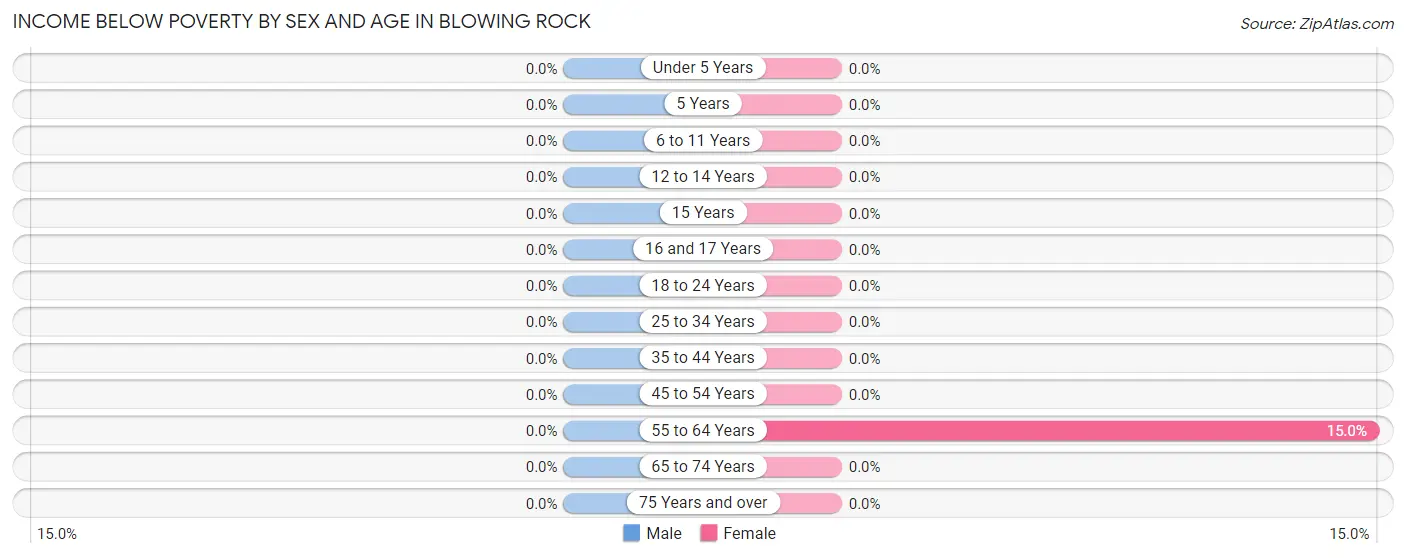
| Age Bracket | Male | Female |
| Under 5 Years | 0 (0.0%) | 0 (0.0%) |
| 5 Years | 0 (0.0%) | 0 (0.0%) |
| 6 to 11 Years | 0 (0.0%) | 0 (0.0%) |
| 12 to 14 Years | 0 (0.0%) | 0 (0.0%) |
| 15 Years | 0 (0.0%) | 0 (0.0%) |
| 16 and 17 Years | 0 (0.0%) | 0 (0.0%) |
| 18 to 24 Years | 0 (0.0%) | 0 (0.0%) |
| 25 to 34 Years | 0 (0.0%) | 0 (0.0%) |
| 35 to 44 Years | 0 (0.0%) | 0 (0.0%) |
| 45 to 54 Years | 0 (0.0%) | 0 (0.0%) |
| 55 to 64 Years | 0 (0.0%) | 16 (14.9%) |
| 65 to 74 Years | 0 (0.0%) | 0 (0.0%) |
| 75 Years and over | 0 (0.0%) | 0 (0.0%) |
| Total | 0 (0.0%) | 16 (3.5%) |
Income Above Poverty by Sex and Age in Blowing Rock
According to the poverty statistics in Blowing Rock, males aged under 5 years and females aged 12 to 14 years are the age groups that are most secure financially, with 100.0% of males and 100.0% of females in these age groups living above the poverty line.
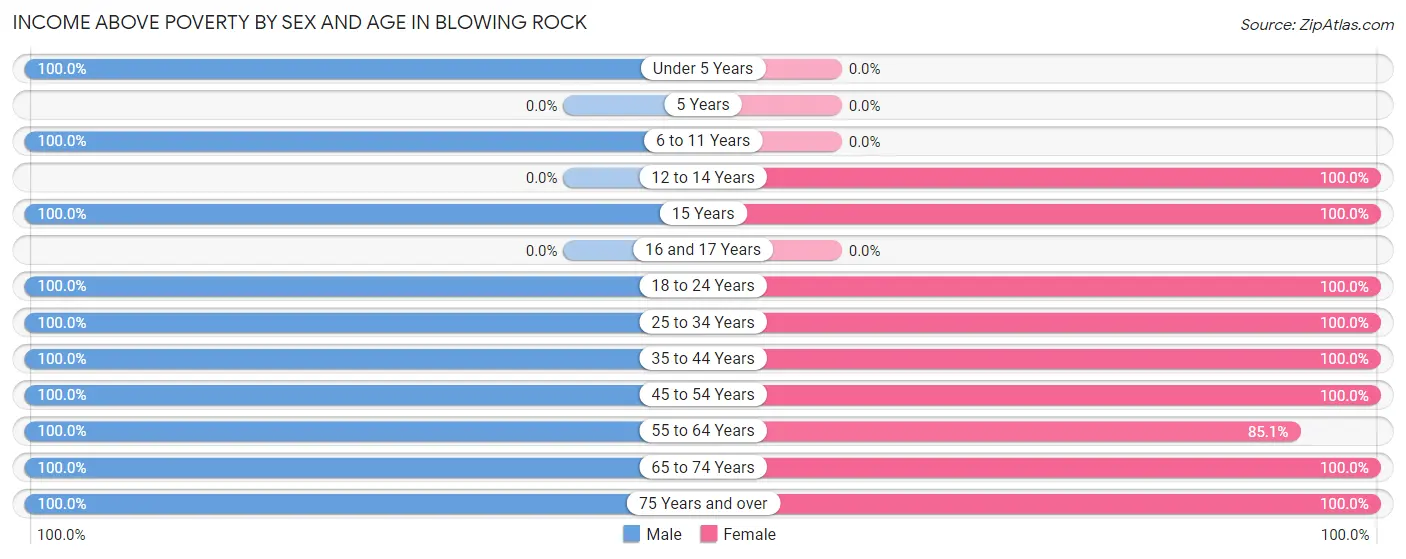
| Age Bracket | Male | Female |
| Under 5 Years | 6 (100.0%) | 0 (0.0%) |
| 5 Years | 0 (0.0%) | 0 (0.0%) |
| 6 to 11 Years | 6 (100.0%) | 0 (0.0%) |
| 12 to 14 Years | 0 (0.0%) | 15 (100.0%) |
| 15 Years | 4 (100.0%) | 13 (100.0%) |
| 16 and 17 Years | 0 (0.0%) | 0 (0.0%) |
| 18 to 24 Years | 17 (100.0%) | 70 (100.0%) |
| 25 to 34 Years | 26 (100.0%) | 15 (100.0%) |
| 35 to 44 Years | 31 (100.0%) | 46 (100.0%) |
| 45 to 54 Years | 49 (100.0%) | 48 (100.0%) |
| 55 to 64 Years | 80 (100.0%) | 91 (85.1%) |
| 65 to 74 Years | 106 (100.0%) | 98 (100.0%) |
| 75 Years and over | 67 (100.0%) | 49 (100.0%) |
| Total | 392 (100.0%) | 445 (96.5%) |
Income Below Poverty Among Married-Couple Families in Blowing Rock
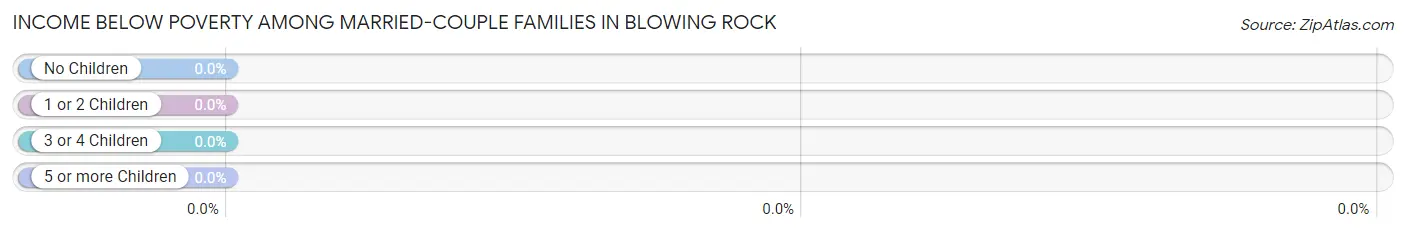
| Children | Above Poverty | Below Poverty |
| No Children | 205 (100.0%) | 0 (0.0%) |
| 1 or 2 Children | 30 (100.0%) | 0 (0.0%) |
| 3 or 4 Children | 0 (0.0%) | 0 (0.0%) |
| 5 or more Children | 0 (0.0%) | 0 (0.0%) |
| Total | 235 (100.0%) | 0 (0.0%) |
Income Below Poverty Among Single-Parent Households in Blowing Rock
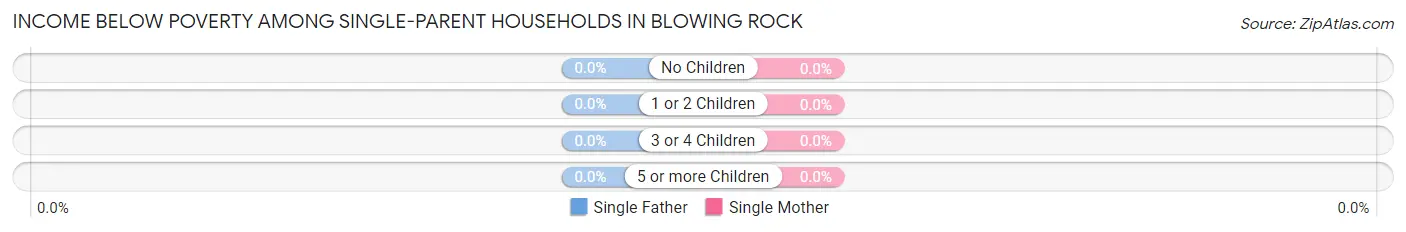
| Children | Single Father | Single Mother |
| No Children | 0 (0.0%) | 0 (0.0%) |
| 1 or 2 Children | 0 (0.0%) | 0 (0.0%) |
| 3 or 4 Children | 0 (0.0%) | 0 (0.0%) |
| 5 or more Children | 0 (0.0%) | 0 (0.0%) |
| Total | 0 (0.0%) | 0 (0.0%) |
Income Below Poverty Among Married-Couple vs Single-Parent Households in Blowing Rock
| Children | Married-Couple Families | Single-Parent Households |
| No Children | 0 (0.0%) | 0 (0.0%) |
| 1 or 2 Children | 0 (0.0%) | 0 (0.0%) |
| 3 or 4 Children | 0 (0.0%) | 0 (0.0%) |
| 5 or more Children | 0 (0.0%) | 0 (0.0%) |
| Total | 0 (0.0%) | 0 (0.0%) |
Employment Characteristics in Blowing Rock
Employment by Class of Employer in Blowing Rock
Among the 512 employed individuals in Blowing Rock, private company employees (315 | 61.5%), self-employed (incorporated) (72 | 14.1%), and state government employees (47 | 9.2%) make up the most common classes of employment.
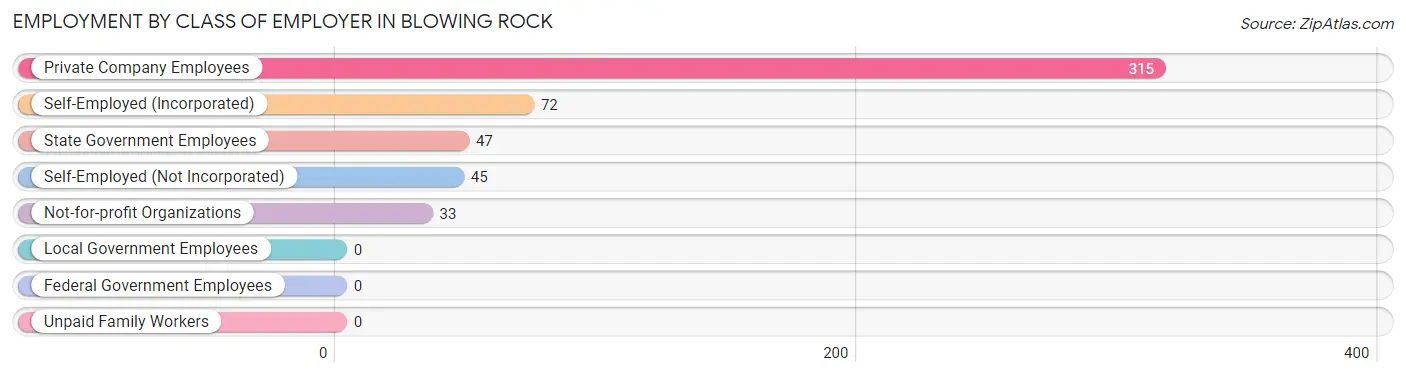
| Employer Class | # Employees | % Employees |
| Private Company Employees | 315 | 61.5% |
| Self-Employed (Incorporated) | 72 | 14.1% |
| Self-Employed (Not Incorporated) | 45 | 8.8% |
| Not-for-profit Organizations | 33 | 6.5% |
| Local Government Employees | 0 | 0.0% |
| State Government Employees | 47 | 9.2% |
| Federal Government Employees | 0 | 0.0% |
| Unpaid Family Workers | 0 | 0.0% |
| Total | 512 | 100.0% |
Employment Status by Age in Blowing Rock
According to the labor force statistics for Blowing Rock, out of the total population over 16 years of age (856), 60.6% or 519 individuals are in the labor force, with 0.6% or 3 of them unemployed. The age group with the highest labor force participation rate is 25 to 29 years, with 100.0% or 28 individuals in the labor force. Within the labor force, the 20 to 24 years age range has the highest percentage of unemployed individuals, with 3.7% or 3 of them being unemployed.
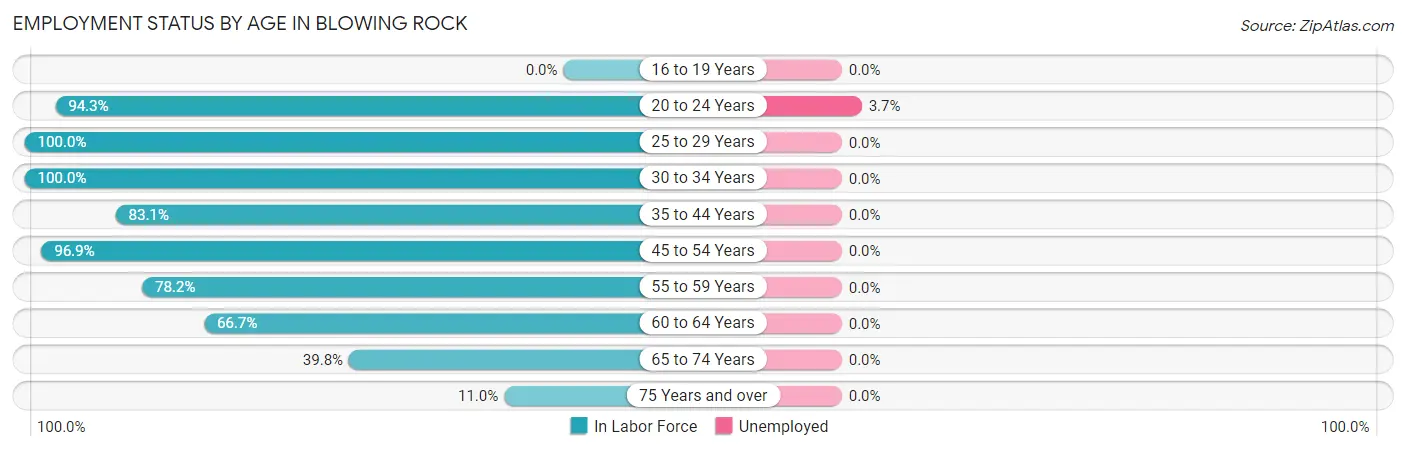
| Age Bracket | In Labor Force | Unemployed |
| 16 to 19 Years | 0 (0.0%) | 0 (0.0%) |
| 20 to 24 Years | 82 (94.3%) | 3 (3.7%) |
| 25 to 29 Years | 28 (100.0%) | 0 (0.0%) |
| 30 to 34 Years | 13 (100.0%) | 0 (0.0%) |
| 35 to 44 Years | 64 (83.1%) | 0 (0.0%) |
| 45 to 54 Years | 94 (96.9%) | 0 (0.0%) |
| 55 to 59 Years | 43 (78.2%) | 0 (0.0%) |
| 60 to 64 Years | 88 (66.7%) | 0 (0.0%) |
| 65 to 74 Years | 92 (39.8%) | 0 (0.0%) |
| 75 Years and over | 15 (11.0%) | 0 (0.0%) |
| Total | 519 (60.6%) | 3 (0.6%) |
Employment Status by Educational Attainment in Blowing Rock
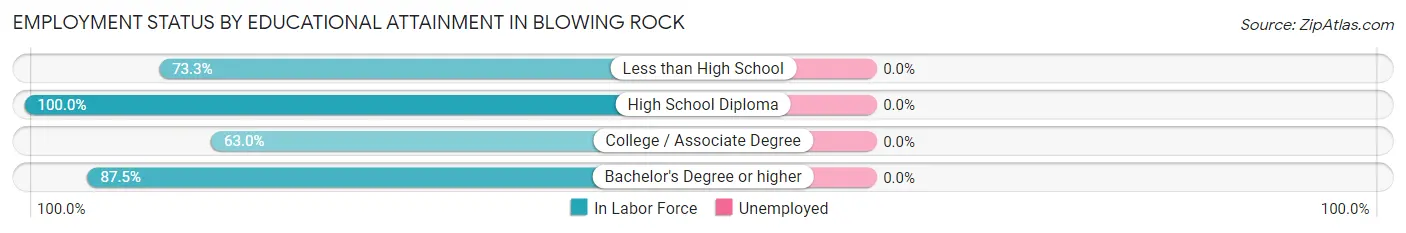
| Educational Attainment | In Labor Force | Unemployed |
| Less than High School | 11 (73.3%) | 0 (0.0%) |
| High School Diploma | 24 (100.0%) | 0 (0.0%) |
| College / Associate Degree | 58 (63.0%) | 0 (0.0%) |
| Bachelor's Degree or higher | 237 (87.5%) | 0 (0.0%) |
| Total | 330 (82.1%) | 0 (0.0%) |
Employment Occupations by Sex in Blowing Rock
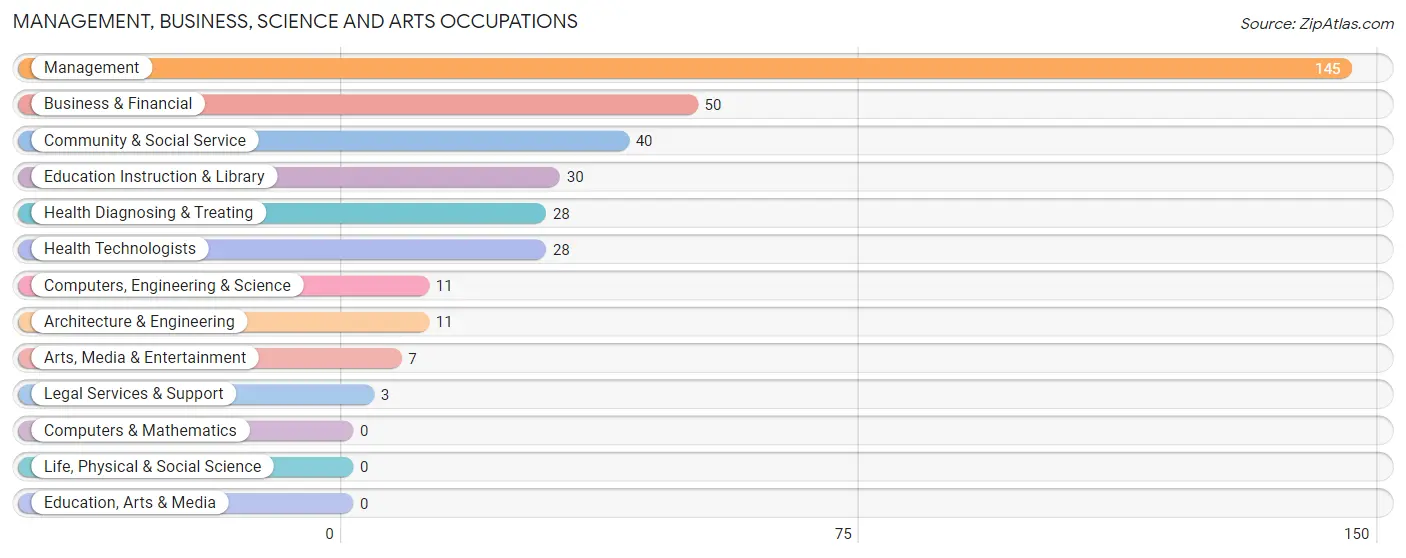
Management, Business, Science and Arts Occupations
The most common Management, Business, Science and Arts occupations in Blowing Rock are Management (145 | 28.1%), Business & Financial (50 | 9.7%), Community & Social Service (40 | 7.7%), Education Instruction & Library (30 | 5.8%), and Health Diagnosing & Treating (28 | 5.4%).
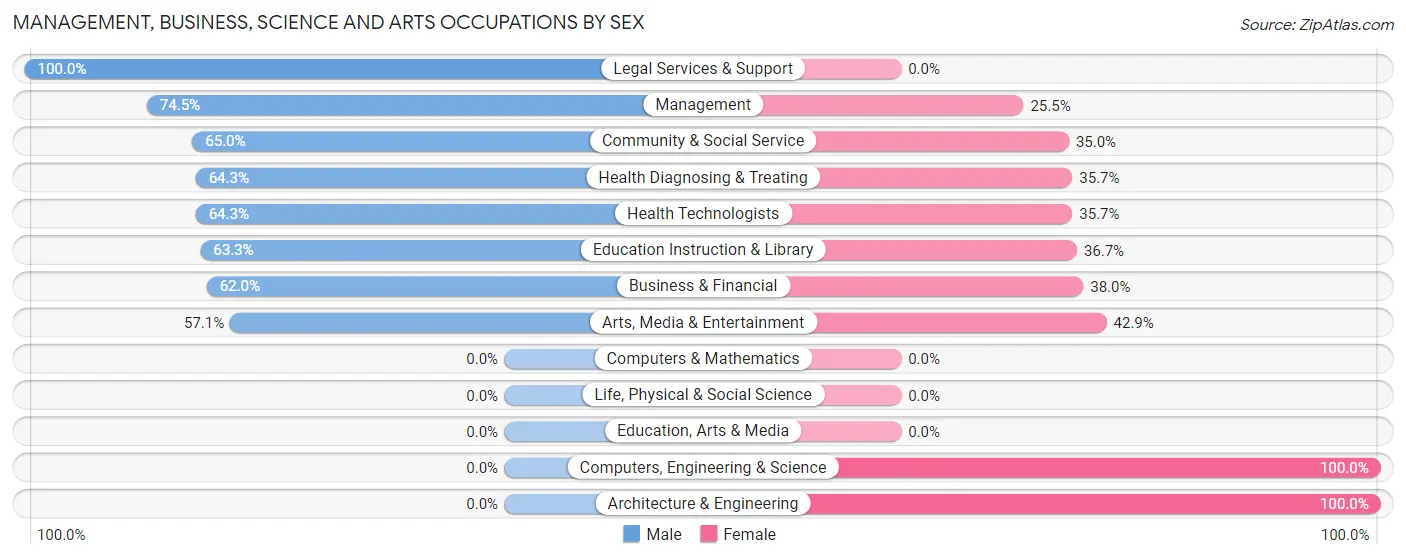
Management, Business, Science and Arts Occupations by Sex
Within the Management, Business, Science and Arts occupations in Blowing Rock, the most male-oriented occupations are Legal Services & Support (100.0%), Management (74.5%), and Community & Social Service (65.0%), while the most female-oriented occupations are Computers, Engineering & Science (100.0%), Architecture & Engineering (100.0%), and Arts, Media & Entertainment (42.9%).
| Occupation | Male | Female |
| Management | 108 (74.5%) | 37 (25.5%) |
| Business & Financial | 31 (62.0%) | 19 (38.0%) |
| Computers, Engineering & Science | 0 (0.0%) | 11 (100.0%) |
| Computers & Mathematics | 0 (0.0%) | 0 (0.0%) |
| Architecture & Engineering | 0 (0.0%) | 11 (100.0%) |
| Life, Physical & Social Science | 0 (0.0%) | 0 (0.0%) |
| Community & Social Service | 26 (65.0%) | 14 (35.0%) |
| Education, Arts & Media | 0 (0.0%) | 0 (0.0%) |
| Legal Services & Support | 3 (100.0%) | 0 (0.0%) |
| Education Instruction & Library | 19 (63.3%) | 11 (36.7%) |
| Arts, Media & Entertainment | 4 (57.1%) | 3 (42.9%) |
| Health Diagnosing & Treating | 18 (64.3%) | 10 (35.7%) |
| Health Technologists | 18 (64.3%) | 10 (35.7%) |
| Total (Category) | 183 (66.8%) | 91 (33.2%) |
| Total (Overall) | 262 (50.8%) | 254 (49.2%) |
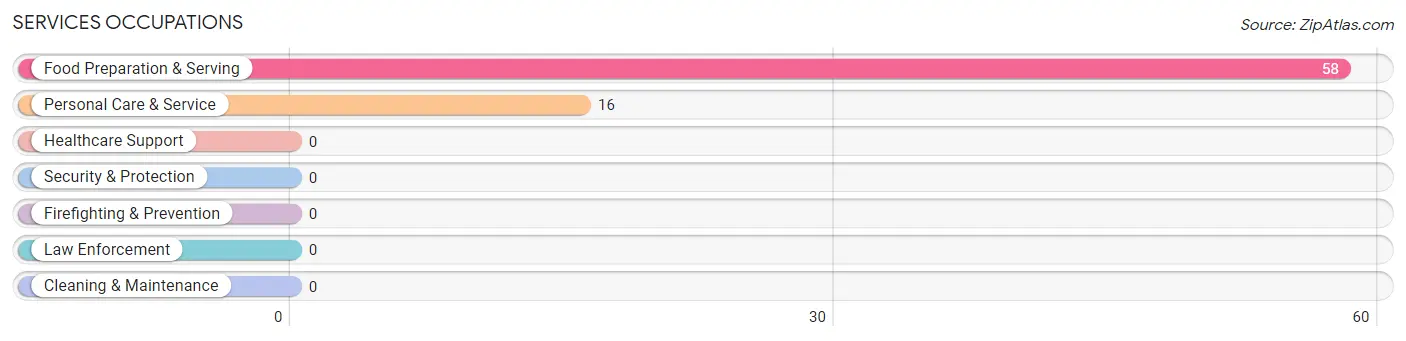
Services Occupations
The most common Services occupations in Blowing Rock are Food Preparation & Serving (58 | 11.2%), and Personal Care & Service (16 | 3.1%).
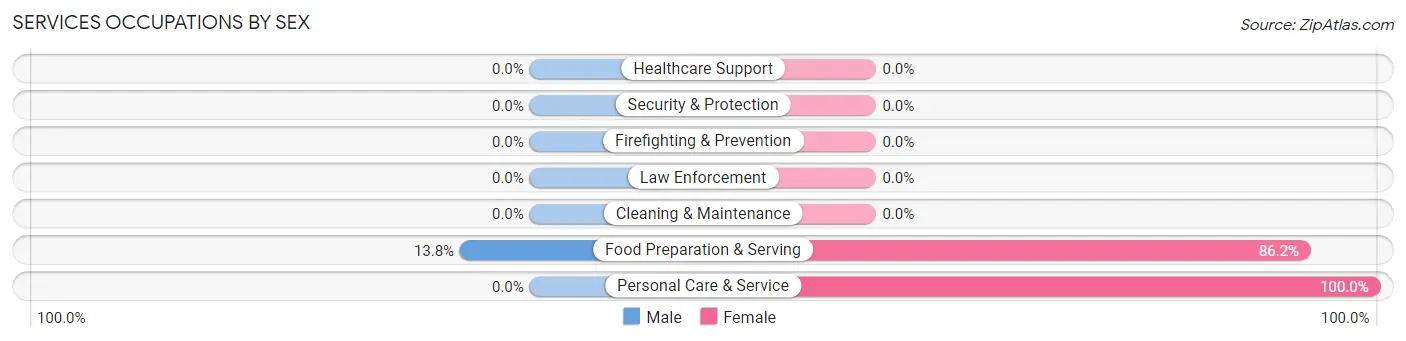
Services Occupations by Sex
| Occupation | Male | Female |
| Healthcare Support | 0 (0.0%) | 0 (0.0%) |
| Security & Protection | 0 (0.0%) | 0 (0.0%) |
| Firefighting & Prevention | 0 (0.0%) | 0 (0.0%) |
| Law Enforcement | 0 (0.0%) | 0 (0.0%) |
| Food Preparation & Serving | 8 (13.8%) | 50 (86.2%) |
| Cleaning & Maintenance | 0 (0.0%) | 0 (0.0%) |
| Personal Care & Service | 0 (0.0%) | 16 (100.0%) |
| Total (Category) | 8 (10.8%) | 66 (89.2%) |
| Total (Overall) | 262 (50.8%) | 254 (49.2%) |
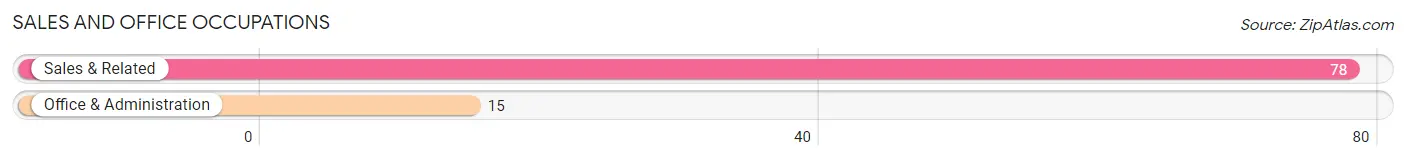
Sales and Office Occupations
The most common Sales and Office occupations in Blowing Rock are Sales & Related (78 | 15.1%), and Office & Administration (15 | 2.9%).
Sales and Office Occupations by Sex
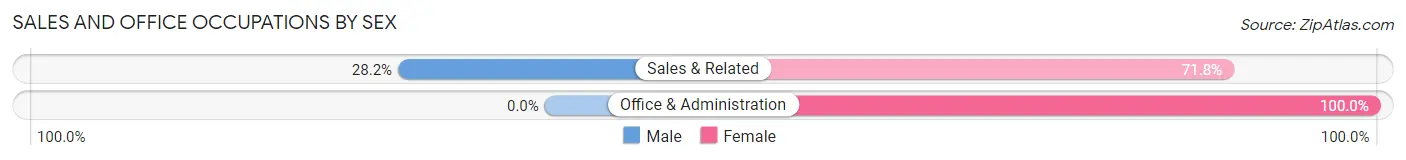
| Occupation | Male | Female |
| Sales & Related | 22 (28.2%) | 56 (71.8%) |
| Office & Administration | 0 (0.0%) | 15 (100.0%) |
| Total (Category) | 22 (23.7%) | 71 (76.3%) |
| Total (Overall) | 262 (50.8%) | 254 (49.2%) |
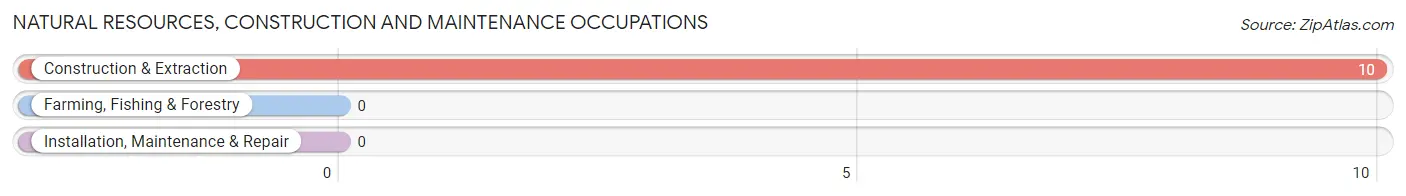
Natural Resources, Construction and Maintenance Occupations
The most common Natural Resources, Construction and Maintenance occupations in Blowing Rock are , and Construction & Extraction (10 | 1.9%).
Natural Resources, Construction and Maintenance Occupations by Sex
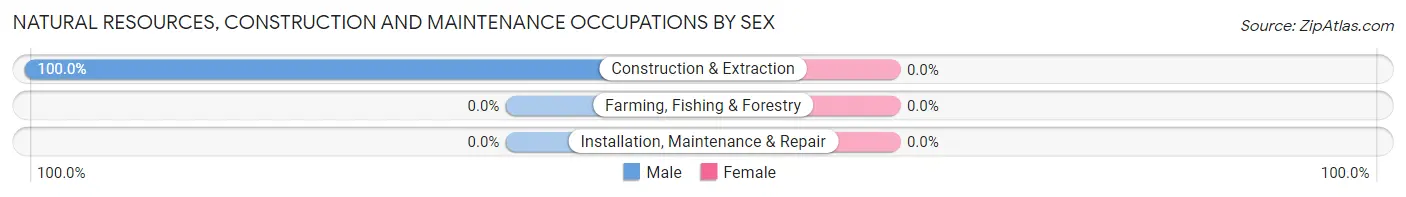
| Occupation | Male | Female |
| Farming, Fishing & Forestry | 0 (0.0%) | 0 (0.0%) |
| Construction & Extraction | 10 (100.0%) | 0 (0.0%) |
| Installation, Maintenance & Repair | 0 (0.0%) | 0 (0.0%) |
| Total (Category) | 10 (100.0%) | 0 (0.0%) |
| Total (Overall) | 262 (50.8%) | 254 (49.2%) |
Production, Transportation and Moving Occupations
The most common Production, Transportation and Moving occupations in Blowing Rock are Production (28 | 5.4%), Transportation (21 | 4.1%), and Material Moving (16 | 3.1%).
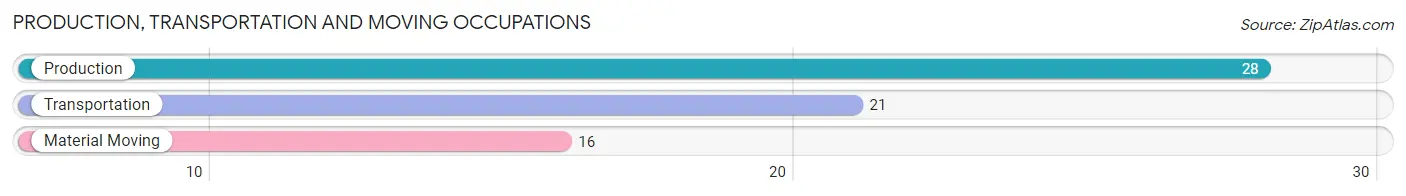
Production, Transportation and Moving Occupations by Sex
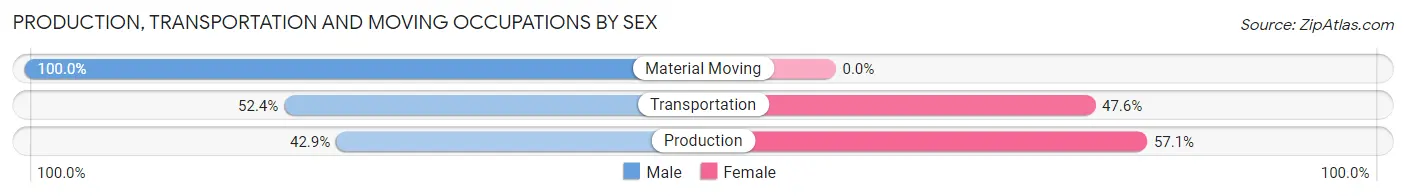
| Occupation | Male | Female |
| Production | 12 (42.9%) | 16 (57.1%) |
| Transportation | 11 (52.4%) | 10 (47.6%) |
| Material Moving | 16 (100.0%) | 0 (0.0%) |
| Total (Category) | 39 (60.0%) | 26 (40.0%) |
| Total (Overall) | 262 (50.8%) | 254 (49.2%) |
Employment Industries by Sex in Blowing Rock
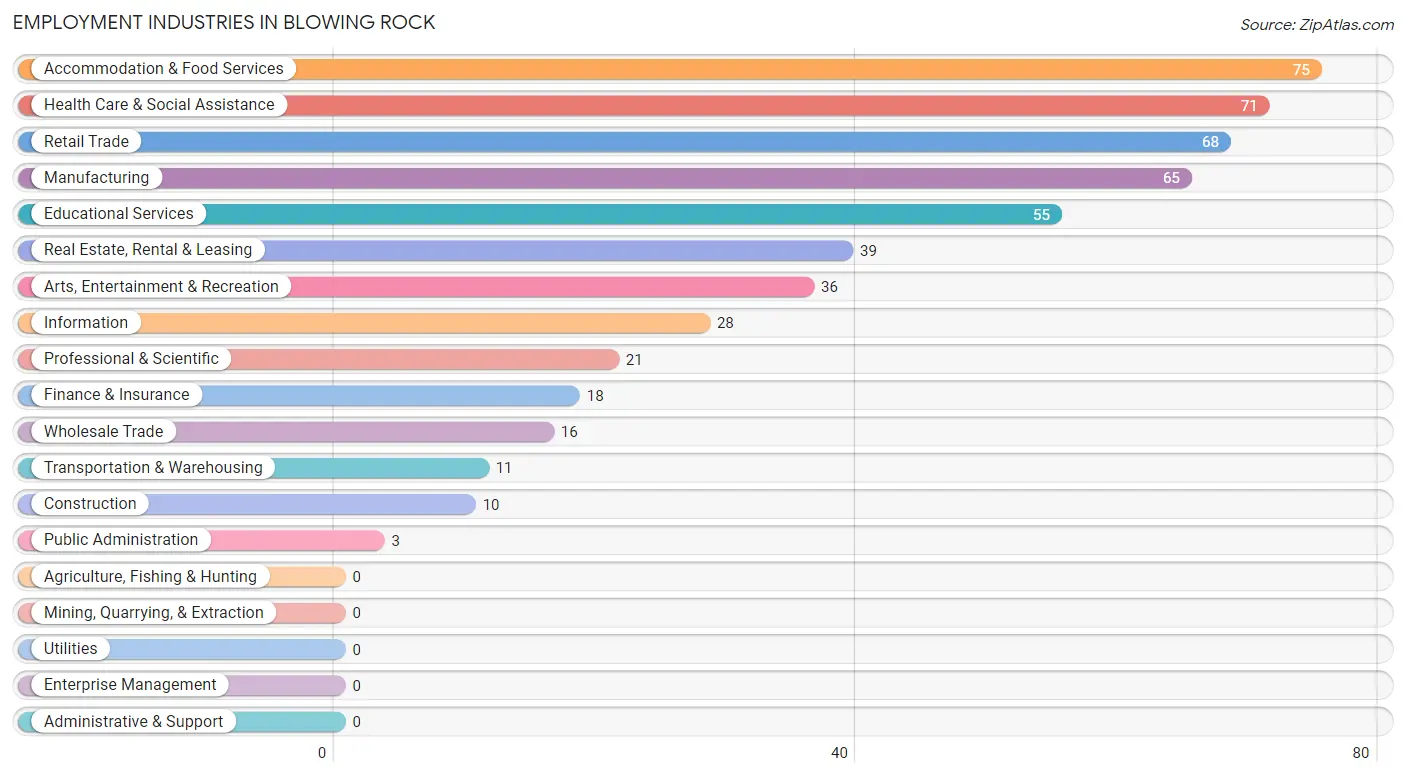
Employment Industries in Blowing Rock
The major employment industries in Blowing Rock include Accommodation & Food Services (75 | 14.5%), Health Care & Social Assistance (71 | 13.8%), Retail Trade (68 | 13.2%), Manufacturing (65 | 12.6%), and Educational Services (55 | 10.7%).
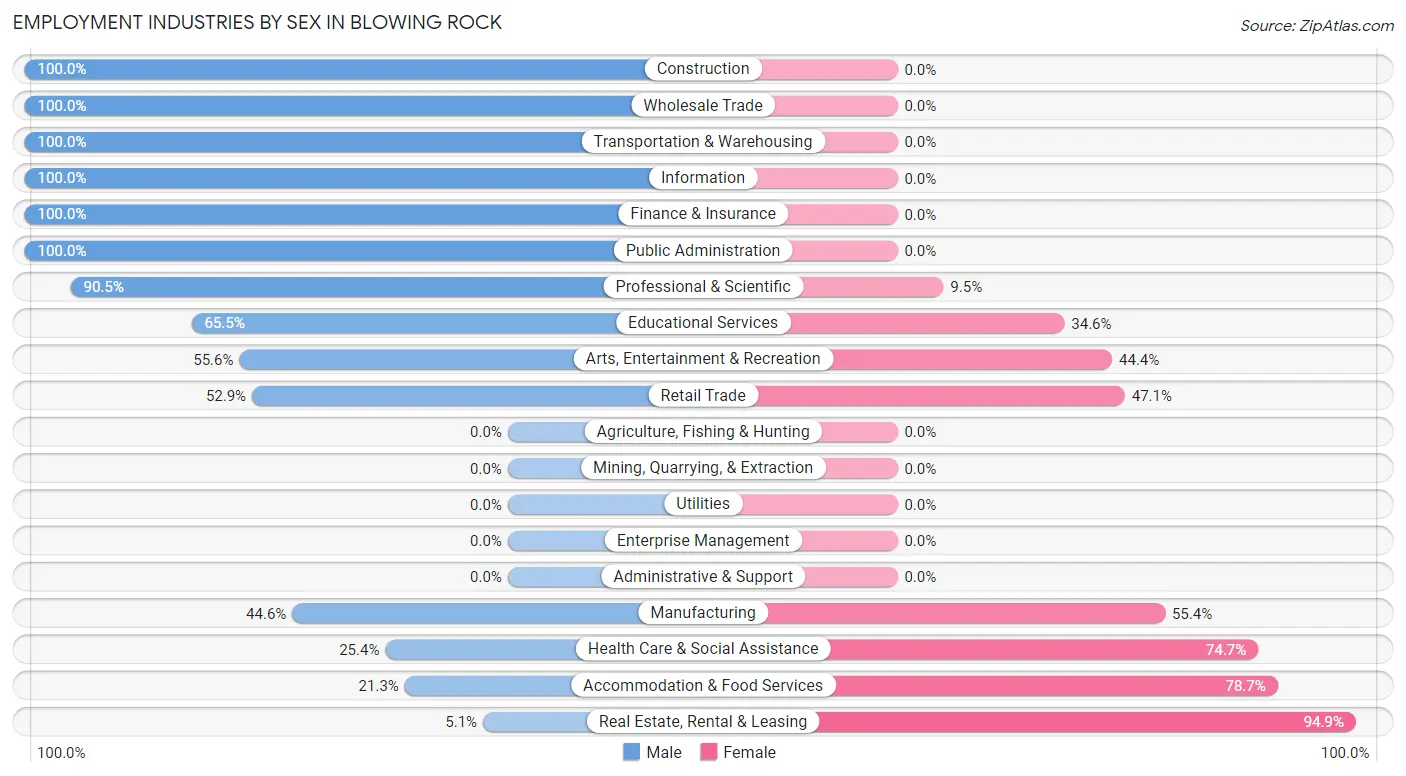
Employment Industries by Sex in Blowing Rock
The Blowing Rock industries that see more men than women are Construction (100.0%), Wholesale Trade (100.0%), and Transportation & Warehousing (100.0%), whereas the industries that tend to have a higher number of women are Real Estate, Rental & Leasing (94.9%), Accommodation & Food Services (78.7%), and Health Care & Social Assistance (74.7%).
| Industry | Male | Female |
| Agriculture, Fishing & Hunting | 0 (0.0%) | 0 (0.0%) |
| Mining, Quarrying, & Extraction | 0 (0.0%) | 0 (0.0%) |
| Construction | 10 (100.0%) | 0 (0.0%) |
| Manufacturing | 29 (44.6%) | 36 (55.4%) |
| Wholesale Trade | 16 (100.0%) | 0 (0.0%) |
| Retail Trade | 36 (52.9%) | 32 (47.1%) |
| Transportation & Warehousing | 11 (100.0%) | 0 (0.0%) |
| Utilities | 0 (0.0%) | 0 (0.0%) |
| Information | 28 (100.0%) | 0 (0.0%) |
| Finance & Insurance | 18 (100.0%) | 0 (0.0%) |
| Real Estate, Rental & Leasing | 2 (5.1%) | 37 (94.9%) |
| Professional & Scientific | 19 (90.5%) | 2 (9.5%) |
| Enterprise Management | 0 (0.0%) | 0 (0.0%) |
| Administrative & Support | 0 (0.0%) | 0 (0.0%) |
| Educational Services | 36 (65.4%) | 19 (34.5%) |
| Health Care & Social Assistance | 18 (25.4%) | 53 (74.7%) |
| Arts, Entertainment & Recreation | 20 (55.6%) | 16 (44.4%) |
| Accommodation & Food Services | 16 (21.3%) | 59 (78.7%) |
| Public Administration | 3 (100.0%) | 0 (0.0%) |
| Total | 262 (50.8%) | 254 (49.2%) |
Education in Blowing Rock
School Enrollment in Blowing Rock
The most common levels of schooling among the 53 students in Blowing Rock are middle school (21 | 39.6%), high school (17 | 32.1%), and college / undergraduate (15 | 28.3%).
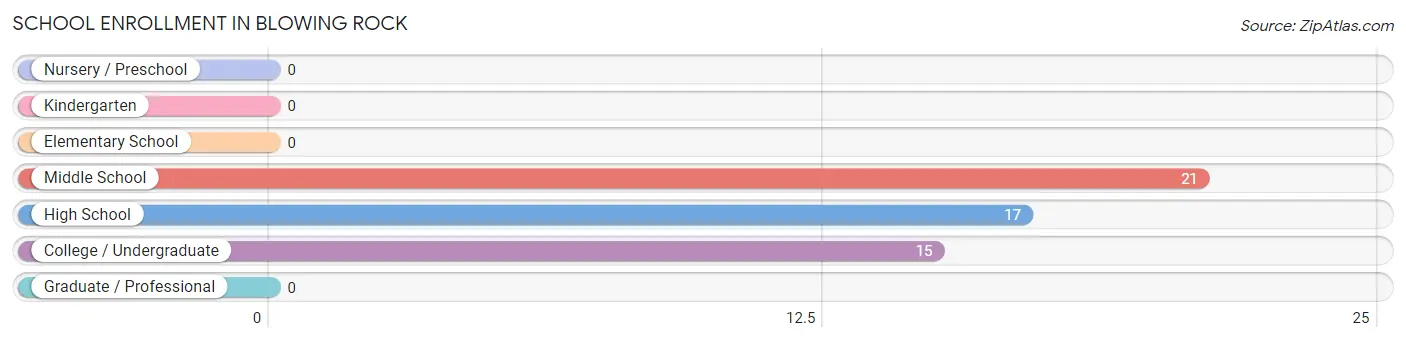
| School Level | # Students | % Students |
| Nursery / Preschool | 0 | 0.0% |
| Kindergarten | 0 | 0.0% |
| Elementary School | 0 | 0.0% |
| Middle School | 21 | 39.6% |
| High School | 17 | 32.1% |
| College / Undergraduate | 15 | 28.3% |
| Graduate / Professional | 0 | 0.0% |
| Total | 53 | 100.0% |
School Enrollment by Age by Funding Source in Blowing Rock
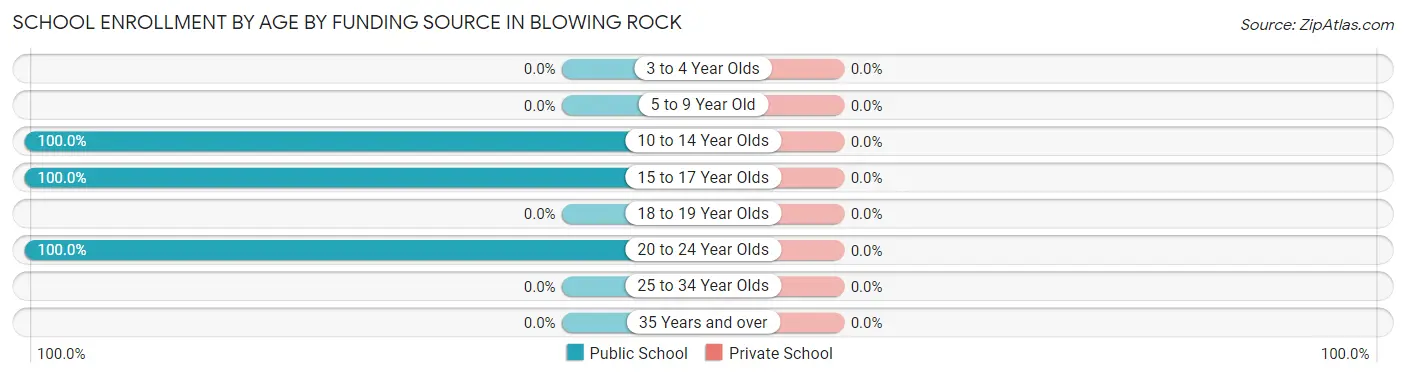
| Age Bracket | Public School | Private School |
| 3 to 4 Year Olds | 0 (0.0%) | 0 (0.0%) |
| 5 to 9 Year Old | 0 (0.0%) | 0 (0.0%) |
| 10 to 14 Year Olds | 21 (100.0%) | 0 (0.0%) |
| 15 to 17 Year Olds | 17 (100.0%) | 0 (0.0%) |
| 18 to 19 Year Olds | 0 (0.0%) | 0 (0.0%) |
| 20 to 24 Year Olds | 15 (100.0%) | 0 (0.0%) |
| 25 to 34 Year Olds | 0 (0.0%) | 0 (0.0%) |
| 35 Years and over | 0 (0.0%) | 0 (0.0%) |
| Total | 53 (100.0%) | 0 (0.0%) |
Educational Attainment by Field of Study in Blowing Rock
Business (112 | 20.8%), education (65 | 12.1%), psychology (59 | 11.0%), engineering (51 | 9.5%), and social sciences (49 | 9.1%) are the most common fields of study among 539 individuals in Blowing Rock who have obtained a bachelor's degree or higher.
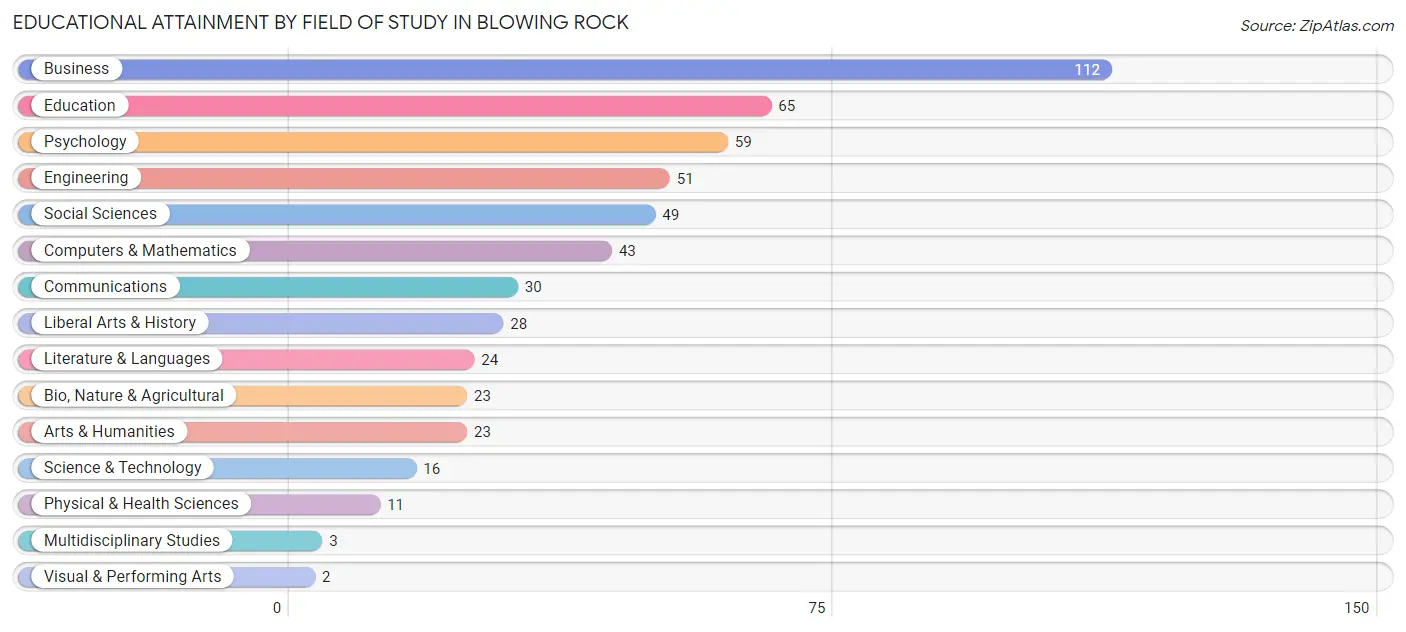
| Field of Study | # Graduates | % Graduates |
| Computers & Mathematics | 43 | 8.0% |
| Bio, Nature & Agricultural | 23 | 4.3% |
| Physical & Health Sciences | 11 | 2.0% |
| Psychology | 59 | 11.0% |
| Social Sciences | 49 | 9.1% |
| Engineering | 51 | 9.5% |
| Multidisciplinary Studies | 3 | 0.6% |
| Science & Technology | 16 | 3.0% |
| Business | 112 | 20.8% |
| Education | 65 | 12.1% |
| Literature & Languages | 24 | 4.4% |
| Liberal Arts & History | 28 | 5.2% |
| Visual & Performing Arts | 2 | 0.4% |
| Communications | 30 | 5.6% |
| Arts & Humanities | 23 | 4.3% |
| Total | 539 | 100.0% |
Transportation & Commute in Blowing Rock
Vehicle Availability by Sex in Blowing Rock
The most prevalent vehicle ownership categories in Blowing Rock are males with 2 vehicles (167, accounting for 63.7%) and females with 2 vehicles (126, making up 66.8%).
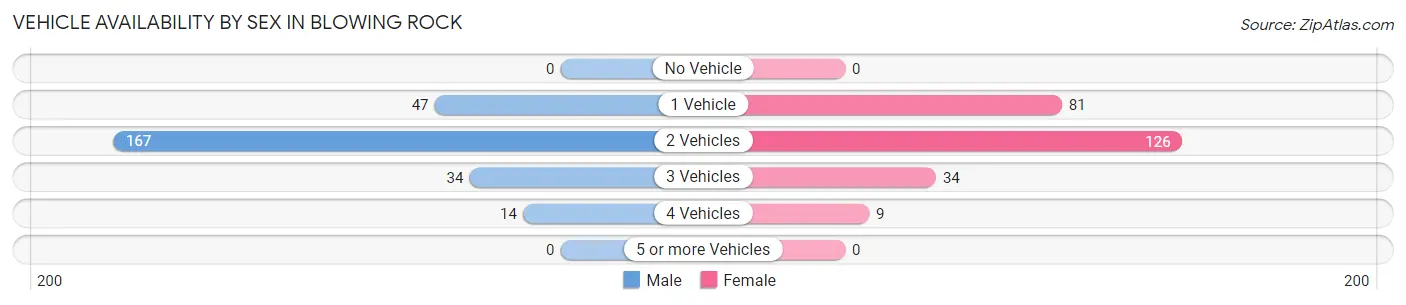
| Vehicles Available | Male | Female |
| No Vehicle | 0 (0.0%) | 0 (0.0%) |
| 1 Vehicle | 47 (17.9%) | 81 (32.4%) |
| 2 Vehicles | 167 (63.7%) | 126 (50.4%) |
| 3 Vehicles | 34 (13.0%) | 34 (13.6%) |
| 4 Vehicles | 14 (5.3%) | 9 (3.6%) |
| 5 or more Vehicles | 0 (0.0%) | 0 (0.0%) |
| Total | 262 (100.0%) | 250 (100.0%) |
Commute Time in Blowing Rock
The most frequently occuring commute durations in Blowing Rock are 5 to 9 minutes (113 commuters, 26.1%), less than 5 minutes (87 commuters, 20.1%), and 20 to 24 minutes (82 commuters, 18.9%).
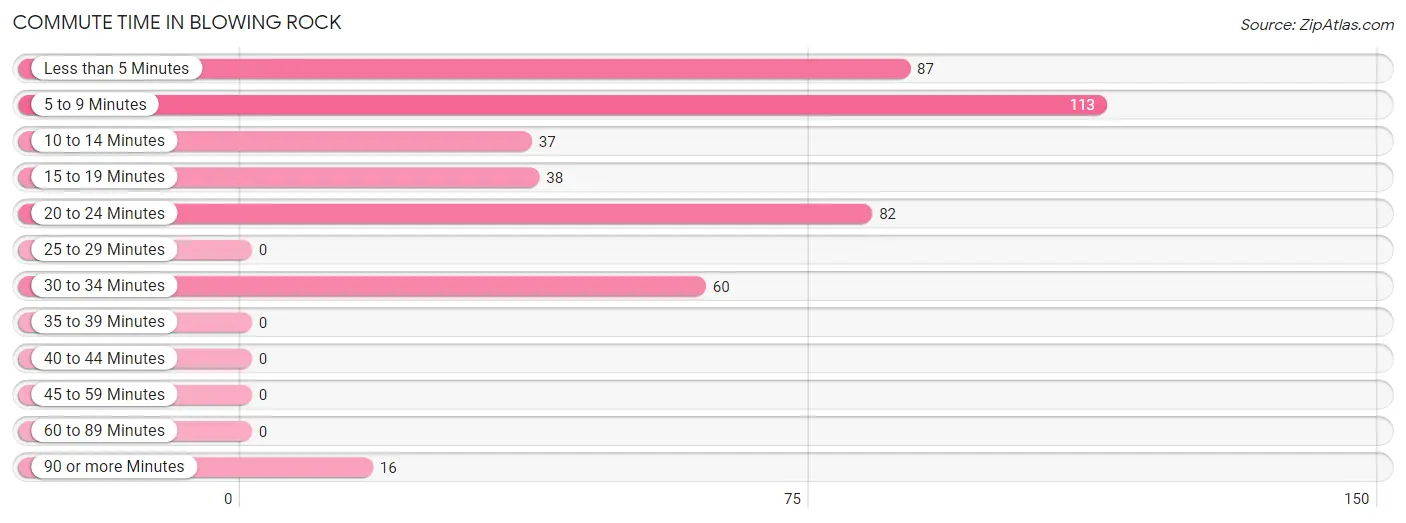
| Commute Time | # Commuters | % Commuters |
| Less than 5 Minutes | 87 | 20.1% |
| 5 to 9 Minutes | 113 | 26.1% |
| 10 to 14 Minutes | 37 | 8.6% |
| 15 to 19 Minutes | 38 | 8.8% |
| 20 to 24 Minutes | 82 | 18.9% |
| 25 to 29 Minutes | 0 | 0.0% |
| 30 to 34 Minutes | 60 | 13.9% |
| 35 to 39 Minutes | 0 | 0.0% |
| 40 to 44 Minutes | 0 | 0.0% |
| 45 to 59 Minutes | 0 | 0.0% |
| 60 to 89 Minutes | 0 | 0.0% |
| 90 or more Minutes | 16 | 3.7% |
Commute Time by Sex in Blowing Rock
The most common commute times in Blowing Rock are 5 to 9 minutes (67 commuters, 30.3%) for males and less than 5 minutes (59 commuters, 27.8%) for females.
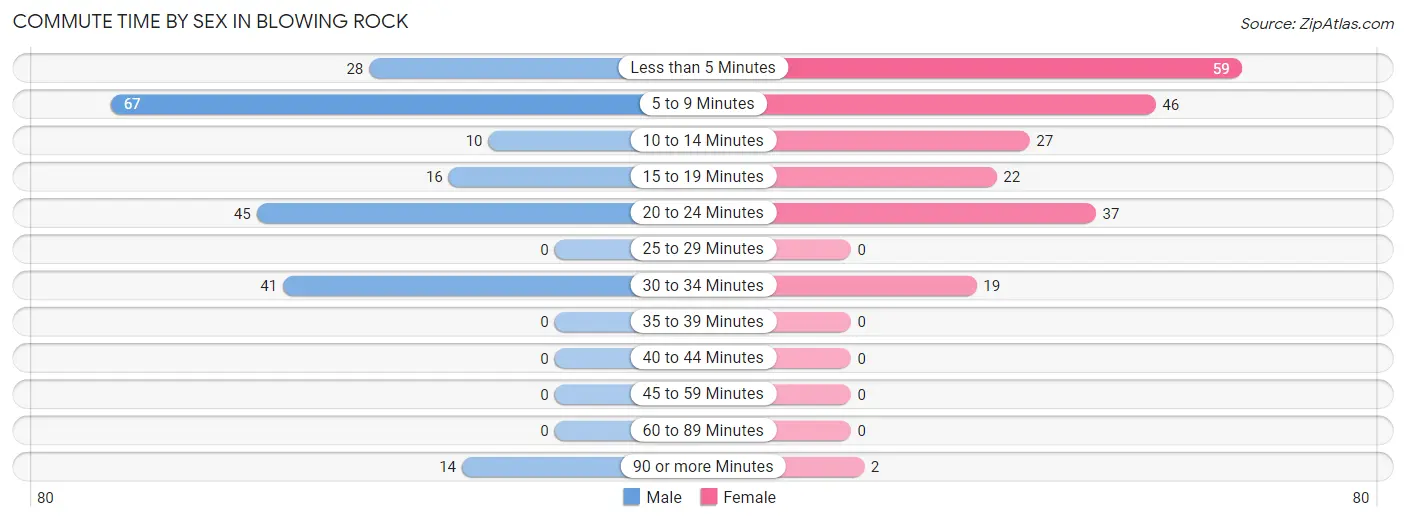
| Commute Time | Male | Female |
| Less than 5 Minutes | 28 (12.7%) | 59 (27.8%) |
| 5 to 9 Minutes | 67 (30.3%) | 46 (21.7%) |
| 10 to 14 Minutes | 10 (4.5%) | 27 (12.7%) |
| 15 to 19 Minutes | 16 (7.2%) | 22 (10.4%) |
| 20 to 24 Minutes | 45 (20.4%) | 37 (17.4%) |
| 25 to 29 Minutes | 0 (0.0%) | 0 (0.0%) |
| 30 to 34 Minutes | 41 (18.5%) | 19 (9.0%) |
| 35 to 39 Minutes | 0 (0.0%) | 0 (0.0%) |
| 40 to 44 Minutes | 0 (0.0%) | 0 (0.0%) |
| 45 to 59 Minutes | 0 (0.0%) | 0 (0.0%) |
| 60 to 89 Minutes | 0 (0.0%) | 0 (0.0%) |
| 90 or more Minutes | 14 (6.3%) | 2 (0.9%) |
Time of Departure to Work by Sex in Blowing Rock
The most frequent times of departure to work in Blowing Rock are 7:30 AM to 7:59 AM (74, 33.5%) for males and 12:00 PM to 3:59 PM (58, 27.4%) for females.
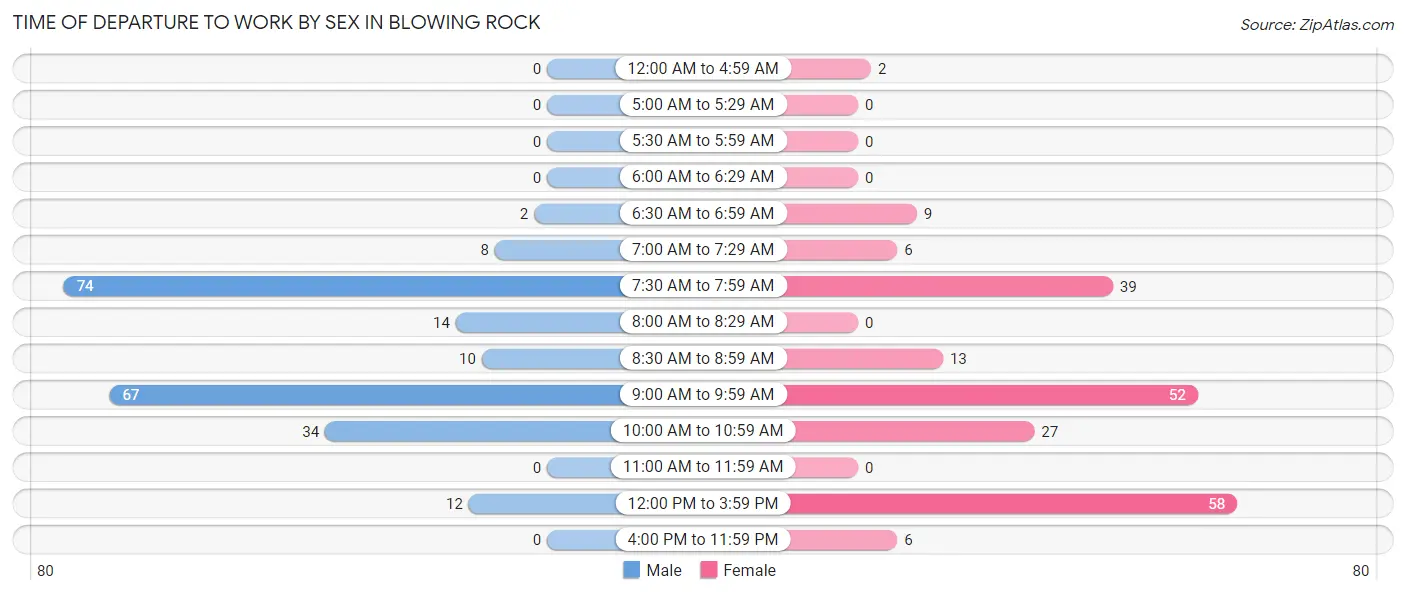
| Time of Departure | Male | Female |
| 12:00 AM to 4:59 AM | 0 (0.0%) | 2 (0.9%) |
| 5:00 AM to 5:29 AM | 0 (0.0%) | 0 (0.0%) |
| 5:30 AM to 5:59 AM | 0 (0.0%) | 0 (0.0%) |
| 6:00 AM to 6:29 AM | 0 (0.0%) | 0 (0.0%) |
| 6:30 AM to 6:59 AM | 2 (0.9%) | 9 (4.3%) |
| 7:00 AM to 7:29 AM | 8 (3.6%) | 6 (2.8%) |
| 7:30 AM to 7:59 AM | 74 (33.5%) | 39 (18.4%) |
| 8:00 AM to 8:29 AM | 14 (6.3%) | 0 (0.0%) |
| 8:30 AM to 8:59 AM | 10 (4.5%) | 13 (6.1%) |
| 9:00 AM to 9:59 AM | 67 (30.3%) | 52 (24.5%) |
| 10:00 AM to 10:59 AM | 34 (15.4%) | 27 (12.7%) |
| 11:00 AM to 11:59 AM | 0 (0.0%) | 0 (0.0%) |
| 12:00 PM to 3:59 PM | 12 (5.4%) | 58 (27.4%) |
| 4:00 PM to 11:59 PM | 0 (0.0%) | 6 (2.8%) |
| Total | 221 (100.0%) | 212 (100.0%) |
Housing Occupancy in Blowing Rock
Occupancy by Ownership in Blowing Rock
Of the total 480 dwellings in Blowing Rock, owner-occupied units account for 342 (71.3%), while renter-occupied units make up 138 (28.7%).
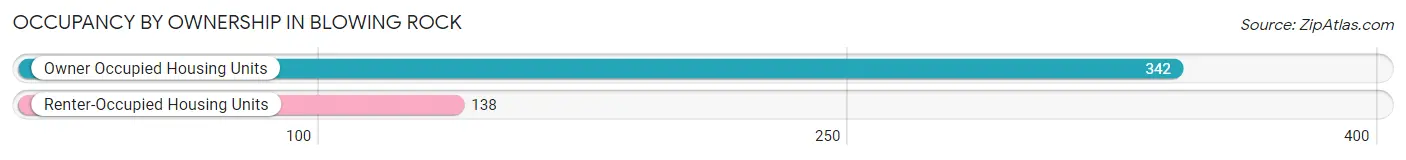
| Occupancy | # Housing Units | % Housing Units |
| Owner Occupied Housing Units | 342 | 71.3% |
| Renter-Occupied Housing Units | 138 | 28.7% |
| Total Occupied Housing Units | 480 | 100.0% |
Occupancy by Household Size in Blowing Rock
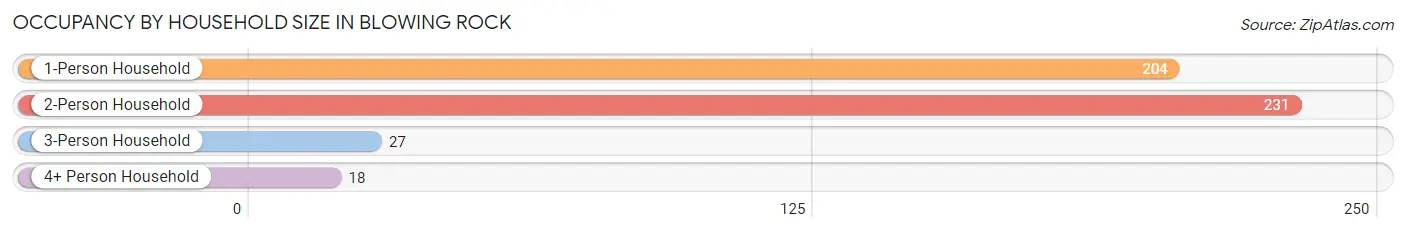
| Household Size | # Housing Units | % Housing Units |
| 1-Person Household | 204 | 42.5% |
| 2-Person Household | 231 | 48.1% |
| 3-Person Household | 27 | 5.6% |
| 4+ Person Household | 18 | 3.7% |
| Total Housing Units | 480 | 100.0% |
Occupancy by Ownership by Household Size in Blowing Rock
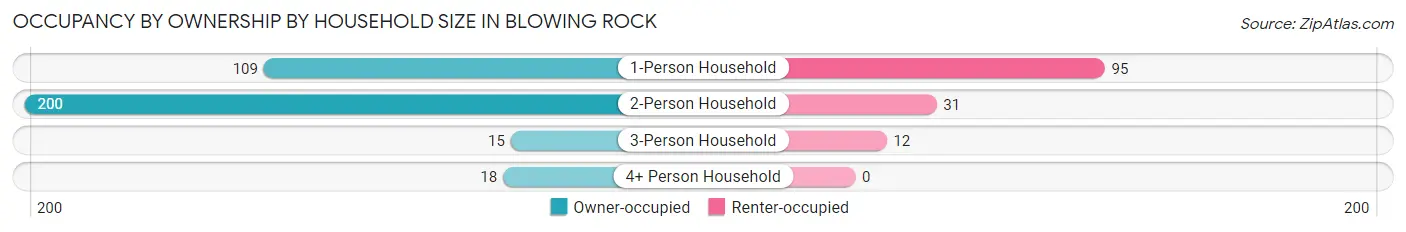
| Household Size | Owner-occupied | Renter-occupied |
| 1-Person Household | 109 (53.4%) | 95 (46.6%) |
| 2-Person Household | 200 (86.6%) | 31 (13.4%) |
| 3-Person Household | 15 (55.6%) | 12 (44.4%) |
| 4+ Person Household | 18 (100.0%) | 0 (0.0%) |
| Total Housing Units | 342 (71.3%) | 138 (28.7%) |
Occupancy by Educational Attainment in Blowing Rock
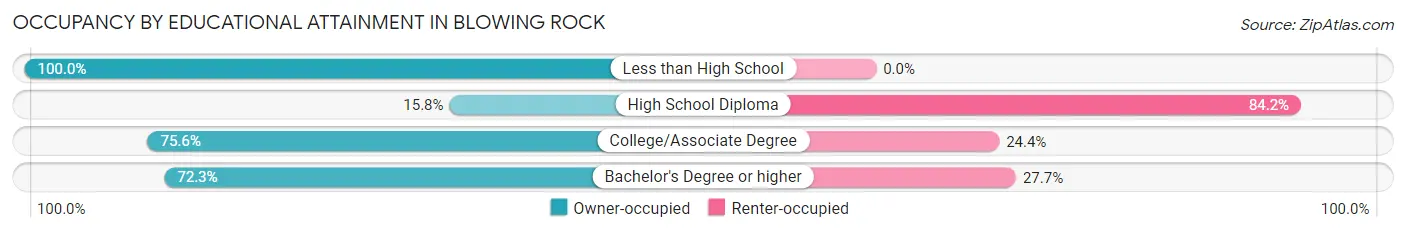
| Household Size | Owner-occupied | Renter-occupied |
| Less than High School | 11 (100.0%) | 0 (0.0%) |
| High School Diploma | 3 (15.8%) | 16 (84.2%) |
| College/Associate Degree | 62 (75.6%) | 20 (24.4%) |
| Bachelor's Degree or higher | 266 (72.3%) | 102 (27.7%) |
Occupancy by Age of Householder in Blowing Rock
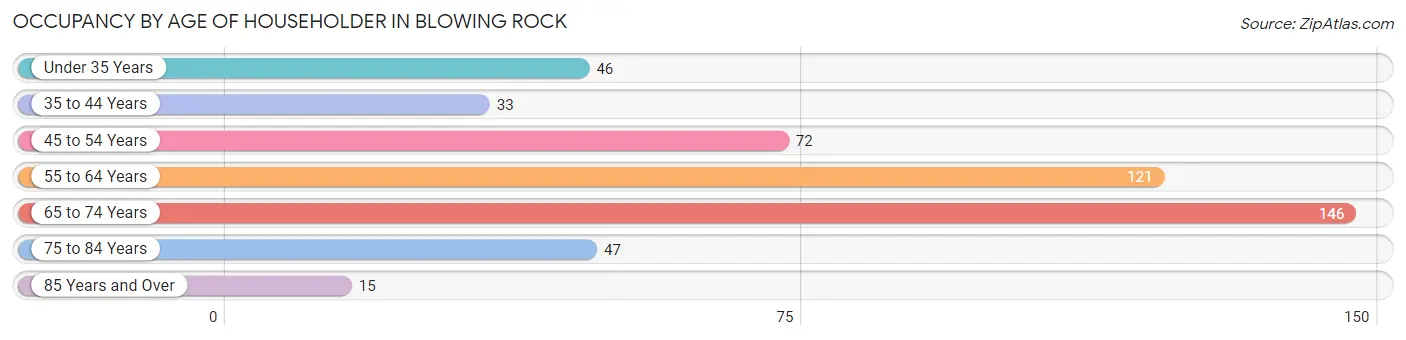
| Age Bracket | # Households | % Households |
| Under 35 Years | 46 | 9.6% |
| 35 to 44 Years | 33 | 6.9% |
| 45 to 54 Years | 72 | 15.0% |
| 55 to 64 Years | 121 | 25.2% |
| 65 to 74 Years | 146 | 30.4% |
| 75 to 84 Years | 47 | 9.8% |
| 85 Years and Over | 15 | 3.1% |
| Total | 480 | 100.0% |
Housing Finances in Blowing Rock
Median Income by Occupancy in Blowing Rock
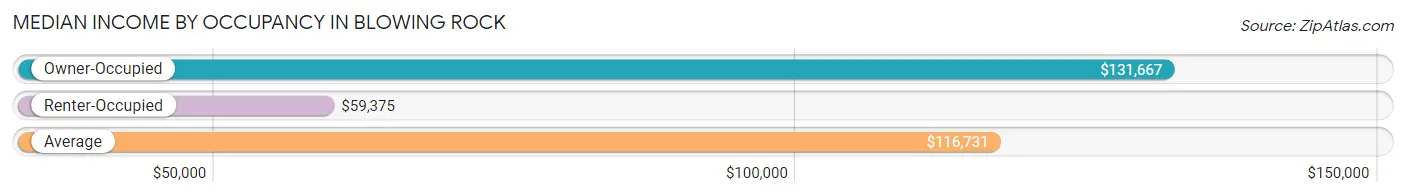
| Occupancy Type | # Households | Median Income |
| Owner-Occupied | 342 (71.3%) | $131,667 |
| Renter-Occupied | 138 (28.7%) | $59,375 |
| Average | 480 (100.0%) | $116,731 |
Occupancy by Householder Income Bracket in Blowing Rock
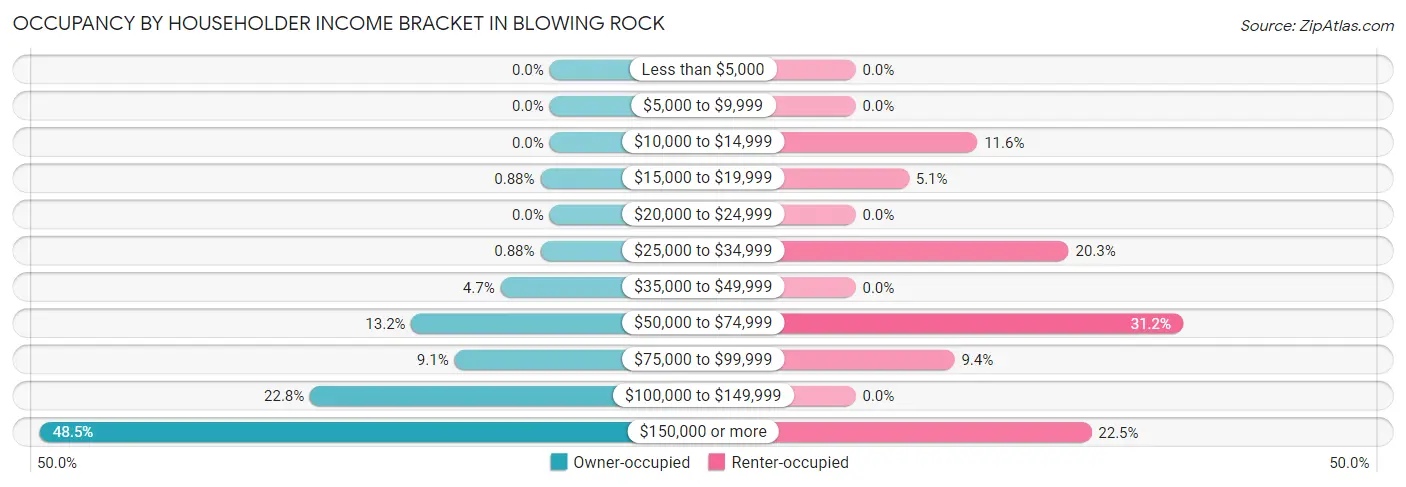
| Income Bracket | Owner-occupied | Renter-occupied |
| Less than $5,000 | 0 (0.0%) | 0 (0.0%) |
| $5,000 to $9,999 | 0 (0.0%) | 0 (0.0%) |
| $10,000 to $14,999 | 0 (0.0%) | 16 (11.6%) |
| $15,000 to $19,999 | 3 (0.9%) | 7 (5.1%) |
| $20,000 to $24,999 | 0 (0.0%) | 0 (0.0%) |
| $25,000 to $34,999 | 3 (0.9%) | 28 (20.3%) |
| $35,000 to $49,999 | 16 (4.7%) | 0 (0.0%) |
| $50,000 to $74,999 | 45 (13.2%) | 43 (31.2%) |
| $75,000 to $99,999 | 31 (9.1%) | 13 (9.4%) |
| $100,000 to $149,999 | 78 (22.8%) | 0 (0.0%) |
| $150,000 or more | 166 (48.5%) | 31 (22.5%) |
| Total | 342 (100.0%) | 138 (100.0%) |
Monthly Housing Cost Tiers in Blowing Rock
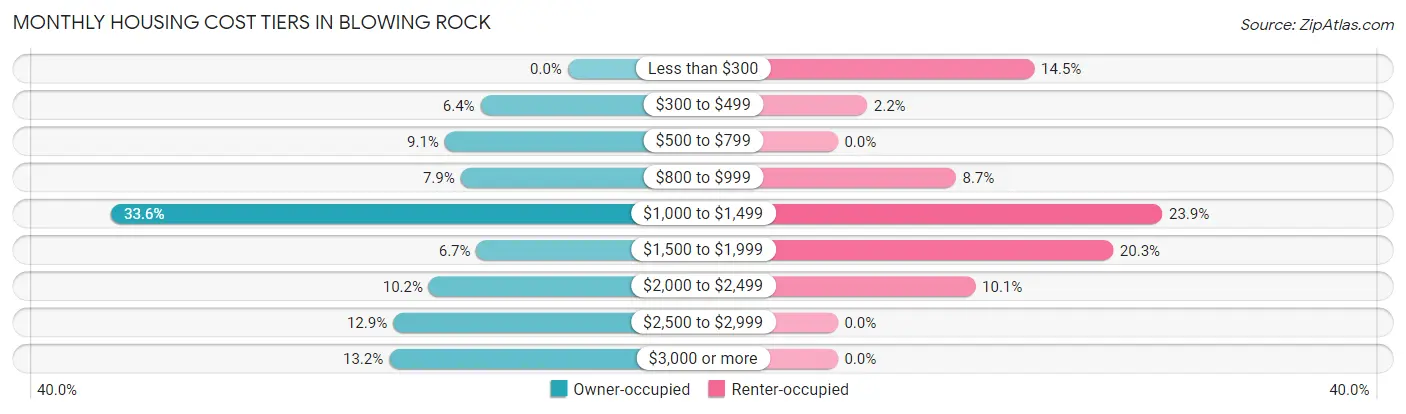
| Monthly Cost | Owner-occupied | Renter-occupied |
| Less than $300 | 0 (0.0%) | 20 (14.5%) |
| $300 to $499 | 22 (6.4%) | 3 (2.2%) |
| $500 to $799 | 31 (9.1%) | 0 (0.0%) |
| $800 to $999 | 27 (7.9%) | 12 (8.7%) |
| $1,000 to $1,499 | 115 (33.6%) | 33 (23.9%) |
| $1,500 to $1,999 | 23 (6.7%) | 28 (20.3%) |
| $2,000 to $2,499 | 35 (10.2%) | 14 (10.1%) |
| $2,500 to $2,999 | 44 (12.9%) | 0 (0.0%) |
| $3,000 or more | 45 (13.2%) | 0 (0.0%) |
| Total | 342 (100.0%) | 138 (100.0%) |
Physical Housing Characteristics in Blowing Rock
Housing Structures in Blowing Rock
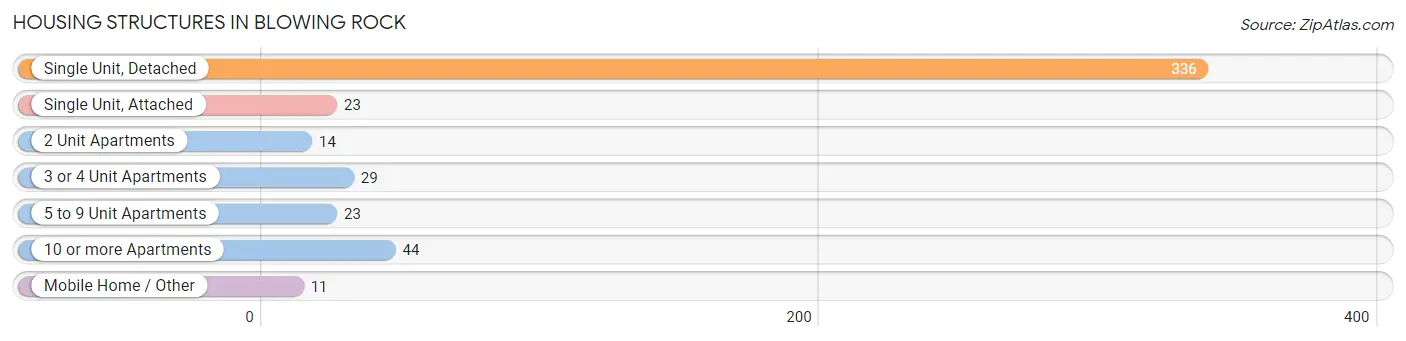
| Structure Type | # Housing Units | % Housing Units |
| Single Unit, Detached | 336 | 70.0% |
| Single Unit, Attached | 23 | 4.8% |
| 2 Unit Apartments | 14 | 2.9% |
| 3 or 4 Unit Apartments | 29 | 6.0% |
| 5 to 9 Unit Apartments | 23 | 4.8% |
| 10 or more Apartments | 44 | 9.2% |
| Mobile Home / Other | 11 | 2.3% |
| Total | 480 | 100.0% |
Housing Structures by Occupancy in Blowing Rock
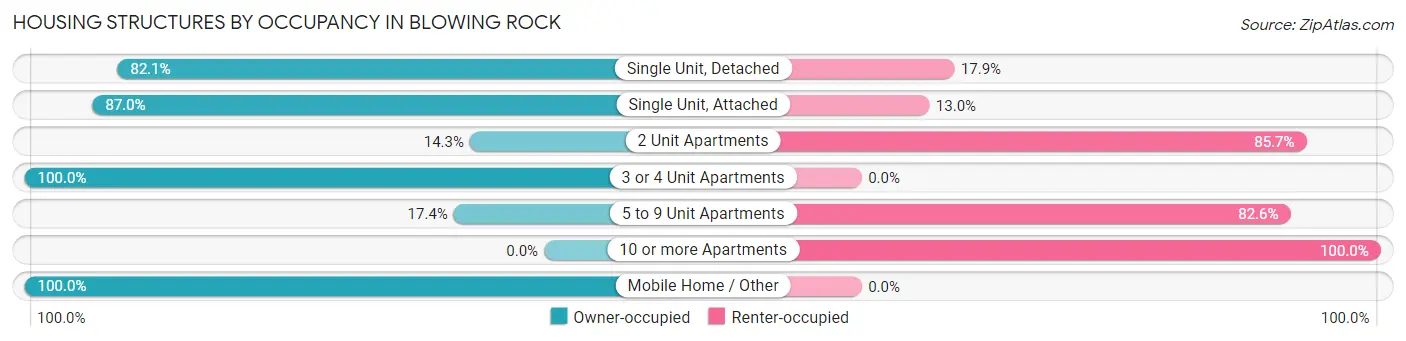
| Structure Type | Owner-occupied | Renter-occupied |
| Single Unit, Detached | 276 (82.1%) | 60 (17.9%) |
| Single Unit, Attached | 20 (87.0%) | 3 (13.0%) |
| 2 Unit Apartments | 2 (14.3%) | 12 (85.7%) |
| 3 or 4 Unit Apartments | 29 (100.0%) | 0 (0.0%) |
| 5 to 9 Unit Apartments | 4 (17.4%) | 19 (82.6%) |
| 10 or more Apartments | 0 (0.0%) | 44 (100.0%) |
| Mobile Home / Other | 11 (100.0%) | 0 (0.0%) |
| Total | 342 (71.3%) | 138 (28.7%) |
Housing Structures by Number of Rooms in Blowing Rock
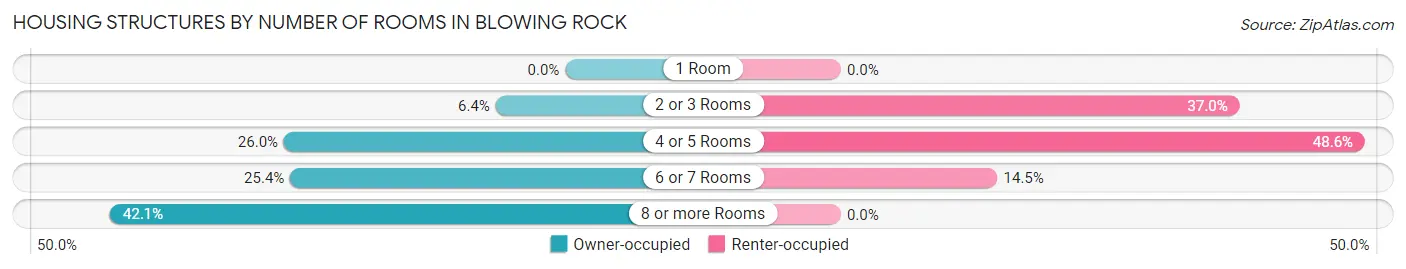
| Number of Rooms | Owner-occupied | Renter-occupied |
| 1 Room | 0 (0.0%) | 0 (0.0%) |
| 2 or 3 Rooms | 22 (6.4%) | 51 (37.0%) |
| 4 or 5 Rooms | 89 (26.0%) | 67 (48.5%) |
| 6 or 7 Rooms | 87 (25.4%) | 20 (14.5%) |
| 8 or more Rooms | 144 (42.1%) | 0 (0.0%) |
| Total | 342 (100.0%) | 138 (100.0%) |
Housing Structure by Heating Type in Blowing Rock
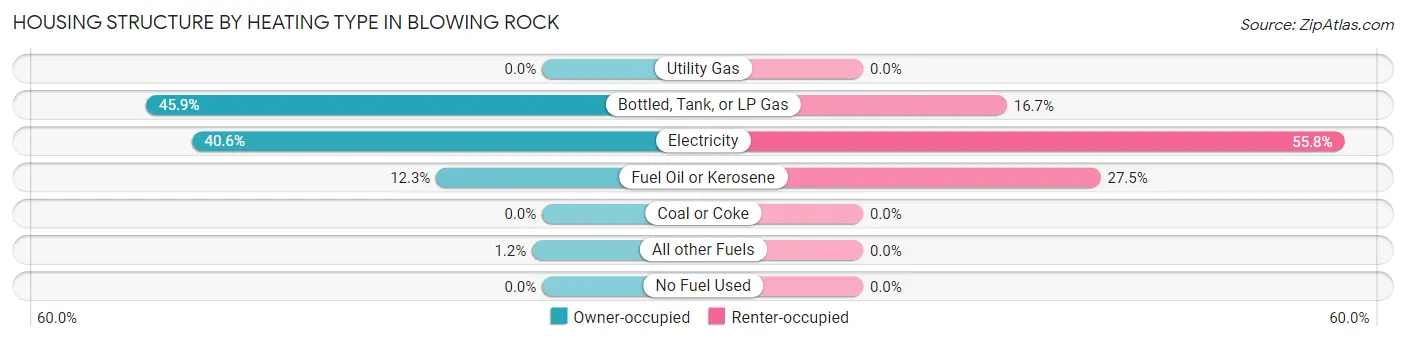
| Heating Type | Owner-occupied | Renter-occupied |
| Utility Gas | 0 (0.0%) | 0 (0.0%) |
| Bottled, Tank, or LP Gas | 157 (45.9%) | 23 (16.7%) |
| Electricity | 139 (40.6%) | 77 (55.8%) |
| Fuel Oil or Kerosene | 42 (12.3%) | 38 (27.5%) |
| Coal or Coke | 0 (0.0%) | 0 (0.0%) |
| All other Fuels | 4 (1.2%) | 0 (0.0%) |
| No Fuel Used | 0 (0.0%) | 0 (0.0%) |
| Total | 342 (100.0%) | 138 (100.0%) |
Household Vehicle Usage in Blowing Rock
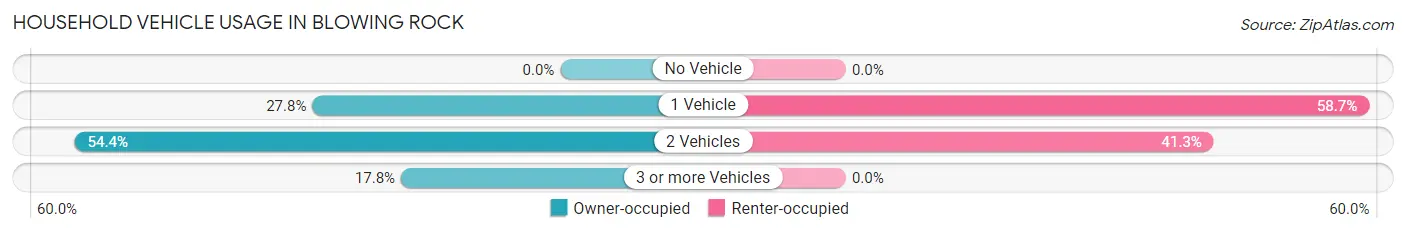
| Vehicles per Household | Owner-occupied | Renter-occupied |
| No Vehicle | 0 (0.0%) | 0 (0.0%) |
| 1 Vehicle | 95 (27.8%) | 81 (58.7%) |
| 2 Vehicles | 186 (54.4%) | 57 (41.3%) |
| 3 or more Vehicles | 61 (17.8%) | 0 (0.0%) |
| Total | 342 (100.0%) | 138 (100.0%) |
Real Estate & Mortgages in Blowing Rock
Real Estate and Mortgage Overview in Blowing Rock
| Characteristic | Without Mortgage | With Mortgage |
| Housing Units | 168 | 174 |
| Median Property Value | $725,000 | $542,800 |
| Median Household Income | $162,708 | $79 |
| Monthly Housing Costs | $1,010 | $45 |
| Real Estate Taxes | $3,909 | $0 |
Property Value by Mortgage Status in Blowing Rock
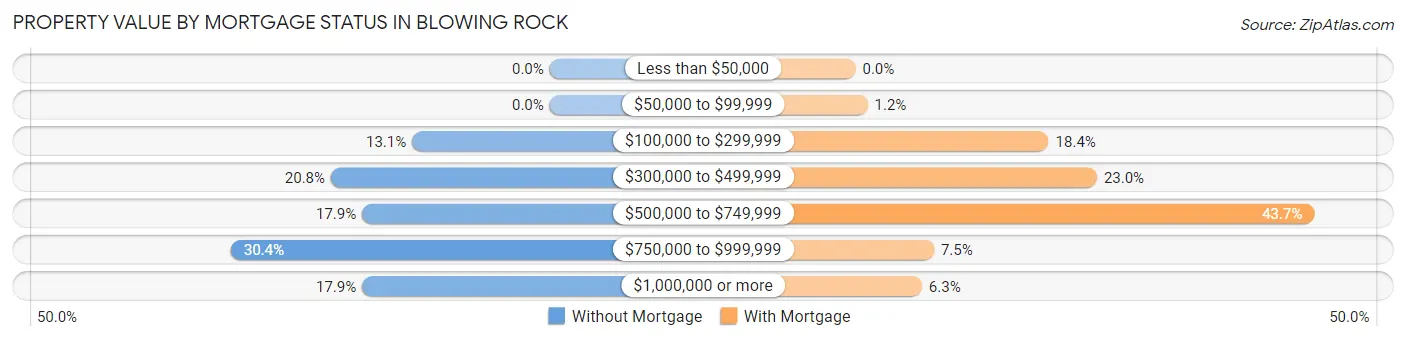
| Property Value | Without Mortgage | With Mortgage |
| Less than $50,000 | 0 (0.0%) | 0 (0.0%) |
| $50,000 to $99,999 | 0 (0.0%) | 2 (1.1%) |
| $100,000 to $299,999 | 22 (13.1%) | 32 (18.4%) |
| $300,000 to $499,999 | 35 (20.8%) | 40 (23.0%) |
| $500,000 to $749,999 | 30 (17.9%) | 76 (43.7%) |
| $750,000 to $999,999 | 51 (30.4%) | 13 (7.5%) |
| $1,000,000 or more | 30 (17.9%) | 11 (6.3%) |
| Total | 168 (100.0%) | 174 (100.0%) |
Household Income by Mortgage Status in Blowing Rock
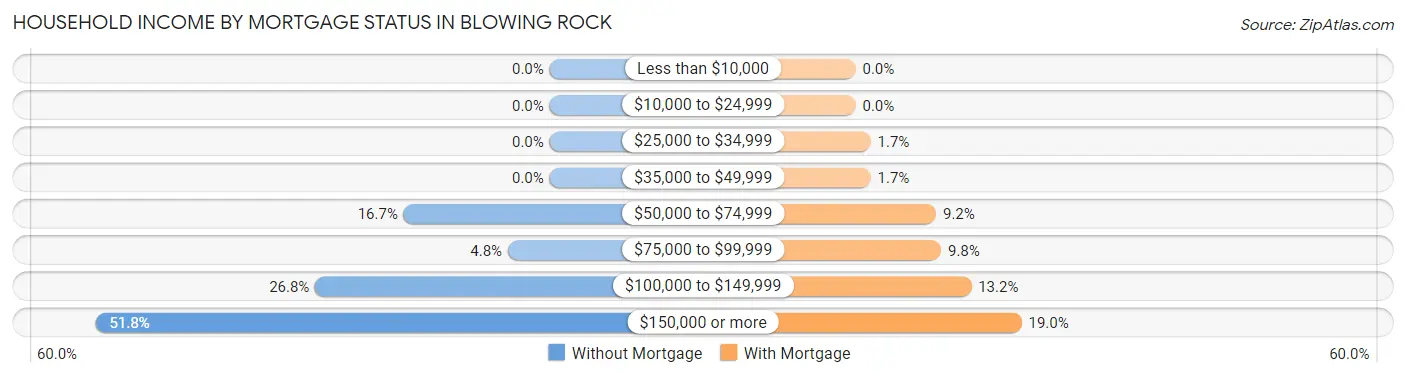
| Household Income | Without Mortgage | With Mortgage |
| Less than $10,000 | 0 (0.0%) | 0 (0.0%) |
| $10,000 to $24,999 | 0 (0.0%) | 0 (0.0%) |
| $25,000 to $34,999 | 0 (0.0%) | 3 (1.7%) |
| $35,000 to $49,999 | 0 (0.0%) | 3 (1.7%) |
| $50,000 to $74,999 | 28 (16.7%) | 16 (9.2%) |
| $75,000 to $99,999 | 8 (4.8%) | 17 (9.8%) |
| $100,000 to $149,999 | 45 (26.8%) | 23 (13.2%) |
| $150,000 or more | 87 (51.8%) | 33 (19.0%) |
| Total | 168 (100.0%) | 174 (100.0%) |
Property Value to Household Income Ratio in Blowing Rock
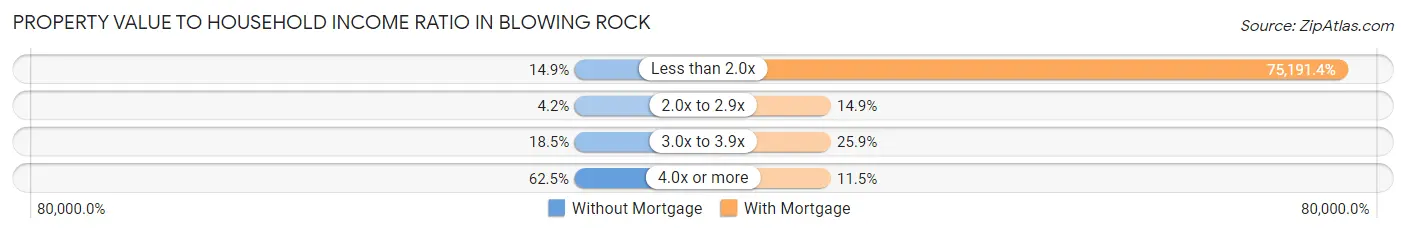
| Value-to-Income Ratio | Without Mortgage | With Mortgage |
| Less than 2.0x | 25 (14.9%) | 130,833 (75,191.4%) |
| 2.0x to 2.9x | 7 (4.2%) | 26 (14.9%) |
| 3.0x to 3.9x | 31 (18.4%) | 45 (25.9%) |
| 4.0x or more | 105 (62.5%) | 20 (11.5%) |
| Total | 168 (100.0%) | 174 (100.0%) |
Real Estate Taxes by Mortgage Status in Blowing Rock
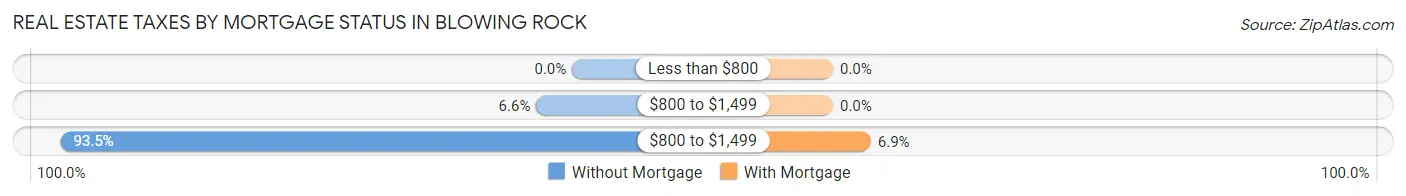
| Property Taxes | Without Mortgage | With Mortgage |
| Less than $800 | 0 (0.0%) | 0 (0.0%) |
| $800 to $1,499 | 11 (6.6%) | 0 (0.0%) |
| $800 to $1,499 | 157 (93.4%) | 12 (6.9%) |
| Total | 168 (100.0%) | 174 (100.0%) |
Health & Disability in Blowing Rock
Health Insurance Coverage by Age in Blowing Rock
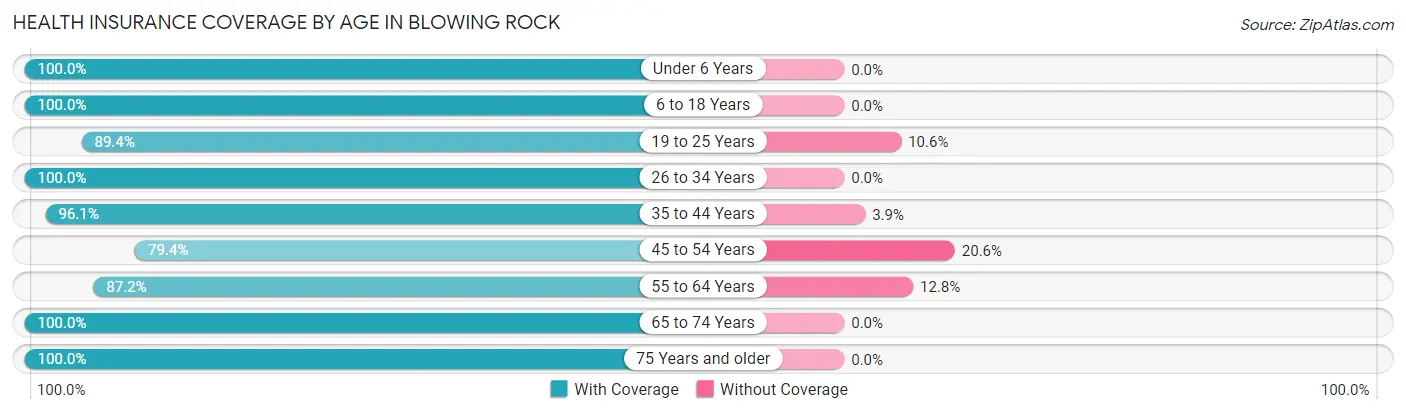
| Age Bracket | With Coverage | Without Coverage |
| Under 6 Years | 6 (100.0%) | 0 (0.0%) |
| 6 to 18 Years | 38 (100.0%) | 0 (0.0%) |
| 19 to 25 Years | 101 (89.4%) | 12 (10.6%) |
| 26 to 34 Years | 15 (100.0%) | 0 (0.0%) |
| 35 to 44 Years | 74 (96.1%) | 3 (3.9%) |
| 45 to 54 Years | 77 (79.4%) | 20 (20.6%) |
| 55 to 64 Years | 163 (87.2%) | 24 (12.8%) |
| 65 to 74 Years | 204 (100.0%) | 0 (0.0%) |
| 75 Years and older | 116 (100.0%) | 0 (0.0%) |
| Total | 794 (93.1%) | 59 (6.9%) |
Health Insurance Coverage by Citizenship Status in Blowing Rock
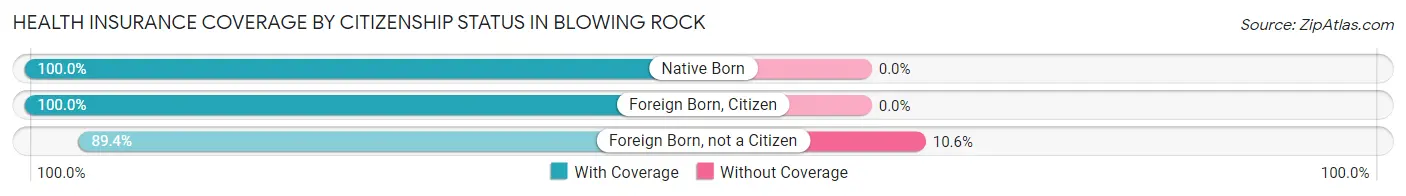
| Citizenship Status | With Coverage | Without Coverage |
| Native Born | 6 (100.0%) | 0 (0.0%) |
| Foreign Born, Citizen | 38 (100.0%) | 0 (0.0%) |
| Foreign Born, not a Citizen | 101 (89.4%) | 12 (10.6%) |
Health Insurance Coverage by Household Income in Blowing Rock
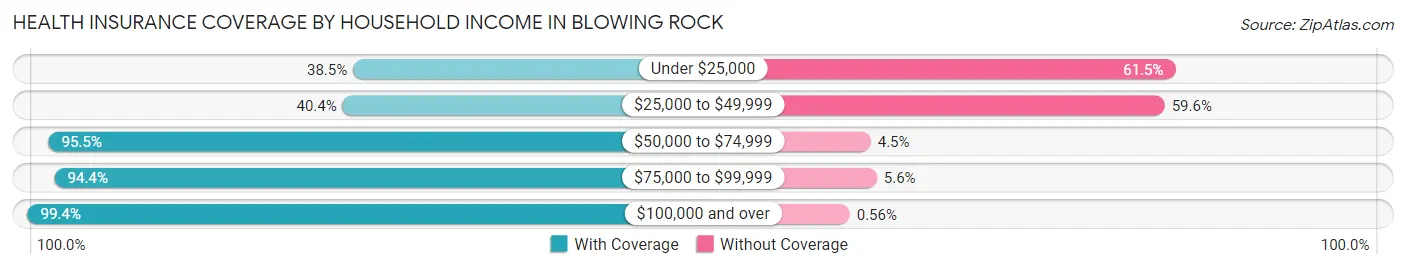
| Household Income | With Coverage | Without Coverage |
| Under $25,000 | 10 (38.5%) | 16 (61.5%) |
| $25,000 to $49,999 | 19 (40.4%) | 28 (59.6%) |
| $50,000 to $74,999 | 170 (95.5%) | 8 (4.5%) |
| $75,000 to $99,999 | 67 (94.4%) | 4 (5.6%) |
| $100,000 and over | 528 (99.4%) | 3 (0.6%) |
Public vs Private Health Insurance Coverage by Age in Blowing Rock
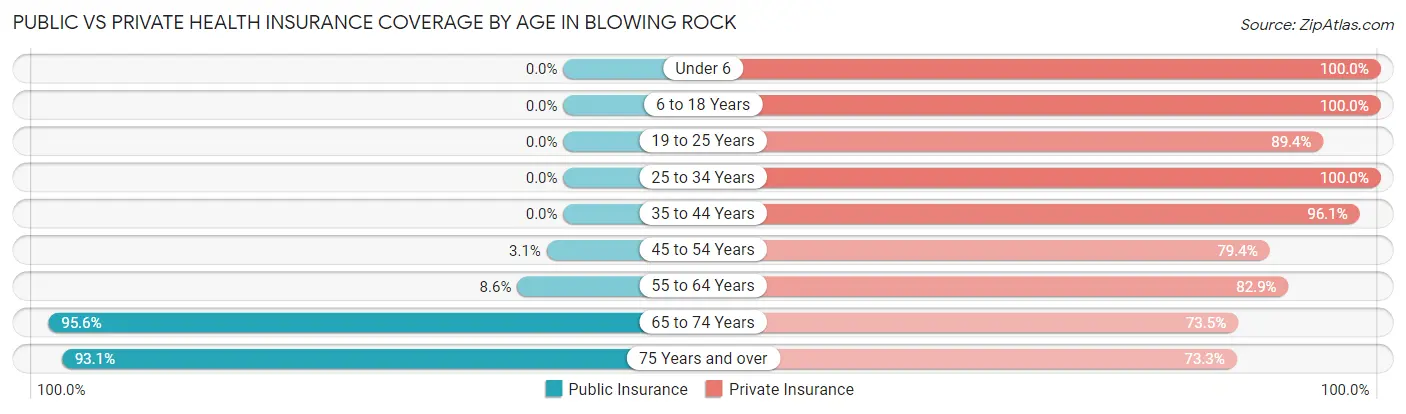
| Age Bracket | Public Insurance | Private Insurance |
| Under 6 | 0 (0.0%) | 6 (100.0%) |
| 6 to 18 Years | 0 (0.0%) | 38 (100.0%) |
| 19 to 25 Years | 0 (0.0%) | 101 (89.4%) |
| 25 to 34 Years | 0 (0.0%) | 15 (100.0%) |
| 35 to 44 Years | 0 (0.0%) | 74 (96.1%) |
| 45 to 54 Years | 3 (3.1%) | 77 (79.4%) |
| 55 to 64 Years | 16 (8.6%) | 155 (82.9%) |
| 65 to 74 Years | 195 (95.6%) | 150 (73.5%) |
| 75 Years and over | 108 (93.1%) | 85 (73.3%) |
| Total | 322 (37.8%) | 701 (82.2%) |
Disability Status by Sex by Age in Blowing Rock
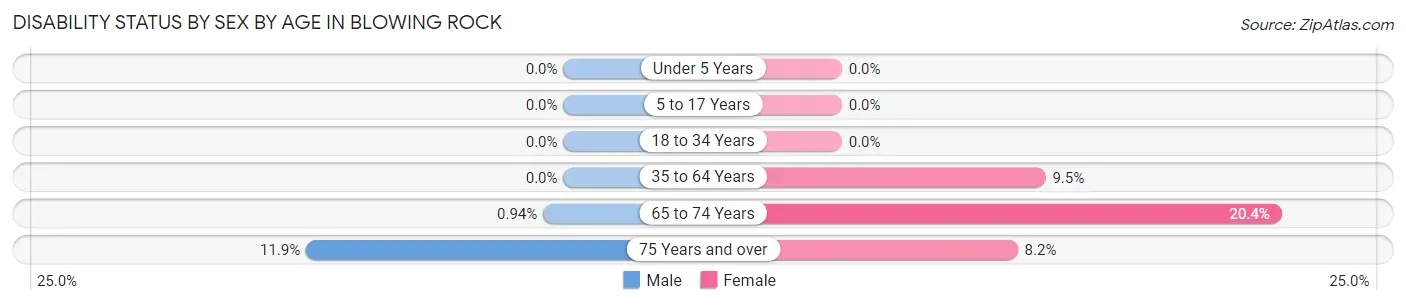
| Age Bracket | Male | Female |
| Under 5 Years | 0 (0.0%) | 0 (0.0%) |
| 5 to 17 Years | 0 (0.0%) | 0 (0.0%) |
| 18 to 34 Years | 0 (0.0%) | 0 (0.0%) |
| 35 to 64 Years | 0 (0.0%) | 19 (9.5%) |
| 65 to 74 Years | 1 (0.9%) | 20 (20.4%) |
| 75 Years and over | 8 (11.9%) | 4 (8.2%) |
Disability Class by Sex by Age in Blowing Rock
Disability Class: Hearing Difficulty
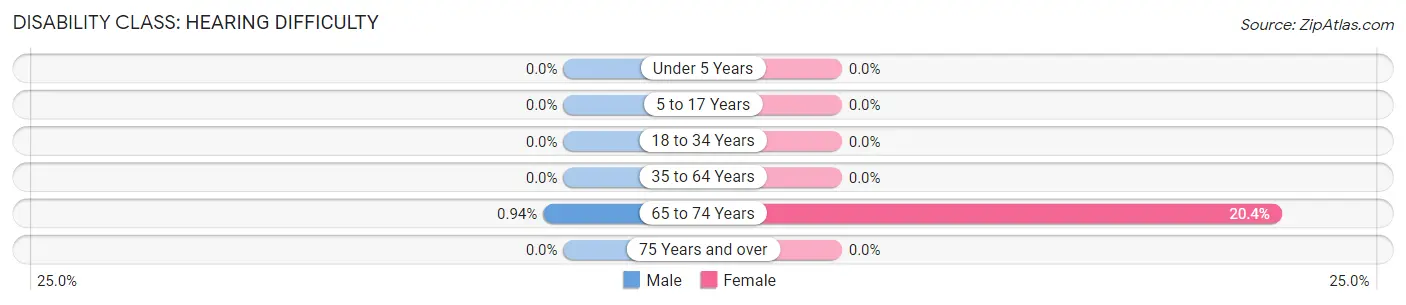
| Age Bracket | Male | Female |
| Under 5 Years | 0 (0.0%) | 0 (0.0%) |
| 5 to 17 Years | 0 (0.0%) | 0 (0.0%) |
| 18 to 34 Years | 0 (0.0%) | 0 (0.0%) |
| 35 to 64 Years | 0 (0.0%) | 0 (0.0%) |
| 65 to 74 Years | 1 (0.9%) | 20 (20.4%) |
| 75 Years and over | 0 (0.0%) | 0 (0.0%) |
Disability Class: Vision Difficulty
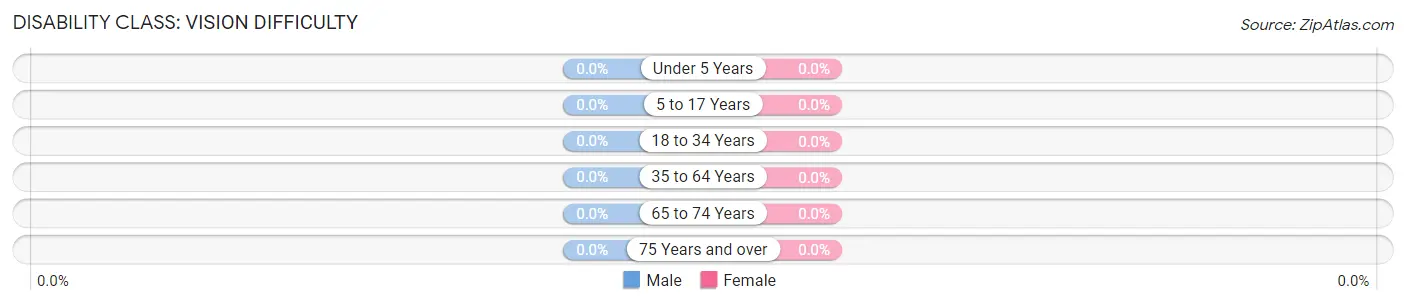
| Age Bracket | Male | Female |
| Under 5 Years | 0 (0.0%) | 0 (0.0%) |
| 5 to 17 Years | 0 (0.0%) | 0 (0.0%) |
| 18 to 34 Years | 0 (0.0%) | 0 (0.0%) |
| 35 to 64 Years | 0 (0.0%) | 0 (0.0%) |
| 65 to 74 Years | 0 (0.0%) | 0 (0.0%) |
| 75 Years and over | 0 (0.0%) | 0 (0.0%) |
Disability Class: Cognitive Difficulty
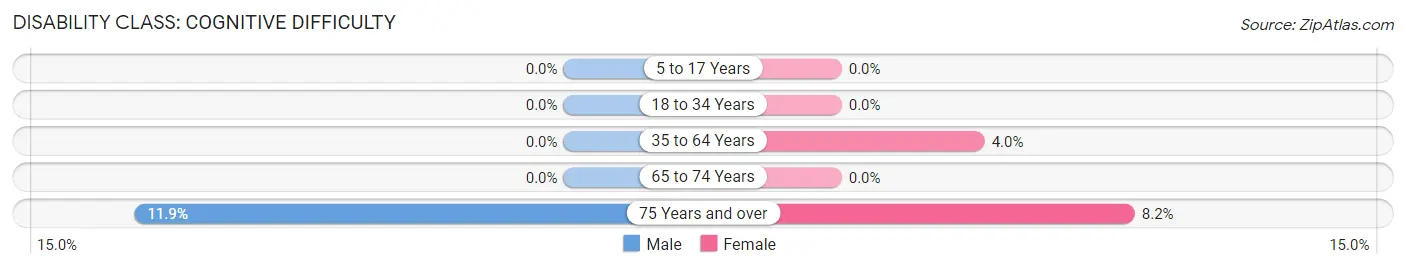
| Age Bracket | Male | Female |
| 5 to 17 Years | 0 (0.0%) | 0 (0.0%) |
| 18 to 34 Years | 0 (0.0%) | 0 (0.0%) |
| 35 to 64 Years | 0 (0.0%) | 8 (4.0%) |
| 65 to 74 Years | 0 (0.0%) | 0 (0.0%) |
| 75 Years and over | 8 (11.9%) | 4 (8.2%) |
Disability Class: Ambulatory Difficulty
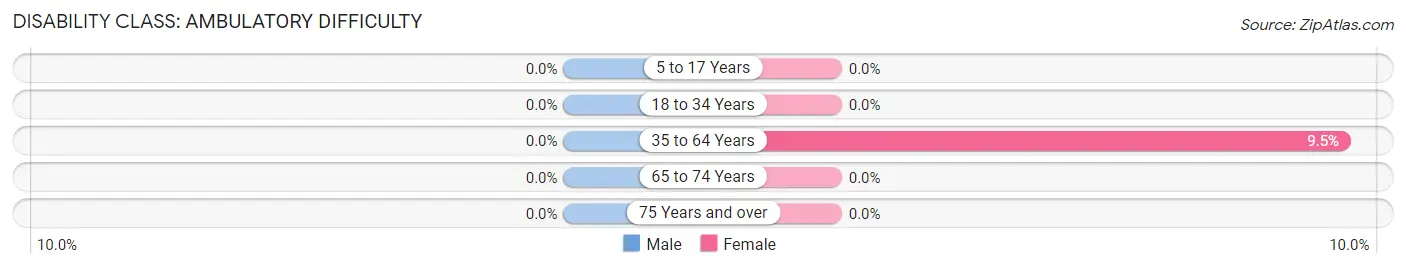
| Age Bracket | Male | Female |
| 5 to 17 Years | 0 (0.0%) | 0 (0.0%) |
| 18 to 34 Years | 0 (0.0%) | 0 (0.0%) |
| 35 to 64 Years | 0 (0.0%) | 19 (9.5%) |
| 65 to 74 Years | 0 (0.0%) | 0 (0.0%) |
| 75 Years and over | 0 (0.0%) | 0 (0.0%) |
Disability Class: Self-Care Difficulty
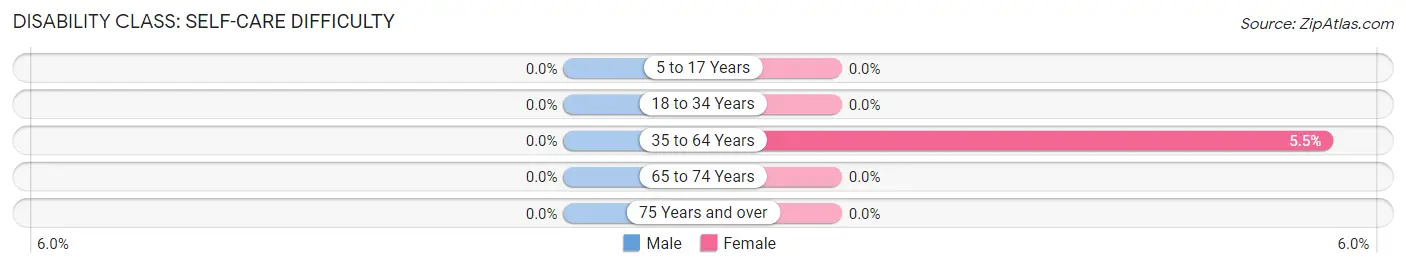
| Age Bracket | Male | Female |
| 5 to 17 Years | 0 (0.0%) | 0 (0.0%) |
| 18 to 34 Years | 0 (0.0%) | 0 (0.0%) |
| 35 to 64 Years | 0 (0.0%) | 11 (5.5%) |
| 65 to 74 Years | 0 (0.0%) | 0 (0.0%) |
| 75 Years and over | 0 (0.0%) | 0 (0.0%) |
Technology Access in Blowing Rock
Computing Device Access in Blowing Rock
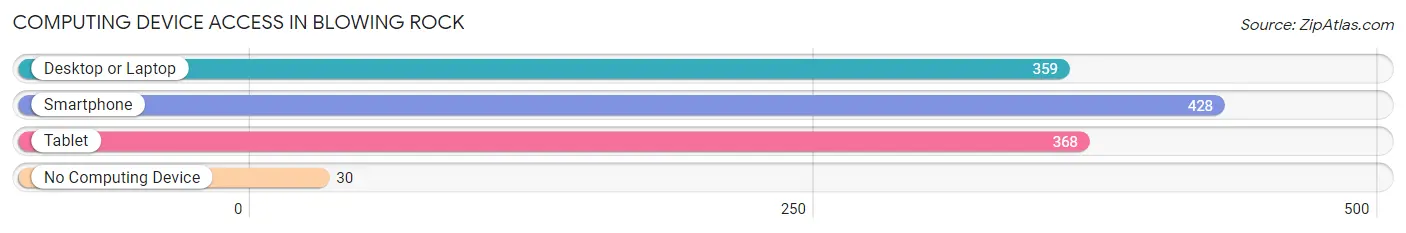
| Device Type | # Households | % Households |
| Desktop or Laptop | 359 | 74.8% |
| Smartphone | 428 | 89.2% |
| Tablet | 368 | 76.7% |
| No Computing Device | 30 | 6.2% |
| Total | 480 | 100.0% |
Internet Access in Blowing Rock
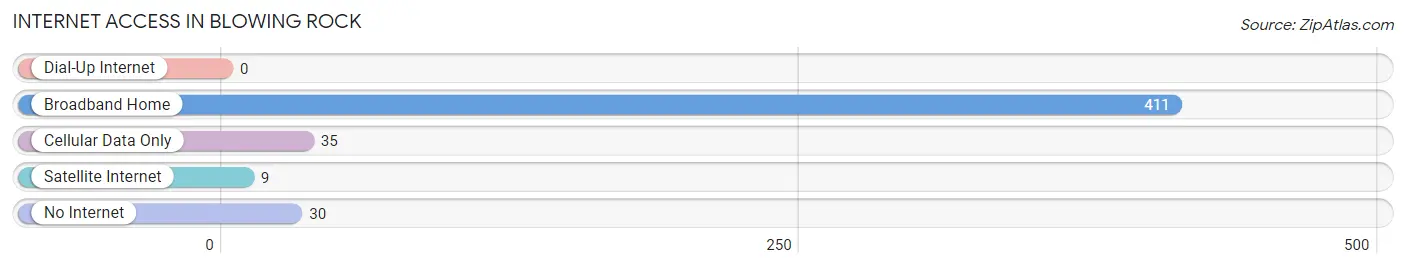
| Internet Type | # Households | % Households |
| Dial-Up Internet | 0 | 0.0% |
| Broadband Home | 411 | 85.6% |
| Cellular Data Only | 35 | 7.3% |
| Satellite Internet | 9 | 1.9% |
| No Internet | 30 | 6.2% |
| Total | 480 | 100.0% |
Blowing Rock Summary
Blowing Rock is a small town located in the Blue Ridge Mountains of North Carolina. It is situated in Watauga County, and is part of the Boone metropolitan area. The town is known for its spectacular views of the Blue Ridge Mountains, and its mild climate. Blowing Rock has a population of 1,241 as of the 2010 census, and is a popular tourist destination.
Geography
Blowing Rock is located in the Blue Ridge Mountains of North Carolina, in Watauga County. It is situated at an elevation of 3,500 feet, and is surrounded by the Pisgah National Forest. The town is located on the eastern edge of the Appalachian Mountains, and is part of the Boone metropolitan area. The town is located near the Blue Ridge Parkway, and is a popular tourist destination.
History
Blowing Rock was first settled in the late 1700s by settlers from Virginia and North Carolina. The town was originally known as “The Rocks”, and was later renamed Blowing Rock after a local legend. According to the legend, a Cherokee brave was blown off a cliff by a strong gust of wind, and was saved by a rock outcropping. The town was officially incorporated in 1889.
In the early 1900s, Blowing Rock became a popular tourist destination. The town was known for its spectacular views of the Blue Ridge Mountains, and its mild climate. The town was also home to several resorts, including the Green Park Hotel and the Blowing Rock Hotel.
Economy
The economy of Blowing Rock is largely based on tourism. The town is home to several resorts, restaurants, and shops. The town is also home to several art galleries, and is a popular destination for outdoor activities such as hiking, fishing, and camping.
Demographics
As of the 2010 census, Blowing Rock had a population of 1,241. The racial makeup of the town was 95.3% White, 0.9% African American, 0.3% Native American, 0.7% Asian, 0.1% Pacific Islander, 1.2% from other races, and 1.5% from two or more races. Hispanic or Latino of any race were 2.3% of the population.
The median income for a household in Blowing Rock was $37,917, and the median income for a family was $45,625. The per capita income for the town was $22,845. About 8.3% of families and 11.2% of the population were below the poverty line, including 15.2% of those under age 18 and 8.3% of those age 65 or over.
Conclusion
Blowing Rock is a small town located in the Blue Ridge Mountains of North Carolina. It is situated in Watauga County, and is part of the Boone metropolitan area. The town is known for its spectacular views of the Blue Ridge Mountains, and its mild climate. Blowing Rock has a population of 1,241 as of the 2010 census, and is a popular tourist destination. The economy of Blowing Rock is largely based on tourism, and the town is home to several resorts, restaurants, and shops. The racial makeup of the town is predominantly White, with a small percentage of African American, Native American, Asian, and Pacific Islander residents.
Common Questions
What is the Total Population of Blowing Rock?
Total Population of Blowing Rock is 900.
What is the Total Male Population of Blowing Rock?
Total Male Population of Blowing Rock is 392.
What is the Total Female Population of Blowing Rock?
Total Female Population of Blowing Rock is 508.
What is the Ratio of Males per 100 Females in Blowing Rock?
There are 77.17 Males per 100 Females in Blowing Rock.
What is the Ratio of Females per 100 Males in Blowing Rock?
There are 129.59 Females per 100 Males in Blowing Rock.
What is the Median Population Age in Blowing Rock?
Median Population Age in Blowing Rock is 62.4 Years.
What is the Average Family Size in Blowing Rock
Average Family Size in Blowing Rock is 2.2 People.
What is the Average Household Size in Blowing Rock
Average Household Size in Blowing Rock is 1.8 People.
What is Per Capita Income in Blowing Rock?
Per Capita income in Blowing Rock is $80,474.
What is the Median Family Income in Blowing Rock?
Median Family Income in Blowing Rock is $130,833.
What is the Median Household income in Blowing Rock?
Median Household Income in Blowing Rock is $116,731.
What is Income or Wage Gap in Blowing Rock?
Income or Wage Gap in Blowing Rock is 57.0%.
Women in Blowing Rock earn 43.0 cents for every dollar earned by a man.
What is Inequality or Gini Index in Blowing Rock?
Inequality or Gini Index in Blowing Rock is 0.42.
How Large is the Labor Force in Blowing Rock?
There are 519 People in the Labor Forcein in Blowing Rock.
What is the Percentage of People in the Labor Force in Blowing Rock?
60.6% of People are in the Labor Force in Blowing Rock.
What is the Unemployment Rate in Blowing Rock?
Unemployment Rate in Blowing Rock is 0.6%.