Shelby, NC
Shelby Map
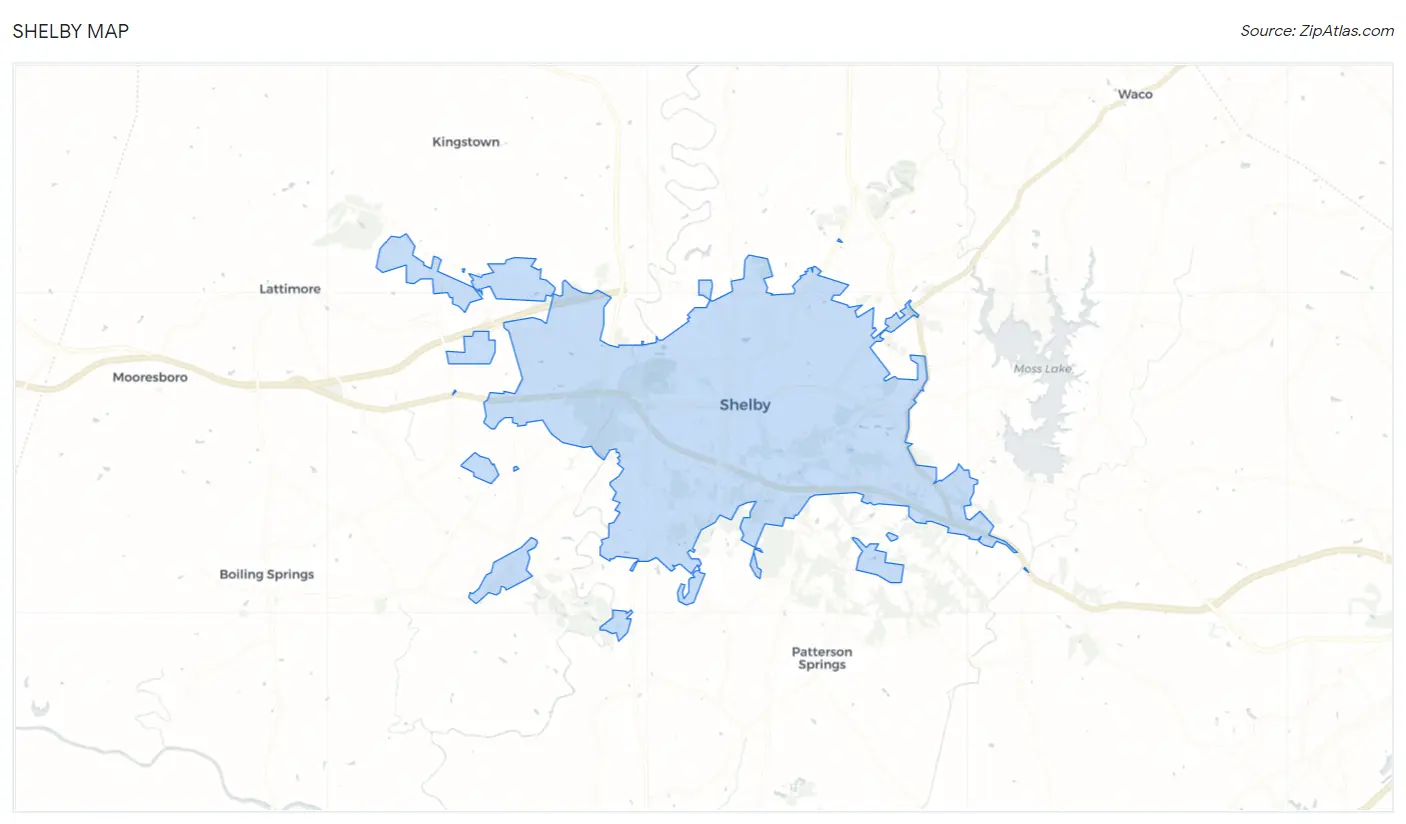
Shelby Overview
21,712
TOTAL POPULATION
9,957
MALE POPULATION
11,755
FEMALE POPULATION
84.70
MALES / 100 FEMALES
118.06
FEMALES / 100 MALES
43.4
MEDIAN AGE
3.1
AVG FAMILY SIZE
2.3
AVG HOUSEHOLD SIZE
$28,414
PER CAPITA INCOME
$63,682
AVG FAMILY INCOME
$46,176
AVG HOUSEHOLD INCOME
22.1%
WAGE / INCOME GAP [ % ]
77.9¢/ $1
WAGE / INCOME GAP [ $ ]
$11,931
FAMILY INCOME DEFICIT
0.47
INEQUALITY / GINI INDEX
9,778
LABOR FORCE [ PEOPLE ]
55.4%
PERCENT IN LABOR FORCE
3.7%
UNEMPLOYMENT RATE
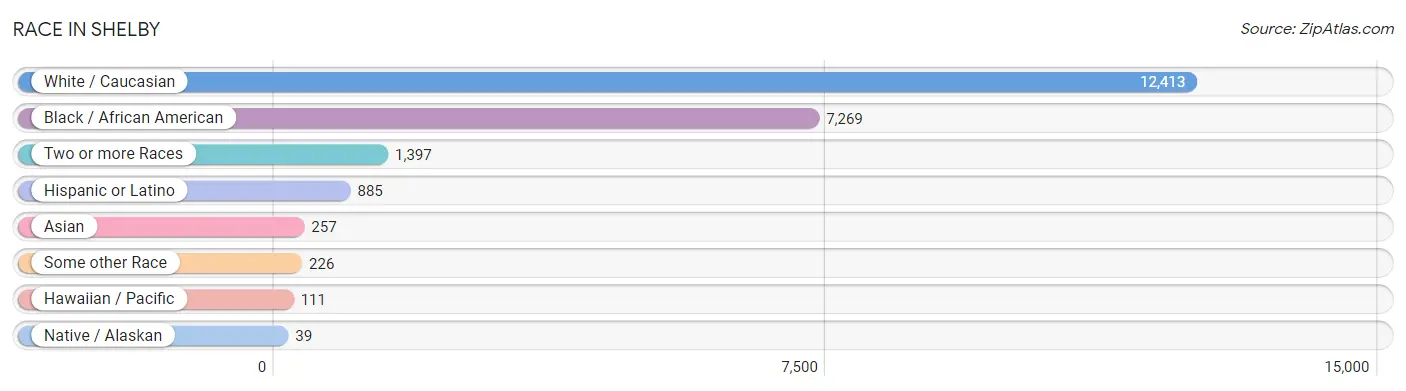
Race in Shelby
The most populous races in Shelby are White / Caucasian (12,413 | 57.2%), Black / African American (7,269 | 33.5%), and Two or more Races (1,397 | 6.4%).
| Race | # Population | % Population |
| Asian | 257 | 1.2% |
| Black / African American | 7,269 | 33.5% |
| Hawaiian / Pacific | 111 | 0.5% |
| Hispanic or Latino | 885 | 4.1% |
| Native / Alaskan | 39 | 0.2% |
| White / Caucasian | 12,413 | 57.2% |
| Two or more Races | 1,397 | 6.4% |
| Some other Race | 226 | 1.0% |
| Total | 21,712 | 100.0% |
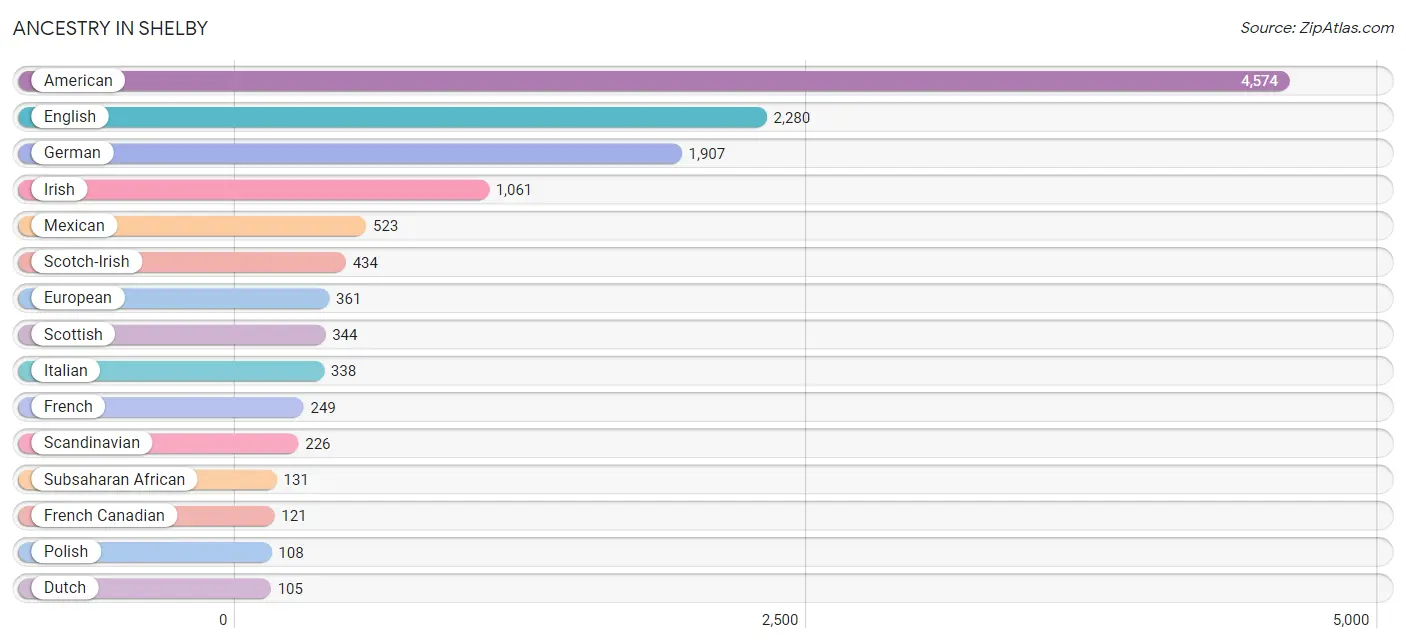
Ancestry in Shelby
The most populous ancestries reported in Shelby are American (4,574 | 21.1%), English (2,280 | 10.5%), German (1,907 | 8.8%), Irish (1,061 | 4.9%), and Mexican (523 | 2.4%), together accounting for 47.6% of all Shelby residents.
| Ancestry | # Population | % Population |
| African | 45 | 0.2% |
| American | 4,574 | 21.1% |
| Australian | 42 | 0.2% |
| Austrian | 7 | 0.0% |
| Belgian | 77 | 0.4% |
| Bhutanese | 86 | 0.4% |
| Blackfeet | 8 | 0.0% |
| British | 16 | 0.1% |
| Central American | 100 | 0.5% |
| Cherokee | 24 | 0.1% |
| Creek | 16 | 0.1% |
| Croatian | 11 | 0.1% |
| Cuban | 102 | 0.5% |
| Czech | 25 | 0.1% |
| Dutch | 105 | 0.5% |
| Eastern European | 11 | 0.1% |
| English | 2,280 | 10.5% |
| European | 361 | 1.7% |
| French | 249 | 1.1% |
| French American Indian | 74 | 0.3% |
| French Canadian | 121 | 0.6% |
| German | 1,907 | 8.8% |
| Greek | 36 | 0.2% |
| Honduran | 14 | 0.1% |
| Hungarian | 8 | 0.0% |
| Indian (Asian) | 51 | 0.2% |
| Irish | 1,061 | 4.9% |
| Italian | 338 | 1.6% |
| Jamaican | 20 | 0.1% |
| Mexican | 523 | 2.4% |
| Mexican American Indian | 22 | 0.1% |
| Native Hawaiian | 41 | 0.2% |
| Nigerian | 86 | 0.4% |
| Pakistani | 30 | 0.1% |
| Polish | 108 | 0.5% |
| Portuguese | 6 | 0.0% |
| Puerto Rican | 103 | 0.5% |
| Romanian | 43 | 0.2% |
| Russian | 38 | 0.2% |
| Salvadoran | 86 | 0.4% |
| Scandinavian | 226 | 1.0% |
| Scotch-Irish | 434 | 2.0% |
| Scottish | 344 | 1.6% |
| Slavic | 10 | 0.1% |
| South American | 35 | 0.2% |
| Spaniard | 1 | 0.0% |
| Subsaharan African | 131 | 0.6% |
| Swedish | 17 | 0.1% |
| Swiss | 54 | 0.3% |
| Trinidadian and Tobagonian | 14 | 0.1% |
| Venezuelan | 35 | 0.2% |
| Welsh | 40 | 0.2% | View All 52 Rows |
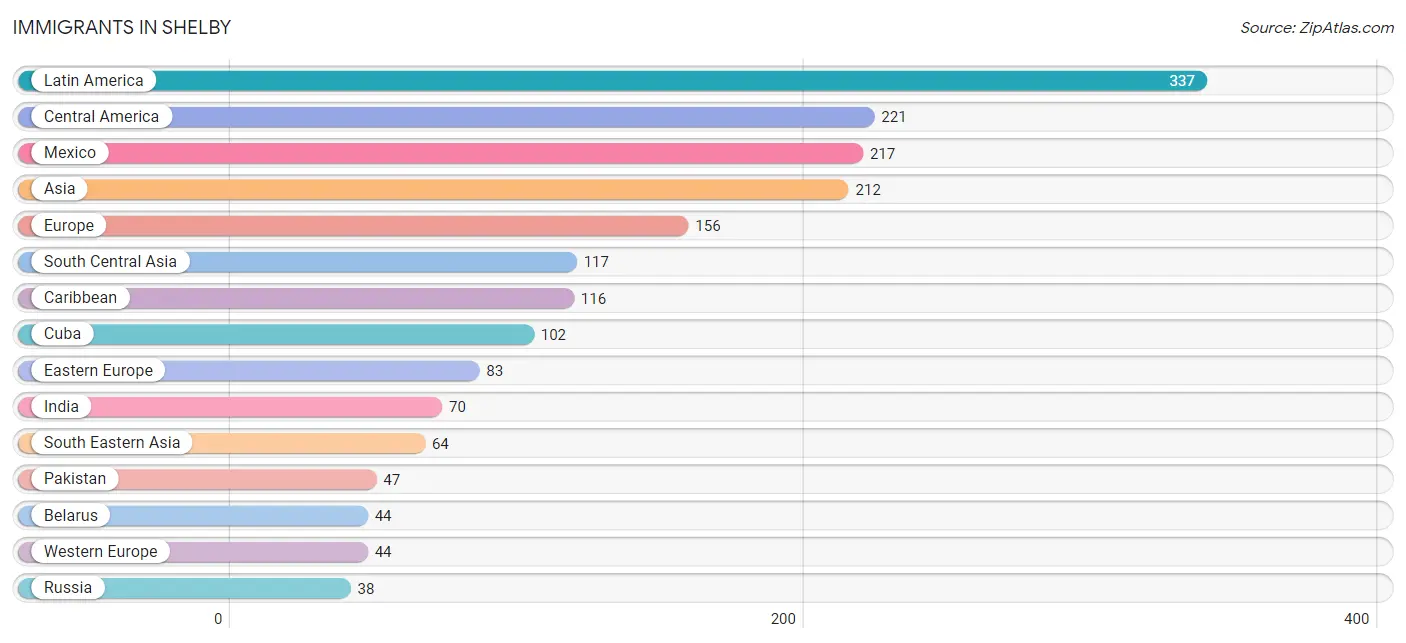
Immigrants in Shelby
The most numerous immigrant groups reported in Shelby came from Latin America (337 | 1.5%), Central America (221 | 1.0%), Mexico (217 | 1.0%), Asia (212 | 1.0%), and Europe (156 | 0.7%), together accounting for 5.3% of all Shelby residents.
| Immigration Origin | # Population | % Population |
| Africa | 16 | 0.1% |
| Asia | 212 | 1.0% |
| Belarus | 44 | 0.2% |
| Caribbean | 116 | 0.5% |
| Central America | 221 | 1.0% |
| Cuba | 102 | 0.5% |
| Eastern Asia | 31 | 0.1% |
| Eastern Europe | 83 | 0.4% |
| El Salvador | 4 | 0.0% |
| England | 29 | 0.1% |
| Europe | 156 | 0.7% |
| France | 9 | 0.0% |
| Germany | 27 | 0.1% |
| India | 70 | 0.3% |
| Japan | 31 | 0.1% |
| Latin America | 337 | 1.5% |
| Malaysia | 34 | 0.2% |
| Mexico | 217 | 1.0% |
| Northern Europe | 29 | 0.1% |
| Pakistan | 47 | 0.2% |
| Romania | 1 | 0.0% |
| Russia | 38 | 0.2% |
| Senegal | 16 | 0.1% |
| South Central Asia | 117 | 0.5% |
| South Eastern Asia | 64 | 0.3% |
| Switzerland | 8 | 0.0% |
| Thailand | 30 | 0.1% |
| Trinidad and Tobago | 14 | 0.1% |
| Western Africa | 16 | 0.1% |
| Western Europe | 44 | 0.2% | View All 30 Rows |
Sex and Age in Shelby
Sex and Age in Shelby
The most populous age groups in Shelby are 15 to 19 Years (950 | 9.5%) for men and 50 to 54 Years (1,007 | 8.6%) for women.
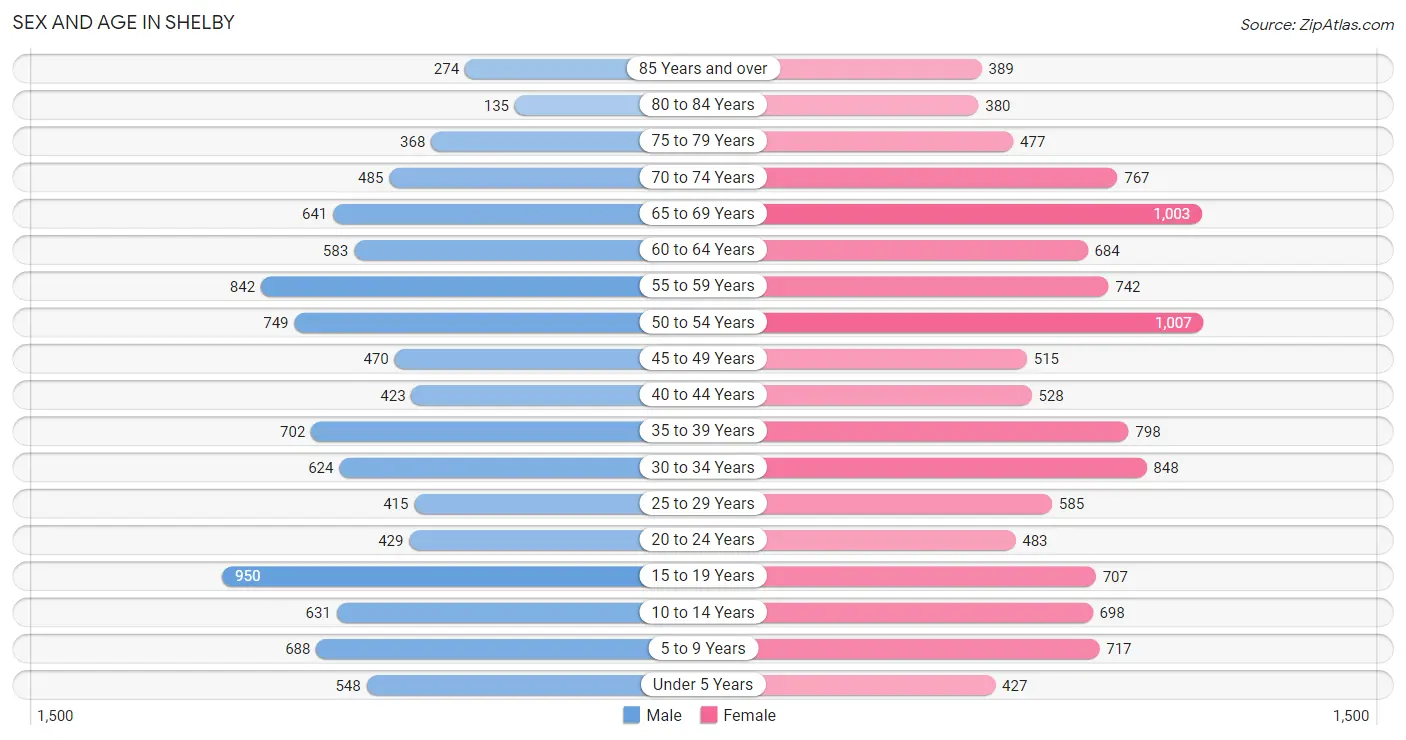
| Age Bracket | Male | Female |
| Under 5 Years | 548 (5.5%) | 427 (3.6%) |
| 5 to 9 Years | 688 (6.9%) | 717 (6.1%) |
| 10 to 14 Years | 631 (6.3%) | 698 (5.9%) |
| 15 to 19 Years | 950 (9.5%) | 707 (6.0%) |
| 20 to 24 Years | 429 (4.3%) | 483 (4.1%) |
| 25 to 29 Years | 415 (4.2%) | 585 (5.0%) |
| 30 to 34 Years | 624 (6.3%) | 848 (7.2%) |
| 35 to 39 Years | 702 (7.0%) | 798 (6.8%) |
| 40 to 44 Years | 423 (4.3%) | 528 (4.5%) |
| 45 to 49 Years | 470 (4.7%) | 515 (4.4%) |
| 50 to 54 Years | 749 (7.5%) | 1,007 (8.6%) |
| 55 to 59 Years | 842 (8.5%) | 742 (6.3%) |
| 60 to 64 Years | 583 (5.9%) | 684 (5.8%) |
| 65 to 69 Years | 641 (6.4%) | 1,003 (8.5%) |
| 70 to 74 Years | 485 (4.9%) | 767 (6.5%) |
| 75 to 79 Years | 368 (3.7%) | 477 (4.1%) |
| 80 to 84 Years | 135 (1.4%) | 380 (3.2%) |
| 85 Years and over | 274 (2.8%) | 389 (3.3%) |
| Total | 9,957 (100.0%) | 11,755 (100.0%) |
Families and Households in Shelby
Median Family Size in Shelby
The median family size in Shelby is 3.13 persons per family, with single female/mother families (1,680 | 31.5%) accounting for the largest median family size of 3.79 persons per family. On the other hand, married-couple families (3,109 | 58.3%) represent the smallest median family size with 2.76 persons per family.
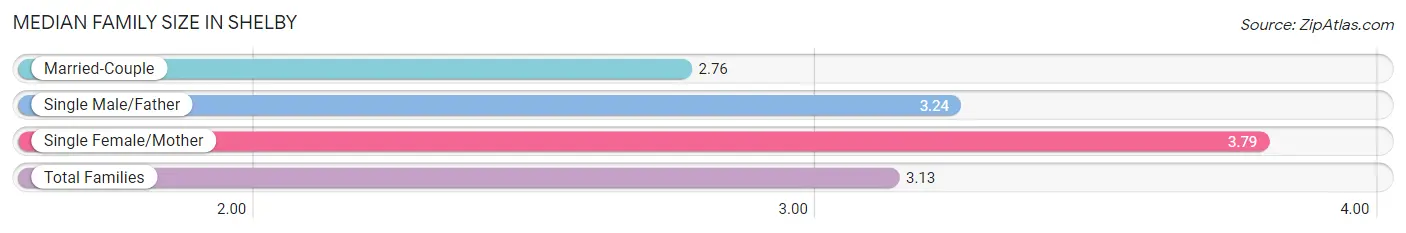
| Family Type | # Families | Family Size |
| Married-Couple | 3,109 (58.3%) | 2.76 |
| Single Male/Father | 544 (10.2%) | 3.24 |
| Single Female/Mother | 1,680 (31.5%) | 3.79 |
| Total Families | 5,333 (100.0%) | 3.13 |
Median Household Size in Shelby
The median household size in Shelby is 2.32 persons per household, with single female/mother households (1,680 | 18.2%) accounting for the largest median household size of 3.94 persons per household. non-family households (3,890 | 42.2%) represent the smallest median household size with 1.08 persons per household.
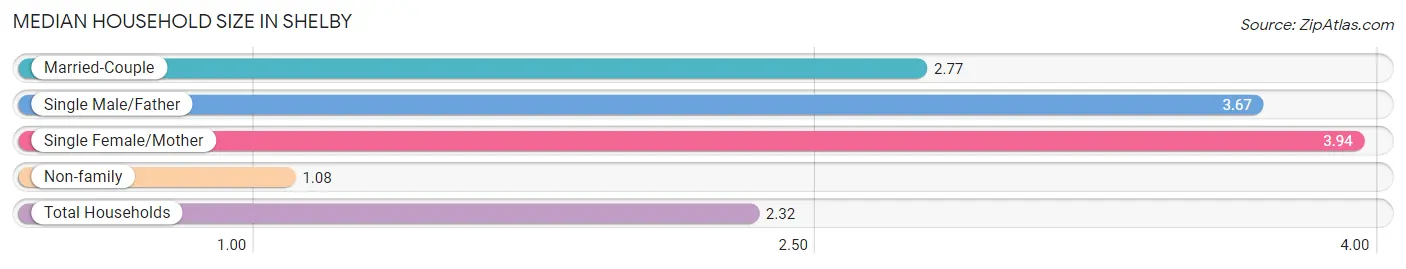
| Household Type | # Households | Household Size |
| Married-Couple | 3,109 (33.7%) | 2.77 |
| Single Male/Father | 544 (5.9%) | 3.67 |
| Single Female/Mother | 1,680 (18.2%) | 3.94 |
| Non-family | 3,890 (42.2%) | 1.08 |
| Total Households | 9,223 (100.0%) | 2.32 |
Household Size by Marriage Status in Shelby
Out of a total of 9,223 households in Shelby, 5,333 (57.8%) are family households, while 3,890 (42.2%) are nonfamily households. The most numerous type of family households are 2-person households, comprising 2,693, and the most common type of nonfamily households are 1-person households, comprising 3,666.
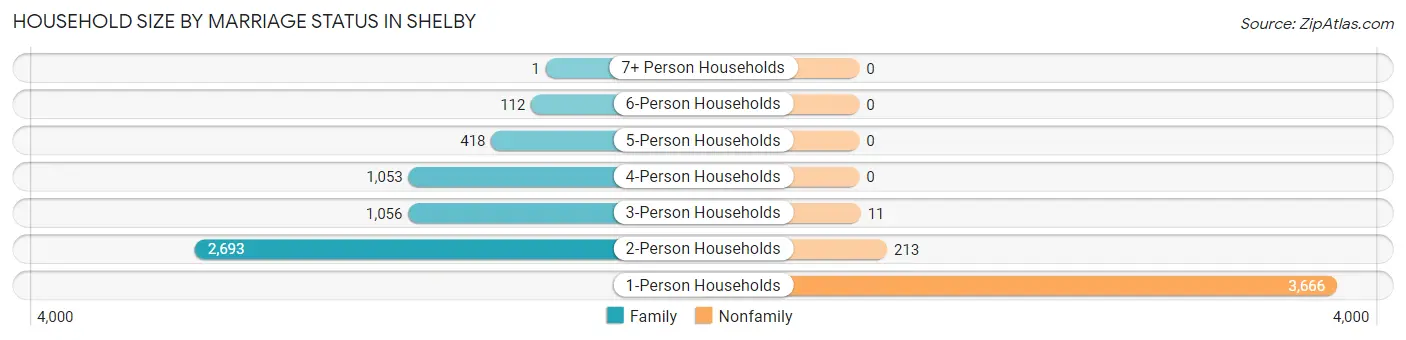
| Household Size | Family Households | Nonfamily Households |
| 1-Person Households | - | 3,666 (39.8%) |
| 2-Person Households | 2,693 (29.2%) | 213 (2.3%) |
| 3-Person Households | 1,056 (11.5%) | 11 (0.1%) |
| 4-Person Households | 1,053 (11.4%) | 0 (0.0%) |
| 5-Person Households | 418 (4.5%) | 0 (0.0%) |
| 6-Person Households | 112 (1.2%) | 0 (0.0%) |
| 7+ Person Households | 1 (0.0%) | 0 (0.0%) |
| Total | 5,333 (57.8%) | 3,890 (42.2%) |
Female Fertility in Shelby
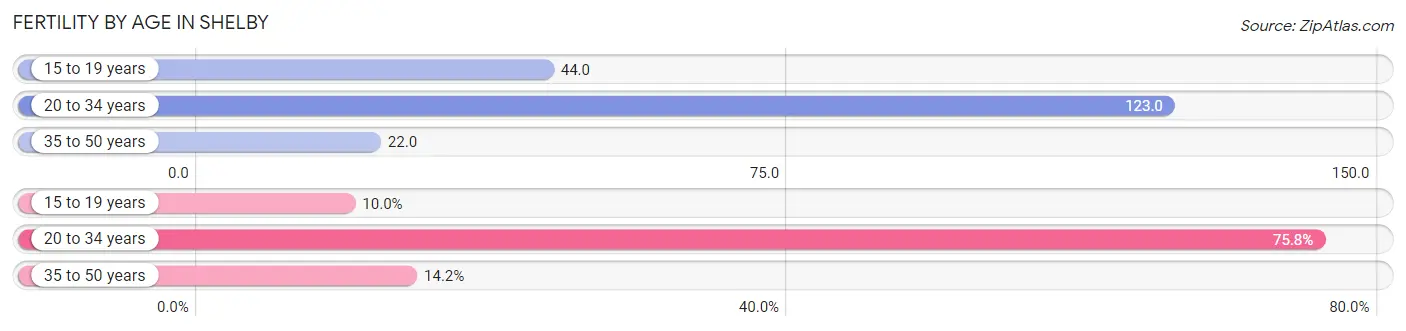
Fertility by Age in Shelby
Average fertility rate in Shelby is 67.0 births per 1,000 women. Women in the age bracket of 20 to 34 years have the highest fertility rate with 123.0 births per 1,000 women. Women in the age bracket of 20 to 34 years acount for 75.8% of all women with births.
| Age Bracket | Women with Births | Births / 1,000 Women |
| 15 to 19 years | 31 (10.0%) | 44.0 |
| 20 to 34 years | 235 (75.8%) | 123.0 |
| 35 to 50 years | 44 (14.2%) | 22.0 |
| Total | 310 (100.0%) | 67.0 |
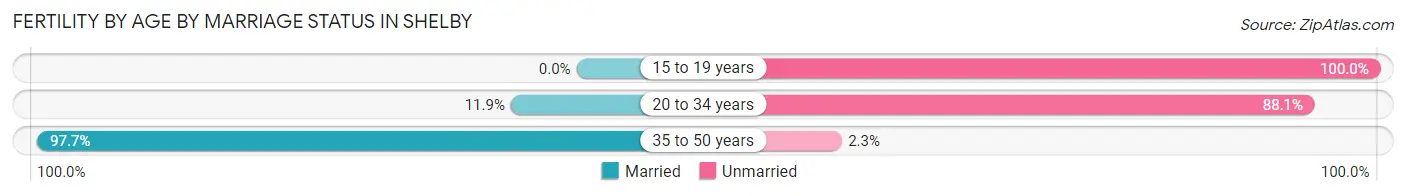
Fertility by Age by Marriage Status in Shelby
22.9% of women with births (310) in Shelby are married. The highest percentage of unmarried women with births falls into 15 to 19 years age bracket with 100.0% of them unmarried at the time of birth, while the lowest percentage of unmarried women with births belong to 35 to 50 years age bracket with 2.3% of them unmarried.
| Age Bracket | Married | Unmarried |
| 15 to 19 years | 0 (0.0%) | 31 (100.0%) |
| 20 to 34 years | 28 (11.9%) | 207 (88.1%) |
| 35 to 50 years | 43 (97.7%) | 1 (2.3%) |
| Total | 71 (22.9%) | 239 (77.1%) |
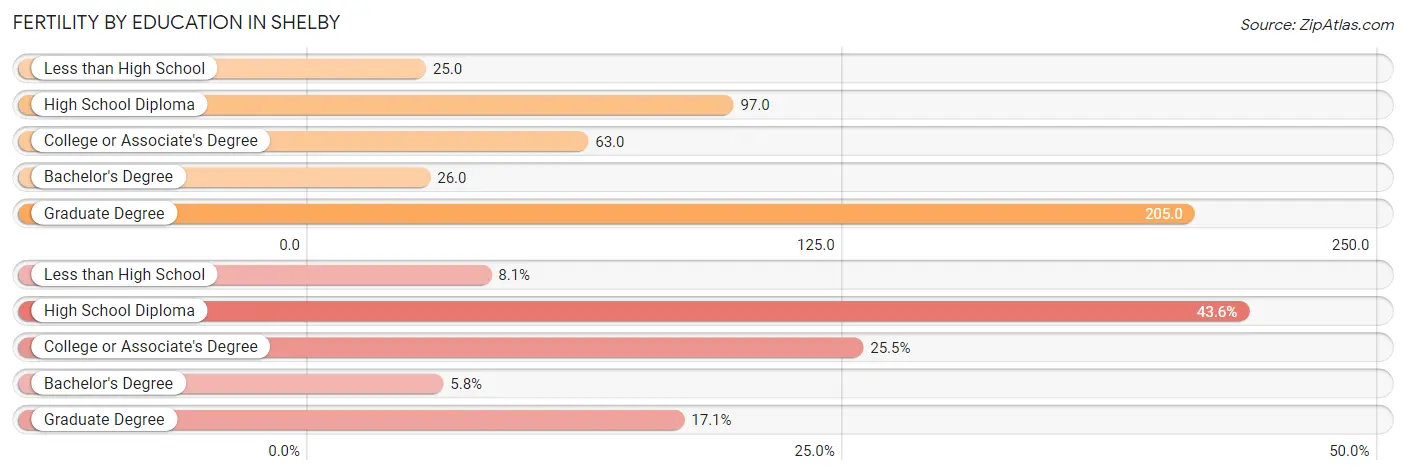
Fertility by Education in Shelby
Average fertility rate in Shelby is 67.0 births per 1,000 women. Women with the education attainment of graduate degree have the highest fertility rate of 205.0 births per 1,000 women, while women with the education attainment of less than high school have the lowest fertility at 25.0 births per 1,000 women. Women with the education attainment of high school diploma represent 43.5% of all women with births.
| Educational Attainment | Women with Births | Births / 1,000 Women |
| Less than High School | 25 (8.1%) | 25.0 |
| High School Diploma | 135 (43.5%) | 97.0 |
| College or Associate's Degree | 79 (25.5%) | 63.0 |
| Bachelor's Degree | 18 (5.8%) | 26.0 |
| Graduate Degree | 53 (17.1%) | 205.0 |
| Total | 310 (100.0%) | 67.0 |
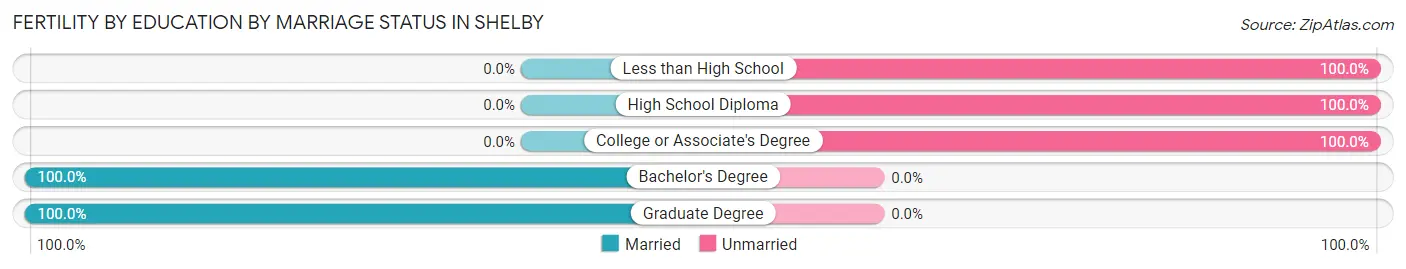
Fertility by Education by Marriage Status in Shelby
77.1% of women with births in Shelby are unmarried. Women with the educational attainment of bachelor's degree are most likely to be married with 100.0% of them married at childbirth, while women with the educational attainment of less than high school are least likely to be married with 100.0% of them unmarried at childbirth.
| Educational Attainment | Married | Unmarried |
| Less than High School | 0 (0.0%) | 25 (100.0%) |
| High School Diploma | 0 (0.0%) | 135 (100.0%) |
| College or Associate's Degree | 0 (0.0%) | 79 (100.0%) |
| Bachelor's Degree | 18 (100.0%) | 0 (0.0%) |
| Graduate Degree | 53 (100.0%) | 0 (0.0%) |
| Total | 71 (22.9%) | 239 (77.1%) |
Income in Shelby
Income Overview in Shelby
Per Capita Income in Shelby is $28,414, while median incomes of families and households are $63,682 and $46,176 respectively.
| Characteristic | Number | Measure |
| Per Capita Income | 21,712 | $28,414 |
| Median Family Income | 5,333 | $63,682 |
| Mean Family Income | 5,333 | $80,360 |
| Median Household Income | 9,223 | $46,176 |
| Mean Household Income | 9,223 | $64,457 |
| Income Deficit | 5,333 | $11,931 |
| Wage / Income Gap (%) | 21,712 | 22.06% |
| Wage / Income Gap ($) | 21,712 | 77.94¢ per $1 |
| Gini / Inequality Index | 21,712 | 0.47 |
Earnings by Sex in Shelby
Average Earnings in Shelby are $36,109, $40,107 for men and $31,259 for women, a difference of 22.1%.
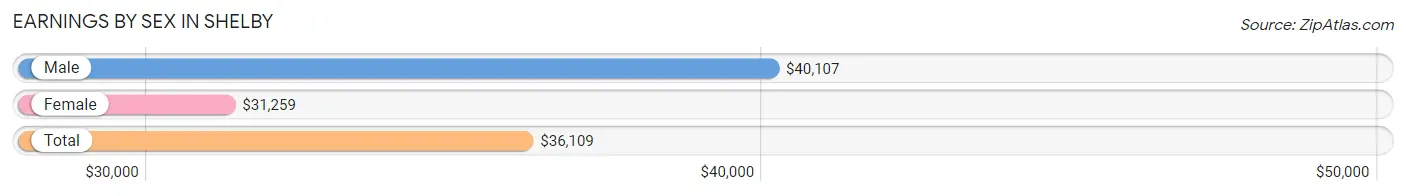
| Sex | Number | Average Earnings |
| Male | 4,619 (46.0%) | $40,107 |
| Female | 5,421 (54.0%) | $31,259 |
| Total | 10,040 (100.0%) | $36,109 |
Earnings by Sex by Income Bracket in Shelby
The most common earnings brackets in Shelby are $100,000+ for men (506 | 11.0%) and $55,000 to $64,999 for women (600 | 11.1%).
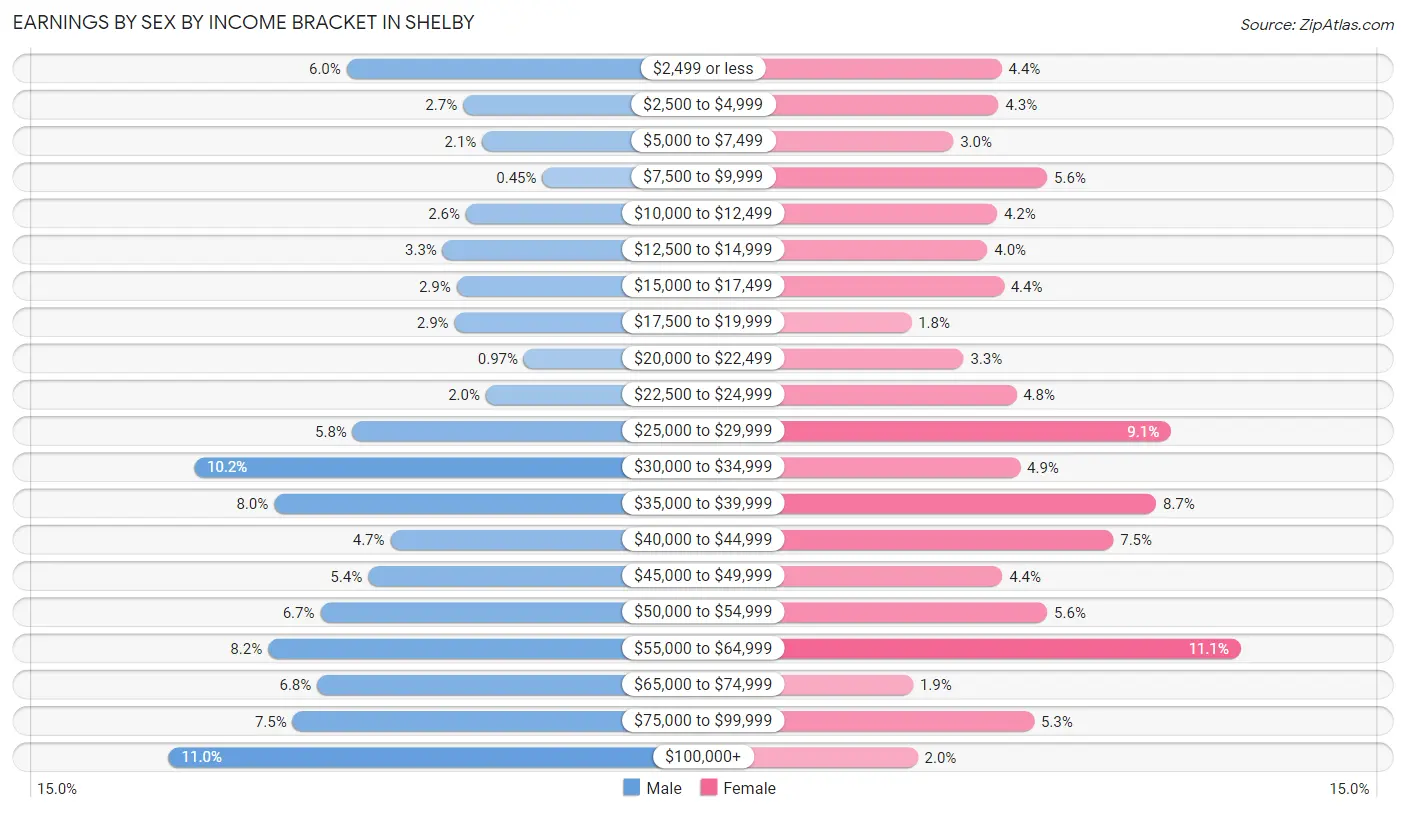
| Income | Male | Female |
| $2,499 or less | 275 (5.9%) | 236 (4.3%) |
| $2,500 to $4,999 | 124 (2.7%) | 231 (4.3%) |
| $5,000 to $7,499 | 99 (2.1%) | 162 (3.0%) |
| $7,500 to $9,999 | 21 (0.4%) | 305 (5.6%) |
| $10,000 to $12,499 | 120 (2.6%) | 229 (4.2%) |
| $12,500 to $14,999 | 150 (3.3%) | 214 (4.0%) |
| $15,000 to $17,499 | 132 (2.9%) | 239 (4.4%) |
| $17,500 to $19,999 | 135 (2.9%) | 98 (1.8%) |
| $20,000 to $22,499 | 45 (1.0%) | 178 (3.3%) |
| $22,500 to $24,999 | 94 (2.0%) | 258 (4.8%) |
| $25,000 to $29,999 | 267 (5.8%) | 494 (9.1%) |
| $30,000 to $34,999 | 473 (10.2%) | 264 (4.9%) |
| $35,000 to $39,999 | 369 (8.0%) | 471 (8.7%) |
| $40,000 to $44,999 | 218 (4.7%) | 406 (7.5%) |
| $45,000 to $49,999 | 247 (5.3%) | 237 (4.4%) |
| $50,000 to $54,999 | 309 (6.7%) | 305 (5.6%) |
| $55,000 to $64,999 | 377 (8.2%) | 600 (11.1%) |
| $65,000 to $74,999 | 313 (6.8%) | 101 (1.9%) |
| $75,000 to $99,999 | 345 (7.5%) | 285 (5.3%) |
| $100,000+ | 506 (11.0%) | 108 (2.0%) |
| Total | 4,619 (100.0%) | 5,421 (100.0%) |
Earnings by Sex by Educational Attainment in Shelby
Average earnings in Shelby are $46,397 for men and $36,289 for women, a difference of 21.8%. Men with an educational attainment of graduate degree enjoy the highest average annual earnings of $75,000, while those with less than high school education earn the least with $29,767. Women with an educational attainment of graduate degree earn the most with the average annual earnings of $56,818, while those with less than high school education have the smallest earnings of $10,590.
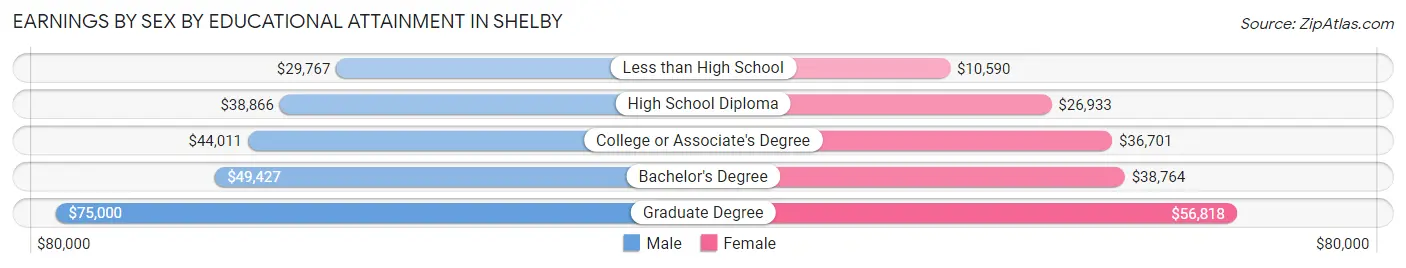
| Educational Attainment | Male Income | Female Income |
| Less than High School | $29,767 | $10,590 |
| High School Diploma | $38,866 | $26,933 |
| College or Associate's Degree | $44,011 | $36,701 |
| Bachelor's Degree | $49,427 | $38,764 |
| Graduate Degree | $75,000 | $56,818 |
| Total | $46,397 | $36,289 |
Family Income in Shelby
Family Income Brackets in Shelby
According to the Shelby family income data, there are 843 families falling into the $50,000 to $74,999 income range, which is the most common income bracket and makes up 15.8% of all families. Conversely, the less than $10,000 income bracket is the least frequent group with only 219 families (4.1%) belonging to this category.
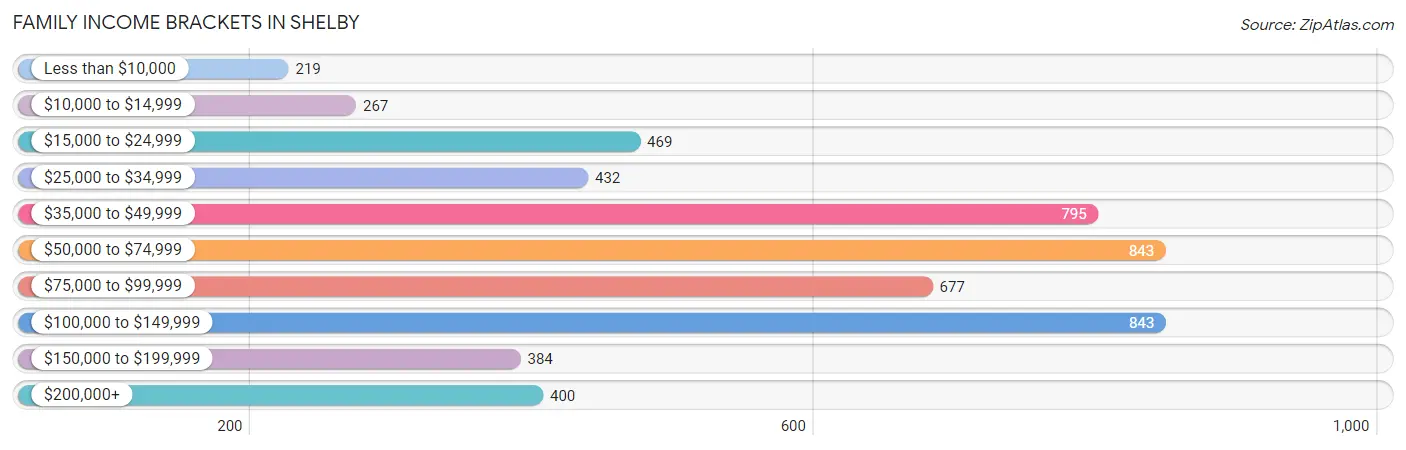
| Income Bracket | # Families | % Families |
| Less than $10,000 | 219 | 4.1% |
| $10,000 to $14,999 | 267 | 5.0% |
| $15,000 to $24,999 | 469 | 8.8% |
| $25,000 to $34,999 | 432 | 8.1% |
| $35,000 to $49,999 | 795 | 14.9% |
| $50,000 to $74,999 | 843 | 15.8% |
| $75,000 to $99,999 | 677 | 12.7% |
| $100,000 to $149,999 | 843 | 15.8% |
| $150,000 to $199,999 | 384 | 7.2% |
| $200,000+ | 400 | 7.5% |
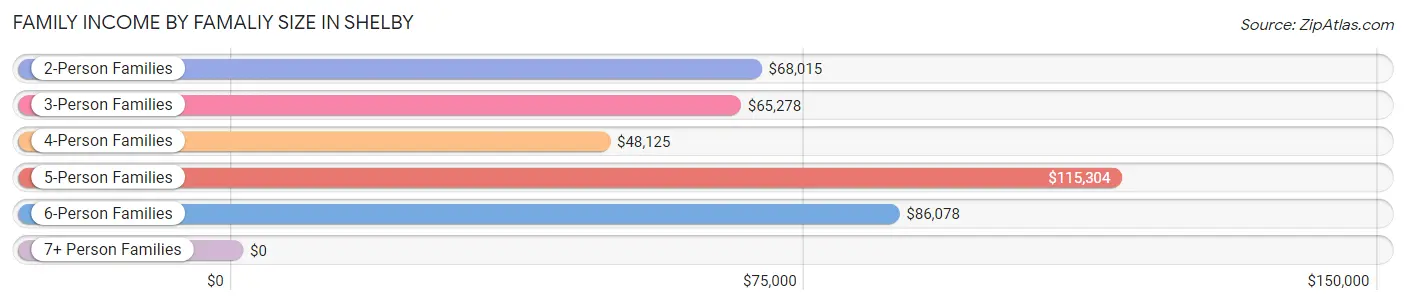
Family Income by Famaliy Size in Shelby
5-person families (393 | 7.4%) account for the highest median family income in Shelby with $115,304 per family, while 2-person families (2,750 | 51.6%) have the highest median income of $34,008 per family member.
| Income Bracket | # Families | Median Income |
| 2-Person Families | 2,750 (51.6%) | $68,015 |
| 3-Person Families | 1,306 (24.5%) | $65,278 |
| 4-Person Families | 820 (15.4%) | $48,125 |
| 5-Person Families | 393 (7.4%) | $115,304 |
| 6-Person Families | 63 (1.2%) | $86,078 |
| 7+ Person Families | 1 (0.0%) | $0 |
| Total | 5,333 (100.0%) | $63,682 |
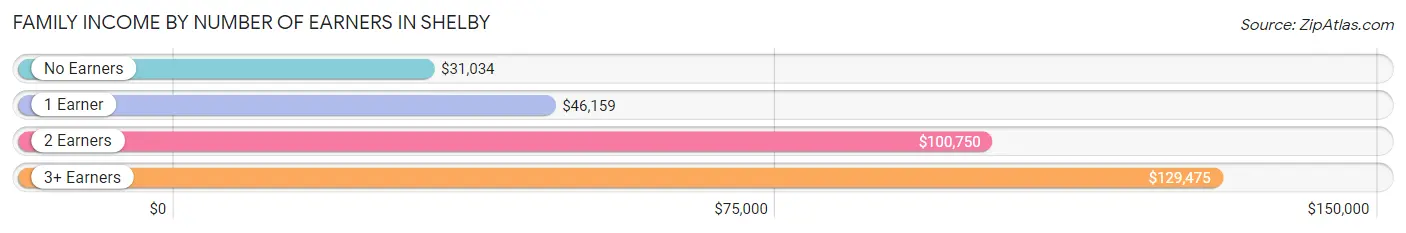
Family Income by Number of Earners in Shelby
The median family income in Shelby is $63,682, with families comprising 3+ earners (343) having the highest median family income of $129,475, while families with no earners (1,037) have the lowest median family income of $31,034, accounting for 6.4% and 19.4% of families, respectively.
| Number of Earners | # Families | Median Income |
| No Earners | 1,037 (19.4%) | $31,034 |
| 1 Earner | 2,043 (38.3%) | $46,159 |
| 2 Earners | 1,910 (35.8%) | $100,750 |
| 3+ Earners | 343 (6.4%) | $129,475 |
| Total | 5,333 (100.0%) | $63,682 |
Household Income in Shelby
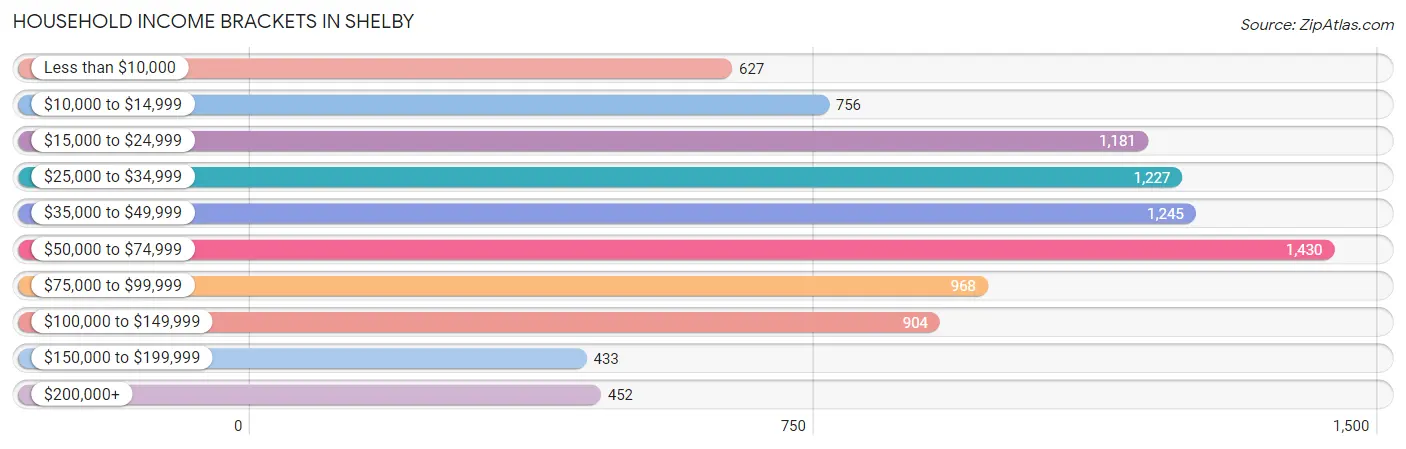
Household Income Brackets in Shelby
With 1,430 households falling in the category, the $50,000 to $74,999 income range is the most frequent in Shelby, accounting for 15.5% of all households. In contrast, only 433 households (4.7%) fall into the $150,000 to $199,999 income bracket, making it the least populous group.
| Income Bracket | # Households | % Households |
| Less than $10,000 | 627 | 6.8% |
| $10,000 to $14,999 | 756 | 8.2% |
| $15,000 to $24,999 | 1,181 | 12.8% |
| $25,000 to $34,999 | 1,227 | 13.3% |
| $35,000 to $49,999 | 1,245 | 13.5% |
| $50,000 to $74,999 | 1,430 | 15.5% |
| $75,000 to $99,999 | 968 | 10.5% |
| $100,000 to $149,999 | 904 | 9.8% |
| $150,000 to $199,999 | 433 | 4.7% |
| $200,000+ | 452 | 4.9% |
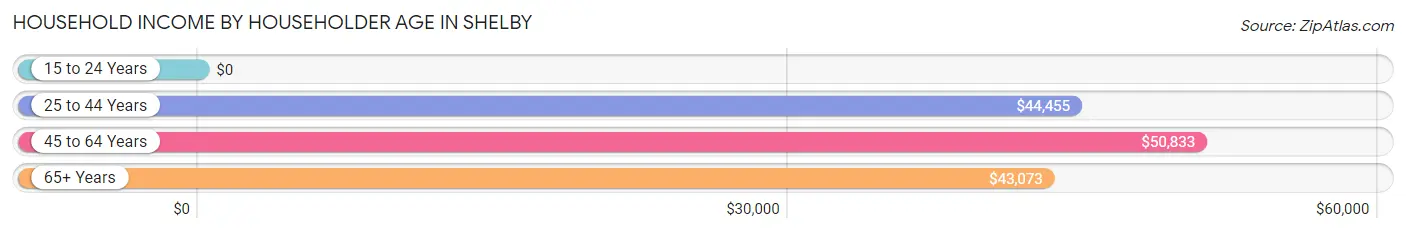
Household Income by Householder Age in Shelby
The median household income in Shelby is $46,176, with the highest median household income of $50,833 found in the 45 to 64 years age bracket for the primary householder. A total of 3,210 households (34.8%) fall into this category. Meanwhile, the 15 to 24 years age bracket for the primary householder has the lowest median household income of $0, with 204 households (2.2%) in this group.
| Income Bracket | # Households | Median Income |
| 15 to 24 Years | 204 (2.2%) | $0 |
| 25 to 44 Years | 2,426 (26.3%) | $44,455 |
| 45 to 64 Years | 3,210 (34.8%) | $50,833 |
| 65+ Years | 3,383 (36.7%) | $43,073 |
| Total | 9,223 (100.0%) | $46,176 |
Poverty in Shelby
Income Below Poverty by Sex and Age in Shelby
With 15.9% poverty level for males and 20.3% for females among the residents of Shelby, 5 year old males and 15 year old females are the most vulnerable to poverty, with 77 males (56.2%) and 67 females (44.4%) in their respective age groups living below the poverty level.
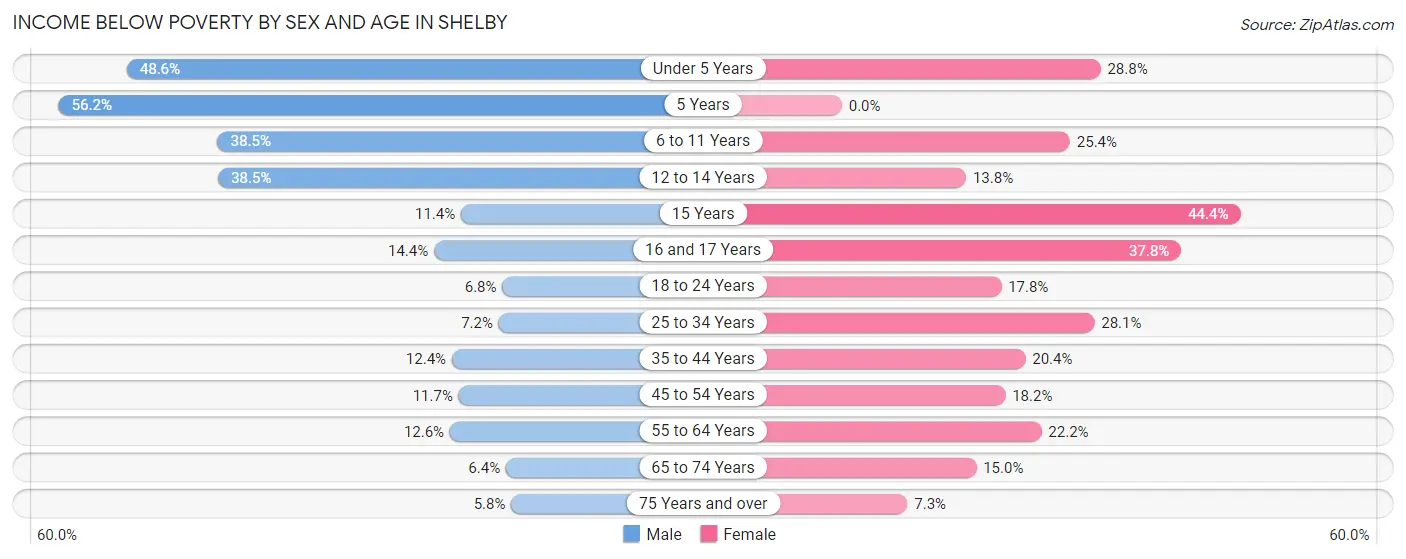
| Age Bracket | Male | Female |
| Under 5 Years | 244 (48.6%) | 123 (28.8%) |
| 5 Years | 77 (56.2%) | 0 (0.0%) |
| 6 to 11 Years | 355 (38.5%) | 240 (25.4%) |
| 12 to 14 Years | 100 (38.5%) | 57 (13.8%) |
| 15 Years | 23 (11.4%) | 67 (44.4%) |
| 16 and 17 Years | 75 (14.4%) | 130 (37.8%) |
| 18 to 24 Years | 43 (6.8%) | 123 (17.7%) |
| 25 to 34 Years | 71 (7.2%) | 403 (28.1%) |
| 35 to 44 Years | 137 (12.4%) | 271 (20.4%) |
| 45 to 54 Years | 142 (11.7%) | 277 (18.2%) |
| 55 to 64 Years | 180 (12.6%) | 317 (22.2%) |
| 65 to 74 Years | 72 (6.4%) | 265 (15.0%) |
| 75 Years and over | 45 (5.8%) | 87 (7.3%) |
| Total | 1,564 (15.9%) | 2,360 (20.3%) |
Income Above Poverty by Sex and Age in Shelby
According to the poverty statistics in Shelby, males aged 75 years and over and females aged 5 years are the age groups that are most secure financially, with 94.2% of males and 100.0% of females in these age groups living above the poverty line.
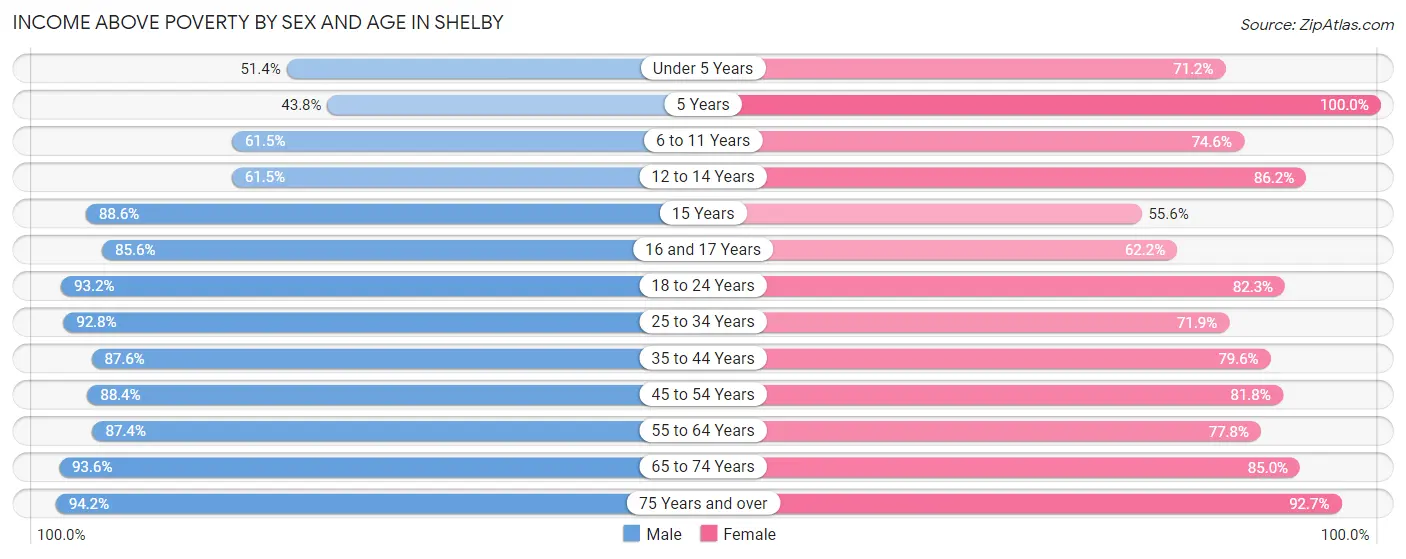
| Age Bracket | Male | Female |
| Under 5 Years | 258 (51.4%) | 304 (71.2%) |
| 5 Years | 60 (43.8%) | 14 (100.0%) |
| 6 to 11 Years | 567 (61.5%) | 705 (74.6%) |
| 12 to 14 Years | 160 (61.5%) | 355 (86.2%) |
| 15 Years | 179 (88.6%) | 84 (55.6%) |
| 16 and 17 Years | 446 (85.6%) | 214 (62.2%) |
| 18 to 24 Years | 590 (93.2%) | 570 (82.3%) |
| 25 to 34 Years | 916 (92.8%) | 1,030 (71.9%) |
| 35 to 44 Years | 967 (87.6%) | 1,055 (79.6%) |
| 45 to 54 Years | 1,077 (88.3%) | 1,245 (81.8%) |
| 55 to 64 Years | 1,245 (87.4%) | 1,109 (77.8%) |
| 65 to 74 Years | 1,054 (93.6%) | 1,505 (85.0%) |
| 75 Years and over | 731 (94.2%) | 1,104 (92.7%) |
| Total | 8,250 (84.1%) | 9,294 (79.7%) |
Income Below Poverty Among Married-Couple Families in Shelby
The poverty statistics for married-couple families in Shelby show that 3.4% or 105 of the total 3,109 families live below the poverty line. Families with 5 or more children have the highest poverty rate of 100.0%, comprising of 1 families. On the other hand, families with 3 or 4 children have the lowest poverty rate of 0.0%, which includes 0 families.
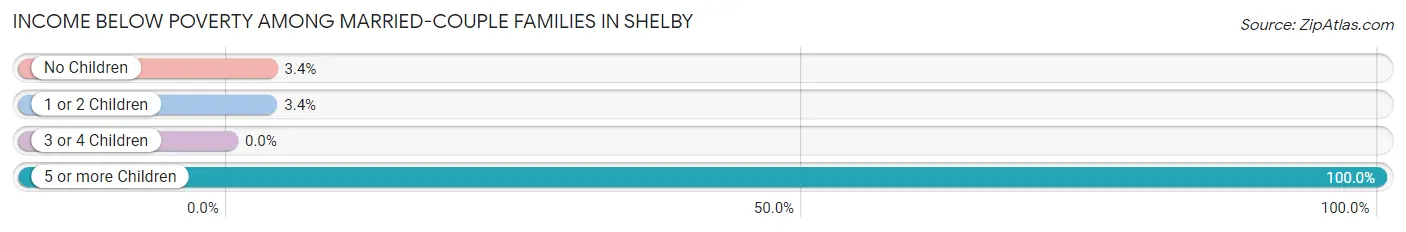
| Children | Above Poverty | Below Poverty |
| No Children | 2,189 (96.6%) | 78 (3.4%) |
| 1 or 2 Children | 735 (96.6%) | 26 (3.4%) |
| 3 or 4 Children | 80 (100.0%) | 0 (0.0%) |
| 5 or more Children | 0 (0.0%) | 1 (100.0%) |
| Total | 3,004 (96.6%) | 105 (3.4%) |
Income Below Poverty Among Single-Parent Households in Shelby
According to the poverty data in Shelby, 24.8% or 135 single-father households and 34.7% or 583 single-mother households are living below the poverty line. Among single-father households, those with 1 or 2 children have the highest poverty rate, with 117 households (31.5%) experiencing poverty. Likewise, among single-mother households, those with 3 or 4 children have the highest poverty rate, with 209 households (55.3%) falling below the poverty line.
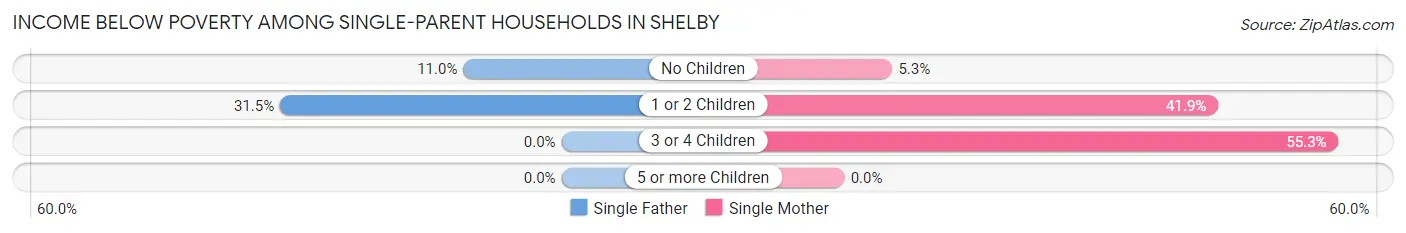
| Children | Single Father | Single Mother |
| No Children | 18 (11.0%) | 25 (5.3%) |
| 1 or 2 Children | 117 (31.5%) | 349 (41.8%) |
| 3 or 4 Children | 0 (0.0%) | 209 (55.3%) |
| 5 or more Children | 0 (0.0%) | 0 (0.0%) |
| Total | 135 (24.8%) | 583 (34.7%) |
Income Below Poverty Among Married-Couple vs Single-Parent Households in Shelby
The poverty data for Shelby shows that 105 of the married-couple family households (3.4%) and 718 of the single-parent households (32.3%) are living below the poverty level. Within the married-couple family households, those with 5 or more children have the highest poverty rate, with 1 households (100.0%) falling below the poverty line. Among the single-parent households, those with 3 or 4 children have the highest poverty rate, with 209 household (54.1%) living below poverty.
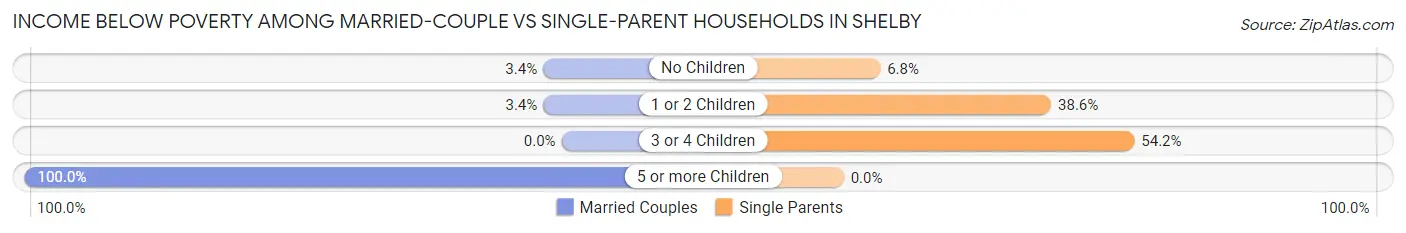
| Children | Married-Couple Families | Single-Parent Households |
| No Children | 78 (3.4%) | 43 (6.8%) |
| 1 or 2 Children | 26 (3.4%) | 466 (38.6%) |
| 3 or 4 Children | 0 (0.0%) | 209 (54.1%) |
| 5 or more Children | 1 (100.0%) | 0 (0.0%) |
| Total | 105 (3.4%) | 718 (32.3%) |
Employment Characteristics in Shelby
Employment by Class of Employer in Shelby
Among the 9,161 employed individuals in Shelby, private company employees (6,308 | 68.9%), not-for-profit organizations (1,021 | 11.2%), and local government employees (707 | 7.7%) make up the most common classes of employment.
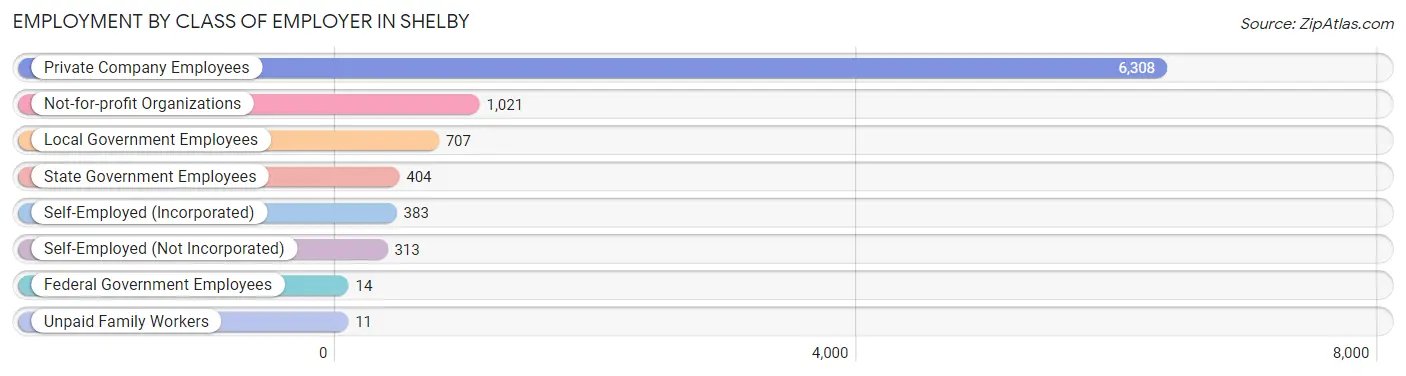
| Employer Class | # Employees | % Employees |
| Private Company Employees | 6,308 | 68.9% |
| Self-Employed (Incorporated) | 383 | 4.2% |
| Self-Employed (Not Incorporated) | 313 | 3.4% |
| Not-for-profit Organizations | 1,021 | 11.2% |
| Local Government Employees | 707 | 7.7% |
| State Government Employees | 404 | 4.4% |
| Federal Government Employees | 14 | 0.2% |
| Unpaid Family Workers | 11 | 0.1% |
| Total | 9,161 | 100.0% |
Employment Status by Age in Shelby
According to the labor force statistics for Shelby, out of the total population over 16 years of age (17,650), 55.4% or 9,778 individuals are in the labor force, with 3.7% or 362 of them unemployed. The age group with the highest labor force participation rate is 20 to 24 years, with 86.0% or 784 individuals in the labor force. Within the labor force, the 25 to 29 years age range has the highest percentage of unemployed individuals, with 7.6% or 51 of them being unemployed.
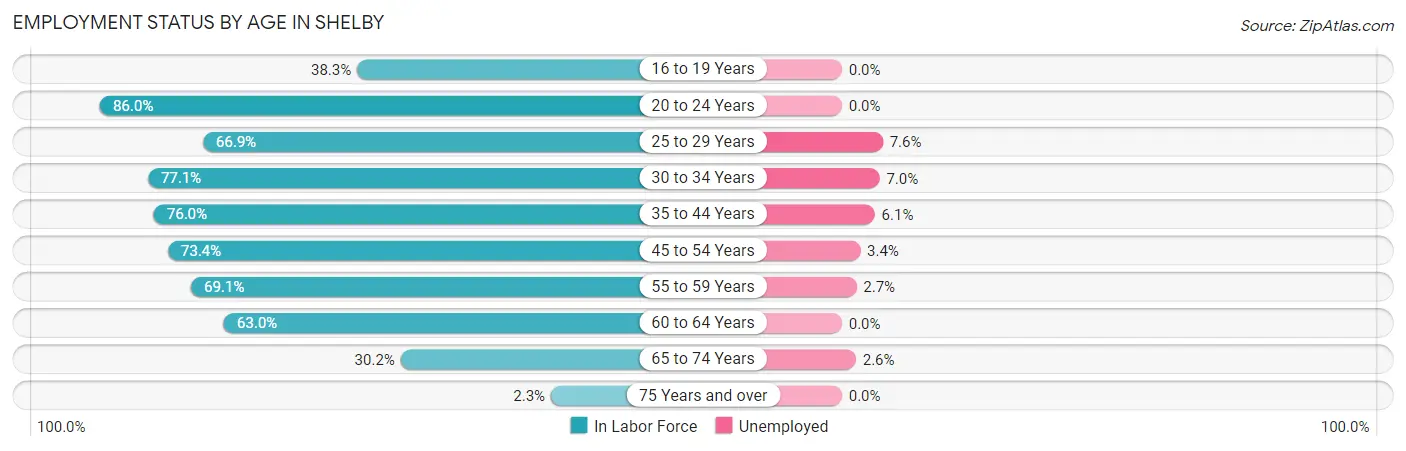
| Age Bracket | In Labor Force | Unemployed |
| 16 to 19 Years | 499 (38.3%) | 0 (0.0%) |
| 20 to 24 Years | 784 (86.0%) | 0 (0.0%) |
| 25 to 29 Years | 669 (66.9%) | 51 (7.6%) |
| 30 to 34 Years | 1,135 (77.1%) | 79 (7.0%) |
| 35 to 44 Years | 1,863 (76.0%) | 114 (6.1%) |
| 45 to 54 Years | 2,012 (73.4%) | 68 (3.4%) |
| 55 to 59 Years | 1,095 (69.1%) | 30 (2.7%) |
| 60 to 64 Years | 798 (63.0%) | 0 (0.0%) |
| 65 to 74 Years | 875 (30.2%) | 23 (2.6%) |
| 75 Years and over | 47 (2.3%) | 0 (0.0%) |
| Total | 9,778 (55.4%) | 362 (3.7%) |
Employment Status by Educational Attainment in Shelby
According to labor force statistics for Shelby, 72.0% of individuals (7,571) out of the total population between 25 and 64 years of age (10,515) are in the labor force, with 4.5% or 341 of them being unemployed. The group with the highest labor force participation rate are those with the educational attainment of bachelor's degree or higher, with 90.2% or 2,379 individuals in the labor force. Within the labor force, individuals with less than high school education have the highest percentage of unemployment, with 14.3% or 65 of them being unemployed.
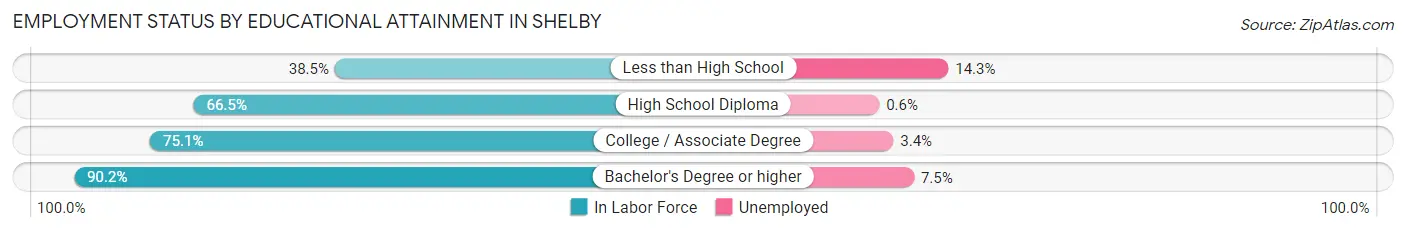
| Educational Attainment | In Labor Force | Unemployed |
| Less than High School | 455 (38.5%) | 169 (14.3%) |
| High School Diploma | 2,225 (66.5%) | 20 (0.6%) |
| College / Associate Degree | 2,515 (75.1%) | 114 (3.4%) |
| Bachelor's Degree or higher | 2,379 (90.2%) | 198 (7.5%) |
| Total | 7,571 (72.0%) | 473 (4.5%) |
Employment Occupations by Sex in Shelby
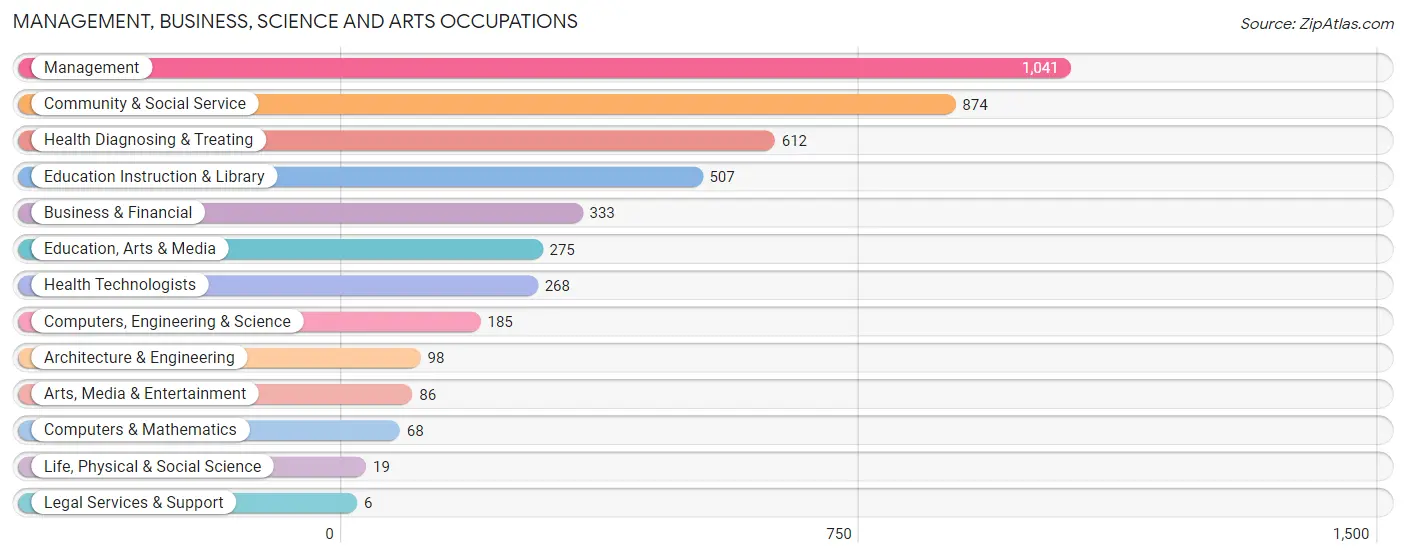
Management, Business, Science and Arts Occupations
The most common Management, Business, Science and Arts occupations in Shelby are Management (1,041 | 11.1%), Community & Social Service (874 | 9.3%), Health Diagnosing & Treating (612 | 6.5%), Education Instruction & Library (507 | 5.4%), and Business & Financial (333 | 3.5%).
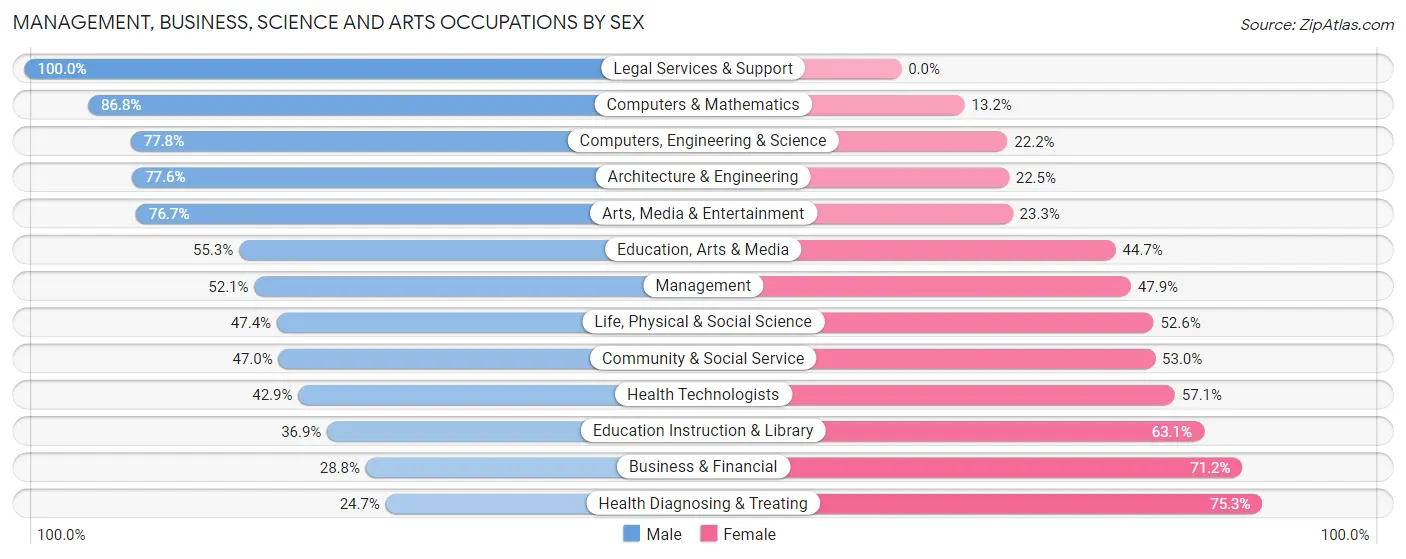
Management, Business, Science and Arts Occupations by Sex
Within the Management, Business, Science and Arts occupations in Shelby, the most male-oriented occupations are Legal Services & Support (100.0%), Computers & Mathematics (86.8%), and Computers, Engineering & Science (77.8%), while the most female-oriented occupations are Health Diagnosing & Treating (75.3%), Business & Financial (71.2%), and Education Instruction & Library (63.1%).
| Occupation | Male | Female |
| Management | 542 (52.1%) | 499 (47.9%) |
| Business & Financial | 96 (28.8%) | 237 (71.2%) |
| Computers, Engineering & Science | 144 (77.8%) | 41 (22.2%) |
| Computers & Mathematics | 59 (86.8%) | 9 (13.2%) |
| Architecture & Engineering | 76 (77.5%) | 22 (22.5%) |
| Life, Physical & Social Science | 9 (47.4%) | 10 (52.6%) |
| Community & Social Service | 411 (47.0%) | 463 (53.0%) |
| Education, Arts & Media | 152 (55.3%) | 123 (44.7%) |
| Legal Services & Support | 6 (100.0%) | 0 (0.0%) |
| Education Instruction & Library | 187 (36.9%) | 320 (63.1%) |
| Arts, Media & Entertainment | 66 (76.7%) | 20 (23.3%) |
| Health Diagnosing & Treating | 151 (24.7%) | 461 (75.3%) |
| Health Technologists | 115 (42.9%) | 153 (57.1%) |
| Total (Category) | 1,344 (44.1%) | 1,701 (55.9%) |
| Total (Overall) | 4,438 (47.2%) | 4,958 (52.8%) |
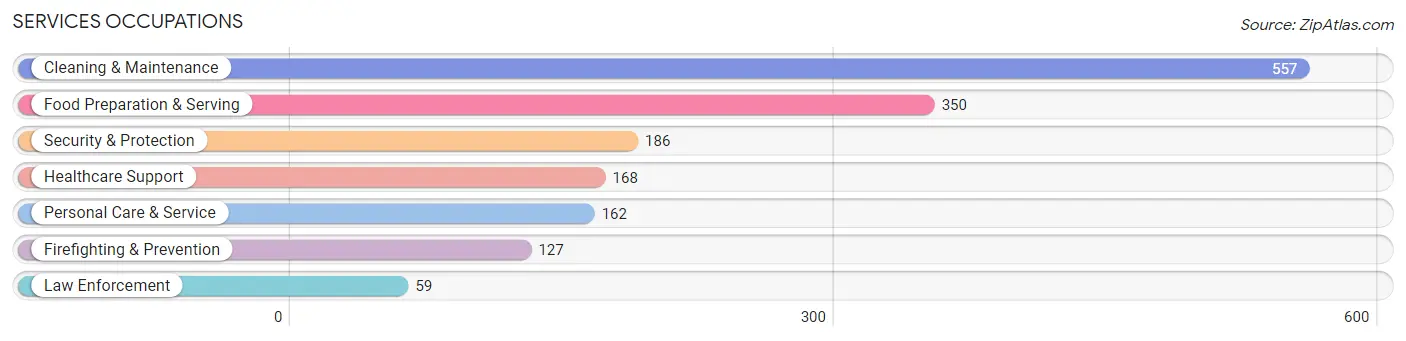
Services Occupations
The most common Services occupations in Shelby are Cleaning & Maintenance (557 | 5.9%), Food Preparation & Serving (350 | 3.7%), Security & Protection (186 | 2.0%), Healthcare Support (168 | 1.8%), and Personal Care & Service (162 | 1.7%).
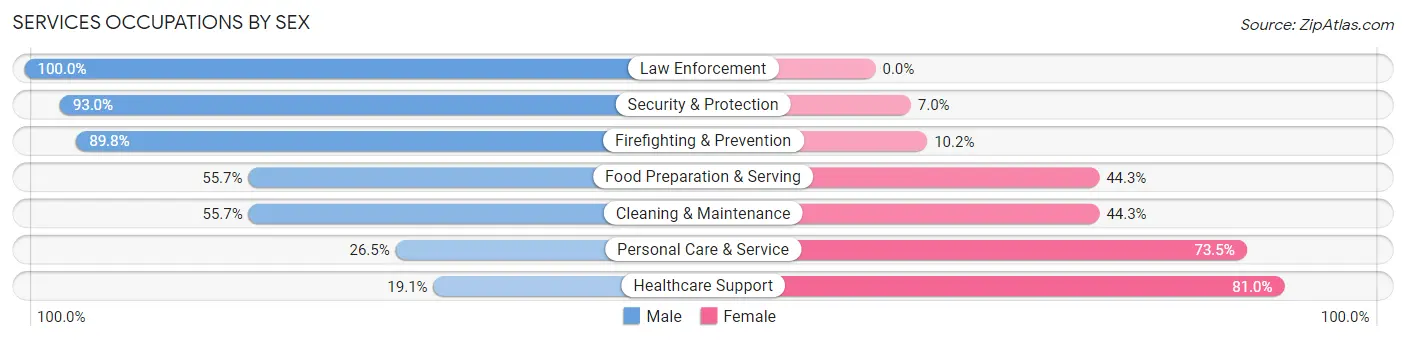
Services Occupations by Sex
Within the Services occupations in Shelby, the most male-oriented occupations are Law Enforcement (100.0%), Security & Protection (93.0%), and Firefighting & Prevention (89.8%), while the most female-oriented occupations are Healthcare Support (80.9%), Personal Care & Service (73.5%), and Cleaning & Maintenance (44.3%).
| Occupation | Male | Female |
| Healthcare Support | 32 (19.1%) | 136 (80.9%) |
| Security & Protection | 173 (93.0%) | 13 (7.0%) |
| Firefighting & Prevention | 114 (89.8%) | 13 (10.2%) |
| Law Enforcement | 59 (100.0%) | 0 (0.0%) |
| Food Preparation & Serving | 195 (55.7%) | 155 (44.3%) |
| Cleaning & Maintenance | 310 (55.7%) | 247 (44.3%) |
| Personal Care & Service | 43 (26.5%) | 119 (73.5%) |
| Total (Category) | 753 (52.9%) | 670 (47.1%) |
| Total (Overall) | 4,438 (47.2%) | 4,958 (52.8%) |
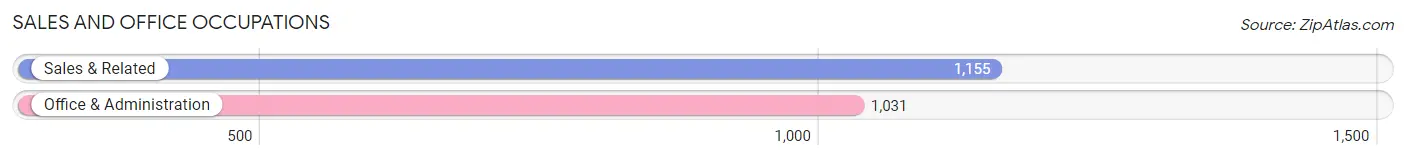
Sales and Office Occupations
The most common Sales and Office occupations in Shelby are Sales & Related (1,155 | 12.3%), and Office & Administration (1,031 | 11.0%).
Sales and Office Occupations by Sex
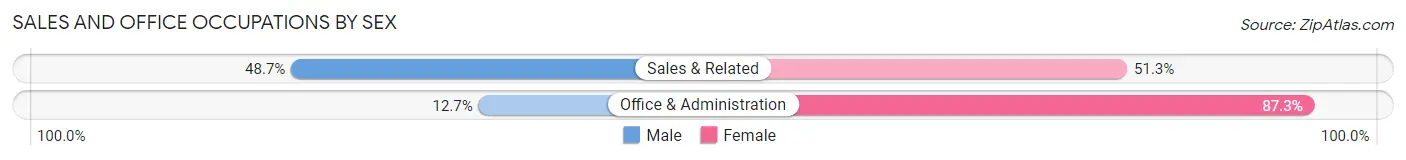
| Occupation | Male | Female |
| Sales & Related | 563 (48.7%) | 592 (51.3%) |
| Office & Administration | 131 (12.7%) | 900 (87.3%) |
| Total (Category) | 694 (31.8%) | 1,492 (68.2%) |
| Total (Overall) | 4,438 (47.2%) | 4,958 (52.8%) |
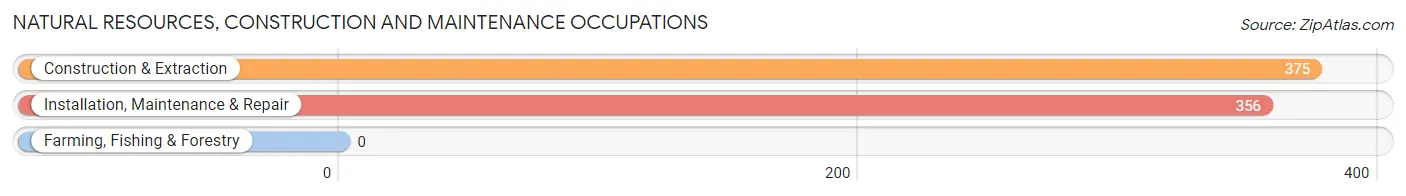
Natural Resources, Construction and Maintenance Occupations
The most common Natural Resources, Construction and Maintenance occupations in Shelby are Construction & Extraction (375 | 4.0%), and Installation, Maintenance & Repair (356 | 3.8%).
Natural Resources, Construction and Maintenance Occupations by Sex
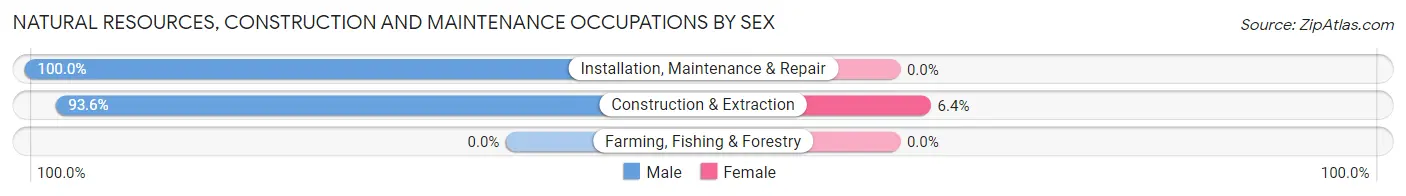
| Occupation | Male | Female |
| Farming, Fishing & Forestry | 0 (0.0%) | 0 (0.0%) |
| Construction & Extraction | 351 (93.6%) | 24 (6.4%) |
| Installation, Maintenance & Repair | 356 (100.0%) | 0 (0.0%) |
| Total (Category) | 707 (96.7%) | 24 (3.3%) |
| Total (Overall) | 4,438 (47.2%) | 4,958 (52.8%) |
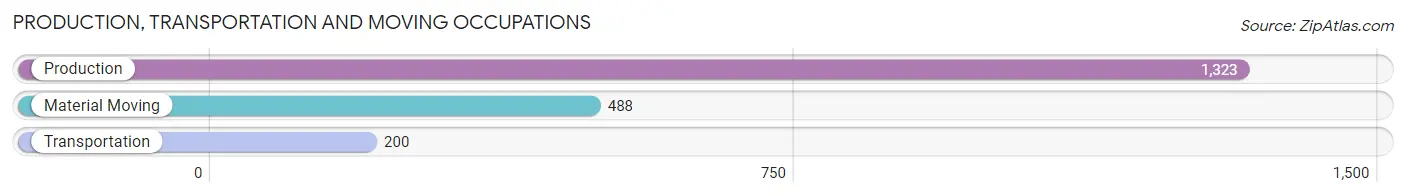
Production, Transportation and Moving Occupations
The most common Production, Transportation and Moving occupations in Shelby are Production (1,323 | 14.1%), Material Moving (488 | 5.2%), and Transportation (200 | 2.1%).
Production, Transportation and Moving Occupations by Sex
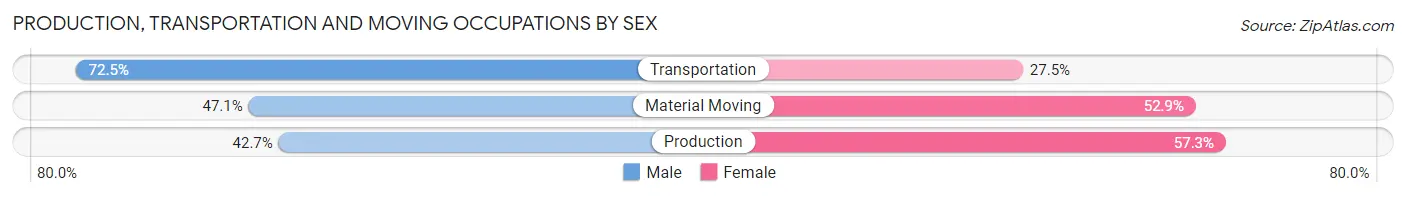
| Occupation | Male | Female |
| Production | 565 (42.7%) | 758 (57.3%) |
| Transportation | 145 (72.5%) | 55 (27.5%) |
| Material Moving | 230 (47.1%) | 258 (52.9%) |
| Total (Category) | 940 (46.7%) | 1,071 (53.3%) |
| Total (Overall) | 4,438 (47.2%) | 4,958 (52.8%) |
Employment Industries by Sex in Shelby
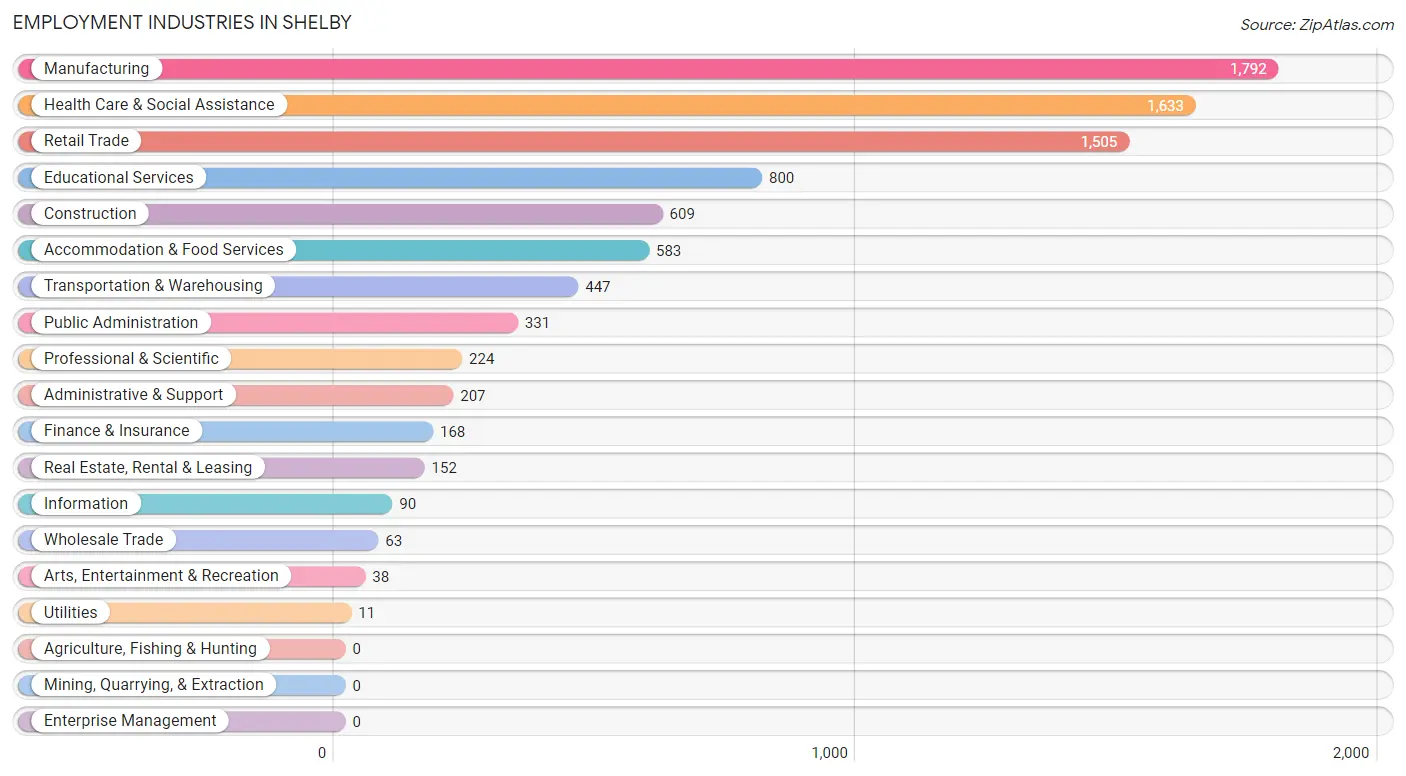
Employment Industries in Shelby
The major employment industries in Shelby include Manufacturing (1,792 | 19.1%), Health Care & Social Assistance (1,633 | 17.4%), Retail Trade (1,505 | 16.0%), Educational Services (800 | 8.5%), and Construction (609 | 6.5%).
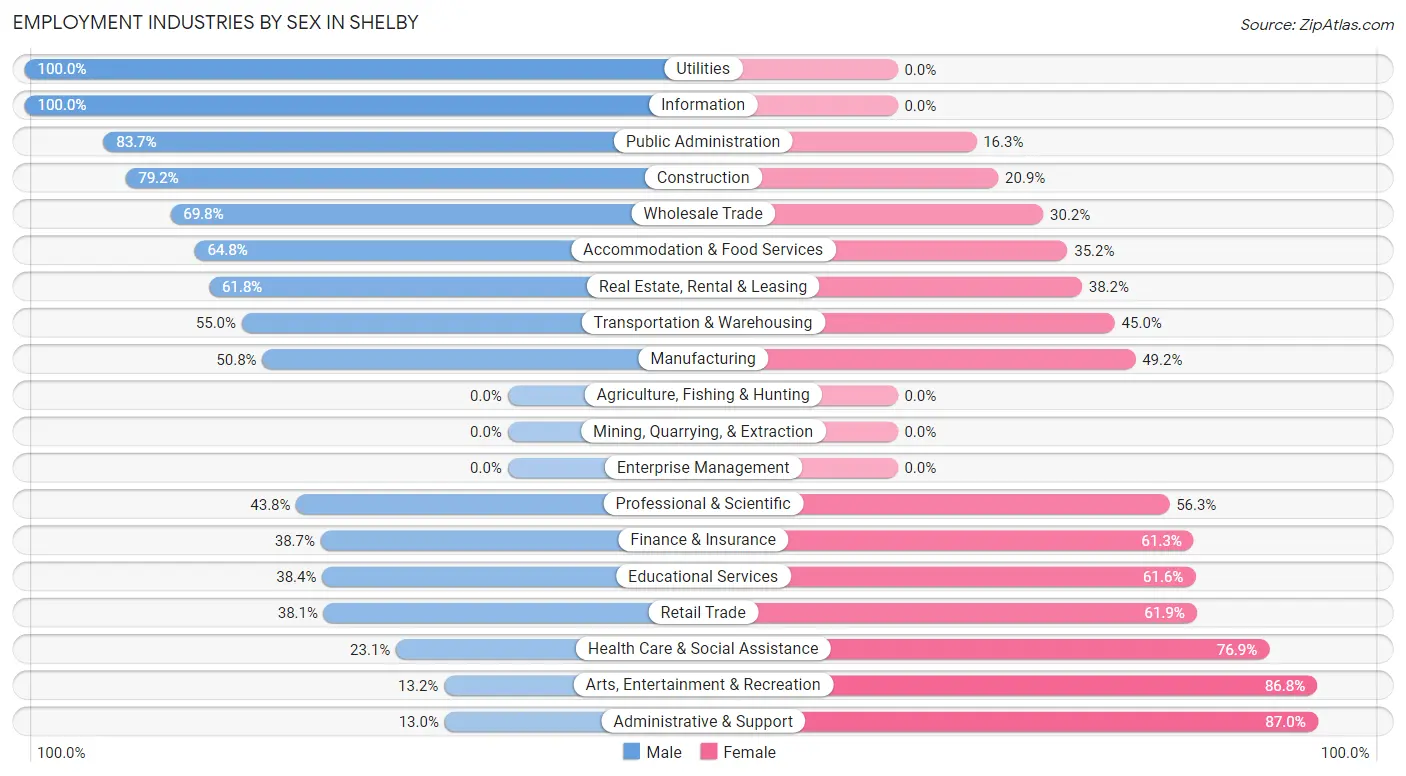
Employment Industries by Sex in Shelby
The Shelby industries that see more men than women are Utilities (100.0%), Information (100.0%), and Public Administration (83.7%), whereas the industries that tend to have a higher number of women are Administrative & Support (87.0%), Arts, Entertainment & Recreation (86.8%), and Health Care & Social Assistance (76.9%).
| Industry | Male | Female |
| Agriculture, Fishing & Hunting | 0 (0.0%) | 0 (0.0%) |
| Mining, Quarrying, & Extraction | 0 (0.0%) | 0 (0.0%) |
| Construction | 482 (79.1%) | 127 (20.8%) |
| Manufacturing | 910 (50.8%) | 882 (49.2%) |
| Wholesale Trade | 44 (69.8%) | 19 (30.2%) |
| Retail Trade | 573 (38.1%) | 932 (61.9%) |
| Transportation & Warehousing | 246 (55.0%) | 201 (45.0%) |
| Utilities | 11 (100.0%) | 0 (0.0%) |
| Information | 90 (100.0%) | 0 (0.0%) |
| Finance & Insurance | 65 (38.7%) | 103 (61.3%) |
| Real Estate, Rental & Leasing | 94 (61.8%) | 58 (38.2%) |
| Professional & Scientific | 98 (43.8%) | 126 (56.2%) |
| Enterprise Management | 0 (0.0%) | 0 (0.0%) |
| Administrative & Support | 27 (13.0%) | 180 (87.0%) |
| Educational Services | 307 (38.4%) | 493 (61.6%) |
| Health Care & Social Assistance | 377 (23.1%) | 1,256 (76.9%) |
| Arts, Entertainment & Recreation | 5 (13.2%) | 33 (86.8%) |
| Accommodation & Food Services | 378 (64.8%) | 205 (35.2%) |
| Public Administration | 277 (83.7%) | 54 (16.3%) |
| Total | 4,438 (47.2%) | 4,958 (52.8%) |
Education in Shelby
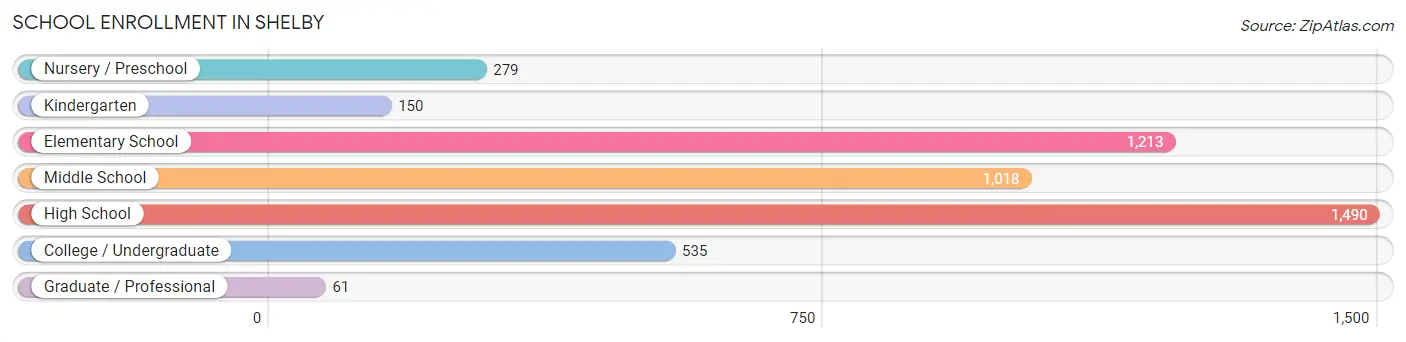
School Enrollment in Shelby
The most common levels of schooling among the 4,746 students in Shelby are high school (1,490 | 31.4%), elementary school (1,213 | 25.6%), and middle school (1,018 | 21.4%).
| School Level | # Students | % Students |
| Nursery / Preschool | 279 | 5.9% |
| Kindergarten | 150 | 3.2% |
| Elementary School | 1,213 | 25.6% |
| Middle School | 1,018 | 21.4% |
| High School | 1,490 | 31.4% |
| College / Undergraduate | 535 | 11.3% |
| Graduate / Professional | 61 | 1.3% |
| Total | 4,746 | 100.0% |
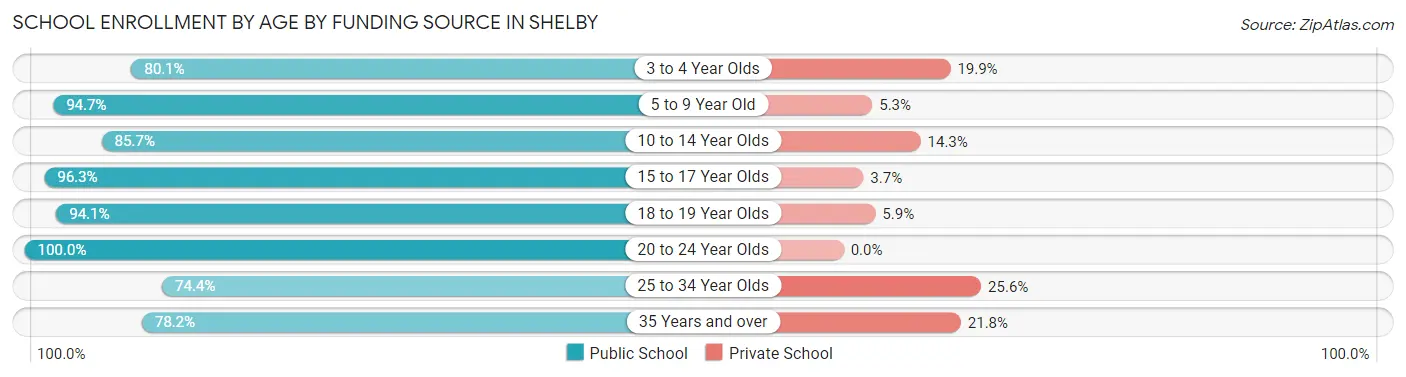
School Enrollment by Age by Funding Source in Shelby
Out of a total of 4,746 students who are enrolled in schools in Shelby, 441 (9.3%) attend a private institution, while the remaining 4,305 (90.7%) are enrolled in public schools. The age group of 25 to 34 year olds has the highest likelihood of being enrolled in private schools, with 42 (25.6% in the age bracket) enrolled. Conversely, the age group of 20 to 24 year olds has the lowest likelihood of being enrolled in a private school, with 147 (100.0% in the age bracket) attending a public institution.
| Age Bracket | Public School | Private School |
| 3 to 4 Year Olds | 145 (80.1%) | 36 (19.9%) |
| 5 to 9 Year Old | 1,279 (94.7%) | 72 (5.3%) |
| 10 to 14 Year Olds | 1,076 (85.7%) | 180 (14.3%) |
| 15 to 17 Year Olds | 1,099 (96.3%) | 42 (3.7%) |
| 18 to 19 Year Olds | 239 (94.1%) | 15 (5.9%) |
| 20 to 24 Year Olds | 147 (100.0%) | 0 (0.0%) |
| 25 to 34 Year Olds | 122 (74.4%) | 42 (25.6%) |
| 35 Years and over | 197 (78.2%) | 55 (21.8%) |
| Total | 4,305 (90.7%) | 441 (9.3%) |
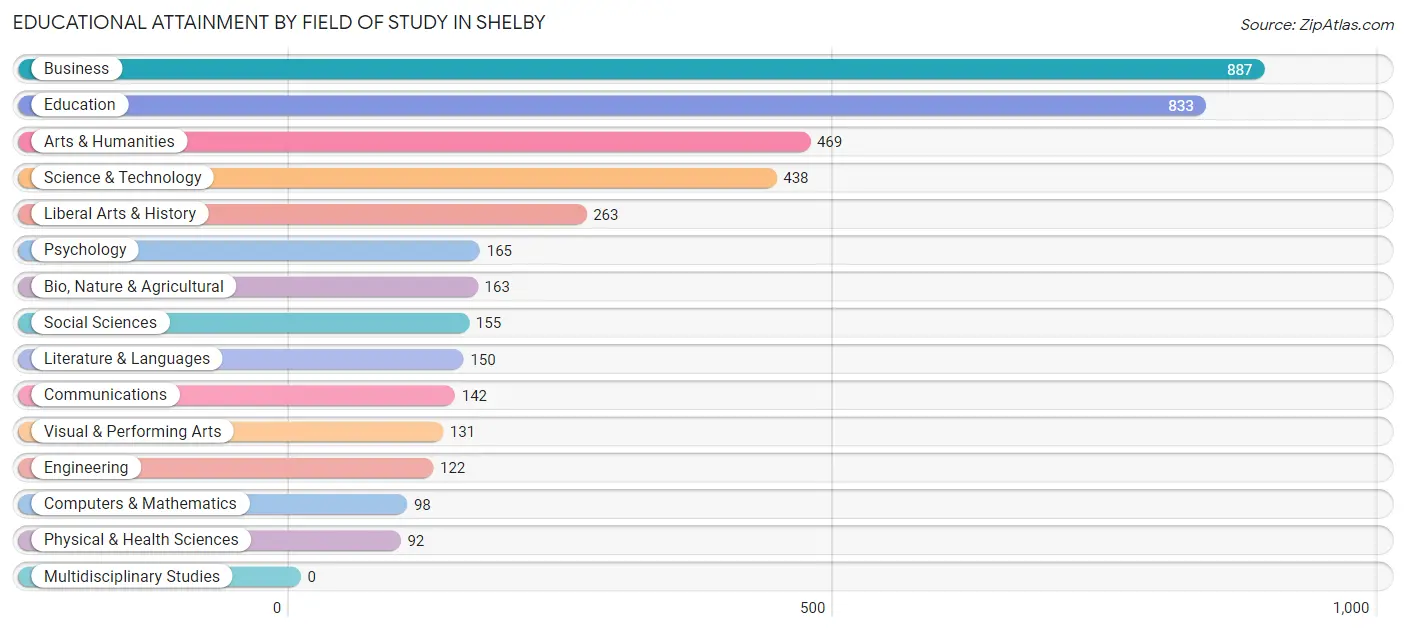
Educational Attainment by Field of Study in Shelby
Business (887 | 21.6%), education (833 | 20.3%), arts & humanities (469 | 11.4%), science & technology (438 | 10.7%), and liberal arts & history (263 | 6.4%) are the most common fields of study among 4,108 individuals in Shelby who have obtained a bachelor's degree or higher.
| Field of Study | # Graduates | % Graduates |
| Computers & Mathematics | 98 | 2.4% |
| Bio, Nature & Agricultural | 163 | 4.0% |
| Physical & Health Sciences | 92 | 2.2% |
| Psychology | 165 | 4.0% |
| Social Sciences | 155 | 3.8% |
| Engineering | 122 | 3.0% |
| Multidisciplinary Studies | 0 | 0.0% |
| Science & Technology | 438 | 10.7% |
| Business | 887 | 21.6% |
| Education | 833 | 20.3% |
| Literature & Languages | 150 | 3.6% |
| Liberal Arts & History | 263 | 6.4% |
| Visual & Performing Arts | 131 | 3.2% |
| Communications | 142 | 3.5% |
| Arts & Humanities | 469 | 11.4% |
| Total | 4,108 | 100.0% |
Transportation & Commute in Shelby
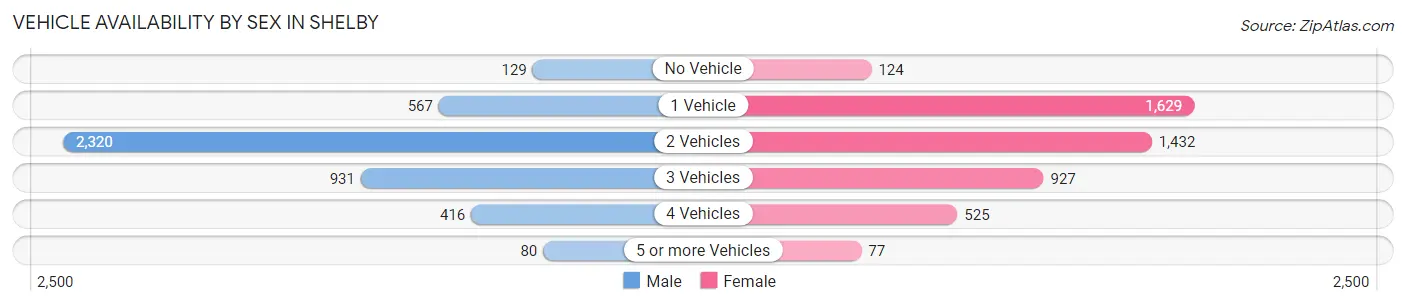
Vehicle Availability by Sex in Shelby
The most prevalent vehicle ownership categories in Shelby are males with 2 vehicles (2,320, accounting for 52.2%) and females with 2 vehicles (1,432, making up 49.2%).
| Vehicles Available | Male | Female |
| No Vehicle | 129 (2.9%) | 124 (2.6%) |
| 1 Vehicle | 567 (12.8%) | 1,629 (34.6%) |
| 2 Vehicles | 2,320 (52.2%) | 1,432 (30.4%) |
| 3 Vehicles | 931 (20.9%) | 927 (19.7%) |
| 4 Vehicles | 416 (9.4%) | 525 (11.1%) |
| 5 or more Vehicles | 80 (1.8%) | 77 (1.6%) |
| Total | 4,443 (100.0%) | 4,714 (100.0%) |
Commute Time in Shelby
The most frequently occuring commute durations in Shelby are 10 to 14 minutes (1,900 commuters, 22.9%), 5 to 9 minutes (1,667 commuters, 20.1%), and 15 to 19 minutes (1,130 commuters, 13.6%).
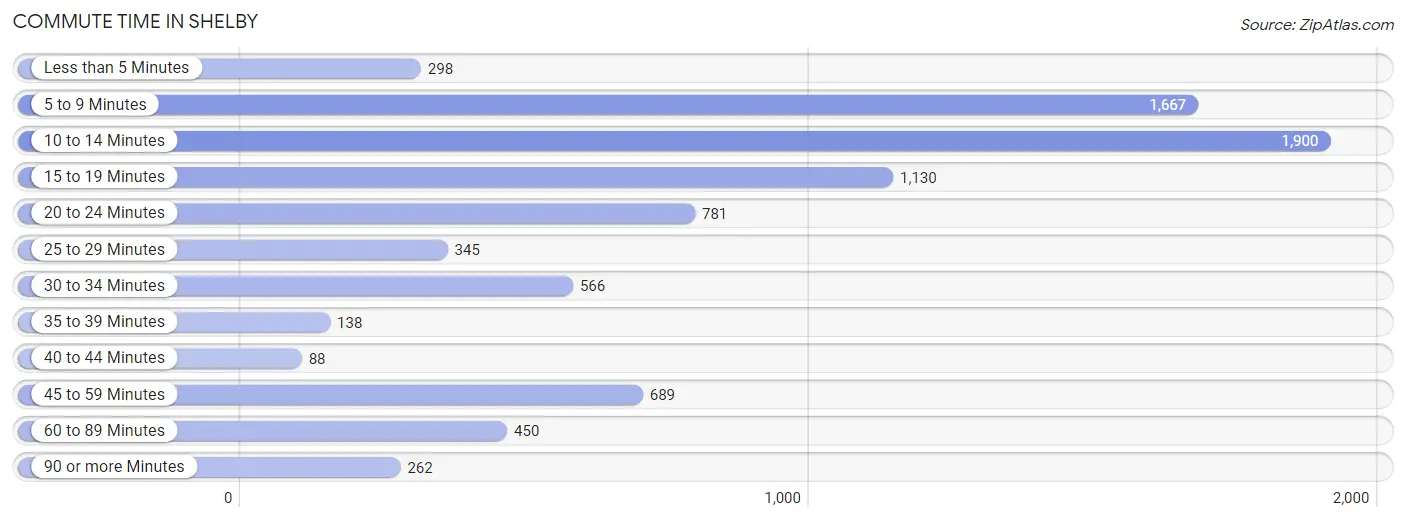
| Commute Time | # Commuters | % Commuters |
| Less than 5 Minutes | 298 | 3.6% |
| 5 to 9 Minutes | 1,667 | 20.1% |
| 10 to 14 Minutes | 1,900 | 22.9% |
| 15 to 19 Minutes | 1,130 | 13.6% |
| 20 to 24 Minutes | 781 | 9.4% |
| 25 to 29 Minutes | 345 | 4.2% |
| 30 to 34 Minutes | 566 | 6.8% |
| 35 to 39 Minutes | 138 | 1.7% |
| 40 to 44 Minutes | 88 | 1.1% |
| 45 to 59 Minutes | 689 | 8.3% |
| 60 to 89 Minutes | 450 | 5.4% |
| 90 or more Minutes | 262 | 3.2% |
Commute Time by Sex in Shelby
The most common commute times in Shelby are 5 to 9 minutes (928 commuters, 23.4%) for males and 10 to 14 minutes (1,123 commuters, 25.9%) for females.
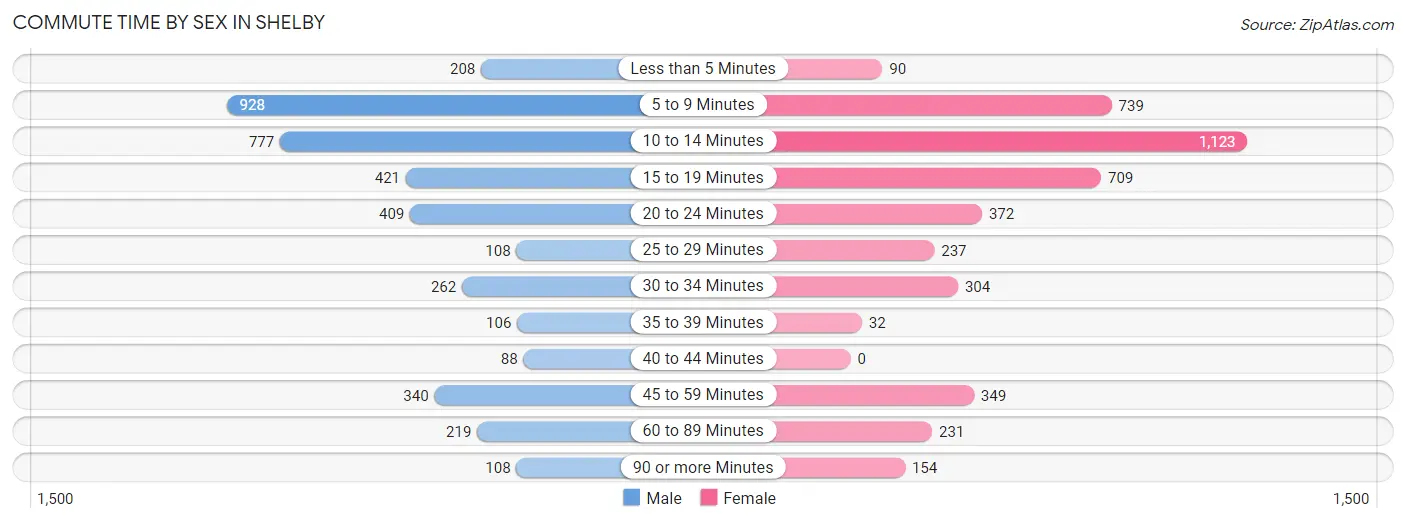
| Commute Time | Male | Female |
| Less than 5 Minutes | 208 (5.2%) | 90 (2.1%) |
| 5 to 9 Minutes | 928 (23.4%) | 739 (17.0%) |
| 10 to 14 Minutes | 777 (19.6%) | 1,123 (25.9%) |
| 15 to 19 Minutes | 421 (10.6%) | 709 (16.3%) |
| 20 to 24 Minutes | 409 (10.3%) | 372 (8.6%) |
| 25 to 29 Minutes | 108 (2.7%) | 237 (5.5%) |
| 30 to 34 Minutes | 262 (6.6%) | 304 (7.0%) |
| 35 to 39 Minutes | 106 (2.7%) | 32 (0.7%) |
| 40 to 44 Minutes | 88 (2.2%) | 0 (0.0%) |
| 45 to 59 Minutes | 340 (8.6%) | 349 (8.0%) |
| 60 to 89 Minutes | 219 (5.5%) | 231 (5.3%) |
| 90 or more Minutes | 108 (2.7%) | 154 (3.5%) |
Time of Departure to Work by Sex in Shelby
The most frequent times of departure to work in Shelby are 7:30 AM to 7:59 AM (1,035, 26.0%) for males and 7:30 AM to 7:59 AM (1,011, 23.3%) for females.
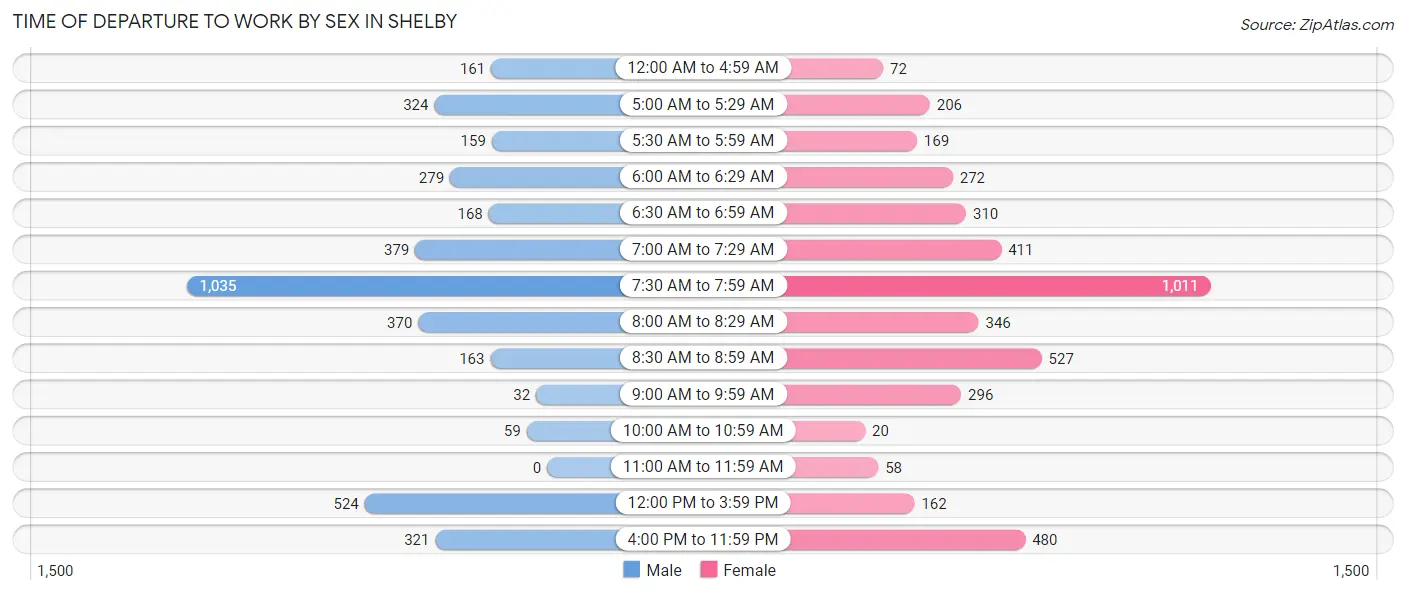
| Time of Departure | Male | Female |
| 12:00 AM to 4:59 AM | 161 (4.1%) | 72 (1.7%) |
| 5:00 AM to 5:29 AM | 324 (8.2%) | 206 (4.8%) |
| 5:30 AM to 5:59 AM | 159 (4.0%) | 169 (3.9%) |
| 6:00 AM to 6:29 AM | 279 (7.0%) | 272 (6.3%) |
| 6:30 AM to 6:59 AM | 168 (4.2%) | 310 (7.1%) |
| 7:00 AM to 7:29 AM | 379 (9.5%) | 411 (9.5%) |
| 7:30 AM to 7:59 AM | 1,035 (26.0%) | 1,011 (23.3%) |
| 8:00 AM to 8:29 AM | 370 (9.3%) | 346 (8.0%) |
| 8:30 AM to 8:59 AM | 163 (4.1%) | 527 (12.1%) |
| 9:00 AM to 9:59 AM | 32 (0.8%) | 296 (6.8%) |
| 10:00 AM to 10:59 AM | 59 (1.5%) | 20 (0.5%) |
| 11:00 AM to 11:59 AM | 0 (0.0%) | 58 (1.3%) |
| 12:00 PM to 3:59 PM | 524 (13.2%) | 162 (3.7%) |
| 4:00 PM to 11:59 PM | 321 (8.1%) | 480 (11.1%) |
| Total | 3,974 (100.0%) | 4,340 (100.0%) |
Housing Occupancy in Shelby
Occupancy by Ownership in Shelby
Of the total 9,223 dwellings in Shelby, owner-occupied units account for 5,580 (60.5%), while renter-occupied units make up 3,643 (39.5%).
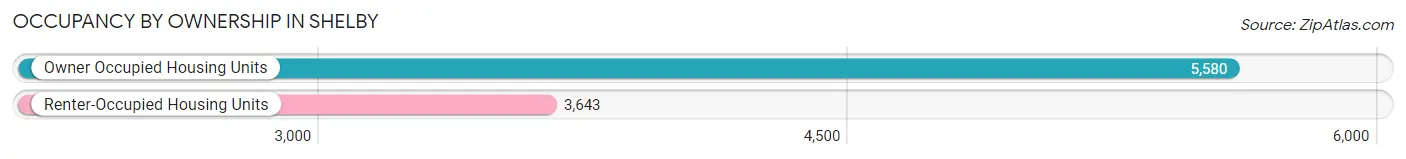
| Occupancy | # Housing Units | % Housing Units |
| Owner Occupied Housing Units | 5,580 | 60.5% |
| Renter-Occupied Housing Units | 3,643 | 39.5% |
| Total Occupied Housing Units | 9,223 | 100.0% |
Occupancy by Household Size in Shelby
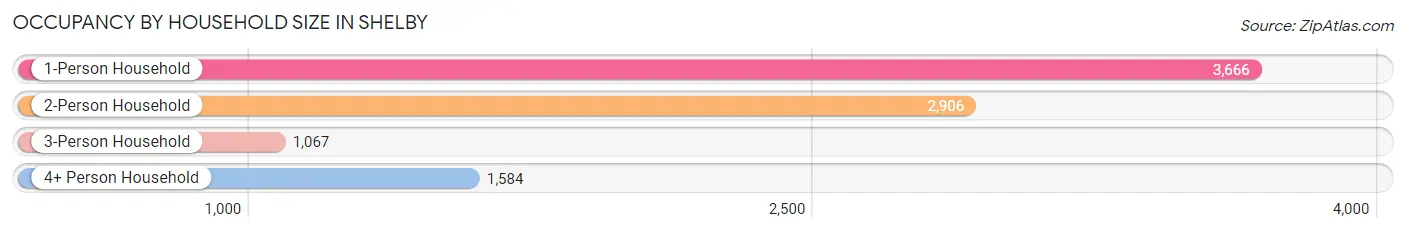
| Household Size | # Housing Units | % Housing Units |
| 1-Person Household | 3,666 | 39.8% |
| 2-Person Household | 2,906 | 31.5% |
| 3-Person Household | 1,067 | 11.6% |
| 4+ Person Household | 1,584 | 17.2% |
| Total Housing Units | 9,223 | 100.0% |
Occupancy by Ownership by Household Size in Shelby
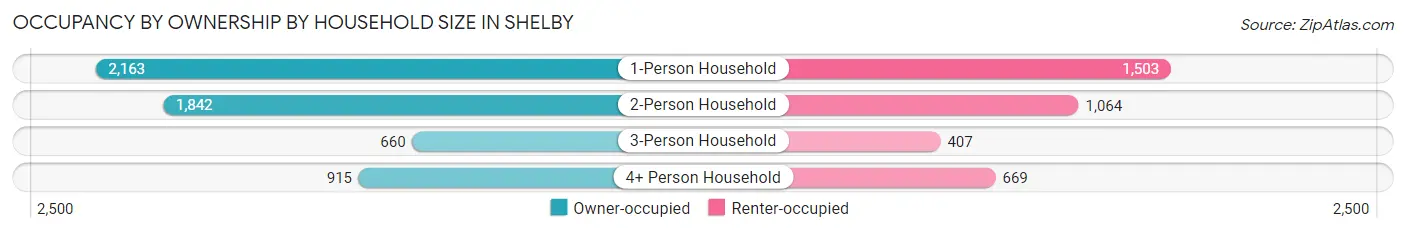
| Household Size | Owner-occupied | Renter-occupied |
| 1-Person Household | 2,163 (59.0%) | 1,503 (41.0%) |
| 2-Person Household | 1,842 (63.4%) | 1,064 (36.6%) |
| 3-Person Household | 660 (61.9%) | 407 (38.1%) |
| 4+ Person Household | 915 (57.8%) | 669 (42.2%) |
| Total Housing Units | 5,580 (60.5%) | 3,643 (39.5%) |
Occupancy by Educational Attainment in Shelby
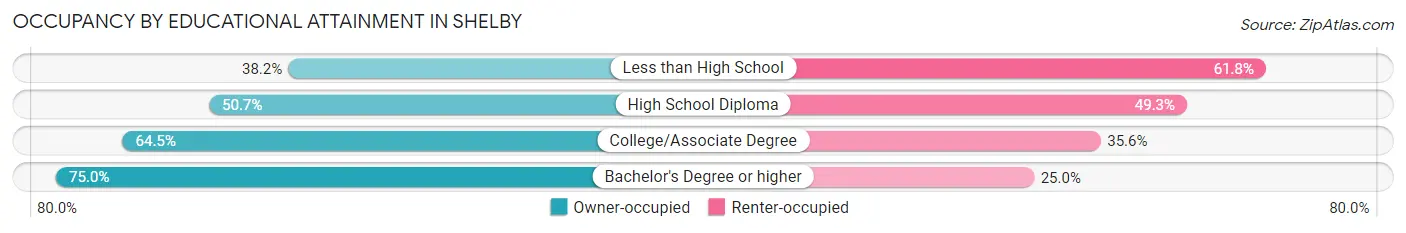
| Household Size | Owner-occupied | Renter-occupied |
| Less than High School | 381 (38.2%) | 616 (61.8%) |
| High School Diploma | 1,251 (50.7%) | 1,215 (49.3%) |
| College/Associate Degree | 2,273 (64.4%) | 1,254 (35.5%) |
| Bachelor's Degree or higher | 1,675 (75.0%) | 558 (25.0%) |
Occupancy by Age of Householder in Shelby
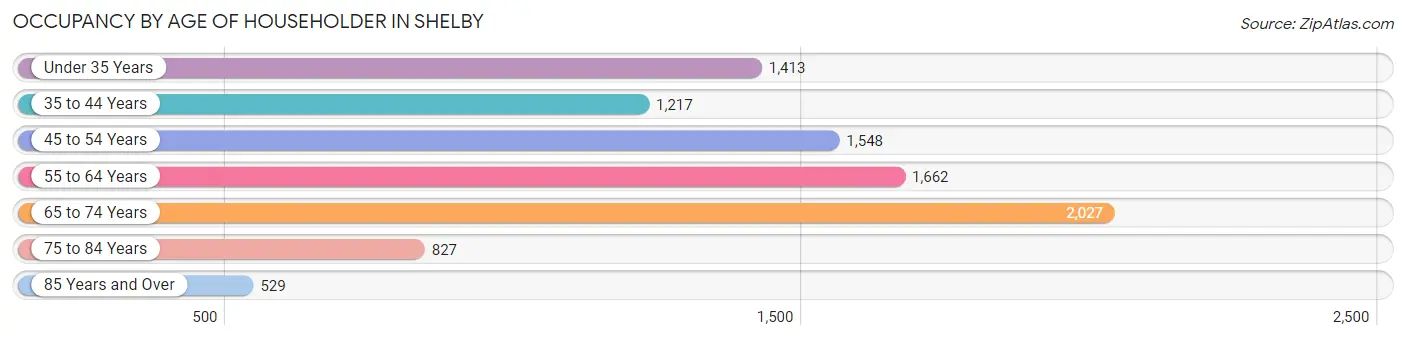
| Age Bracket | # Households | % Households |
| Under 35 Years | 1,413 | 15.3% |
| 35 to 44 Years | 1,217 | 13.2% |
| 45 to 54 Years | 1,548 | 16.8% |
| 55 to 64 Years | 1,662 | 18.0% |
| 65 to 74 Years | 2,027 | 22.0% |
| 75 to 84 Years | 827 | 9.0% |
| 85 Years and Over | 529 | 5.7% |
| Total | 9,223 | 100.0% |
Housing Finances in Shelby
Median Income by Occupancy in Shelby
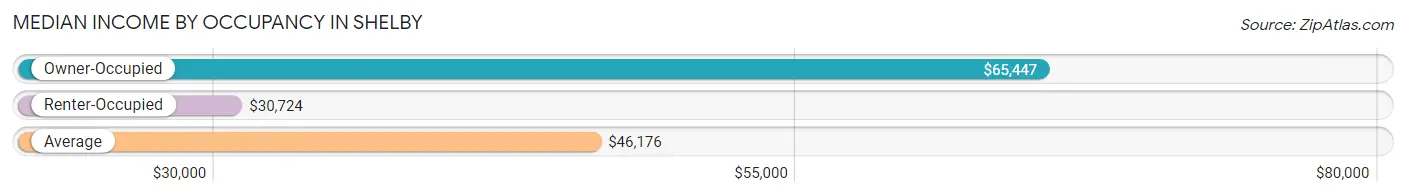
| Occupancy Type | # Households | Median Income |
| Owner-Occupied | 5,580 (60.5%) | $65,447 |
| Renter-Occupied | 3,643 (39.5%) | $30,724 |
| Average | 9,223 (100.0%) | $46,176 |
Occupancy by Householder Income Bracket in Shelby
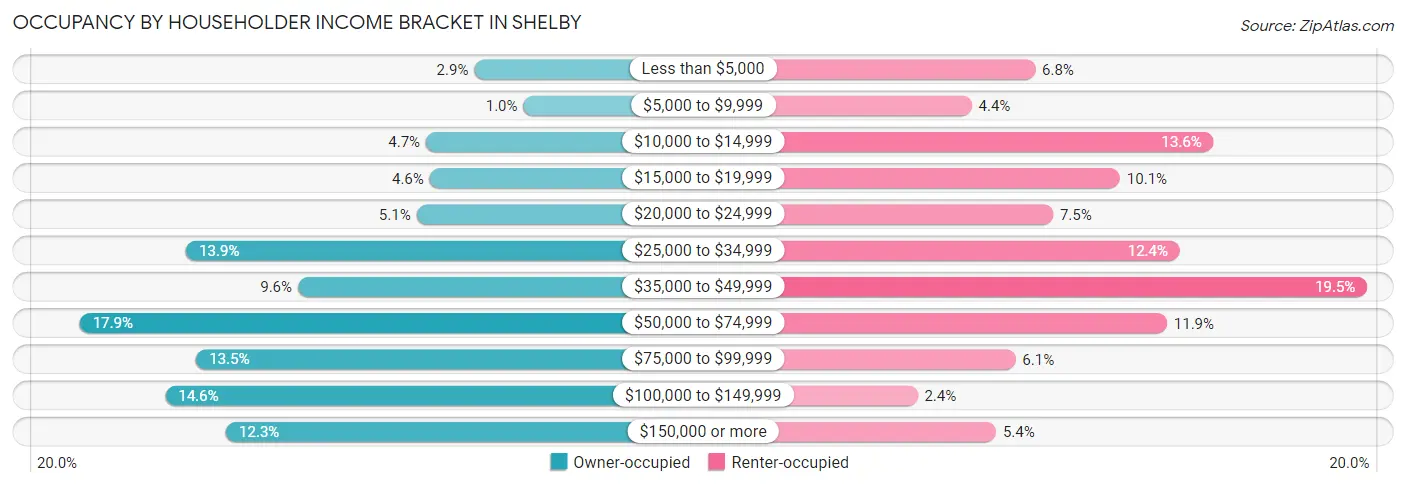
| Income Bracket | Owner-occupied | Renter-occupied |
| Less than $5,000 | 160 (2.9%) | 249 (6.8%) |
| $5,000 to $9,999 | 56 (1.0%) | 161 (4.4%) |
| $10,000 to $14,999 | 263 (4.7%) | 497 (13.6%) |
| $15,000 to $19,999 | 255 (4.6%) | 367 (10.1%) |
| $20,000 to $24,999 | 283 (5.1%) | 274 (7.5%) |
| $25,000 to $34,999 | 773 (13.9%) | 450 (12.3%) |
| $35,000 to $49,999 | 535 (9.6%) | 710 (19.5%) |
| $50,000 to $74,999 | 999 (17.9%) | 432 (11.9%) |
| $75,000 to $99,999 | 751 (13.5%) | 222 (6.1%) |
| $100,000 to $149,999 | 817 (14.6%) | 86 (2.4%) |
| $150,000 or more | 688 (12.3%) | 195 (5.3%) |
| Total | 5,580 (100.0%) | 3,643 (100.0%) |
Monthly Housing Cost Tiers in Shelby
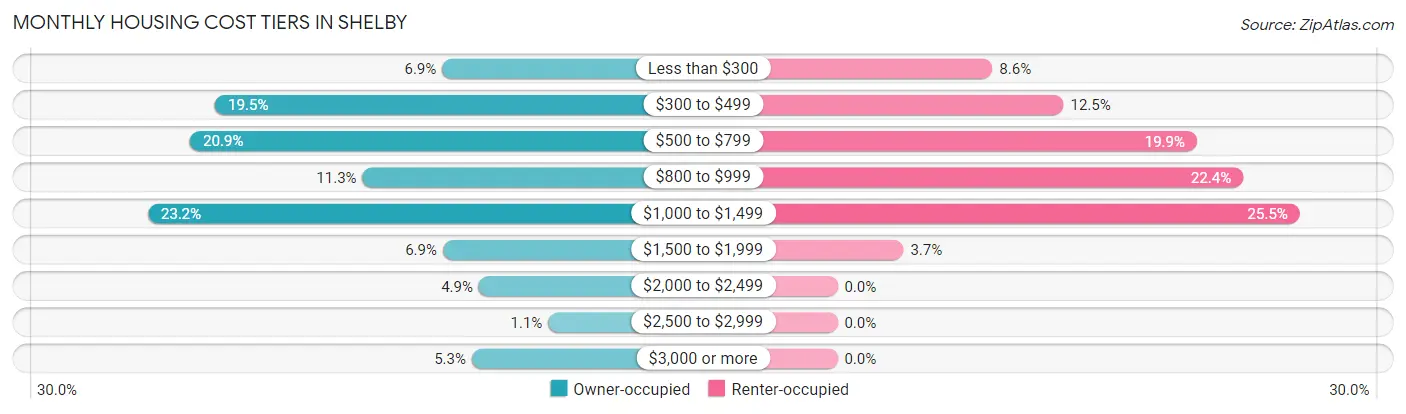
| Monthly Cost | Owner-occupied | Renter-occupied |
| Less than $300 | 387 (6.9%) | 312 (8.6%) |
| $300 to $499 | 1,087 (19.5%) | 455 (12.5%) |
| $500 to $799 | 1,164 (20.9%) | 723 (19.9%) |
| $800 to $999 | 633 (11.3%) | 816 (22.4%) |
| $1,000 to $1,499 | 1,294 (23.2%) | 930 (25.5%) |
| $1,500 to $1,999 | 385 (6.9%) | 133 (3.6%) |
| $2,000 to $2,499 | 274 (4.9%) | 0 (0.0%) |
| $2,500 to $2,999 | 60 (1.1%) | 0 (0.0%) |
| $3,000 or more | 296 (5.3%) | 0 (0.0%) |
| Total | 5,580 (100.0%) | 3,643 (100.0%) |
Physical Housing Characteristics in Shelby
Housing Structures in Shelby
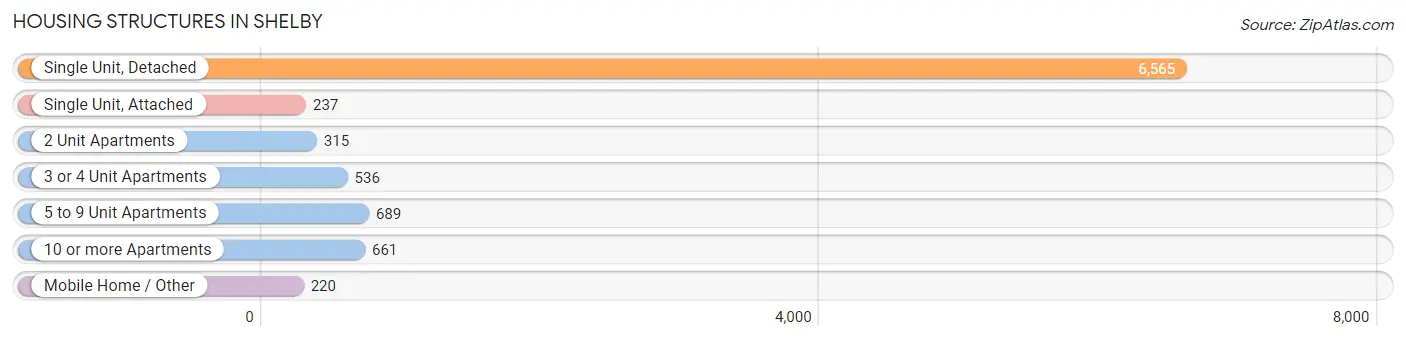
| Structure Type | # Housing Units | % Housing Units |
| Single Unit, Detached | 6,565 | 71.2% |
| Single Unit, Attached | 237 | 2.6% |
| 2 Unit Apartments | 315 | 3.4% |
| 3 or 4 Unit Apartments | 536 | 5.8% |
| 5 to 9 Unit Apartments | 689 | 7.5% |
| 10 or more Apartments | 661 | 7.2% |
| Mobile Home / Other | 220 | 2.4% |
| Total | 9,223 | 100.0% |
Housing Structures by Occupancy in Shelby
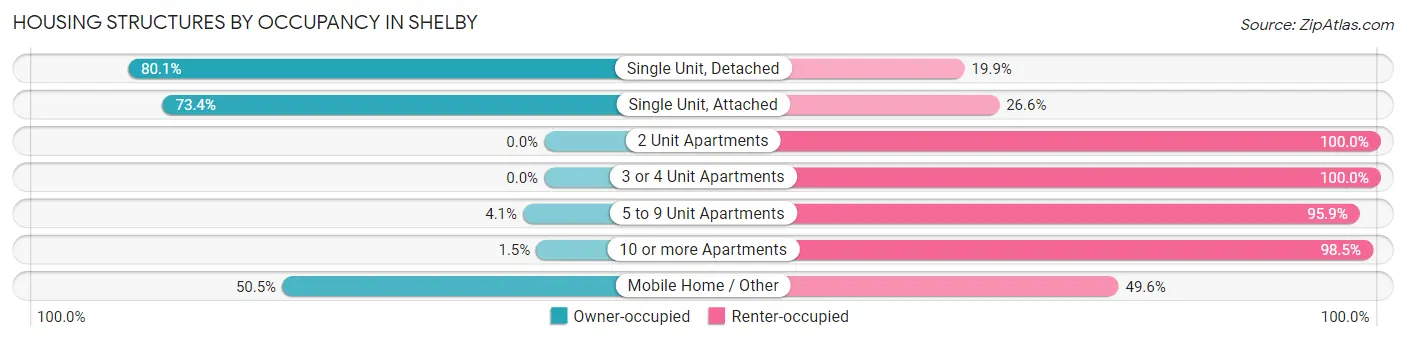
| Structure Type | Owner-occupied | Renter-occupied |
| Single Unit, Detached | 5,257 (80.1%) | 1,308 (19.9%) |
| Single Unit, Attached | 174 (73.4%) | 63 (26.6%) |
| 2 Unit Apartments | 0 (0.0%) | 315 (100.0%) |
| 3 or 4 Unit Apartments | 0 (0.0%) | 536 (100.0%) |
| 5 to 9 Unit Apartments | 28 (4.1%) | 661 (95.9%) |
| 10 or more Apartments | 10 (1.5%) | 651 (98.5%) |
| Mobile Home / Other | 111 (50.4%) | 109 (49.5%) |
| Total | 5,580 (60.5%) | 3,643 (39.5%) |
Housing Structures by Number of Rooms in Shelby
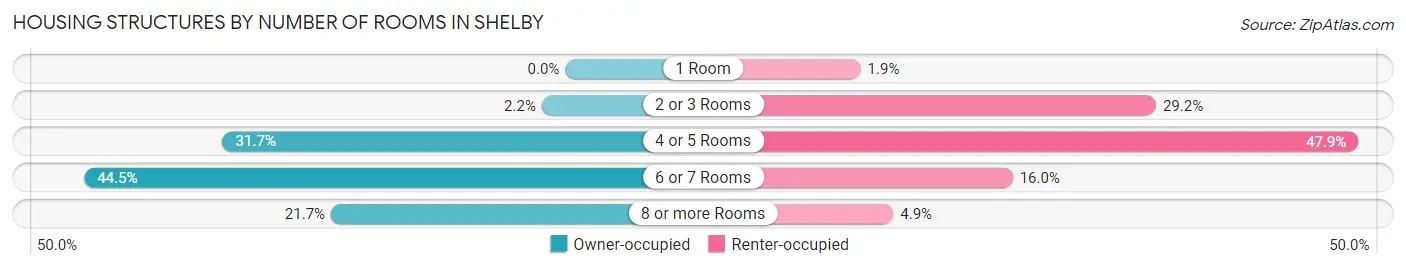
| Number of Rooms | Owner-occupied | Renter-occupied |
| 1 Room | 0 (0.0%) | 70 (1.9%) |
| 2 or 3 Rooms | 121 (2.2%) | 1,065 (29.2%) |
| 4 or 5 Rooms | 1,768 (31.7%) | 1,746 (47.9%) |
| 6 or 7 Rooms | 2,482 (44.5%) | 582 (16.0%) |
| 8 or more Rooms | 1,209 (21.7%) | 180 (4.9%) |
| Total | 5,580 (100.0%) | 3,643 (100.0%) |
Housing Structure by Heating Type in Shelby
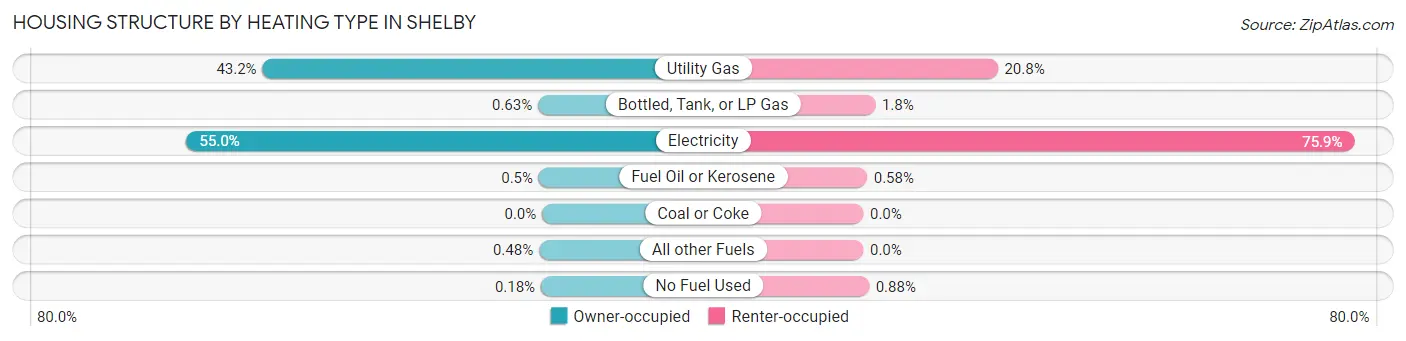
| Heating Type | Owner-occupied | Renter-occupied |
| Utility Gas | 2,412 (43.2%) | 757 (20.8%) |
| Bottled, Tank, or LP Gas | 35 (0.6%) | 67 (1.8%) |
| Electricity | 3,068 (55.0%) | 2,766 (75.9%) |
| Fuel Oil or Kerosene | 28 (0.5%) | 21 (0.6%) |
| Coal or Coke | 0 (0.0%) | 0 (0.0%) |
| All other Fuels | 27 (0.5%) | 0 (0.0%) |
| No Fuel Used | 10 (0.2%) | 32 (0.9%) |
| Total | 5,580 (100.0%) | 3,643 (100.0%) |
Household Vehicle Usage in Shelby
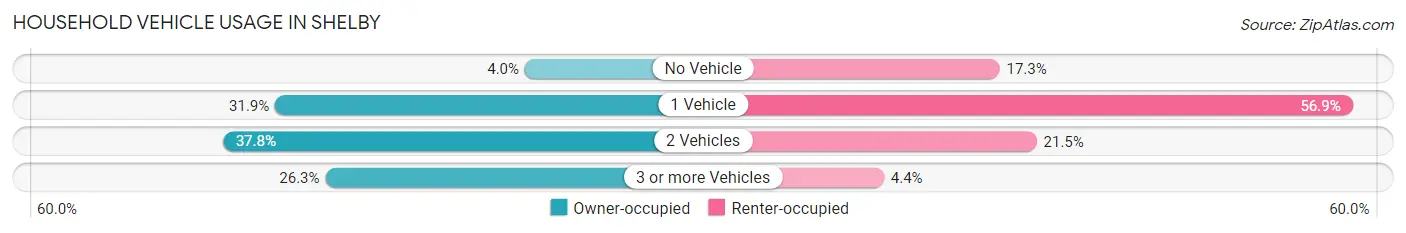
| Vehicles per Household | Owner-occupied | Renter-occupied |
| No Vehicle | 221 (4.0%) | 631 (17.3%) |
| 1 Vehicle | 1,782 (31.9%) | 2,071 (56.9%) |
| 2 Vehicles | 2,109 (37.8%) | 782 (21.5%) |
| 3 or more Vehicles | 1,468 (26.3%) | 159 (4.4%) |
| Total | 5,580 (100.0%) | 3,643 (100.0%) |
Real Estate & Mortgages in Shelby
Real Estate and Mortgage Overview in Shelby
| Characteristic | Without Mortgage | With Mortgage |
| Housing Units | 2,204 | 3,376 |
| Median Property Value | $145,000 | $155,600 |
| Median Household Income | $60,952 | $530 |
| Monthly Housing Costs | $451 | $296 |
| Real Estate Taxes | $1,194 | $96 |
Property Value by Mortgage Status in Shelby
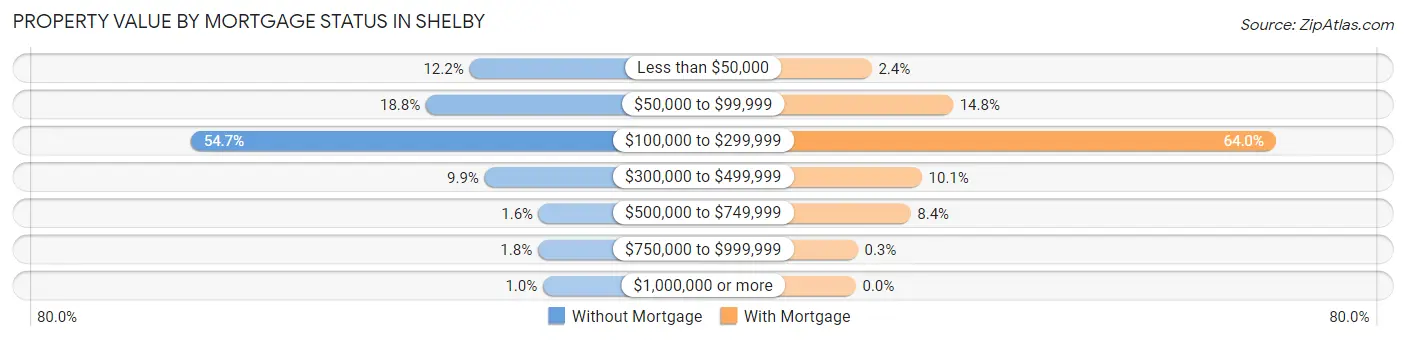
| Property Value | Without Mortgage | With Mortgage |
| Less than $50,000 | 269 (12.2%) | 82 (2.4%) |
| $50,000 to $99,999 | 415 (18.8%) | 500 (14.8%) |
| $100,000 to $299,999 | 1,205 (54.7%) | 2,162 (64.0%) |
| $300,000 to $499,999 | 218 (9.9%) | 340 (10.1%) |
| $500,000 to $749,999 | 36 (1.6%) | 282 (8.4%) |
| $750,000 to $999,999 | 39 (1.8%) | 10 (0.3%) |
| $1,000,000 or more | 22 (1.0%) | 0 (0.0%) |
| Total | 2,204 (100.0%) | 3,376 (100.0%) |
Household Income by Mortgage Status in Shelby
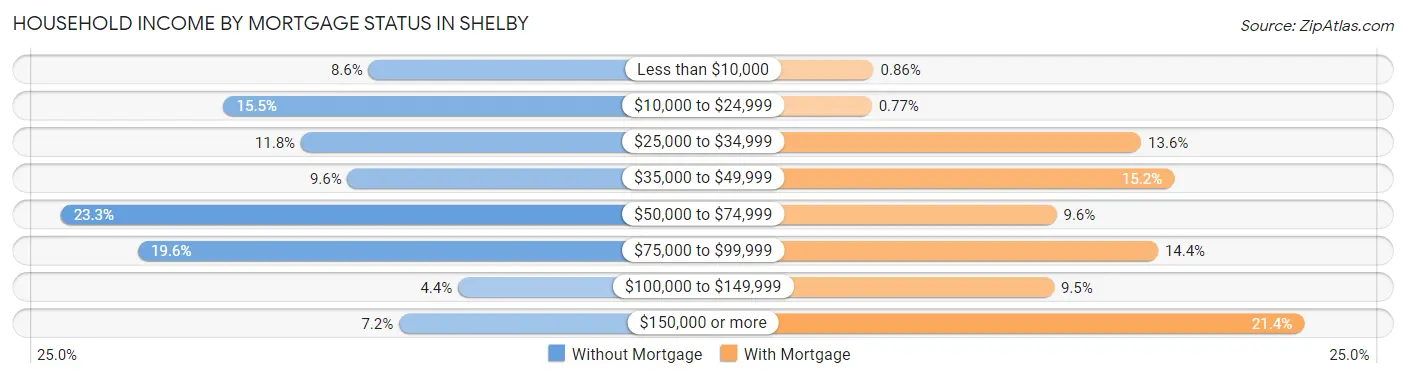
| Household Income | Without Mortgage | With Mortgage |
| Less than $10,000 | 190 (8.6%) | 29 (0.9%) |
| $10,000 to $24,999 | 342 (15.5%) | 26 (0.8%) |
| $25,000 to $34,999 | 261 (11.8%) | 459 (13.6%) |
| $35,000 to $49,999 | 212 (9.6%) | 512 (15.2%) |
| $50,000 to $74,999 | 513 (23.3%) | 323 (9.6%) |
| $75,000 to $99,999 | 432 (19.6%) | 486 (14.4%) |
| $100,000 to $149,999 | 96 (4.4%) | 319 (9.5%) |
| $150,000 or more | 158 (7.2%) | 721 (21.4%) |
| Total | 2,204 (100.0%) | 3,376 (100.0%) |
Property Value to Household Income Ratio in Shelby
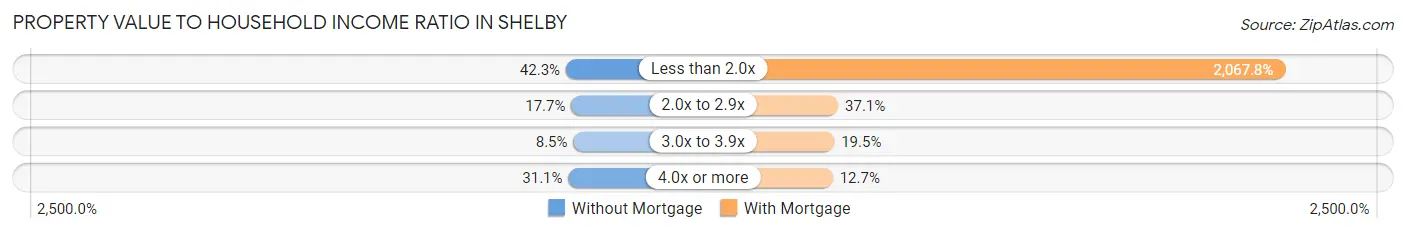
| Value-to-Income Ratio | Without Mortgage | With Mortgage |
| Less than 2.0x | 933 (42.3%) | 69,808 (2,067.8%) |
| 2.0x to 2.9x | 389 (17.6%) | 1,253 (37.1%) |
| 3.0x to 3.9x | 187 (8.5%) | 659 (19.5%) |
| 4.0x or more | 685 (31.1%) | 429 (12.7%) |
| Total | 2,204 (100.0%) | 3,376 (100.0%) |
Real Estate Taxes by Mortgage Status in Shelby
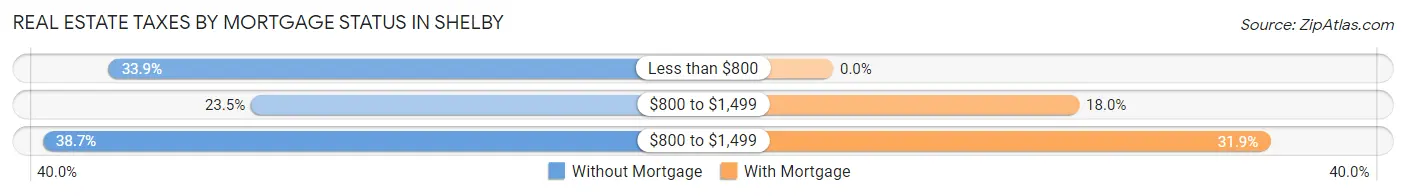
| Property Taxes | Without Mortgage | With Mortgage |
| Less than $800 | 746 (33.9%) | 0 (0.0%) |
| $800 to $1,499 | 517 (23.5%) | 607 (18.0%) |
| $800 to $1,499 | 852 (38.7%) | 1,078 (31.9%) |
| Total | 2,204 (100.0%) | 3,376 (100.0%) |
Health & Disability in Shelby
Health Insurance Coverage by Age in Shelby
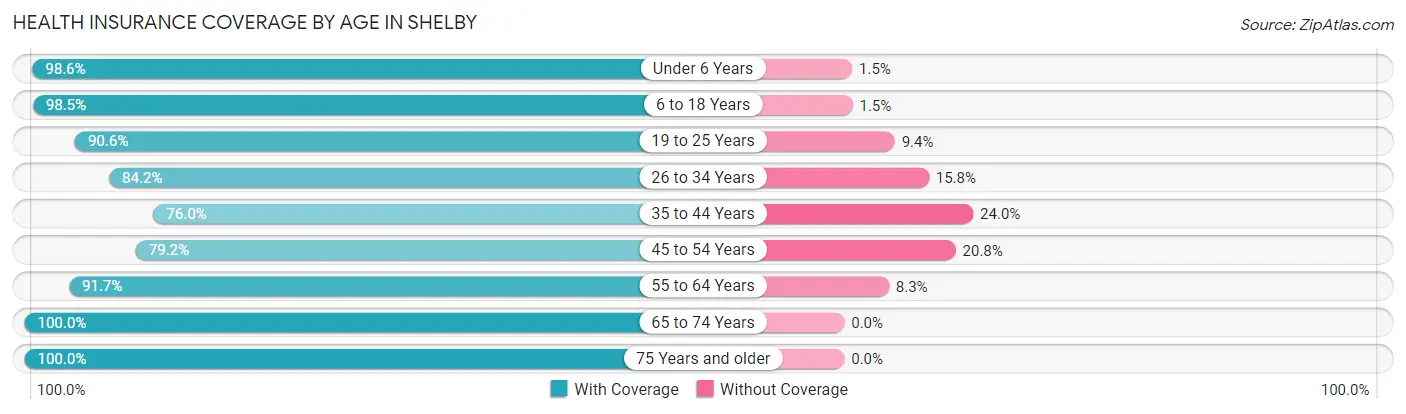
| Age Bracket | With Coverage | Without Coverage |
| Under 6 Years | 1,153 (98.6%) | 17 (1.5%) |
| 6 to 18 Years | 3,984 (98.5%) | 62 (1.5%) |
| 19 to 25 Years | 1,079 (90.6%) | 112 (9.4%) |
| 26 to 34 Years | 1,897 (84.2%) | 355 (15.8%) |
| 35 to 44 Years | 1,846 (76.0%) | 584 (24.0%) |
| 45 to 54 Years | 2,172 (79.2%) | 569 (20.8%) |
| 55 to 64 Years | 2,614 (91.7%) | 237 (8.3%) |
| 65 to 74 Years | 2,896 (100.0%) | 0 (0.0%) |
| 75 Years and older | 1,967 (100.0%) | 0 (0.0%) |
| Total | 19,608 (91.0%) | 1,936 (9.0%) |
Health Insurance Coverage by Citizenship Status in Shelby
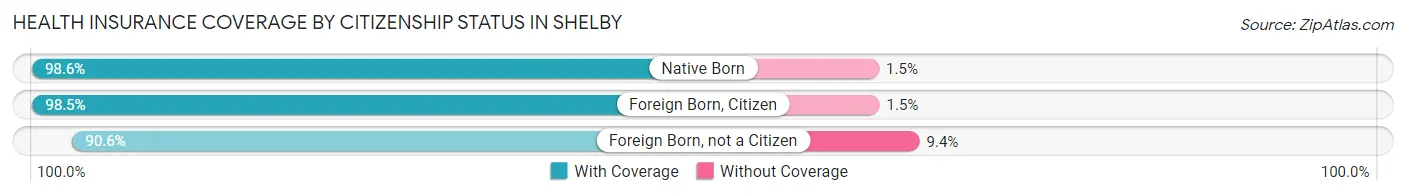
| Citizenship Status | With Coverage | Without Coverage |
| Native Born | 1,153 (98.6%) | 17 (1.5%) |
| Foreign Born, Citizen | 3,984 (98.5%) | 62 (1.5%) |
| Foreign Born, not a Citizen | 1,079 (90.6%) | 112 (9.4%) |
Health Insurance Coverage by Household Income in Shelby
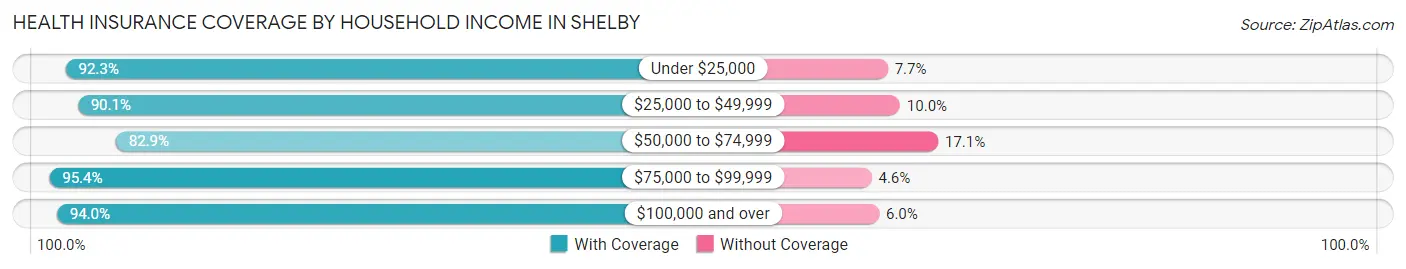
| Household Income | With Coverage | Without Coverage |
| Under $25,000 | 3,898 (92.3%) | 324 (7.7%) |
| $25,000 to $49,999 | 5,422 (90.0%) | 599 (10.0%) |
| $50,000 to $74,999 | 2,795 (82.9%) | 576 (17.1%) |
| $75,000 to $99,999 | 2,287 (95.4%) | 111 (4.6%) |
| $100,000 and over | 5,075 (94.0%) | 326 (6.0%) |
Public vs Private Health Insurance Coverage by Age in Shelby
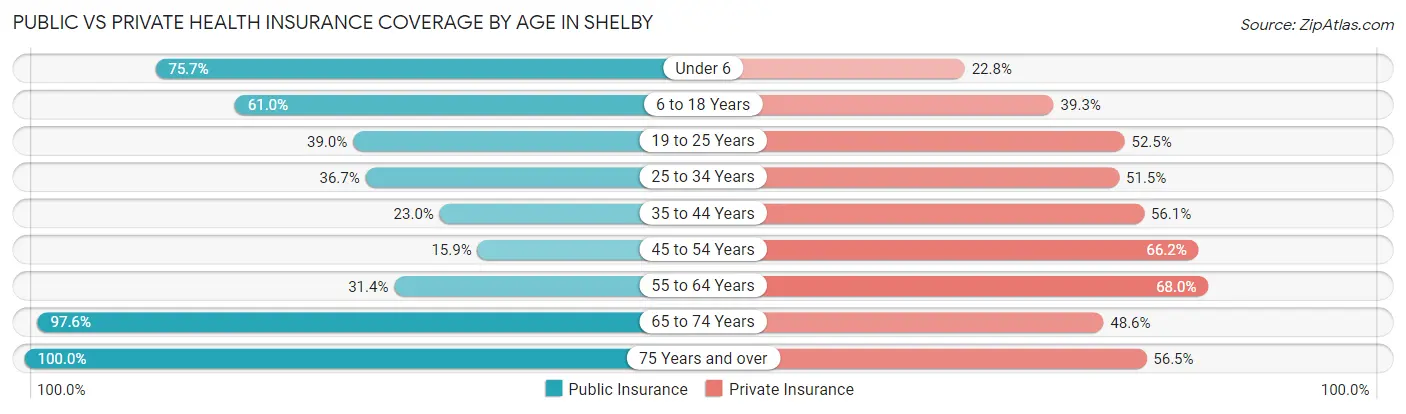
| Age Bracket | Public Insurance | Private Insurance |
| Under 6 | 886 (75.7%) | 267 (22.8%) |
| 6 to 18 Years | 2,467 (61.0%) | 1,591 (39.3%) |
| 19 to 25 Years | 465 (39.0%) | 625 (52.5%) |
| 25 to 34 Years | 827 (36.7%) | 1,159 (51.5%) |
| 35 to 44 Years | 558 (23.0%) | 1,363 (56.1%) |
| 45 to 54 Years | 437 (15.9%) | 1,815 (66.2%) |
| 55 to 64 Years | 895 (31.4%) | 1,939 (68.0%) |
| 65 to 74 Years | 2,826 (97.6%) | 1,406 (48.5%) |
| 75 Years and over | 1,967 (100.0%) | 1,112 (56.5%) |
| Total | 11,328 (52.6%) | 11,277 (52.3%) |
Disability Status by Sex by Age in Shelby
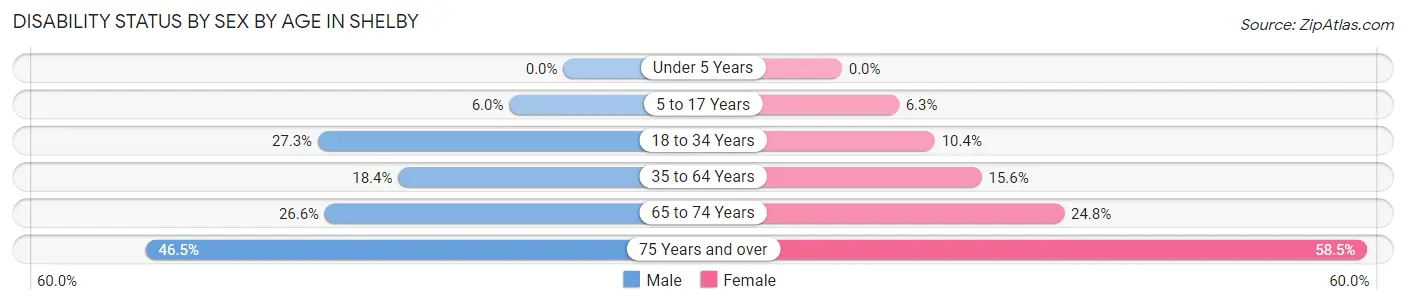
| Age Bracket | Male | Female |
| Under 5 Years | 0 (0.0%) | 0 (0.0%) |
| 5 to 17 Years | 123 (6.0%) | 121 (6.3%) |
| 18 to 34 Years | 439 (27.3%) | 220 (10.3%) |
| 35 to 64 Years | 689 (18.4%) | 665 (15.6%) |
| 65 to 74 Years | 299 (26.6%) | 438 (24.7%) |
| 75 Years and over | 361 (46.5%) | 697 (58.5%) |
Disability Class by Sex by Age in Shelby
Disability Class: Hearing Difficulty
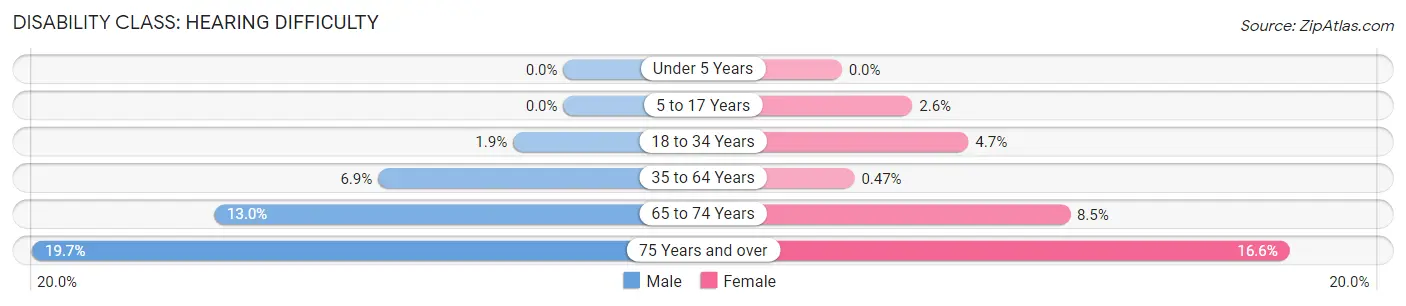
| Age Bracket | Male | Female |
| Under 5 Years | 0 (0.0%) | 0 (0.0%) |
| 5 to 17 Years | 0 (0.0%) | 50 (2.6%) |
| 18 to 34 Years | 30 (1.9%) | 100 (4.7%) |
| 35 to 64 Years | 258 (6.9%) | 20 (0.5%) |
| 65 to 74 Years | 146 (13.0%) | 150 (8.5%) |
| 75 Years and over | 153 (19.7%) | 198 (16.6%) |
Disability Class: Vision Difficulty
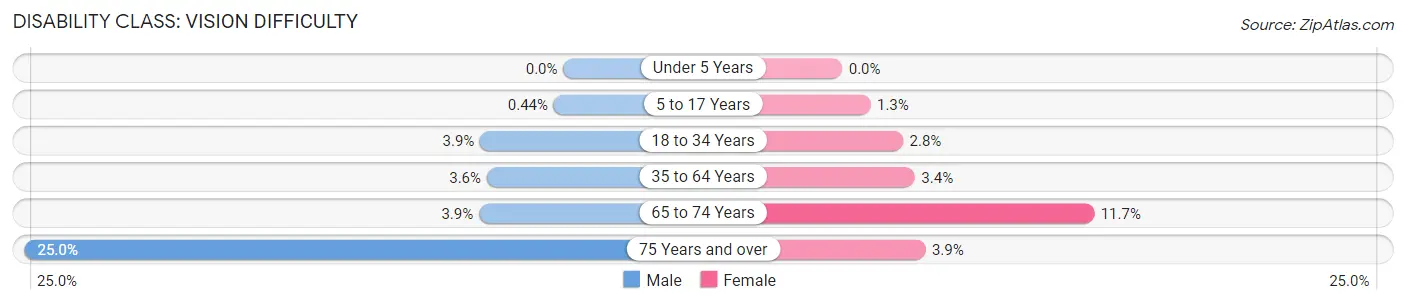
| Age Bracket | Male | Female |
| Under 5 Years | 0 (0.0%) | 0 (0.0%) |
| 5 to 17 Years | 9 (0.4%) | 25 (1.3%) |
| 18 to 34 Years | 62 (3.9%) | 60 (2.8%) |
| 35 to 64 Years | 133 (3.5%) | 144 (3.4%) |
| 65 to 74 Years | 44 (3.9%) | 207 (11.7%) |
| 75 Years and over | 194 (25.0%) | 46 (3.9%) |
Disability Class: Cognitive Difficulty
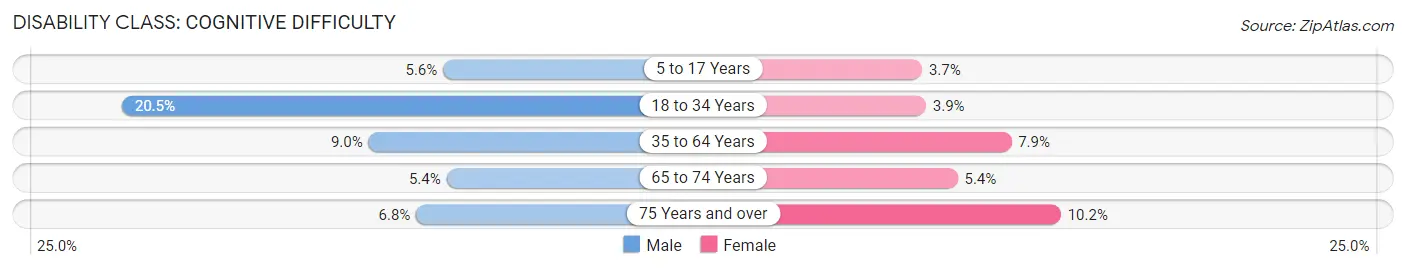
| Age Bracket | Male | Female |
| 5 to 17 Years | 114 (5.6%) | 71 (3.7%) |
| 18 to 34 Years | 329 (20.5%) | 83 (3.9%) |
| 35 to 64 Years | 339 (9.0%) | 336 (7.9%) |
| 65 to 74 Years | 61 (5.4%) | 95 (5.4%) |
| 75 Years and over | 53 (6.8%) | 121 (10.2%) |
Disability Class: Ambulatory Difficulty
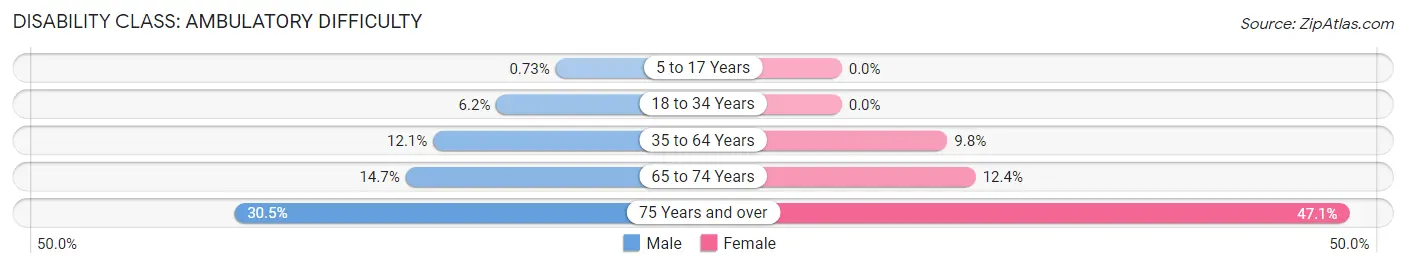
| Age Bracket | Male | Female |
| 5 to 17 Years | 15 (0.7%) | 0 (0.0%) |
| 18 to 34 Years | 100 (6.2%) | 0 (0.0%) |
| 35 to 64 Years | 453 (12.1%) | 419 (9.8%) |
| 65 to 74 Years | 165 (14.6%) | 220 (12.4%) |
| 75 Years and over | 237 (30.5%) | 561 (47.1%) |
Disability Class: Self-Care Difficulty
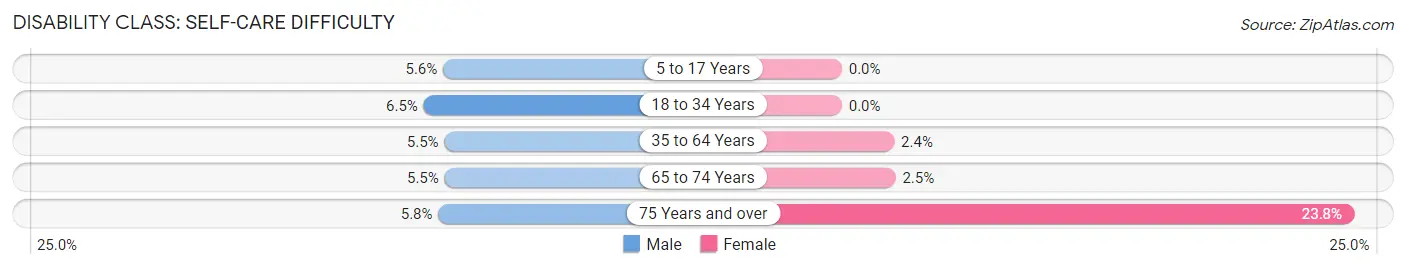
| Age Bracket | Male | Female |
| 5 to 17 Years | 114 (5.6%) | 0 (0.0%) |
| 18 to 34 Years | 104 (6.5%) | 0 (0.0%) |
| 35 to 64 Years | 207 (5.5%) | 104 (2.4%) |
| 65 to 74 Years | 62 (5.5%) | 44 (2.5%) |
| 75 Years and over | 45 (5.8%) | 283 (23.8%) |
Technology Access in Shelby
Computing Device Access in Shelby
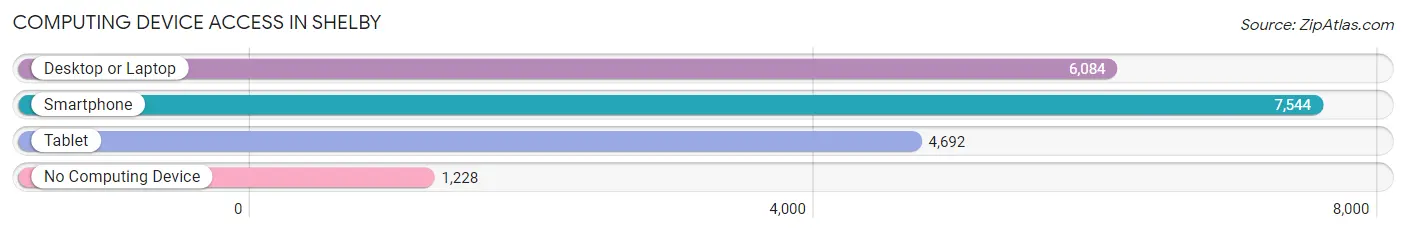
| Device Type | # Households | % Households |
| Desktop or Laptop | 6,084 | 66.0% |
| Smartphone | 7,544 | 81.8% |
| Tablet | 4,692 | 50.9% |
| No Computing Device | 1,228 | 13.3% |
| Total | 9,223 | 100.0% |
Internet Access in Shelby
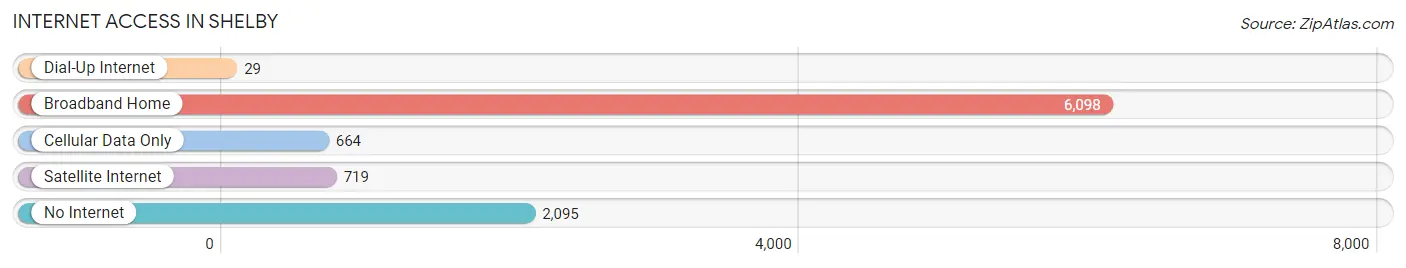
| Internet Type | # Households | % Households |
| Dial-Up Internet | 29 | 0.3% |
| Broadband Home | 6,098 | 66.1% |
| Cellular Data Only | 664 | 7.2% |
| Satellite Internet | 719 | 7.8% |
| No Internet | 2,095 | 22.7% |
| Total | 9,223 | 100.0% |
Shelby Summary
Shelby, North Carolina is a city located in Cleveland County, in the foothills of the Blue Ridge Mountains. It is the county seat of Cleveland County and is located approximately 45 miles west of Charlotte. The city has a population of approximately 20,000 people and is the largest city in the county.
History
Shelby was founded in 1841 by Colonel William Hardin. He named the city after his wife, Shelby Hardin. The city was incorporated in 1843 and was named the county seat of Cleveland County in 1845.
The city was a major center of the textile industry in the late 19th and early 20th centuries. The city was also home to the first cotton mill in the state of North Carolina. The city was also home to the first cotton gin in the state.
The city was also home to the first public library in the state, which was established in 1887. The library was funded by a grant from Andrew Carnegie.
The city was also home to the first hospital in the state, which was established in 1891. The hospital was funded by a grant from the Rockefeller Foundation.
The city was also home to the first college in the state, which was established in 1892. The college was funded by a grant from the Peabody Education Fund.
The city was also home to the first public school in the state, which was established in 1895. The school was funded by a grant from the Julius Rosenwald Fund.
Geography
Shelby is located in the foothills of the Blue Ridge Mountains in western North Carolina. The city is located at the intersection of US Highway 74 and US Highway 321. The city is located approximately 45 miles west of Charlotte.
The city is located in a hilly area and is surrounded by forests and rolling hills. The city is located at an elevation of 890 feet above sea level.
Economy
Shelby is a major center of the textile industry in the region. The city is home to several large textile mills, including the Shelby Cotton Mill, which is the largest cotton mill in the state. The city is also home to several other textile-related businesses, including yarn and fabric manufacturers.
The city is also home to several other industries, including furniture manufacturing, automotive parts manufacturing, and food processing. The city is also home to several retail stores, including a Walmart Supercenter.
Demographics
As of the 2010 census, the population of Shelby was 20,323. The racial makeup of the city was 79.3% White, 16.2% African American, 0.3% Native American, 0.7% Asian, 0.1% Pacific Islander, 1.7% from other races, and 1.9% from two or more races. Hispanic or Latino of any race were 4.2% of the population.
The median income for a household in the city was $30,945, and the median income for a family was $37,945. The per capita income for the city was $17,845. About 17.2% of families and 20.3% of the population were below the poverty line, including 28.2% of those under age 18 and 14.2% of those age 65 or over.
Common Questions
What is the Total Population of Shelby?
Total Population of Shelby is 21,712.
What is the Total Male Population of Shelby?
Total Male Population of Shelby is 9,957.
What is the Total Female Population of Shelby?
Total Female Population of Shelby is 11,755.
What is the Ratio of Males per 100 Females in Shelby?
There are 84.70 Males per 100 Females in Shelby.
What is the Ratio of Females per 100 Males in Shelby?
There are 118.06 Females per 100 Males in Shelby.
What is the Median Population Age in Shelby?
Median Population Age in Shelby is 43.4 Years.
What is the Average Family Size in Shelby
Average Family Size in Shelby is 3.1 People.
What is the Average Household Size in Shelby
Average Household Size in Shelby is 2.3 People.
What is Per Capita Income in Shelby?
Per Capita income in Shelby is $28,414.
What is the Median Family Income in Shelby?
Median Family Income in Shelby is $63,682.
What is the Median Household income in Shelby?
Median Household Income in Shelby is $46,176.
What is Income or Wage Gap in Shelby?
Income or Wage Gap in Shelby is 22.1%.
Women in Shelby earn 77.9 cents for every dollar earned by a man.
What is Family Income Deficit in Shelby?
Family Income Deficit in Shelby is $11,931.
Families that are below poverty line in Shelby earn $11,931 less on average than the poverty threshold level.
What is Inequality or Gini Index in Shelby?
Inequality or Gini Index in Shelby is 0.47.
How Large is the Labor Force in Shelby?
There are 9,778 People in the Labor Forcein in Shelby.
What is the Percentage of People in the Labor Force in Shelby?
55.4% of People are in the Labor Force in Shelby.
What is the Unemployment Rate in Shelby?
Unemployment Rate in Shelby is 3.7%.