Clinton, NC
Clinton Map
Clinton Overview
8,362
TOTAL POPULATION
4,123
MALE POPULATION
4,239
FEMALE POPULATION
97.26
MALES / 100 FEMALES
102.81
FEMALES / 100 MALES
41.8
MEDIAN AGE
3.7
AVG FAMILY SIZE
2.6
AVG HOUSEHOLD SIZE
$24,421
PER CAPITA INCOME
$60,106
AVG FAMILY INCOME
$38,880
AVG HOUSEHOLD INCOME
3.3%
WAGE / INCOME GAP [ % ]
96.7¢/ $1
WAGE / INCOME GAP [ $ ]
0.53
INEQUALITY / GINI INDEX
3,123
LABOR FORCE [ PEOPLE ]
46.7%
PERCENT IN LABOR FORCE
4.6%
UNEMPLOYMENT RATE
Clinton Zip Codes
Clinton Area Codes
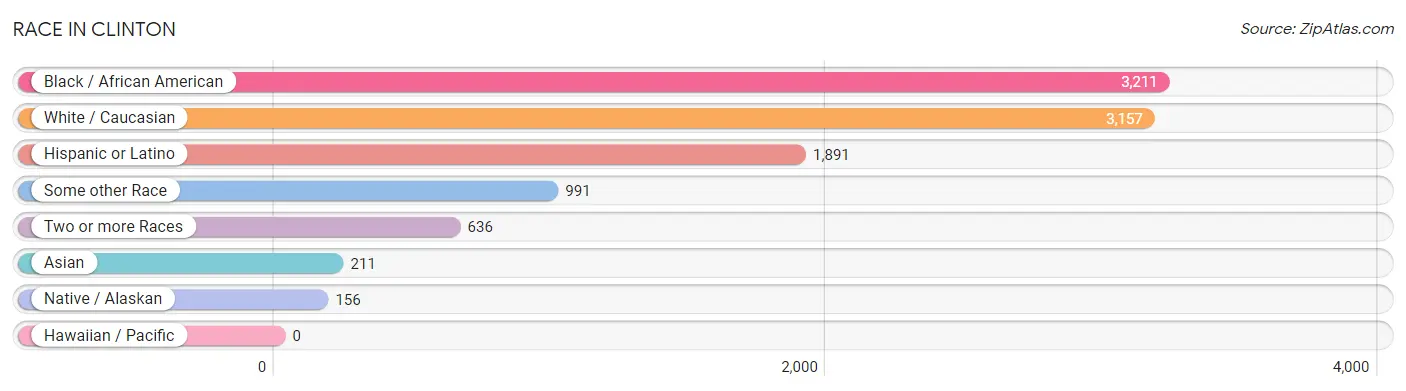
Race in Clinton
The most populous races in Clinton are Black / African American (3,211 | 38.4%), White / Caucasian (3,157 | 37.8%), and Hispanic or Latino (1,891 | 22.6%).
| Race | # Population | % Population |
| Asian | 211 | 2.5% |
| Black / African American | 3,211 | 38.4% |
| Hawaiian / Pacific | 0 | 0.0% |
| Hispanic or Latino | 1,891 | 22.6% |
| Native / Alaskan | 156 | 1.9% |
| White / Caucasian | 3,157 | 37.8% |
| Two or more Races | 636 | 7.6% |
| Some other Race | 991 | 11.8% |
| Total | 8,362 | 100.0% |
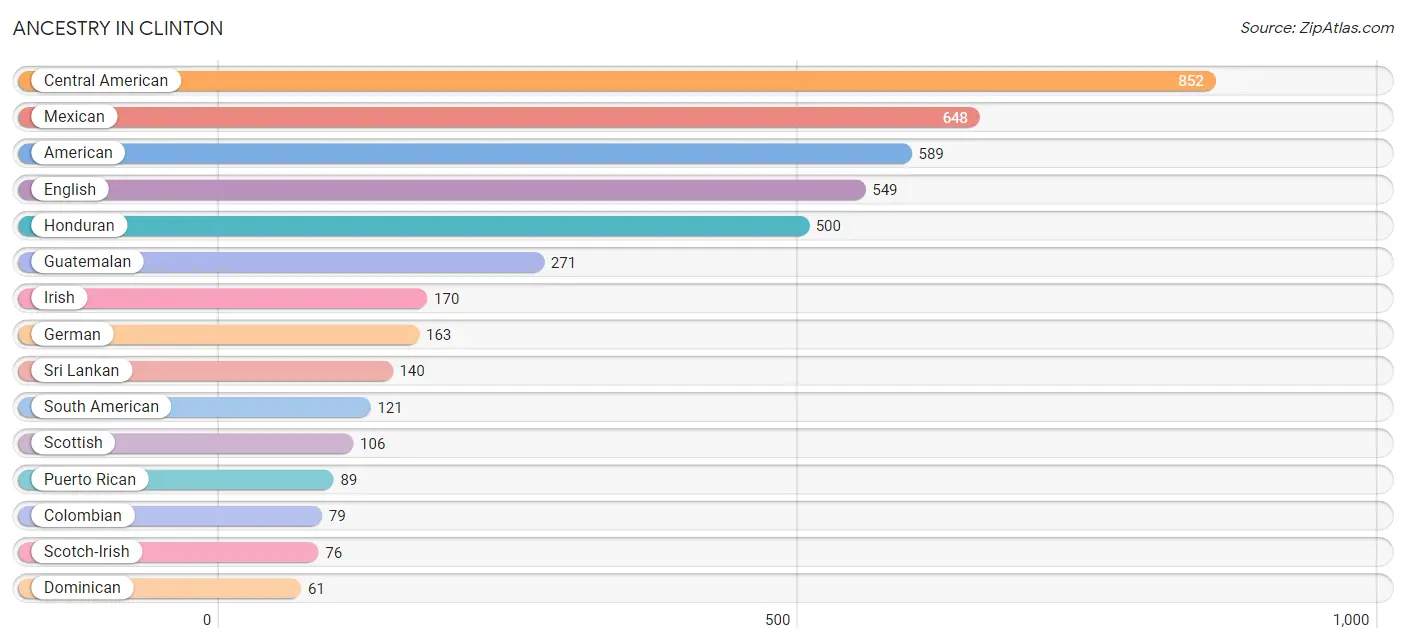
Ancestry in Clinton
The most populous ancestries reported in Clinton are Central American (852 | 10.2%), Mexican (648 | 7.7%), American (589 | 7.0%), English (549 | 6.6%), and Honduran (500 | 6.0%), together accounting for 37.5% of all Clinton residents.
| Ancestry | # Population | % Population |
| American | 589 | 7.0% |
| Arab | 8 | 0.1% |
| Belgian | 2 | 0.0% |
| Bhutanese | 2 | 0.0% |
| Blackfeet | 9 | 0.1% |
| British | 25 | 0.3% |
| Burmese | 8 | 0.1% |
| Central American | 852 | 10.2% |
| Cherokee | 8 | 0.1% |
| Colombian | 79 | 0.9% |
| Cuban | 4 | 0.1% |
| Dominican | 61 | 0.7% |
| Dutch | 9 | 0.1% |
| Eastern European | 3 | 0.0% |
| Ecuadorian | 2 | 0.0% |
| English | 549 | 6.6% |
| European | 41 | 0.5% |
| French | 35 | 0.4% |
| French Canadian | 4 | 0.1% |
| German | 163 | 1.9% |
| Greek | 2 | 0.0% |
| Guatemalan | 271 | 3.2% |
| Guyanese | 19 | 0.2% |
| Haitian | 37 | 0.4% |
| Honduran | 500 | 6.0% |
| Hungarian | 3 | 0.0% |
| Indian (Asian) | 33 | 0.4% |
| Irish | 170 | 2.0% |
| Italian | 25 | 0.3% |
| Jamaican | 9 | 0.1% |
| Korean | 7 | 0.1% |
| Lebanese | 8 | 0.1% |
| Lithuanian | 2 | 0.0% |
| Lumbee | 17 | 0.2% |
| Mexican | 648 | 7.7% |
| Mexican American Indian | 29 | 0.4% |
| Nicaraguan | 32 | 0.4% |
| Nigerian | 3 | 0.0% |
| Northern European | 12 | 0.1% |
| Norwegian | 7 | 0.1% |
| Peruvian | 18 | 0.2% |
| Polish | 43 | 0.5% |
| Puerto Rican | 89 | 1.1% |
| Salvadoran | 49 | 0.6% |
| Scandinavian | 2 | 0.0% |
| Scotch-Irish | 76 | 0.9% |
| Scottish | 106 | 1.3% |
| Shoshone | 49 | 0.6% |
| Slovak | 2 | 0.0% |
| South American | 121 | 1.5% |
| Spaniard | 19 | 0.2% |
| Spanish | 26 | 0.3% |
| Sri Lankan | 140 | 1.7% |
| Subsaharan African | 3 | 0.0% |
| Thai | 48 | 0.6% |
| Venezuelan | 22 | 0.3% |
| Welsh | 21 | 0.3% |
| West Indian | 18 | 0.2% | View All 58 Rows |
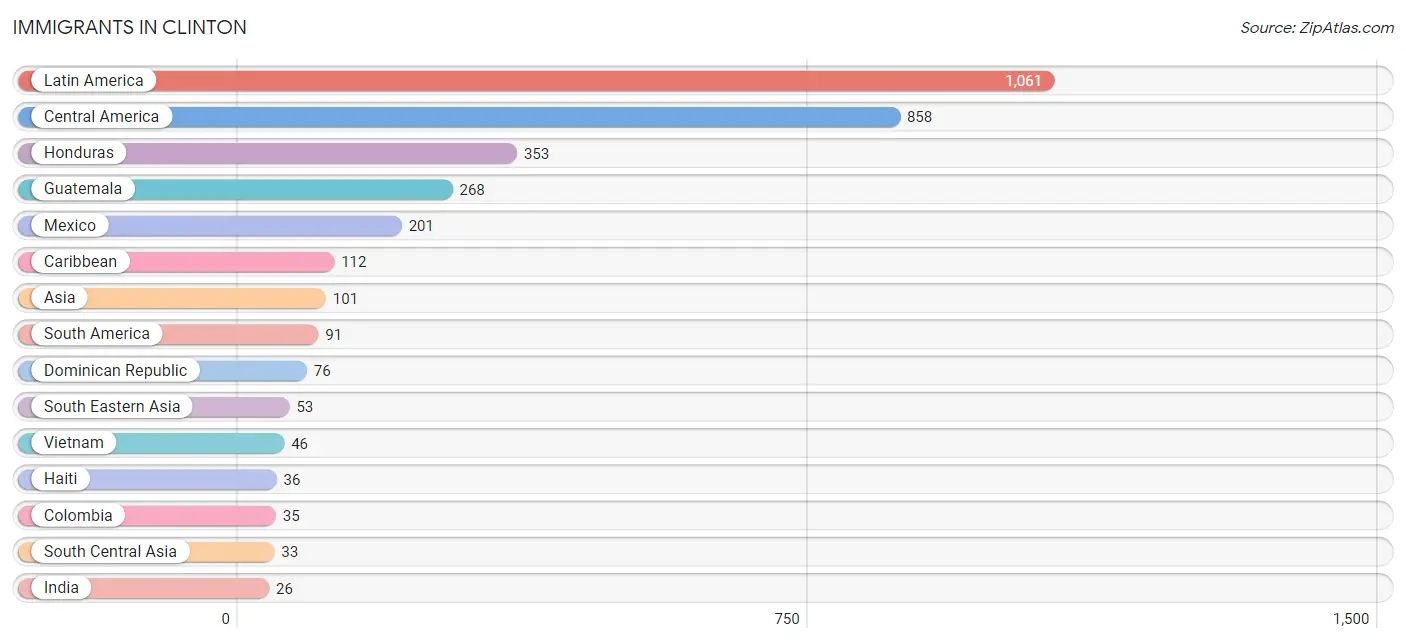
Immigrants in Clinton
The most numerous immigrant groups reported in Clinton came from Latin America (1,061 | 12.7%), Central America (858 | 10.3%), Honduras (353 | 4.2%), Guatemala (268 | 3.2%), and Mexico (201 | 2.4%), together accounting for 32.8% of all Clinton residents.
| Immigration Origin | # Population | % Population |
| Africa | 7 | 0.1% |
| Asia | 101 | 1.2% |
| Brazil | 3 | 0.0% |
| Caribbean | 112 | 1.3% |
| Central America | 858 | 10.3% |
| China | 11 | 0.1% |
| Colombia | 35 | 0.4% |
| Dominican Republic | 76 | 0.9% |
| Eastern Africa | 7 | 0.1% |
| Eastern Asia | 15 | 0.2% |
| Ecuador | 2 | 0.0% |
| El Salvador | 13 | 0.2% |
| Europe | 1 | 0.0% |
| Germany | 1 | 0.0% |
| Guatemala | 268 | 3.2% |
| Guyana | 19 | 0.2% |
| Haiti | 36 | 0.4% |
| Honduras | 353 | 4.2% |
| India | 26 | 0.3% |
| Japan | 2 | 0.0% |
| Korea | 2 | 0.0% |
| Latin America | 1,061 | 12.7% |
| Mexico | 201 | 2.4% |
| Nepal | 7 | 0.1% |
| Nicaragua | 23 | 0.3% |
| Peru | 12 | 0.1% |
| Philippines | 7 | 0.1% |
| South America | 91 | 1.1% |
| South Central Asia | 33 | 0.4% |
| South Eastern Asia | 53 | 0.6% |
| Taiwan | 2 | 0.0% |
| Venezuela | 20 | 0.2% |
| Vietnam | 46 | 0.5% |
| Western Europe | 1 | 0.0% | View All 34 Rows |
Sex and Age in Clinton
Sex and Age in Clinton
The most populous age groups in Clinton are 10 to 14 Years (351 | 8.5%) for men and 65 to 69 Years (539 | 12.7%) for women.
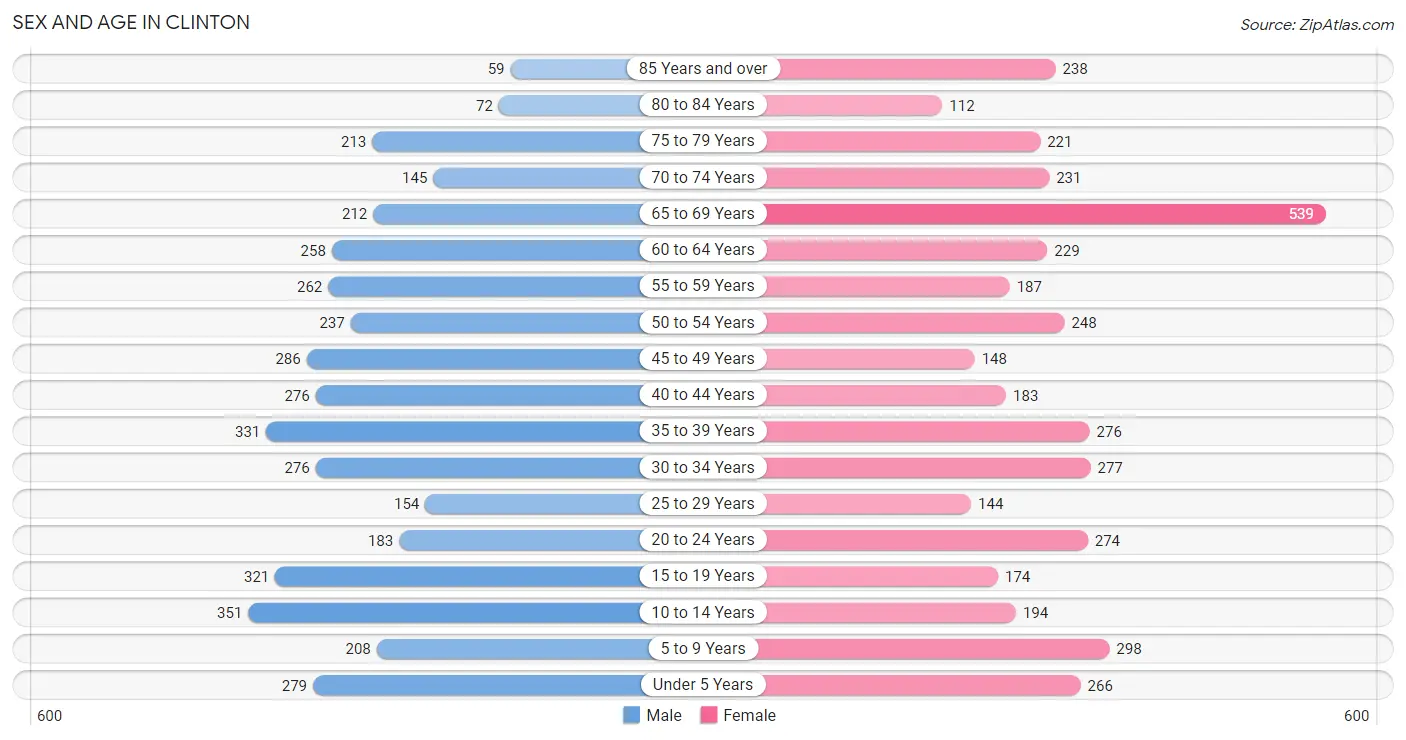
| Age Bracket | Male | Female |
| Under 5 Years | 279 (6.8%) | 266 (6.3%) |
| 5 to 9 Years | 208 (5.0%) | 298 (7.0%) |
| 10 to 14 Years | 351 (8.5%) | 194 (4.6%) |
| 15 to 19 Years | 321 (7.8%) | 174 (4.1%) |
| 20 to 24 Years | 183 (4.4%) | 274 (6.5%) |
| 25 to 29 Years | 154 (3.7%) | 144 (3.4%) |
| 30 to 34 Years | 276 (6.7%) | 277 (6.5%) |
| 35 to 39 Years | 331 (8.0%) | 276 (6.5%) |
| 40 to 44 Years | 276 (6.7%) | 183 (4.3%) |
| 45 to 49 Years | 286 (6.9%) | 148 (3.5%) |
| 50 to 54 Years | 237 (5.8%) | 248 (5.9%) |
| 55 to 59 Years | 262 (6.4%) | 187 (4.4%) |
| 60 to 64 Years | 258 (6.3%) | 229 (5.4%) |
| 65 to 69 Years | 212 (5.1%) | 539 (12.7%) |
| 70 to 74 Years | 145 (3.5%) | 231 (5.4%) |
| 75 to 79 Years | 213 (5.2%) | 221 (5.2%) |
| 80 to 84 Years | 72 (1.8%) | 112 (2.6%) |
| 85 Years and over | 59 (1.4%) | 238 (5.6%) |
| Total | 4,123 (100.0%) | 4,239 (100.0%) |
Families and Households in Clinton
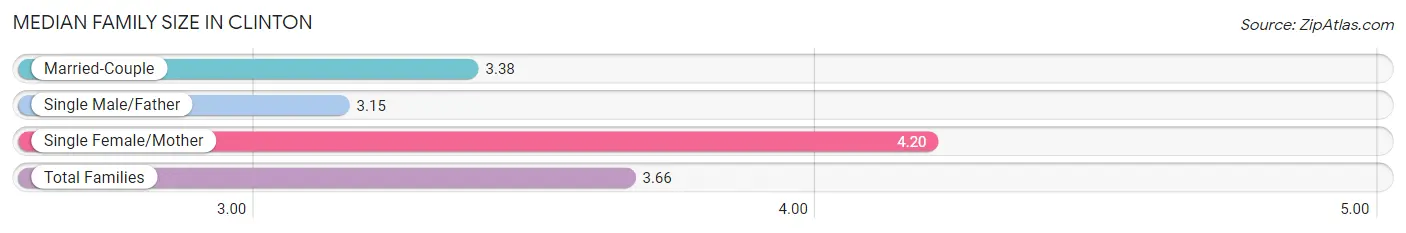
Median Family Size in Clinton
The median family size in Clinton is 3.66 persons per family, with single female/mother families (594 | 36.2%) accounting for the largest median family size of 4.2 persons per family. On the other hand, single male/father families (103 | 6.3%) represent the smallest median family size with 3.15 persons per family.
| Family Type | # Families | Family Size |
| Married-Couple | 945 (57.6%) | 3.38 |
| Single Male/Father | 103 (6.3%) | 3.15 |
| Single Female/Mother | 594 (36.2%) | 4.20 |
| Total Families | 1,642 (100.0%) | 3.66 |
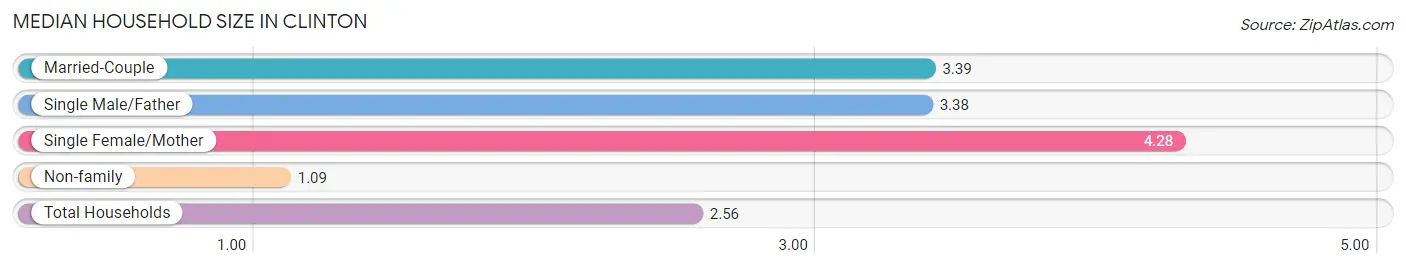
Median Household Size in Clinton
The median household size in Clinton is 2.56 persons per household, with single female/mother households (594 | 20.3%) accounting for the largest median household size of 4.28 persons per household. non-family households (1,291 | 44.0%) represent the smallest median household size with 1.09 persons per household.
| Household Type | # Households | Household Size |
| Married-Couple | 945 (32.2%) | 3.39 |
| Single Male/Father | 103 (3.5%) | 3.38 |
| Single Female/Mother | 594 (20.3%) | 4.28 |
| Non-family | 1,291 (44.0%) | 1.09 |
| Total Households | 2,933 (100.0%) | 2.56 |
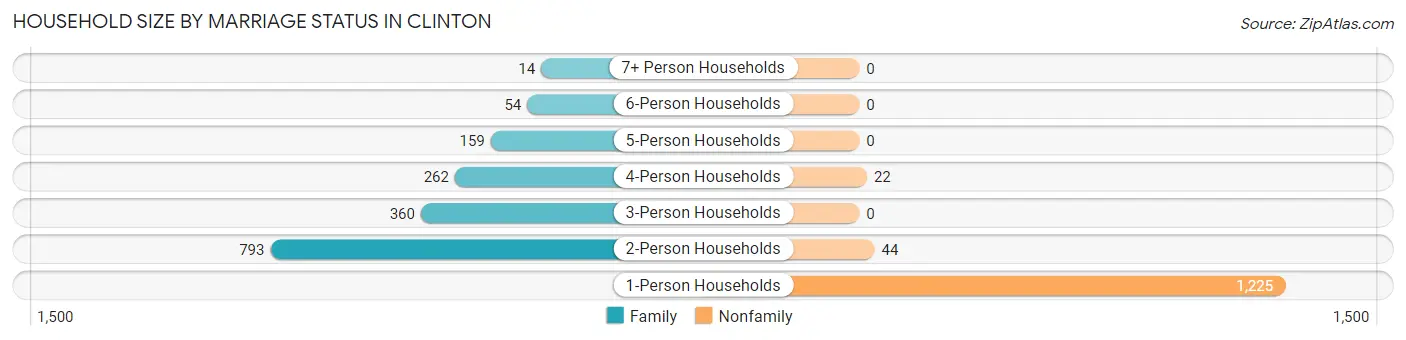
Household Size by Marriage Status in Clinton
Out of a total of 2,933 households in Clinton, 1,642 (56.0%) are family households, while 1,291 (44.0%) are nonfamily households. The most numerous type of family households are 2-person households, comprising 793, and the most common type of nonfamily households are 1-person households, comprising 1,225.
| Household Size | Family Households | Nonfamily Households |
| 1-Person Households | - | 1,225 (41.8%) |
| 2-Person Households | 793 (27.0%) | 44 (1.5%) |
| 3-Person Households | 360 (12.3%) | 0 (0.0%) |
| 4-Person Households | 262 (8.9%) | 22 (0.7%) |
| 5-Person Households | 159 (5.4%) | 0 (0.0%) |
| 6-Person Households | 54 (1.8%) | 0 (0.0%) |
| 7+ Person Households | 14 (0.5%) | 0 (0.0%) |
| Total | 1,642 (56.0%) | 1,291 (44.0%) |
Female Fertility in Clinton
Fertility by Age in Clinton
Average fertility rate in Clinton is 43.0 births per 1,000 women. Women in the age bracket of 20 to 34 years have the highest fertility rate with 73.0 births per 1,000 women. Women in the age bracket of 20 to 34 years acount for 77.3% of all women with births.
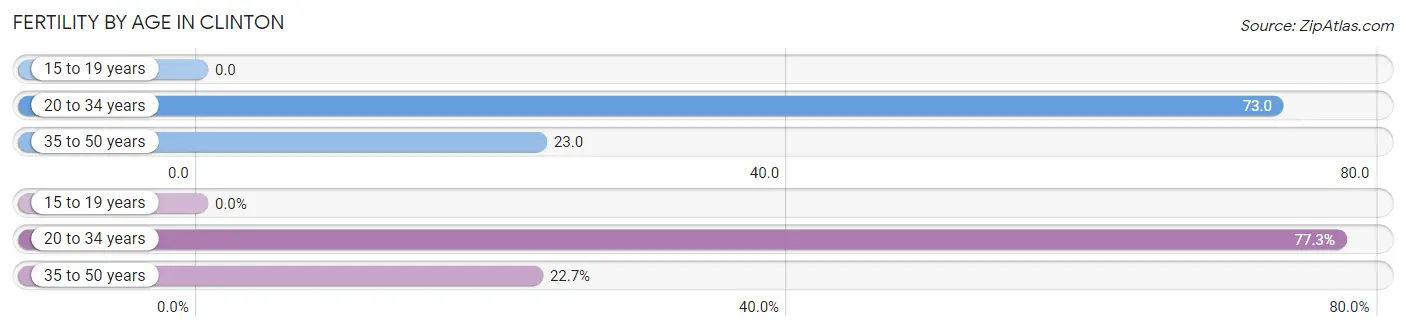
| Age Bracket | Women with Births | Births / 1,000 Women |
| 15 to 19 years | 0 (0.0%) | 0.0 |
| 20 to 34 years | 51 (77.3%) | 73.0 |
| 35 to 50 years | 15 (22.7%) | 23.0 |
| Total | 66 (100.0%) | 43.0 |
Fertility by Age by Marriage Status in Clinton
42.4% of women with births (66) in Clinton are married. The highest percentage of unmarried women with births falls into 20 to 34 years age bracket with 70.6% of them unmarried at the time of birth, while the lowest percentage of unmarried women with births belong to 35 to 50 years age bracket with 13.3% of them unmarried.
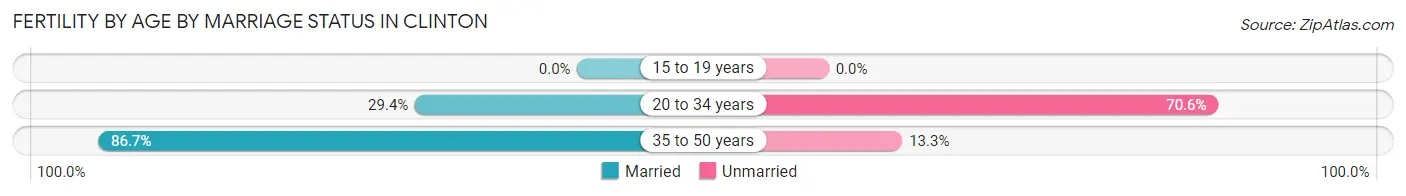
| Age Bracket | Married | Unmarried |
| 15 to 19 years | 0 (0.0%) | 0 (0.0%) |
| 20 to 34 years | 15 (29.4%) | 36 (70.6%) |
| 35 to 50 years | 13 (86.7%) | 2 (13.3%) |
| Total | 28 (42.4%) | 38 (57.6%) |
Fertility by Education in Clinton
Average fertility rate in Clinton is 43.0 births per 1,000 women. Women with the education attainment of graduate degree have the highest fertility rate of 60.0 births per 1,000 women, while women with the education attainment of less than high school have the lowest fertility at 27.0 births per 1,000 women. Women with the education attainment of college or associate's degree represent 40.9% of all women with births.
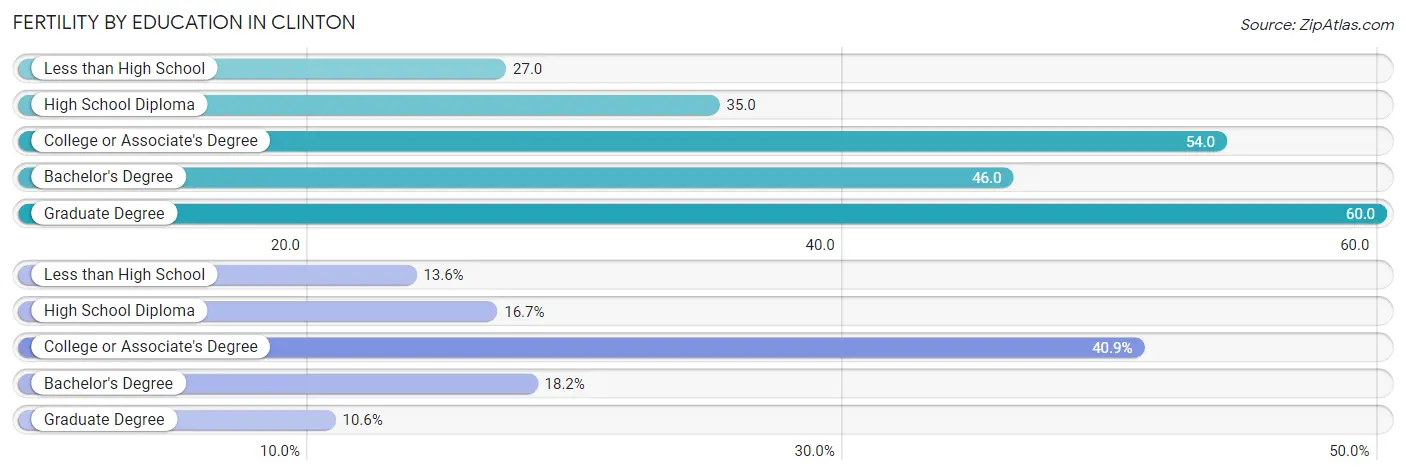
| Educational Attainment | Women with Births | Births / 1,000 Women |
| Less than High School | 9 (13.6%) | 27.0 |
| High School Diploma | 11 (16.7%) | 35.0 |
| College or Associate's Degree | 27 (40.9%) | 54.0 |
| Bachelor's Degree | 12 (18.2%) | 46.0 |
| Graduate Degree | 7 (10.6%) | 60.0 |
| Total | 66 (100.0%) | 43.0 |
Fertility by Education by Marriage Status in Clinton
57.6% of women with births in Clinton are unmarried. Women with the educational attainment of bachelor's degree are most likely to be married with 83.3% of them married at childbirth, while women with the educational attainment of less than high school are least likely to be married with 100.0% of them unmarried at childbirth.
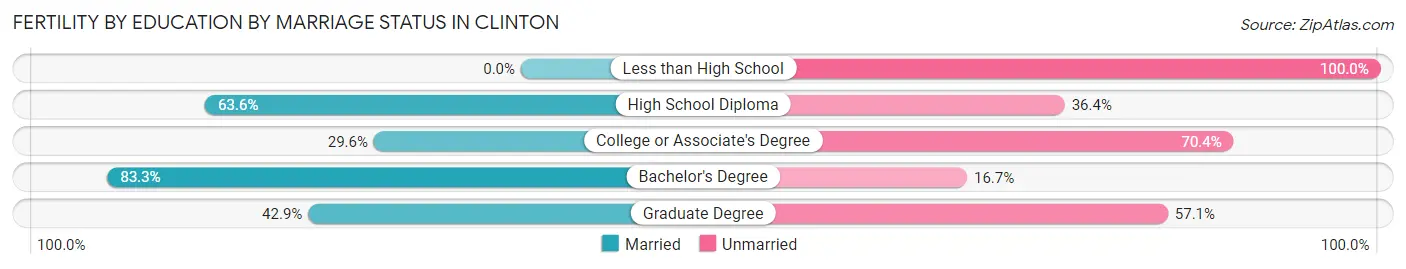
| Educational Attainment | Married | Unmarried |
| Less than High School | 0 (0.0%) | 9 (100.0%) |
| High School Diploma | 7 (63.6%) | 4 (36.4%) |
| College or Associate's Degree | 8 (29.6%) | 19 (70.4%) |
| Bachelor's Degree | 10 (83.3%) | 2 (16.7%) |
| Graduate Degree | 3 (42.9%) | 4 (57.1%) |
| Total | 28 (42.4%) | 38 (57.6%) |
Income in Clinton
Income Overview in Clinton
Per Capita Income in Clinton is $24,421, while median incomes of families and households are $60,106 and $38,880 respectively.
| Characteristic | Number | Measure |
| Per Capita Income | 8,362 | $24,421 |
| Median Family Income | 1,642 | $60,106 |
| Mean Family Income | 1,642 | $82,199 |
| Median Household Income | 2,933 | $38,880 |
| Mean Household Income | 2,933 | $63,001 |
| Income Deficit | 1,642 | $0 |
| Wage / Income Gap (%) | 8,362 | 3.30% |
| Wage / Income Gap ($) | 8,362 | 96.70¢ per $1 |
| Gini / Inequality Index | 8,362 | 0.53 |
Earnings by Sex in Clinton
Average Earnings in Clinton are $31,750, $32,298 for men and $31,233 for women, a difference of 3.3%.
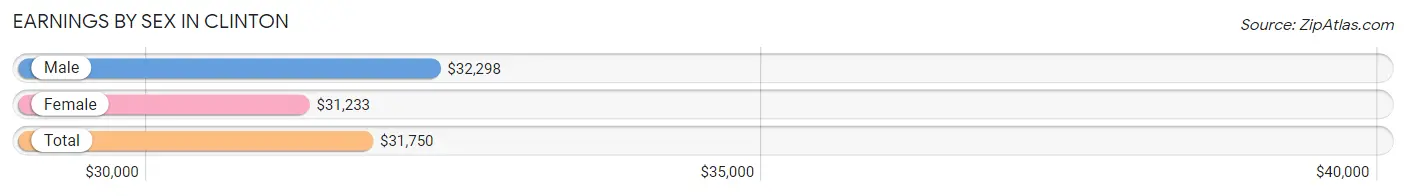
| Sex | Number | Average Earnings |
| Male | 1,821 (53.3%) | $32,298 |
| Female | 1,595 (46.7%) | $31,233 |
| Total | 3,416 (100.0%) | $31,750 |
Earnings by Sex by Income Bracket in Clinton
The most common earnings brackets in Clinton are $55,000 to $64,999 for men (174 | 9.6%) and $55,000 to $64,999 for women (170 | 10.7%).
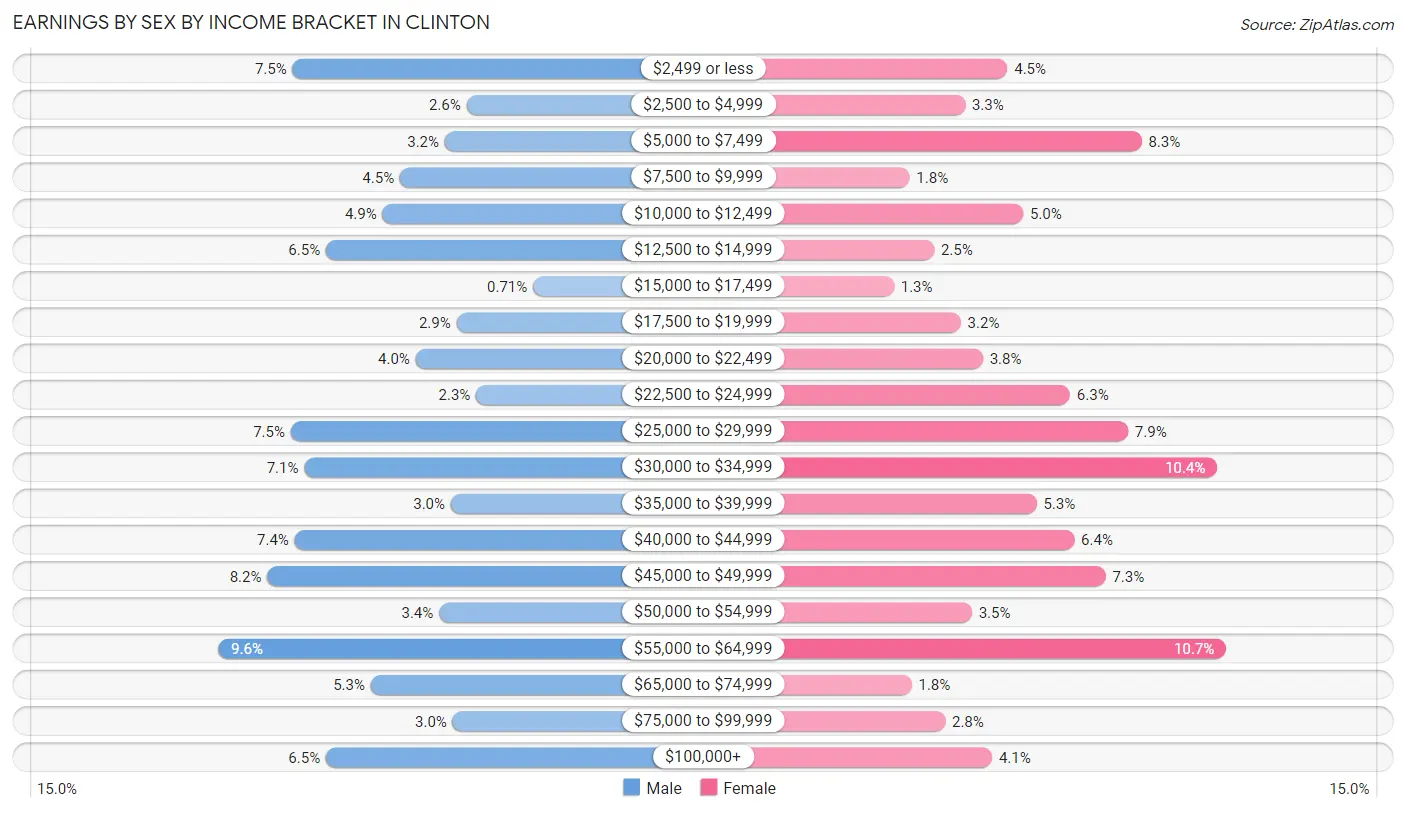
| Income | Male | Female |
| $2,499 or less | 136 (7.5%) | 72 (4.5%) |
| $2,500 to $4,999 | 47 (2.6%) | 53 (3.3%) |
| $5,000 to $7,499 | 58 (3.2%) | 132 (8.3%) |
| $7,500 to $9,999 | 81 (4.4%) | 28 (1.8%) |
| $10,000 to $12,499 | 90 (4.9%) | 79 (5.0%) |
| $12,500 to $14,999 | 119 (6.5%) | 39 (2.5%) |
| $15,000 to $17,499 | 13 (0.7%) | 21 (1.3%) |
| $17,500 to $19,999 | 52 (2.9%) | 51 (3.2%) |
| $20,000 to $22,499 | 73 (4.0%) | 61 (3.8%) |
| $22,500 to $24,999 | 42 (2.3%) | 100 (6.3%) |
| $25,000 to $29,999 | 137 (7.5%) | 126 (7.9%) |
| $30,000 to $34,999 | 130 (7.1%) | 166 (10.4%) |
| $35,000 to $39,999 | 55 (3.0%) | 85 (5.3%) |
| $40,000 to $44,999 | 135 (7.4%) | 102 (6.4%) |
| $45,000 to $49,999 | 149 (8.2%) | 116 (7.3%) |
| $50,000 to $54,999 | 61 (3.4%) | 56 (3.5%) |
| $55,000 to $64,999 | 174 (9.6%) | 170 (10.7%) |
| $65,000 to $74,999 | 96 (5.3%) | 29 (1.8%) |
| $75,000 to $99,999 | 54 (3.0%) | 44 (2.8%) |
| $100,000+ | 119 (6.5%) | 65 (4.1%) |
| Total | 1,821 (100.0%) | 1,595 (100.0%) |
Earnings by Sex by Educational Attainment in Clinton
Average earnings in Clinton are $38,250 for men and $34,301 for women, a difference of 10.3%. Men with an educational attainment of graduate degree enjoy the highest average annual earnings of $63,036, while those with less than high school education earn the least with $21,875. Women with an educational attainment of graduate degree earn the most with the average annual earnings of $55,859, while those with less than high school education have the smallest earnings of $5,931.
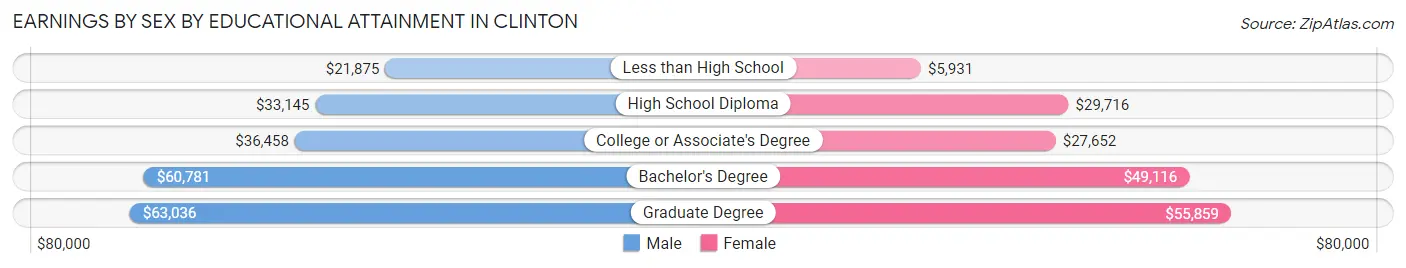
| Educational Attainment | Male Income | Female Income |
| Less than High School | $21,875 | $5,931 |
| High School Diploma | $33,145 | $29,716 |
| College or Associate's Degree | $36,458 | $27,652 |
| Bachelor's Degree | $60,781 | $49,116 |
| Graduate Degree | $63,036 | $55,859 |
| Total | $38,250 | $34,301 |
Family Income in Clinton
Family Income Brackets in Clinton
According to the Clinton family income data, there are 309 families falling into the $100,000 to $149,999 income range, which is the most common income bracket and makes up 18.8% of all families. Conversely, the $150,000 to $199,999 income bracket is the least frequent group with only 71 families (4.3%) belonging to this category.
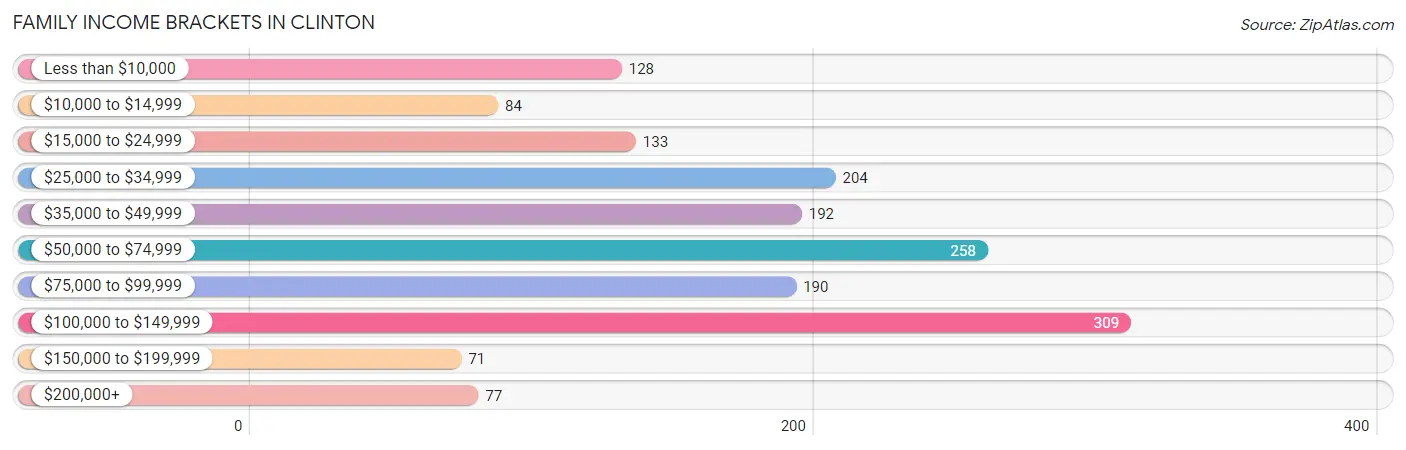
| Income Bracket | # Families | % Families |
| Less than $10,000 | 128 | 7.8% |
| $10,000 to $14,999 | 84 | 5.1% |
| $15,000 to $24,999 | 133 | 8.1% |
| $25,000 to $34,999 | 204 | 12.4% |
| $35,000 to $49,999 | 192 | 11.7% |
| $50,000 to $74,999 | 258 | 15.7% |
| $75,000 to $99,999 | 190 | 11.6% |
| $100,000 to $149,999 | 309 | 18.8% |
| $150,000 to $199,999 | 71 | 4.3% |
| $200,000+ | 77 | 4.7% |
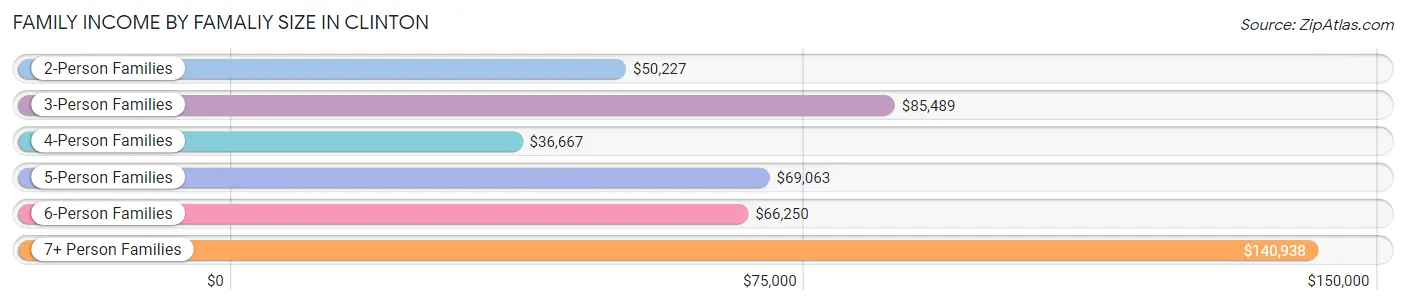
Family Income by Famaliy Size in Clinton
7+ person families (14 | 0.9%) account for the highest median family income in Clinton with $140,938 per family, while 3-person families (343 | 20.9%) have the highest median income of $28,496 per family member.
| Income Bracket | # Families | Median Income |
| 2-Person Families | 810 (49.3%) | $50,227 |
| 3-Person Families | 343 (20.9%) | $85,489 |
| 4-Person Families | 302 (18.4%) | $36,667 |
| 5-Person Families | 119 (7.2%) | $69,063 |
| 6-Person Families | 54 (3.3%) | $66,250 |
| 7+ Person Families | 14 (0.9%) | $140,938 |
| Total | 1,642 (100.0%) | $60,106 |
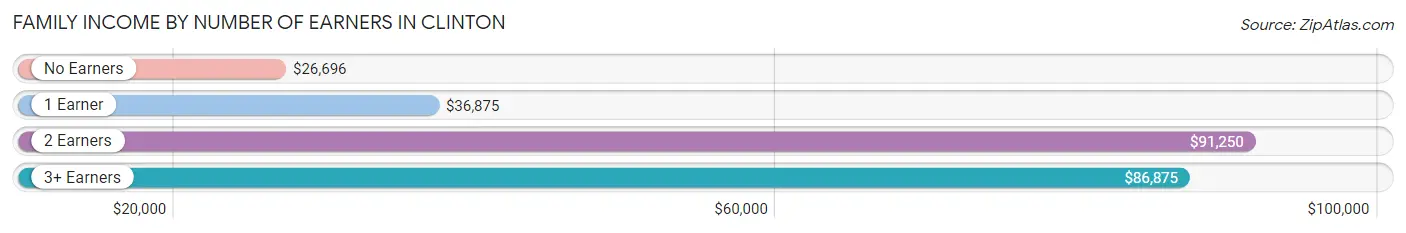
Family Income by Number of Earners in Clinton
The median family income in Clinton is $60,106, with families comprising 2 earners (660) having the highest median family income of $91,250, while families with no earners (330) have the lowest median family income of $26,696, accounting for 40.2% and 20.1% of families, respectively.
| Number of Earners | # Families | Median Income |
| No Earners | 330 (20.1%) | $26,696 |
| 1 Earner | 556 (33.9%) | $36,875 |
| 2 Earners | 660 (40.2%) | $91,250 |
| 3+ Earners | 96 (5.9%) | $86,875 |
| Total | 1,642 (100.0%) | $60,106 |
Household Income in Clinton
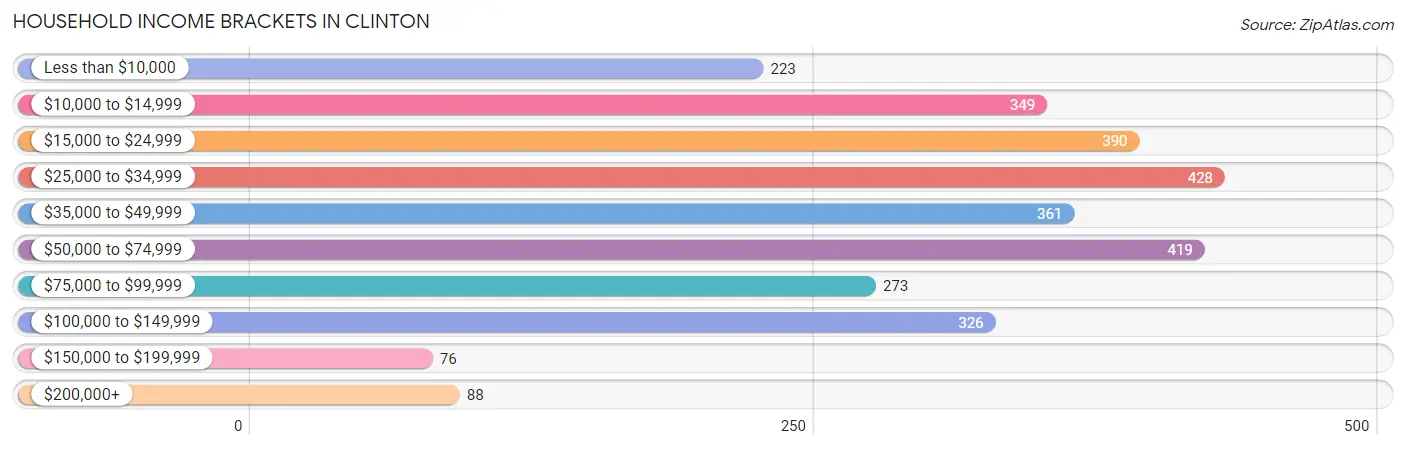
Household Income Brackets in Clinton
With 428 households falling in the category, the $25,000 to $34,999 income range is the most frequent in Clinton, accounting for 14.6% of all households. In contrast, only 76 households (2.6%) fall into the $150,000 to $199,999 income bracket, making it the least populous group.
| Income Bracket | # Households | % Households |
| Less than $10,000 | 223 | 7.6% |
| $10,000 to $14,999 | 349 | 11.9% |
| $15,000 to $24,999 | 390 | 13.3% |
| $25,000 to $34,999 | 428 | 14.6% |
| $35,000 to $49,999 | 361 | 12.3% |
| $50,000 to $74,999 | 419 | 14.3% |
| $75,000 to $99,999 | 273 | 9.3% |
| $100,000 to $149,999 | 326 | 11.1% |
| $150,000 to $199,999 | 76 | 2.6% |
| $200,000+ | 88 | 3.0% |
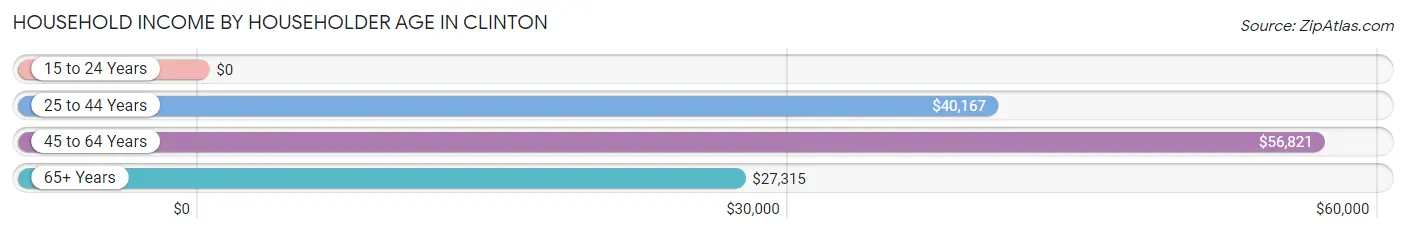
Household Income by Householder Age in Clinton
The median household income in Clinton is $38,880, with the highest median household income of $56,821 found in the 45 to 64 years age bracket for the primary householder. A total of 987 households (33.7%) fall into this category. Meanwhile, the 15 to 24 years age bracket for the primary householder has the lowest median household income of $0, with 61 households (2.1%) in this group.
| Income Bracket | # Households | Median Income |
| 15 to 24 Years | 61 (2.1%) | $0 |
| 25 to 44 Years | 796 (27.1%) | $40,167 |
| 45 to 64 Years | 987 (33.7%) | $56,821 |
| 65+ Years | 1,089 (37.1%) | $27,315 |
| Total | 2,933 (100.0%) | $38,880 |
Poverty in Clinton
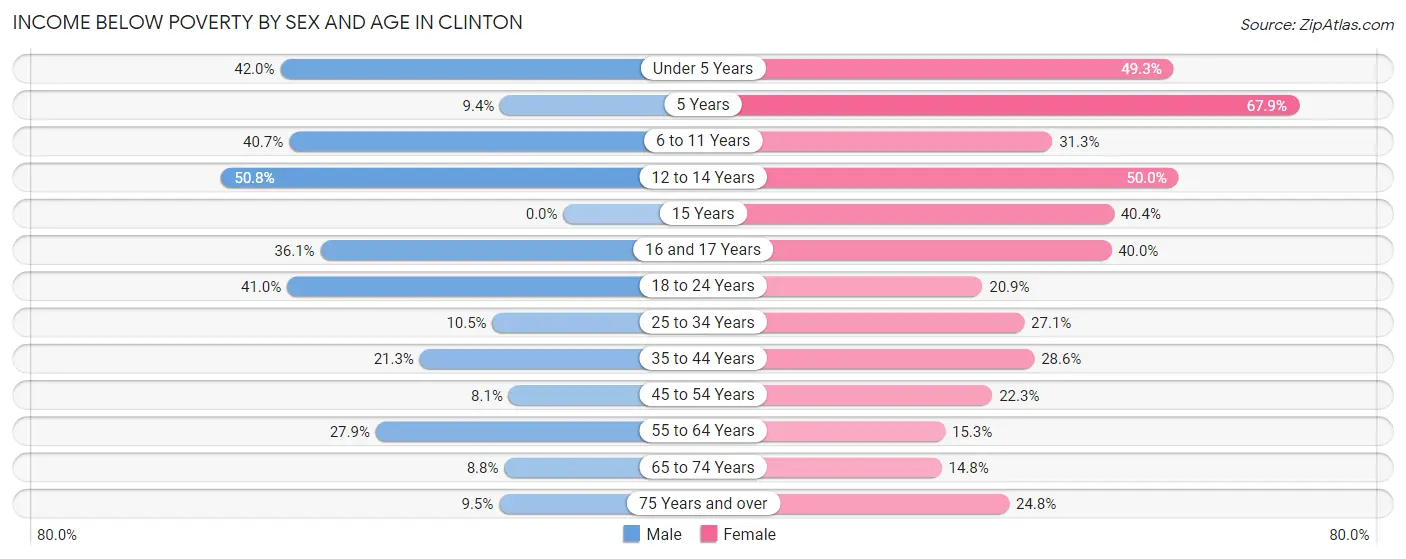
Income Below Poverty by Sex and Age in Clinton
With 24.9% poverty level for males and 26.0% for females among the residents of Clinton, 12 to 14 year old males and 5 year old females are the most vulnerable to poverty, with 128 males (50.8%) and 57 females (67.9%) in their respective age groups living below the poverty level.
| Age Bracket | Male | Female |
| Under 5 Years | 116 (42.0%) | 131 (49.2%) |
| 5 Years | 3 (9.4%) | 57 (67.9%) |
| 6 to 11 Years | 112 (40.7%) | 105 (31.2%) |
| 12 to 14 Years | 128 (50.8%) | 36 (50.0%) |
| 15 Years | 0 (0.0%) | 21 (40.4%) |
| 16 and 17 Years | 66 (36.1%) | 28 (40.0%) |
| 18 to 24 Years | 119 (41.0%) | 68 (20.9%) |
| 25 to 34 Years | 36 (10.5%) | 114 (27.1%) |
| 35 to 44 Years | 77 (21.3%) | 126 (28.6%) |
| 45 to 54 Years | 33 (8.1%) | 82 (22.3%) |
| 55 to 64 Years | 129 (27.9%) | 63 (15.3%) |
| 65 to 74 Years | 27 (8.8%) | 114 (14.8%) |
| 75 Years and over | 29 (9.5%) | 110 (24.8%) |
| Total | 875 (24.9%) | 1,055 (26.0%) |
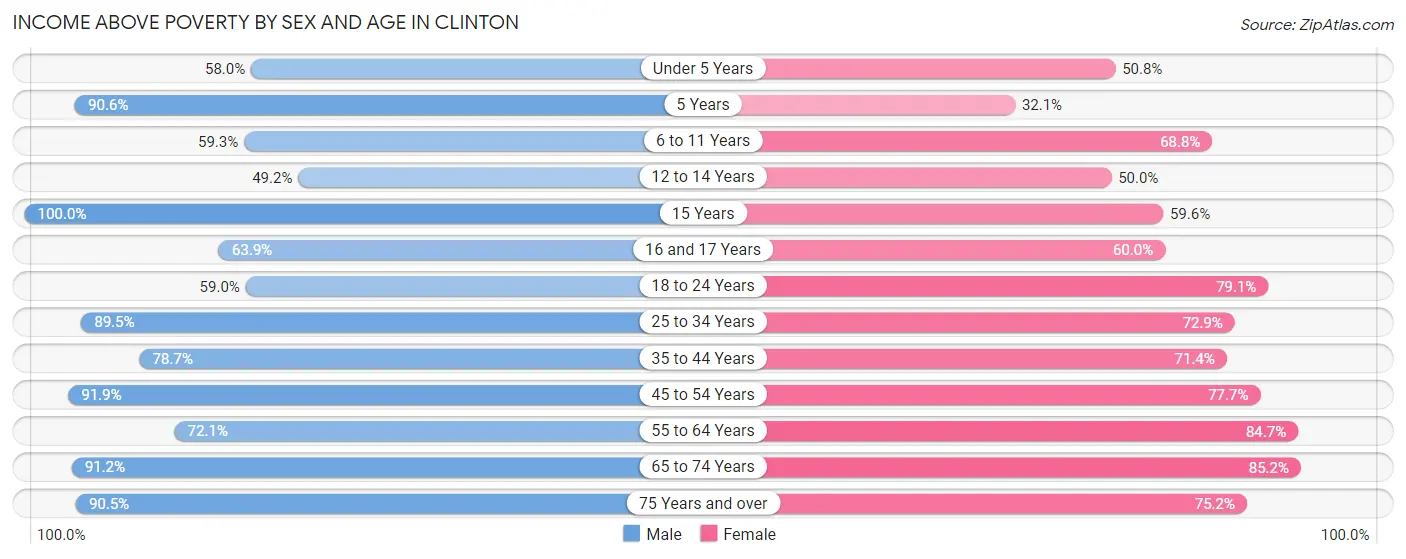
Income Above Poverty by Sex and Age in Clinton
According to the poverty statistics in Clinton, males aged 15 years and females aged 65 to 74 years are the age groups that are most secure financially, with 100.0% of males and 85.2% of females in these age groups living above the poverty line.
| Age Bracket | Male | Female |
| Under 5 Years | 160 (58.0%) | 135 (50.7%) |
| 5 Years | 29 (90.6%) | 27 (32.1%) |
| 6 to 11 Years | 163 (59.3%) | 231 (68.8%) |
| 12 to 14 Years | 124 (49.2%) | 36 (50.0%) |
| 15 Years | 26 (100.0%) | 31 (59.6%) |
| 16 and 17 Years | 117 (63.9%) | 42 (60.0%) |
| 18 to 24 Years | 171 (59.0%) | 258 (79.1%) |
| 25 to 34 Years | 306 (89.5%) | 307 (72.9%) |
| 35 to 44 Years | 284 (78.7%) | 315 (71.4%) |
| 45 to 54 Years | 374 (91.9%) | 285 (77.7%) |
| 55 to 64 Years | 334 (72.1%) | 348 (84.7%) |
| 65 to 74 Years | 281 (91.2%) | 656 (85.2%) |
| 75 Years and over | 275 (90.5%) | 333 (75.2%) |
| Total | 2,644 (75.1%) | 3,004 (74.0%) |
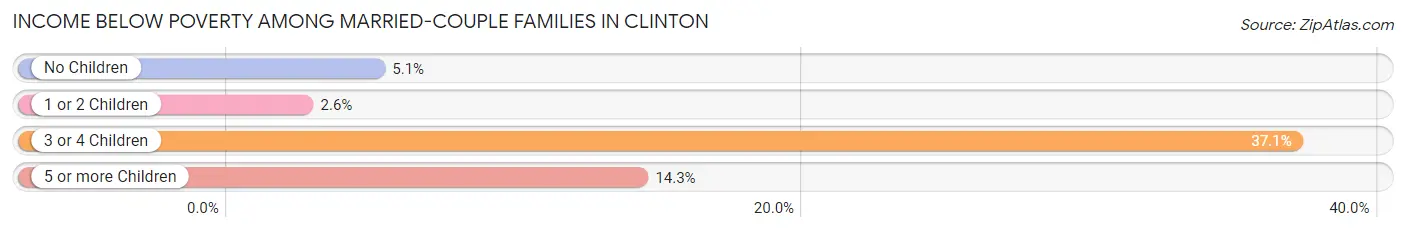
Income Below Poverty Among Married-Couple Families in Clinton
The poverty statistics for married-couple families in Clinton show that 6.6% or 62 of the total 945 families live below the poverty line. Families with 3 or 4 children have the highest poverty rate of 37.1%, comprising of 23 families. On the other hand, families with 1 or 2 children have the lowest poverty rate of 2.6%, which includes 8 families.
| Children | Above Poverty | Below Poverty |
| No Children | 536 (94.9%) | 29 (5.1%) |
| 1 or 2 Children | 296 (97.4%) | 8 (2.6%) |
| 3 or 4 Children | 39 (62.9%) | 23 (37.1%) |
| 5 or more Children | 12 (85.7%) | 2 (14.3%) |
| Total | 883 (93.4%) | 62 (6.6%) |
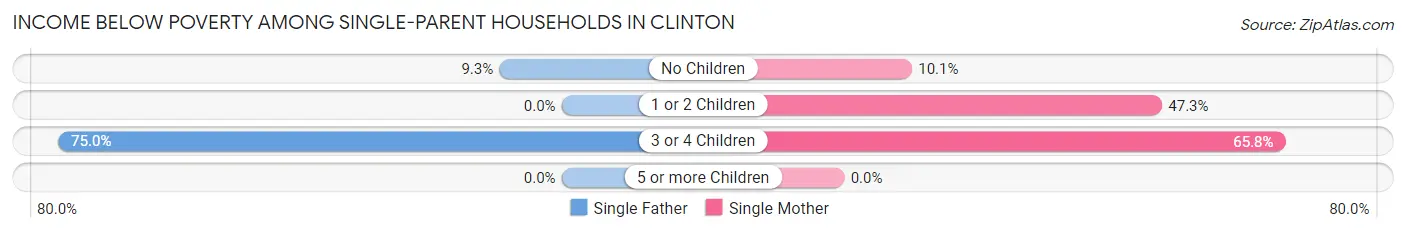
Income Below Poverty Among Single-Parent Households in Clinton
According to the poverty data in Clinton, 9.7% or 10 single-father households and 42.3% or 251 single-mother households are living below the poverty line. Among single-father households, those with 3 or 4 children have the highest poverty rate, with 6 households (75.0%) experiencing poverty. Likewise, among single-mother households, those with 3 or 4 children have the highest poverty rate, with 77 households (65.8%) falling below the poverty line.
| Children | Single Father | Single Mother |
| No Children | 4 (9.3%) | 14 (10.1%) |
| 1 or 2 Children | 0 (0.0%) | 160 (47.3%) |
| 3 or 4 Children | 6 (75.0%) | 77 (65.8%) |
| 5 or more Children | 0 (0.0%) | 0 (0.0%) |
| Total | 10 (9.7%) | 251 (42.3%) |
Income Below Poverty Among Married-Couple vs Single-Parent Households in Clinton
The poverty data for Clinton shows that 62 of the married-couple family households (6.6%) and 261 of the single-parent households (37.4%) are living below the poverty level. Within the married-couple family households, those with 3 or 4 children have the highest poverty rate, with 23 households (37.1%) falling below the poverty line. Among the single-parent households, those with 3 or 4 children have the highest poverty rate, with 83 household (66.4%) living below poverty.
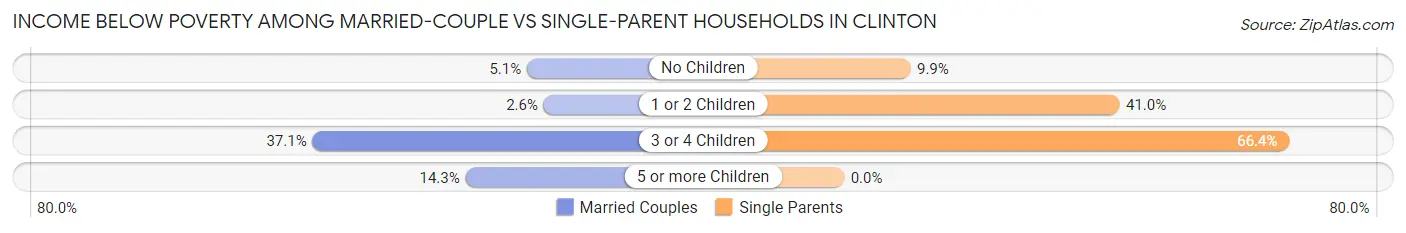
| Children | Married-Couple Families | Single-Parent Households |
| No Children | 29 (5.1%) | 18 (9.9%) |
| 1 or 2 Children | 8 (2.6%) | 160 (41.0%) |
| 3 or 4 Children | 23 (37.1%) | 83 (66.4%) |
| 5 or more Children | 2 (14.3%) | 0 (0.0%) |
| Total | 62 (6.6%) | 261 (37.4%) |
Employment Characteristics in Clinton
Employment by Class of Employer in Clinton
Among the 2,928 employed individuals in Clinton, private company employees (1,709 | 58.4%), self-employed (incorporated) (332 | 11.3%), and local government employees (241 | 8.2%) make up the most common classes of employment.
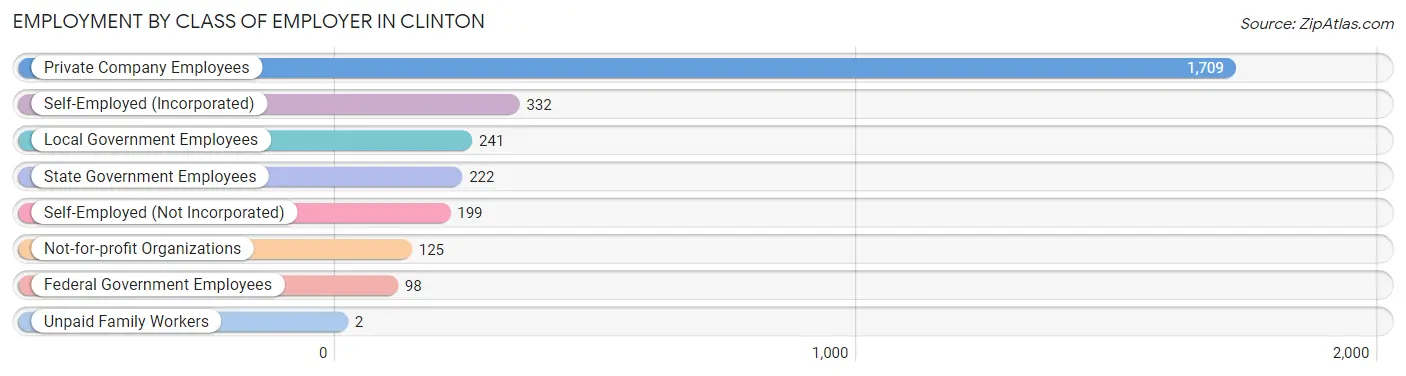
| Employer Class | # Employees | % Employees |
| Private Company Employees | 1,709 | 58.4% |
| Self-Employed (Incorporated) | 332 | 11.3% |
| Self-Employed (Not Incorporated) | 199 | 6.8% |
| Not-for-profit Organizations | 125 | 4.3% |
| Local Government Employees | 241 | 8.2% |
| State Government Employees | 222 | 7.6% |
| Federal Government Employees | 98 | 3.4% |
| Unpaid Family Workers | 2 | 0.1% |
| Total | 2,928 | 100.0% |
Employment Status by Age in Clinton
According to the labor force statistics for Clinton, out of the total population over 16 years of age (6,688), 46.7% or 3,123 individuals are in the labor force, with 4.6% or 144 of them unemployed. The age group with the highest labor force participation rate is 30 to 34 years, with 70.5% or 390 individuals in the labor force. Within the labor force, the 25 to 29 years age range has the highest percentage of unemployed individuals, with 9.7% or 19 of them being unemployed.
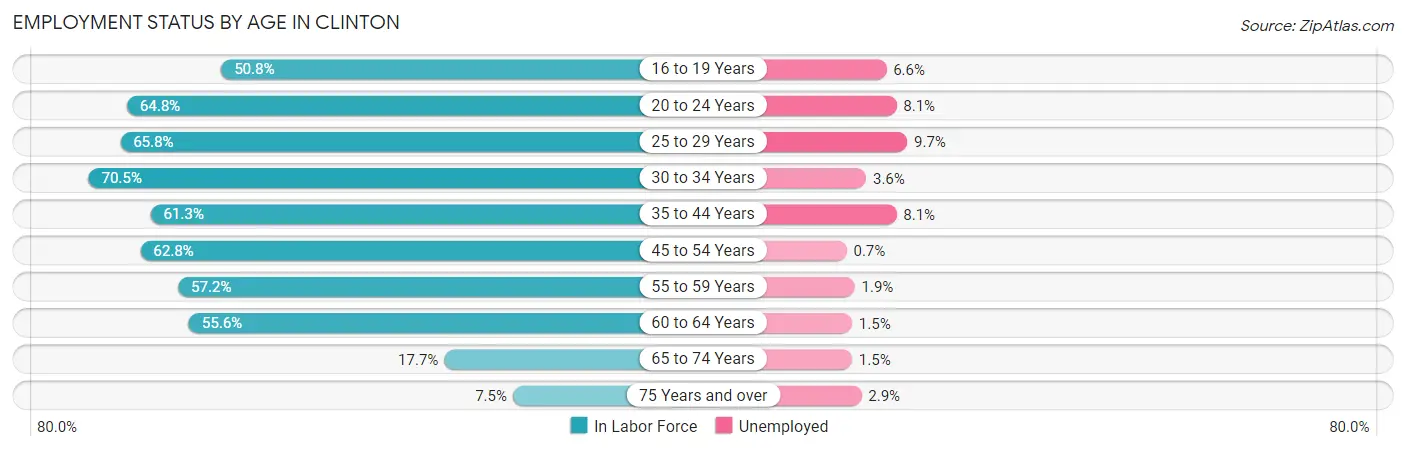
| Age Bracket | In Labor Force | Unemployed |
| 16 to 19 Years | 212 (50.8%) | 14 (6.6%) |
| 20 to 24 Years | 296 (64.8%) | 24 (8.1%) |
| 25 to 29 Years | 196 (65.8%) | 19 (9.7%) |
| 30 to 34 Years | 390 (70.5%) | 14 (3.6%) |
| 35 to 44 Years | 653 (61.3%) | 53 (8.1%) |
| 45 to 54 Years | 577 (62.8%) | 4 (0.7%) |
| 55 to 59 Years | 257 (57.2%) | 5 (1.9%) |
| 60 to 64 Years | 271 (55.6%) | 4 (1.5%) |
| 65 to 74 Years | 199 (17.7%) | 3 (1.5%) |
| 75 Years and over | 69 (7.5%) | 2 (2.9%) |
| Total | 3,123 (46.7%) | 144 (4.6%) |
Employment Status by Educational Attainment in Clinton
According to labor force statistics for Clinton, 62.1% of individuals (2,342) out of the total population between 25 and 64 years of age (3,772) are in the labor force, with 4.3% or 101 of them being unemployed. The group with the highest labor force participation rate are those with the educational attainment of bachelor's degree or higher, with 89.0% or 740 individuals in the labor force. Within the labor force, individuals with less than high school education have the highest percentage of unemployment, with 16.8% or 54 of them being unemployed.
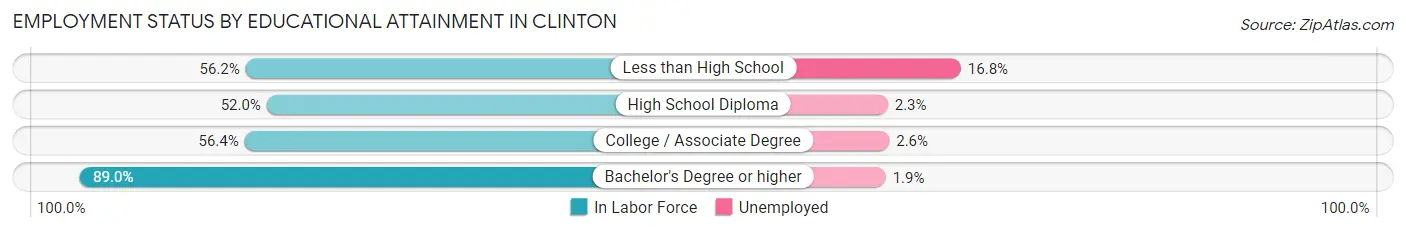
| Educational Attainment | In Labor Force | Unemployed |
| Less than High School | 321 (56.2%) | 96 (16.8%) |
| High School Diploma | 633 (52.0%) | 28 (2.3%) |
| College / Associate Degree | 650 (56.4%) | 30 (2.6%) |
| Bachelor's Degree or higher | 740 (89.0%) | 16 (1.9%) |
| Total | 2,342 (62.1%) | 162 (4.3%) |
Employment Occupations by Sex in Clinton
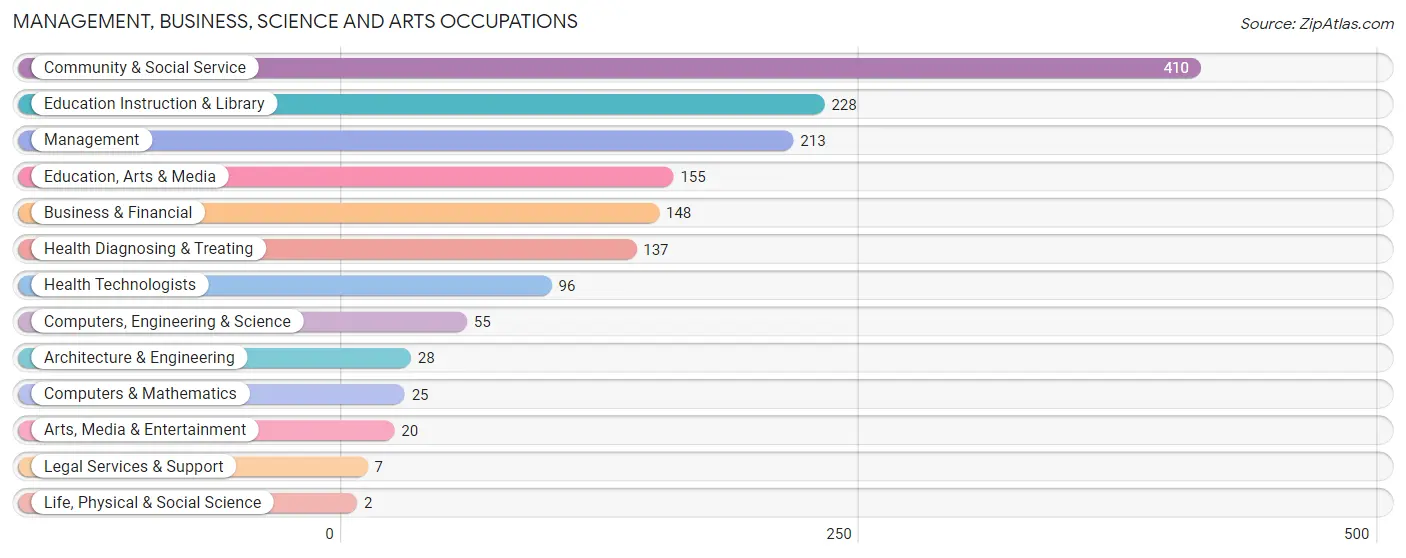
Management, Business, Science and Arts Occupations
The most common Management, Business, Science and Arts occupations in Clinton are Community & Social Service (410 | 13.8%), Education Instruction & Library (228 | 7.7%), Management (213 | 7.2%), Education, Arts & Media (155 | 5.2%), and Business & Financial (148 | 5.0%).
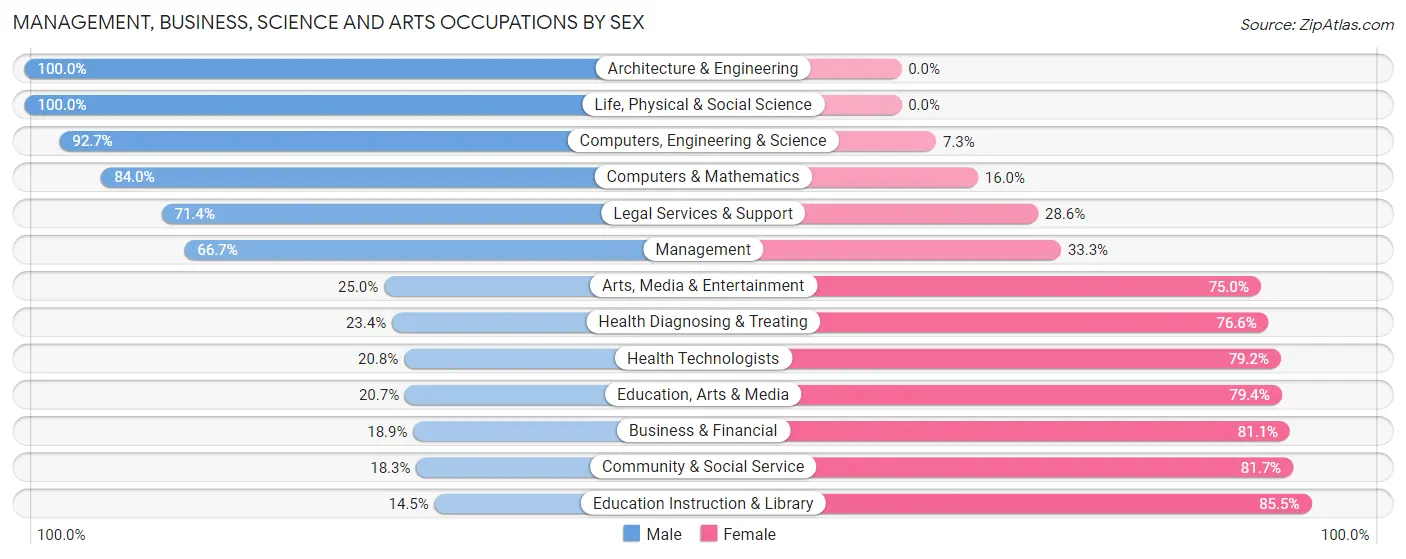
Management, Business, Science and Arts Occupations by Sex
Within the Management, Business, Science and Arts occupations in Clinton, the most male-oriented occupations are Architecture & Engineering (100.0%), Life, Physical & Social Science (100.0%), and Computers, Engineering & Science (92.7%), while the most female-oriented occupations are Education Instruction & Library (85.5%), Community & Social Service (81.7%), and Business & Financial (81.1%).
| Occupation | Male | Female |
| Management | 142 (66.7%) | 71 (33.3%) |
| Business & Financial | 28 (18.9%) | 120 (81.1%) |
| Computers, Engineering & Science | 51 (92.7%) | 4 (7.3%) |
| Computers & Mathematics | 21 (84.0%) | 4 (16.0%) |
| Architecture & Engineering | 28 (100.0%) | 0 (0.0%) |
| Life, Physical & Social Science | 2 (100.0%) | 0 (0.0%) |
| Community & Social Service | 75 (18.3%) | 335 (81.7%) |
| Education, Arts & Media | 32 (20.6%) | 123 (79.3%) |
| Legal Services & Support | 5 (71.4%) | 2 (28.6%) |
| Education Instruction & Library | 33 (14.5%) | 195 (85.5%) |
| Arts, Media & Entertainment | 5 (25.0%) | 15 (75.0%) |
| Health Diagnosing & Treating | 32 (23.4%) | 105 (76.6%) |
| Health Technologists | 20 (20.8%) | 76 (79.2%) |
| Total (Category) | 328 (34.1%) | 635 (65.9%) |
| Total (Overall) | 1,564 (52.8%) | 1,399 (47.2%) |
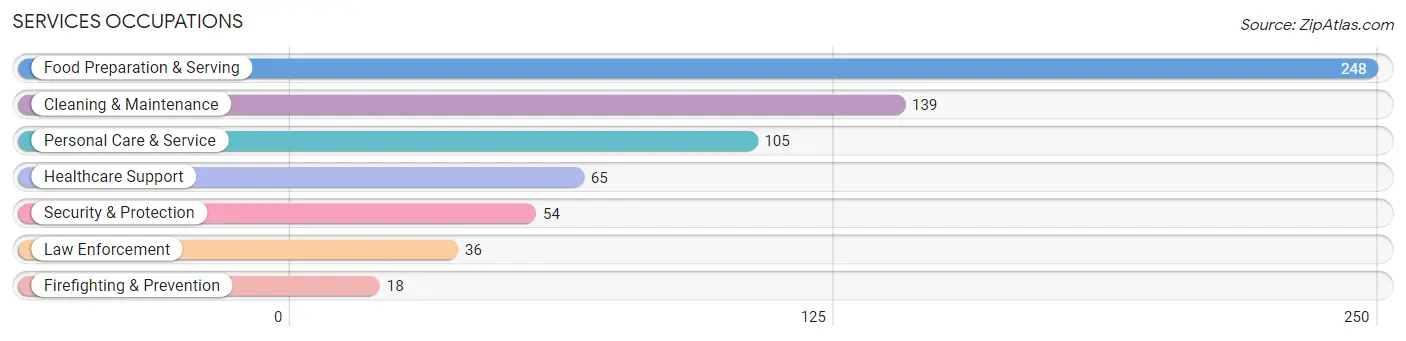
Services Occupations
The most common Services occupations in Clinton are Food Preparation & Serving (248 | 8.4%), Cleaning & Maintenance (139 | 4.7%), Personal Care & Service (105 | 3.5%), Healthcare Support (65 | 2.2%), and Security & Protection (54 | 1.8%).
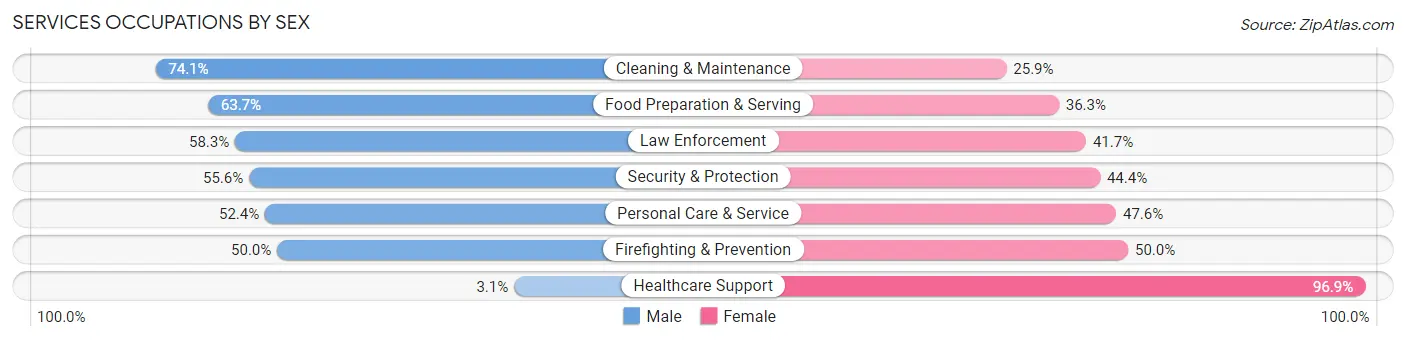
Services Occupations by Sex
Within the Services occupations in Clinton, the most male-oriented occupations are Cleaning & Maintenance (74.1%), Food Preparation & Serving (63.7%), and Law Enforcement (58.3%), while the most female-oriented occupations are Healthcare Support (96.9%), Firefighting & Prevention (50.0%), and Personal Care & Service (47.6%).
| Occupation | Male | Female |
| Healthcare Support | 2 (3.1%) | 63 (96.9%) |
| Security & Protection | 30 (55.6%) | 24 (44.4%) |
| Firefighting & Prevention | 9 (50.0%) | 9 (50.0%) |
| Law Enforcement | 21 (58.3%) | 15 (41.7%) |
| Food Preparation & Serving | 158 (63.7%) | 90 (36.3%) |
| Cleaning & Maintenance | 103 (74.1%) | 36 (25.9%) |
| Personal Care & Service | 55 (52.4%) | 50 (47.6%) |
| Total (Category) | 348 (57.0%) | 263 (43.0%) |
| Total (Overall) | 1,564 (52.8%) | 1,399 (47.2%) |
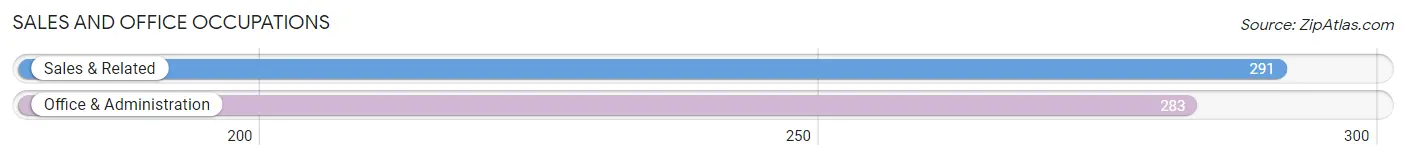
Sales and Office Occupations
The most common Sales and Office occupations in Clinton are Sales & Related (291 | 9.8%), and Office & Administration (283 | 9.6%).
Sales and Office Occupations by Sex
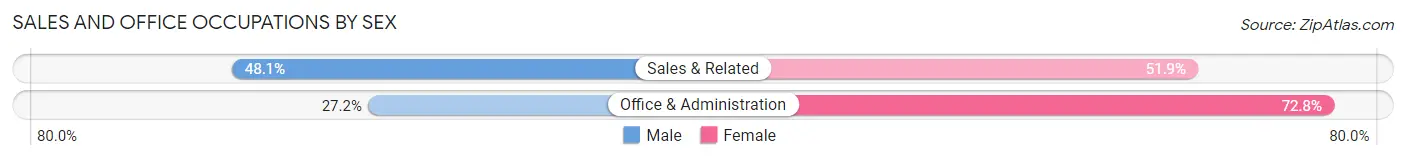
| Occupation | Male | Female |
| Sales & Related | 140 (48.1%) | 151 (51.9%) |
| Office & Administration | 77 (27.2%) | 206 (72.8%) |
| Total (Category) | 217 (37.8%) | 357 (62.2%) |
| Total (Overall) | 1,564 (52.8%) | 1,399 (47.2%) |
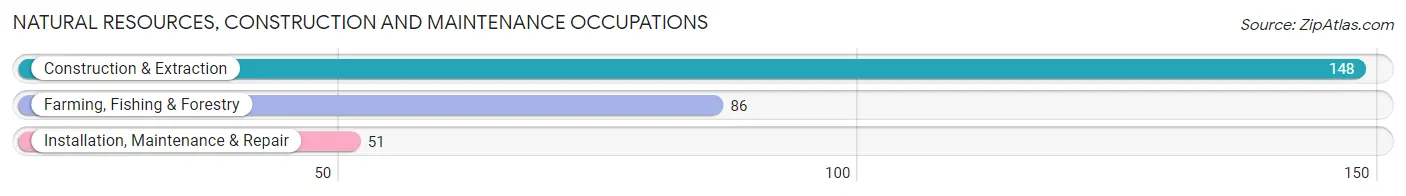
Natural Resources, Construction and Maintenance Occupations
The most common Natural Resources, Construction and Maintenance occupations in Clinton are Construction & Extraction (148 | 5.0%), Farming, Fishing & Forestry (86 | 2.9%), and Installation, Maintenance & Repair (51 | 1.7%).
Natural Resources, Construction and Maintenance Occupations by Sex
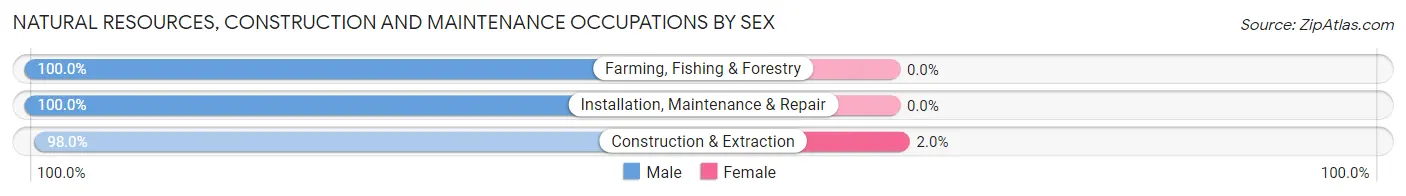
| Occupation | Male | Female |
| Farming, Fishing & Forestry | 86 (100.0%) | 0 (0.0%) |
| Construction & Extraction | 145 (98.0%) | 3 (2.0%) |
| Installation, Maintenance & Repair | 51 (100.0%) | 0 (0.0%) |
| Total (Category) | 282 (99.0%) | 3 (1.1%) |
| Total (Overall) | 1,564 (52.8%) | 1,399 (47.2%) |
Production, Transportation and Moving Occupations
The most common Production, Transportation and Moving occupations in Clinton are Production (238 | 8.0%), Transportation (154 | 5.2%), and Material Moving (138 | 4.7%).
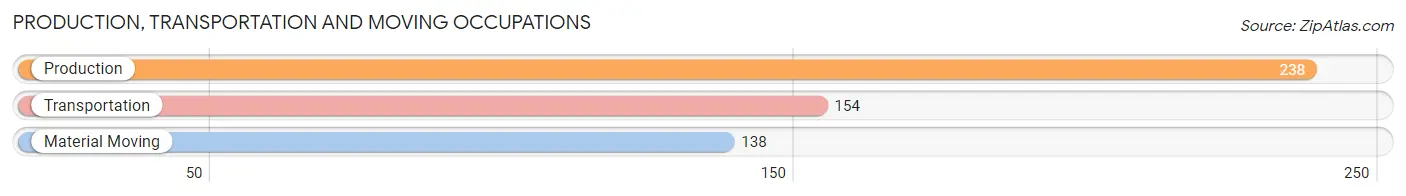
Production, Transportation and Moving Occupations by Sex
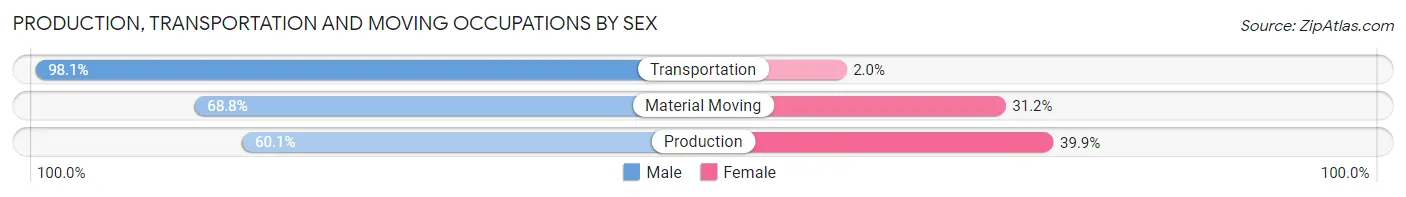
| Occupation | Male | Female |
| Production | 143 (60.1%) | 95 (39.9%) |
| Transportation | 151 (98.1%) | 3 (1.9%) |
| Material Moving | 95 (68.8%) | 43 (31.2%) |
| Total (Category) | 389 (73.4%) | 141 (26.6%) |
| Total (Overall) | 1,564 (52.8%) | 1,399 (47.2%) |
Employment Industries by Sex in Clinton
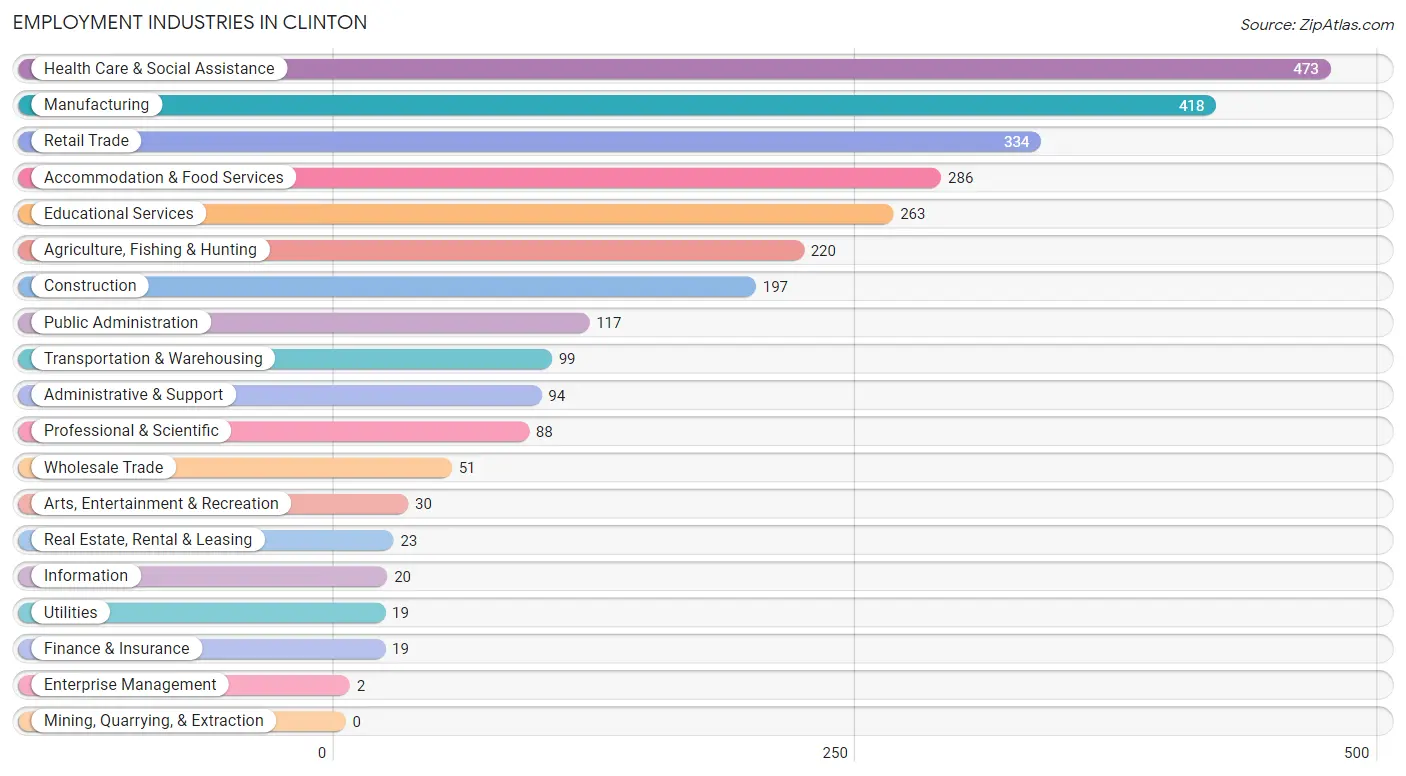
Employment Industries in Clinton
The major employment industries in Clinton include Health Care & Social Assistance (473 | 16.0%), Manufacturing (418 | 14.1%), Retail Trade (334 | 11.3%), Accommodation & Food Services (286 | 9.7%), and Educational Services (263 | 8.9%).
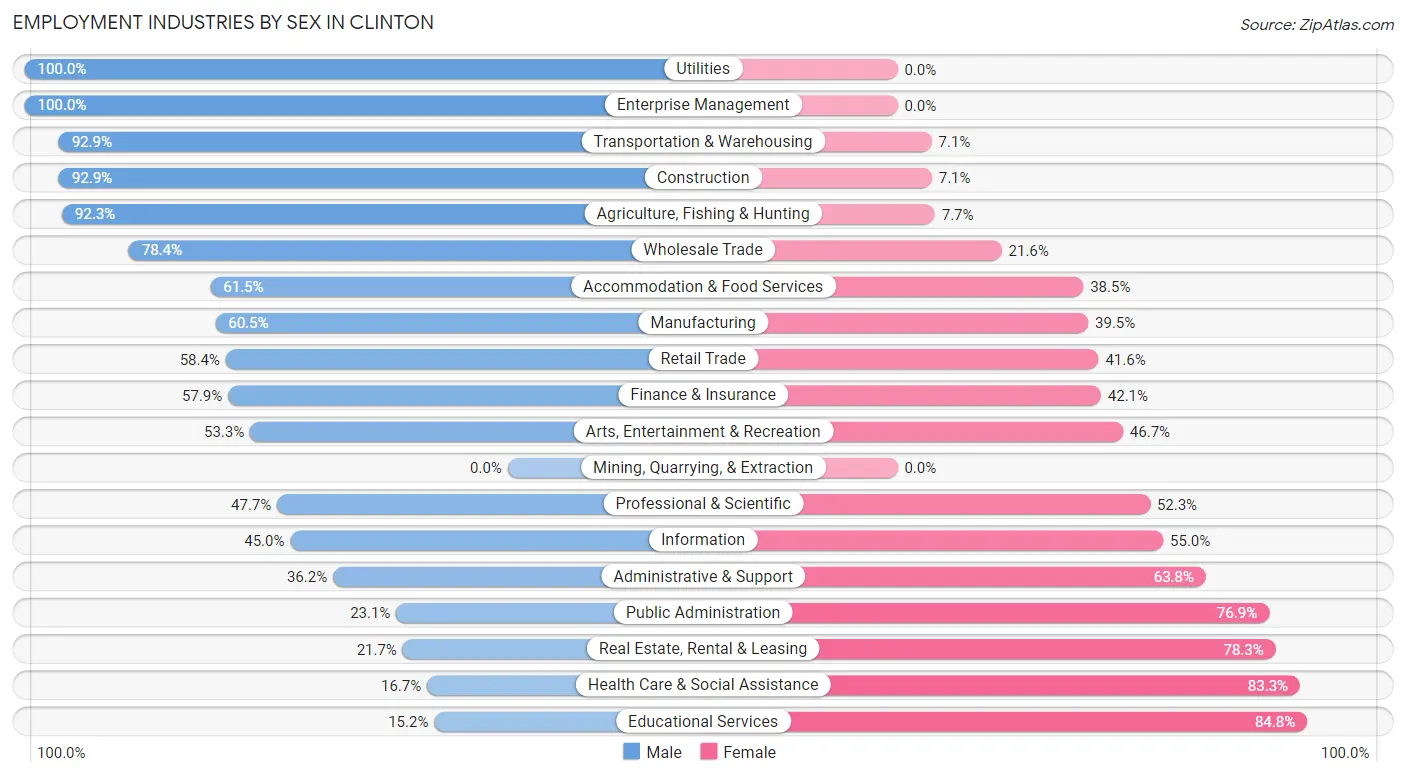
Employment Industries by Sex in Clinton
The Clinton industries that see more men than women are Utilities (100.0%), Enterprise Management (100.0%), and Transportation & Warehousing (92.9%), whereas the industries that tend to have a higher number of women are Educational Services (84.8%), Health Care & Social Assistance (83.3%), and Real Estate, Rental & Leasing (78.3%).
| Industry | Male | Female |
| Agriculture, Fishing & Hunting | 203 (92.3%) | 17 (7.7%) |
| Mining, Quarrying, & Extraction | 0 (0.0%) | 0 (0.0%) |
| Construction | 183 (92.9%) | 14 (7.1%) |
| Manufacturing | 253 (60.5%) | 165 (39.5%) |
| Wholesale Trade | 40 (78.4%) | 11 (21.6%) |
| Retail Trade | 195 (58.4%) | 139 (41.6%) |
| Transportation & Warehousing | 92 (92.9%) | 7 (7.1%) |
| Utilities | 19 (100.0%) | 0 (0.0%) |
| Information | 9 (45.0%) | 11 (55.0%) |
| Finance & Insurance | 11 (57.9%) | 8 (42.1%) |
| Real Estate, Rental & Leasing | 5 (21.7%) | 18 (78.3%) |
| Professional & Scientific | 42 (47.7%) | 46 (52.3%) |
| Enterprise Management | 2 (100.0%) | 0 (0.0%) |
| Administrative & Support | 34 (36.2%) | 60 (63.8%) |
| Educational Services | 40 (15.2%) | 223 (84.8%) |
| Health Care & Social Assistance | 79 (16.7%) | 394 (83.3%) |
| Arts, Entertainment & Recreation | 16 (53.3%) | 14 (46.7%) |
| Accommodation & Food Services | 176 (61.5%) | 110 (38.5%) |
| Public Administration | 27 (23.1%) | 90 (76.9%) |
| Total | 1,564 (52.8%) | 1,399 (47.2%) |
Education in Clinton
School Enrollment in Clinton
The most common levels of schooling among the 1,883 students in Clinton are high school (475 | 25.2%), middle school (426 | 22.6%), and elementary school (330 | 17.5%).
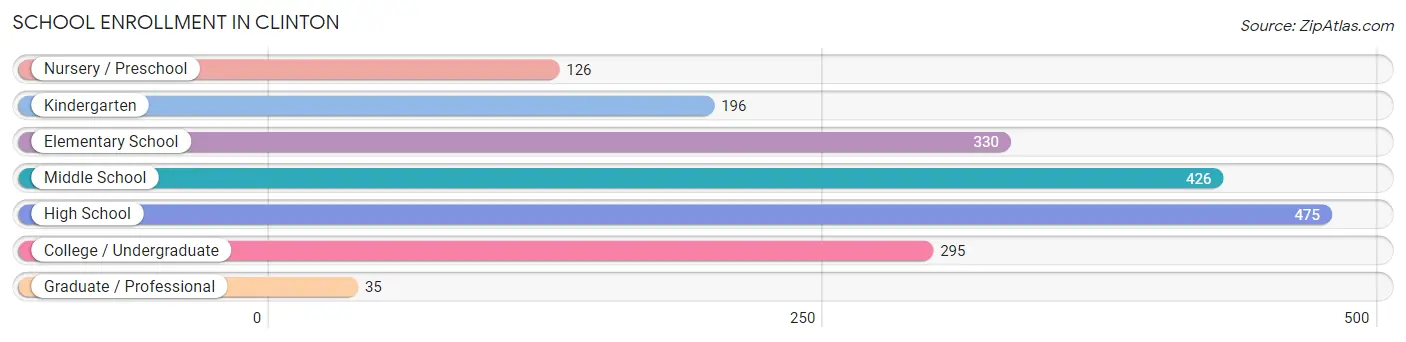
| School Level | # Students | % Students |
| Nursery / Preschool | 126 | 6.7% |
| Kindergarten | 196 | 10.4% |
| Elementary School | 330 | 17.5% |
| Middle School | 426 | 22.6% |
| High School | 475 | 25.2% |
| College / Undergraduate | 295 | 15.7% |
| Graduate / Professional | 35 | 1.9% |
| Total | 1,883 | 100.0% |
School Enrollment by Age by Funding Source in Clinton
Out of a total of 1,883 students who are enrolled in schools in Clinton, 213 (11.3%) attend a private institution, while the remaining 1,670 (88.7%) are enrolled in public schools. The age group of 3 to 4 year olds has the highest likelihood of being enrolled in private schools, with 32 (28.8% in the age bracket) enrolled. Conversely, the age group of 18 to 19 year olds has the lowest likelihood of being enrolled in a private school, with 64 (100.0% in the age bracket) attending a public institution.
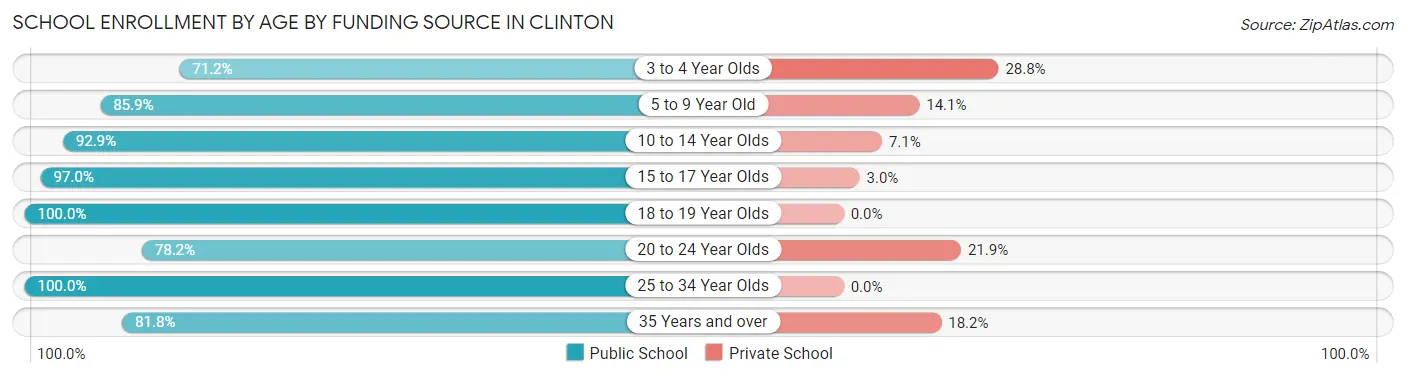
| Age Bracket | Public School | Private School |
| 3 to 4 Year Olds | 79 (71.2%) | 32 (28.8%) |
| 5 to 9 Year Old | 433 (85.9%) | 71 (14.1%) |
| 10 to 14 Year Olds | 495 (92.9%) | 38 (7.1%) |
| 15 to 17 Year Olds | 294 (97.0%) | 9 (3.0%) |
| 18 to 19 Year Olds | 64 (100.0%) | 0 (0.0%) |
| 20 to 24 Year Olds | 118 (78.1%) | 33 (21.8%) |
| 25 to 34 Year Olds | 52 (100.0%) | 0 (0.0%) |
| 35 Years and over | 135 (81.8%) | 30 (18.2%) |
| Total | 1,670 (88.7%) | 213 (11.3%) |
Educational Attainment by Field of Study in Clinton
Business (276 | 21.8%), education (276 | 21.8%), arts & humanities (151 | 11.9%), science & technology (112 | 8.8%), and social sciences (102 | 8.1%) are the most common fields of study among 1,267 individuals in Clinton who have obtained a bachelor's degree or higher.
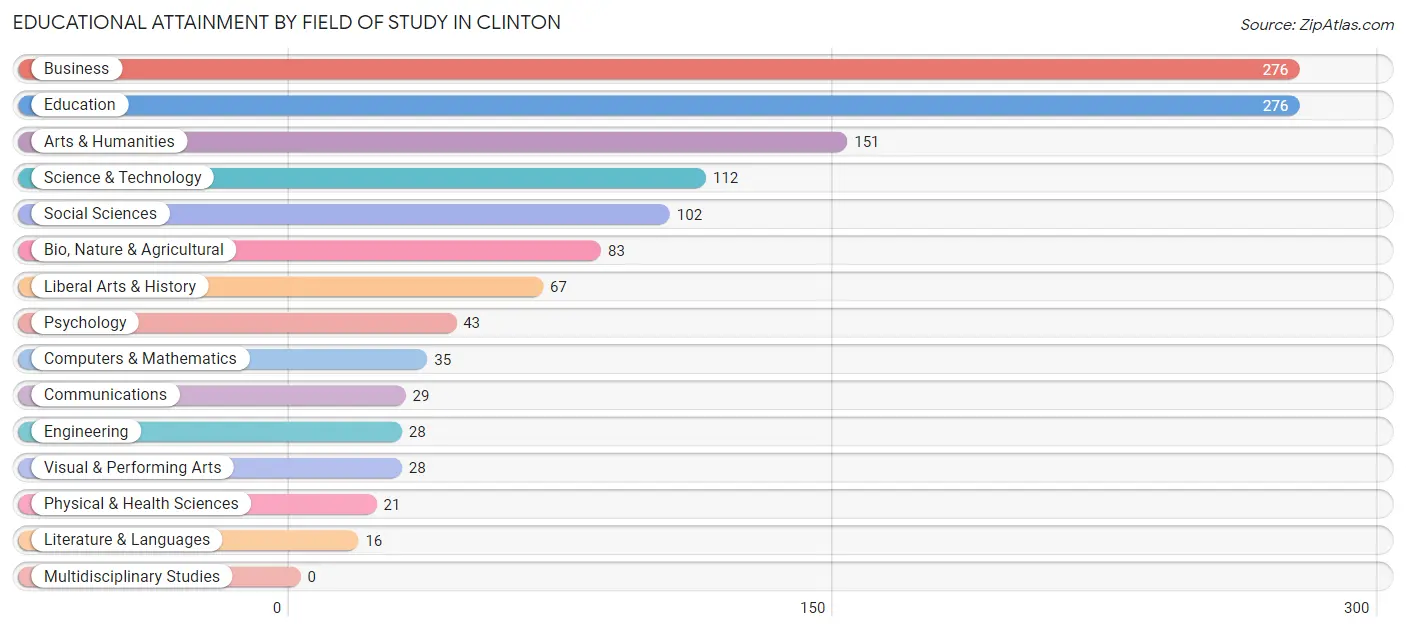
| Field of Study | # Graduates | % Graduates |
| Computers & Mathematics | 35 | 2.8% |
| Bio, Nature & Agricultural | 83 | 6.6% |
| Physical & Health Sciences | 21 | 1.7% |
| Psychology | 43 | 3.4% |
| Social Sciences | 102 | 8.1% |
| Engineering | 28 | 2.2% |
| Multidisciplinary Studies | 0 | 0.0% |
| Science & Technology | 112 | 8.8% |
| Business | 276 | 21.8% |
| Education | 276 | 21.8% |
| Literature & Languages | 16 | 1.3% |
| Liberal Arts & History | 67 | 5.3% |
| Visual & Performing Arts | 28 | 2.2% |
| Communications | 29 | 2.3% |
| Arts & Humanities | 151 | 11.9% |
| Total | 1,267 | 100.0% |
Transportation & Commute in Clinton
Vehicle Availability by Sex in Clinton
The most prevalent vehicle ownership categories in Clinton are males with 2 vehicles (622, accounting for 39.5%) and females with 2 vehicles (485, making up 46.0%).
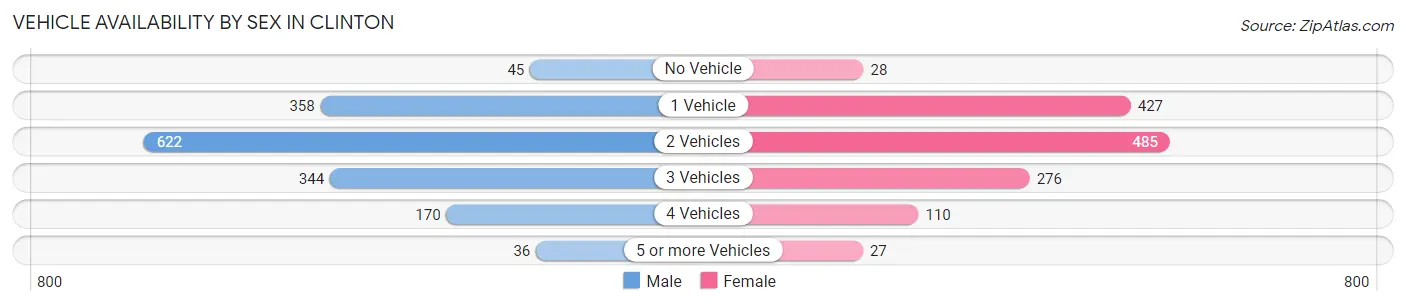
| Vehicles Available | Male | Female |
| No Vehicle | 45 (2.9%) | 28 (2.1%) |
| 1 Vehicle | 358 (22.7%) | 427 (31.6%) |
| 2 Vehicles | 622 (39.5%) | 485 (35.8%) |
| 3 Vehicles | 344 (21.8%) | 276 (20.4%) |
| 4 Vehicles | 170 (10.8%) | 110 (8.1%) |
| 5 or more Vehicles | 36 (2.3%) | 27 (2.0%) |
| Total | 1,575 (100.0%) | 1,353 (100.0%) |
Commute Time in Clinton
The most frequently occuring commute durations in Clinton are 5 to 9 minutes (706 commuters, 25.5%), 10 to 14 minutes (575 commuters, 20.8%), and 15 to 19 minutes (309 commuters, 11.2%).
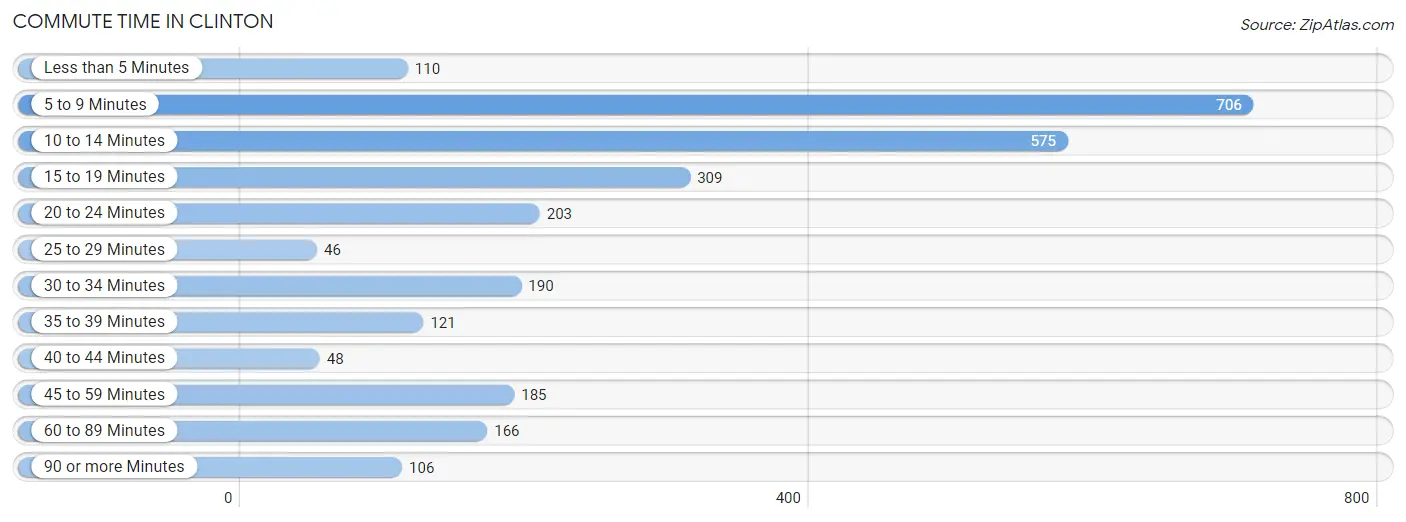
| Commute Time | # Commuters | % Commuters |
| Less than 5 Minutes | 110 | 4.0% |
| 5 to 9 Minutes | 706 | 25.5% |
| 10 to 14 Minutes | 575 | 20.8% |
| 15 to 19 Minutes | 309 | 11.2% |
| 20 to 24 Minutes | 203 | 7.3% |
| 25 to 29 Minutes | 46 | 1.7% |
| 30 to 34 Minutes | 190 | 6.9% |
| 35 to 39 Minutes | 121 | 4.4% |
| 40 to 44 Minutes | 48 | 1.7% |
| 45 to 59 Minutes | 185 | 6.7% |
| 60 to 89 Minutes | 166 | 6.0% |
| 90 or more Minutes | 106 | 3.8% |
Commute Time by Sex in Clinton
The most common commute times in Clinton are 5 to 9 minutes (371 commuters, 24.3%) for males and 5 to 9 minutes (335 commuters, 27.1%) for females.
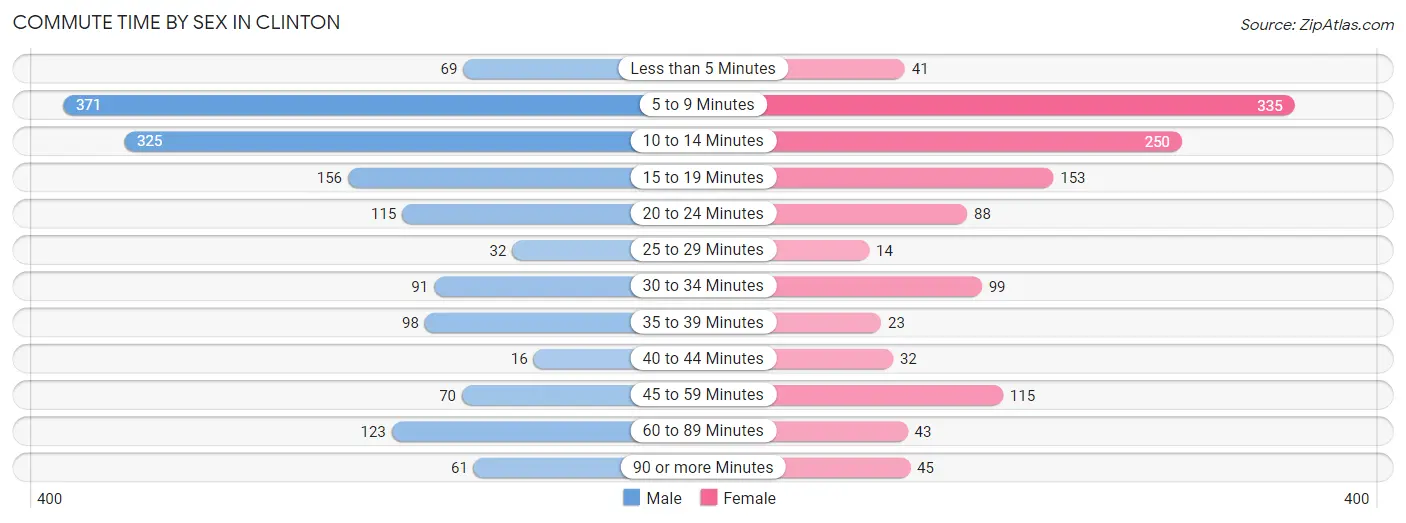
| Commute Time | Male | Female |
| Less than 5 Minutes | 69 (4.5%) | 41 (3.3%) |
| 5 to 9 Minutes | 371 (24.3%) | 335 (27.1%) |
| 10 to 14 Minutes | 325 (21.3%) | 250 (20.2%) |
| 15 to 19 Minutes | 156 (10.2%) | 153 (12.4%) |
| 20 to 24 Minutes | 115 (7.5%) | 88 (7.1%) |
| 25 to 29 Minutes | 32 (2.1%) | 14 (1.1%) |
| 30 to 34 Minutes | 91 (6.0%) | 99 (8.0%) |
| 35 to 39 Minutes | 98 (6.4%) | 23 (1.9%) |
| 40 to 44 Minutes | 16 (1.1%) | 32 (2.6%) |
| 45 to 59 Minutes | 70 (4.6%) | 115 (9.3%) |
| 60 to 89 Minutes | 123 (8.1%) | 43 (3.5%) |
| 90 or more Minutes | 61 (4.0%) | 45 (3.6%) |
Time of Departure to Work by Sex in Clinton
The most frequent times of departure to work in Clinton are 7:00 AM to 7:29 AM (278, 18.2%) for males and 7:00 AM to 7:29 AM (255, 20.6%) for females.
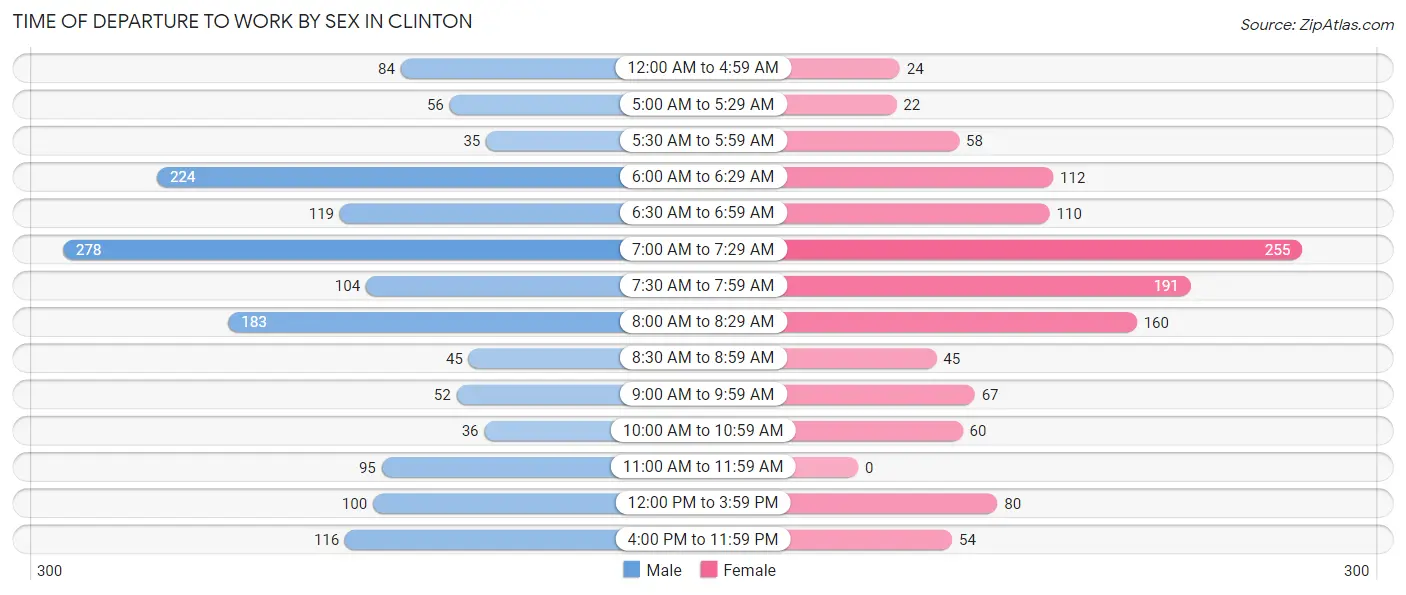
| Time of Departure | Male | Female |
| 12:00 AM to 4:59 AM | 84 (5.5%) | 24 (1.9%) |
| 5:00 AM to 5:29 AM | 56 (3.7%) | 22 (1.8%) |
| 5:30 AM to 5:59 AM | 35 (2.3%) | 58 (4.7%) |
| 6:00 AM to 6:29 AM | 224 (14.7%) | 112 (9.0%) |
| 6:30 AM to 6:59 AM | 119 (7.8%) | 110 (8.9%) |
| 7:00 AM to 7:29 AM | 278 (18.2%) | 255 (20.6%) |
| 7:30 AM to 7:59 AM | 104 (6.8%) | 191 (15.4%) |
| 8:00 AM to 8:29 AM | 183 (12.0%) | 160 (12.9%) |
| 8:30 AM to 8:59 AM | 45 (2.9%) | 45 (3.6%) |
| 9:00 AM to 9:59 AM | 52 (3.4%) | 67 (5.4%) |
| 10:00 AM to 10:59 AM | 36 (2.4%) | 60 (4.9%) |
| 11:00 AM to 11:59 AM | 95 (6.2%) | 0 (0.0%) |
| 12:00 PM to 3:59 PM | 100 (6.6%) | 80 (6.5%) |
| 4:00 PM to 11:59 PM | 116 (7.6%) | 54 (4.4%) |
| Total | 1,527 (100.0%) | 1,238 (100.0%) |
Housing Occupancy in Clinton
Occupancy by Ownership in Clinton
Of the total 2,933 dwellings in Clinton, owner-occupied units account for 1,383 (47.1%), while renter-occupied units make up 1,550 (52.8%).
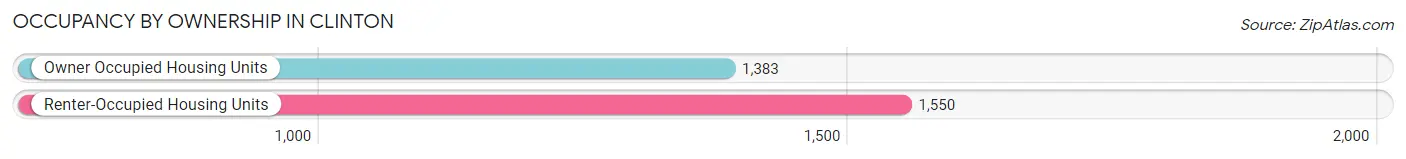
| Occupancy | # Housing Units | % Housing Units |
| Owner Occupied Housing Units | 1,383 | 47.1% |
| Renter-Occupied Housing Units | 1,550 | 52.8% |
| Total Occupied Housing Units | 2,933 | 100.0% |
Occupancy by Household Size in Clinton
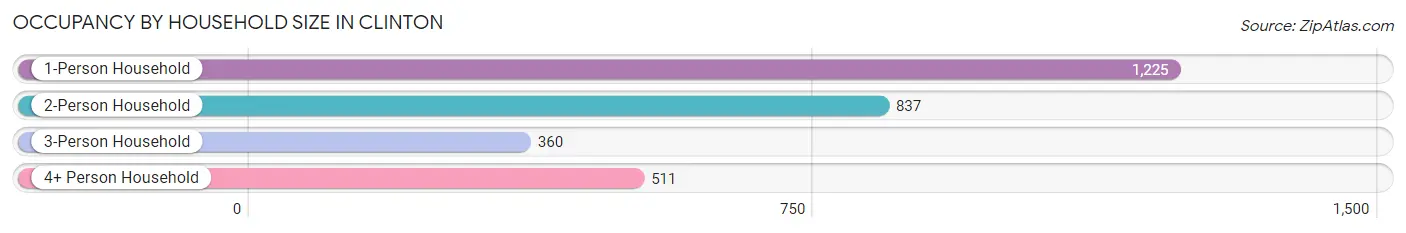
| Household Size | # Housing Units | % Housing Units |
| 1-Person Household | 1,225 | 41.8% |
| 2-Person Household | 837 | 28.5% |
| 3-Person Household | 360 | 12.3% |
| 4+ Person Household | 511 | 17.4% |
| Total Housing Units | 2,933 | 100.0% |
Occupancy by Ownership by Household Size in Clinton
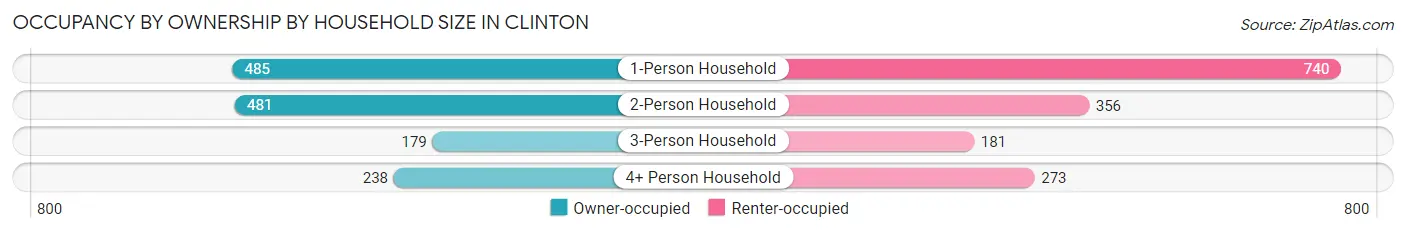
| Household Size | Owner-occupied | Renter-occupied |
| 1-Person Household | 485 (39.6%) | 740 (60.4%) |
| 2-Person Household | 481 (57.5%) | 356 (42.5%) |
| 3-Person Household | 179 (49.7%) | 181 (50.3%) |
| 4+ Person Household | 238 (46.6%) | 273 (53.4%) |
| Total Housing Units | 1,383 (47.1%) | 1,550 (52.8%) |
Occupancy by Educational Attainment in Clinton
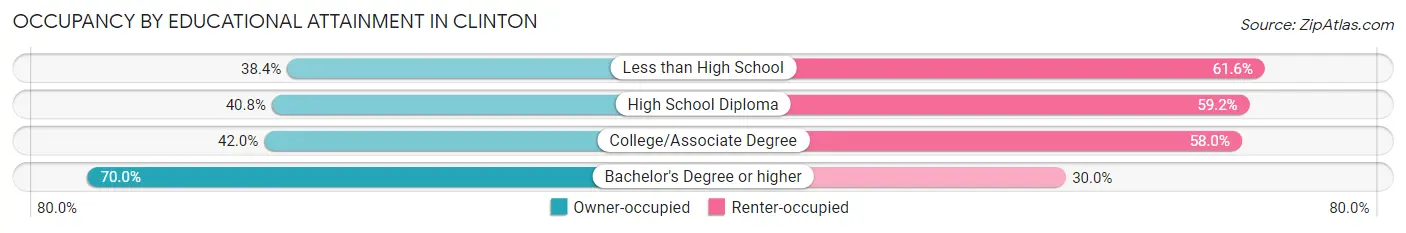
| Household Size | Owner-occupied | Renter-occupied |
| Less than High School | 178 (38.4%) | 286 (61.6%) |
| High School Diploma | 359 (40.8%) | 521 (59.2%) |
| College/Associate Degree | 400 (42.0%) | 552 (58.0%) |
| Bachelor's Degree or higher | 446 (70.0%) | 191 (30.0%) |
Occupancy by Age of Householder in Clinton
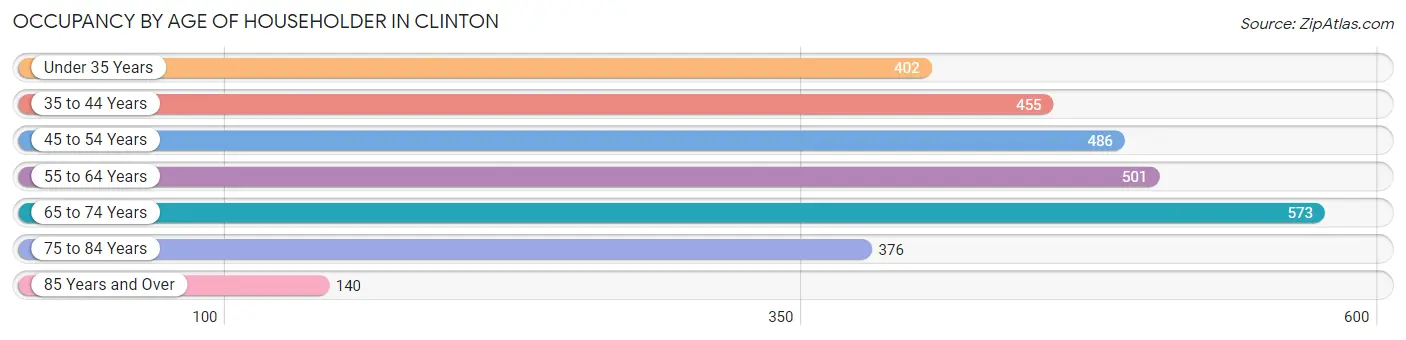
| Age Bracket | # Households | % Households |
| Under 35 Years | 402 | 13.7% |
| 35 to 44 Years | 455 | 15.5% |
| 45 to 54 Years | 486 | 16.6% |
| 55 to 64 Years | 501 | 17.1% |
| 65 to 74 Years | 573 | 19.5% |
| 75 to 84 Years | 376 | 12.8% |
| 85 Years and Over | 140 | 4.8% |
| Total | 2,933 | 100.0% |
Housing Finances in Clinton
Median Income by Occupancy in Clinton
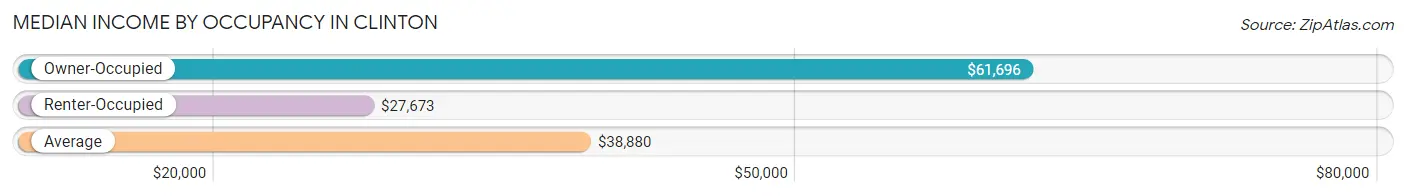
| Occupancy Type | # Households | Median Income |
| Owner-Occupied | 1,383 (47.1%) | $61,696 |
| Renter-Occupied | 1,550 (52.8%) | $27,673 |
| Average | 2,933 (100.0%) | $38,880 |
Occupancy by Householder Income Bracket in Clinton
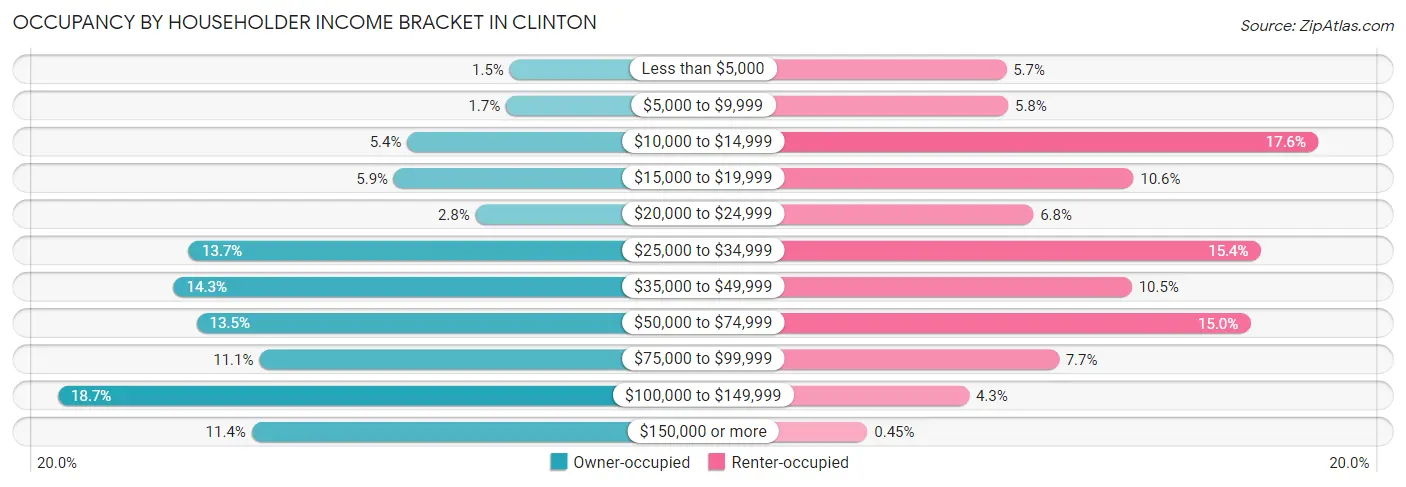
| Income Bracket | Owner-occupied | Renter-occupied |
| Less than $5,000 | 21 (1.5%) | 89 (5.7%) |
| $5,000 to $9,999 | 23 (1.7%) | 90 (5.8%) |
| $10,000 to $14,999 | 75 (5.4%) | 273 (17.6%) |
| $15,000 to $19,999 | 82 (5.9%) | 164 (10.6%) |
| $20,000 to $24,999 | 39 (2.8%) | 105 (6.8%) |
| $25,000 to $34,999 | 190 (13.7%) | 239 (15.4%) |
| $35,000 to $49,999 | 198 (14.3%) | 163 (10.5%) |
| $50,000 to $74,999 | 186 (13.5%) | 233 (15.0%) |
| $75,000 to $99,999 | 153 (11.1%) | 120 (7.7%) |
| $100,000 to $149,999 | 259 (18.7%) | 67 (4.3%) |
| $150,000 or more | 157 (11.4%) | 7 (0.4%) |
| Total | 1,383 (100.0%) | 1,550 (100.0%) |
Monthly Housing Cost Tiers in Clinton
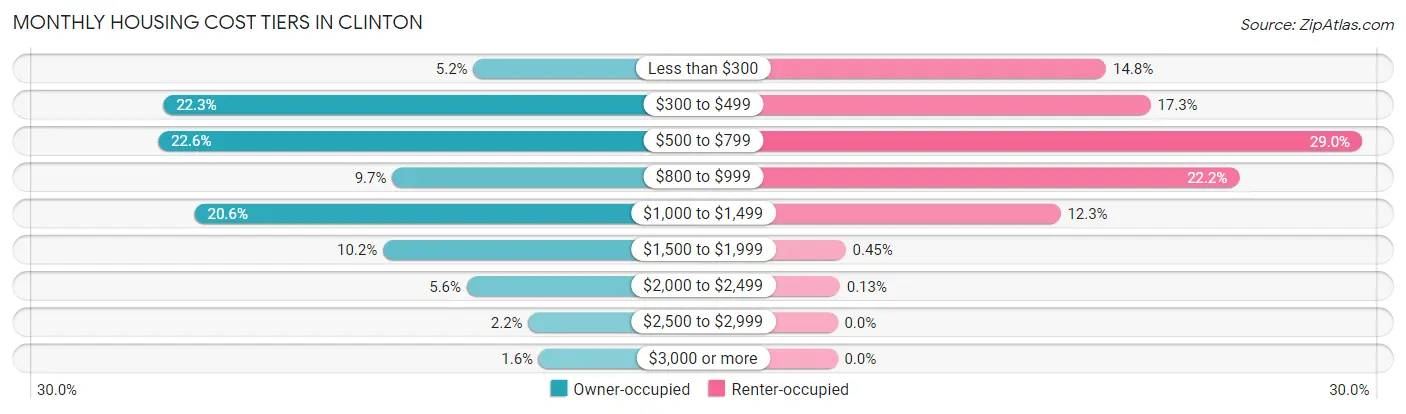
| Monthly Cost | Owner-occupied | Renter-occupied |
| Less than $300 | 72 (5.2%) | 230 (14.8%) |
| $300 to $499 | 309 (22.3%) | 268 (17.3%) |
| $500 to $799 | 313 (22.6%) | 449 (29.0%) |
| $800 to $999 | 134 (9.7%) | 344 (22.2%) |
| $1,000 to $1,499 | 285 (20.6%) | 191 (12.3%) |
| $1,500 to $1,999 | 141 (10.2%) | 7 (0.4%) |
| $2,000 to $2,499 | 77 (5.6%) | 2 (0.1%) |
| $2,500 to $2,999 | 30 (2.2%) | 0 (0.0%) |
| $3,000 or more | 22 (1.6%) | 0 (0.0%) |
| Total | 1,383 (100.0%) | 1,550 (100.0%) |
Physical Housing Characteristics in Clinton
Housing Structures in Clinton
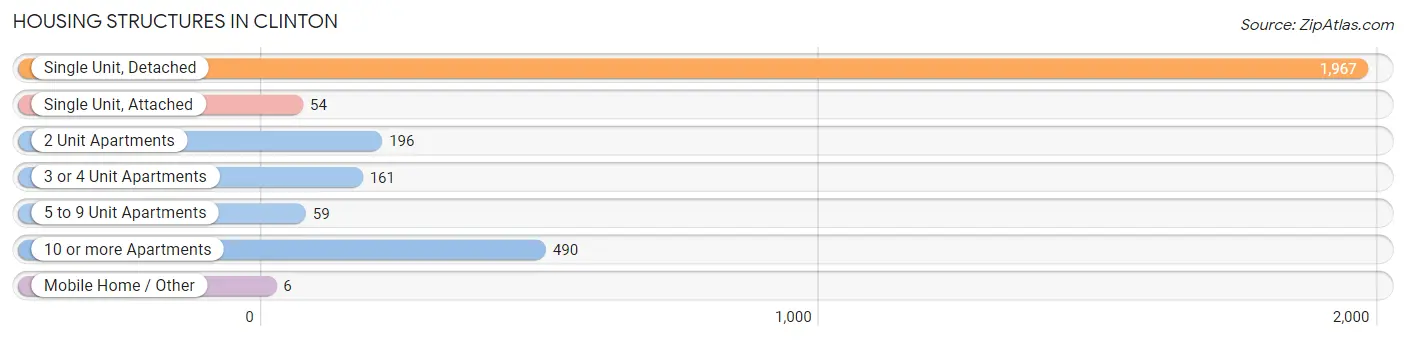
| Structure Type | # Housing Units | % Housing Units |
| Single Unit, Detached | 1,967 | 67.1% |
| Single Unit, Attached | 54 | 1.8% |
| 2 Unit Apartments | 196 | 6.7% |
| 3 or 4 Unit Apartments | 161 | 5.5% |
| 5 to 9 Unit Apartments | 59 | 2.0% |
| 10 or more Apartments | 490 | 16.7% |
| Mobile Home / Other | 6 | 0.2% |
| Total | 2,933 | 100.0% |
Housing Structures by Occupancy in Clinton
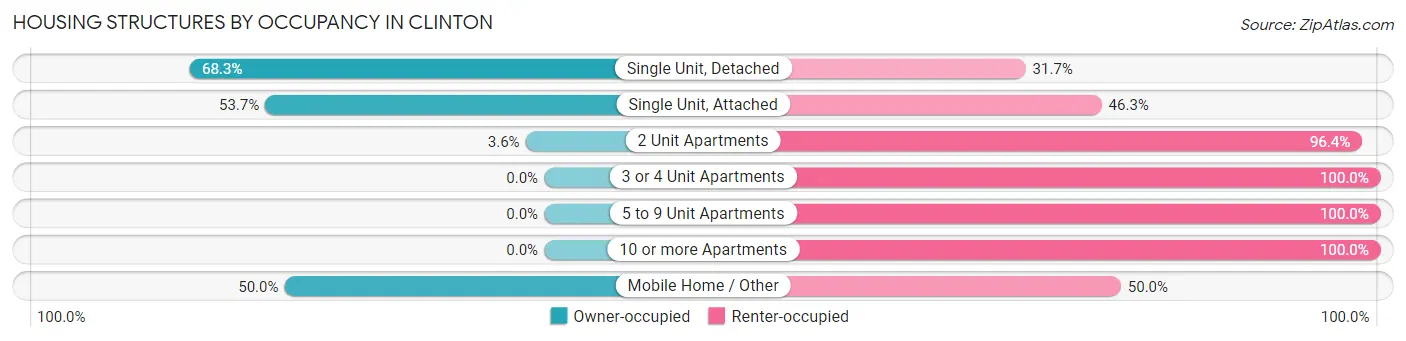
| Structure Type | Owner-occupied | Renter-occupied |
| Single Unit, Detached | 1,344 (68.3%) | 623 (31.7%) |
| Single Unit, Attached | 29 (53.7%) | 25 (46.3%) |
| 2 Unit Apartments | 7 (3.6%) | 189 (96.4%) |
| 3 or 4 Unit Apartments | 0 (0.0%) | 161 (100.0%) |
| 5 to 9 Unit Apartments | 0 (0.0%) | 59 (100.0%) |
| 10 or more Apartments | 0 (0.0%) | 490 (100.0%) |
| Mobile Home / Other | 3 (50.0%) | 3 (50.0%) |
| Total | 1,383 (47.1%) | 1,550 (52.8%) |
Housing Structures by Number of Rooms in Clinton
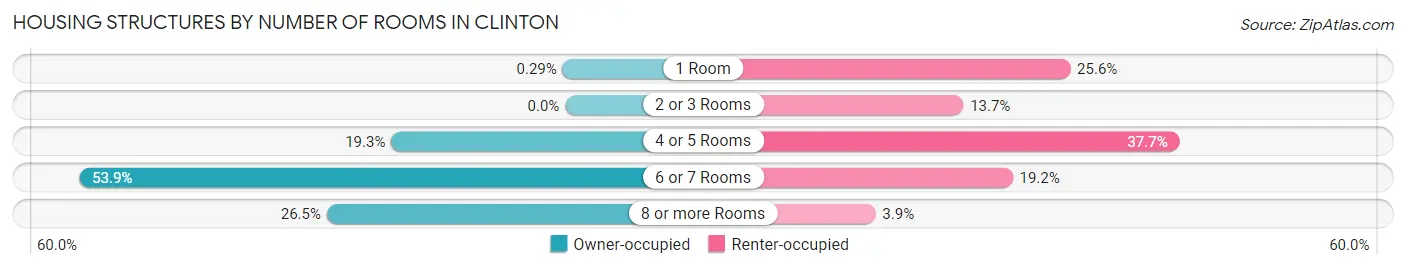
| Number of Rooms | Owner-occupied | Renter-occupied |
| 1 Room | 4 (0.3%) | 396 (25.6%) |
| 2 or 3 Rooms | 0 (0.0%) | 212 (13.7%) |
| 4 or 5 Rooms | 267 (19.3%) | 584 (37.7%) |
| 6 or 7 Rooms | 746 (53.9%) | 297 (19.2%) |
| 8 or more Rooms | 366 (26.5%) | 61 (3.9%) |
| Total | 1,383 (100.0%) | 1,550 (100.0%) |
Housing Structure by Heating Type in Clinton
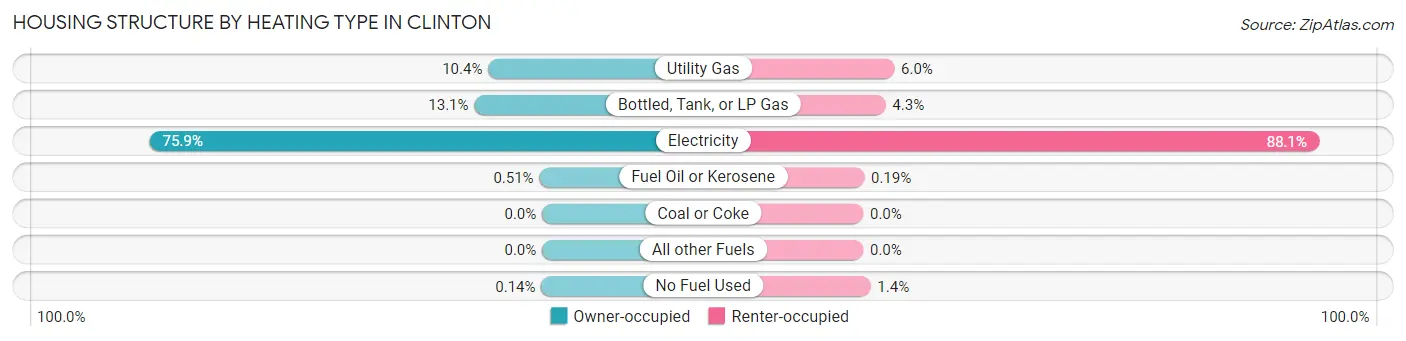
| Heating Type | Owner-occupied | Renter-occupied |
| Utility Gas | 144 (10.4%) | 93 (6.0%) |
| Bottled, Tank, or LP Gas | 181 (13.1%) | 67 (4.3%) |
| Electricity | 1,049 (75.8%) | 1,365 (88.1%) |
| Fuel Oil or Kerosene | 7 (0.5%) | 3 (0.2%) |
| Coal or Coke | 0 (0.0%) | 0 (0.0%) |
| All other Fuels | 0 (0.0%) | 0 (0.0%) |
| No Fuel Used | 2 (0.1%) | 22 (1.4%) |
| Total | 1,383 (100.0%) | 1,550 (100.0%) |
Household Vehicle Usage in Clinton
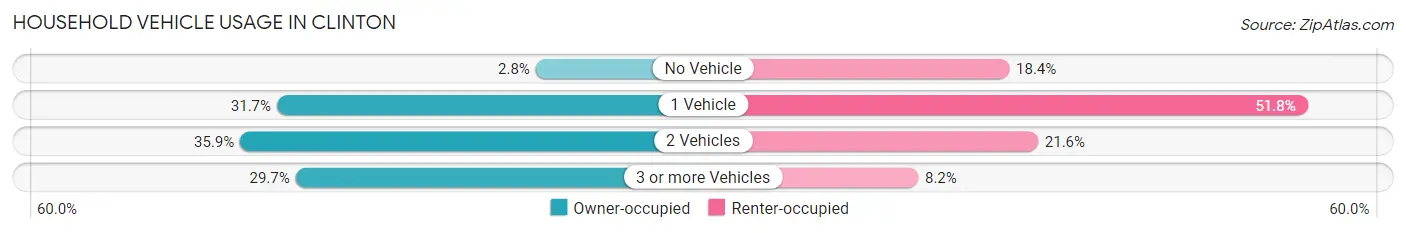
| Vehicles per Household | Owner-occupied | Renter-occupied |
| No Vehicle | 38 (2.8%) | 285 (18.4%) |
| 1 Vehicle | 439 (31.7%) | 803 (51.8%) |
| 2 Vehicles | 496 (35.9%) | 335 (21.6%) |
| 3 or more Vehicles | 410 (29.6%) | 127 (8.2%) |
| Total | 1,383 (100.0%) | 1,550 (100.0%) |
Real Estate & Mortgages in Clinton
Real Estate and Mortgage Overview in Clinton
| Characteristic | Without Mortgage | With Mortgage |
| Housing Units | 699 | 684 |
| Median Property Value | $163,400 | $156,300 |
| Median Household Income | $42,198 | $101 |
| Monthly Housing Costs | $480 | $22 |
| Real Estate Taxes | $1,365 | $7 |
Property Value by Mortgage Status in Clinton
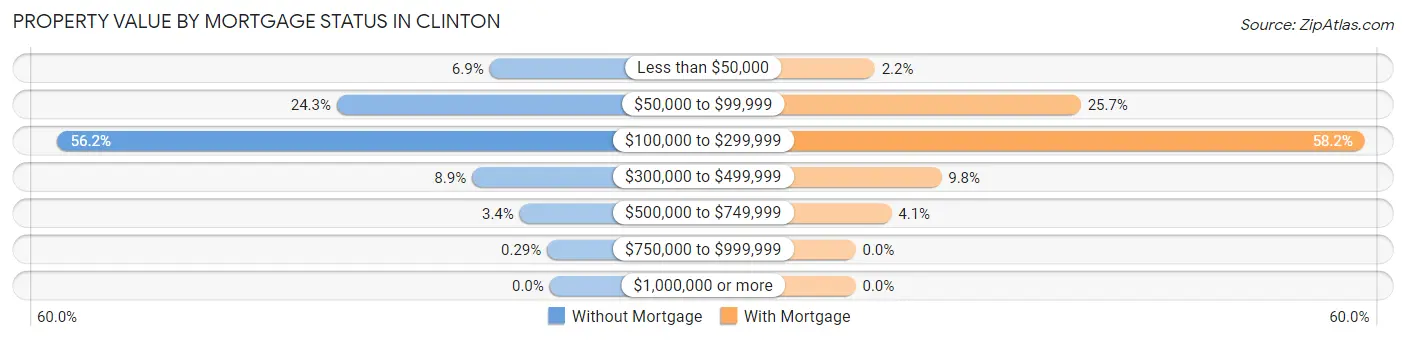
| Property Value | Without Mortgage | With Mortgage |
| Less than $50,000 | 48 (6.9%) | 15 (2.2%) |
| $50,000 to $99,999 | 170 (24.3%) | 176 (25.7%) |
| $100,000 to $299,999 | 393 (56.2%) | 398 (58.2%) |
| $300,000 to $499,999 | 62 (8.9%) | 67 (9.8%) |
| $500,000 to $749,999 | 24 (3.4%) | 28 (4.1%) |
| $750,000 to $999,999 | 2 (0.3%) | 0 (0.0%) |
| $1,000,000 or more | 0 (0.0%) | 0 (0.0%) |
| Total | 699 (100.0%) | 684 (100.0%) |
Household Income by Mortgage Status in Clinton
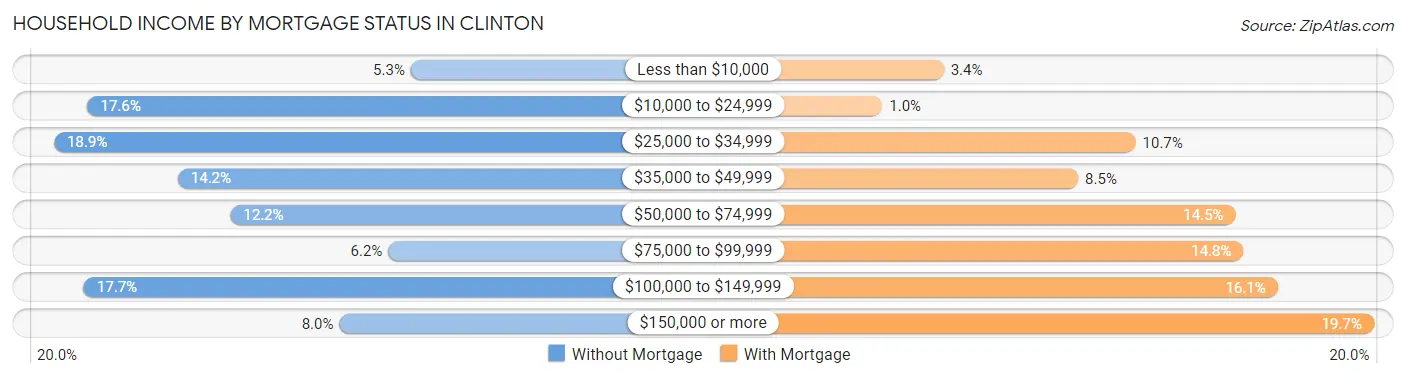
| Household Income | Without Mortgage | With Mortgage |
| Less than $10,000 | 37 (5.3%) | 23 (3.4%) |
| $10,000 to $24,999 | 123 (17.6%) | 7 (1.0%) |
| $25,000 to $34,999 | 132 (18.9%) | 73 (10.7%) |
| $35,000 to $49,999 | 99 (14.2%) | 58 (8.5%) |
| $50,000 to $74,999 | 85 (12.2%) | 99 (14.5%) |
| $75,000 to $99,999 | 43 (6.1%) | 101 (14.8%) |
| $100,000 to $149,999 | 124 (17.7%) | 110 (16.1%) |
| $150,000 or more | 56 (8.0%) | 135 (19.7%) |
| Total | 699 (100.0%) | 684 (100.0%) |
Property Value to Household Income Ratio in Clinton
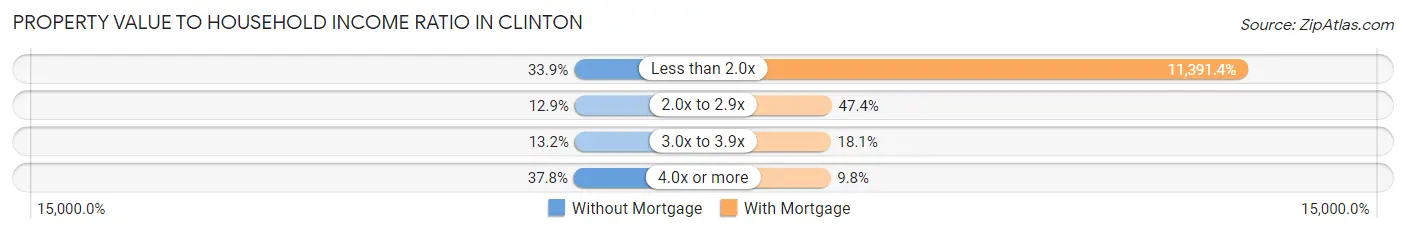
| Value-to-Income Ratio | Without Mortgage | With Mortgage |
| Less than 2.0x | 237 (33.9%) | 77,917 (11,391.4%) |
| 2.0x to 2.9x | 90 (12.9%) | 324 (47.4%) |
| 3.0x to 3.9x | 92 (13.2%) | 124 (18.1%) |
| 4.0x or more | 264 (37.8%) | 67 (9.8%) |
| Total | 699 (100.0%) | 684 (100.0%) |
Real Estate Taxes by Mortgage Status in Clinton
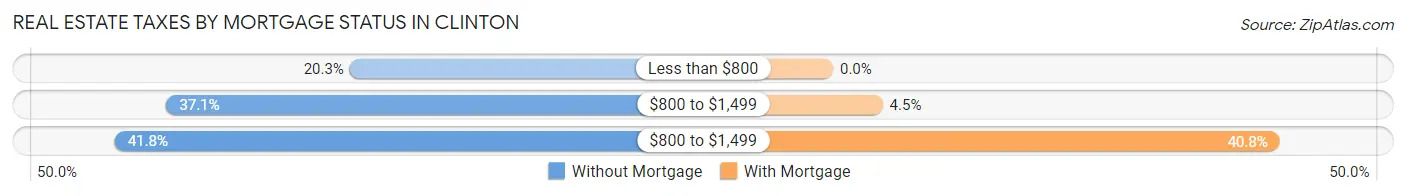
| Property Taxes | Without Mortgage | With Mortgage |
| Less than $800 | 142 (20.3%) | 0 (0.0%) |
| $800 to $1,499 | 259 (37.0%) | 31 (4.5%) |
| $800 to $1,499 | 292 (41.8%) | 279 (40.8%) |
| Total | 699 (100.0%) | 684 (100.0%) |
Health & Disability in Clinton
Health Insurance Coverage by Age in Clinton
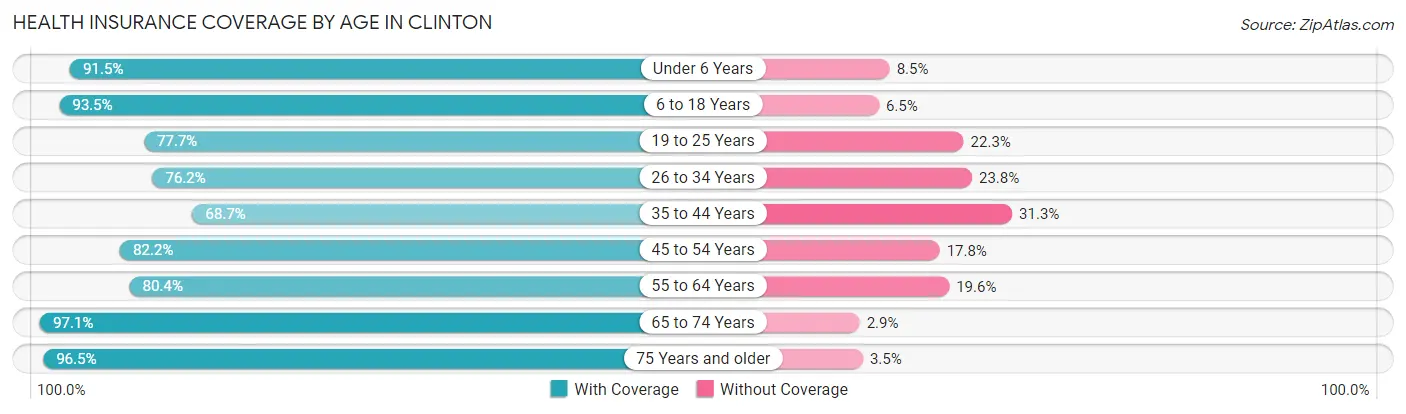
| Age Bracket | With Coverage | Without Coverage |
| Under 6 Years | 605 (91.5%) | 56 (8.5%) |
| 6 to 18 Years | 1,229 (93.5%) | 85 (6.5%) |
| 19 to 25 Years | 454 (77.7%) | 130 (22.3%) |
| 26 to 34 Years | 569 (76.2%) | 178 (23.8%) |
| 35 to 44 Years | 551 (68.7%) | 251 (31.3%) |
| 45 to 54 Years | 624 (82.2%) | 135 (17.8%) |
| 55 to 64 Years | 703 (80.4%) | 171 (19.6%) |
| 65 to 74 Years | 1,047 (97.1%) | 31 (2.9%) |
| 75 Years and older | 721 (96.5%) | 26 (3.5%) |
| Total | 6,503 (86.0%) | 1,063 (14.1%) |
Health Insurance Coverage by Citizenship Status in Clinton
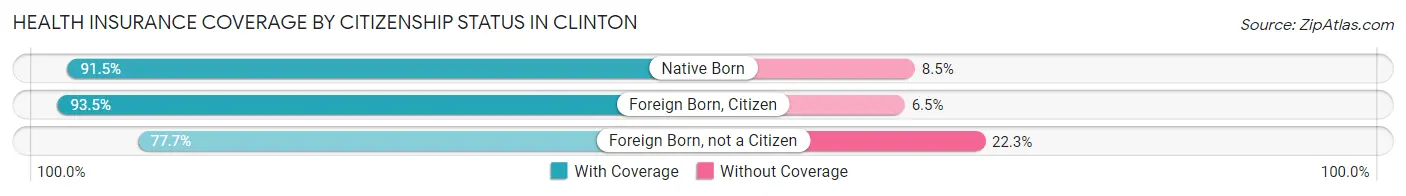
| Citizenship Status | With Coverage | Without Coverage |
| Native Born | 605 (91.5%) | 56 (8.5%) |
| Foreign Born, Citizen | 1,229 (93.5%) | 85 (6.5%) |
| Foreign Born, not a Citizen | 454 (77.7%) | 130 (22.3%) |
Health Insurance Coverage by Household Income in Clinton
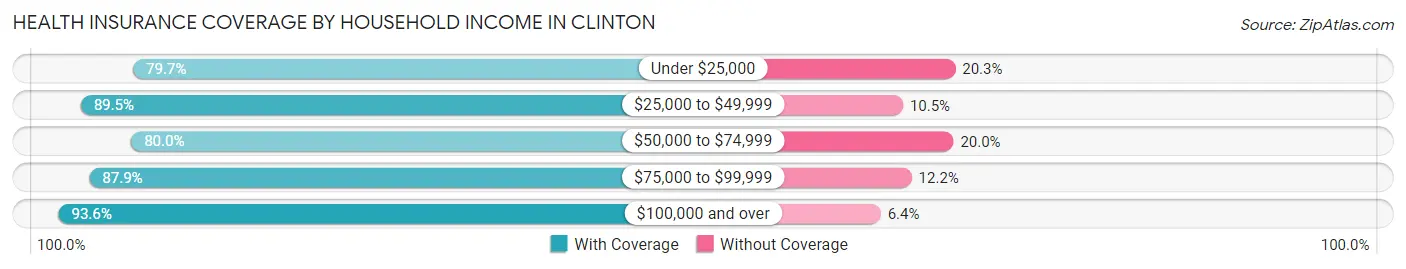
| Household Income | With Coverage | Without Coverage |
| Under $25,000 | 1,565 (79.7%) | 399 (20.3%) |
| $25,000 to $49,999 | 1,727 (89.5%) | 203 (10.5%) |
| $50,000 to $74,999 | 985 (80.0%) | 246 (20.0%) |
| $75,000 to $99,999 | 759 (87.8%) | 105 (12.1%) |
| $100,000 and over | 1,398 (93.6%) | 95 (6.4%) |
Public vs Private Health Insurance Coverage by Age in Clinton
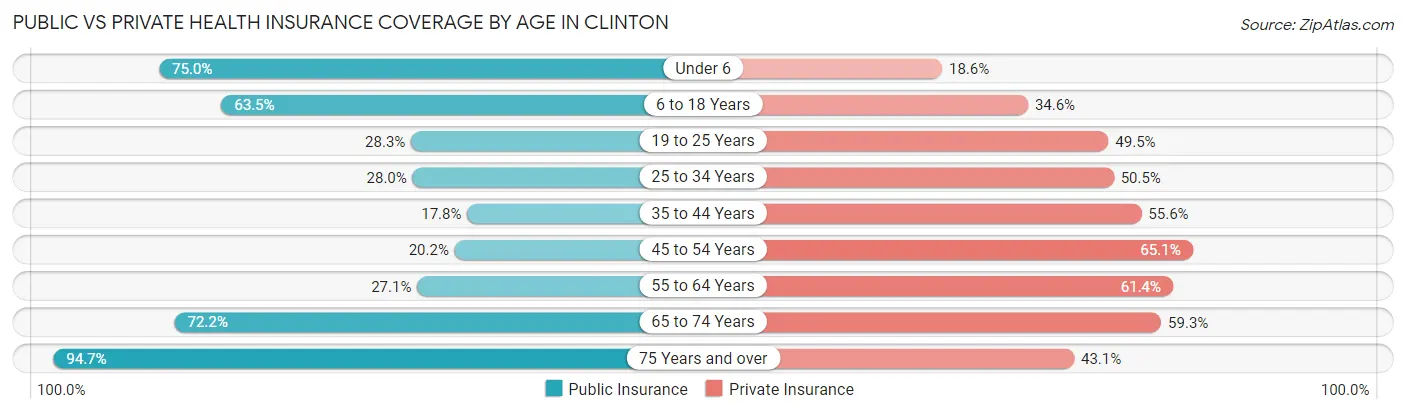
| Age Bracket | Public Insurance | Private Insurance |
| Under 6 | 496 (75.0%) | 123 (18.6%) |
| 6 to 18 Years | 834 (63.5%) | 454 (34.5%) |
| 19 to 25 Years | 165 (28.2%) | 289 (49.5%) |
| 25 to 34 Years | 209 (28.0%) | 377 (50.5%) |
| 35 to 44 Years | 143 (17.8%) | 446 (55.6%) |
| 45 to 54 Years | 153 (20.2%) | 494 (65.1%) |
| 55 to 64 Years | 237 (27.1%) | 537 (61.4%) |
| 65 to 74 Years | 778 (72.2%) | 639 (59.3%) |
| 75 Years and over | 707 (94.7%) | 322 (43.1%) |
| Total | 3,722 (49.2%) | 3,681 (48.6%) |
Disability Status by Sex by Age in Clinton
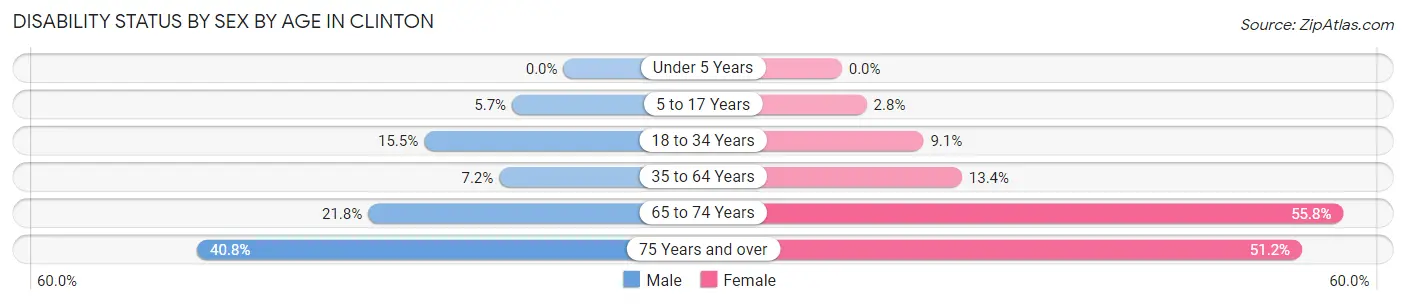
| Age Bracket | Male | Female |
| Under 5 Years | 0 (0.0%) | 0 (0.0%) |
| 5 to 17 Years | 44 (5.7%) | 17 (2.8%) |
| 18 to 34 Years | 98 (15.5%) | 68 (9.1%) |
| 35 to 64 Years | 87 (7.1%) | 163 (13.4%) |
| 65 to 74 Years | 67 (21.7%) | 430 (55.8%) |
| 75 Years and over | 124 (40.8%) | 227 (51.2%) |
Disability Class by Sex by Age in Clinton
Disability Class: Hearing Difficulty
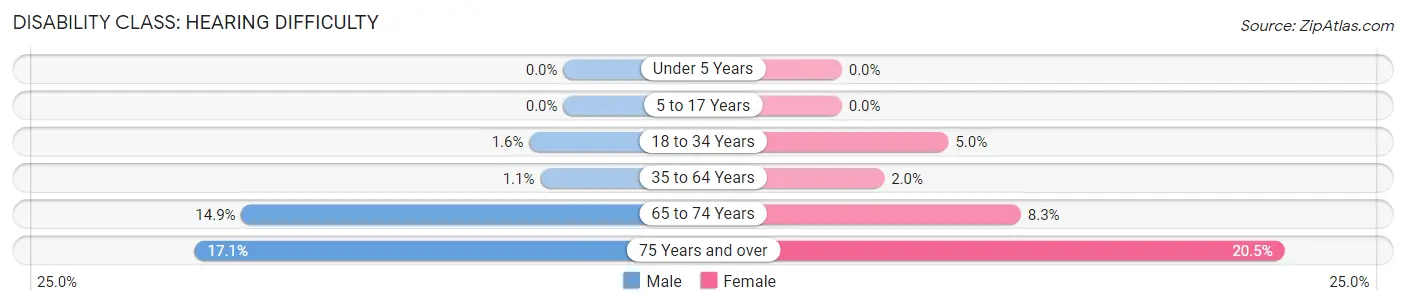
| Age Bracket | Male | Female |
| Under 5 Years | 0 (0.0%) | 0 (0.0%) |
| 5 to 17 Years | 0 (0.0%) | 0 (0.0%) |
| 18 to 34 Years | 10 (1.6%) | 37 (5.0%) |
| 35 to 64 Years | 13 (1.1%) | 24 (2.0%) |
| 65 to 74 Years | 46 (14.9%) | 64 (8.3%) |
| 75 Years and over | 52 (17.1%) | 91 (20.5%) |
Disability Class: Vision Difficulty
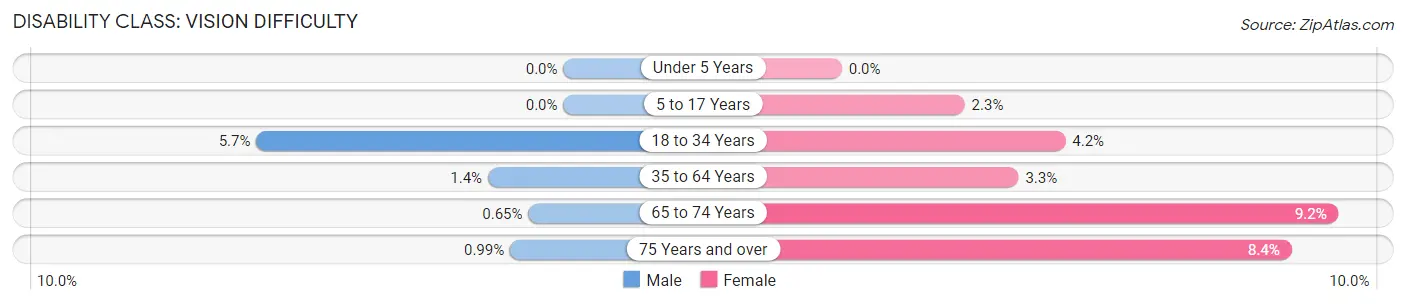
| Age Bracket | Male | Female |
| Under 5 Years | 0 (0.0%) | 0 (0.0%) |
| 5 to 17 Years | 0 (0.0%) | 14 (2.3%) |
| 18 to 34 Years | 36 (5.7%) | 31 (4.2%) |
| 35 to 64 Years | 17 (1.4%) | 40 (3.3%) |
| 65 to 74 Years | 2 (0.6%) | 71 (9.2%) |
| 75 Years and over | 3 (1.0%) | 37 (8.4%) |
Disability Class: Cognitive Difficulty
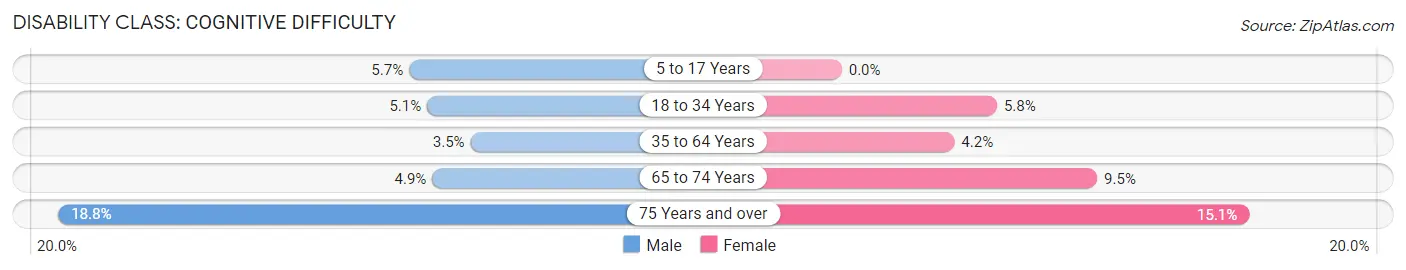
| Age Bracket | Male | Female |
| 5 to 17 Years | 44 (5.7%) | 0 (0.0%) |
| 18 to 34 Years | 32 (5.1%) | 43 (5.8%) |
| 35 to 64 Years | 42 (3.5%) | 51 (4.2%) |
| 65 to 74 Years | 15 (4.9%) | 73 (9.5%) |
| 75 Years and over | 57 (18.8%) | 67 (15.1%) |
Disability Class: Ambulatory Difficulty
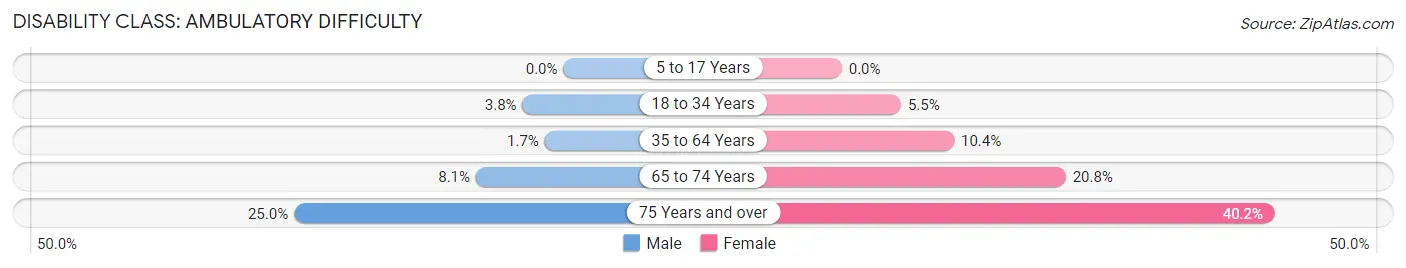
| Age Bracket | Male | Female |
| 5 to 17 Years | 0 (0.0%) | 0 (0.0%) |
| 18 to 34 Years | 24 (3.8%) | 41 (5.5%) |
| 35 to 64 Years | 21 (1.7%) | 127 (10.4%) |
| 65 to 74 Years | 25 (8.1%) | 160 (20.8%) |
| 75 Years and over | 76 (25.0%) | 178 (40.2%) |
Disability Class: Self-Care Difficulty
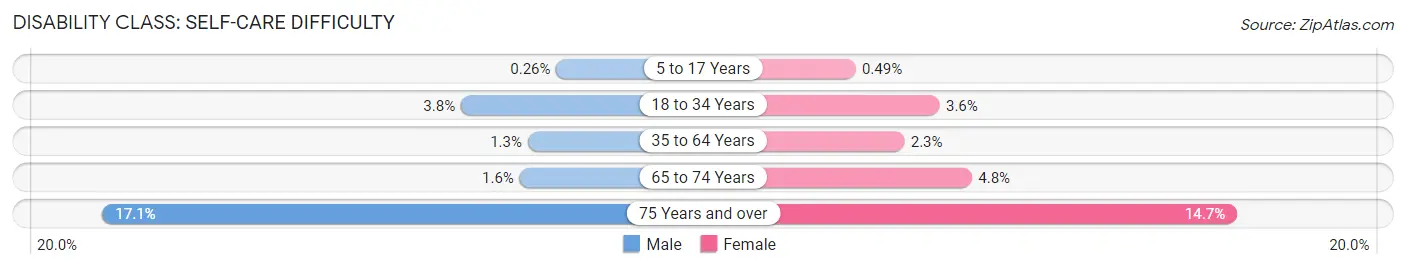
| Age Bracket | Male | Female |
| 5 to 17 Years | 2 (0.3%) | 3 (0.5%) |
| 18 to 34 Years | 24 (3.8%) | 27 (3.6%) |
| 35 to 64 Years | 16 (1.3%) | 28 (2.3%) |
| 65 to 74 Years | 5 (1.6%) | 37 (4.8%) |
| 75 Years and over | 52 (17.1%) | 65 (14.7%) |
Technology Access in Clinton
Computing Device Access in Clinton
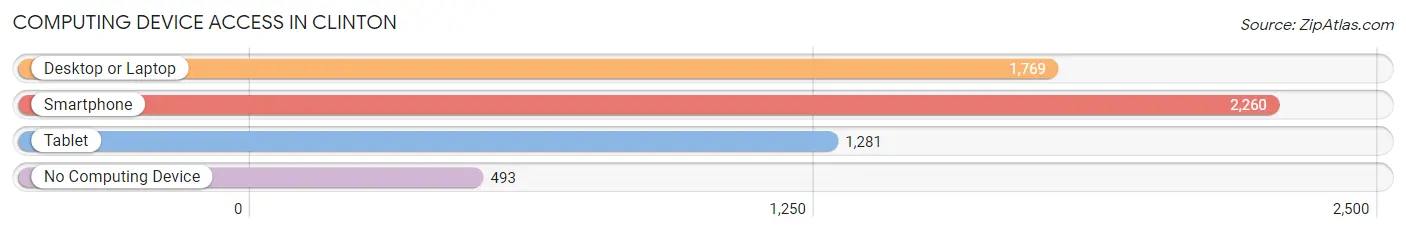
| Device Type | # Households | % Households |
| Desktop or Laptop | 1,769 | 60.3% |
| Smartphone | 2,260 | 77.0% |
| Tablet | 1,281 | 43.7% |
| No Computing Device | 493 | 16.8% |
| Total | 2,933 | 100.0% |
Internet Access in Clinton
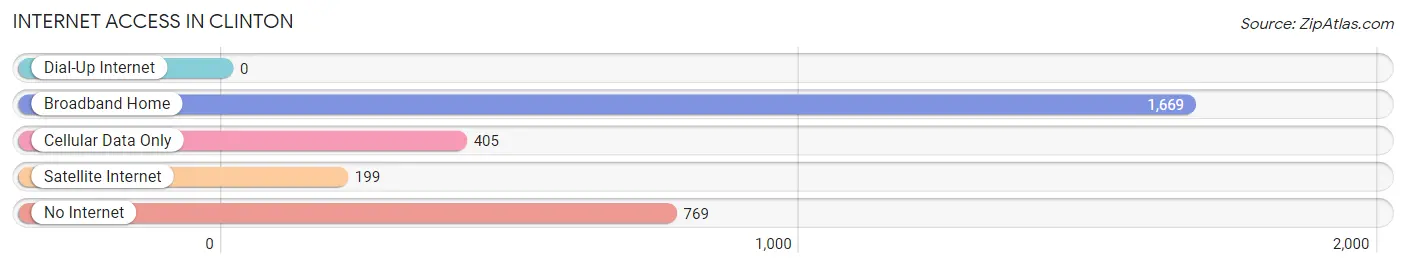
| Internet Type | # Households | % Households |
| Dial-Up Internet | 0 | 0.0% |
| Broadband Home | 1,669 | 56.9% |
| Cellular Data Only | 405 | 13.8% |
| Satellite Internet | 199 | 6.8% |
| No Internet | 769 | 26.2% |
| Total | 2,933 | 100.0% |
Clinton Summary
Clinton, North Carolina is a small town located in the eastern part of the state, in Sampson County. It is situated on the banks of the Cape Fear River, and is part of the Fayetteville metropolitan area. The town has a population of 8,639, according to the 2010 census, and is the county seat of Sampson County.
History
The area that is now Clinton was first settled in the late 1700s by a group of Quakers from Pennsylvania. The town was originally known as Clinton Courthouse, and was named after Richard Clinton, a Revolutionary War hero. The town was officially incorporated in 1852, and the courthouse was built in 1854.
In the late 1800s, Clinton was a major center for the production of naval stores, such as turpentine and rosin. The town was also home to several cotton mills, and was a major stop on the Wilmington and Weldon Railroad.
Geography
Clinton is located in the eastern part of North Carolina, in Sampson County. It is situated on the banks of the Cape Fear River, and is part of the Fayetteville metropolitan area. The town has a total area of 8.3 square miles, of which 8.2 square miles is land and 0.1 square miles is water.
Economy
Clinton’s economy is largely based on agriculture and manufacturing. The town is home to several large poultry processing plants, as well as a number of smaller businesses. The town is also home to several large retail stores, including Walmart and Lowe’s.
Demographics
According to the 2010 census, Clinton has a population of 8,639. The racial makeup of the town is 73.3% White, 22.2% African American, 0.5% Native American, 0.7% Asian, 0.1% Pacific Islander, 1.7% from other races, and 1.5% from two or more races. The median household income is $30,945, and the median family income is $37,917.
Conclusion
Clinton, North Carolina is a small town located in the eastern part of the state, in Sampson County. It is situated on the banks of the Cape Fear River, and is part of the Fayetteville metropolitan area. The town has a population of 8,639, according to the 2010 census, and is the county seat of Sampson County. The town’s economy is largely based on agriculture and manufacturing, and it is home to several large poultry processing plants, as well as a number of smaller businesses. The racial makeup of the town is 73.3% White, 22.2% African American, 0.5% Native American, 0.7% Asian, 0.1% Pacific Islander, 1.7% from other races, and 1.5% from two or more races. The median household income is $30,945, and the median family income is $37,917.
Common Questions
What is the Total Population of Clinton?
Total Population of Clinton is 8,362.
What is the Total Male Population of Clinton?
Total Male Population of Clinton is 4,123.
What is the Total Female Population of Clinton?
Total Female Population of Clinton is 4,239.
What is the Ratio of Males per 100 Females in Clinton?
There are 97.26 Males per 100 Females in Clinton.
What is the Ratio of Females per 100 Males in Clinton?
There are 102.81 Females per 100 Males in Clinton.
What is the Median Population Age in Clinton?
Median Population Age in Clinton is 41.8 Years.
What is the Average Family Size in Clinton
Average Family Size in Clinton is 3.7 People.
What is the Average Household Size in Clinton
Average Household Size in Clinton is 2.6 People.
What is Per Capita Income in Clinton?
Per Capita income in Clinton is $24,421.
What is the Median Family Income in Clinton?
Median Family Income in Clinton is $60,106.
What is the Median Household income in Clinton?
Median Household Income in Clinton is $38,880.
What is Income or Wage Gap in Clinton?
Income or Wage Gap in Clinton is 3.3%.
Women in Clinton earn 96.7 cents for every dollar earned by a man.
What is Inequality or Gini Index in Clinton?
Inequality or Gini Index in Clinton is 0.53.
How Large is the Labor Force in Clinton?
There are 3,123 People in the Labor Forcein in Clinton.
What is the Percentage of People in the Labor Force in Clinton?
46.7% of People are in the Labor Force in Clinton.
What is the Unemployment Rate in Clinton?
Unemployment Rate in Clinton is 4.6%.