Sugar Mountain, NC
Sugar Mountain Map
Sugar Mountain Overview
489
TOTAL POPULATION
230
MALE POPULATION
259
FEMALE POPULATION
88.80
MALES / 100 FEMALES
112.61
FEMALES / 100 MALES
61.2
MEDIAN AGE
2.5
AVG FAMILY SIZE
2.0
AVG HOUSEHOLD SIZE
$67,622
PER CAPITA INCOME
$133,750
AVG FAMILY INCOME
$111,250
AVG HOUSEHOLD INCOME
57.2%
WAGE / INCOME GAP [ % ]
42.8¢/ $1
WAGE / INCOME GAP [ $ ]
0.44
INEQUALITY / GINI INDEX
237
LABOR FORCE [ PEOPLE ]
51.6%
PERCENT IN LABOR FORCE
3.4%
UNEMPLOYMENT RATE
Sugar Mountain Area Codes
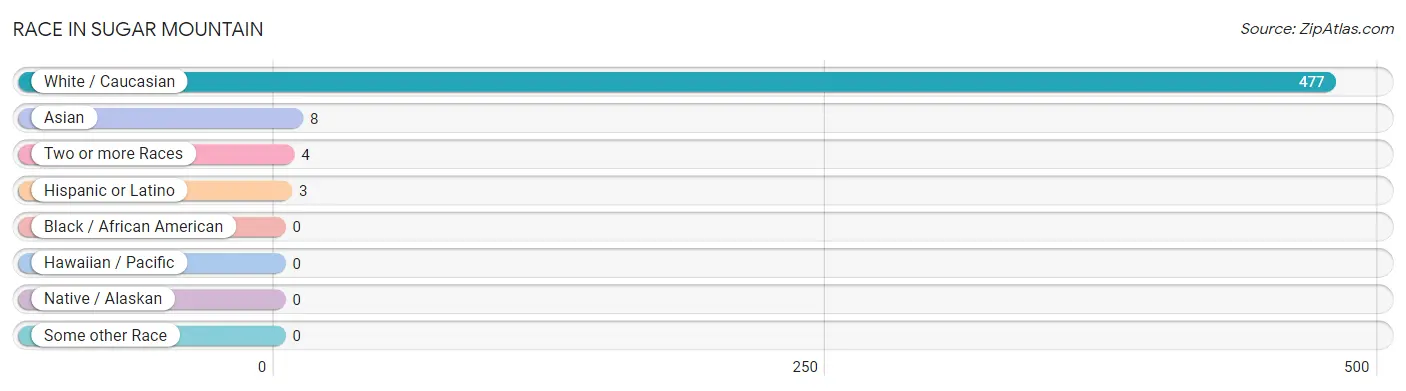
Race in Sugar Mountain
The most populous races in Sugar Mountain are White / Caucasian (477 | 97.6%), Asian (8 | 1.6%), and Two or more Races (4 | 0.8%).
| Race | # Population | % Population |
| Asian | 8 | 1.6% |
| Black / African American | 0 | 0.0% |
| Hawaiian / Pacific | 0 | 0.0% |
| Hispanic or Latino | 3 | 0.6% |
| Native / Alaskan | 0 | 0.0% |
| White / Caucasian | 477 | 97.6% |
| Two or more Races | 4 | 0.8% |
| Some other Race | 0 | 0.0% |
| Total | 489 | 100.0% |
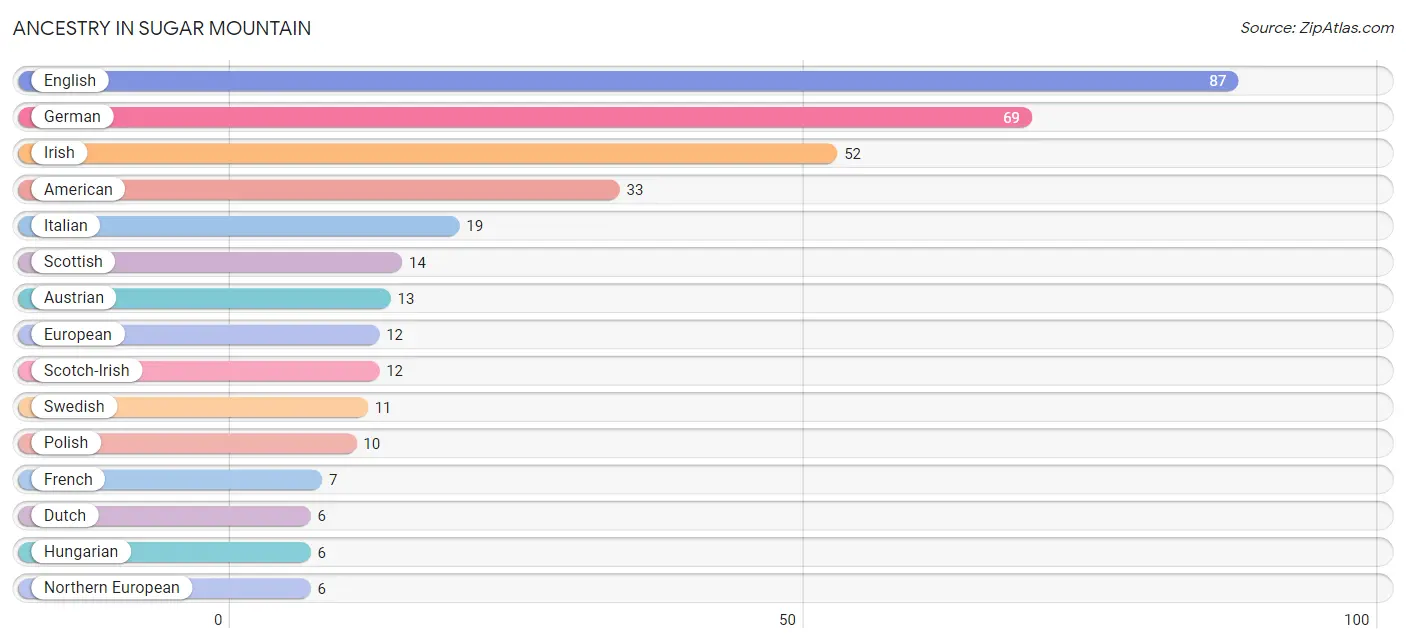
Ancestry in Sugar Mountain
The most populous ancestries reported in Sugar Mountain are English (87 | 17.8%), German (69 | 14.1%), Irish (52 | 10.6%), American (33 | 6.8%), and Italian (19 | 3.9%), together accounting for 53.2% of all Sugar Mountain residents.
| Ancestry | # Population | % Population |
| American | 33 | 6.8% |
| Arab | 2 | 0.4% |
| Austrian | 13 | 2.7% |
| British | 4 | 0.8% |
| Central American | 1 | 0.2% |
| Cherokee | 1 | 0.2% |
| Colombian | 2 | 0.4% |
| Danish | 2 | 0.4% |
| Dutch | 6 | 1.2% |
| Eastern European | 4 | 0.8% |
| English | 87 | 17.8% |
| Estonian | 4 | 0.8% |
| European | 12 | 2.5% |
| French | 7 | 1.4% |
| German | 69 | 14.1% |
| Greek | 3 | 0.6% |
| Guatemalan | 1 | 0.2% |
| Hungarian | 6 | 1.2% |
| Indian (Asian) | 3 | 0.6% |
| Irish | 52 | 10.6% |
| Italian | 19 | 3.9% |
| Lebanese | 2 | 0.4% |
| Lithuanian | 3 | 0.6% |
| Northern European | 6 | 1.2% |
| Norwegian | 2 | 0.4% |
| Polish | 10 | 2.0% |
| Portuguese | 1 | 0.2% |
| Russian | 4 | 0.8% |
| Scotch-Irish | 12 | 2.5% |
| Scottish | 14 | 2.9% |
| Slovak | 2 | 0.4% |
| South American | 2 | 0.4% |
| Swedish | 11 | 2.2% |
| Thai | 5 | 1.0% |
| Turkish | 2 | 0.4% |
| Ukrainian | 1 | 0.2% |
| Welsh | 1 | 0.2% | View All 37 Rows |
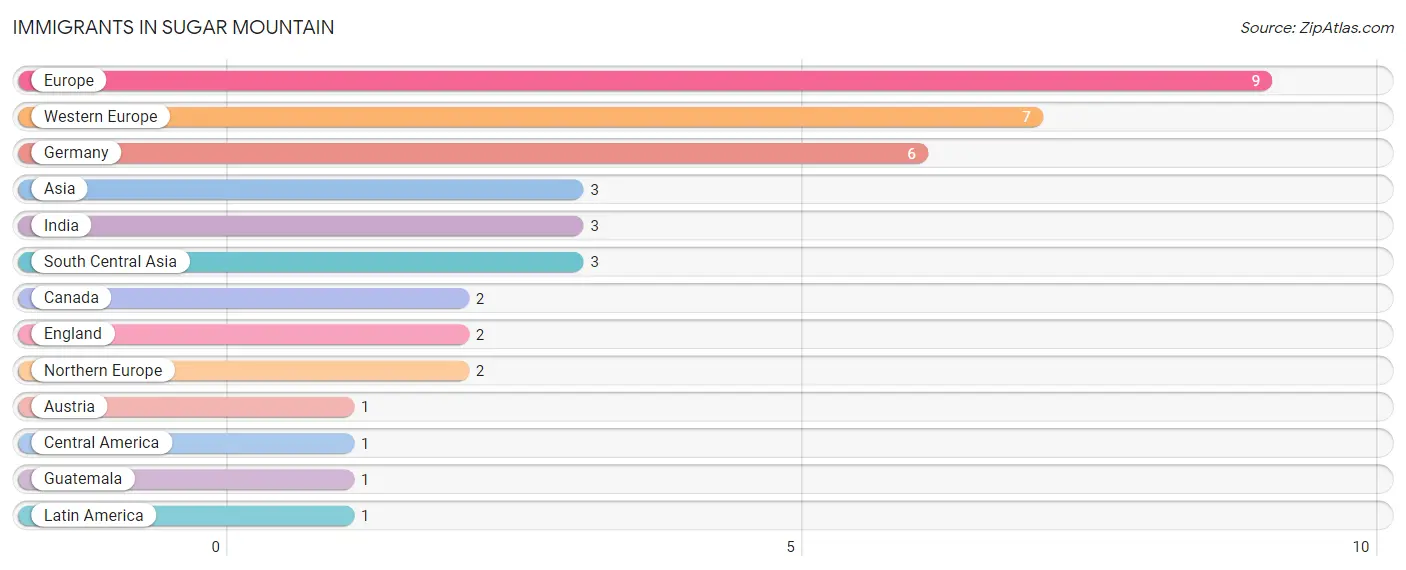
Immigrants in Sugar Mountain
The most numerous immigrant groups reported in Sugar Mountain came from Europe (9 | 1.8%), Western Europe (7 | 1.4%), Germany (6 | 1.2%), Asia (3 | 0.6%), and India (3 | 0.6%), together accounting for 5.7% of all Sugar Mountain residents.
| Immigration Origin | # Population | % Population |
| Asia | 3 | 0.6% |
| Austria | 1 | 0.2% |
| Canada | 2 | 0.4% |
| Central America | 1 | 0.2% |
| England | 2 | 0.4% |
| Europe | 9 | 1.8% |
| Germany | 6 | 1.2% |
| Guatemala | 1 | 0.2% |
| India | 3 | 0.6% |
| Latin America | 1 | 0.2% |
| Northern Europe | 2 | 0.4% |
| South Central Asia | 3 | 0.6% |
| Western Europe | 7 | 1.4% | View All 13 Rows |
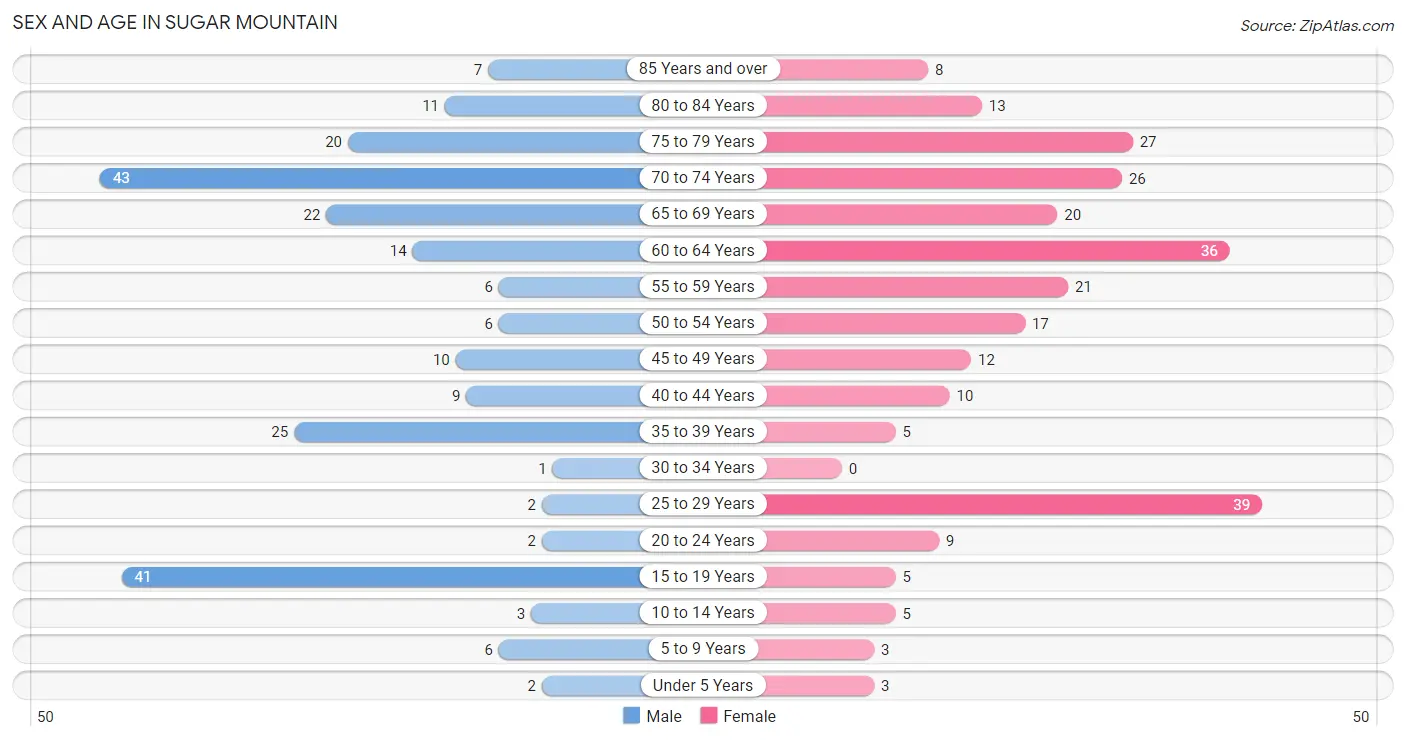
Sex and Age in Sugar Mountain
Sex and Age in Sugar Mountain
The most populous age groups in Sugar Mountain are 70 to 74 Years (43 | 18.7%) for men and 25 to 29 Years (39 | 15.1%) for women.
| Age Bracket | Male | Female |
| Under 5 Years | 2 (0.9%) | 3 (1.2%) |
| 5 to 9 Years | 6 (2.6%) | 3 (1.2%) |
| 10 to 14 Years | 3 (1.3%) | 5 (1.9%) |
| 15 to 19 Years | 41 (17.8%) | 5 (1.9%) |
| 20 to 24 Years | 2 (0.9%) | 9 (3.5%) |
| 25 to 29 Years | 2 (0.9%) | 39 (15.1%) |
| 30 to 34 Years | 1 (0.4%) | 0 (0.0%) |
| 35 to 39 Years | 25 (10.9%) | 5 (1.9%) |
| 40 to 44 Years | 9 (3.9%) | 10 (3.9%) |
| 45 to 49 Years | 10 (4.3%) | 12 (4.6%) |
| 50 to 54 Years | 6 (2.6%) | 17 (6.6%) |
| 55 to 59 Years | 6 (2.6%) | 21 (8.1%) |
| 60 to 64 Years | 14 (6.1%) | 36 (13.9%) |
| 65 to 69 Years | 22 (9.6%) | 20 (7.7%) |
| 70 to 74 Years | 43 (18.7%) | 26 (10.0%) |
| 75 to 79 Years | 20 (8.7%) | 27 (10.4%) |
| 80 to 84 Years | 11 (4.8%) | 13 (5.0%) |
| 85 Years and over | 7 (3.0%) | 8 (3.1%) |
| Total | 230 (100.0%) | 259 (100.0%) |
Families and Households in Sugar Mountain
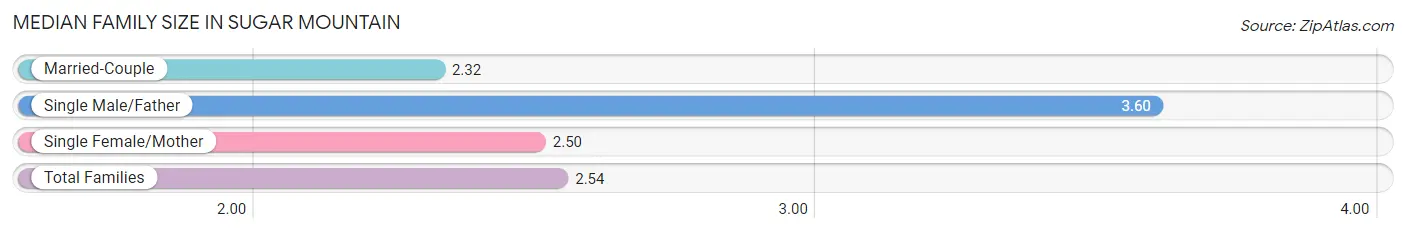
Median Family Size in Sugar Mountain
The median family size in Sugar Mountain is 2.54 persons per family, with single male/father families (25 | 16.8%) accounting for the largest median family size of 3.6 persons per family. On the other hand, married-couple families (116 | 77.8%) represent the smallest median family size with 2.32 persons per family.
| Family Type | # Families | Family Size |
| Married-Couple | 116 (77.8%) | 2.32 |
| Single Male/Father | 25 (16.8%) | 3.60 |
| Single Female/Mother | 8 (5.4%) | 2.50 |
| Total Families | 149 (100.0%) | 2.54 |
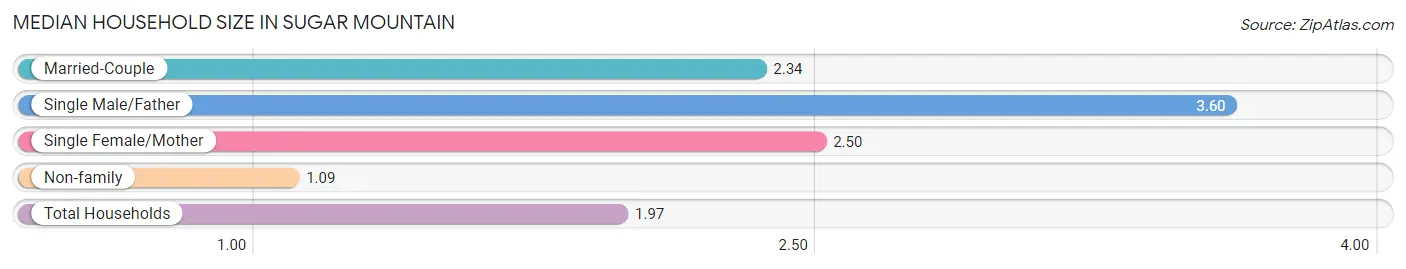
Median Household Size in Sugar Mountain
The median household size in Sugar Mountain is 1.97 persons per household, with single male/father households (25 | 10.1%) accounting for the largest median household size of 3.6 persons per household. non-family households (99 | 39.9%) represent the smallest median household size with 1.09 persons per household.
| Household Type | # Households | Household Size |
| Married-Couple | 116 (46.8%) | 2.34 |
| Single Male/Father | 25 (10.1%) | 3.60 |
| Single Female/Mother | 8 (3.2%) | 2.50 |
| Non-family | 99 (39.9%) | 1.09 |
| Total Households | 248 (100.0%) | 1.97 |
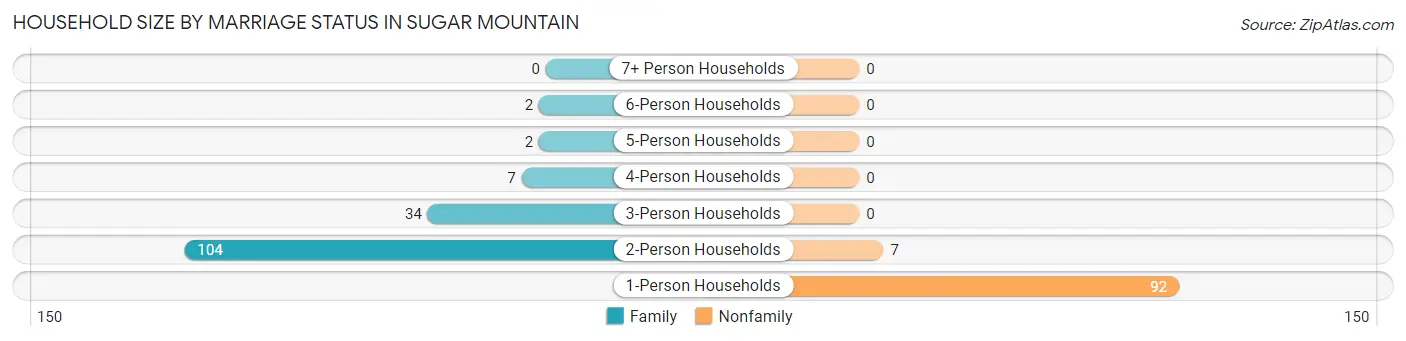
Household Size by Marriage Status in Sugar Mountain
Out of a total of 248 households in Sugar Mountain, 149 (60.1%) are family households, while 99 (39.9%) are nonfamily households. The most numerous type of family households are 2-person households, comprising 104, and the most common type of nonfamily households are 1-person households, comprising 92.
| Household Size | Family Households | Nonfamily Households |
| 1-Person Households | - | 92 (37.1%) |
| 2-Person Households | 104 (41.9%) | 7 (2.8%) |
| 3-Person Households | 34 (13.7%) | 0 (0.0%) |
| 4-Person Households | 7 (2.8%) | 0 (0.0%) |
| 5-Person Households | 2 (0.8%) | 0 (0.0%) |
| 6-Person Households | 2 (0.8%) | 0 (0.0%) |
| 7+ Person Households | 0 (0.0%) | 0 (0.0%) |
| Total | 149 (60.1%) | 99 (39.9%) |
Female Fertility in Sugar Mountain
Fertility by Age in Sugar Mountain
| Age Bracket | Women with Births | Births / 1,000 Women |
| 15 to 19 years | 0 (0.0%) | 0.0 |
| 20 to 34 years | 0 (0.0%) | 0.0 |
| 35 to 50 years | 0 (0.0%) | 0.0 |
| Total | 0 (0.0%) | 0.0 |
Fertility by Age by Marriage Status in Sugar Mountain
| Age Bracket | Married | Unmarried |
| 15 to 19 years | 0 (0.0%) | 0 (0.0%) |
| 20 to 34 years | 0 (0.0%) | 0 (0.0%) |
| 35 to 50 years | 0 (0.0%) | 0 (0.0%) |
| Total | 0 (0.0%) | 0 (0.0%) |
Fertility by Education in Sugar Mountain
| Educational Attainment | Women with Births | Births / 1,000 Women |
| Less than High School | 0 (0.0%) | 0.0 |
| High School Diploma | 0 (0.0%) | 0.0 |
| College or Associate's Degree | 0 (0.0%) | 0.0 |
| Bachelor's Degree | 0 (0.0%) | 0.0 |
| Graduate Degree | 0 (0.0%) | 0.0 |
| Total | 0 (0.0%) | 0.0 |
Fertility by Education by Marriage Status in Sugar Mountain
| Educational Attainment | Married | Unmarried |
| Less than High School | 0 (0.0%) | 0 (0.0%) |
| High School Diploma | 0 (0.0%) | 0 (0.0%) |
| College or Associate's Degree | 0 (0.0%) | 0 (0.0%) |
| Bachelor's Degree | 0 (0.0%) | 0 (0.0%) |
| Graduate Degree | 0 (0.0%) | 0 (0.0%) |
| Total | 0 (0.0%) | 0 (0.0%) |
Income in Sugar Mountain
Income Overview in Sugar Mountain
Per Capita Income in Sugar Mountain is $67,622, while median incomes of families and households are $133,750 and $111,250 respectively.
| Characteristic | Number | Measure |
| Per Capita Income | 489 | $67,622 |
| Median Family Income | 149 | $133,750 |
| Mean Family Income | 149 | $165,276 |
| Median Household Income | 248 | $111,250 |
| Mean Household Income | 248 | $134,745 |
| Income Deficit | 149 | $0 |
| Wage / Income Gap (%) | 489 | 57.24% |
| Wage / Income Gap ($) | 489 | 42.76¢ per $1 |
| Gini / Inequality Index | 489 | 0.44 |
Earnings by Sex in Sugar Mountain
Average Earnings in Sugar Mountain are $61,250, $38,798 for men and $90,729 for women, a difference of 57.2%.
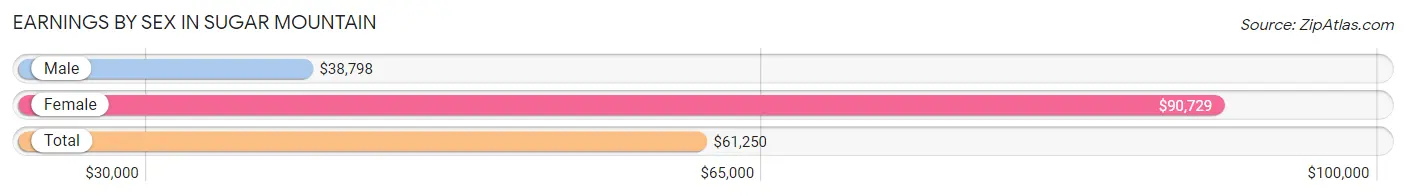
| Sex | Number | Average Earnings |
| Male | 109 (43.2%) | $38,798 |
| Female | 143 (56.8%) | $90,729 |
| Total | 252 (100.0%) | $61,250 |
Earnings by Sex by Income Bracket in Sugar Mountain
The most common earnings brackets in Sugar Mountain are $35,000 to $39,999 for men (28 | 25.7%) and $75,000 to $99,999 for women (48 | 33.6%).
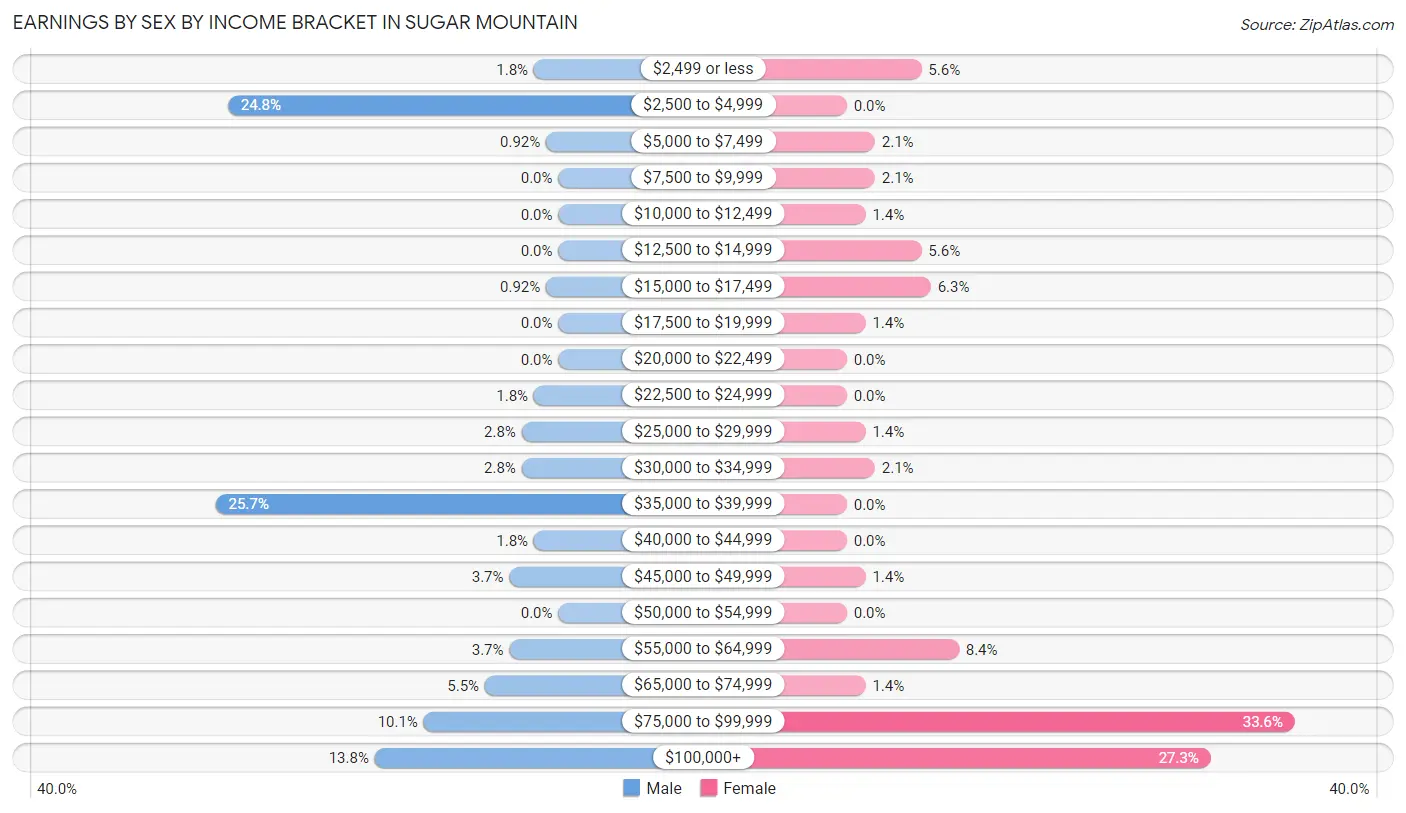
| Income | Male | Female |
| $2,499 or less | 2 (1.8%) | 8 (5.6%) |
| $2,500 to $4,999 | 27 (24.8%) | 0 (0.0%) |
| $5,000 to $7,499 | 1 (0.9%) | 3 (2.1%) |
| $7,500 to $9,999 | 0 (0.0%) | 3 (2.1%) |
| $10,000 to $12,499 | 0 (0.0%) | 2 (1.4%) |
| $12,500 to $14,999 | 0 (0.0%) | 8 (5.6%) |
| $15,000 to $17,499 | 1 (0.9%) | 9 (6.3%) |
| $17,500 to $19,999 | 0 (0.0%) | 2 (1.4%) |
| $20,000 to $22,499 | 0 (0.0%) | 0 (0.0%) |
| $22,500 to $24,999 | 2 (1.8%) | 0 (0.0%) |
| $25,000 to $29,999 | 3 (2.8%) | 2 (1.4%) |
| $30,000 to $34,999 | 3 (2.8%) | 3 (2.1%) |
| $35,000 to $39,999 | 28 (25.7%) | 0 (0.0%) |
| $40,000 to $44,999 | 2 (1.8%) | 0 (0.0%) |
| $45,000 to $49,999 | 4 (3.7%) | 2 (1.4%) |
| $50,000 to $54,999 | 0 (0.0%) | 0 (0.0%) |
| $55,000 to $64,999 | 4 (3.7%) | 12 (8.4%) |
| $65,000 to $74,999 | 6 (5.5%) | 2 (1.4%) |
| $75,000 to $99,999 | 11 (10.1%) | 48 (33.6%) |
| $100,000+ | 15 (13.8%) | 39 (27.3%) |
| Total | 109 (100.0%) | 143 (100.0%) |
Earnings by Sex by Educational Attainment in Sugar Mountain
Average earnings in Sugar Mountain are $43,750 for men and $91,111 for women, a difference of 52.0%. Men with an educational attainment of graduate degree enjoy the highest average annual earnings of $106,250, while those with high school diploma education earn the least with $38,854. Women with an educational attainment of graduate degree earn the most with the average annual earnings of $111,250, while those with high school diploma education have the smallest earnings of $90,972.
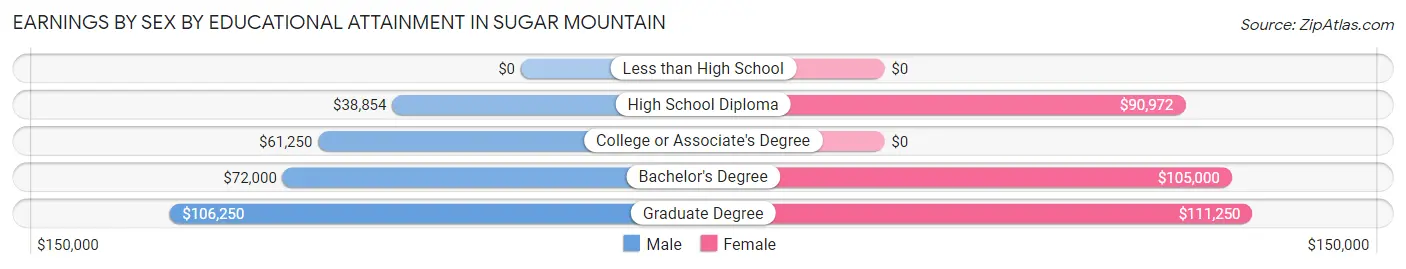
| Educational Attainment | Male Income | Female Income |
| Less than High School | - | - |
| High School Diploma | $38,854 | $90,972 |
| College or Associate's Degree | $61,250 | $0 |
| Bachelor's Degree | $72,000 | $105,000 |
| Graduate Degree | $106,250 | $111,250 |
| Total | $43,750 | $91,111 |
Family Income in Sugar Mountain
Family Income Brackets in Sugar Mountain
According to the Sugar Mountain family income data, there are 50 families falling into the $100,000 to $149,999 income range, which is the most common income bracket and makes up 33.6% of all families.
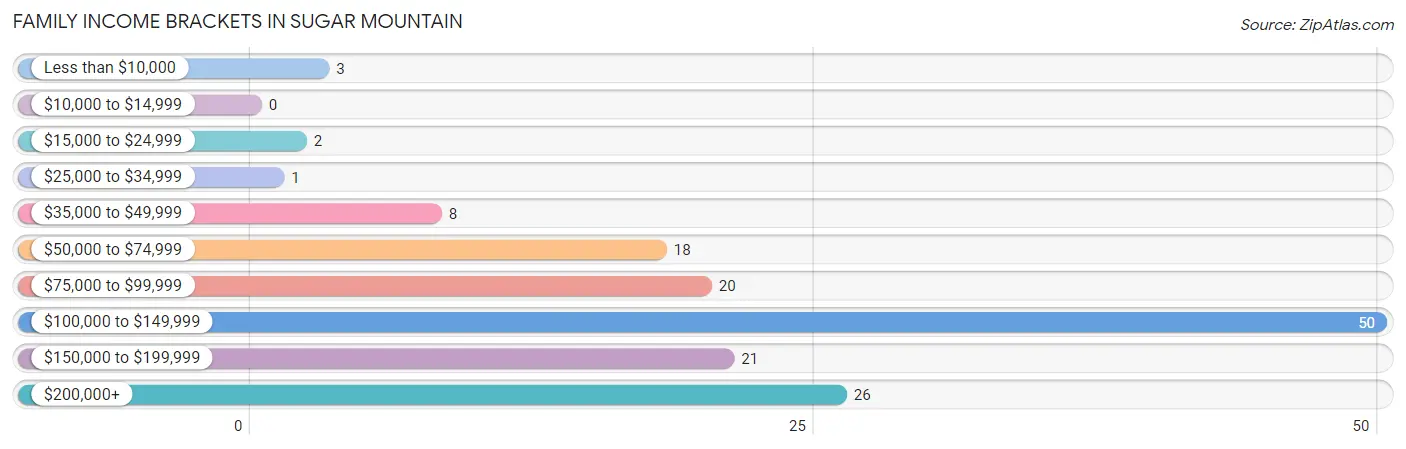
| Income Bracket | # Families | % Families |
| Less than $10,000 | 3 | 2.0% |
| $10,000 to $14,999 | 0 | 0.0% |
| $15,000 to $24,999 | 2 | 1.3% |
| $25,000 to $34,999 | 1 | 0.7% |
| $35,000 to $49,999 | 8 | 5.4% |
| $50,000 to $74,999 | 18 | 12.1% |
| $75,000 to $99,999 | 20 | 13.4% |
| $100,000 to $149,999 | 50 | 33.6% |
| $150,000 to $199,999 | 21 | 14.1% |
| $200,000+ | 26 | 17.4% |
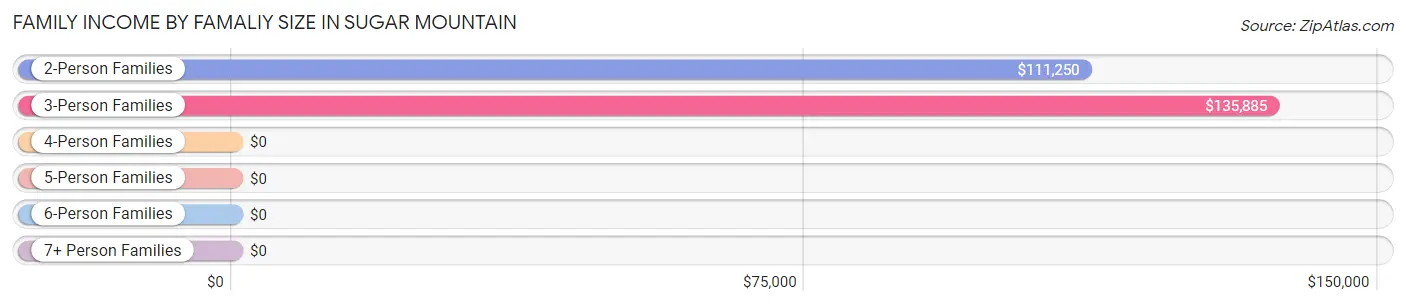
Family Income by Famaliy Size in Sugar Mountain
3-person families (35 | 23.5%) account for the highest median family income in Sugar Mountain with $135,885 per family, while 2-person families (104 | 69.8%) have the highest median income of $55,625 per family member.
| Income Bracket | # Families | Median Income |
| 2-Person Families | 104 (69.8%) | $111,250 |
| 3-Person Families | 35 (23.5%) | $135,885 |
| 4-Person Families | 6 (4.0%) | $0 |
| 5-Person Families | 2 (1.3%) | $0 |
| 6-Person Families | 2 (1.3%) | $0 |
| 7+ Person Families | 0 (0.0%) | $0 |
| Total | 149 (100.0%) | $133,750 |
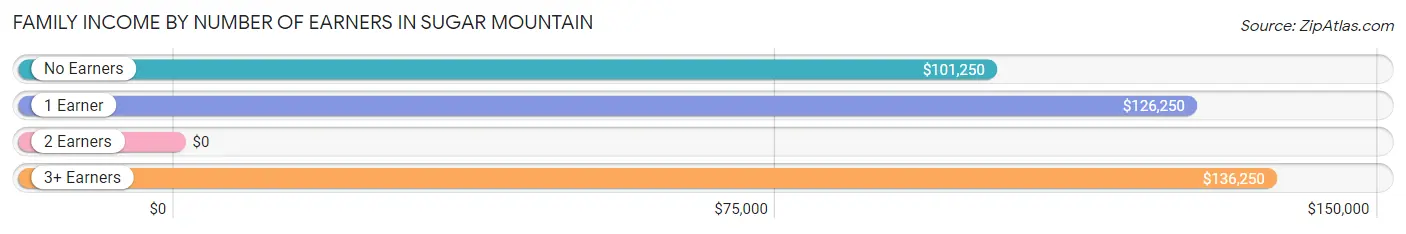
Family Income by Number of Earners in Sugar Mountain
| Number of Earners | # Families | Median Income |
| No Earners | 57 (38.3%) | $101,250 |
| 1 Earner | 40 (26.9%) | $126,250 |
| 2 Earners | 24 (16.1%) | $0 |
| 3+ Earners | 28 (18.8%) | $136,250 |
| Total | 149 (100.0%) | $133,750 |
Household Income in Sugar Mountain
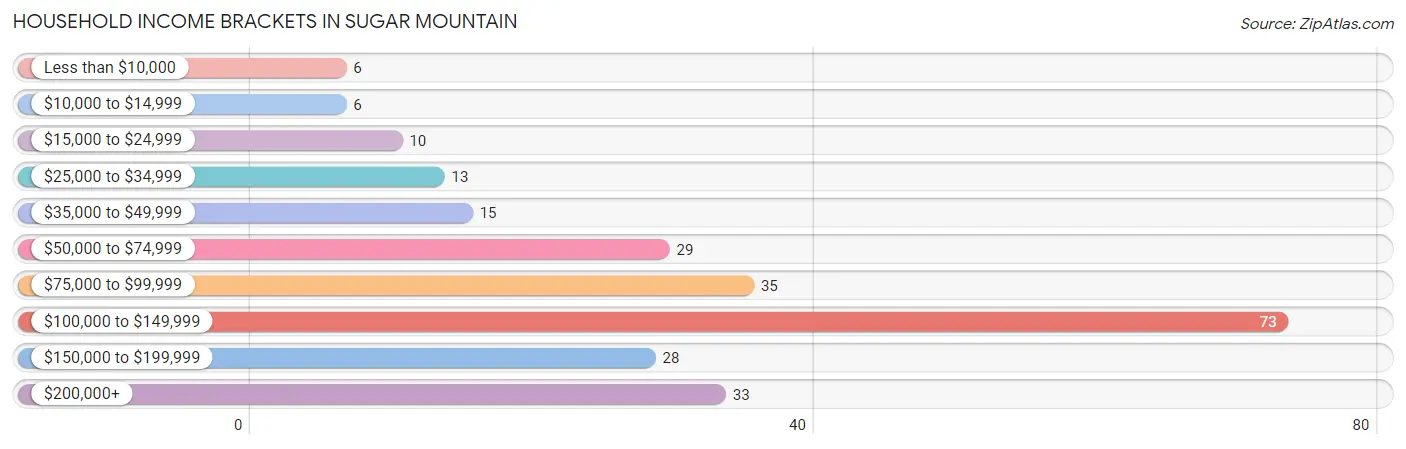
Household Income Brackets in Sugar Mountain
With 73 households falling in the category, the $100,000 to $149,999 income range is the most frequent in Sugar Mountain, accounting for 29.4% of all households. In contrast, only 6 households (2.4%) fall into the less than $10,000 income bracket, making it the least populous group.
| Income Bracket | # Households | % Households |
| Less than $10,000 | 6 | 2.4% |
| $10,000 to $14,999 | 6 | 2.4% |
| $15,000 to $24,999 | 10 | 4.0% |
| $25,000 to $34,999 | 13 | 5.2% |
| $35,000 to $49,999 | 15 | 6.0% |
| $50,000 to $74,999 | 29 | 11.7% |
| $75,000 to $99,999 | 35 | 14.1% |
| $100,000 to $149,999 | 73 | 29.4% |
| $150,000 to $199,999 | 28 | 11.3% |
| $200,000+ | 33 | 13.3% |
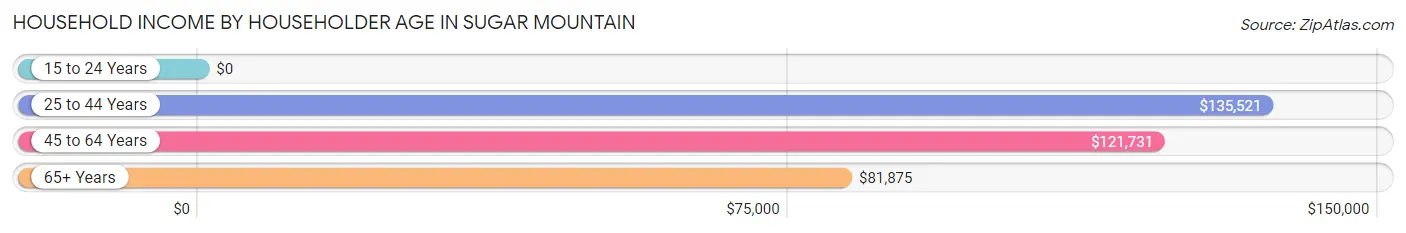
Household Income by Householder Age in Sugar Mountain
The median household income in Sugar Mountain is $111,250, with the highest median household income of $135,521 found in the 25 to 44 years age bracket for the primary householder. A total of 42 households (16.9%) fall into this category. Meanwhile, the 15 to 24 years age bracket for the primary householder has the lowest median household income of $0, with 7 households (2.8%) in this group.
| Income Bracket | # Households | Median Income |
| 15 to 24 Years | 7 (2.8%) | $0 |
| 25 to 44 Years | 42 (16.9%) | $135,521 |
| 45 to 64 Years | 86 (34.7%) | $121,731 |
| 65+ Years | 113 (45.6%) | $81,875 |
| Total | 248 (100.0%) | $111,250 |
Poverty in Sugar Mountain
Income Below Poverty by Sex and Age in Sugar Mountain
With 2.6% poverty level for males and 9.7% for females among the residents of Sugar Mountain, under 5 year old males and under 5 year old females are the most vulnerable to poverty, with 2 males (100.0%) and 3 females (100.0%) in their respective age groups living below the poverty level.
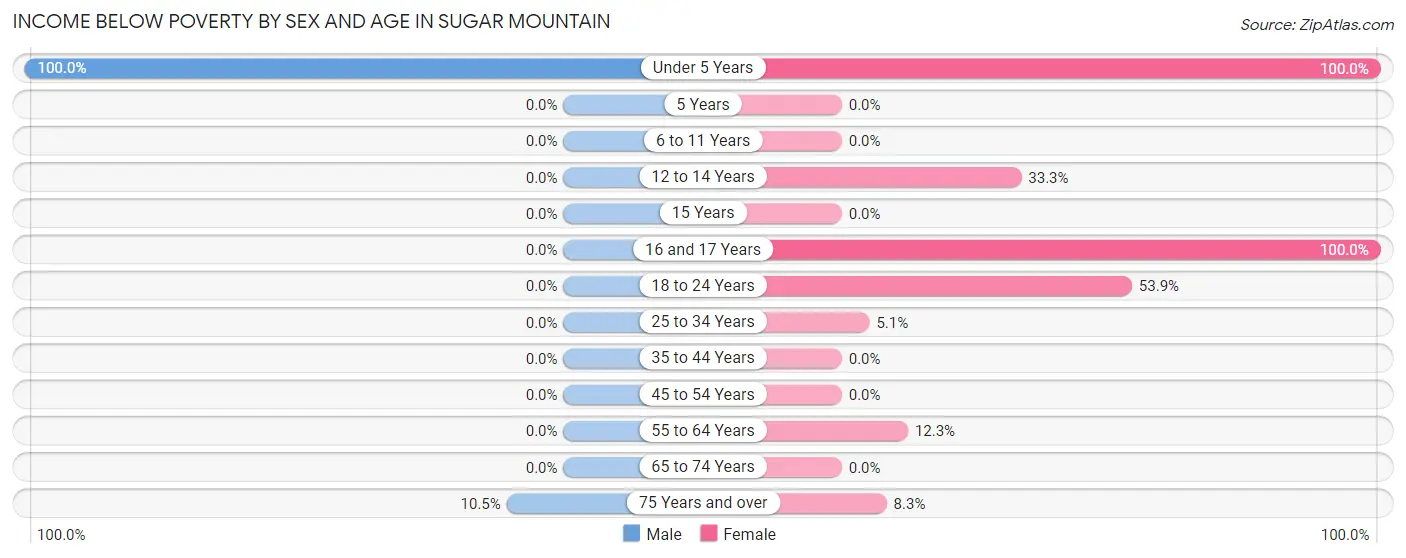
| Age Bracket | Male | Female |
| Under 5 Years | 2 (100.0%) | 3 (100.0%) |
| 5 Years | 0 (0.0%) | 0 (0.0%) |
| 6 to 11 Years | 0 (0.0%) | 0 (0.0%) |
| 12 to 14 Years | 0 (0.0%) | 1 (33.3%) |
| 15 Years | 0 (0.0%) | 0 (0.0%) |
| 16 and 17 Years | 0 (0.0%) | 1 (100.0%) |
| 18 to 24 Years | 0 (0.0%) | 7 (53.8%) |
| 25 to 34 Years | 0 (0.0%) | 2 (5.1%) |
| 35 to 44 Years | 0 (0.0%) | 0 (0.0%) |
| 45 to 54 Years | 0 (0.0%) | 0 (0.0%) |
| 55 to 64 Years | 0 (0.0%) | 7 (12.3%) |
| 65 to 74 Years | 0 (0.0%) | 0 (0.0%) |
| 75 Years and over | 4 (10.5%) | 4 (8.3%) |
| Total | 6 (2.6%) | 25 (9.7%) |
Income Above Poverty by Sex and Age in Sugar Mountain
According to the poverty statistics in Sugar Mountain, males aged 5 years and females aged 5 years are the age groups that are most secure financially, with 100.0% of males and 100.0% of females in these age groups living above the poverty line.
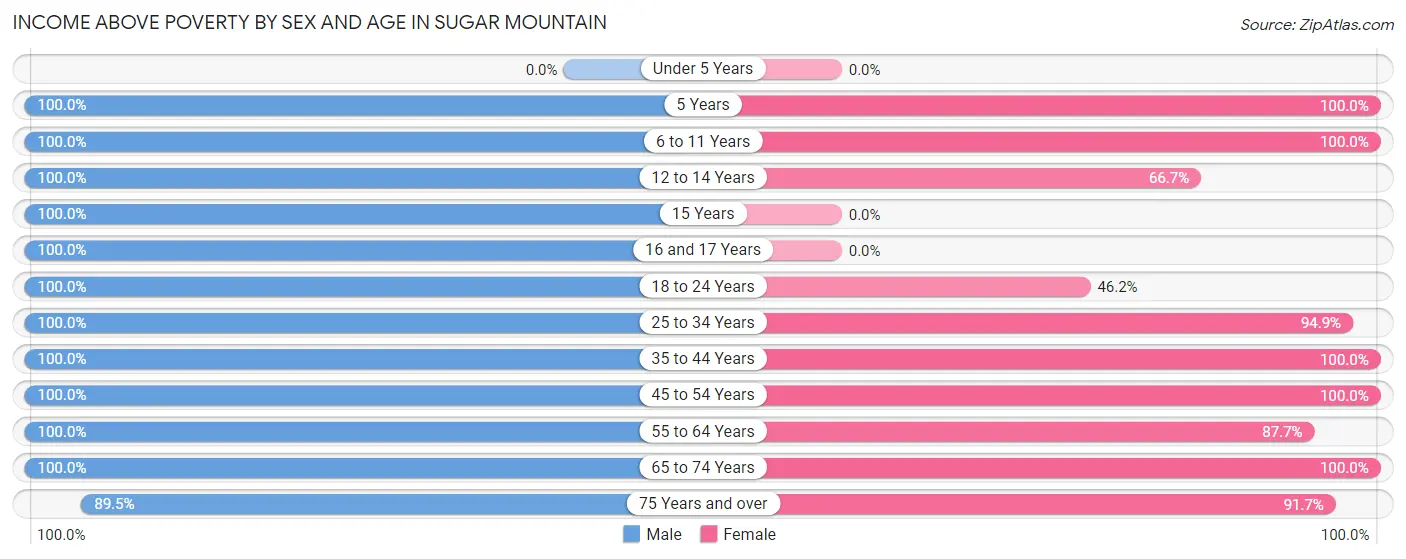
| Age Bracket | Male | Female |
| Under 5 Years | 0 (0.0%) | 0 (0.0%) |
| 5 Years | 2 (100.0%) | 2 (100.0%) |
| 6 to 11 Years | 4 (100.0%) | 3 (100.0%) |
| 12 to 14 Years | 3 (100.0%) | 2 (66.7%) |
| 15 Years | 8 (100.0%) | 0 (0.0%) |
| 16 and 17 Years | 5 (100.0%) | 0 (0.0%) |
| 18 to 24 Years | 30 (100.0%) | 6 (46.2%) |
| 25 to 34 Years | 3 (100.0%) | 37 (94.9%) |
| 35 to 44 Years | 34 (100.0%) | 15 (100.0%) |
| 45 to 54 Years | 16 (100.0%) | 29 (100.0%) |
| 55 to 64 Years | 20 (100.0%) | 50 (87.7%) |
| 65 to 74 Years | 65 (100.0%) | 46 (100.0%) |
| 75 Years and over | 34 (89.5%) | 44 (91.7%) |
| Total | 224 (97.4%) | 234 (90.3%) |
Income Below Poverty Among Married-Couple Families in Sugar Mountain
The poverty statistics for married-couple families in Sugar Mountain show that 1.7% or 2 of the total 116 families live below the poverty line. Families with no children have the highest poverty rate of 2.0%, comprising of 2 families. On the other hand, families with 1 or 2 children have the lowest poverty rate of 0.0%, which includes 0 families.
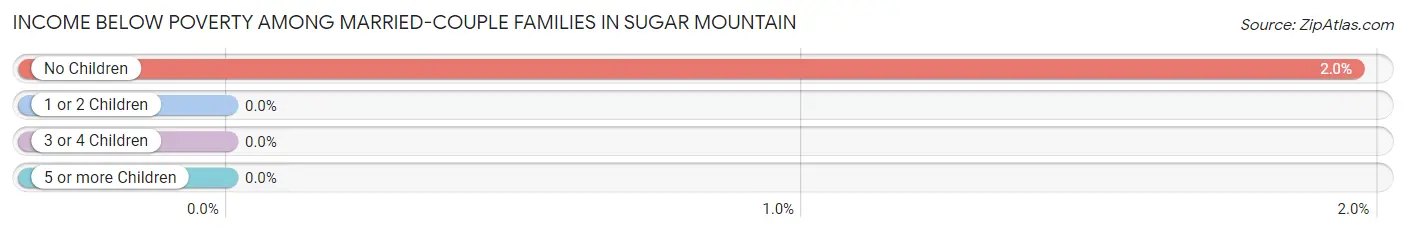
| Children | Above Poverty | Below Poverty |
| No Children | 100 (98.0%) | 2 (2.0%) |
| 1 or 2 Children | 12 (100.0%) | 0 (0.0%) |
| 3 or 4 Children | 2 (100.0%) | 0 (0.0%) |
| 5 or more Children | 0 (0.0%) | 0 (0.0%) |
| Total | 114 (98.3%) | 2 (1.7%) |
Income Below Poverty Among Single-Parent Households in Sugar Mountain
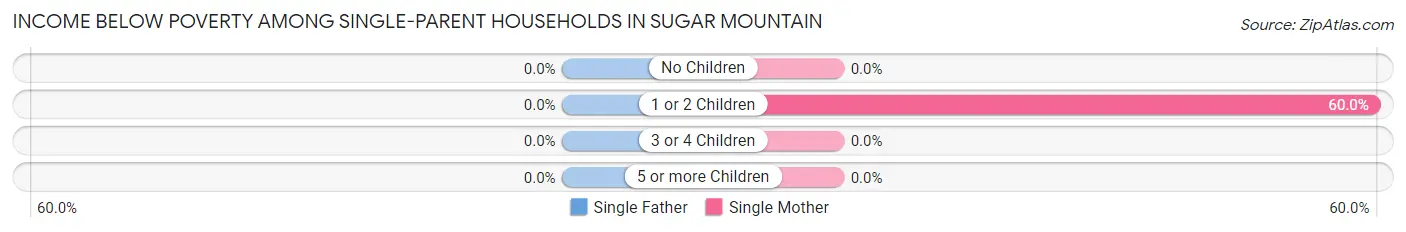
| Children | Single Father | Single Mother |
| No Children | 0 (0.0%) | 0 (0.0%) |
| 1 or 2 Children | 0 (0.0%) | 3 (60.0%) |
| 3 or 4 Children | 0 (0.0%) | 0 (0.0%) |
| 5 or more Children | 0 (0.0%) | 0 (0.0%) |
| Total | 0 (0.0%) | 3 (37.5%) |
Income Below Poverty Among Married-Couple vs Single-Parent Households in Sugar Mountain
The poverty data for Sugar Mountain shows that 2 of the married-couple family households (1.7%) and 3 of the single-parent households (9.1%) are living below the poverty level. Within the married-couple family households, those with no children have the highest poverty rate, with 2 households (2.0%) falling below the poverty line. Among the single-parent households, those with 1 or 2 children have the highest poverty rate, with 3 household (50.0%) living below poverty.
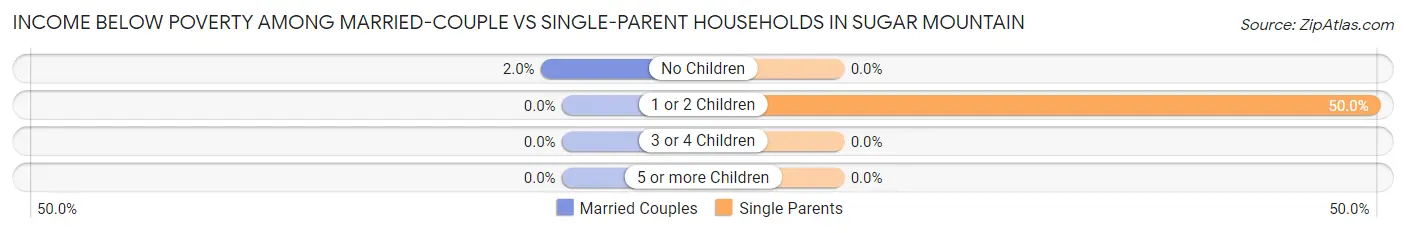
| Children | Married-Couple Families | Single-Parent Households |
| No Children | 2 (2.0%) | 0 (0.0%) |
| 1 or 2 Children | 0 (0.0%) | 3 (50.0%) |
| 3 or 4 Children | 0 (0.0%) | 0 (0.0%) |
| 5 or more Children | 0 (0.0%) | 0 (0.0%) |
| Total | 2 (1.7%) | 3 (9.1%) |
Employment Characteristics in Sugar Mountain
Employment by Class of Employer in Sugar Mountain
Among the 227 employed individuals in Sugar Mountain, private company employees (112 | 49.3%), self-employed (incorporated) (68 | 30.0%), and state government employees (19 | 8.4%) make up the most common classes of employment.
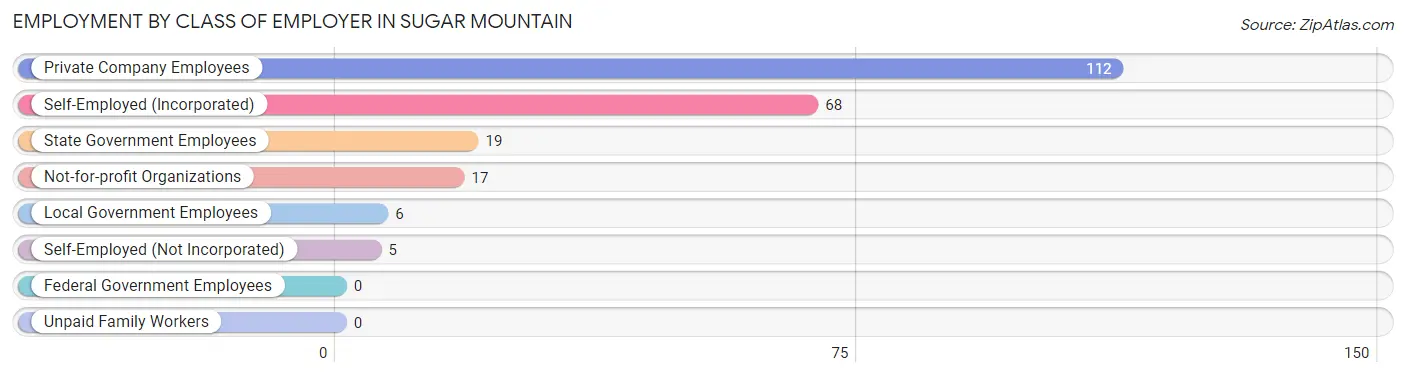
| Employer Class | # Employees | % Employees |
| Private Company Employees | 112 | 49.3% |
| Self-Employed (Incorporated) | 68 | 30.0% |
| Self-Employed (Not Incorporated) | 5 | 2.2% |
| Not-for-profit Organizations | 17 | 7.5% |
| Local Government Employees | 6 | 2.6% |
| State Government Employees | 19 | 8.4% |
| Federal Government Employees | 0 | 0.0% |
| Unpaid Family Workers | 0 | 0.0% |
| Total | 227 | 100.0% |
Employment Status by Age in Sugar Mountain
According to the labor force statistics for Sugar Mountain, out of the total population over 16 years of age (459), 51.6% or 237 individuals are in the labor force, with 3.4% or 8 of them unemployed. The age group with the highest labor force participation rate is 25 to 29 years, with 100.0% or 41 individuals in the labor force. Within the labor force, the 55 to 59 years age range has the highest percentage of unemployed individuals, with 21.1% or 4 of them being unemployed.
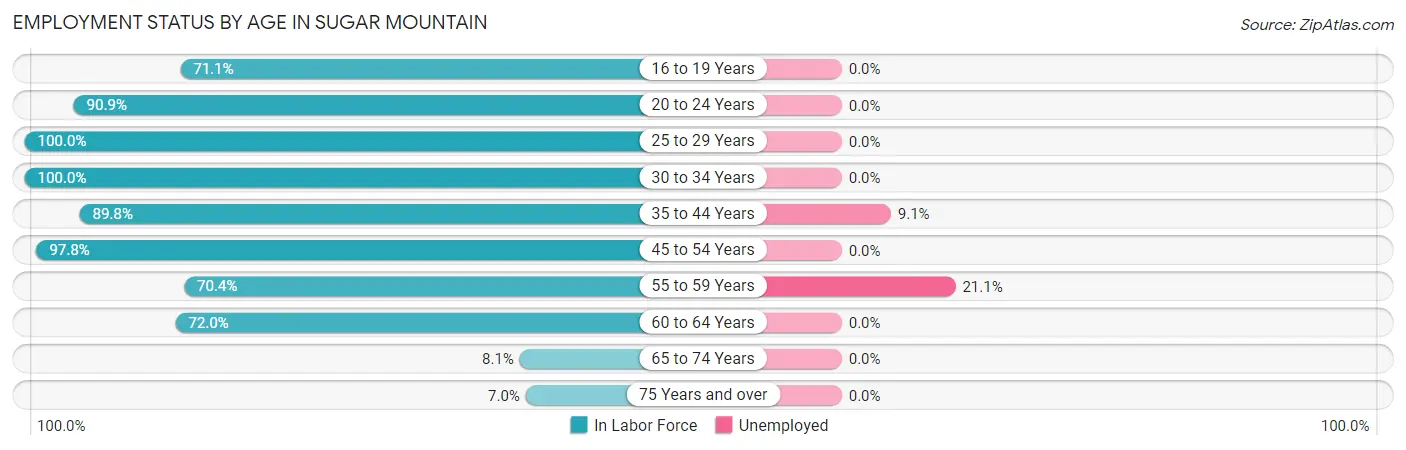
| Age Bracket | In Labor Force | Unemployed |
| 16 to 19 Years | 27 (71.1%) | 0 (0.0%) |
| 20 to 24 Years | 10 (90.9%) | 0 (0.0%) |
| 25 to 29 Years | 41 (100.0%) | 0 (0.0%) |
| 30 to 34 Years | 1 (100.0%) | 0 (0.0%) |
| 35 to 44 Years | 44 (89.8%) | 4 (9.1%) |
| 45 to 54 Years | 44 (97.8%) | 0 (0.0%) |
| 55 to 59 Years | 19 (70.4%) | 4 (21.1%) |
| 60 to 64 Years | 36 (72.0%) | 0 (0.0%) |
| 65 to 74 Years | 9 (8.1%) | 0 (0.0%) |
| 75 Years and over | 6 (7.0%) | 0 (0.0%) |
| Total | 237 (51.6%) | 8 (3.4%) |
Employment Status by Educational Attainment in Sugar Mountain
According to labor force statistics for Sugar Mountain, 86.9% of individuals (185) out of the total population between 25 and 64 years of age (213) are in the labor force, with 4.3% or 8 of them being unemployed. The group with the highest labor force participation rate are those with the educational attainment of high school diploma, with 97.1% or 66 individuals in the labor force. Within the labor force, individuals with college / associate degree education have the highest percentage of unemployment, with 17.2% or 5 of them being unemployed.
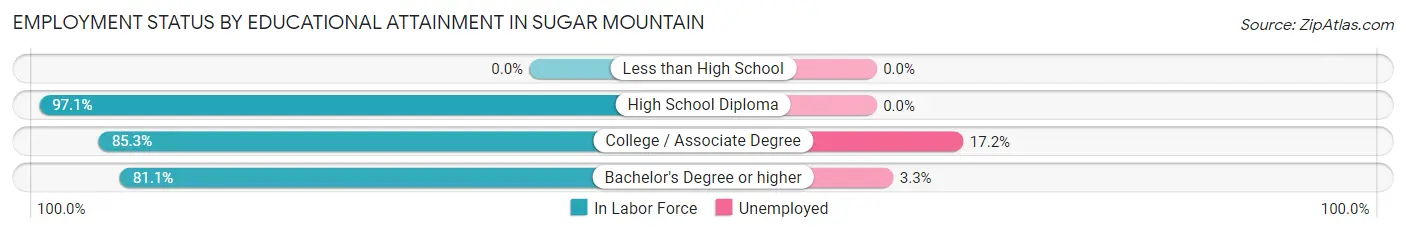
| Educational Attainment | In Labor Force | Unemployed |
| Less than High School | 0 (0.0%) | 0 (0.0%) |
| High School Diploma | 66 (97.1%) | 0 (0.0%) |
| College / Associate Degree | 29 (85.3%) | 6 (17.2%) |
| Bachelor's Degree or higher | 90 (81.1%) | 4 (3.3%) |
| Total | 185 (86.9%) | 9 (4.3%) |
Employment Occupations by Sex in Sugar Mountain
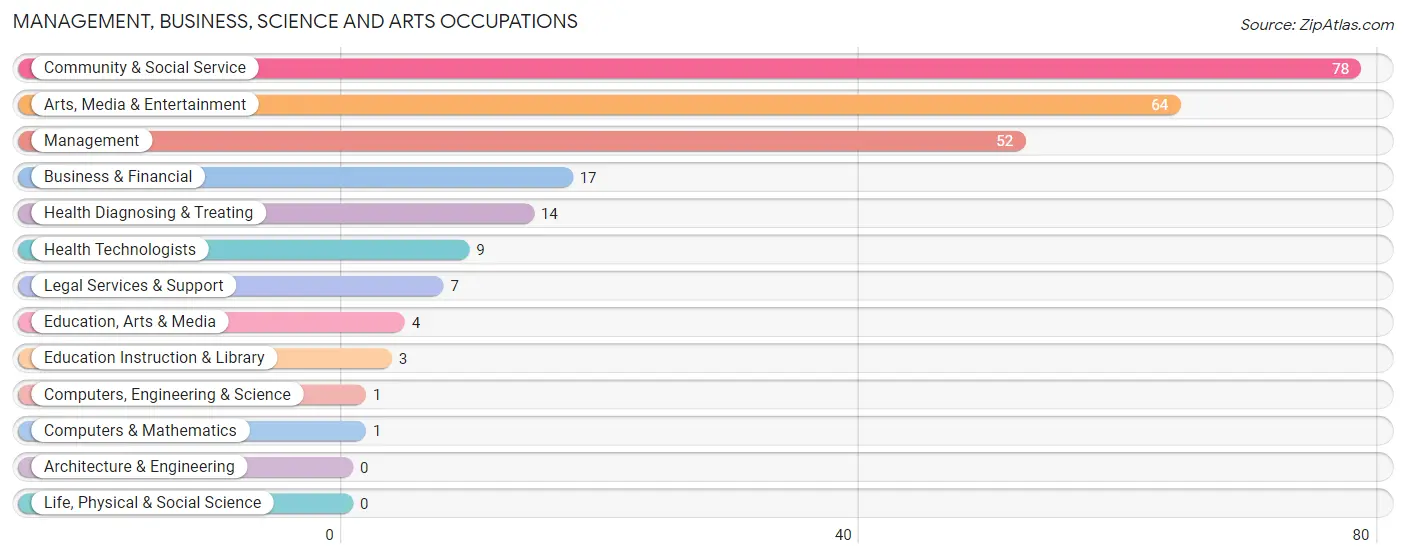
Management, Business, Science and Arts Occupations
The most common Management, Business, Science and Arts occupations in Sugar Mountain are Community & Social Service (78 | 34.1%), Arts, Media & Entertainment (64 | 28.0%), Management (52 | 22.7%), Business & Financial (17 | 7.4%), and Health Diagnosing & Treating (14 | 6.1%).
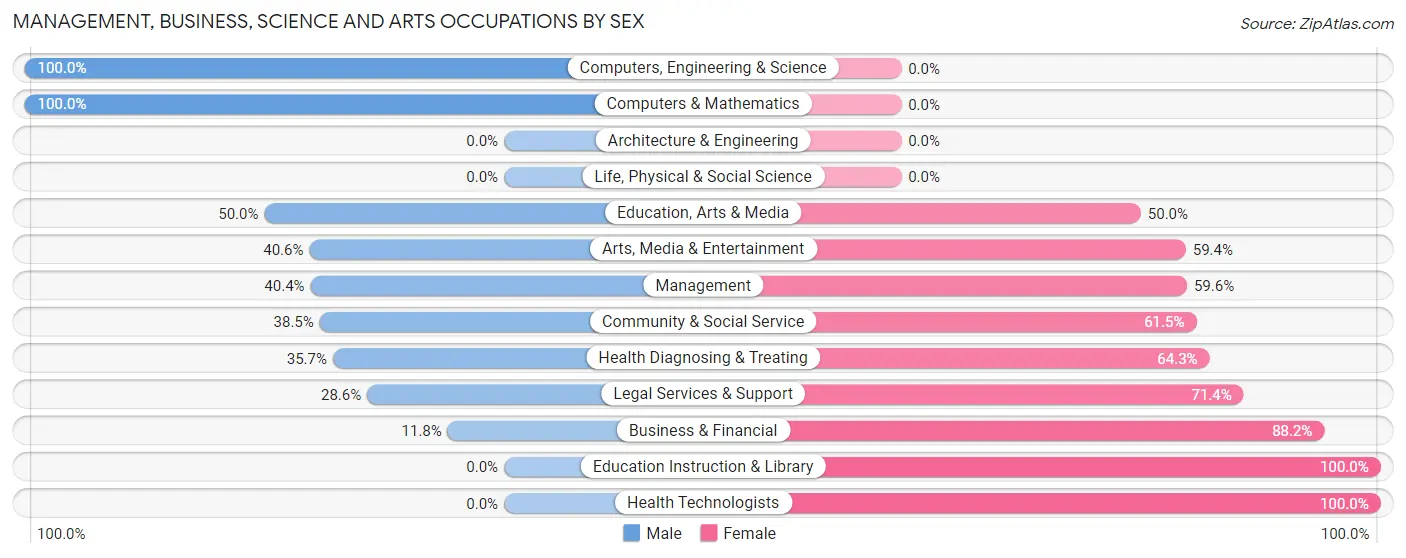
Management, Business, Science and Arts Occupations by Sex
Within the Management, Business, Science and Arts occupations in Sugar Mountain, the most male-oriented occupations are Computers, Engineering & Science (100.0%), Computers & Mathematics (100.0%), and Education, Arts & Media (50.0%), while the most female-oriented occupations are Education Instruction & Library (100.0%), Health Technologists (100.0%), and Business & Financial (88.2%).
| Occupation | Male | Female |
| Management | 21 (40.4%) | 31 (59.6%) |
| Business & Financial | 2 (11.8%) | 15 (88.2%) |
| Computers, Engineering & Science | 1 (100.0%) | 0 (0.0%) |
| Computers & Mathematics | 1 (100.0%) | 0 (0.0%) |
| Architecture & Engineering | 0 (0.0%) | 0 (0.0%) |
| Life, Physical & Social Science | 0 (0.0%) | 0 (0.0%) |
| Community & Social Service | 30 (38.5%) | 48 (61.5%) |
| Education, Arts & Media | 2 (50.0%) | 2 (50.0%) |
| Legal Services & Support | 2 (28.6%) | 5 (71.4%) |
| Education Instruction & Library | 0 (0.0%) | 3 (100.0%) |
| Arts, Media & Entertainment | 26 (40.6%) | 38 (59.4%) |
| Health Diagnosing & Treating | 5 (35.7%) | 9 (64.3%) |
| Health Technologists | 0 (0.0%) | 9 (100.0%) |
| Total (Category) | 59 (36.4%) | 103 (63.6%) |
| Total (Overall) | 101 (44.1%) | 128 (55.9%) |
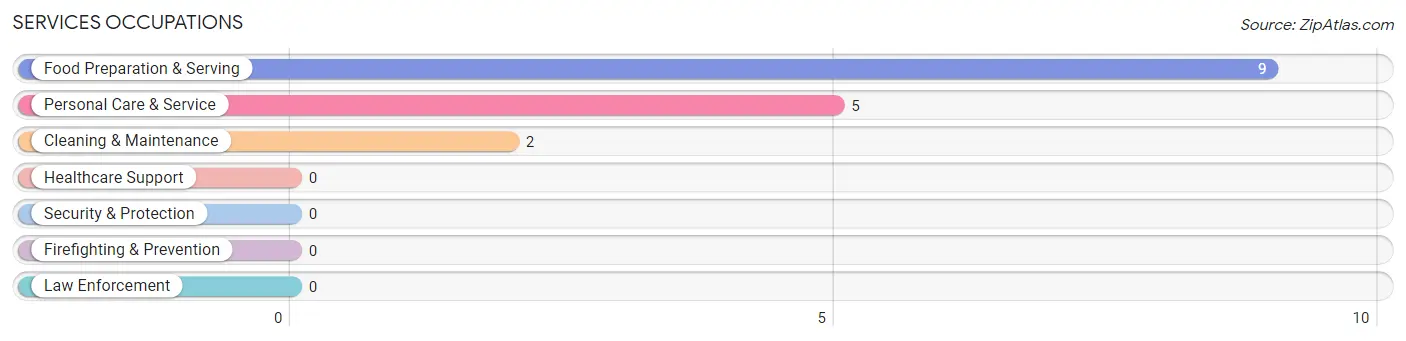
Services Occupations
The most common Services occupations in Sugar Mountain are Food Preparation & Serving (9 | 3.9%), Personal Care & Service (5 | 2.2%), and Cleaning & Maintenance (2 | 0.9%).
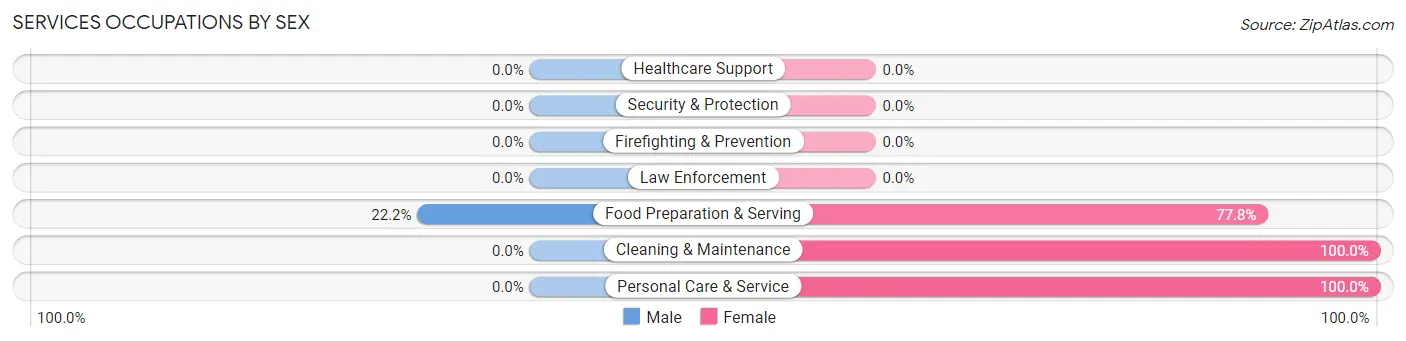
Services Occupations by Sex
| Occupation | Male | Female |
| Healthcare Support | 0 (0.0%) | 0 (0.0%) |
| Security & Protection | 0 (0.0%) | 0 (0.0%) |
| Firefighting & Prevention | 0 (0.0%) | 0 (0.0%) |
| Law Enforcement | 0 (0.0%) | 0 (0.0%) |
| Food Preparation & Serving | 2 (22.2%) | 7 (77.8%) |
| Cleaning & Maintenance | 0 (0.0%) | 2 (100.0%) |
| Personal Care & Service | 0 (0.0%) | 5 (100.0%) |
| Total (Category) | 2 (12.5%) | 14 (87.5%) |
| Total (Overall) | 101 (44.1%) | 128 (55.9%) |
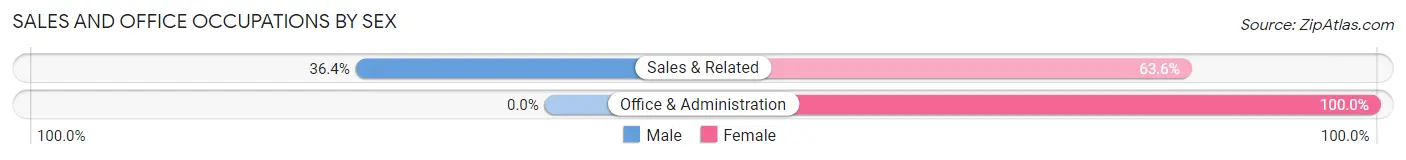
Sales and Office Occupations
The most common Sales and Office occupations in Sugar Mountain are Sales & Related (11 | 4.8%), and Office & Administration (4 | 1.8%).
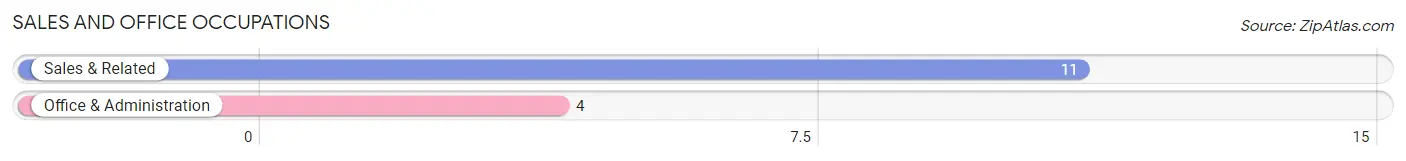
Sales and Office Occupations by Sex
| Occupation | Male | Female |
| Sales & Related | 4 (36.4%) | 7 (63.6%) |
| Office & Administration | 0 (0.0%) | 4 (100.0%) |
| Total (Category) | 4 (26.7%) | 11 (73.3%) |
| Total (Overall) | 101 (44.1%) | 128 (55.9%) |
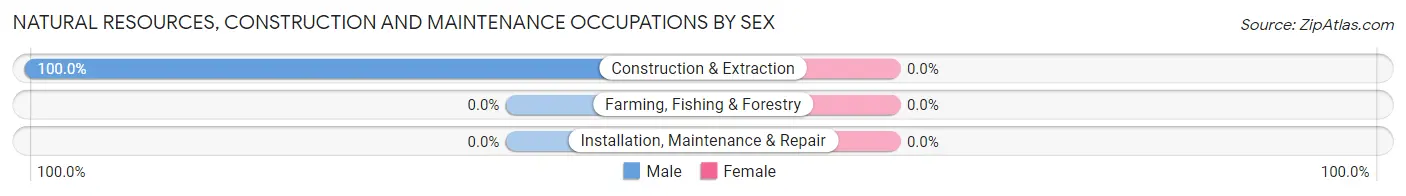
Natural Resources, Construction and Maintenance Occupations
The most common Natural Resources, Construction and Maintenance occupations in Sugar Mountain are , and Construction & Extraction (4 | 1.8%).
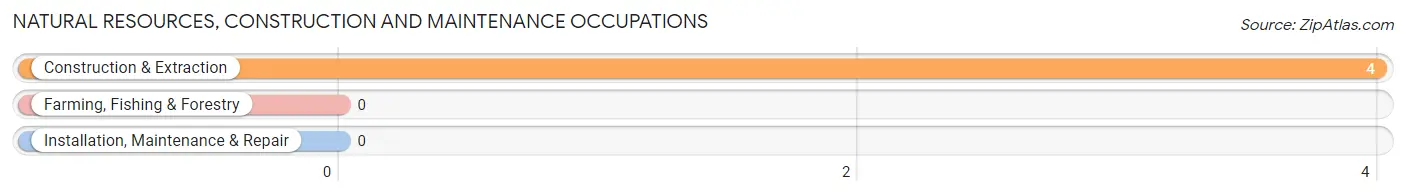
Natural Resources, Construction and Maintenance Occupations by Sex
| Occupation | Male | Female |
| Farming, Fishing & Forestry | 0 (0.0%) | 0 (0.0%) |
| Construction & Extraction | 4 (100.0%) | 0 (0.0%) |
| Installation, Maintenance & Repair | 0 (0.0%) | 0 (0.0%) |
| Total (Category) | 4 (100.0%) | 0 (0.0%) |
| Total (Overall) | 101 (44.1%) | 128 (55.9%) |
Production, Transportation and Moving Occupations
The most common Production, Transportation and Moving occupations in Sugar Mountain are Material Moving (27 | 11.8%), Production (3 | 1.3%), and Transportation (2 | 0.9%).
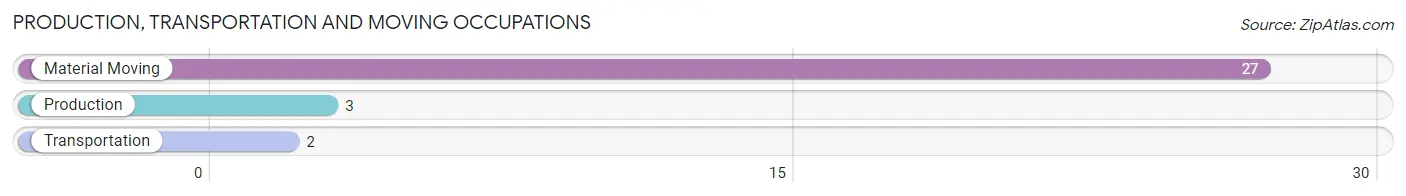
Production, Transportation and Moving Occupations by Sex
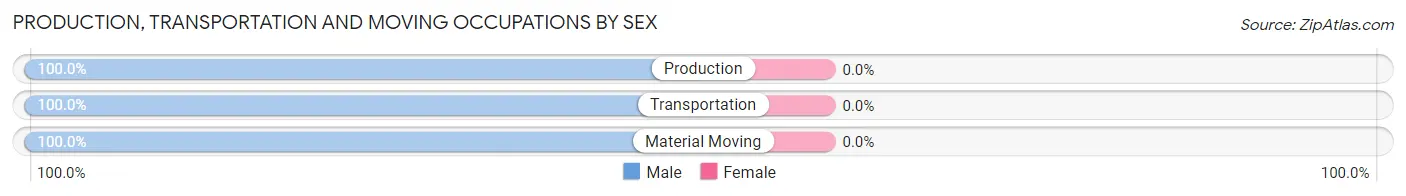
| Occupation | Male | Female |
| Production | 3 (100.0%) | 0 (0.0%) |
| Transportation | 2 (100.0%) | 0 (0.0%) |
| Material Moving | 27 (100.0%) | 0 (0.0%) |
| Total (Category) | 32 (100.0%) | 0 (0.0%) |
| Total (Overall) | 101 (44.1%) | 128 (55.9%) |
Employment Industries by Sex in Sugar Mountain
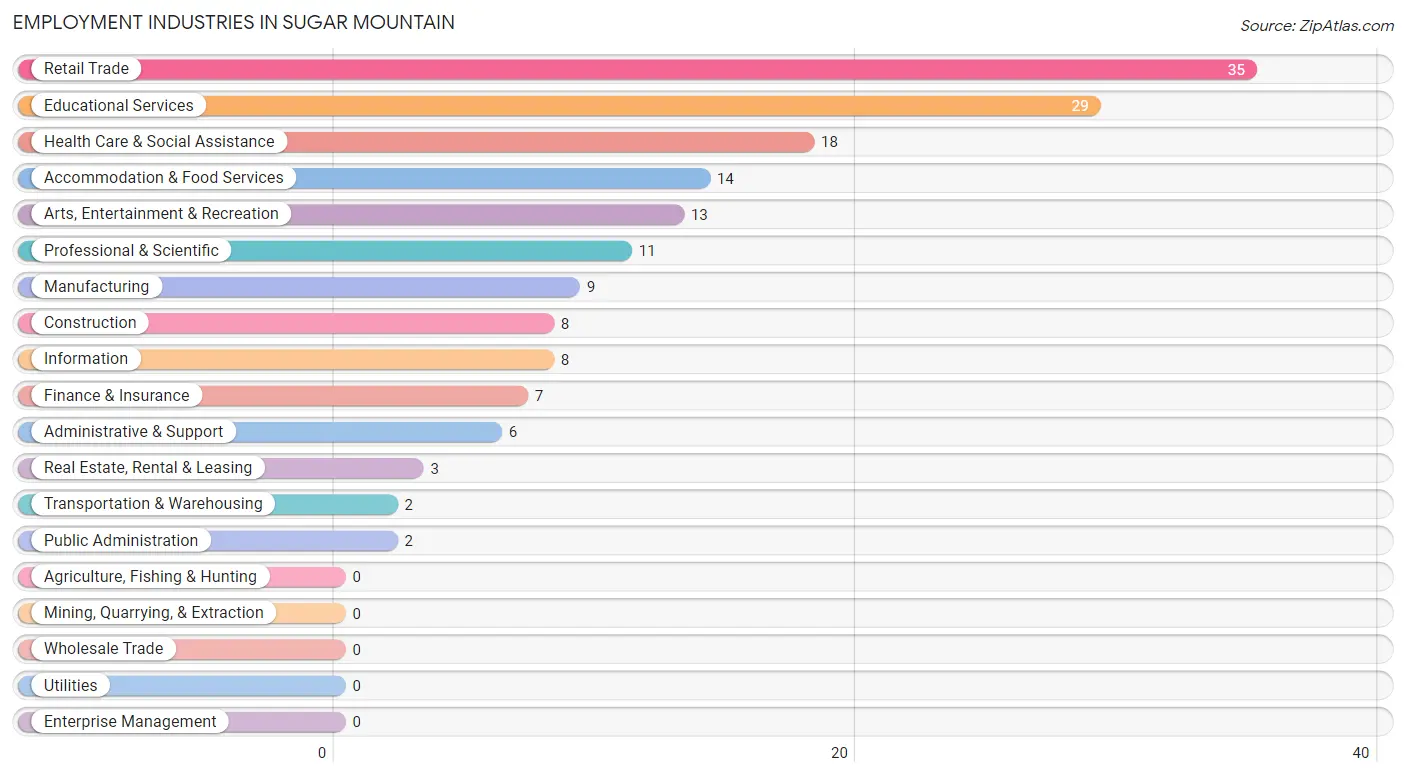
Employment Industries in Sugar Mountain
The major employment industries in Sugar Mountain include Retail Trade (35 | 15.3%), Educational Services (29 | 12.7%), Health Care & Social Assistance (18 | 7.9%), Accommodation & Food Services (14 | 6.1%), and Arts, Entertainment & Recreation (13 | 5.7%).
Employment Industries by Sex in Sugar Mountain
The Sugar Mountain industries that see more men than women are Construction (100.0%), Transportation & Warehousing (100.0%), and Retail Trade (85.7%), whereas the industries that tend to have a higher number of women are Information (100.0%), Arts, Entertainment & Recreation (100.0%), and Public Administration (100.0%).
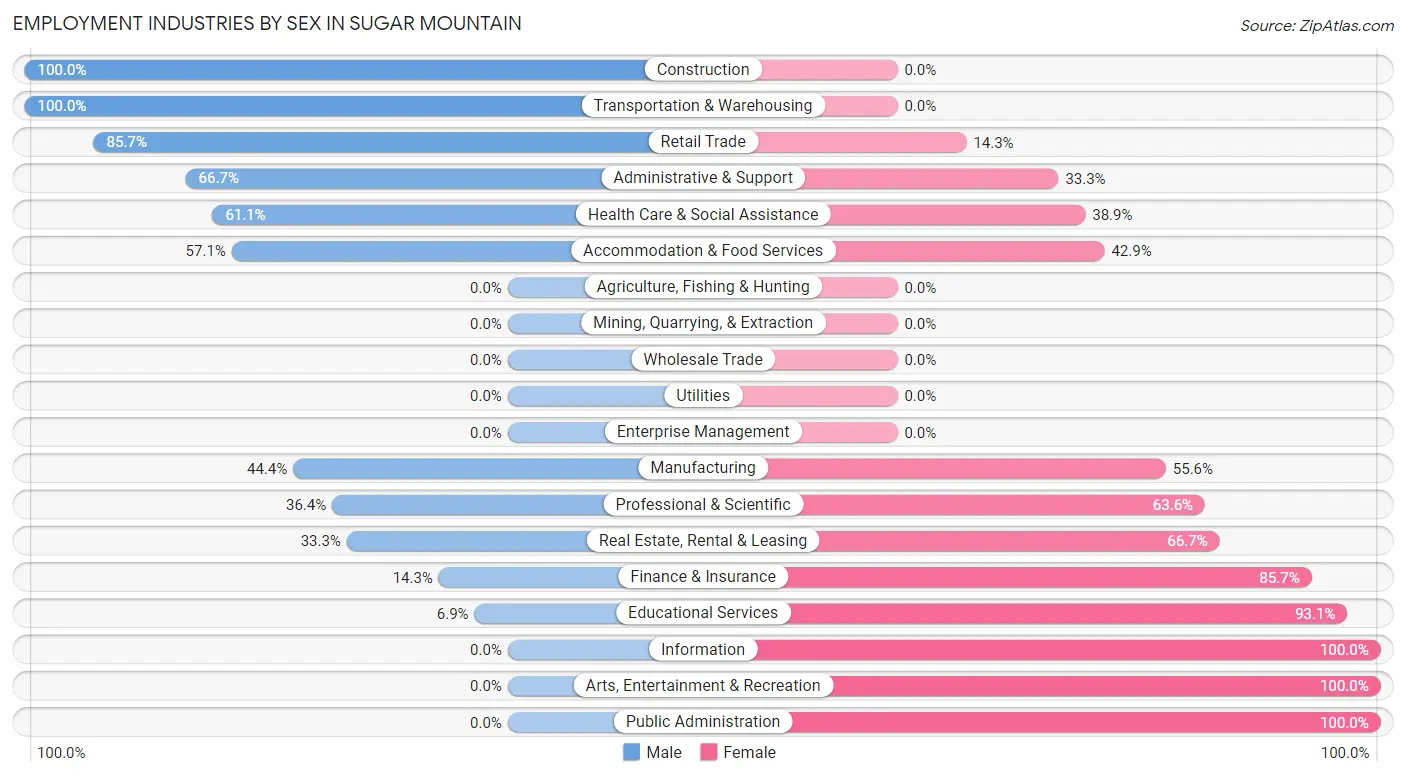
| Industry | Male | Female |
| Agriculture, Fishing & Hunting | 0 (0.0%) | 0 (0.0%) |
| Mining, Quarrying, & Extraction | 0 (0.0%) | 0 (0.0%) |
| Construction | 8 (100.0%) | 0 (0.0%) |
| Manufacturing | 4 (44.4%) | 5 (55.6%) |
| Wholesale Trade | 0 (0.0%) | 0 (0.0%) |
| Retail Trade | 30 (85.7%) | 5 (14.3%) |
| Transportation & Warehousing | 2 (100.0%) | 0 (0.0%) |
| Utilities | 0 (0.0%) | 0 (0.0%) |
| Information | 0 (0.0%) | 8 (100.0%) |
| Finance & Insurance | 1 (14.3%) | 6 (85.7%) |
| Real Estate, Rental & Leasing | 1 (33.3%) | 2 (66.7%) |
| Professional & Scientific | 4 (36.4%) | 7 (63.6%) |
| Enterprise Management | 0 (0.0%) | 0 (0.0%) |
| Administrative & Support | 4 (66.7%) | 2 (33.3%) |
| Educational Services | 2 (6.9%) | 27 (93.1%) |
| Health Care & Social Assistance | 11 (61.1%) | 7 (38.9%) |
| Arts, Entertainment & Recreation | 0 (0.0%) | 13 (100.0%) |
| Accommodation & Food Services | 8 (57.1%) | 6 (42.9%) |
| Public Administration | 0 (0.0%) | 2 (100.0%) |
| Total | 101 (44.1%) | 128 (55.9%) |
Education in Sugar Mountain
School Enrollment in Sugar Mountain
The most common levels of schooling among the 80 students in Sugar Mountain are high school (48 | 60.0%), nursery / preschool (9 | 11.3%), and college / undergraduate (9 | 11.3%).
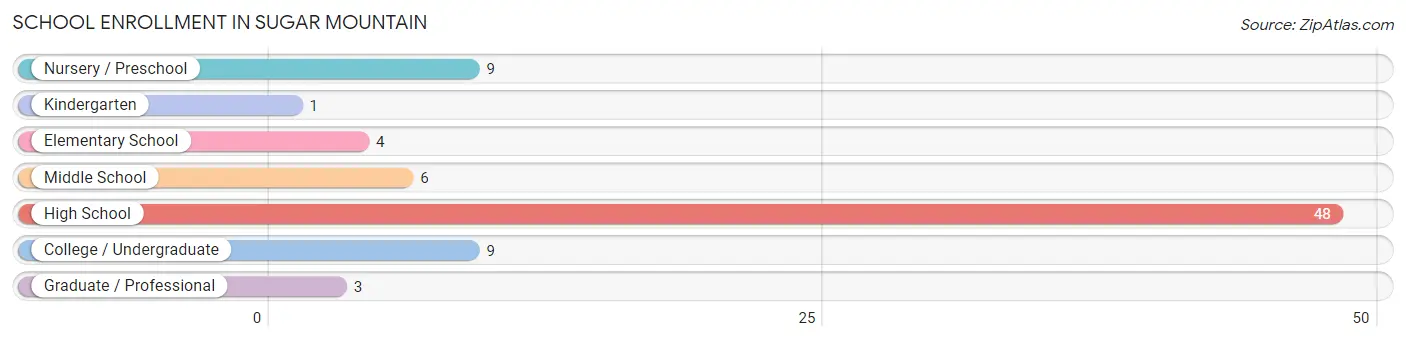
| School Level | # Students | % Students |
| Nursery / Preschool | 9 | 11.3% |
| Kindergarten | 1 | 1.3% |
| Elementary School | 4 | 5.0% |
| Middle School | 6 | 7.5% |
| High School | 48 | 60.0% |
| College / Undergraduate | 9 | 11.3% |
| Graduate / Professional | 3 | 3.7% |
| Total | 80 | 100.0% |
School Enrollment by Age by Funding Source in Sugar Mountain
Out of a total of 80 students who are enrolled in schools in Sugar Mountain, 9 (11.3%) attend a private institution, while the remaining 71 (88.7%) are enrolled in public schools. The age group of 5 to 9 year old has the highest likelihood of being enrolled in private schools, with 6 (66.7% in the age bracket) enrolled. Conversely, the age group of 3 to 4 year olds has the lowest likelihood of being enrolled in a private school, with 5 (100.0% in the age bracket) attending a public institution.
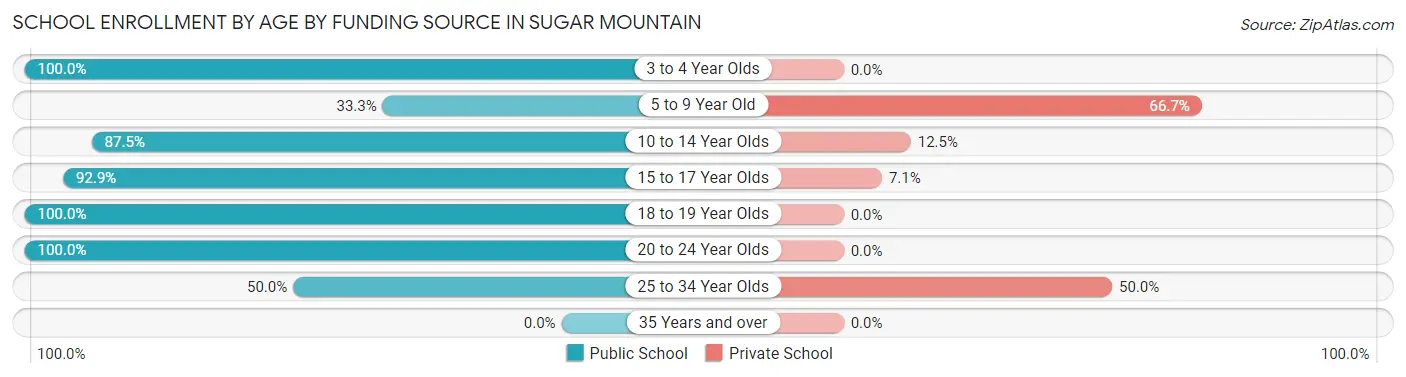
| Age Bracket | Public School | Private School |
| 3 to 4 Year Olds | 5 (100.0%) | 0 (0.0%) |
| 5 to 9 Year Old | 3 (33.3%) | 6 (66.7%) |
| 10 to 14 Year Olds | 7 (87.5%) | 1 (12.5%) |
| 15 to 17 Year Olds | 13 (92.9%) | 1 (7.1%) |
| 18 to 19 Year Olds | 32 (100.0%) | 0 (0.0%) |
| 20 to 24 Year Olds | 10 (100.0%) | 0 (0.0%) |
| 25 to 34 Year Olds | 1 (50.0%) | 1 (50.0%) |
| 35 Years and over | 0 (0.0%) | 0 (0.0%) |
| Total | 71 (88.8%) | 9 (11.3%) |
Educational Attainment by Field of Study in Sugar Mountain
Business (70 | 26.6%), education (40 | 15.2%), science & technology (29 | 11.0%), social sciences (23 | 8.7%), and bio, nature & agricultural (20 | 7.6%) are the most common fields of study among 263 individuals in Sugar Mountain who have obtained a bachelor's degree or higher.
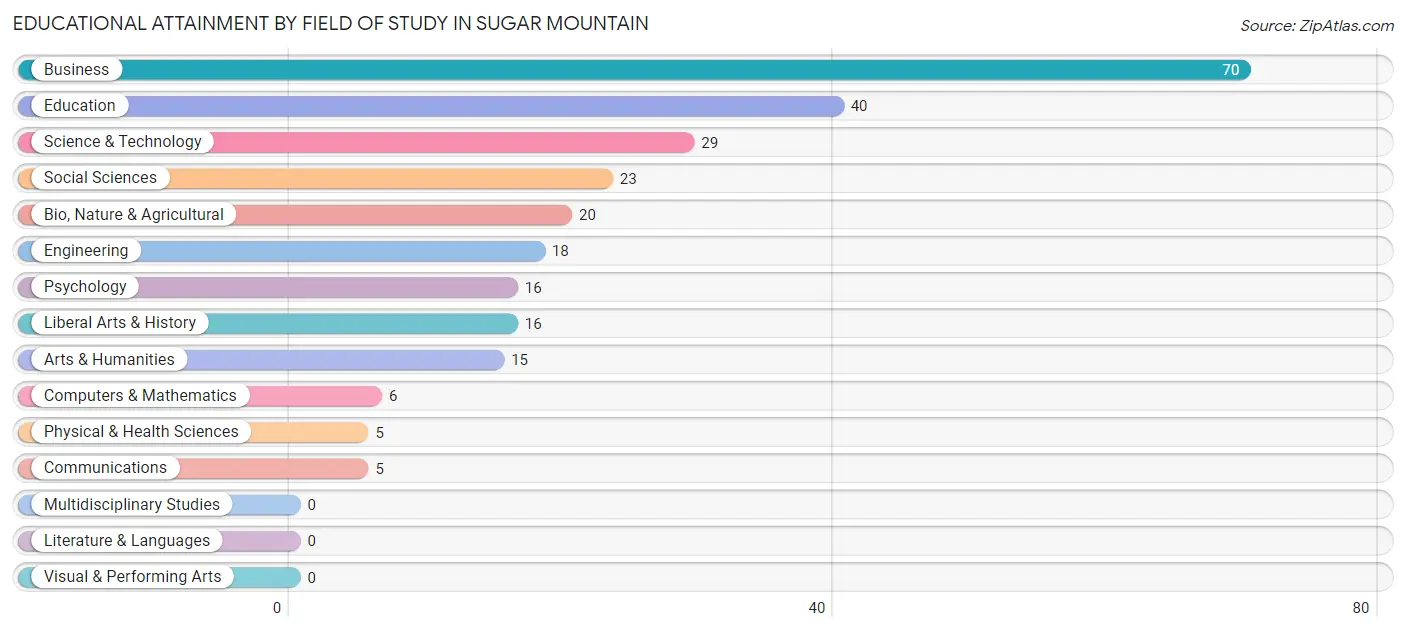
| Field of Study | # Graduates | % Graduates |
| Computers & Mathematics | 6 | 2.3% |
| Bio, Nature & Agricultural | 20 | 7.6% |
| Physical & Health Sciences | 5 | 1.9% |
| Psychology | 16 | 6.1% |
| Social Sciences | 23 | 8.7% |
| Engineering | 18 | 6.8% |
| Multidisciplinary Studies | 0 | 0.0% |
| Science & Technology | 29 | 11.0% |
| Business | 70 | 26.6% |
| Education | 40 | 15.2% |
| Literature & Languages | 0 | 0.0% |
| Liberal Arts & History | 16 | 6.1% |
| Visual & Performing Arts | 0 | 0.0% |
| Communications | 5 | 1.9% |
| Arts & Humanities | 15 | 5.7% |
| Total | 263 | 100.0% |
Transportation & Commute in Sugar Mountain
Vehicle Availability by Sex in Sugar Mountain
The most prevalent vehicle ownership categories in Sugar Mountain are males with 2 vehicles (78, accounting for 77.2%) and females with 2 vehicles (68, making up 61.9%).
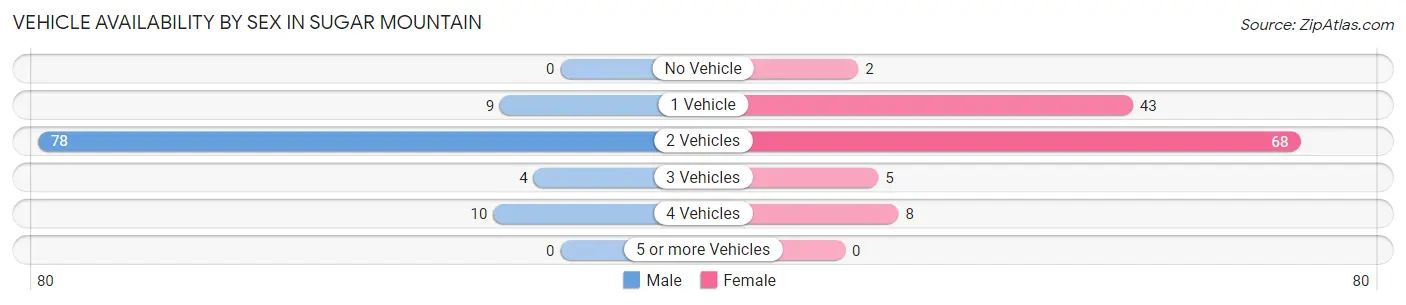
| Vehicles Available | Male | Female |
| No Vehicle | 0 (0.0%) | 2 (1.6%) |
| 1 Vehicle | 9 (8.9%) | 43 (34.1%) |
| 2 Vehicles | 78 (77.2%) | 68 (54.0%) |
| 3 Vehicles | 4 (4.0%) | 5 (4.0%) |
| 4 Vehicles | 10 (9.9%) | 8 (6.4%) |
| 5 or more Vehicles | 0 (0.0%) | 0 (0.0%) |
| Total | 101 (100.0%) | 126 (100.0%) |
Commute Time in Sugar Mountain
The most frequently occuring commute durations in Sugar Mountain are 25 to 29 minutes (77 commuters, 37.2%), less than 5 minutes (31 commuters, 15.0%), and 5 to 9 minutes (27 commuters, 13.0%).
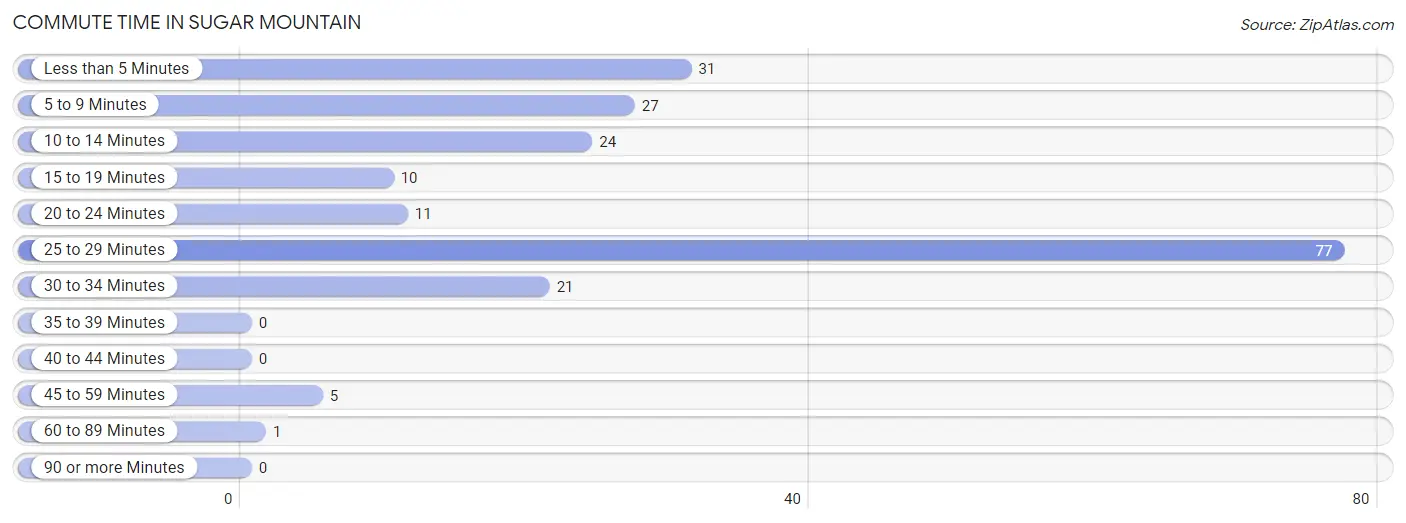
| Commute Time | # Commuters | % Commuters |
| Less than 5 Minutes | 31 | 15.0% |
| 5 to 9 Minutes | 27 | 13.0% |
| 10 to 14 Minutes | 24 | 11.6% |
| 15 to 19 Minutes | 10 | 4.8% |
| 20 to 24 Minutes | 11 | 5.3% |
| 25 to 29 Minutes | 77 | 37.2% |
| 30 to 34 Minutes | 21 | 10.1% |
| 35 to 39 Minutes | 0 | 0.0% |
| 40 to 44 Minutes | 0 | 0.0% |
| 45 to 59 Minutes | 5 | 2.4% |
| 60 to 89 Minutes | 1 | 0.5% |
| 90 or more Minutes | 0 | 0.0% |
Commute Time by Sex in Sugar Mountain
The most common commute times in Sugar Mountain are less than 5 minutes (29 commuters, 29.3%) for males and 25 to 29 minutes (49 commuters, 45.4%) for females.
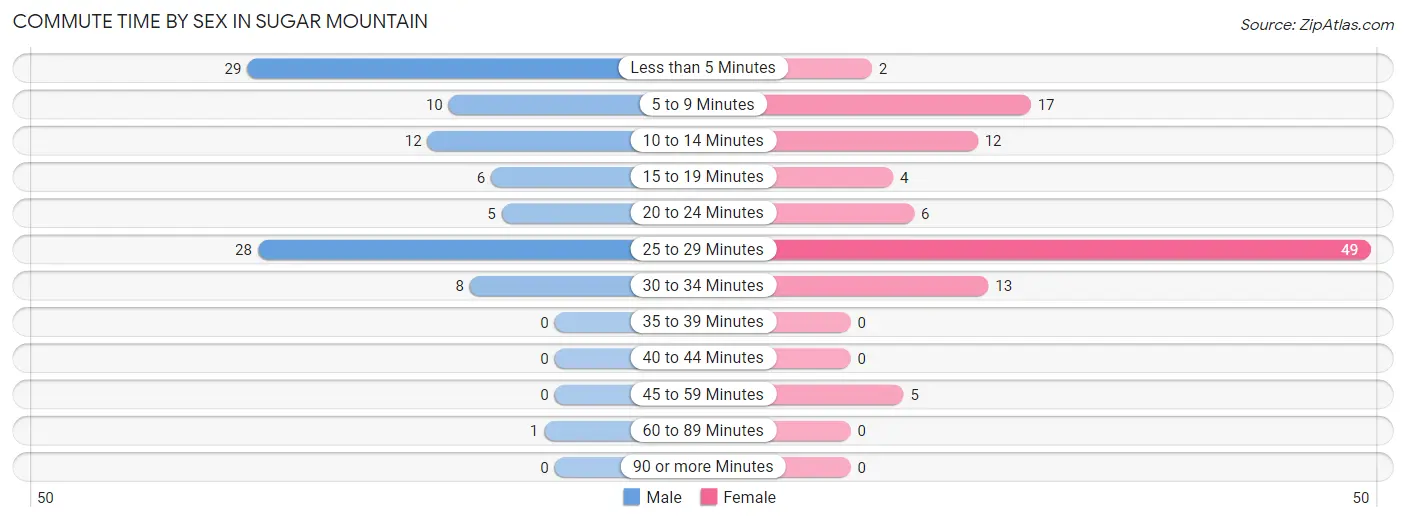
| Commute Time | Male | Female |
| Less than 5 Minutes | 29 (29.3%) | 2 (1.8%) |
| 5 to 9 Minutes | 10 (10.1%) | 17 (15.7%) |
| 10 to 14 Minutes | 12 (12.1%) | 12 (11.1%) |
| 15 to 19 Minutes | 6 (6.1%) | 4 (3.7%) |
| 20 to 24 Minutes | 5 (5.1%) | 6 (5.6%) |
| 25 to 29 Minutes | 28 (28.3%) | 49 (45.4%) |
| 30 to 34 Minutes | 8 (8.1%) | 13 (12.0%) |
| 35 to 39 Minutes | 0 (0.0%) | 0 (0.0%) |
| 40 to 44 Minutes | 0 (0.0%) | 0 (0.0%) |
| 45 to 59 Minutes | 0 (0.0%) | 5 (4.6%) |
| 60 to 89 Minutes | 1 (1.0%) | 0 (0.0%) |
| 90 or more Minutes | 0 (0.0%) | 0 (0.0%) |
Time of Departure to Work by Sex in Sugar Mountain
The most frequent times of departure to work in Sugar Mountain are 4:00 PM to 11:59 PM (29, 29.3%) for males and 10:00 AM to 10:59 AM (38, 35.2%) for females.
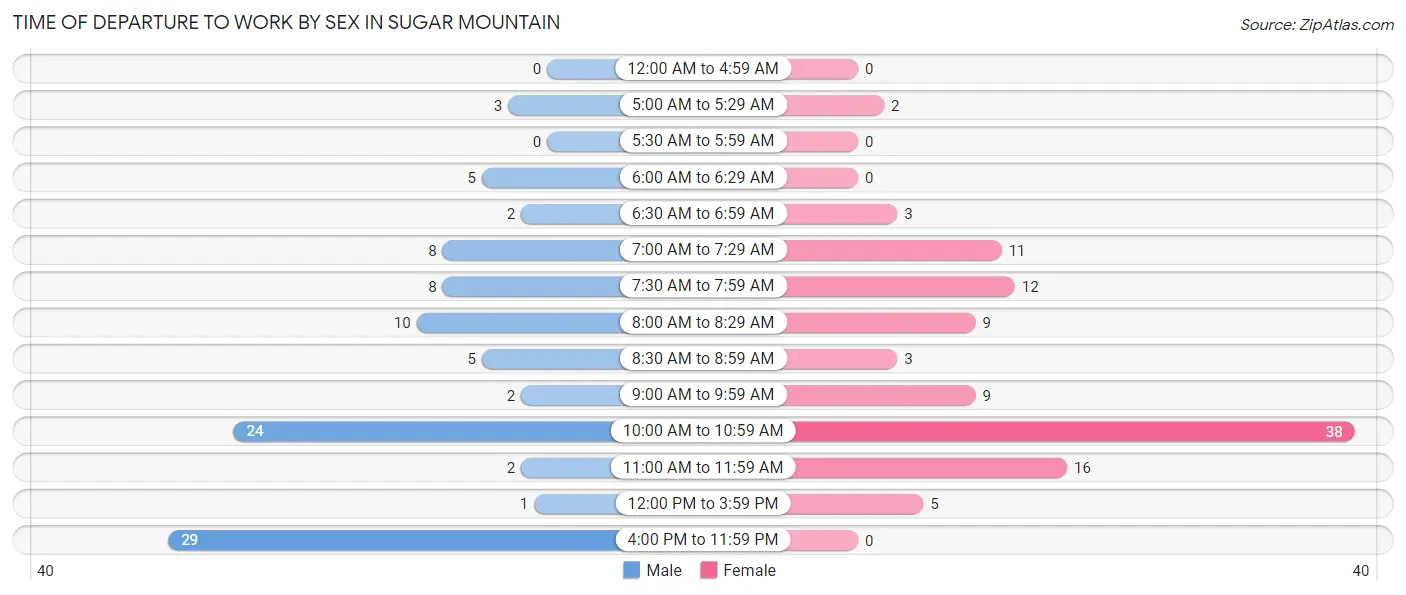
| Time of Departure | Male | Female |
| 12:00 AM to 4:59 AM | 0 (0.0%) | 0 (0.0%) |
| 5:00 AM to 5:29 AM | 3 (3.0%) | 2 (1.8%) |
| 5:30 AM to 5:59 AM | 0 (0.0%) | 0 (0.0%) |
| 6:00 AM to 6:29 AM | 5 (5.1%) | 0 (0.0%) |
| 6:30 AM to 6:59 AM | 2 (2.0%) | 3 (2.8%) |
| 7:00 AM to 7:29 AM | 8 (8.1%) | 11 (10.2%) |
| 7:30 AM to 7:59 AM | 8 (8.1%) | 12 (11.1%) |
| 8:00 AM to 8:29 AM | 10 (10.1%) | 9 (8.3%) |
| 8:30 AM to 8:59 AM | 5 (5.1%) | 3 (2.8%) |
| 9:00 AM to 9:59 AM | 2 (2.0%) | 9 (8.3%) |
| 10:00 AM to 10:59 AM | 24 (24.2%) | 38 (35.2%) |
| 11:00 AM to 11:59 AM | 2 (2.0%) | 16 (14.8%) |
| 12:00 PM to 3:59 PM | 1 (1.0%) | 5 (4.6%) |
| 4:00 PM to 11:59 PM | 29 (29.3%) | 0 (0.0%) |
| Total | 99 (100.0%) | 108 (100.0%) |
Housing Occupancy in Sugar Mountain
Occupancy by Ownership in Sugar Mountain
Of the total 248 dwellings in Sugar Mountain, owner-occupied units account for 195 (78.6%), while renter-occupied units make up 53 (21.4%).
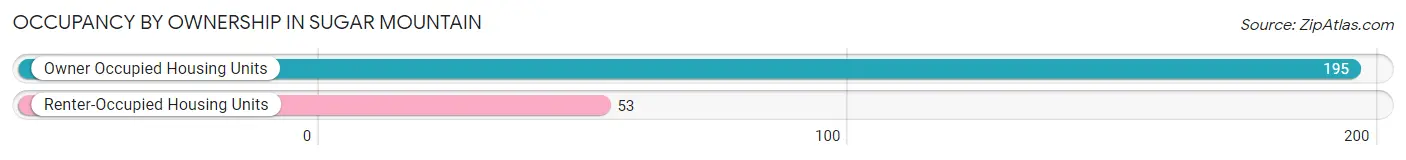
| Occupancy | # Housing Units | % Housing Units |
| Owner Occupied Housing Units | 195 | 78.6% |
| Renter-Occupied Housing Units | 53 | 21.4% |
| Total Occupied Housing Units | 248 | 100.0% |
Occupancy by Household Size in Sugar Mountain
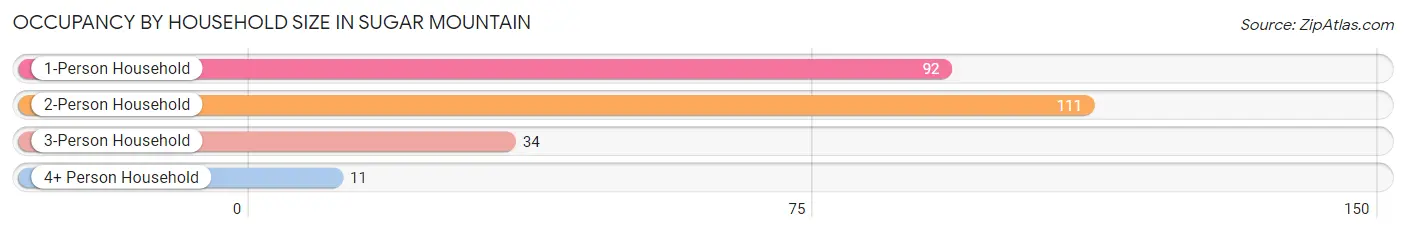
| Household Size | # Housing Units | % Housing Units |
| 1-Person Household | 92 | 37.1% |
| 2-Person Household | 111 | 44.8% |
| 3-Person Household | 34 | 13.7% |
| 4+ Person Household | 11 | 4.4% |
| Total Housing Units | 248 | 100.0% |
Occupancy by Ownership by Household Size in Sugar Mountain
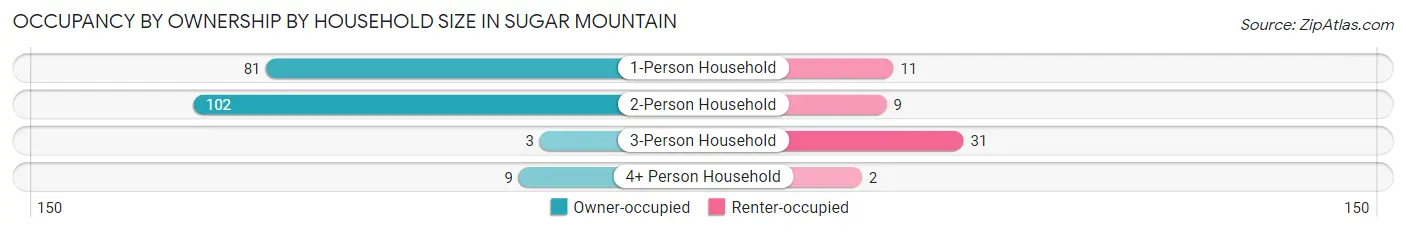
| Household Size | Owner-occupied | Renter-occupied |
| 1-Person Household | 81 (88.0%) | 11 (12.0%) |
| 2-Person Household | 102 (91.9%) | 9 (8.1%) |
| 3-Person Household | 3 (8.8%) | 31 (91.2%) |
| 4+ Person Household | 9 (81.8%) | 2 (18.2%) |
| Total Housing Units | 195 (78.6%) | 53 (21.4%) |
Occupancy by Educational Attainment in Sugar Mountain
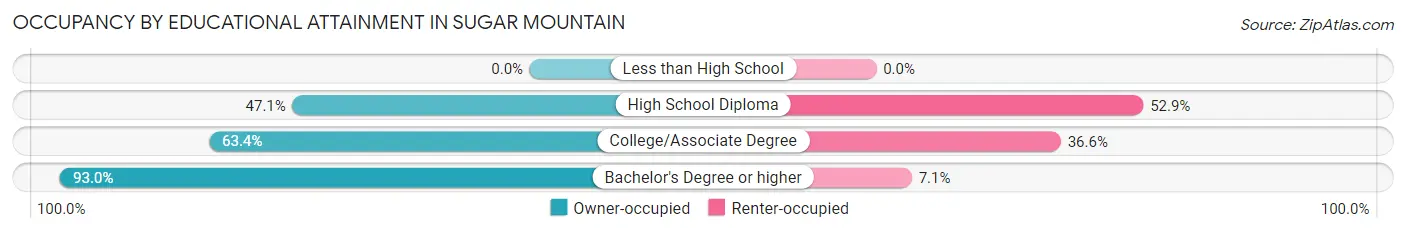
| Household Size | Owner-occupied | Renter-occupied |
| Less than High School | 0 (0.0%) | 0 (0.0%) |
| High School Diploma | 24 (47.1%) | 27 (52.9%) |
| College/Associate Degree | 26 (63.4%) | 15 (36.6%) |
| Bachelor's Degree or higher | 145 (92.9%) | 11 (7.0%) |
Occupancy by Age of Householder in Sugar Mountain
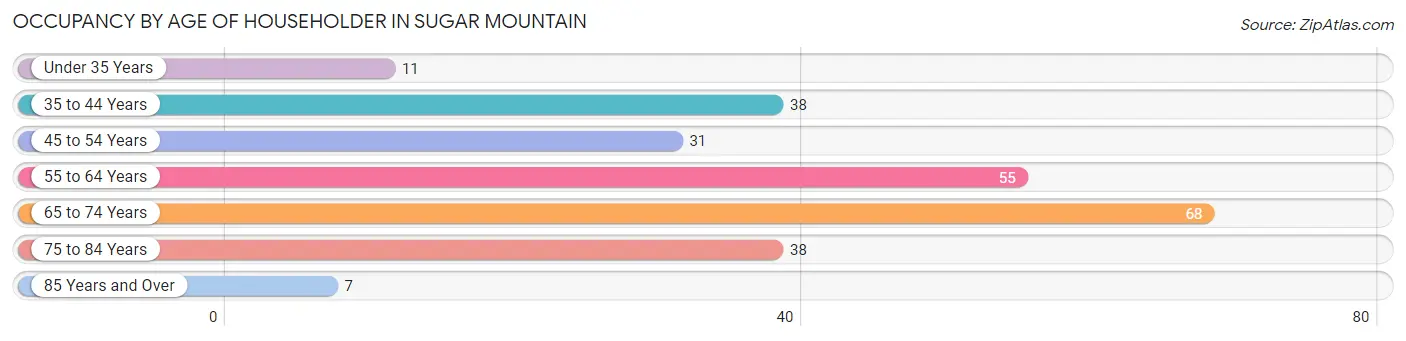
| Age Bracket | # Households | % Households |
| Under 35 Years | 11 | 4.4% |
| 35 to 44 Years | 38 | 15.3% |
| 45 to 54 Years | 31 | 12.5% |
| 55 to 64 Years | 55 | 22.2% |
| 65 to 74 Years | 68 | 27.4% |
| 75 to 84 Years | 38 | 15.3% |
| 85 Years and Over | 7 | 2.8% |
| Total | 248 | 100.0% |
Housing Finances in Sugar Mountain
Median Income by Occupancy in Sugar Mountain
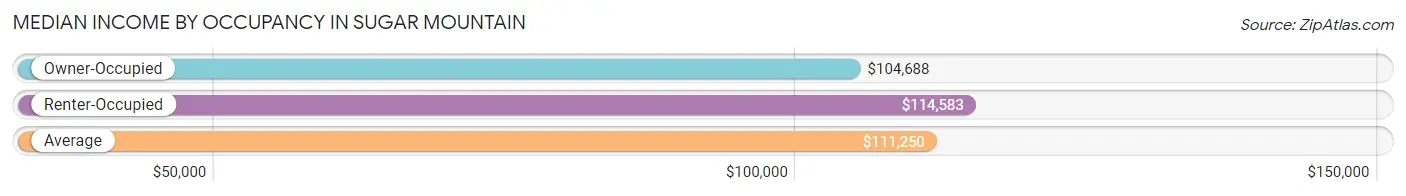
| Occupancy Type | # Households | Median Income |
| Owner-Occupied | 195 (78.6%) | $104,688 |
| Renter-Occupied | 53 (21.4%) | $114,583 |
| Average | 248 (100.0%) | $111,250 |
Occupancy by Householder Income Bracket in Sugar Mountain
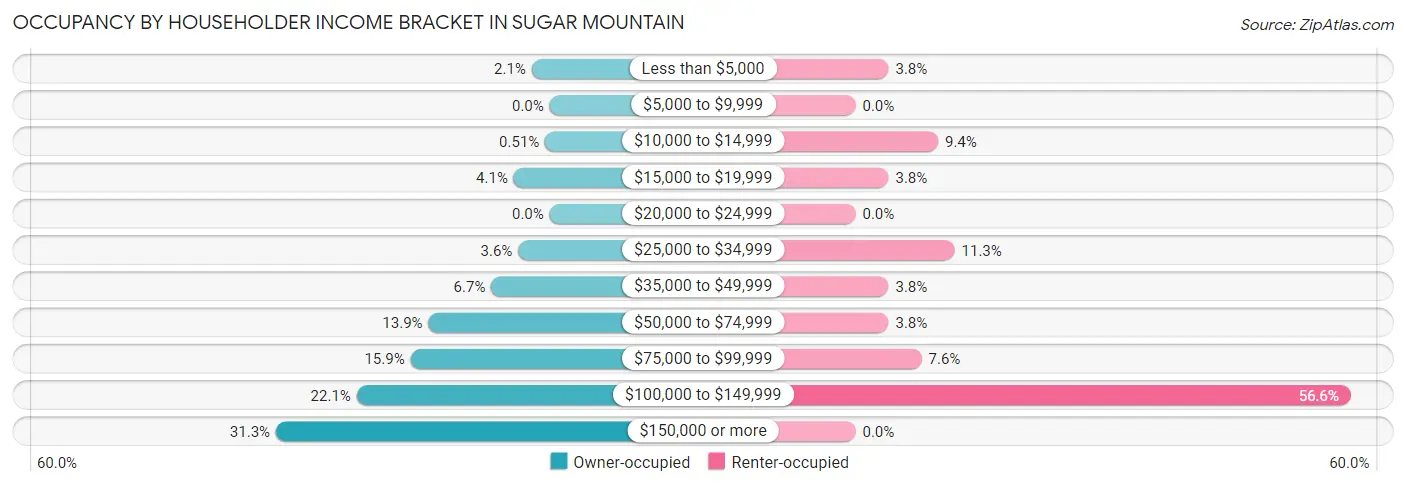
| Income Bracket | Owner-occupied | Renter-occupied |
| Less than $5,000 | 4 (2.1%) | 2 (3.8%) |
| $5,000 to $9,999 | 0 (0.0%) | 0 (0.0%) |
| $10,000 to $14,999 | 1 (0.5%) | 5 (9.4%) |
| $15,000 to $19,999 | 8 (4.1%) | 2 (3.8%) |
| $20,000 to $24,999 | 0 (0.0%) | 0 (0.0%) |
| $25,000 to $34,999 | 7 (3.6%) | 6 (11.3%) |
| $35,000 to $49,999 | 13 (6.7%) | 2 (3.8%) |
| $50,000 to $74,999 | 27 (13.9%) | 2 (3.8%) |
| $75,000 to $99,999 | 31 (15.9%) | 4 (7.5%) |
| $100,000 to $149,999 | 43 (22.1%) | 30 (56.6%) |
| $150,000 or more | 61 (31.3%) | 0 (0.0%) |
| Total | 195 (100.0%) | 53 (100.0%) |
Monthly Housing Cost Tiers in Sugar Mountain
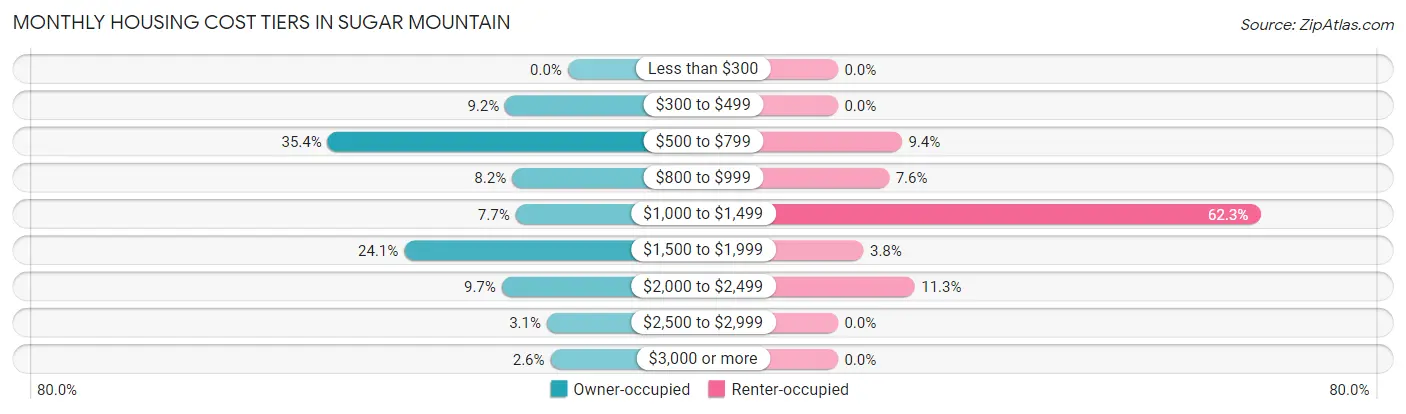
| Monthly Cost | Owner-occupied | Renter-occupied |
| Less than $300 | 0 (0.0%) | 0 (0.0%) |
| $300 to $499 | 18 (9.2%) | 0 (0.0%) |
| $500 to $799 | 69 (35.4%) | 5 (9.4%) |
| $800 to $999 | 16 (8.2%) | 4 (7.5%) |
| $1,000 to $1,499 | 15 (7.7%) | 33 (62.3%) |
| $1,500 to $1,999 | 47 (24.1%) | 2 (3.8%) |
| $2,000 to $2,499 | 19 (9.7%) | 6 (11.3%) |
| $2,500 to $2,999 | 6 (3.1%) | 0 (0.0%) |
| $3,000 or more | 5 (2.6%) | 0 (0.0%) |
| Total | 195 (100.0%) | 53 (100.0%) |
Physical Housing Characteristics in Sugar Mountain
Housing Structures in Sugar Mountain
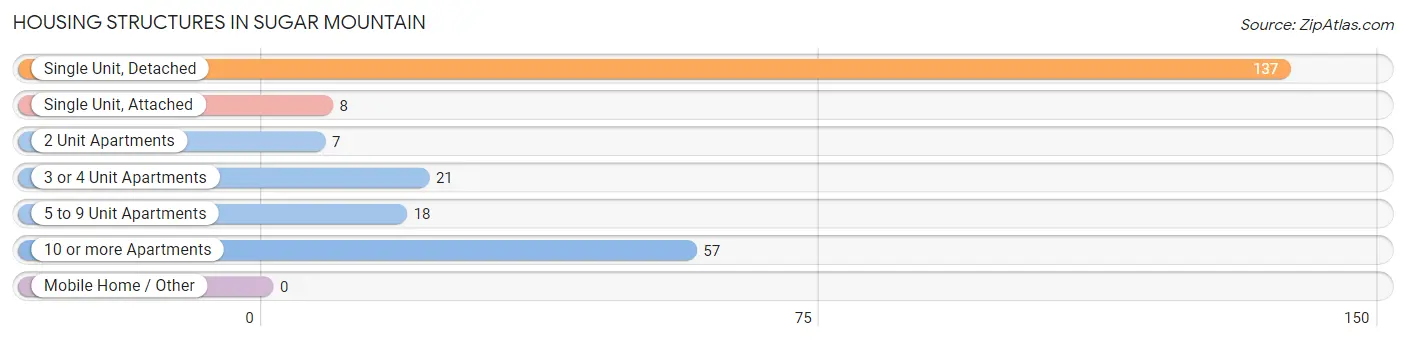
| Structure Type | # Housing Units | % Housing Units |
| Single Unit, Detached | 137 | 55.2% |
| Single Unit, Attached | 8 | 3.2% |
| 2 Unit Apartments | 7 | 2.8% |
| 3 or 4 Unit Apartments | 21 | 8.5% |
| 5 to 9 Unit Apartments | 18 | 7.3% |
| 10 or more Apartments | 57 | 23.0% |
| Mobile Home / Other | 0 | 0.0% |
| Total | 248 | 100.0% |
Housing Structures by Occupancy in Sugar Mountain
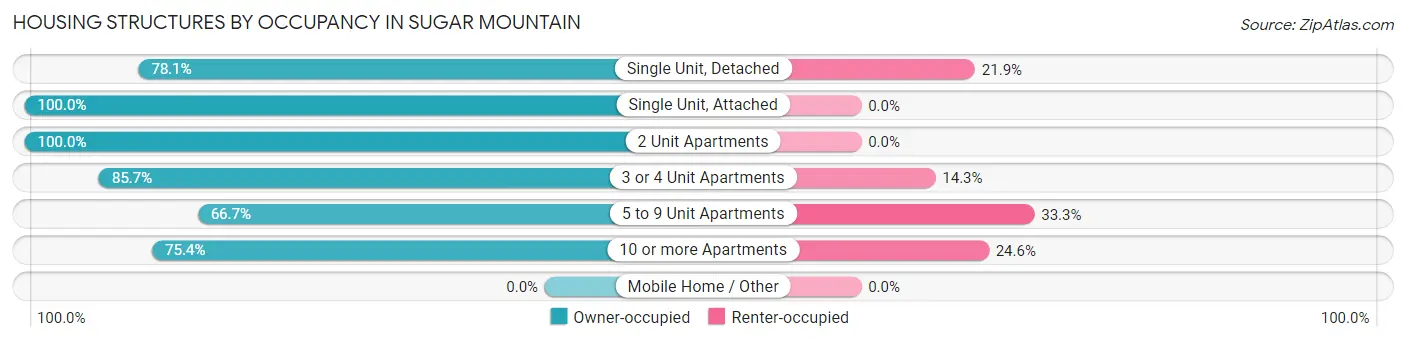
| Structure Type | Owner-occupied | Renter-occupied |
| Single Unit, Detached | 107 (78.1%) | 30 (21.9%) |
| Single Unit, Attached | 8 (100.0%) | 0 (0.0%) |
| 2 Unit Apartments | 7 (100.0%) | 0 (0.0%) |
| 3 or 4 Unit Apartments | 18 (85.7%) | 3 (14.3%) |
| 5 to 9 Unit Apartments | 12 (66.7%) | 6 (33.3%) |
| 10 or more Apartments | 43 (75.4%) | 14 (24.6%) |
| Mobile Home / Other | 0 (0.0%) | 0 (0.0%) |
| Total | 195 (78.6%) | 53 (21.4%) |
Housing Structures by Number of Rooms in Sugar Mountain
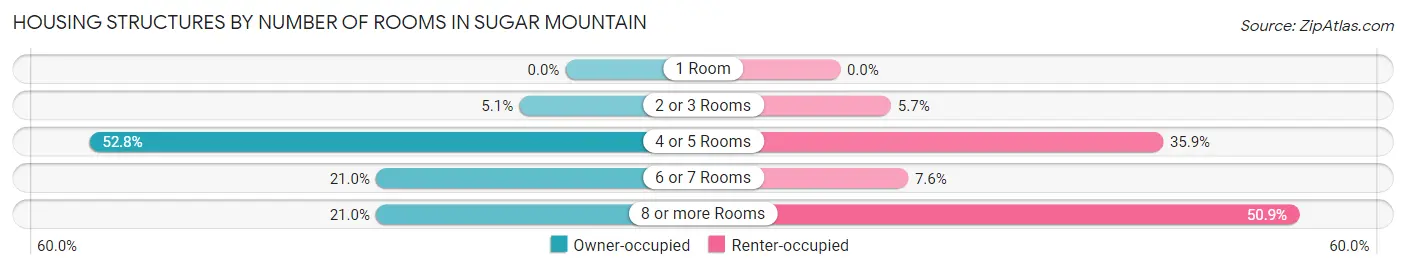
| Number of Rooms | Owner-occupied | Renter-occupied |
| 1 Room | 0 (0.0%) | 0 (0.0%) |
| 2 or 3 Rooms | 10 (5.1%) | 3 (5.7%) |
| 4 or 5 Rooms | 103 (52.8%) | 19 (35.8%) |
| 6 or 7 Rooms | 41 (21.0%) | 4 (7.5%) |
| 8 or more Rooms | 41 (21.0%) | 27 (50.9%) |
| Total | 195 (100.0%) | 53 (100.0%) |
Housing Structure by Heating Type in Sugar Mountain
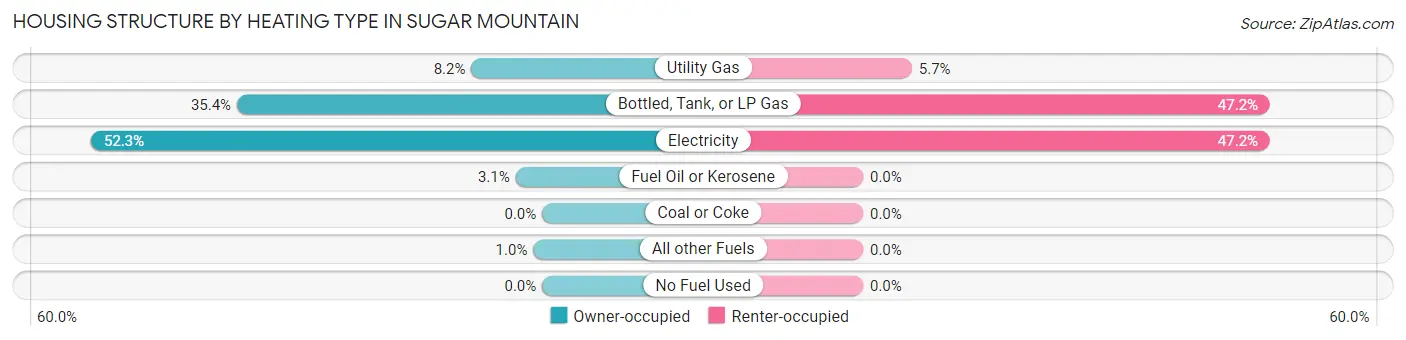
| Heating Type | Owner-occupied | Renter-occupied |
| Utility Gas | 16 (8.2%) | 3 (5.7%) |
| Bottled, Tank, or LP Gas | 69 (35.4%) | 25 (47.2%) |
| Electricity | 102 (52.3%) | 25 (47.2%) |
| Fuel Oil or Kerosene | 6 (3.1%) | 0 (0.0%) |
| Coal or Coke | 0 (0.0%) | 0 (0.0%) |
| All other Fuels | 2 (1.0%) | 0 (0.0%) |
| No Fuel Used | 0 (0.0%) | 0 (0.0%) |
| Total | 195 (100.0%) | 53 (100.0%) |
Household Vehicle Usage in Sugar Mountain
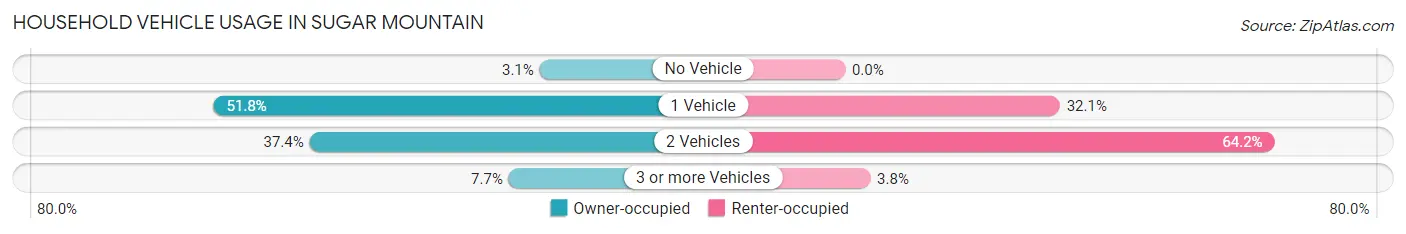
| Vehicles per Household | Owner-occupied | Renter-occupied |
| No Vehicle | 6 (3.1%) | 0 (0.0%) |
| 1 Vehicle | 101 (51.8%) | 17 (32.1%) |
| 2 Vehicles | 73 (37.4%) | 34 (64.1%) |
| 3 or more Vehicles | 15 (7.7%) | 2 (3.8%) |
| Total | 195 (100.0%) | 53 (100.0%) |
Real Estate & Mortgages in Sugar Mountain
Real Estate and Mortgage Overview in Sugar Mountain
| Characteristic | Without Mortgage | With Mortgage |
| Housing Units | 111 | 84 |
| Median Property Value | $210,900 | $335,000 |
| Median Household Income | $89,583 | $24 |
| Monthly Housing Costs | $669 | $5 |
| Real Estate Taxes | $1,466 | $0 |
Property Value by Mortgage Status in Sugar Mountain
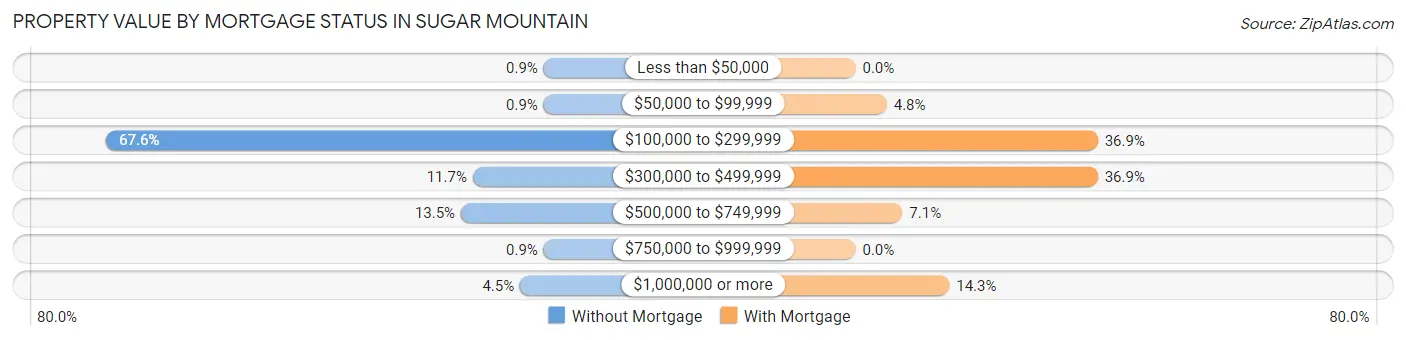
| Property Value | Without Mortgage | With Mortgage |
| Less than $50,000 | 1 (0.9%) | 0 (0.0%) |
| $50,000 to $99,999 | 1 (0.9%) | 4 (4.8%) |
| $100,000 to $299,999 | 75 (67.6%) | 31 (36.9%) |
| $300,000 to $499,999 | 13 (11.7%) | 31 (36.9%) |
| $500,000 to $749,999 | 15 (13.5%) | 6 (7.1%) |
| $750,000 to $999,999 | 1 (0.9%) | 0 (0.0%) |
| $1,000,000 or more | 5 (4.5%) | 12 (14.3%) |
| Total | 111 (100.0%) | 84 (100.0%) |
Household Income by Mortgage Status in Sugar Mountain
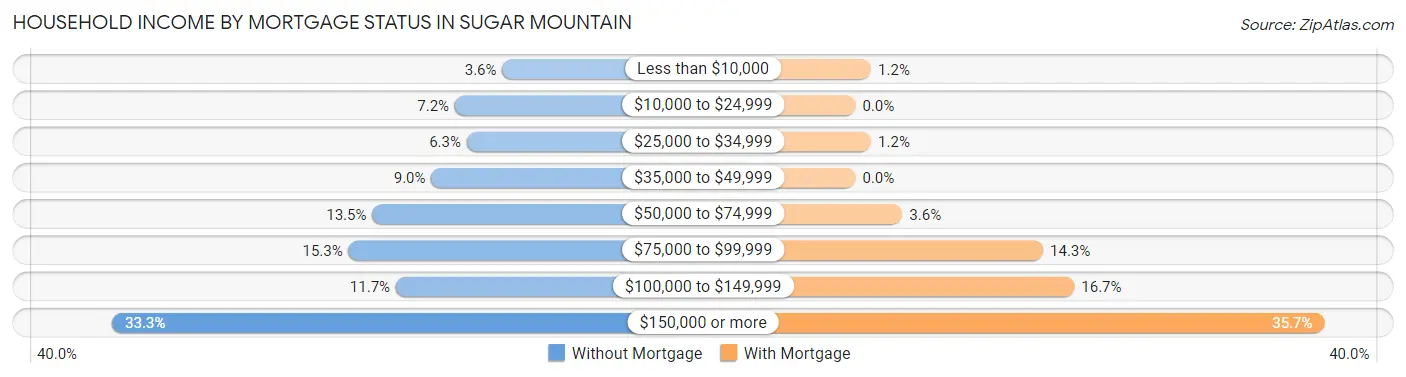
| Household Income | Without Mortgage | With Mortgage |
| Less than $10,000 | 4 (3.6%) | 1 (1.2%) |
| $10,000 to $24,999 | 8 (7.2%) | 0 (0.0%) |
| $25,000 to $34,999 | 7 (6.3%) | 1 (1.2%) |
| $35,000 to $49,999 | 10 (9.0%) | 0 (0.0%) |
| $50,000 to $74,999 | 15 (13.5%) | 3 (3.6%) |
| $75,000 to $99,999 | 17 (15.3%) | 12 (14.3%) |
| $100,000 to $149,999 | 13 (11.7%) | 14 (16.7%) |
| $150,000 or more | 37 (33.3%) | 30 (35.7%) |
| Total | 111 (100.0%) | 84 (100.0%) |
Property Value to Household Income Ratio in Sugar Mountain
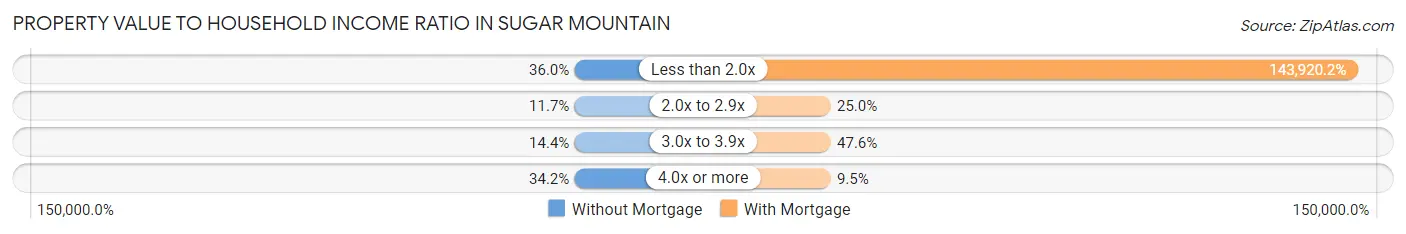
| Value-to-Income Ratio | Without Mortgage | With Mortgage |
| Less than 2.0x | 40 (36.0%) | 120,893 (143,920.2%) |
| 2.0x to 2.9x | 13 (11.7%) | 21 (25.0%) |
| 3.0x to 3.9x | 16 (14.4%) | 40 (47.6%) |
| 4.0x or more | 38 (34.2%) | 8 (9.5%) |
| Total | 111 (100.0%) | 84 (100.0%) |
Real Estate Taxes by Mortgage Status in Sugar Mountain
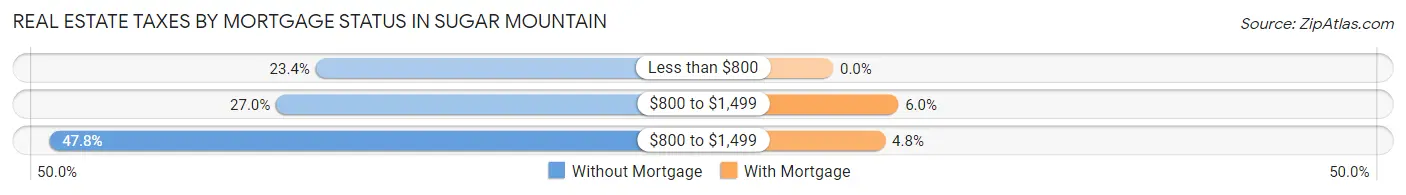
| Property Taxes | Without Mortgage | With Mortgage |
| Less than $800 | 26 (23.4%) | 0 (0.0%) |
| $800 to $1,499 | 30 (27.0%) | 5 (5.9%) |
| $800 to $1,499 | 53 (47.7%) | 4 (4.8%) |
| Total | 111 (100.0%) | 84 (100.0%) |
Health & Disability in Sugar Mountain
Health Insurance Coverage by Age in Sugar Mountain
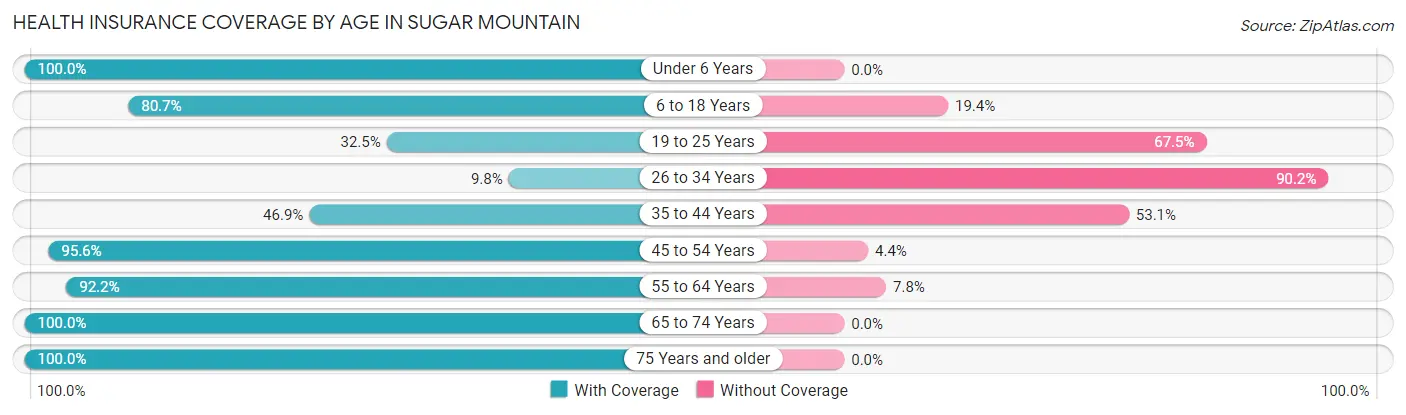
| Age Bracket | With Coverage | Without Coverage |
| Under 6 Years | 9 (100.0%) | 0 (0.0%) |
| 6 to 18 Years | 25 (80.6%) | 6 (19.4%) |
| 19 to 25 Years | 13 (32.5%) | 27 (67.5%) |
| 26 to 34 Years | 4 (9.8%) | 37 (90.2%) |
| 35 to 44 Years | 23 (46.9%) | 26 (53.1%) |
| 45 to 54 Years | 43 (95.6%) | 2 (4.4%) |
| 55 to 64 Years | 71 (92.2%) | 6 (7.8%) |
| 65 to 74 Years | 111 (100.0%) | 0 (0.0%) |
| 75 Years and older | 86 (100.0%) | 0 (0.0%) |
| Total | 385 (78.7%) | 104 (21.3%) |
Health Insurance Coverage by Citizenship Status in Sugar Mountain
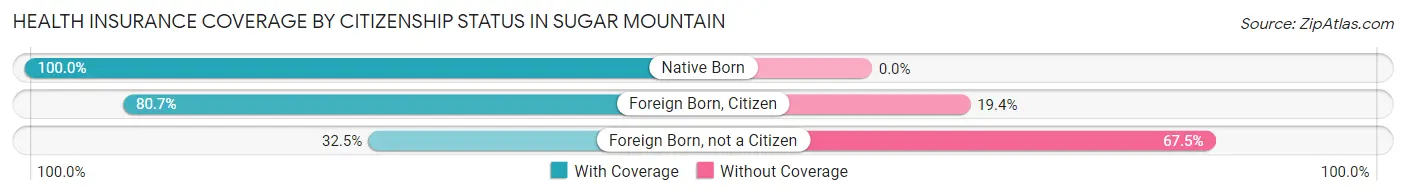
| Citizenship Status | With Coverage | Without Coverage |
| Native Born | 9 (100.0%) | 0 (0.0%) |
| Foreign Born, Citizen | 25 (80.6%) | 6 (19.4%) |
| Foreign Born, not a Citizen | 13 (32.5%) | 27 (67.5%) |
Health Insurance Coverage by Household Income in Sugar Mountain
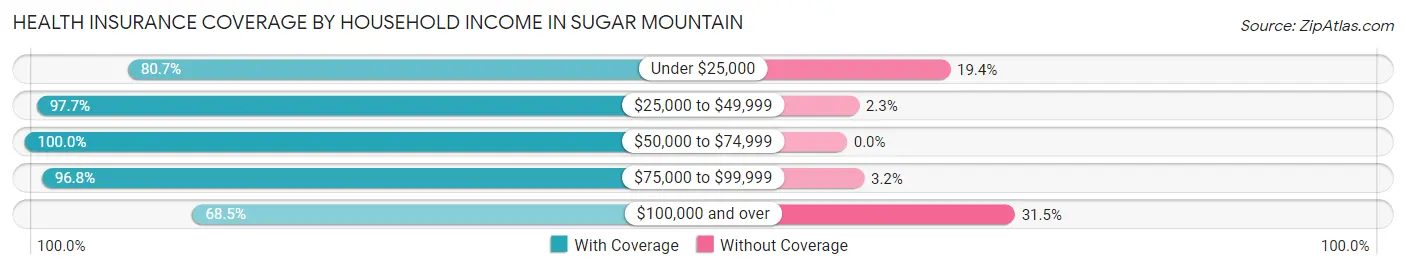
| Household Income | With Coverage | Without Coverage |
| Under $25,000 | 25 (80.6%) | 6 (19.4%) |
| $25,000 to $49,999 | 43 (97.7%) | 1 (2.3%) |
| $50,000 to $74,999 | 50 (100.0%) | 0 (0.0%) |
| $75,000 to $99,999 | 60 (96.8%) | 2 (3.2%) |
| $100,000 and over | 207 (68.5%) | 95 (31.5%) |
Public vs Private Health Insurance Coverage by Age in Sugar Mountain
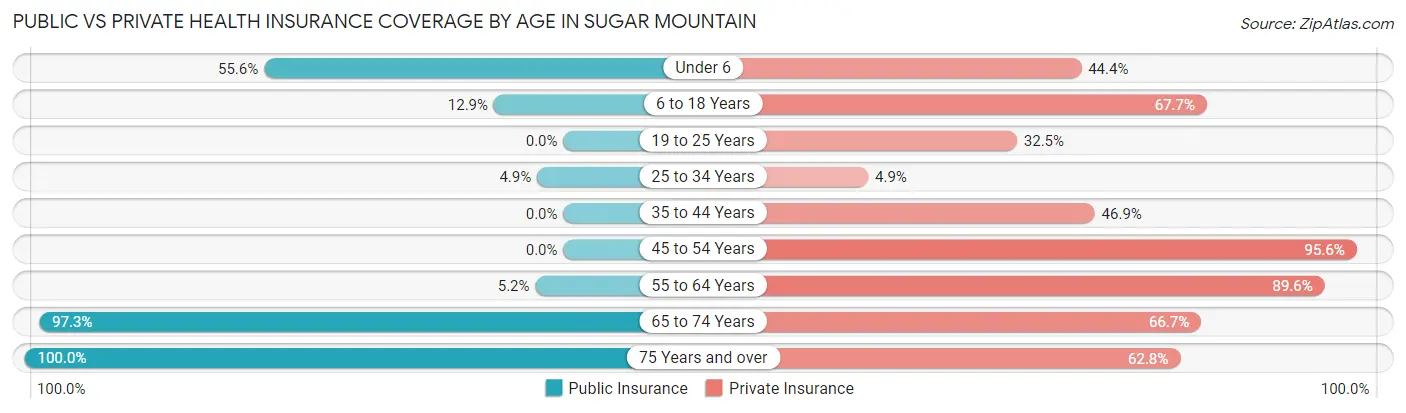
| Age Bracket | Public Insurance | Private Insurance |
| Under 6 | 5 (55.6%) | 4 (44.4%) |
| 6 to 18 Years | 4 (12.9%) | 21 (67.7%) |
| 19 to 25 Years | 0 (0.0%) | 13 (32.5%) |
| 25 to 34 Years | 2 (4.9%) | 2 (4.9%) |
| 35 to 44 Years | 0 (0.0%) | 23 (46.9%) |
| 45 to 54 Years | 0 (0.0%) | 43 (95.6%) |
| 55 to 64 Years | 4 (5.2%) | 69 (89.6%) |
| 65 to 74 Years | 108 (97.3%) | 74 (66.7%) |
| 75 Years and over | 86 (100.0%) | 54 (62.8%) |
| Total | 209 (42.7%) | 303 (62.0%) |
Disability Status by Sex by Age in Sugar Mountain
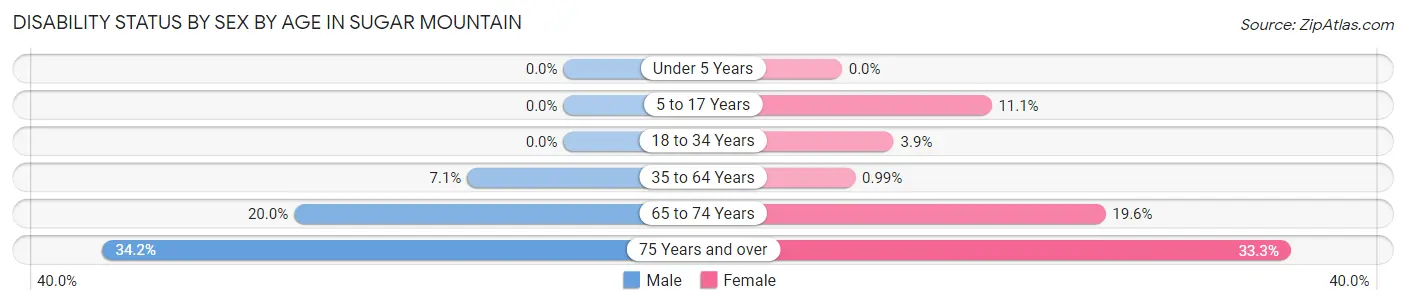
| Age Bracket | Male | Female |
| Under 5 Years | 0 (0.0%) | 0 (0.0%) |
| 5 to 17 Years | 0 (0.0%) | 1 (11.1%) |
| 18 to 34 Years | 0 (0.0%) | 2 (3.8%) |
| 35 to 64 Years | 5 (7.1%) | 1 (1.0%) |
| 65 to 74 Years | 13 (20.0%) | 9 (19.6%) |
| 75 Years and over | 13 (34.2%) | 16 (33.3%) |
Disability Class by Sex by Age in Sugar Mountain
Disability Class: Hearing Difficulty
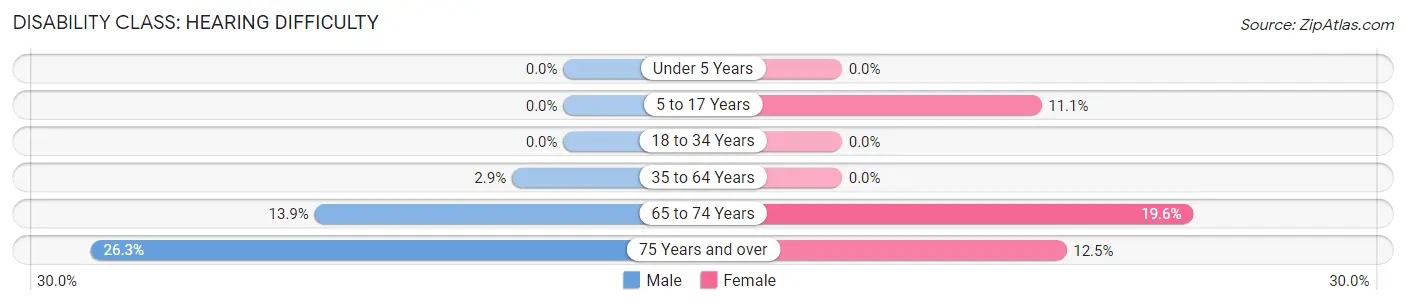
| Age Bracket | Male | Female |
| Under 5 Years | 0 (0.0%) | 0 (0.0%) |
| 5 to 17 Years | 0 (0.0%) | 1 (11.1%) |
| 18 to 34 Years | 0 (0.0%) | 0 (0.0%) |
| 35 to 64 Years | 2 (2.9%) | 0 (0.0%) |
| 65 to 74 Years | 9 (13.9%) | 9 (19.6%) |
| 75 Years and over | 10 (26.3%) | 6 (12.5%) |
Disability Class: Vision Difficulty
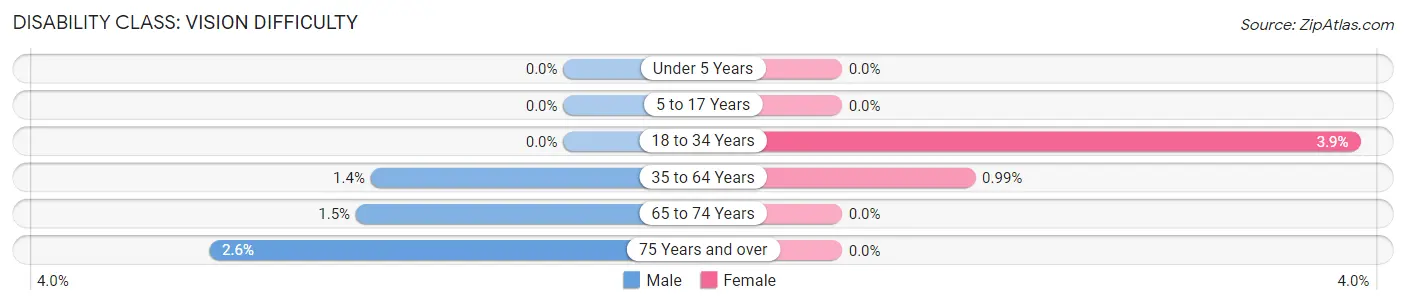
| Age Bracket | Male | Female |
| Under 5 Years | 0 (0.0%) | 0 (0.0%) |
| 5 to 17 Years | 0 (0.0%) | 0 (0.0%) |
| 18 to 34 Years | 0 (0.0%) | 2 (3.8%) |
| 35 to 64 Years | 1 (1.4%) | 1 (1.0%) |
| 65 to 74 Years | 1 (1.5%) | 0 (0.0%) |
| 75 Years and over | 1 (2.6%) | 0 (0.0%) |
Disability Class: Cognitive Difficulty
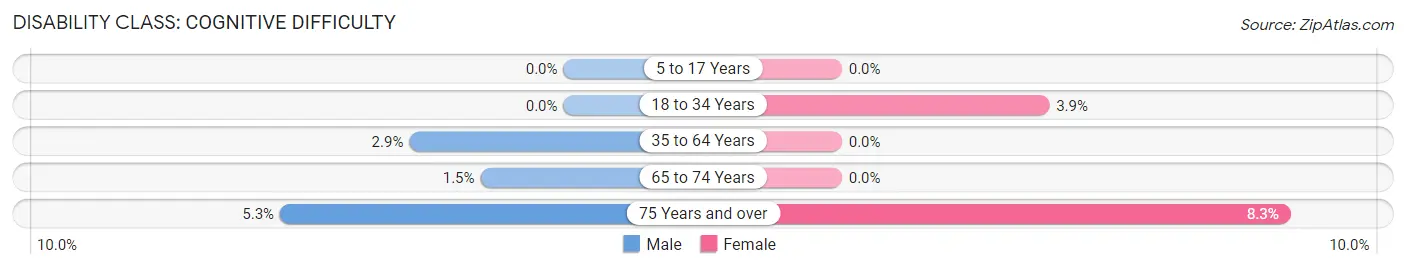
| Age Bracket | Male | Female |
| 5 to 17 Years | 0 (0.0%) | 0 (0.0%) |
| 18 to 34 Years | 0 (0.0%) | 2 (3.8%) |
| 35 to 64 Years | 2 (2.9%) | 0 (0.0%) |
| 65 to 74 Years | 1 (1.5%) | 0 (0.0%) |
| 75 Years and over | 2 (5.3%) | 4 (8.3%) |
Disability Class: Ambulatory Difficulty
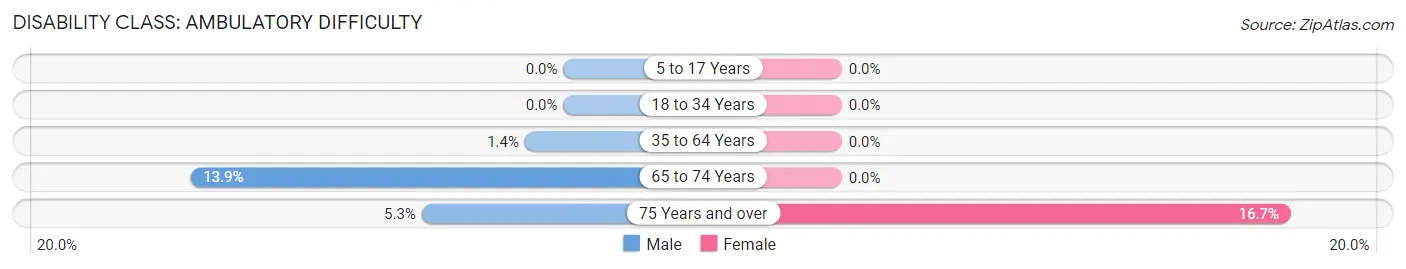
| Age Bracket | Male | Female |
| 5 to 17 Years | 0 (0.0%) | 0 (0.0%) |
| 18 to 34 Years | 0 (0.0%) | 0 (0.0%) |
| 35 to 64 Years | 1 (1.4%) | 0 (0.0%) |
| 65 to 74 Years | 9 (13.9%) | 0 (0.0%) |
| 75 Years and over | 2 (5.3%) | 8 (16.7%) |
Disability Class: Self-Care Difficulty
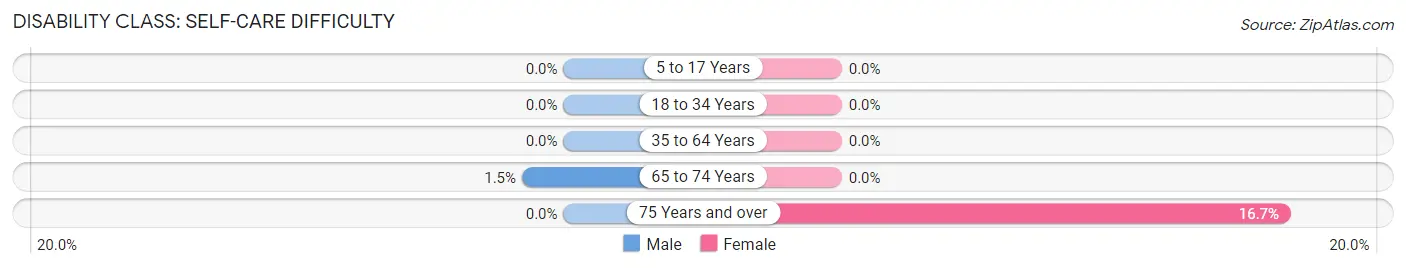
| Age Bracket | Male | Female |
| 5 to 17 Years | 0 (0.0%) | 0 (0.0%) |
| 18 to 34 Years | 0 (0.0%) | 0 (0.0%) |
| 35 to 64 Years | 0 (0.0%) | 0 (0.0%) |
| 65 to 74 Years | 1 (1.5%) | 0 (0.0%) |
| 75 Years and over | 0 (0.0%) | 8 (16.7%) |
Technology Access in Sugar Mountain
Computing Device Access in Sugar Mountain
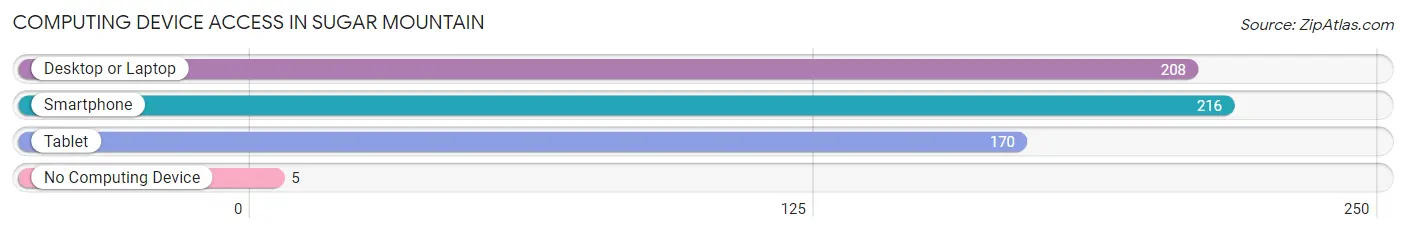
| Device Type | # Households | % Households |
| Desktop or Laptop | 208 | 83.9% |
| Smartphone | 216 | 87.1% |
| Tablet | 170 | 68.5% |
| No Computing Device | 5 | 2.0% |
| Total | 248 | 100.0% |
Internet Access in Sugar Mountain
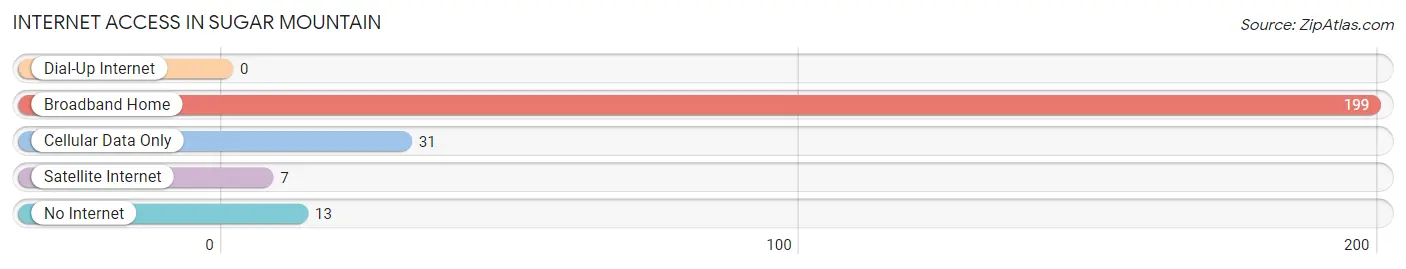
| Internet Type | # Households | % Households |
| Dial-Up Internet | 0 | 0.0% |
| Broadband Home | 199 | 80.2% |
| Cellular Data Only | 31 | 12.5% |
| Satellite Internet | 7 | 2.8% |
| No Internet | 13 | 5.2% |
| Total | 248 | 100.0% |
Sugar Mountain Summary
Sugar Mountain, NC is a small town located in the Blue Ridge Mountains of North Carolina. It is situated in Avery County, and is part of the Boone Micropolitan Statistical Area. The town is known for its ski resort, which is the highest ski resort in the eastern United States. The town has a population of approximately 1,000 people, and is a popular tourist destination.
History
Sugar Mountain was first settled in the late 1800s by a group of settlers from the nearby town of Banner Elk. The settlers were attracted to the area due to its abundance of natural resources, including timber and minerals. The town was originally named Sugarloaf Mountain, but the name was changed to Sugar Mountain in the early 1900s.
The town was officially incorporated in 1959, and the first mayor was elected in 1960. The town has remained relatively small and rural since its incorporation, and has not experienced much growth or development.
Geography
Sugar Mountain is located in the Blue Ridge Mountains of North Carolina, and is situated in Avery County. The town is located at an elevation of 4,000 feet, making it the highest ski resort in the eastern United States. The town is surrounded by the Pisgah National Forest, and is located near the Appalachian Trail.
The town is located approximately 20 miles from Boone, NC, and is accessible via US Highway 321. The nearest major airport is Charlotte Douglas International Airport, which is located approximately two hours away.
Economy
The economy of Sugar Mountain is largely based on tourism, as the town is home to the highest ski resort in the eastern United States. The ski resort attracts visitors from all over the country, and is a popular destination for winter sports enthusiasts. The town also has a number of restaurants, shops, and other businesses that cater to tourists.
In addition to tourism, the town is also home to a number of small businesses, including a lumber mill, a sawmill, and a furniture factory. The town also has a number of farms, which produce a variety of crops, including apples, peaches, and hay.
Demographics
As of the 2010 census, the population of Sugar Mountain was 1,000 people. The racial makeup of the town was 97.2% White, 0.7% African American, 0.3% Native American, 0.3% Asian, and 1.5% from other races. The median household income was $37,500, and the median age was 44.
Conclusion
Sugar Mountain, NC is a small town located in the Blue Ridge Mountains of North Carolina. The town is known for its ski resort, which is the highest ski resort in the eastern United States. The town has a population of approximately 1,000 people, and is a popular tourist destination. The economy of the town is largely based on tourism, and the town also has a number of small businesses, farms, and other businesses. The racial makeup of the town is predominantly White, with a small percentage of African American, Native American, and Asian residents.
Common Questions
What is the Total Population of Sugar Mountain?
Total Population of Sugar Mountain is 489.
What is the Total Male Population of Sugar Mountain?
Total Male Population of Sugar Mountain is 230.
What is the Total Female Population of Sugar Mountain?
Total Female Population of Sugar Mountain is 259.
What is the Ratio of Males per 100 Females in Sugar Mountain?
There are 88.80 Males per 100 Females in Sugar Mountain.
What is the Ratio of Females per 100 Males in Sugar Mountain?
There are 112.61 Females per 100 Males in Sugar Mountain.
What is the Median Population Age in Sugar Mountain?
Median Population Age in Sugar Mountain is 61.2 Years.
What is the Average Family Size in Sugar Mountain
Average Family Size in Sugar Mountain is 2.5 People.
What is the Average Household Size in Sugar Mountain
Average Household Size in Sugar Mountain is 2.0 People.
What is Per Capita Income in Sugar Mountain?
Per Capita income in Sugar Mountain is $67,622.
What is the Median Family Income in Sugar Mountain?
Median Family Income in Sugar Mountain is $133,750.
What is the Median Household income in Sugar Mountain?
Median Household Income in Sugar Mountain is $111,250.
What is Income or Wage Gap in Sugar Mountain?
Income or Wage Gap in Sugar Mountain is 57.2%.
Women in Sugar Mountain earn 42.8 cents for every dollar earned by a man.
What is Inequality or Gini Index in Sugar Mountain?
Inequality or Gini Index in Sugar Mountain is 0.44.
How Large is the Labor Force in Sugar Mountain?
There are 237 People in the Labor Forcein in Sugar Mountain.
What is the Percentage of People in the Labor Force in Sugar Mountain?
51.6% of People are in the Labor Force in Sugar Mountain.
What is the Unemployment Rate in Sugar Mountain?
Unemployment Rate in Sugar Mountain is 3.4%.