Garner, NC
Garner Map
Garner Overview
31,684
TOTAL POPULATION
15,198
MALE POPULATION
16,486
FEMALE POPULATION
92.19
MALES / 100 FEMALES
108.47
FEMALES / 100 MALES
37.3
MEDIAN AGE
3.2
AVG FAMILY SIZE
2.5
AVG HOUSEHOLD SIZE
$42,165
PER CAPITA INCOME
$99,450
AVG FAMILY INCOME
$77,171
AVG HOUSEHOLD INCOME
24.8%
WAGE / INCOME GAP [ % ]
75.2¢/ $1
WAGE / INCOME GAP [ $ ]
$9,463
FAMILY INCOME DEFICIT
0.40
INEQUALITY / GINI INDEX
17,848
LABOR FORCE [ PEOPLE ]
69.2%
PERCENT IN LABOR FORCE
5.8%
UNEMPLOYMENT RATE
Garner Zip Codes
Garner Area Codes
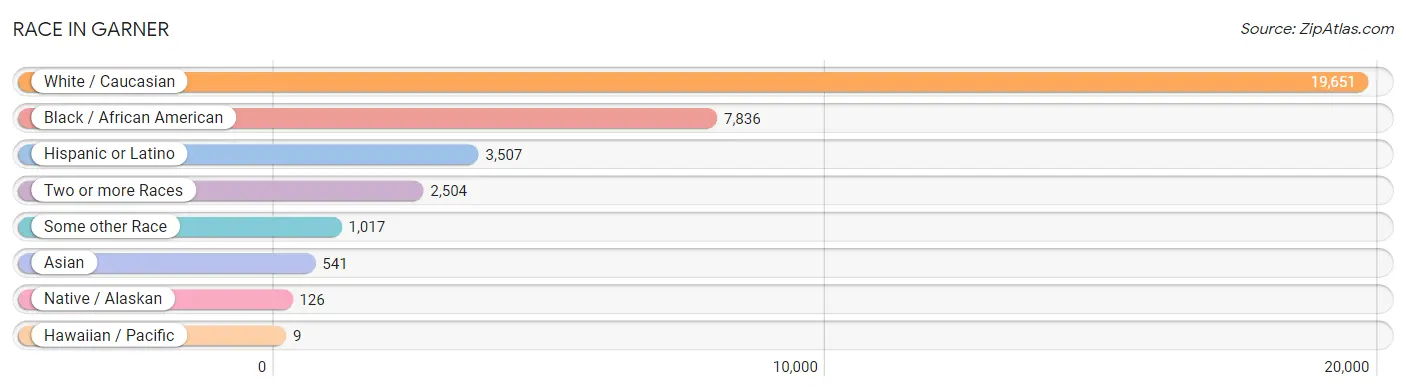
Race in Garner
The most populous races in Garner are White / Caucasian (19,651 | 62.0%), Black / African American (7,836 | 24.7%), and Hispanic or Latino (3,507 | 11.1%).
| Race | # Population | % Population |
| Asian | 541 | 1.7% |
| Black / African American | 7,836 | 24.7% |
| Hawaiian / Pacific | 9 | 0.0% |
| Hispanic or Latino | 3,507 | 11.1% |
| Native / Alaskan | 126 | 0.4% |
| White / Caucasian | 19,651 | 62.0% |
| Two or more Races | 2,504 | 7.9% |
| Some other Race | 1,017 | 3.2% |
| Total | 31,684 | 100.0% |
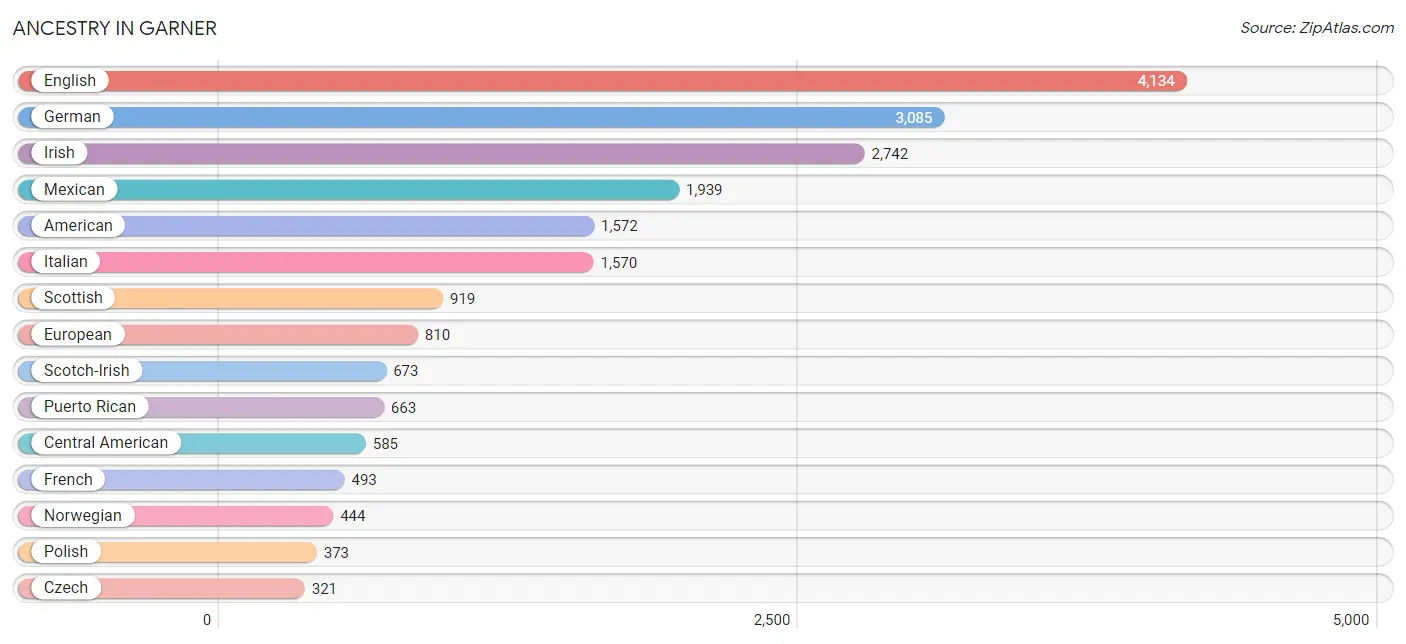
Ancestry in Garner
The most populous ancestries reported in Garner are English (4,134 | 13.1%), German (3,085 | 9.7%), Irish (2,742 | 8.6%), Mexican (1,939 | 6.1%), and American (1,572 | 5.0%), together accounting for 42.5% of all Garner residents.
| Ancestry | # Population | % Population |
| African | 193 | 0.6% |
| American | 1,572 | 5.0% |
| Apache | 8 | 0.0% |
| Arab | 262 | 0.8% |
| Armenian | 34 | 0.1% |
| Bhutanese | 4 | 0.0% |
| British | 270 | 0.9% |
| Burmese | 220 | 0.7% |
| Cambodian | 26 | 0.1% |
| Canadian | 38 | 0.1% |
| Central American | 585 | 1.8% |
| Cherokee | 87 | 0.3% |
| Chippewa | 14 | 0.0% |
| Costa Rican | 82 | 0.3% |
| Cuban | 59 | 0.2% |
| Czech | 321 | 1.0% |
| Czechoslovakian | 56 | 0.2% |
| Danish | 56 | 0.2% |
| Dominican | 49 | 0.2% |
| Dutch | 289 | 0.9% |
| Eastern European | 308 | 1.0% |
| Ecuadorian | 29 | 0.1% |
| Egyptian | 28 | 0.1% |
| English | 4,134 | 13.1% |
| Ethiopian | 20 | 0.1% |
| European | 810 | 2.6% |
| Finnish | 68 | 0.2% |
| French | 493 | 1.6% |
| French Canadian | 41 | 0.1% |
| German | 3,085 | 9.7% |
| Greek | 143 | 0.4% |
| Guamanian / Chamorro | 9 | 0.0% |
| Guatemalan | 106 | 0.3% |
| Honduran | 229 | 0.7% |
| Indian (Asian) | 179 | 0.6% |
| Iranian | 24 | 0.1% |
| Irish | 2,742 | 8.6% |
| Iroquois | 26 | 0.1% |
| Italian | 1,570 | 5.0% |
| Japanese | 29 | 0.1% |
| Jordanian | 191 | 0.6% |
| Korean | 195 | 0.6% |
| Lebanese | 43 | 0.1% |
| Lithuanian | 22 | 0.1% |
| Mexican | 1,939 | 6.1% |
| Nigerian | 23 | 0.1% |
| Northern European | 149 | 0.5% |
| Norwegian | 444 | 1.4% |
| Panamanian | 89 | 0.3% |
| Peruvian | 30 | 0.1% |
| Polish | 373 | 1.2% |
| Portuguese | 62 | 0.2% |
| Puerto Rican | 663 | 2.1% |
| Russian | 40 | 0.1% |
| Salvadoran | 79 | 0.3% |
| Scotch-Irish | 673 | 2.1% |
| Scottish | 919 | 2.9% |
| Sioux | 173 | 0.5% |
| Slovak | 114 | 0.4% |
| South American | 186 | 0.6% |
| Spaniard | 1 | 0.0% |
| Subsaharan African | 287 | 0.9% |
| Swedish | 184 | 0.6% |
| Swiss | 264 | 0.8% |
| Thai | 228 | 0.7% |
| Venezuelan | 127 | 0.4% |
| Vietnamese | 148 | 0.5% |
| Welsh | 272 | 0.9% |
| Yup'ik | 34 | 0.1% | View All 69 Rows |
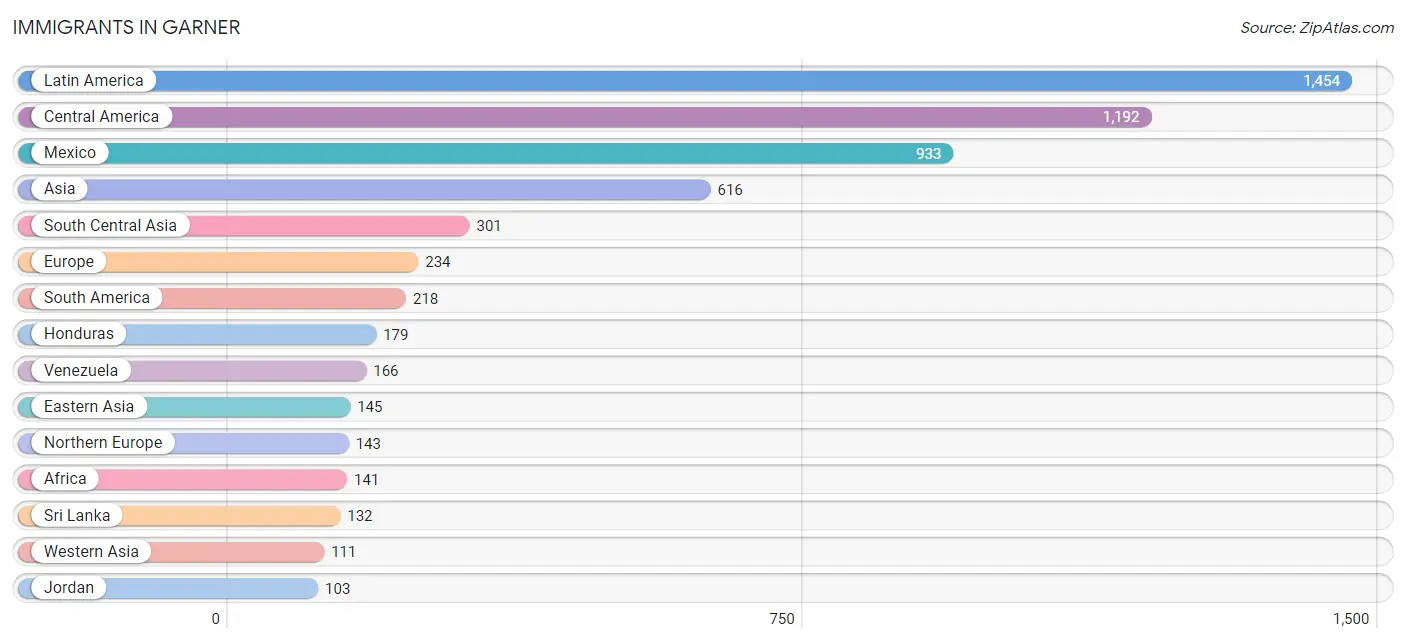
Immigrants in Garner
The most numerous immigrant groups reported in Garner came from Latin America (1,454 | 4.6%), Central America (1,192 | 3.8%), Mexico (933 | 2.9%), Asia (616 | 1.9%), and South Central Asia (301 | 0.9%), together accounting for 14.2% of all Garner residents.
| Immigration Origin | # Population | % Population |
| Africa | 141 | 0.4% |
| Asia | 616 | 1.9% |
| Bangladesh | 92 | 0.3% |
| Cambodia | 29 | 0.1% |
| Canada | 39 | 0.1% |
| Caribbean | 44 | 0.1% |
| Central America | 1,192 | 3.8% |
| China | 58 | 0.2% |
| Congo | 66 | 0.2% |
| Dominican Republic | 34 | 0.1% |
| Eastern Africa | 20 | 0.1% |
| Eastern Asia | 145 | 0.5% |
| Ecuador | 29 | 0.1% |
| Egypt | 28 | 0.1% |
| El Salvador | 24 | 0.1% |
| England | 48 | 0.2% |
| Ethiopia | 20 | 0.1% |
| Europe | 234 | 0.7% |
| Germany | 5 | 0.0% |
| Ghana | 16 | 0.1% |
| Greece | 69 | 0.2% |
| Guatemala | 40 | 0.1% |
| Guyana | 17 | 0.1% |
| Honduras | 179 | 0.6% |
| India | 36 | 0.1% |
| Jamaica | 10 | 0.0% |
| Japan | 4 | 0.0% |
| Jordan | 103 | 0.3% |
| Korea | 83 | 0.3% |
| Latin America | 1,454 | 4.6% |
| Lebanon | 8 | 0.0% |
| Malaysia | 12 | 0.0% |
| Mexico | 933 | 2.9% |
| Middle Africa | 66 | 0.2% |
| Morocco | 11 | 0.0% |
| Nepal | 34 | 0.1% |
| Northern Africa | 39 | 0.1% |
| Northern Europe | 143 | 0.4% |
| Pakistan | 7 | 0.0% |
| Panama | 16 | 0.1% |
| Peru | 6 | 0.0% |
| Philippines | 18 | 0.1% |
| Portugal | 17 | 0.1% |
| Scotland | 48 | 0.2% |
| South America | 218 | 0.7% |
| South Central Asia | 301 | 0.9% |
| South Eastern Asia | 59 | 0.2% |
| Southern Europe | 86 | 0.3% |
| Sri Lanka | 132 | 0.4% |
| Venezuela | 166 | 0.5% |
| Western Africa | 16 | 0.1% |
| Western Asia | 111 | 0.4% |
| Western Europe | 5 | 0.0% | View All 53 Rows |
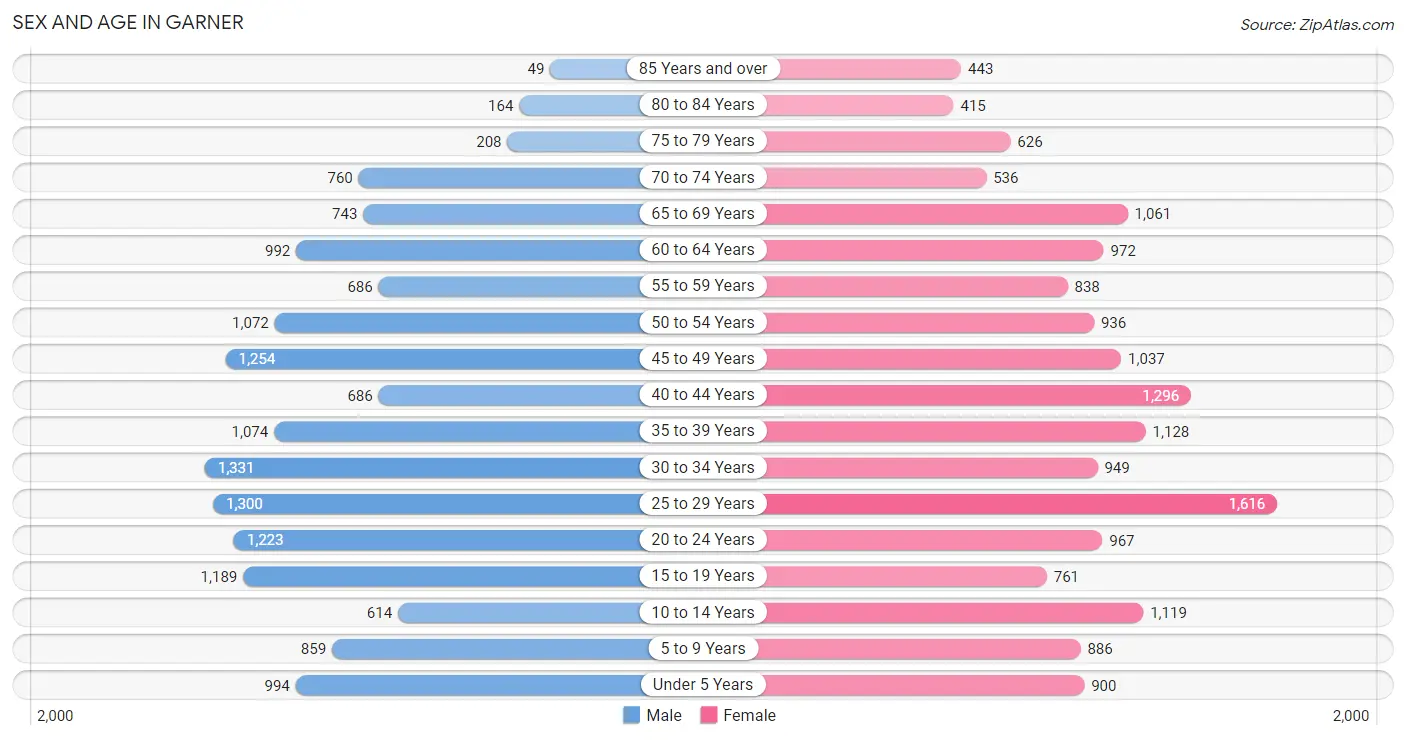
Sex and Age in Garner
Sex and Age in Garner
The most populous age groups in Garner are 30 to 34 Years (1,331 | 8.8%) for men and 25 to 29 Years (1,616 | 9.8%) for women.
| Age Bracket | Male | Female |
| Under 5 Years | 994 (6.5%) | 900 (5.5%) |
| 5 to 9 Years | 859 (5.7%) | 886 (5.4%) |
| 10 to 14 Years | 614 (4.0%) | 1,119 (6.8%) |
| 15 to 19 Years | 1,189 (7.8%) | 761 (4.6%) |
| 20 to 24 Years | 1,223 (8.1%) | 967 (5.9%) |
| 25 to 29 Years | 1,300 (8.6%) | 1,616 (9.8%) |
| 30 to 34 Years | 1,331 (8.8%) | 949 (5.8%) |
| 35 to 39 Years | 1,074 (7.1%) | 1,128 (6.8%) |
| 40 to 44 Years | 686 (4.5%) | 1,296 (7.9%) |
| 45 to 49 Years | 1,254 (8.3%) | 1,037 (6.3%) |
| 50 to 54 Years | 1,072 (7.0%) | 936 (5.7%) |
| 55 to 59 Years | 686 (4.5%) | 838 (5.1%) |
| 60 to 64 Years | 992 (6.5%) | 972 (5.9%) |
| 65 to 69 Years | 743 (4.9%) | 1,061 (6.4%) |
| 70 to 74 Years | 760 (5.0%) | 536 (3.3%) |
| 75 to 79 Years | 208 (1.4%) | 626 (3.8%) |
| 80 to 84 Years | 164 (1.1%) | 415 (2.5%) |
| 85 Years and over | 49 (0.3%) | 443 (2.7%) |
| Total | 15,198 (100.0%) | 16,486 (100.0%) |
Families and Households in Garner
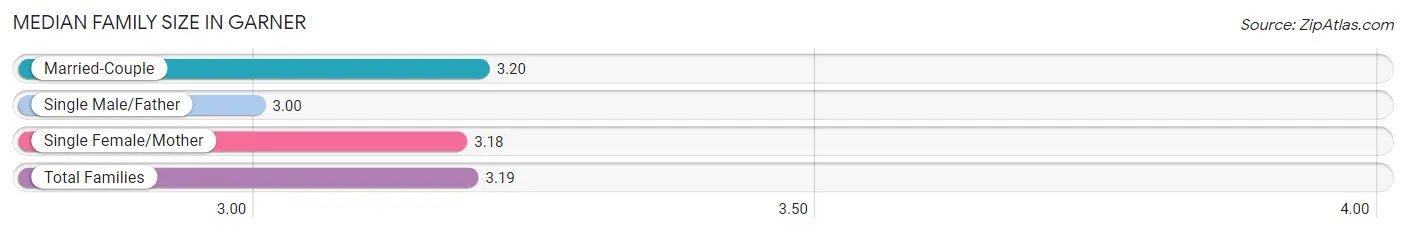
Median Family Size in Garner
The median family size in Garner is 3.19 persons per family, with married-couple families (5,946 | 76.6%) accounting for the largest median family size of 3.2 persons per family. On the other hand, single male/father families (346 | 4.5%) represent the smallest median family size with 3.00 persons per family.
| Family Type | # Families | Family Size |
| Married-Couple | 5,946 (76.6%) | 3.20 |
| Single Male/Father | 346 (4.5%) | 3.00 |
| Single Female/Mother | 1,468 (18.9%) | 3.18 |
| Total Families | 7,760 (100.0%) | 3.19 |
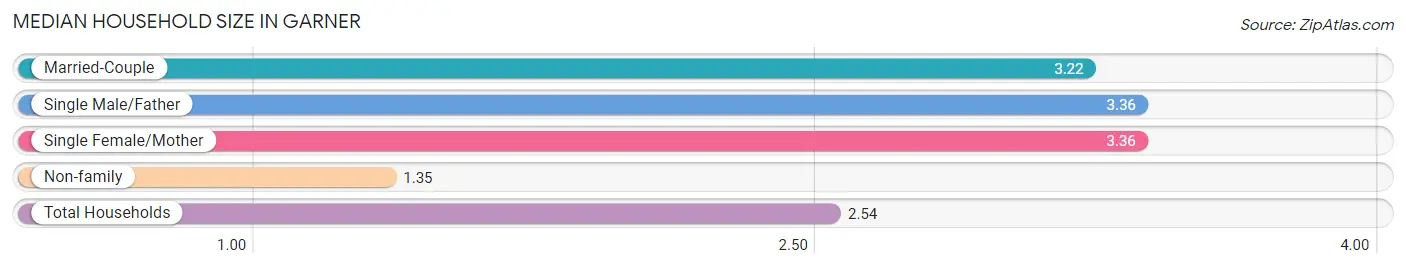
Median Household Size in Garner
The median household size in Garner is 2.54 persons per household, with single male/father households (346 | 2.8%) accounting for the largest median household size of 3.36 persons per household. non-family households (4,600 | 37.2%) represent the smallest median household size with 1.35 persons per household.
| Household Type | # Households | Household Size |
| Married-Couple | 5,946 (48.1%) | 3.22 |
| Single Male/Father | 346 (2.8%) | 3.36 |
| Single Female/Mother | 1,468 (11.9%) | 3.36 |
| Non-family | 4,600 (37.2%) | 1.35 |
| Total Households | 12,360 (100.0%) | 2.54 |
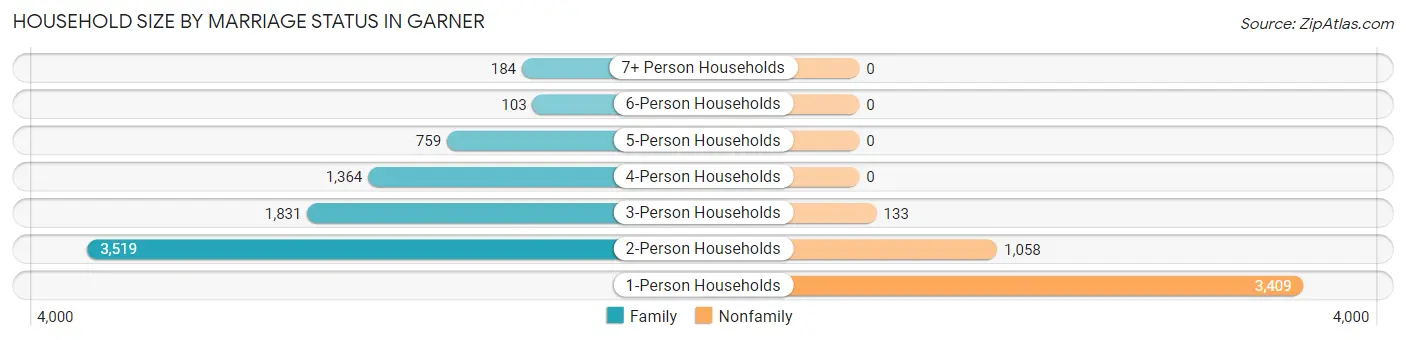
Household Size by Marriage Status in Garner
Out of a total of 12,360 households in Garner, 7,760 (62.8%) are family households, while 4,600 (37.2%) are nonfamily households. The most numerous type of family households are 2-person households, comprising 3,519, and the most common type of nonfamily households are 1-person households, comprising 3,409.
| Household Size | Family Households | Nonfamily Households |
| 1-Person Households | - | 3,409 (27.6%) |
| 2-Person Households | 3,519 (28.5%) | 1,058 (8.6%) |
| 3-Person Households | 1,831 (14.8%) | 133 (1.1%) |
| 4-Person Households | 1,364 (11.0%) | 0 (0.0%) |
| 5-Person Households | 759 (6.1%) | 0 (0.0%) |
| 6-Person Households | 103 (0.8%) | 0 (0.0%) |
| 7+ Person Households | 184 (1.5%) | 0 (0.0%) |
| Total | 7,760 (62.8%) | 4,600 (37.2%) |
Female Fertility in Garner
Fertility by Age in Garner
Average fertility rate in Garner is 41.0 births per 1,000 women. Women in the age bracket of 20 to 34 years have the highest fertility rate with 51.0 births per 1,000 women. Women in the age bracket of 20 to 34 years acount for 54.9% of all women with births.
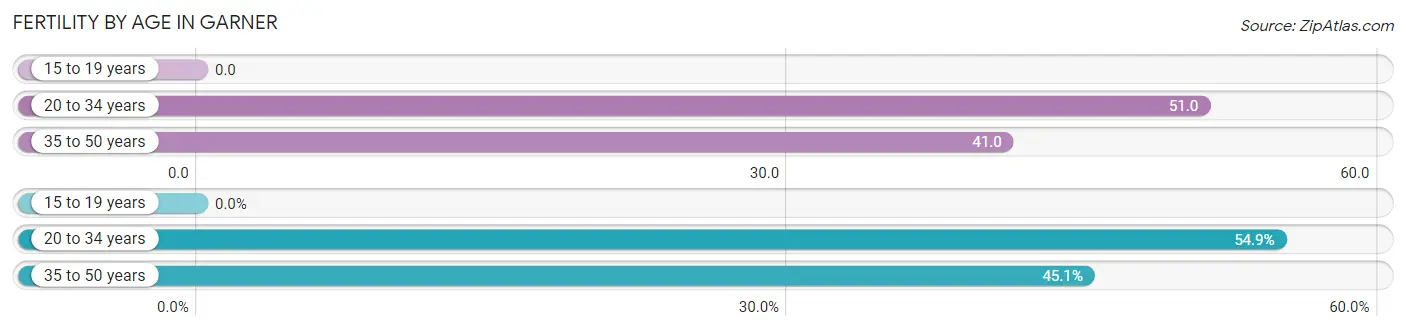
| Age Bracket | Women with Births | Births / 1,000 Women |
| 15 to 19 years | 0 (0.0%) | 0.0 |
| 20 to 34 years | 180 (54.9%) | 51.0 |
| 35 to 50 years | 148 (45.1%) | 41.0 |
| Total | 328 (100.0%) | 41.0 |
Fertility by Age by Marriage Status in Garner
59.5% of women with births (328) in Garner are married. The highest percentage of unmarried women with births falls into 20 to 34 years age bracket with 73.3% of them unmarried at the time of birth, while the lowest percentage of unmarried women with births belong to 35 to 50 years age bracket with 0.7% of them unmarried.
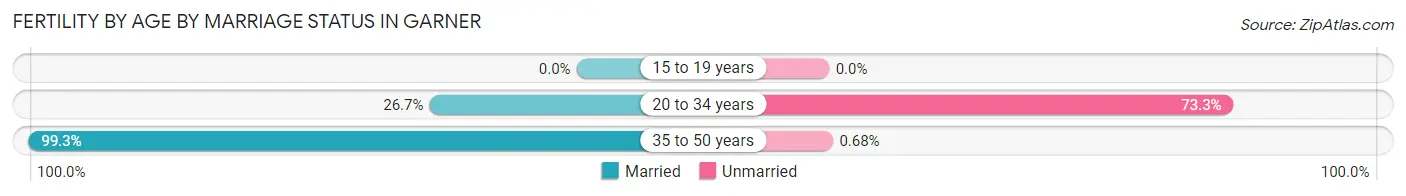
| Age Bracket | Married | Unmarried |
| 15 to 19 years | 0 (0.0%) | 0 (0.0%) |
| 20 to 34 years | 48 (26.7%) | 132 (73.3%) |
| 35 to 50 years | 147 (99.3%) | 1 (0.7%) |
| Total | 195 (59.5%) | 133 (40.6%) |
Fertility by Education in Garner
Average fertility rate in Garner is 41.0 births per 1,000 women. Women with the education attainment of graduate degree have the highest fertility rate of 93.0 births per 1,000 women, while women with the education attainment of college or associate's degree have the lowest fertility at 5.0 births per 1,000 women. Women with the education attainment of bachelor's degree represent 43.6% of all women with births.
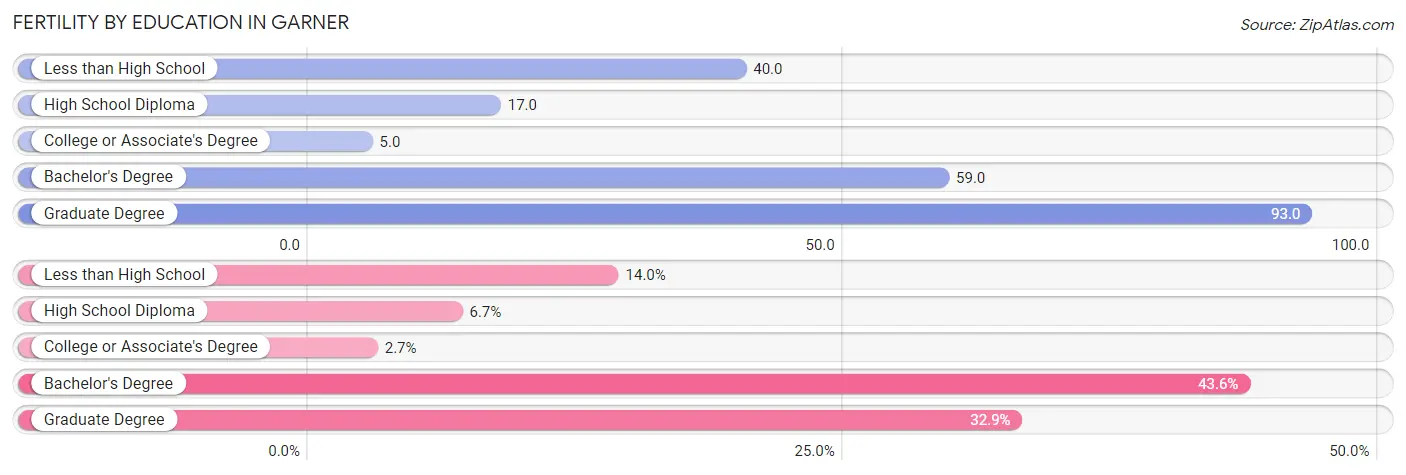
| Educational Attainment | Women with Births | Births / 1,000 Women |
| Less than High School | 46 (14.0%) | 40.0 |
| High School Diploma | 22 (6.7%) | 17.0 |
| College or Associate's Degree | 9 (2.7%) | 5.0 |
| Bachelor's Degree | 143 (43.6%) | 59.0 |
| Graduate Degree | 108 (32.9%) | 93.0 |
| Total | 328 (100.0%) | 41.0 |
Fertility by Education by Marriage Status in Garner
40.6% of women with births in Garner are unmarried. Women with the educational attainment of college or associate's degree are most likely to be married with 100.0% of them married at childbirth, while women with the educational attainment of less than high school are least likely to be married with 100.0% of them unmarried at childbirth.
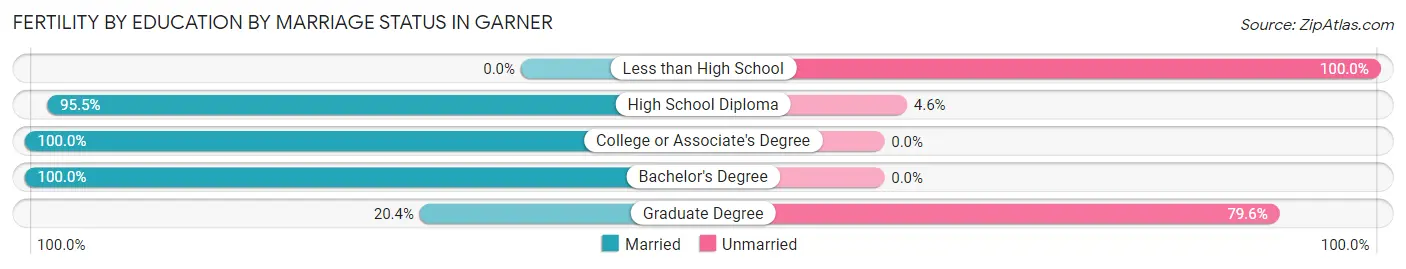
| Educational Attainment | Married | Unmarried |
| Less than High School | 0 (0.0%) | 46 (100.0%) |
| High School Diploma | 21 (95.5%) | 1 (4.5%) |
| College or Associate's Degree | 9 (100.0%) | 0 (0.0%) |
| Bachelor's Degree | 143 (100.0%) | 0 (0.0%) |
| Graduate Degree | 22 (20.4%) | 86 (79.6%) |
| Total | 195 (59.5%) | 133 (40.6%) |
Income in Garner
Income Overview in Garner
Per Capita Income in Garner is $42,165, while median incomes of families and households are $99,450 and $77,171 respectively.
| Characteristic | Number | Measure |
| Per Capita Income | 31,684 | $42,165 |
| Median Family Income | 7,760 | $99,450 |
| Mean Family Income | 7,760 | $118,759 |
| Median Household Income | 12,360 | $77,171 |
| Mean Household Income | 12,360 | $101,921 |
| Income Deficit | 7,760 | $9,463 |
| Wage / Income Gap (%) | 31,684 | 24.76% |
| Wage / Income Gap ($) | 31,684 | 75.24¢ per $1 |
| Gini / Inequality Index | 31,684 | 0.40 |
Earnings by Sex in Garner
Average Earnings in Garner are $49,273, $56,244 for men and $42,317 for women, a difference of 24.8%.
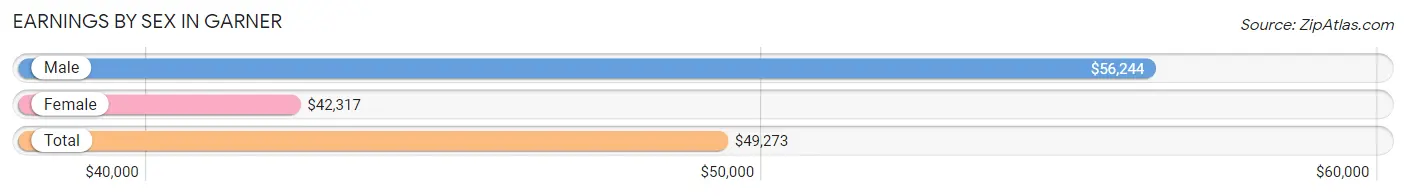
| Sex | Number | Average Earnings |
| Male | 9,609 (52.3%) | $56,244 |
| Female | 8,779 (47.7%) | $42,317 |
| Total | 18,388 (100.0%) | $49,273 |
Earnings by Sex by Income Bracket in Garner
The most common earnings brackets in Garner are $100,000+ for men (2,159 | 22.5%) and $55,000 to $64,999 for women (1,122 | 12.8%).
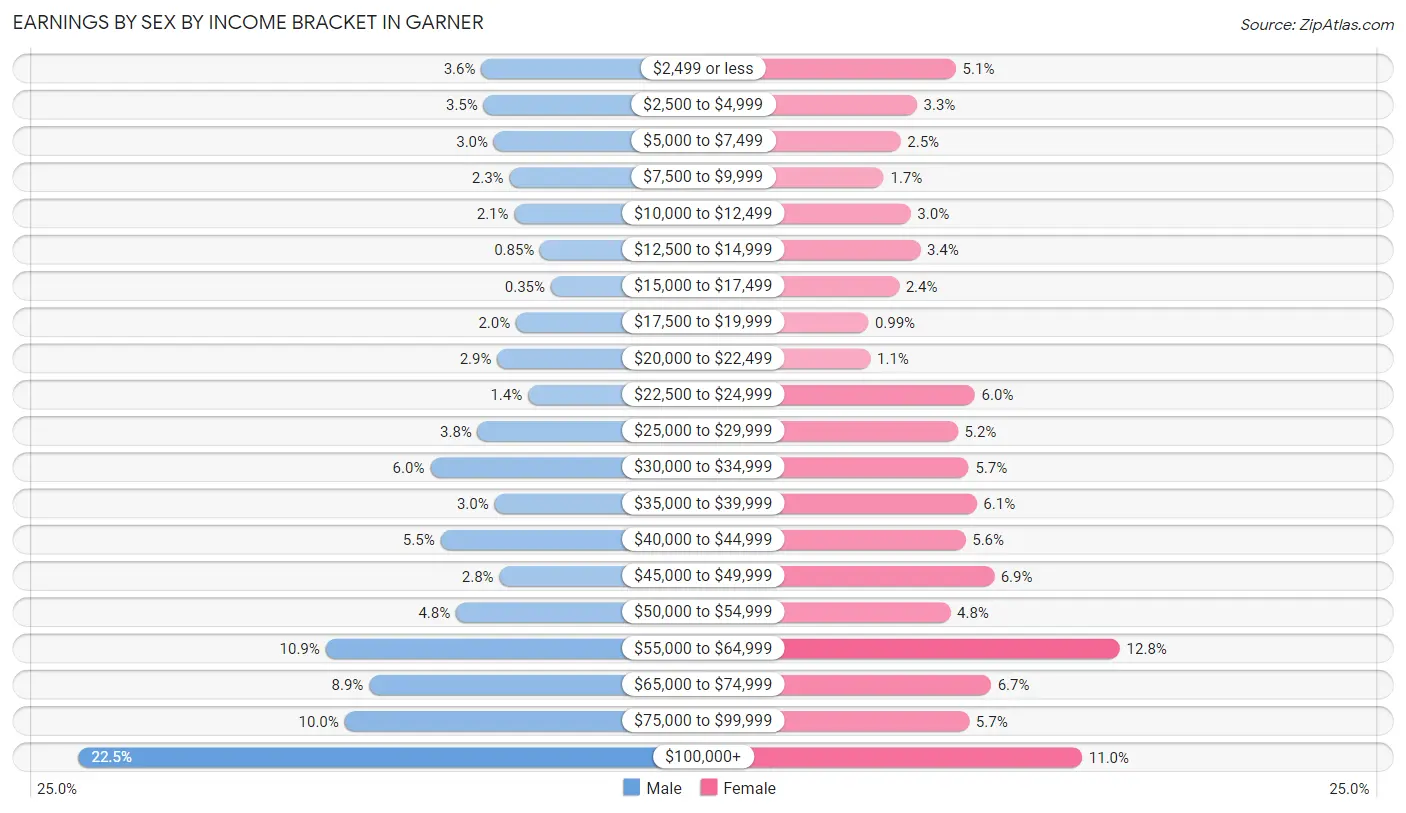
| Income | Male | Female |
| $2,499 or less | 347 (3.6%) | 448 (5.1%) |
| $2,500 to $4,999 | 336 (3.5%) | 287 (3.3%) |
| $5,000 to $7,499 | 290 (3.0%) | 220 (2.5%) |
| $7,500 to $9,999 | 220 (2.3%) | 151 (1.7%) |
| $10,000 to $12,499 | 198 (2.1%) | 262 (3.0%) |
| $12,500 to $14,999 | 82 (0.9%) | 301 (3.4%) |
| $15,000 to $17,499 | 34 (0.4%) | 213 (2.4%) |
| $17,500 to $19,999 | 190 (2.0%) | 87 (1.0%) |
| $20,000 to $22,499 | 275 (2.9%) | 96 (1.1%) |
| $22,500 to $24,999 | 136 (1.4%) | 526 (6.0%) |
| $25,000 to $29,999 | 363 (3.8%) | 456 (5.2%) |
| $30,000 to $34,999 | 577 (6.0%) | 500 (5.7%) |
| $35,000 to $39,999 | 287 (3.0%) | 533 (6.1%) |
| $40,000 to $44,999 | 530 (5.5%) | 487 (5.6%) |
| $45,000 to $49,999 | 265 (2.8%) | 604 (6.9%) |
| $50,000 to $54,999 | 460 (4.8%) | 425 (4.8%) |
| $55,000 to $64,999 | 1,047 (10.9%) | 1,122 (12.8%) |
| $65,000 to $74,999 | 851 (8.9%) | 592 (6.7%) |
| $75,000 to $99,999 | 962 (10.0%) | 502 (5.7%) |
| $100,000+ | 2,159 (22.5%) | 967 (11.0%) |
| Total | 9,609 (100.0%) | 8,779 (100.0%) |
Earnings by Sex by Educational Attainment in Garner
Average earnings in Garner are $63,957 for men and $46,947 for women, a difference of 26.6%. Men with an educational attainment of graduate degree enjoy the highest average annual earnings of $113,161, while those with less than high school education earn the least with $24,844. Women with an educational attainment of bachelor's degree earn the most with the average annual earnings of $64,426, while those with high school diploma education have the smallest earnings of $24,864.
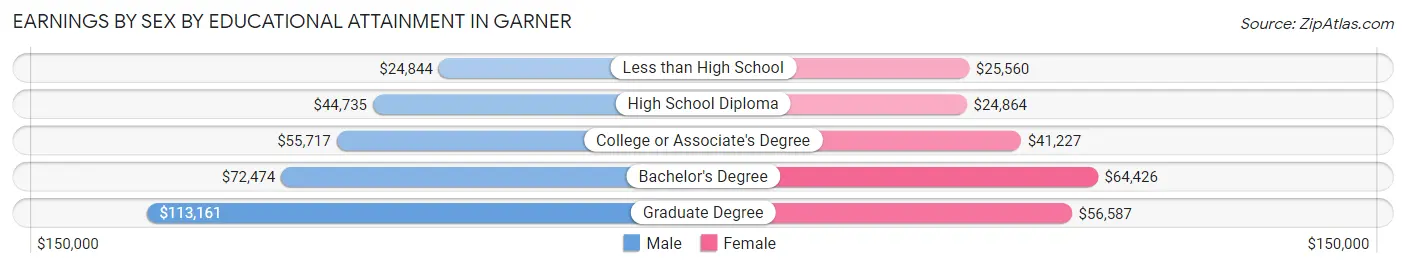
| Educational Attainment | Male Income | Female Income |
| Less than High School | $24,844 | $25,560 |
| High School Diploma | $44,735 | $24,864 |
| College or Associate's Degree | $55,717 | $41,227 |
| Bachelor's Degree | $72,474 | $64,426 |
| Graduate Degree | $113,161 | $56,587 |
| Total | $63,957 | $46,947 |
Family Income in Garner
Family Income Brackets in Garner
According to the Garner family income data, there are 1,730 families falling into the $100,000 to $149,999 income range, which is the most common income bracket and makes up 22.3% of all families. Conversely, the less than $10,000 income bracket is the least frequent group with only 39 families (0.5%) belonging to this category.
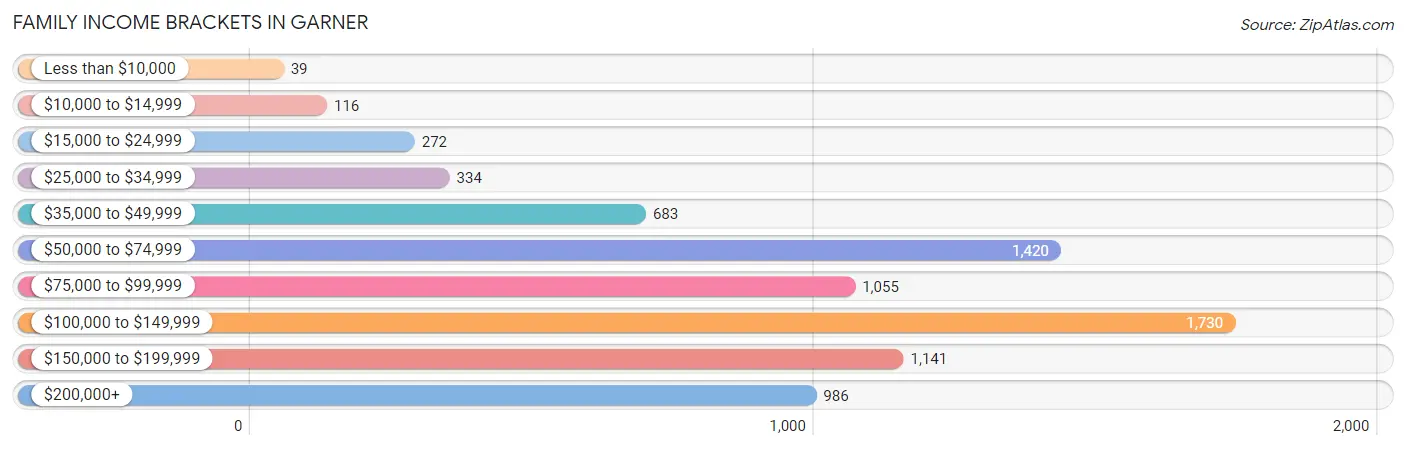
| Income Bracket | # Families | % Families |
| Less than $10,000 | 39 | 0.5% |
| $10,000 to $14,999 | 116 | 1.5% |
| $15,000 to $24,999 | 272 | 3.5% |
| $25,000 to $34,999 | 334 | 4.3% |
| $35,000 to $49,999 | 683 | 8.8% |
| $50,000 to $74,999 | 1,420 | 18.3% |
| $75,000 to $99,999 | 1,055 | 13.6% |
| $100,000 to $149,999 | 1,730 | 22.3% |
| $150,000 to $199,999 | 1,141 | 14.7% |
| $200,000+ | 986 | 12.7% |
Family Income by Famaliy Size in Garner
7+ person families (184 | 2.4%) account for the highest median family income in Garner with $227,705 per family, while 2-person families (3,732 | 48.1%) have the highest median income of $43,794 per family member.
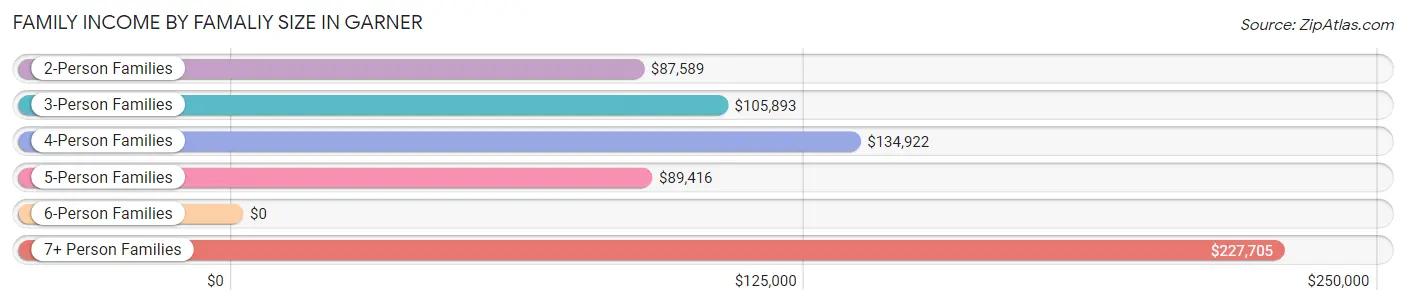
| Income Bracket | # Families | Median Income |
| 2-Person Families | 3,732 (48.1%) | $87,589 |
| 3-Person Families | 1,710 (22.0%) | $105,893 |
| 4-Person Families | 1,289 (16.6%) | $134,922 |
| 5-Person Families | 742 (9.6%) | $89,416 |
| 6-Person Families | 103 (1.3%) | $0 |
| 7+ Person Families | 184 (2.4%) | $227,705 |
| Total | 7,760 (100.0%) | $99,450 |
Family Income by Number of Earners in Garner
The median family income in Garner is $99,450, with families comprising 3+ earners (857) having the highest median family income of $168,993, while families with 1 earner (2,818) have the lowest median family income of $58,269, accounting for 11.0% and 36.3% of families, respectively.
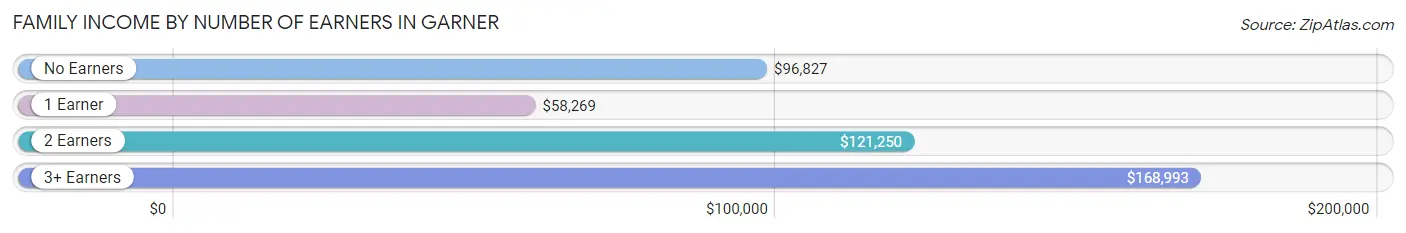
| Number of Earners | # Families | Median Income |
| No Earners | 641 (8.3%) | $96,827 |
| 1 Earner | 2,818 (36.3%) | $58,269 |
| 2 Earners | 3,444 (44.4%) | $121,250 |
| 3+ Earners | 857 (11.0%) | $168,993 |
| Total | 7,760 (100.0%) | $99,450 |
Household Income in Garner
Household Income Brackets in Garner
With 2,707 households falling in the category, the $50,000 to $74,999 income range is the most frequent in Garner, accounting for 21.9% of all households. In contrast, only 210 households (1.7%) fall into the less than $10,000 income bracket, making it the least populous group.
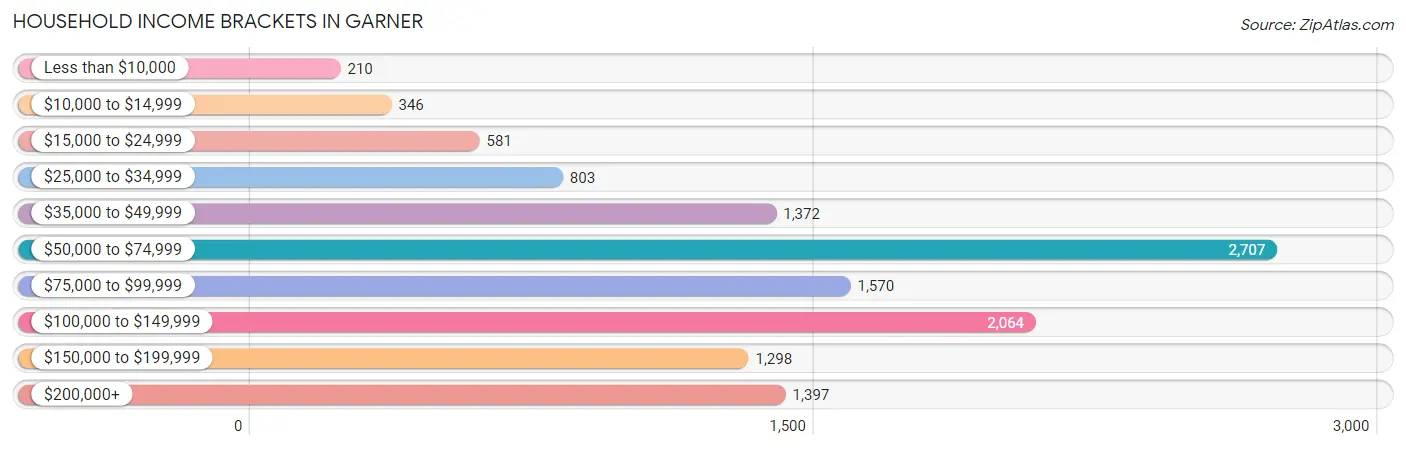
| Income Bracket | # Households | % Households |
| Less than $10,000 | 210 | 1.7% |
| $10,000 to $14,999 | 346 | 2.8% |
| $15,000 to $24,999 | 581 | 4.7% |
| $25,000 to $34,999 | 803 | 6.5% |
| $35,000 to $49,999 | 1,372 | 11.1% |
| $50,000 to $74,999 | 2,707 | 21.9% |
| $75,000 to $99,999 | 1,570 | 12.7% |
| $100,000 to $149,999 | 2,064 | 16.7% |
| $150,000 to $199,999 | 1,298 | 10.5% |
| $200,000+ | 1,397 | 11.3% |
Household Income by Householder Age in Garner
The median household income in Garner is $77,171, with the highest median household income of $88,038 found in the 25 to 44 years age bracket for the primary householder. A total of 4,610 households (37.3%) fall into this category. Meanwhile, the 65+ years age bracket for the primary householder has the lowest median household income of $63,478, with 3,119 households (25.2%) in this group.
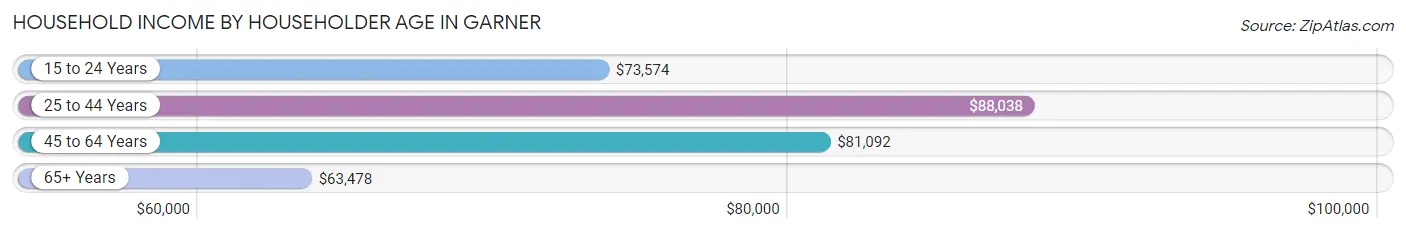
| Income Bracket | # Households | Median Income |
| 15 to 24 Years | 445 (3.6%) | $73,574 |
| 25 to 44 Years | 4,610 (37.3%) | $88,038 |
| 45 to 64 Years | 4,186 (33.9%) | $81,092 |
| 65+ Years | 3,119 (25.2%) | $63,478 |
| Total | 12,360 (100.0%) | $77,171 |
Poverty in Garner
Income Below Poverty by Sex and Age in Garner
With 4.8% poverty level for males and 6.0% for females among the residents of Garner, 16 and 17 year old males and 18 to 24 year old females are the most vulnerable to poverty, with 145 males (34.8%) and 217 females (18.3%) in their respective age groups living below the poverty level.
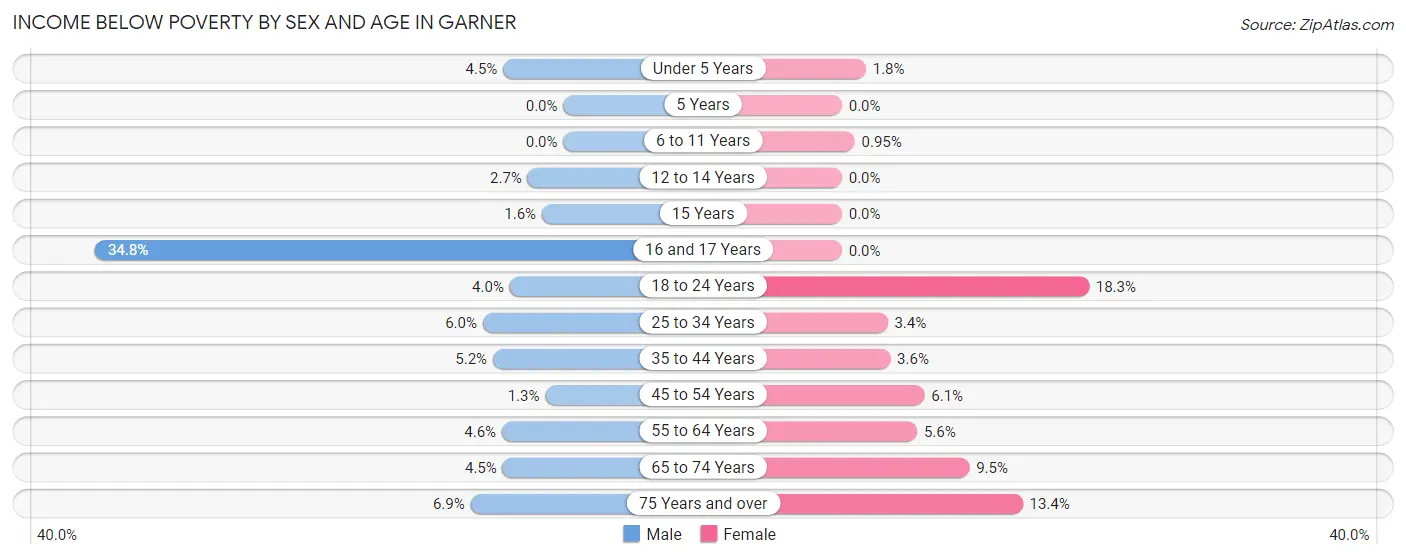
| Age Bracket | Male | Female |
| Under 5 Years | 43 (4.5%) | 16 (1.8%) |
| 5 Years | 0 (0.0%) | 0 (0.0%) |
| 6 to 11 Years | 0 (0.0%) | 11 (0.9%) |
| 12 to 14 Years | 12 (2.6%) | 0 (0.0%) |
| 15 Years | 4 (1.6%) | 0 (0.0%) |
| 16 and 17 Years | 145 (34.8%) | 0 (0.0%) |
| 18 to 24 Years | 69 (4.0%) | 217 (18.3%) |
| 25 to 34 Years | 157 (6.0%) | 87 (3.4%) |
| 35 to 44 Years | 92 (5.2%) | 87 (3.6%) |
| 45 to 54 Years | 31 (1.3%) | 121 (6.1%) |
| 55 to 64 Years | 76 (4.6%) | 101 (5.6%) |
| 65 to 74 Years | 67 (4.5%) | 150 (9.5%) |
| 75 Years and over | 27 (6.9%) | 187 (13.4%) |
| Total | 723 (4.8%) | 977 (6.0%) |
Income Above Poverty by Sex and Age in Garner
According to the poverty statistics in Garner, males aged 5 years and females aged 5 years are the age groups that are most secure financially, with 100.0% of males and 100.0% of females in these age groups living above the poverty line.
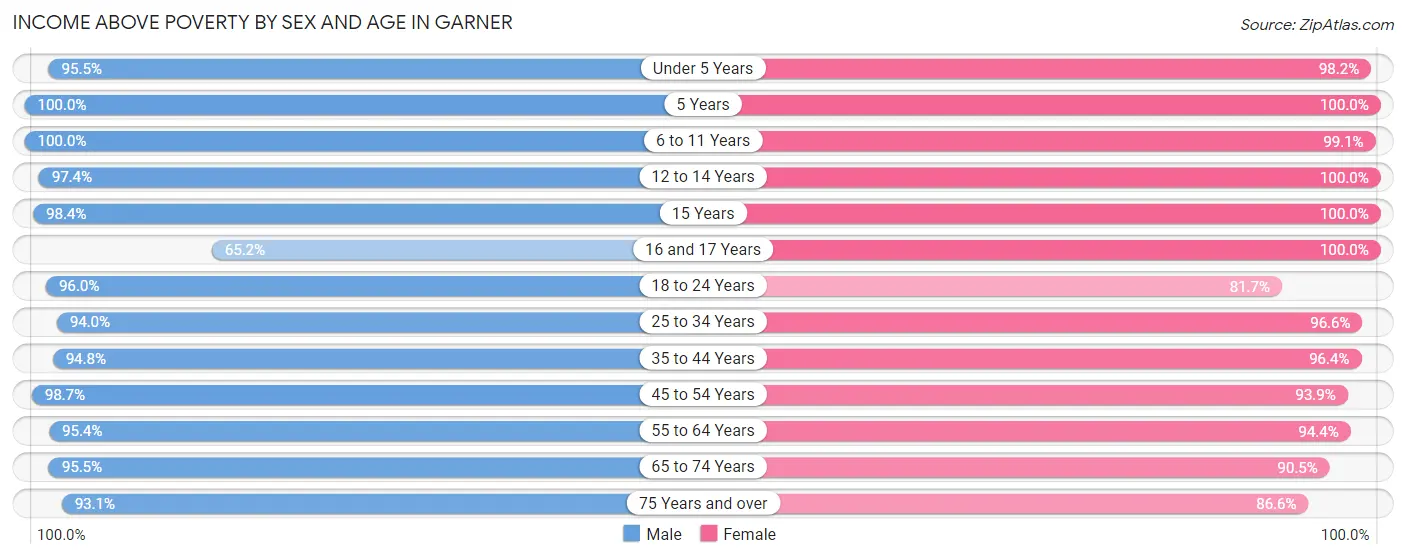
| Age Bracket | Male | Female |
| Under 5 Years | 919 (95.5%) | 884 (98.2%) |
| 5 Years | 71 (100.0%) | 130 (100.0%) |
| 6 to 11 Years | 873 (100.0%) | 1,146 (99.1%) |
| 12 to 14 Years | 441 (97.4%) | 718 (100.0%) |
| 15 Years | 248 (98.4%) | 268 (100.0%) |
| 16 and 17 Years | 272 (65.2%) | 277 (100.0%) |
| 18 to 24 Years | 1,665 (96.0%) | 966 (81.7%) |
| 25 to 34 Years | 2,468 (94.0%) | 2,478 (96.6%) |
| 35 to 44 Years | 1,668 (94.8%) | 2,337 (96.4%) |
| 45 to 54 Years | 2,286 (98.7%) | 1,852 (93.9%) |
| 55 to 64 Years | 1,591 (95.4%) | 1,709 (94.4%) |
| 65 to 74 Years | 1,420 (95.5%) | 1,435 (90.5%) |
| 75 Years and over | 365 (93.1%) | 1,206 (86.6%) |
| Total | 14,287 (95.2%) | 15,406 (94.0%) |
Income Below Poverty Among Married-Couple Families in Garner
The poverty statistics for married-couple families in Garner show that 1.1% or 64 of the total 5,946 families live below the poverty line. Families with 5 or more children have the highest poverty rate of 13.6%, comprising of 11 families. On the other hand, families with 3 or 4 children have the lowest poverty rate of 0.0%, which includes 0 families.
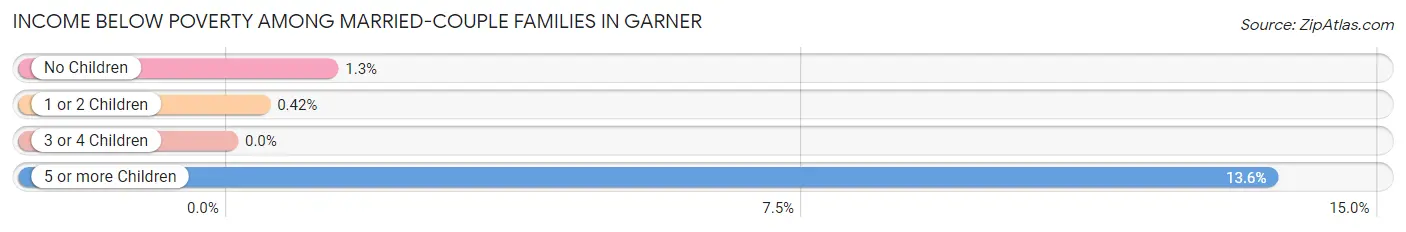
| Children | Above Poverty | Below Poverty |
| No Children | 3,321 (98.7%) | 44 (1.3%) |
| 1 or 2 Children | 2,128 (99.6%) | 9 (0.4%) |
| 3 or 4 Children | 363 (100.0%) | 0 (0.0%) |
| 5 or more Children | 70 (86.4%) | 11 (13.6%) |
| Total | 5,882 (98.9%) | 64 (1.1%) |
Income Below Poverty Among Single-Parent Households in Garner
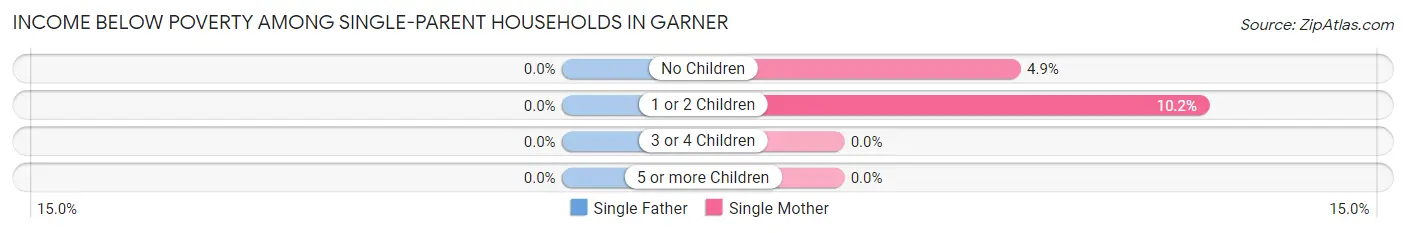
| Children | Single Father | Single Mother |
| No Children | 0 (0.0%) | 33 (4.9%) |
| 1 or 2 Children | 0 (0.0%) | 72 (10.2%) |
| 3 or 4 Children | 0 (0.0%) | 0 (0.0%) |
| 5 or more Children | 0 (0.0%) | 0 (0.0%) |
| Total | 0 (0.0%) | 105 (7.1%) |
Income Below Poverty Among Married-Couple vs Single-Parent Households in Garner
The poverty data for Garner shows that 64 of the married-couple family households (1.1%) and 105 of the single-parent households (5.8%) are living below the poverty level. Within the married-couple family households, those with 5 or more children have the highest poverty rate, with 11 households (13.6%) falling below the poverty line. Among the single-parent households, those with 1 or 2 children have the highest poverty rate, with 72 household (9.0%) living below poverty.
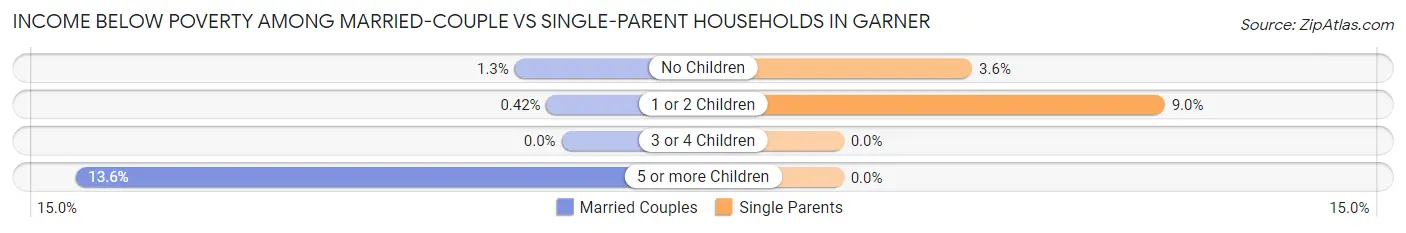
| Children | Married-Couple Families | Single-Parent Households |
| No Children | 44 (1.3%) | 33 (3.6%) |
| 1 or 2 Children | 9 (0.4%) | 72 (9.0%) |
| 3 or 4 Children | 0 (0.0%) | 0 (0.0%) |
| 5 or more Children | 11 (13.6%) | 0 (0.0%) |
| Total | 64 (1.1%) | 105 (5.8%) |
Employment Characteristics in Garner
Employment by Class of Employer in Garner
Among the 16,495 employed individuals in Garner, private company employees (12,154 | 73.7%), state government employees (1,237 | 7.5%), and not-for-profit organizations (1,138 | 6.9%) make up the most common classes of employment.
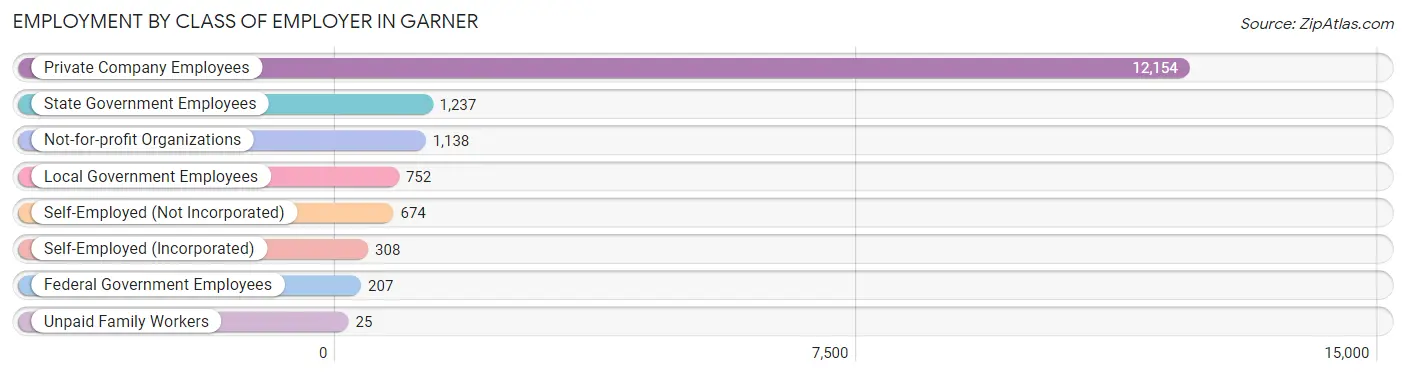
| Employer Class | # Employees | % Employees |
| Private Company Employees | 12,154 | 73.7% |
| Self-Employed (Incorporated) | 308 | 1.9% |
| Self-Employed (Not Incorporated) | 674 | 4.1% |
| Not-for-profit Organizations | 1,138 | 6.9% |
| Local Government Employees | 752 | 4.6% |
| State Government Employees | 1,237 | 7.5% |
| Federal Government Employees | 207 | 1.3% |
| Unpaid Family Workers | 25 | 0.2% |
| Total | 16,495 | 100.0% |
Employment Status by Age in Garner
According to the labor force statistics for Garner, out of the total population over 16 years of age (25,792), 69.2% or 17,848 individuals are in the labor force, with 5.8% or 1,035 of them unemployed. The age group with the highest labor force participation rate is 45 to 54 years, with 92.6% or 3,981 individuals in the labor force. Within the labor force, the 16 to 19 years age range has the highest percentage of unemployed individuals, with 35.9% or 299 of them being unemployed.
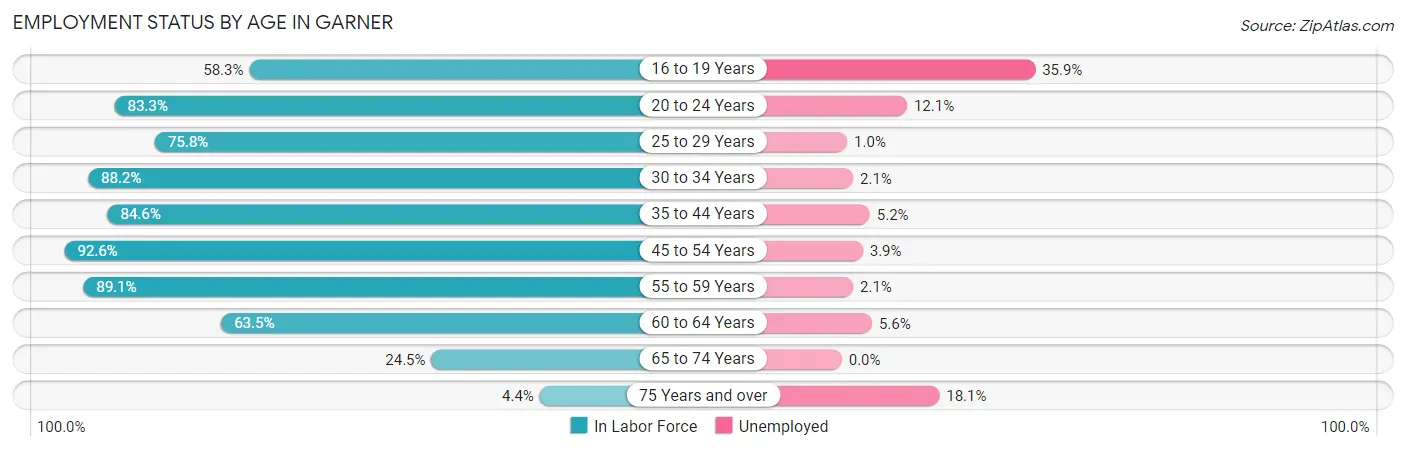
| Age Bracket | In Labor Force | Unemployed |
| 16 to 19 Years | 834 (58.3%) | 299 (35.9%) |
| 20 to 24 Years | 1,824 (83.3%) | 221 (12.1%) |
| 25 to 29 Years | 2,210 (75.8%) | 22 (1.0%) |
| 30 to 34 Years | 2,011 (88.2%) | 42 (2.1%) |
| 35 to 44 Years | 3,540 (84.6%) | 184 (5.2%) |
| 45 to 54 Years | 3,981 (92.6%) | 155 (3.9%) |
| 55 to 59 Years | 1,358 (89.1%) | 29 (2.1%) |
| 60 to 64 Years | 1,247 (63.5%) | 70 (5.6%) |
| 65 to 74 Years | 760 (24.5%) | 0 (0.0%) |
| 75 Years and over | 84 (4.4%) | 15 (18.1%) |
| Total | 17,848 (69.2%) | 1,035 (5.8%) |
Employment Status by Educational Attainment in Garner
According to labor force statistics for Garner, 83.6% of individuals (14,352) out of the total population between 25 and 64 years of age (17,167) are in the labor force, with 3.5% or 502 of them being unemployed. The group with the highest labor force participation rate are those with the educational attainment of college / associate degree, with 87.9% or 4,305 individuals in the labor force. Within the labor force, individuals with less than high school education have the highest percentage of unemployment, with 13.0% or 87 of them being unemployed.
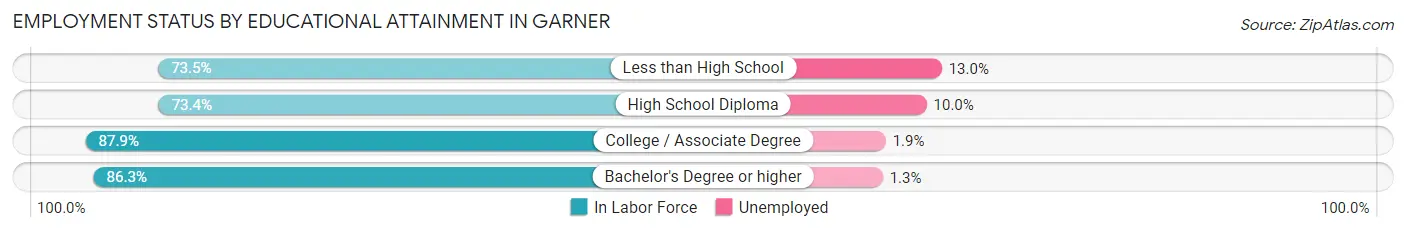
| Educational Attainment | In Labor Force | Unemployed |
| Less than High School | 670 (73.5%) | 119 (13.0%) |
| High School Diploma | 2,424 (73.4%) | 330 (10.0%) |
| College / Associate Degree | 4,305 (87.9%) | 93 (1.9%) |
| Bachelor's Degree or higher | 6,951 (86.3%) | 105 (1.3%) |
| Total | 14,352 (83.6%) | 601 (3.5%) |
Employment Occupations by Sex in Garner
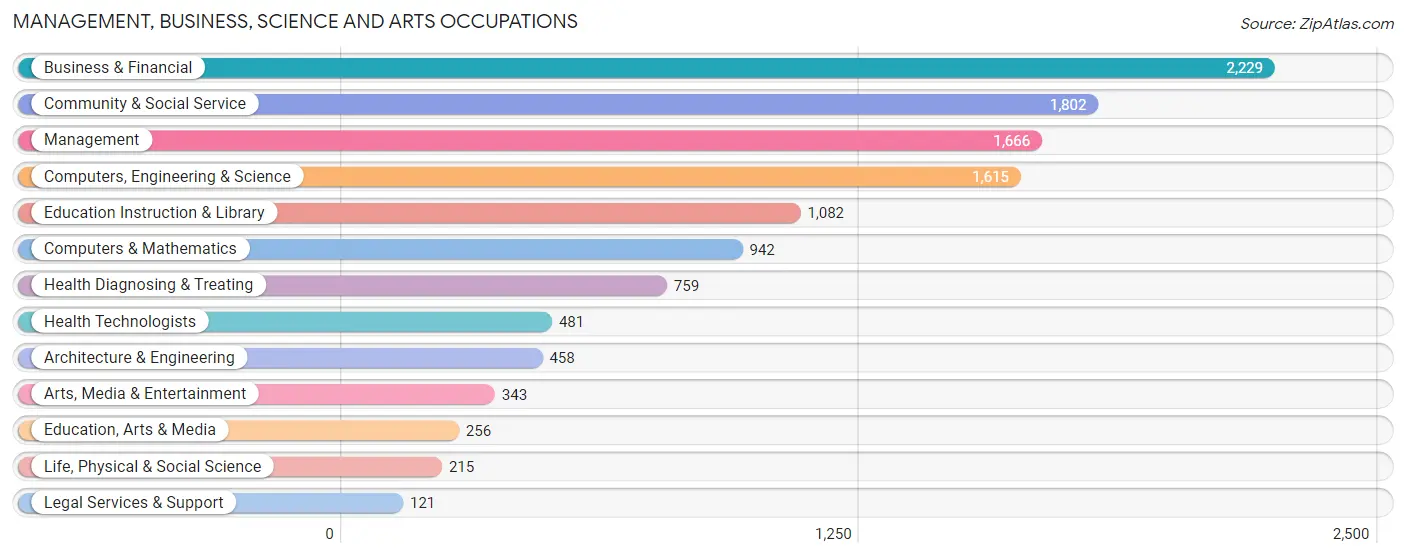
Management, Business, Science and Arts Occupations
The most common Management, Business, Science and Arts occupations in Garner are Business & Financial (2,229 | 13.3%), Community & Social Service (1,802 | 10.7%), Management (1,666 | 9.9%), Computers, Engineering & Science (1,615 | 9.6%), and Education Instruction & Library (1,082 | 6.4%).
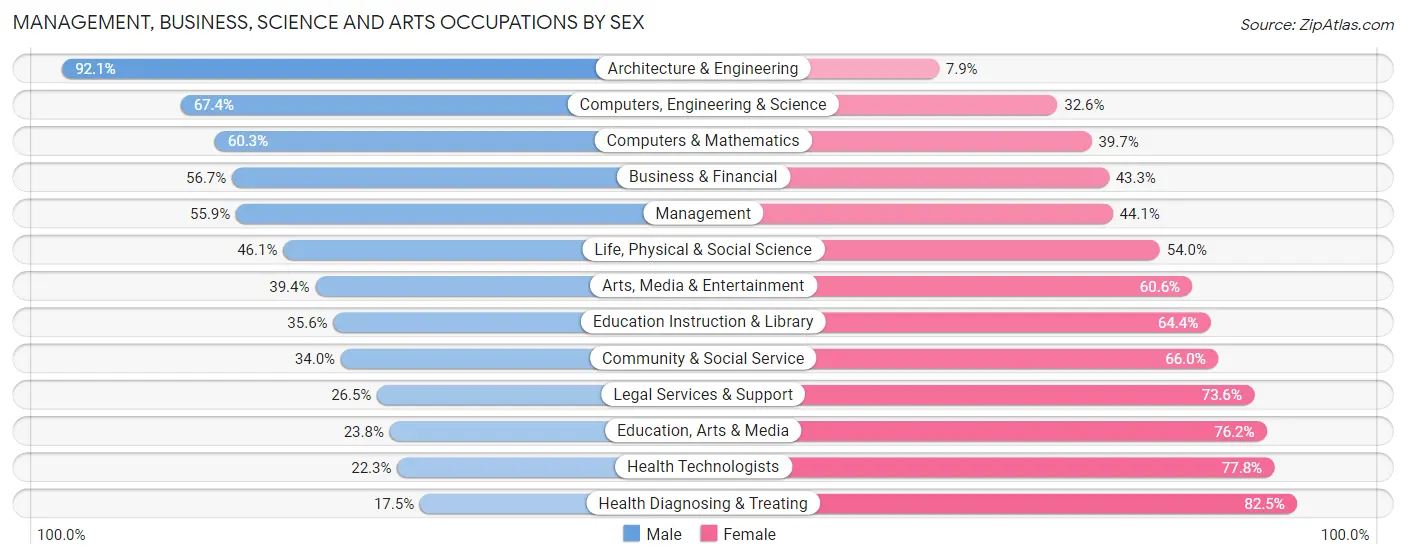
Management, Business, Science and Arts Occupations by Sex
Within the Management, Business, Science and Arts occupations in Garner, the most male-oriented occupations are Architecture & Engineering (92.1%), Computers, Engineering & Science (67.4%), and Computers & Mathematics (60.3%), while the most female-oriented occupations are Health Diagnosing & Treating (82.5%), Health Technologists (77.7%), and Education, Arts & Media (76.2%).
| Occupation | Male | Female |
| Management | 931 (55.9%) | 735 (44.1%) |
| Business & Financial | 1,264 (56.7%) | 965 (43.3%) |
| Computers, Engineering & Science | 1,089 (67.4%) | 526 (32.6%) |
| Computers & Mathematics | 568 (60.3%) | 374 (39.7%) |
| Architecture & Engineering | 422 (92.1%) | 36 (7.9%) |
| Life, Physical & Social Science | 99 (46.1%) | 116 (53.9%) |
| Community & Social Service | 613 (34.0%) | 1,189 (66.0%) |
| Education, Arts & Media | 61 (23.8%) | 195 (76.2%) |
| Legal Services & Support | 32 (26.5%) | 89 (73.6%) |
| Education Instruction & Library | 385 (35.6%) | 697 (64.4%) |
| Arts, Media & Entertainment | 135 (39.4%) | 208 (60.6%) |
| Health Diagnosing & Treating | 133 (17.5%) | 626 (82.5%) |
| Health Technologists | 107 (22.3%) | 374 (77.7%) |
| Total (Category) | 4,030 (49.9%) | 4,041 (50.1%) |
| Total (Overall) | 9,200 (54.8%) | 7,594 (45.2%) |
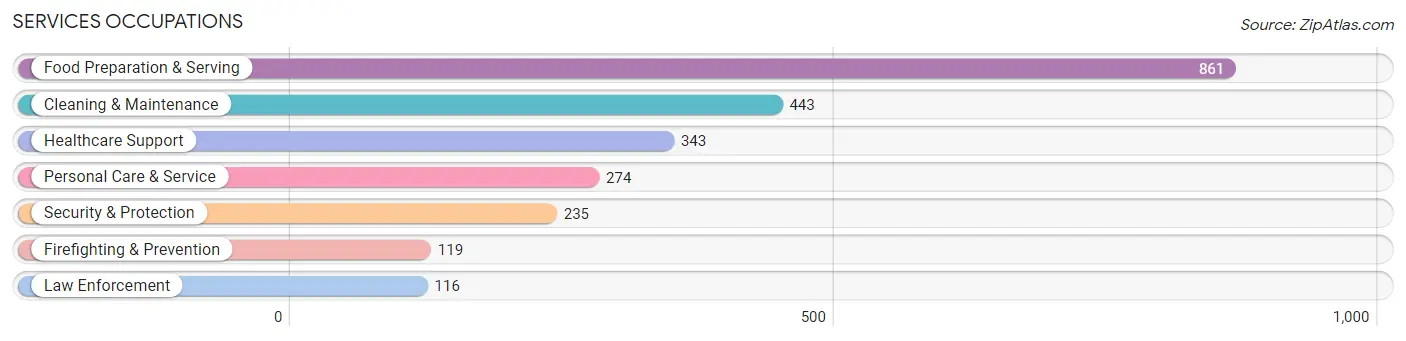
Services Occupations
The most common Services occupations in Garner are Food Preparation & Serving (861 | 5.1%), Cleaning & Maintenance (443 | 2.6%), Healthcare Support (343 | 2.0%), Personal Care & Service (274 | 1.6%), and Security & Protection (235 | 1.4%).
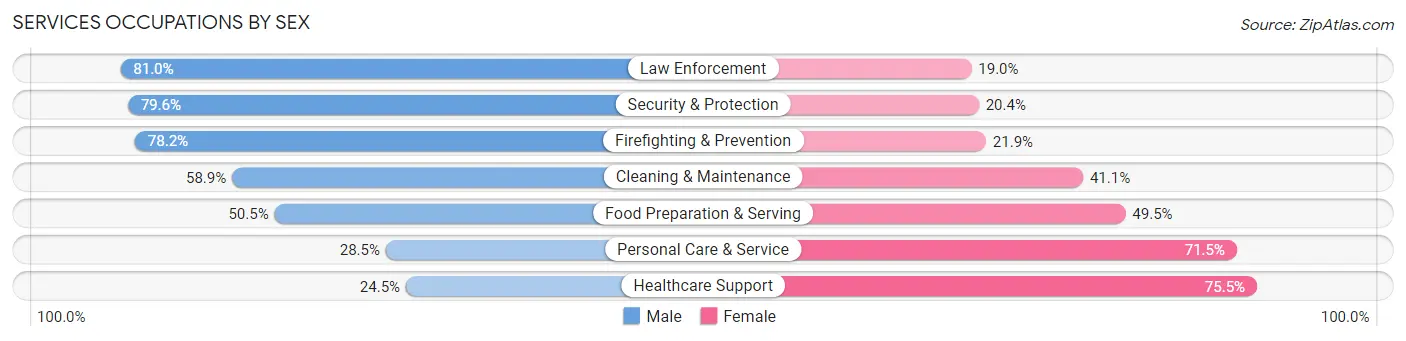
Services Occupations by Sex
Within the Services occupations in Garner, the most male-oriented occupations are Law Enforcement (81.0%), Security & Protection (79.6%), and Firefighting & Prevention (78.1%), while the most female-oriented occupations are Healthcare Support (75.5%), Personal Care & Service (71.5%), and Food Preparation & Serving (49.5%).
| Occupation | Male | Female |
| Healthcare Support | 84 (24.5%) | 259 (75.5%) |
| Security & Protection | 187 (79.6%) | 48 (20.4%) |
| Firefighting & Prevention | 93 (78.1%) | 26 (21.8%) |
| Law Enforcement | 94 (81.0%) | 22 (19.0%) |
| Food Preparation & Serving | 435 (50.5%) | 426 (49.5%) |
| Cleaning & Maintenance | 261 (58.9%) | 182 (41.1%) |
| Personal Care & Service | 78 (28.5%) | 196 (71.5%) |
| Total (Category) | 1,045 (48.5%) | 1,111 (51.5%) |
| Total (Overall) | 9,200 (54.8%) | 7,594 (45.2%) |
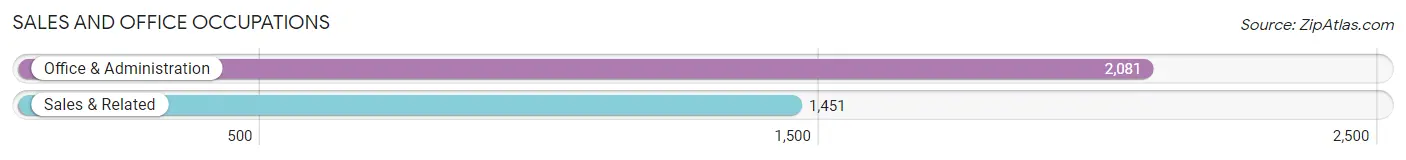
Sales and Office Occupations
The most common Sales and Office occupations in Garner are Office & Administration (2,081 | 12.4%), and Sales & Related (1,451 | 8.6%).
Sales and Office Occupations by Sex
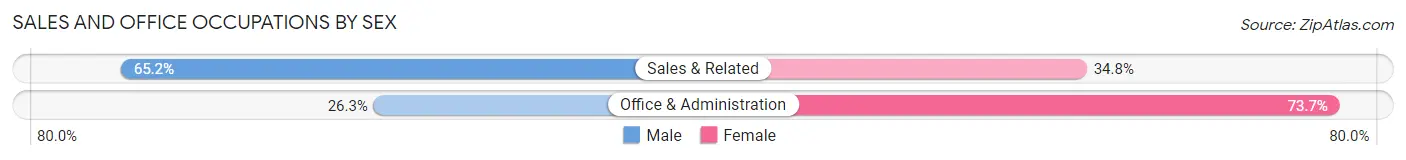
| Occupation | Male | Female |
| Sales & Related | 946 (65.2%) | 505 (34.8%) |
| Office & Administration | 547 (26.3%) | 1,534 (73.7%) |
| Total (Category) | 1,493 (42.3%) | 2,039 (57.7%) |
| Total (Overall) | 9,200 (54.8%) | 7,594 (45.2%) |
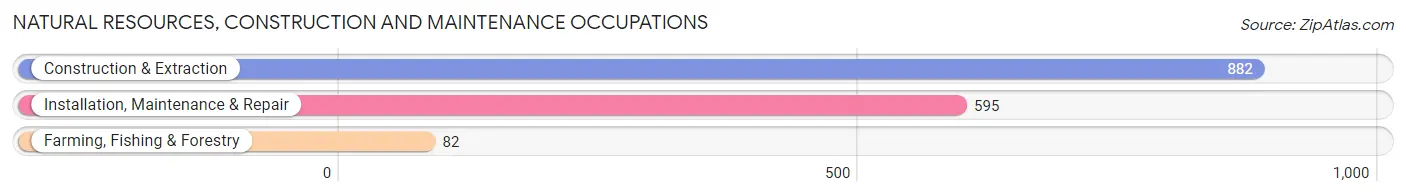
Natural Resources, Construction and Maintenance Occupations
The most common Natural Resources, Construction and Maintenance occupations in Garner are Construction & Extraction (882 | 5.2%), Installation, Maintenance & Repair (595 | 3.5%), and Farming, Fishing & Forestry (82 | 0.5%).
Natural Resources, Construction and Maintenance Occupations by Sex
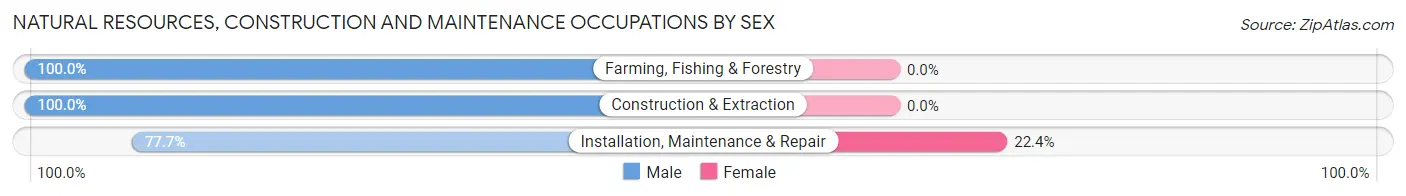
| Occupation | Male | Female |
| Farming, Fishing & Forestry | 82 (100.0%) | 0 (0.0%) |
| Construction & Extraction | 882 (100.0%) | 0 (0.0%) |
| Installation, Maintenance & Repair | 462 (77.6%) | 133 (22.4%) |
| Total (Category) | 1,426 (91.5%) | 133 (8.5%) |
| Total (Overall) | 9,200 (54.8%) | 7,594 (45.2%) |
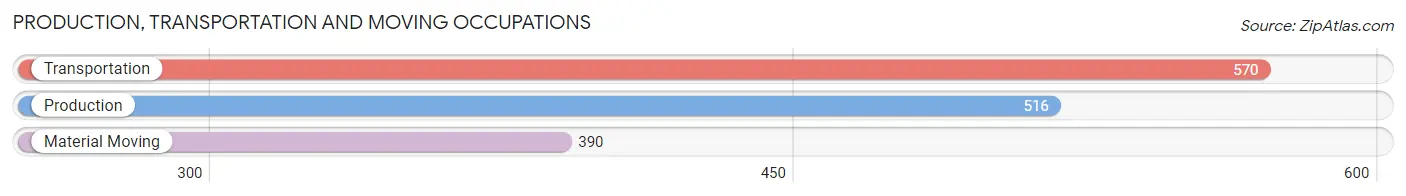
Production, Transportation and Moving Occupations
The most common Production, Transportation and Moving occupations in Garner are Transportation (570 | 3.4%), Production (516 | 3.1%), and Material Moving (390 | 2.3%).
Production, Transportation and Moving Occupations by Sex
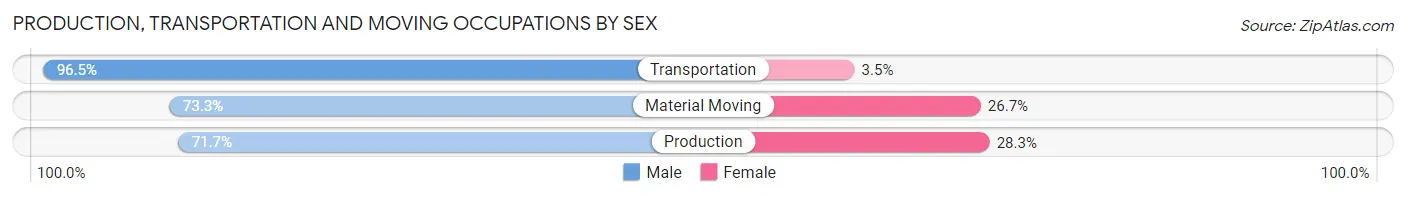
| Occupation | Male | Female |
| Production | 370 (71.7%) | 146 (28.3%) |
| Transportation | 550 (96.5%) | 20 (3.5%) |
| Material Moving | 286 (73.3%) | 104 (26.7%) |
| Total (Category) | 1,206 (81.7%) | 270 (18.3%) |
| Total (Overall) | 9,200 (54.8%) | 7,594 (45.2%) |
Employment Industries by Sex in Garner
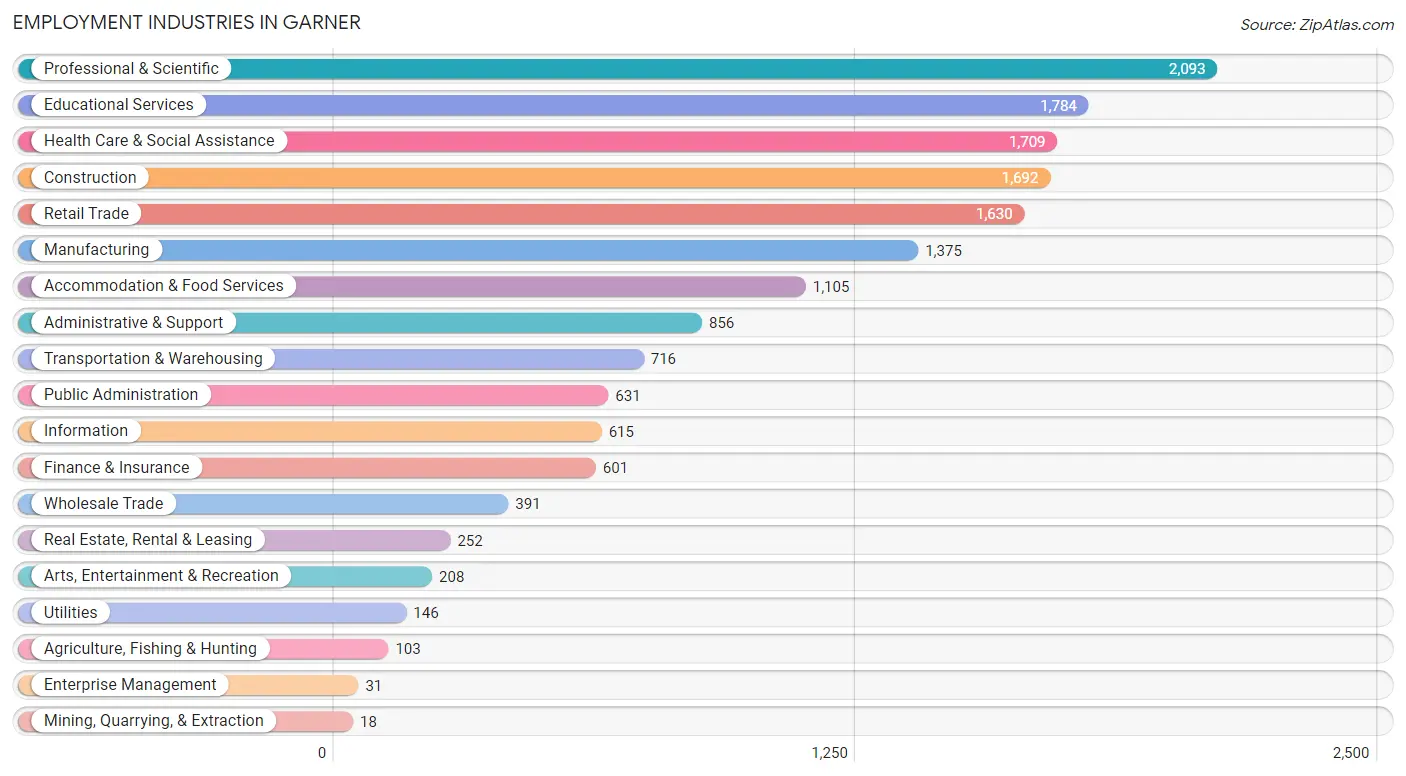
Employment Industries in Garner
The major employment industries in Garner include Professional & Scientific (2,093 | 12.5%), Educational Services (1,784 | 10.6%), Health Care & Social Assistance (1,709 | 10.2%), Construction (1,692 | 10.1%), and Retail Trade (1,630 | 9.7%).
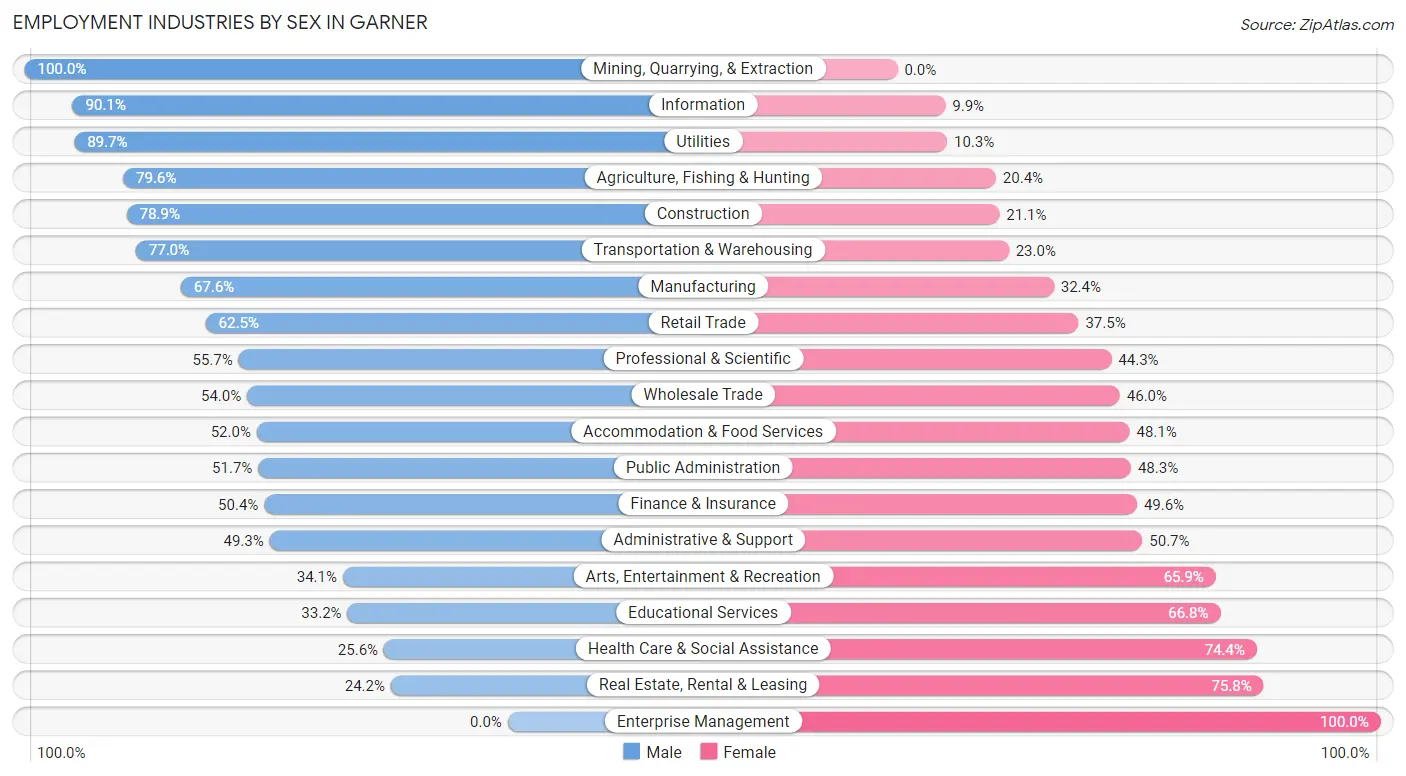
Employment Industries by Sex in Garner
The Garner industries that see more men than women are Mining, Quarrying, & Extraction (100.0%), Information (90.1%), and Utilities (89.7%), whereas the industries that tend to have a higher number of women are Enterprise Management (100.0%), Real Estate, Rental & Leasing (75.8%), and Health Care & Social Assistance (74.4%).
| Industry | Male | Female |
| Agriculture, Fishing & Hunting | 82 (79.6%) | 21 (20.4%) |
| Mining, Quarrying, & Extraction | 18 (100.0%) | 0 (0.0%) |
| Construction | 1,335 (78.9%) | 357 (21.1%) |
| Manufacturing | 930 (67.6%) | 445 (32.4%) |
| Wholesale Trade | 211 (54.0%) | 180 (46.0%) |
| Retail Trade | 1,019 (62.5%) | 611 (37.5%) |
| Transportation & Warehousing | 551 (77.0%) | 165 (23.0%) |
| Utilities | 131 (89.7%) | 15 (10.3%) |
| Information | 554 (90.1%) | 61 (9.9%) |
| Finance & Insurance | 303 (50.4%) | 298 (49.6%) |
| Real Estate, Rental & Leasing | 61 (24.2%) | 191 (75.8%) |
| Professional & Scientific | 1,166 (55.7%) | 927 (44.3%) |
| Enterprise Management | 0 (0.0%) | 31 (100.0%) |
| Administrative & Support | 422 (49.3%) | 434 (50.7%) |
| Educational Services | 592 (33.2%) | 1,192 (66.8%) |
| Health Care & Social Assistance | 438 (25.6%) | 1,271 (74.4%) |
| Arts, Entertainment & Recreation | 71 (34.1%) | 137 (65.9%) |
| Accommodation & Food Services | 574 (51.9%) | 531 (48.0%) |
| Public Administration | 326 (51.7%) | 305 (48.3%) |
| Total | 9,200 (54.8%) | 7,594 (45.2%) |
Education in Garner
School Enrollment in Garner
The most common levels of schooling among the 7,616 students in Garner are college / undergraduate (1,795 | 23.6%), high school (1,562 | 20.5%), and middle school (1,403 | 18.4%).
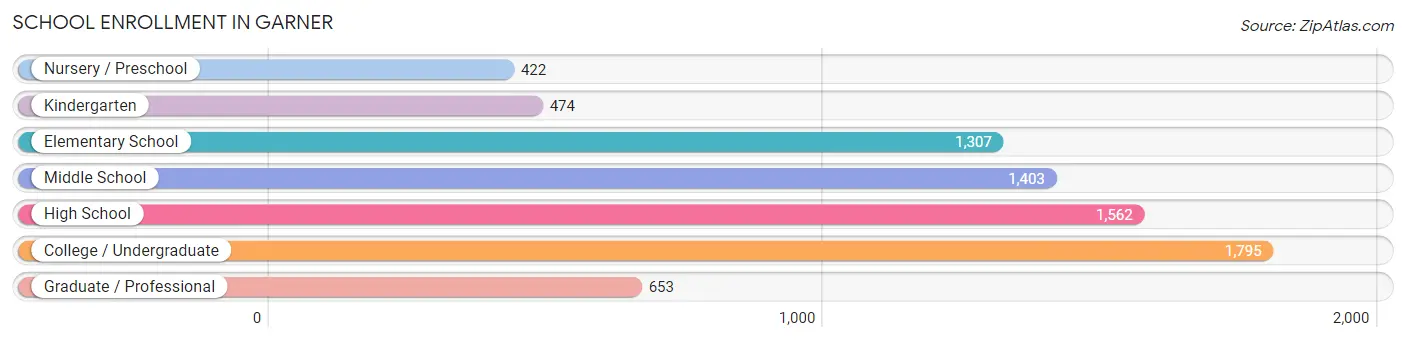
| School Level | # Students | % Students |
| Nursery / Preschool | 422 | 5.5% |
| Kindergarten | 474 | 6.2% |
| Elementary School | 1,307 | 17.2% |
| Middle School | 1,403 | 18.4% |
| High School | 1,562 | 20.5% |
| College / Undergraduate | 1,795 | 23.6% |
| Graduate / Professional | 653 | 8.6% |
| Total | 7,616 | 100.0% |
School Enrollment by Age by Funding Source in Garner
Out of a total of 7,616 students who are enrolled in schools in Garner, 1,775 (23.3%) attend a private institution, while the remaining 5,841 (76.7%) are enrolled in public schools. The age group of 3 to 4 year olds has the highest likelihood of being enrolled in private schools, with 391 (100.0% in the age bracket) enrolled. Conversely, the age group of 18 to 19 year olds has the lowest likelihood of being enrolled in a private school, with 412 (96.3% in the age bracket) attending a public institution.
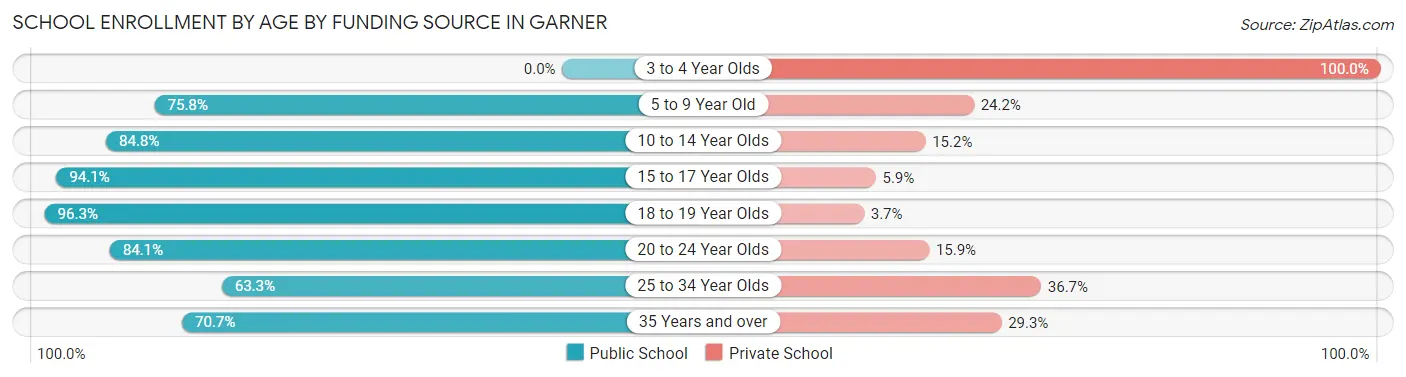
| Age Bracket | Public School | Private School |
| 3 to 4 Year Olds | 0 (0.0%) | 391 (100.0%) |
| 5 to 9 Year Old | 1,295 (75.8%) | 414 (24.2%) |
| 10 to 14 Year Olds | 1,401 (84.8%) | 251 (15.2%) |
| 15 to 17 Year Olds | 1,143 (94.1%) | 72 (5.9%) |
| 18 to 19 Year Olds | 412 (96.3%) | 16 (3.7%) |
| 20 to 24 Year Olds | 657 (84.1%) | 124 (15.9%) |
| 25 to 34 Year Olds | 689 (63.3%) | 400 (36.7%) |
| 35 Years and over | 248 (70.7%) | 103 (29.3%) |
| Total | 5,841 (76.7%) | 1,775 (23.3%) |
Educational Attainment by Field of Study in Garner
Business (2,675 | 24.6%), education (1,120 | 10.3%), bio, nature & agricultural (1,025 | 9.5%), arts & humanities (839 | 7.7%), and social sciences (813 | 7.5%) are the most common fields of study among 10,852 individuals in Garner who have obtained a bachelor's degree or higher.
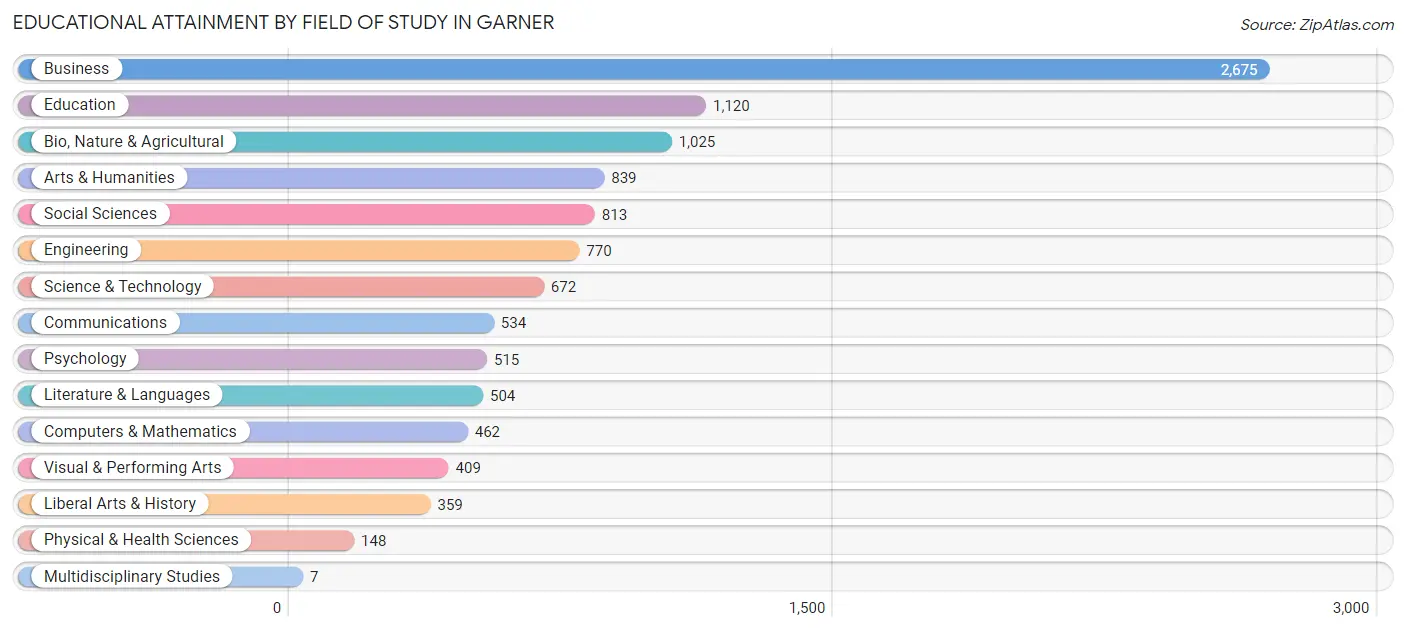
| Field of Study | # Graduates | % Graduates |
| Computers & Mathematics | 462 | 4.3% |
| Bio, Nature & Agricultural | 1,025 | 9.5% |
| Physical & Health Sciences | 148 | 1.4% |
| Psychology | 515 | 4.8% |
| Social Sciences | 813 | 7.5% |
| Engineering | 770 | 7.1% |
| Multidisciplinary Studies | 7 | 0.1% |
| Science & Technology | 672 | 6.2% |
| Business | 2,675 | 24.6% |
| Education | 1,120 | 10.3% |
| Literature & Languages | 504 | 4.6% |
| Liberal Arts & History | 359 | 3.3% |
| Visual & Performing Arts | 409 | 3.8% |
| Communications | 534 | 4.9% |
| Arts & Humanities | 839 | 7.7% |
| Total | 10,852 | 100.0% |
Transportation & Commute in Garner
Vehicle Availability by Sex in Garner
The most prevalent vehicle ownership categories in Garner are males with 2 vehicles (4,287, accounting for 47.0%) and females with 2 vehicles (2,943, making up 58.1%).
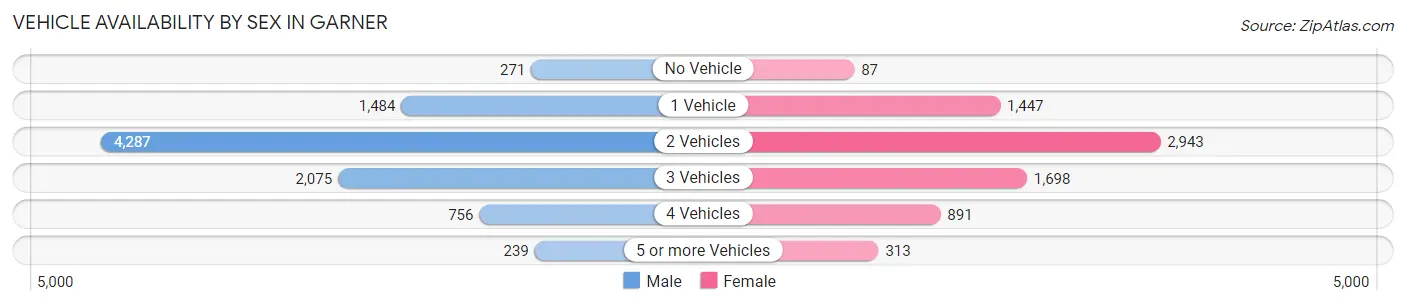
| Vehicles Available | Male | Female |
| No Vehicle | 271 (3.0%) | 87 (1.2%) |
| 1 Vehicle | 1,484 (16.3%) | 1,447 (19.6%) |
| 2 Vehicles | 4,287 (47.0%) | 2,943 (39.9%) |
| 3 Vehicles | 2,075 (22.8%) | 1,698 (23.0%) |
| 4 Vehicles | 756 (8.3%) | 891 (12.1%) |
| 5 or more Vehicles | 239 (2.6%) | 313 (4.2%) |
| Total | 9,112 (100.0%) | 7,379 (100.0%) |
Commute Time in Garner
The most frequently occuring commute durations in Garner are 30 to 34 minutes (2,251 commuters, 16.3%), 20 to 24 minutes (1,747 commuters, 12.7%), and 15 to 19 minutes (1,724 commuters, 12.5%).
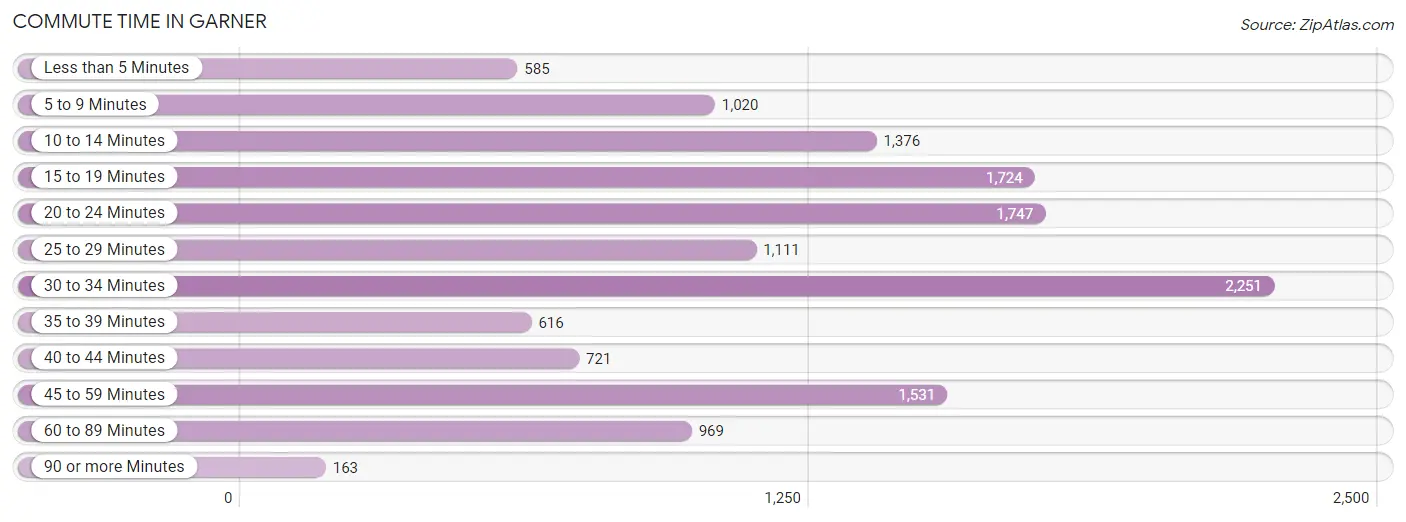
| Commute Time | # Commuters | % Commuters |
| Less than 5 Minutes | 585 | 4.2% |
| 5 to 9 Minutes | 1,020 | 7.4% |
| 10 to 14 Minutes | 1,376 | 10.0% |
| 15 to 19 Minutes | 1,724 | 12.5% |
| 20 to 24 Minutes | 1,747 | 12.7% |
| 25 to 29 Minutes | 1,111 | 8.0% |
| 30 to 34 Minutes | 2,251 | 16.3% |
| 35 to 39 Minutes | 616 | 4.5% |
| 40 to 44 Minutes | 721 | 5.2% |
| 45 to 59 Minutes | 1,531 | 11.1% |
| 60 to 89 Minutes | 969 | 7.0% |
| 90 or more Minutes | 163 | 1.2% |
Commute Time by Sex in Garner
The most common commute times in Garner are 30 to 34 minutes (1,297 commuters, 16.3%) for males and 45 to 59 minutes (961 commuters, 16.4%) for females.
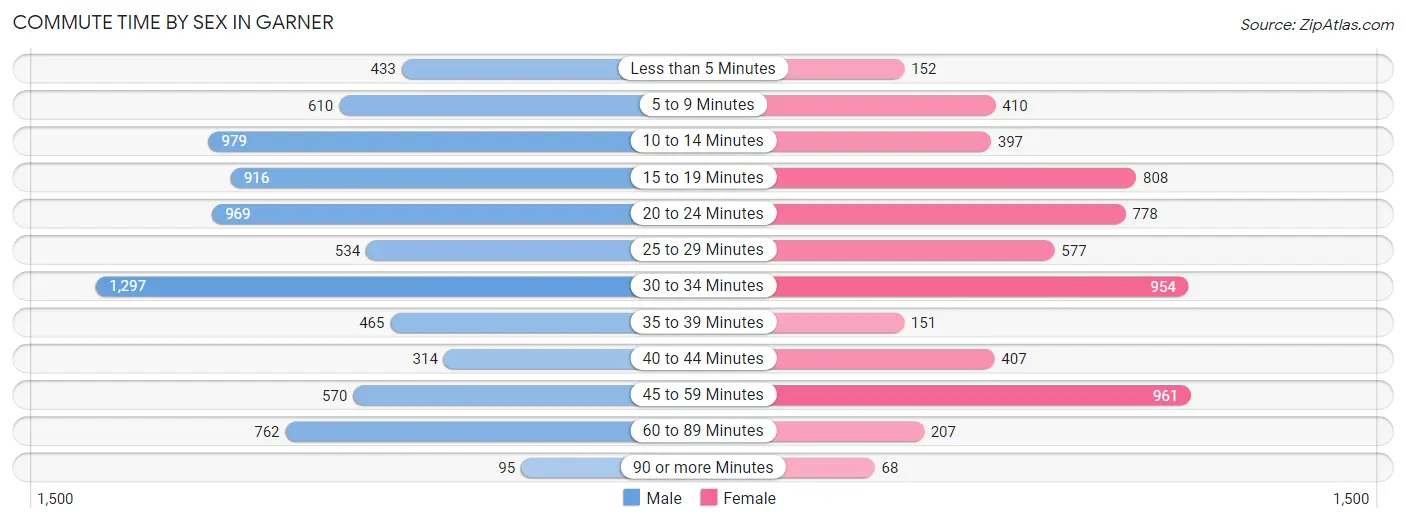
| Commute Time | Male | Female |
| Less than 5 Minutes | 433 (5.4%) | 152 (2.6%) |
| 5 to 9 Minutes | 610 (7.7%) | 410 (7.0%) |
| 10 to 14 Minutes | 979 (12.3%) | 397 (6.8%) |
| 15 to 19 Minutes | 916 (11.5%) | 808 (13.8%) |
| 20 to 24 Minutes | 969 (12.2%) | 778 (13.3%) |
| 25 to 29 Minutes | 534 (6.7%) | 577 (9.8%) |
| 30 to 34 Minutes | 1,297 (16.3%) | 954 (16.3%) |
| 35 to 39 Minutes | 465 (5.9%) | 151 (2.6%) |
| 40 to 44 Minutes | 314 (4.0%) | 407 (6.9%) |
| 45 to 59 Minutes | 570 (7.2%) | 961 (16.4%) |
| 60 to 89 Minutes | 762 (9.6%) | 207 (3.5%) |
| 90 or more Minutes | 95 (1.2%) | 68 (1.2%) |
Time of Departure to Work by Sex in Garner
The most frequent times of departure to work in Garner are 7:00 AM to 7:29 AM (1,674, 21.1%) for males and 7:00 AM to 7:29 AM (1,147, 19.5%) for females.
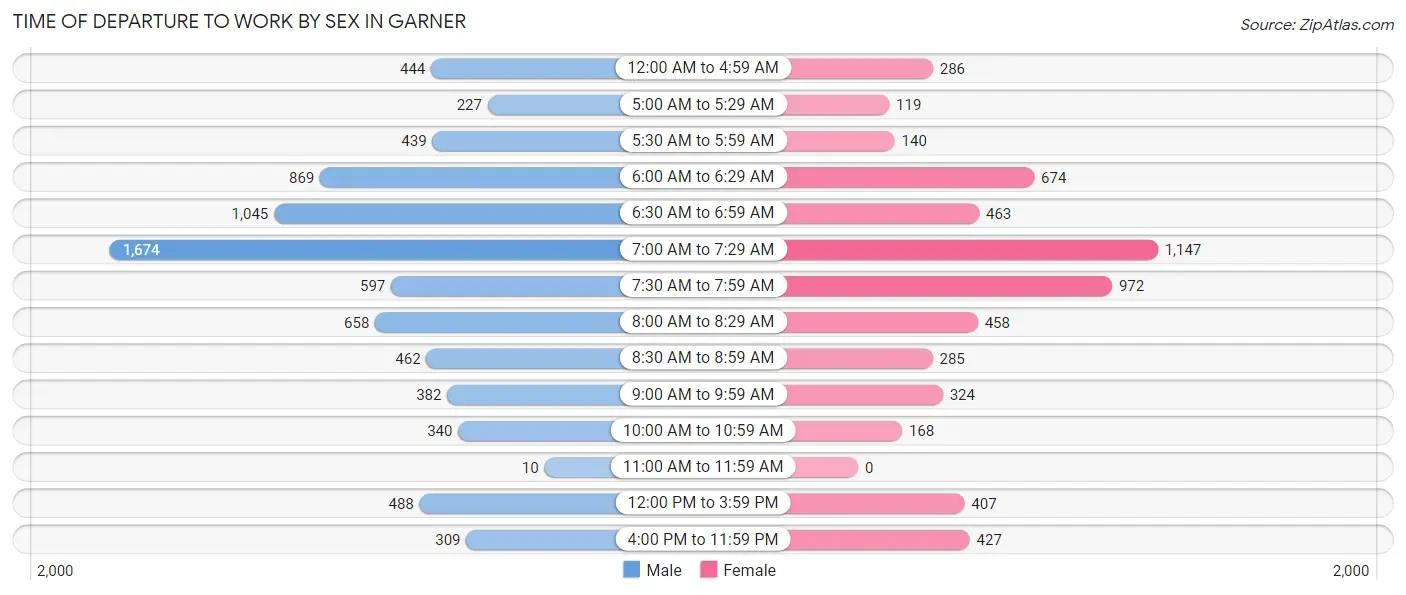
| Time of Departure | Male | Female |
| 12:00 AM to 4:59 AM | 444 (5.6%) | 286 (4.9%) |
| 5:00 AM to 5:29 AM | 227 (2.9%) | 119 (2.0%) |
| 5:30 AM to 5:59 AM | 439 (5.5%) | 140 (2.4%) |
| 6:00 AM to 6:29 AM | 869 (10.9%) | 674 (11.5%) |
| 6:30 AM to 6:59 AM | 1,045 (13.2%) | 463 (7.9%) |
| 7:00 AM to 7:29 AM | 1,674 (21.1%) | 1,147 (19.5%) |
| 7:30 AM to 7:59 AM | 597 (7.5%) | 972 (16.6%) |
| 8:00 AM to 8:29 AM | 658 (8.3%) | 458 (7.8%) |
| 8:30 AM to 8:59 AM | 462 (5.8%) | 285 (4.9%) |
| 9:00 AM to 9:59 AM | 382 (4.8%) | 324 (5.5%) |
| 10:00 AM to 10:59 AM | 340 (4.3%) | 168 (2.9%) |
| 11:00 AM to 11:59 AM | 10 (0.1%) | 0 (0.0%) |
| 12:00 PM to 3:59 PM | 488 (6.1%) | 407 (6.9%) |
| 4:00 PM to 11:59 PM | 309 (3.9%) | 427 (7.3%) |
| Total | 7,944 (100.0%) | 5,870 (100.0%) |
Housing Occupancy in Garner
Occupancy by Ownership in Garner
Of the total 12,360 dwellings in Garner, owner-occupied units account for 7,904 (63.9%), while renter-occupied units make up 4,456 (36.0%).
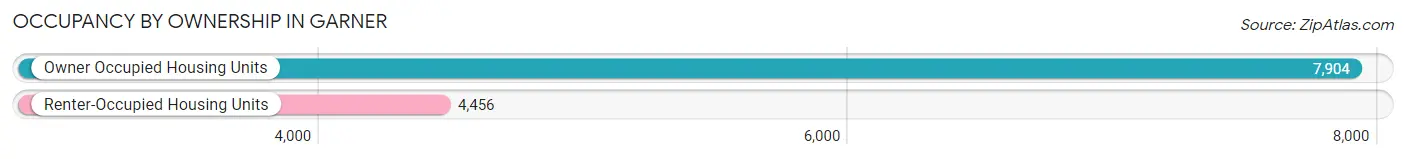
| Occupancy | # Housing Units | % Housing Units |
| Owner Occupied Housing Units | 7,904 | 63.9% |
| Renter-Occupied Housing Units | 4,456 | 36.0% |
| Total Occupied Housing Units | 12,360 | 100.0% |
Occupancy by Household Size in Garner
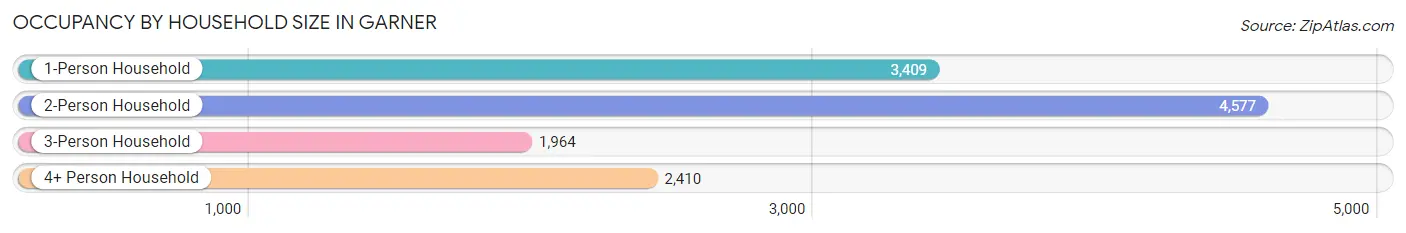
| Household Size | # Housing Units | % Housing Units |
| 1-Person Household | 3,409 | 27.6% |
| 2-Person Household | 4,577 | 37.0% |
| 3-Person Household | 1,964 | 15.9% |
| 4+ Person Household | 2,410 | 19.5% |
| Total Housing Units | 12,360 | 100.0% |
Occupancy by Ownership by Household Size in Garner
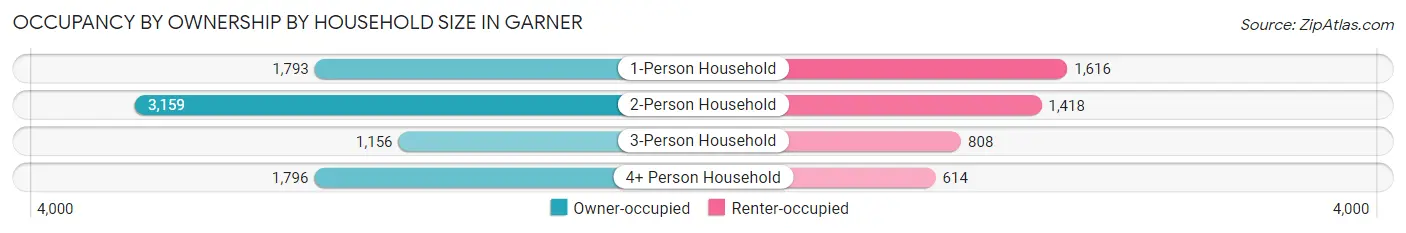
| Household Size | Owner-occupied | Renter-occupied |
| 1-Person Household | 1,793 (52.6%) | 1,616 (47.4%) |
| 2-Person Household | 3,159 (69.0%) | 1,418 (31.0%) |
| 3-Person Household | 1,156 (58.9%) | 808 (41.1%) |
| 4+ Person Household | 1,796 (74.5%) | 614 (25.5%) |
| Total Housing Units | 7,904 (63.9%) | 4,456 (36.0%) |
Occupancy by Educational Attainment in Garner
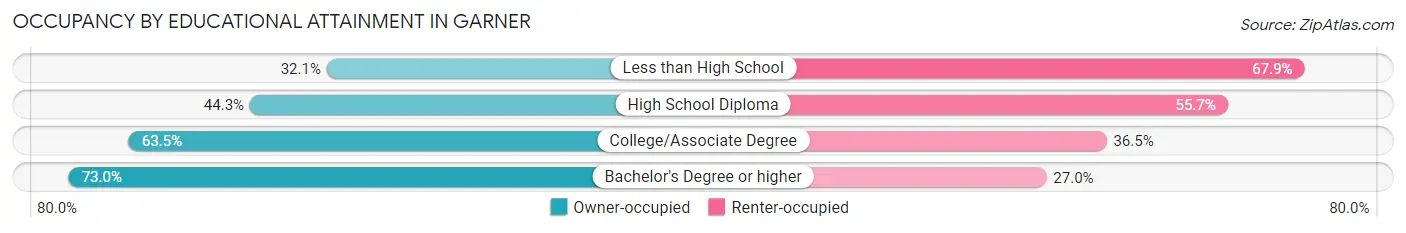
| Household Size | Owner-occupied | Renter-occupied |
| Less than High School | 128 (32.1%) | 271 (67.9%) |
| High School Diploma | 967 (44.3%) | 1,218 (55.7%) |
| College/Associate Degree | 2,181 (63.5%) | 1,255 (36.5%) |
| Bachelor's Degree or higher | 4,628 (73.0%) | 1,712 (27.0%) |
Occupancy by Age of Householder in Garner
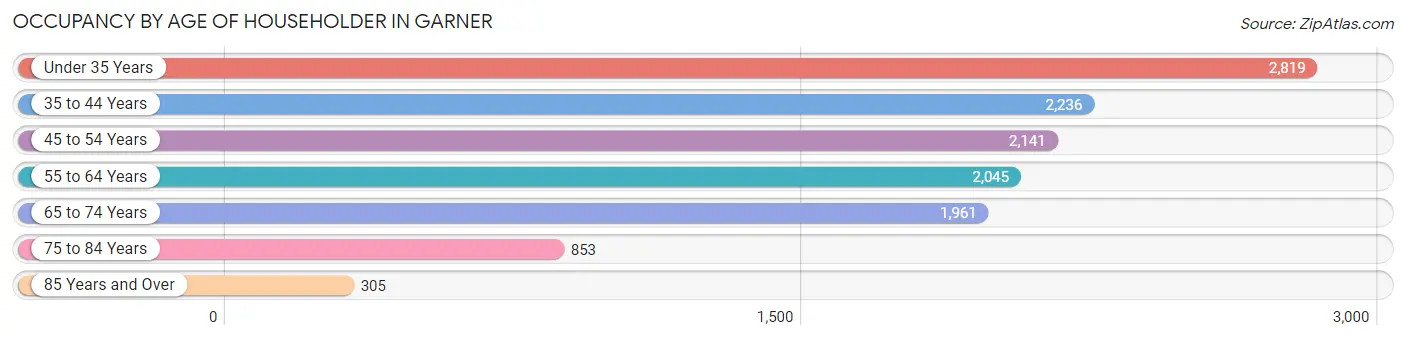
| Age Bracket | # Households | % Households |
| Under 35 Years | 2,819 | 22.8% |
| 35 to 44 Years | 2,236 | 18.1% |
| 45 to 54 Years | 2,141 | 17.3% |
| 55 to 64 Years | 2,045 | 16.6% |
| 65 to 74 Years | 1,961 | 15.9% |
| 75 to 84 Years | 853 | 6.9% |
| 85 Years and Over | 305 | 2.5% |
| Total | 12,360 | 100.0% |
Housing Finances in Garner
Median Income by Occupancy in Garner
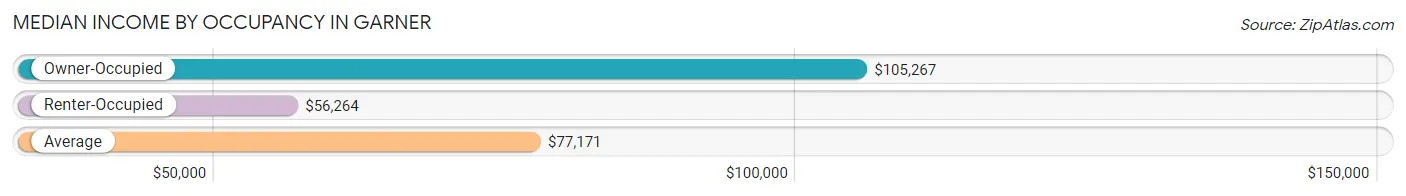
| Occupancy Type | # Households | Median Income |
| Owner-Occupied | 7,904 (63.9%) | $105,267 |
| Renter-Occupied | 4,456 (36.0%) | $56,264 |
| Average | 12,360 (100.0%) | $77,171 |
Occupancy by Householder Income Bracket in Garner
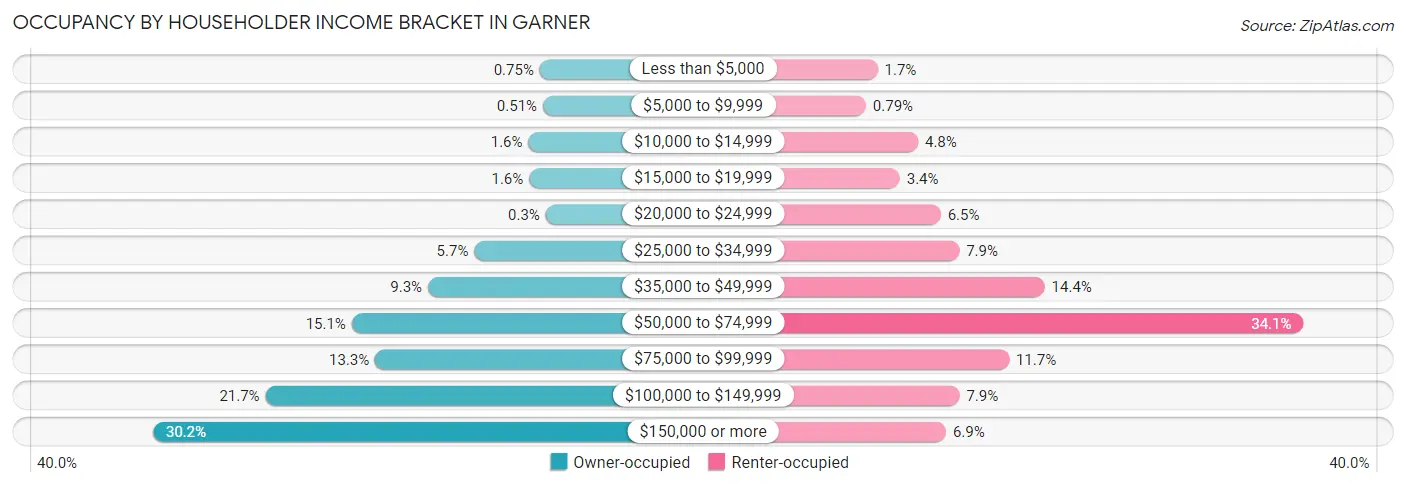
| Income Bracket | Owner-occupied | Renter-occupied |
| Less than $5,000 | 59 (0.7%) | 75 (1.7%) |
| $5,000 to $9,999 | 40 (0.5%) | 35 (0.8%) |
| $10,000 to $14,999 | 128 (1.6%) | 212 (4.8%) |
| $15,000 to $19,999 | 123 (1.6%) | 150 (3.4%) |
| $20,000 to $24,999 | 24 (0.3%) | 289 (6.5%) |
| $25,000 to $34,999 | 454 (5.7%) | 352 (7.9%) |
| $35,000 to $49,999 | 733 (9.3%) | 642 (14.4%) |
| $50,000 to $74,999 | 1,192 (15.1%) | 1,520 (34.1%) |
| $75,000 to $99,999 | 1,051 (13.3%) | 521 (11.7%) |
| $100,000 to $149,999 | 1,711 (21.6%) | 353 (7.9%) |
| $150,000 or more | 2,389 (30.2%) | 307 (6.9%) |
| Total | 7,904 (100.0%) | 4,456 (100.0%) |
Monthly Housing Cost Tiers in Garner
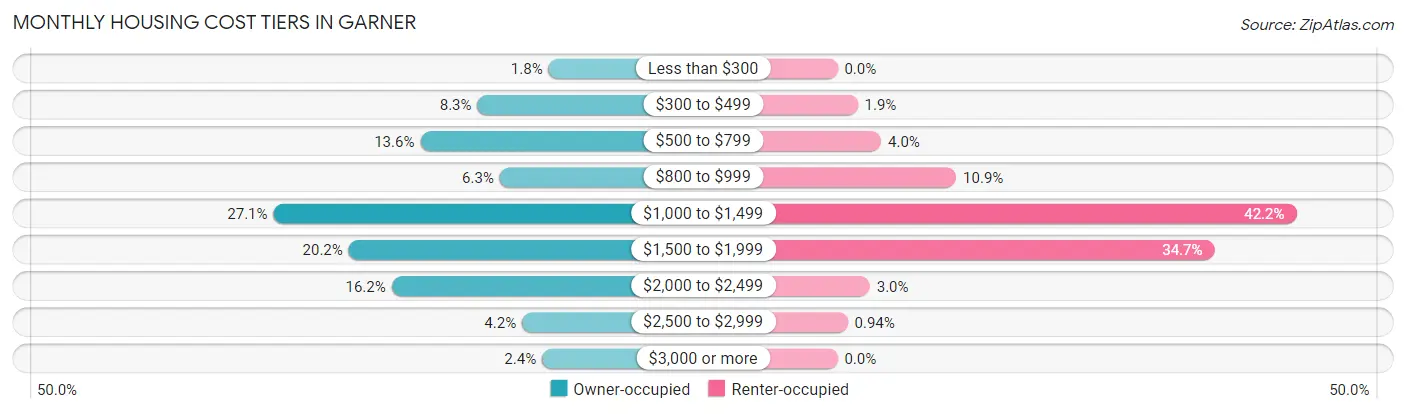
| Monthly Cost | Owner-occupied | Renter-occupied |
| Less than $300 | 140 (1.8%) | 0 (0.0%) |
| $300 to $499 | 658 (8.3%) | 83 (1.9%) |
| $500 to $799 | 1,073 (13.6%) | 179 (4.0%) |
| $800 to $999 | 495 (6.3%) | 487 (10.9%) |
| $1,000 to $1,499 | 2,142 (27.1%) | 1,882 (42.2%) |
| $1,500 to $1,999 | 1,594 (20.2%) | 1,546 (34.7%) |
| $2,000 to $2,499 | 1,282 (16.2%) | 133 (3.0%) |
| $2,500 to $2,999 | 333 (4.2%) | 42 (0.9%) |
| $3,000 or more | 187 (2.4%) | 0 (0.0%) |
| Total | 7,904 (100.0%) | 4,456 (100.0%) |
Physical Housing Characteristics in Garner
Housing Structures in Garner
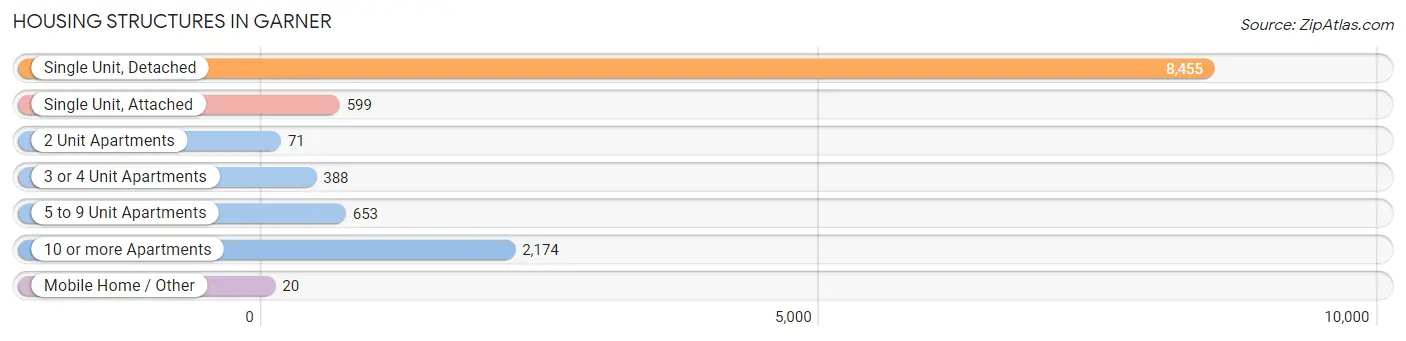
| Structure Type | # Housing Units | % Housing Units |
| Single Unit, Detached | 8,455 | 68.4% |
| Single Unit, Attached | 599 | 4.9% |
| 2 Unit Apartments | 71 | 0.6% |
| 3 or 4 Unit Apartments | 388 | 3.1% |
| 5 to 9 Unit Apartments | 653 | 5.3% |
| 10 or more Apartments | 2,174 | 17.6% |
| Mobile Home / Other | 20 | 0.2% |
| Total | 12,360 | 100.0% |
Housing Structures by Occupancy in Garner
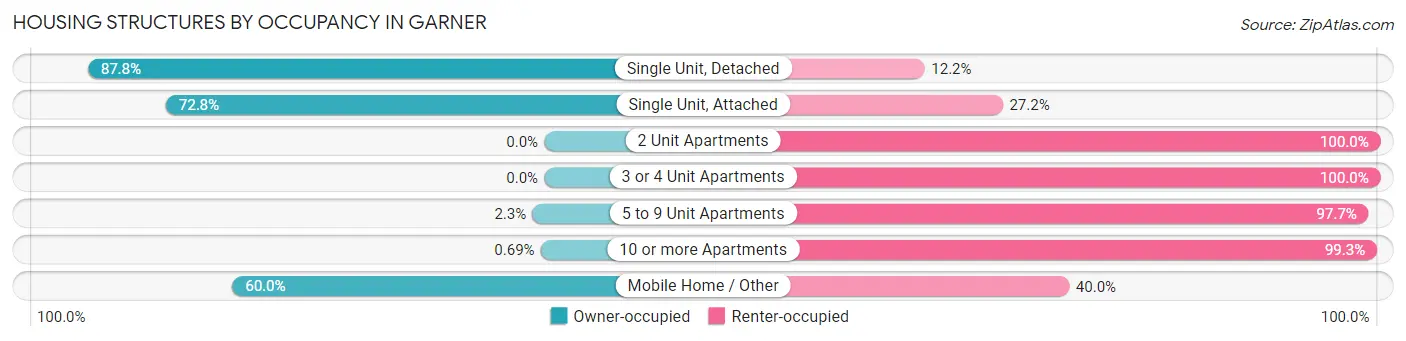
| Structure Type | Owner-occupied | Renter-occupied |
| Single Unit, Detached | 7,426 (87.8%) | 1,029 (12.2%) |
| Single Unit, Attached | 436 (72.8%) | 163 (27.2%) |
| 2 Unit Apartments | 0 (0.0%) | 71 (100.0%) |
| 3 or 4 Unit Apartments | 0 (0.0%) | 388 (100.0%) |
| 5 to 9 Unit Apartments | 15 (2.3%) | 638 (97.7%) |
| 10 or more Apartments | 15 (0.7%) | 2,159 (99.3%) |
| Mobile Home / Other | 12 (60.0%) | 8 (40.0%) |
| Total | 7,904 (63.9%) | 4,456 (36.0%) |
Housing Structures by Number of Rooms in Garner
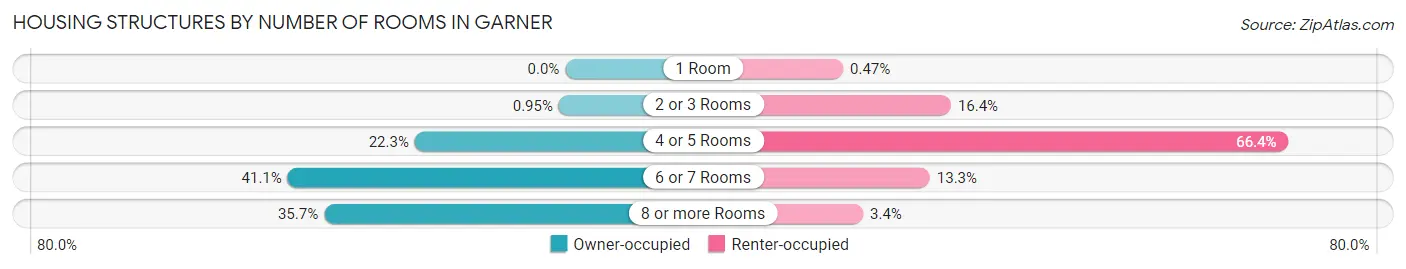
| Number of Rooms | Owner-occupied | Renter-occupied |
| 1 Room | 0 (0.0%) | 21 (0.5%) |
| 2 or 3 Rooms | 75 (0.9%) | 732 (16.4%) |
| 4 or 5 Rooms | 1,760 (22.3%) | 2,957 (66.4%) |
| 6 or 7 Rooms | 3,247 (41.1%) | 593 (13.3%) |
| 8 or more Rooms | 2,822 (35.7%) | 153 (3.4%) |
| Total | 7,904 (100.0%) | 4,456 (100.0%) |
Housing Structure by Heating Type in Garner
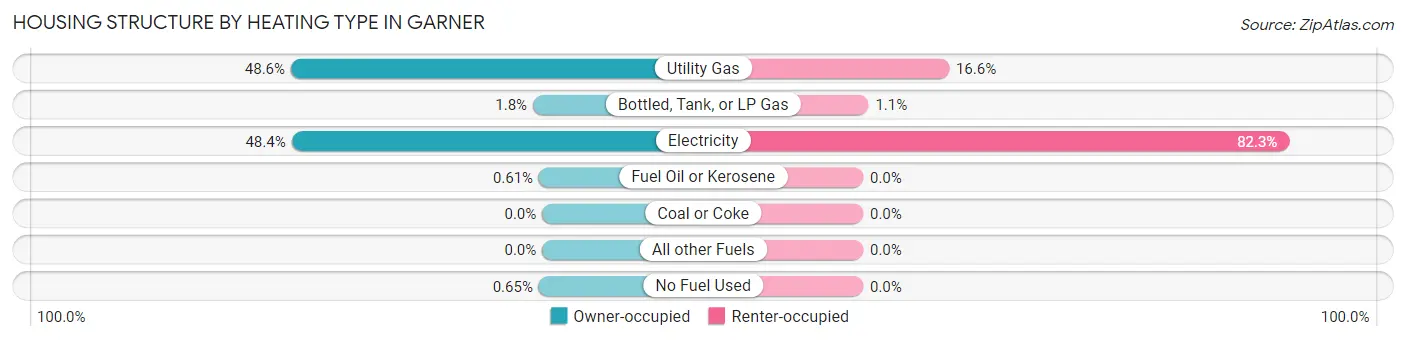
| Heating Type | Owner-occupied | Renter-occupied |
| Utility Gas | 3,837 (48.5%) | 740 (16.6%) |
| Bottled, Tank, or LP Gas | 140 (1.8%) | 47 (1.1%) |
| Electricity | 3,828 (48.4%) | 3,669 (82.3%) |
| Fuel Oil or Kerosene | 48 (0.6%) | 0 (0.0%) |
| Coal or Coke | 0 (0.0%) | 0 (0.0%) |
| All other Fuels | 0 (0.0%) | 0 (0.0%) |
| No Fuel Used | 51 (0.6%) | 0 (0.0%) |
| Total | 7,904 (100.0%) | 4,456 (100.0%) |
Household Vehicle Usage in Garner
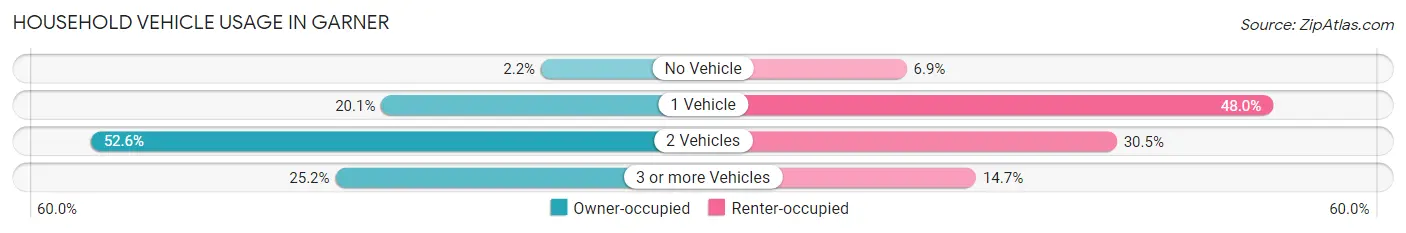
| Vehicles per Household | Owner-occupied | Renter-occupied |
| No Vehicle | 171 (2.2%) | 308 (6.9%) |
| 1 Vehicle | 1,585 (20.1%) | 2,137 (48.0%) |
| 2 Vehicles | 4,157 (52.6%) | 1,357 (30.4%) |
| 3 or more Vehicles | 1,991 (25.2%) | 654 (14.7%) |
| Total | 7,904 (100.0%) | 4,456 (100.0%) |
Real Estate & Mortgages in Garner
Real Estate and Mortgage Overview in Garner
| Characteristic | Without Mortgage | With Mortgage |
| Housing Units | 1,932 | 5,972 |
| Median Property Value | $283,200 | $290,500 |
| Median Household Income | $80,577 | $1,920 |
| Monthly Housing Costs | $569 | $179 |
| Real Estate Taxes | $2,337 | $64 |
Property Value by Mortgage Status in Garner
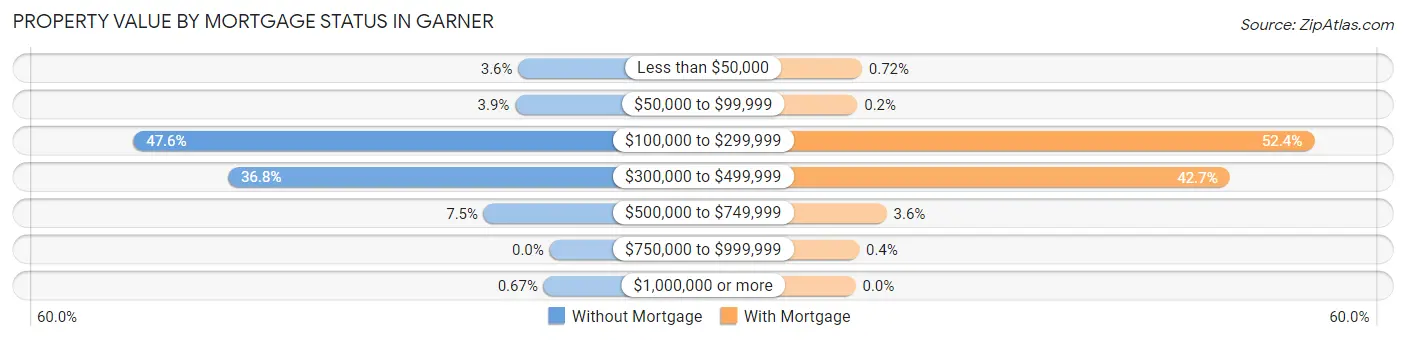
| Property Value | Without Mortgage | With Mortgage |
| Less than $50,000 | 69 (3.6%) | 43 (0.7%) |
| $50,000 to $99,999 | 76 (3.9%) | 12 (0.2%) |
| $100,000 to $299,999 | 919 (47.6%) | 3,129 (52.4%) |
| $300,000 to $499,999 | 710 (36.7%) | 2,552 (42.7%) |
| $500,000 to $749,999 | 145 (7.5%) | 212 (3.5%) |
| $750,000 to $999,999 | 0 (0.0%) | 24 (0.4%) |
| $1,000,000 or more | 13 (0.7%) | 0 (0.0%) |
| Total | 1,932 (100.0%) | 5,972 (100.0%) |
Household Income by Mortgage Status in Garner
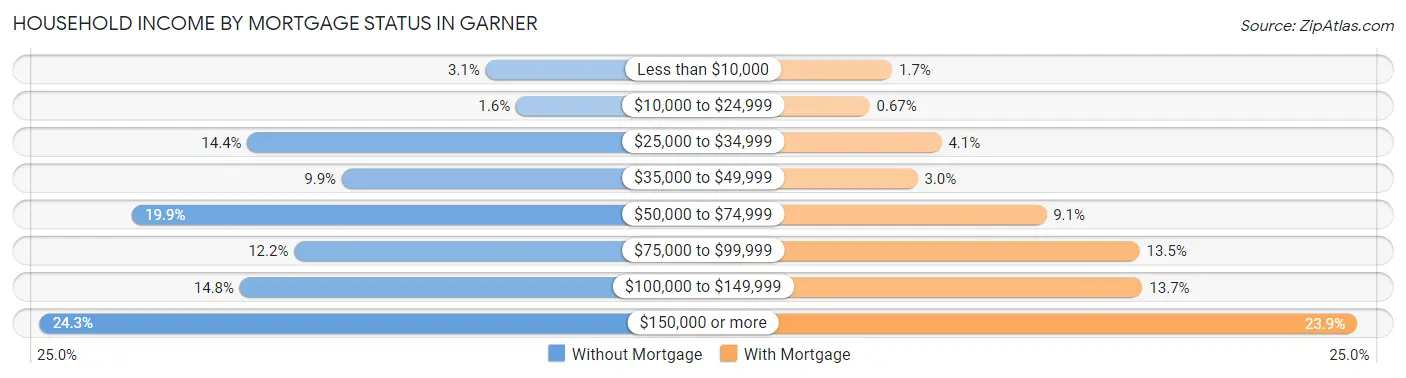
| Household Income | Without Mortgage | With Mortgage |
| Less than $10,000 | 59 (3.0%) | 104 (1.7%) |
| $10,000 to $24,999 | 31 (1.6%) | 40 (0.7%) |
| $25,000 to $34,999 | 278 (14.4%) | 244 (4.1%) |
| $35,000 to $49,999 | 191 (9.9%) | 176 (2.9%) |
| $50,000 to $74,999 | 384 (19.9%) | 542 (9.1%) |
| $75,000 to $99,999 | 235 (12.2%) | 808 (13.5%) |
| $100,000 to $149,999 | 285 (14.7%) | 816 (13.7%) |
| $150,000 or more | 469 (24.3%) | 1,426 (23.9%) |
| Total | 1,932 (100.0%) | 5,972 (100.0%) |
Property Value to Household Income Ratio in Garner
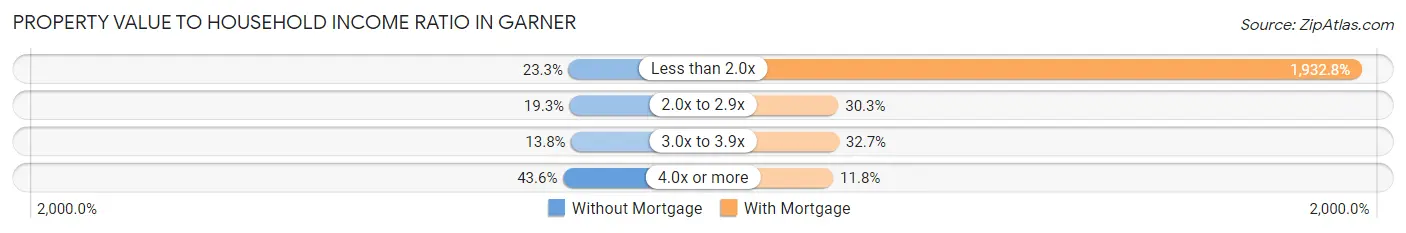
| Value-to-Income Ratio | Without Mortgage | With Mortgage |
| Less than 2.0x | 451 (23.3%) | 115,429 (1,932.8%) |
| 2.0x to 2.9x | 372 (19.3%) | 1,811 (30.3%) |
| 3.0x to 3.9x | 267 (13.8%) | 1,950 (32.7%) |
| 4.0x or more | 842 (43.6%) | 705 (11.8%) |
| Total | 1,932 (100.0%) | 5,972 (100.0%) |
Real Estate Taxes by Mortgage Status in Garner
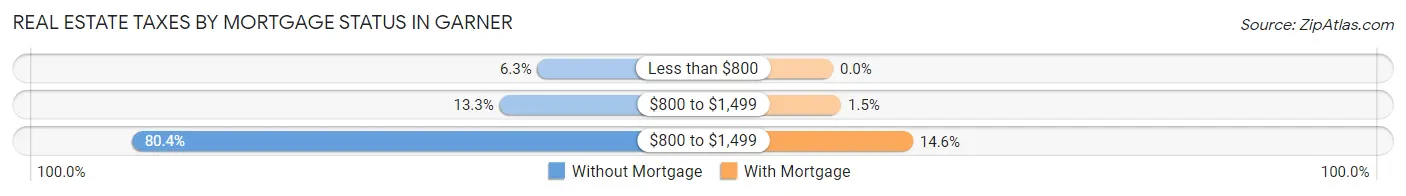
| Property Taxes | Without Mortgage | With Mortgage |
| Less than $800 | 122 (6.3%) | 0 (0.0%) |
| $800 to $1,499 | 256 (13.3%) | 88 (1.5%) |
| $800 to $1,499 | 1,554 (80.4%) | 871 (14.6%) |
| Total | 1,932 (100.0%) | 5,972 (100.0%) |
Health & Disability in Garner
Health Insurance Coverage by Age in Garner
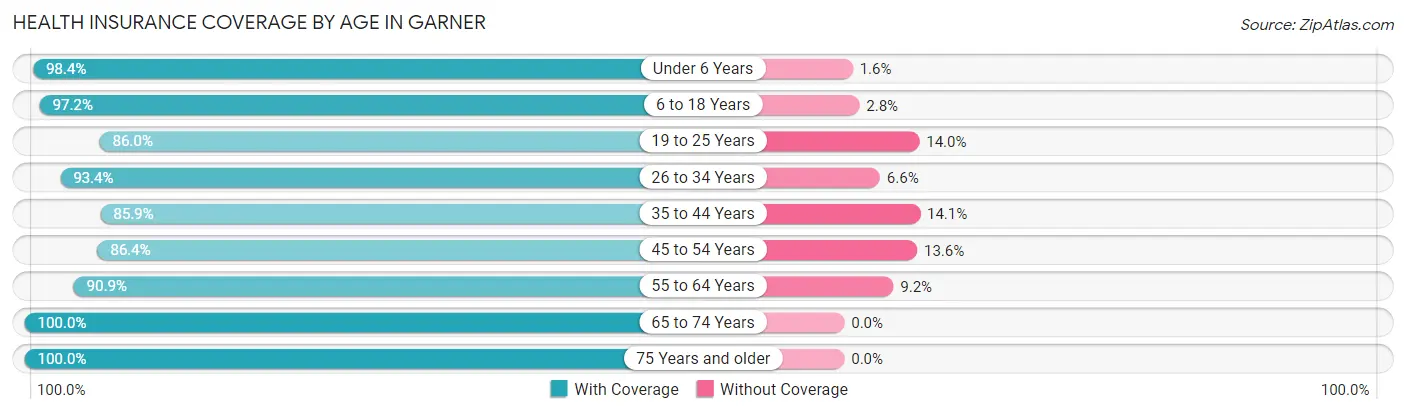
| Age Bracket | With Coverage | Without Coverage |
| Under 6 Years | 2,137 (98.4%) | 34 (1.6%) |
| 6 to 18 Years | 4,592 (97.2%) | 133 (2.8%) |
| 19 to 25 Years | 2,621 (86.0%) | 426 (14.0%) |
| 26 to 34 Years | 4,418 (93.4%) | 314 (6.6%) |
| 35 to 44 Years | 3,593 (85.9%) | 591 (14.1%) |
| 45 to 54 Years | 3,708 (86.4%) | 582 (13.6%) |
| 55 to 64 Years | 3,159 (90.8%) | 318 (9.1%) |
| 65 to 74 Years | 3,072 (100.0%) | 0 (0.0%) |
| 75 Years and older | 1,785 (100.0%) | 0 (0.0%) |
| Total | 29,085 (92.4%) | 2,398 (7.6%) |
Health Insurance Coverage by Citizenship Status in Garner
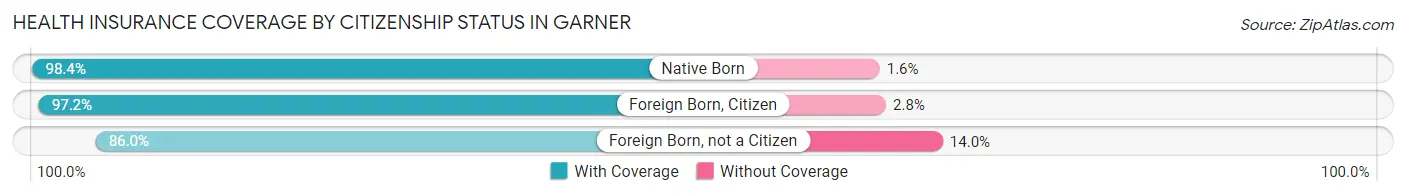
| Citizenship Status | With Coverage | Without Coverage |
| Native Born | 2,137 (98.4%) | 34 (1.6%) |
| Foreign Born, Citizen | 4,592 (97.2%) | 133 (2.8%) |
| Foreign Born, not a Citizen | 2,621 (86.0%) | 426 (14.0%) |
Health Insurance Coverage by Household Income in Garner
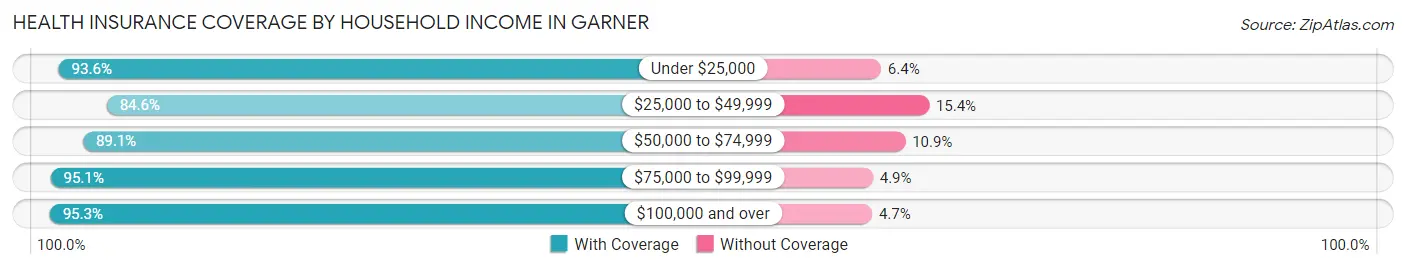
| Household Income | With Coverage | Without Coverage |
| Under $25,000 | 1,625 (93.6%) | 111 (6.4%) |
| $25,000 to $49,999 | 3,914 (84.6%) | 712 (15.4%) |
| $50,000 to $74,999 | 5,437 (89.1%) | 668 (10.9%) |
| $75,000 to $99,999 | 3,831 (95.1%) | 196 (4.9%) |
| $100,000 and over | 14,231 (95.3%) | 704 (4.7%) |
Public vs Private Health Insurance Coverage by Age in Garner
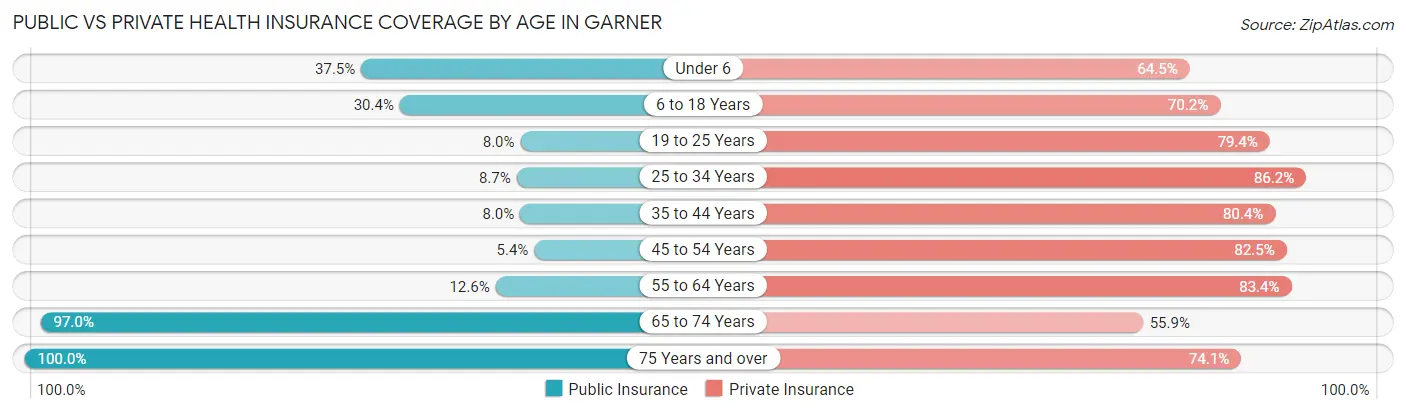
| Age Bracket | Public Insurance | Private Insurance |
| Under 6 | 815 (37.5%) | 1,401 (64.5%) |
| 6 to 18 Years | 1,435 (30.4%) | 3,317 (70.2%) |
| 19 to 25 Years | 243 (8.0%) | 2,420 (79.4%) |
| 25 to 34 Years | 411 (8.7%) | 4,077 (86.2%) |
| 35 to 44 Years | 336 (8.0%) | 3,365 (80.4%) |
| 45 to 54 Years | 232 (5.4%) | 3,541 (82.5%) |
| 55 to 64 Years | 438 (12.6%) | 2,901 (83.4%) |
| 65 to 74 Years | 2,981 (97.0%) | 1,716 (55.9%) |
| 75 Years and over | 1,785 (100.0%) | 1,323 (74.1%) |
| Total | 8,676 (27.6%) | 24,061 (76.4%) |
Disability Status by Sex by Age in Garner
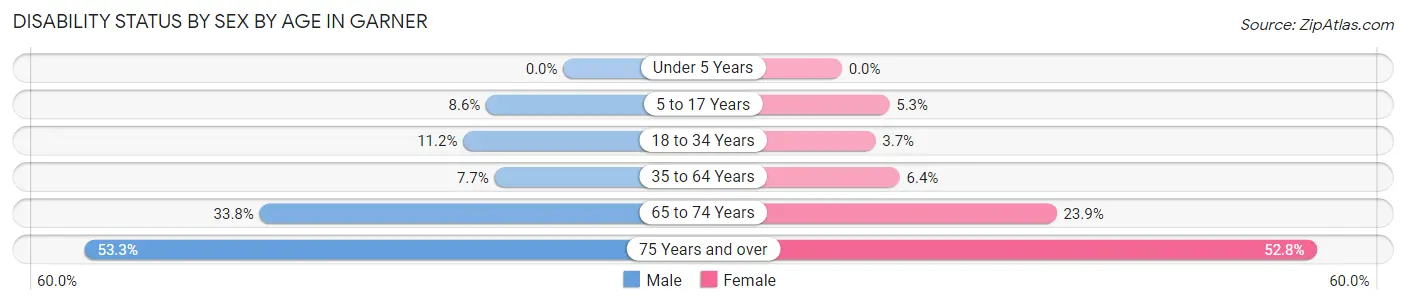
| Age Bracket | Male | Female |
| Under 5 Years | 0 (0.0%) | 0 (0.0%) |
| 5 to 17 Years | 184 (8.6%) | 135 (5.3%) |
| 18 to 34 Years | 484 (11.2%) | 140 (3.7%) |
| 35 to 64 Years | 440 (7.7%) | 400 (6.4%) |
| 65 to 74 Years | 503 (33.8%) | 379 (23.9%) |
| 75 Years and over | 209 (53.3%) | 736 (52.8%) |
Disability Class by Sex by Age in Garner
Disability Class: Hearing Difficulty
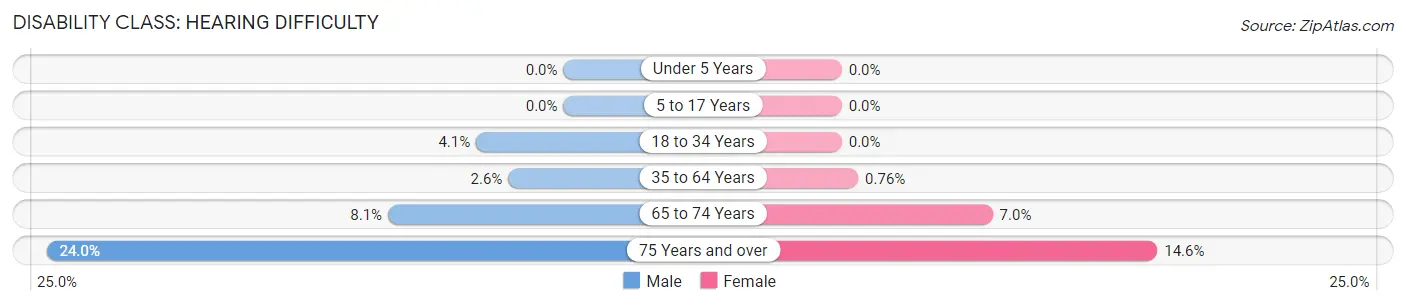
| Age Bracket | Male | Female |
| Under 5 Years | 0 (0.0%) | 0 (0.0%) |
| 5 to 17 Years | 0 (0.0%) | 0 (0.0%) |
| 18 to 34 Years | 176 (4.1%) | 0 (0.0%) |
| 35 to 64 Years | 147 (2.6%) | 47 (0.8%) |
| 65 to 74 Years | 121 (8.1%) | 111 (7.0%) |
| 75 Years and over | 94 (24.0%) | 204 (14.6%) |
Disability Class: Vision Difficulty
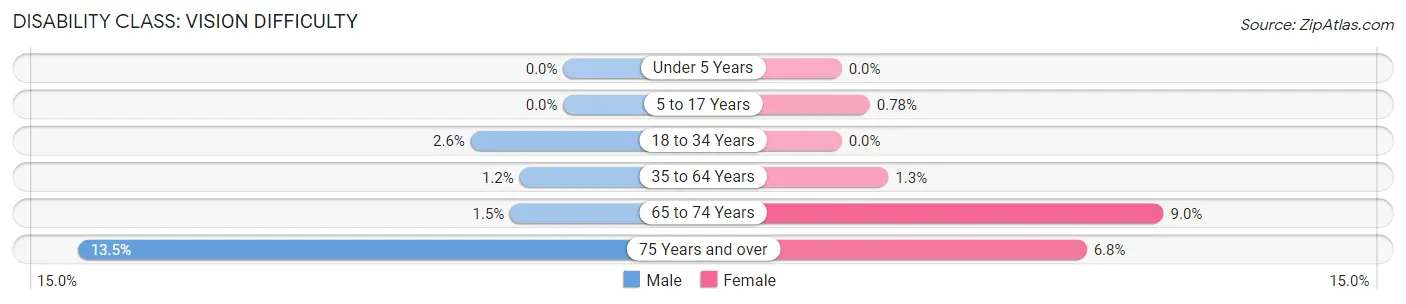
| Age Bracket | Male | Female |
| Under 5 Years | 0 (0.0%) | 0 (0.0%) |
| 5 to 17 Years | 0 (0.0%) | 20 (0.8%) |
| 18 to 34 Years | 112 (2.6%) | 0 (0.0%) |
| 35 to 64 Years | 70 (1.2%) | 81 (1.3%) |
| 65 to 74 Years | 22 (1.5%) | 142 (9.0%) |
| 75 Years and over | 53 (13.5%) | 95 (6.8%) |
Disability Class: Cognitive Difficulty
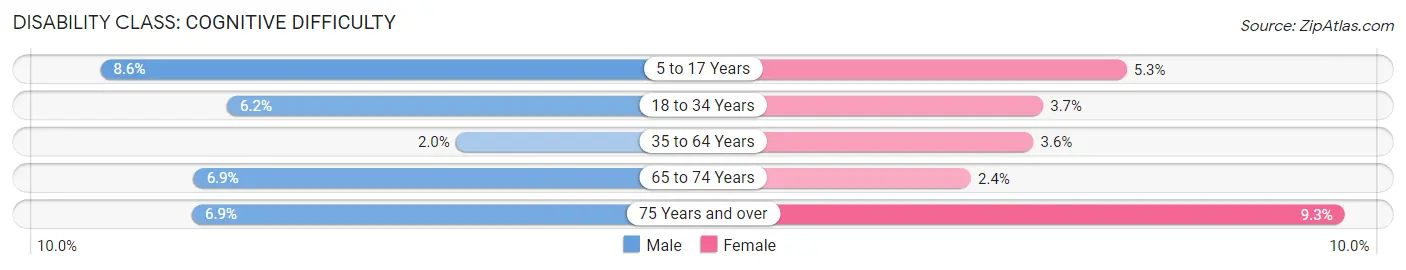
| Age Bracket | Male | Female |
| 5 to 17 Years | 184 (8.6%) | 135 (5.3%) |
| 18 to 34 Years | 271 (6.2%) | 140 (3.7%) |
| 35 to 64 Years | 115 (2.0%) | 221 (3.6%) |
| 65 to 74 Years | 102 (6.9%) | 38 (2.4%) |
| 75 Years and over | 27 (6.9%) | 130 (9.3%) |
Disability Class: Ambulatory Difficulty
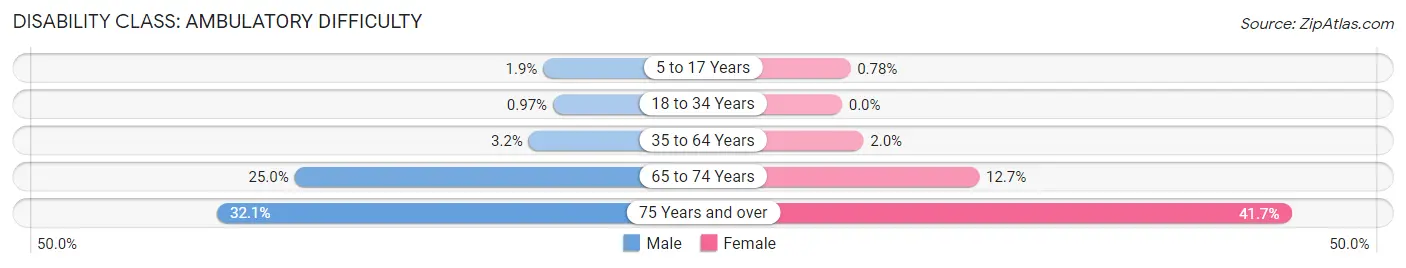
| Age Bracket | Male | Female |
| 5 to 17 Years | 40 (1.9%) | 20 (0.8%) |
| 18 to 34 Years | 42 (1.0%) | 0 (0.0%) |
| 35 to 64 Years | 185 (3.2%) | 124 (2.0%) |
| 65 to 74 Years | 371 (24.9%) | 202 (12.7%) |
| 75 Years and over | 126 (32.1%) | 581 (41.7%) |
Disability Class: Self-Care Difficulty
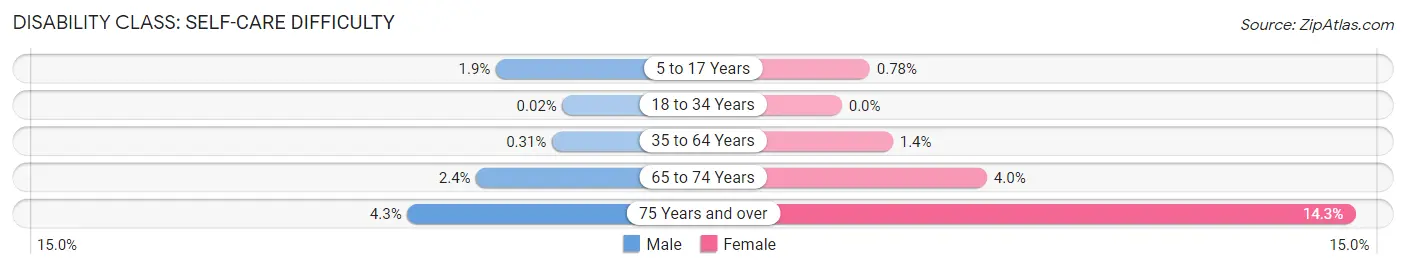
| Age Bracket | Male | Female |
| 5 to 17 Years | 40 (1.9%) | 20 (0.8%) |
| 18 to 34 Years | 1 (0.0%) | 0 (0.0%) |
| 35 to 64 Years | 18 (0.3%) | 88 (1.4%) |
| 65 to 74 Years | 36 (2.4%) | 64 (4.0%) |
| 75 Years and over | 17 (4.3%) | 199 (14.3%) |
Technology Access in Garner
Computing Device Access in Garner
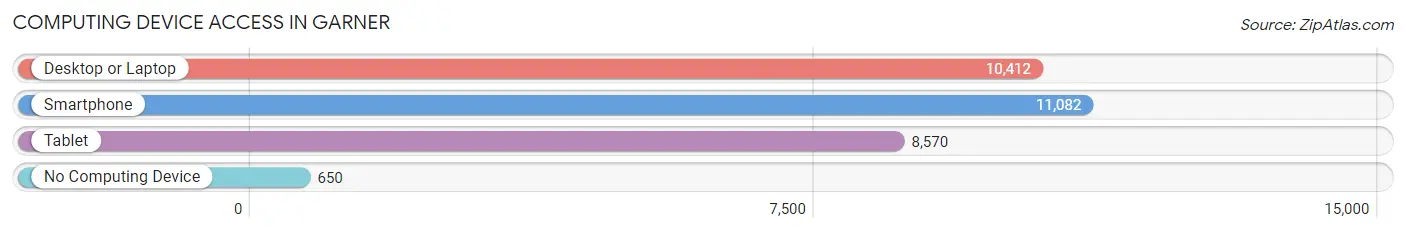
| Device Type | # Households | % Households |
| Desktop or Laptop | 10,412 | 84.2% |
| Smartphone | 11,082 | 89.7% |
| Tablet | 8,570 | 69.3% |
| No Computing Device | 650 | 5.3% |
| Total | 12,360 | 100.0% |
Internet Access in Garner
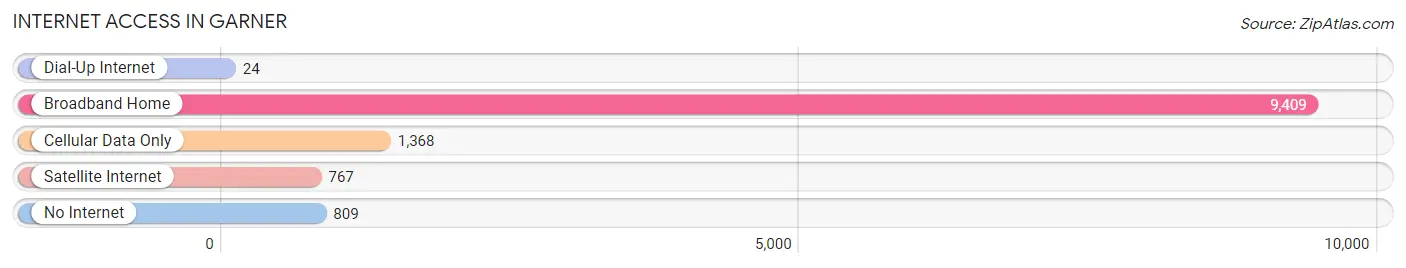
| Internet Type | # Households | % Households |
| Dial-Up Internet | 24 | 0.2% |
| Broadband Home | 9,409 | 76.1% |
| Cellular Data Only | 1,368 | 11.1% |
| Satellite Internet | 767 | 6.2% |
| No Internet | 809 | 6.6% |
| Total | 12,360 | 100.0% |
Garner Summary
Garner, North Carolina is a town located in Wake County, North Carolina. It is part of the Raleigh-Durham-Chapel Hill metropolitan area. The town was founded in 1883 and has a population of approximately 28,000 people.
Geography
Garner is located in the northeast corner of Wake County, North Carolina. It is situated between the Neuse River and the Little River. The town is bordered by the towns of Clayton, Knightdale, and Raleigh. The town is located approximately 20 miles from downtown Raleigh and is accessible by Interstate 40 and US Highway 70.
The town of Garner is located in the Piedmont region of North Carolina. The terrain is mostly flat with some rolling hills. The climate is humid subtropical with hot summers and mild winters. The average annual temperature is around 60 degrees Fahrenheit.
Economy
Garner’s economy is largely based on the service industry. The town is home to several large employers, including WakeMed Health & Hospitals, Wake County Public Schools, and the North Carolina Department of Transportation. The town also has a number of small businesses, including restaurants, retail stores, and professional services.
The town is also home to several large shopping centers, including White Oak Shopping Center, Garner Towne Center, and South Garner Shopping Center. These shopping centers provide a variety of retail and dining options for residents and visitors.
Demographics
As of the 2010 census, the population of Garner was 28,000. The racial makeup of the town was 79.3% White, 13.2% African American, 0.7% Native American, 2.2% Asian, and 4.6% from other races. The median household income was $50,000.
The town is home to a diverse population. The town is home to a large Hispanic population, as well as a growing Asian population. The town also has a large number of military veterans.
Conclusion
Garner, North Carolina is a town located in Wake County, North Carolina. It is part of the Raleigh-Durham-Chapel Hill metropolitan area. The town was founded in 1883 and has a population of approximately 28,000 people. The town is located in the Piedmont region of North Carolina and has a humid subtropical climate. The economy of the town is largely based on the service industry. The town is home to a diverse population, with a large Hispanic and Asian population. The median household income is $50,000.
Common Questions
What is the Total Population of Garner?
Total Population of Garner is 31,684.
What is the Total Male Population of Garner?
Total Male Population of Garner is 15,198.
What is the Total Female Population of Garner?
Total Female Population of Garner is 16,486.
What is the Ratio of Males per 100 Females in Garner?
There are 92.19 Males per 100 Females in Garner.
What is the Ratio of Females per 100 Males in Garner?
There are 108.47 Females per 100 Males in Garner.
What is the Median Population Age in Garner?
Median Population Age in Garner is 37.3 Years.
What is the Average Family Size in Garner
Average Family Size in Garner is 3.2 People.
What is the Average Household Size in Garner
Average Household Size in Garner is 2.5 People.
What is Per Capita Income in Garner?
Per Capita income in Garner is $42,165.
What is the Median Family Income in Garner?
Median Family Income in Garner is $99,450.
What is the Median Household income in Garner?
Median Household Income in Garner is $77,171.
What is Income or Wage Gap in Garner?
Income or Wage Gap in Garner is 24.8%.
Women in Garner earn 75.2 cents for every dollar earned by a man.
What is Family Income Deficit in Garner?
Family Income Deficit in Garner is $9,463.
Families that are below poverty line in Garner earn $9,463 less on average than the poverty threshold level.
What is Inequality or Gini Index in Garner?
Inequality or Gini Index in Garner is 0.40.
How Large is the Labor Force in Garner?
There are 17,848 People in the Labor Forcein in Garner.
What is the Percentage of People in the Labor Force in Garner?
69.2% of People are in the Labor Force in Garner.
What is the Unemployment Rate in Garner?
Unemployment Rate in Garner is 5.8%.