Wallburg, NC
Wallburg Map
Wallburg Overview
3,081
TOTAL POPULATION
1,571
MALE POPULATION
1,510
FEMALE POPULATION
104.04
MALES / 100 FEMALES
96.12
FEMALES / 100 MALES
53.7
MEDIAN AGE
2.6
AVG FAMILY SIZE
2.3
AVG HOUSEHOLD SIZE
$40,645
PER CAPITA INCOME
$92,619
AVG FAMILY INCOME
$80,592
AVG HOUSEHOLD INCOME
38.7%
WAGE / INCOME GAP [ % ]
61.3¢/ $1
WAGE / INCOME GAP [ $ ]
0.40
INEQUALITY / GINI INDEX
1,640
LABOR FORCE [ PEOPLE ]
59.6%
PERCENT IN LABOR FORCE
8.2%
UNEMPLOYMENT RATE
Wallburg Area Codes
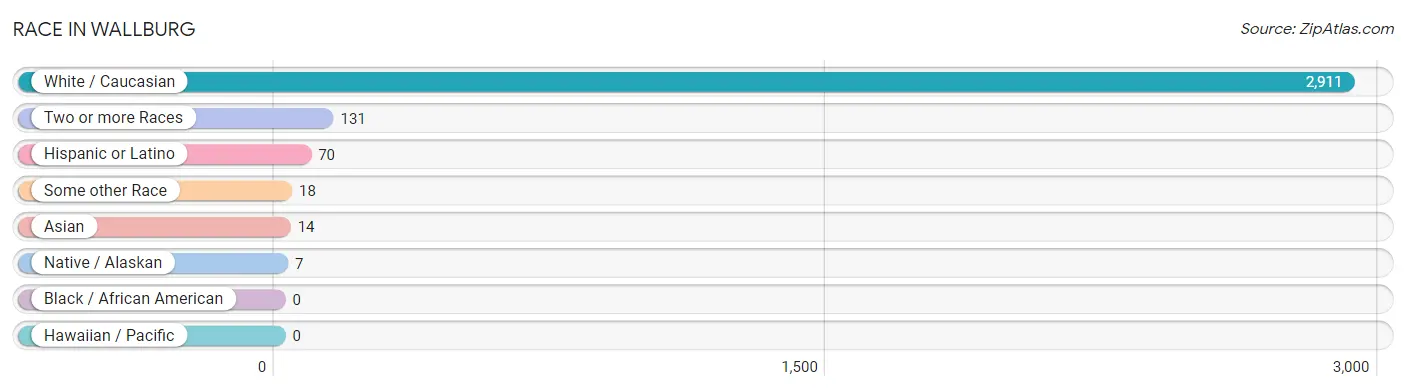
Race in Wallburg
The most populous races in Wallburg are White / Caucasian (2,911 | 94.5%), Two or more Races (131 | 4.3%), and Hispanic or Latino (70 | 2.3%).
| Race | # Population | % Population |
| Asian | 14 | 0.4% |
| Black / African American | 0 | 0.0% |
| Hawaiian / Pacific | 0 | 0.0% |
| Hispanic or Latino | 70 | 2.3% |
| Native / Alaskan | 7 | 0.2% |
| White / Caucasian | 2,911 | 94.5% |
| Two or more Races | 131 | 4.3% |
| Some other Race | 18 | 0.6% |
| Total | 3,081 | 100.0% |
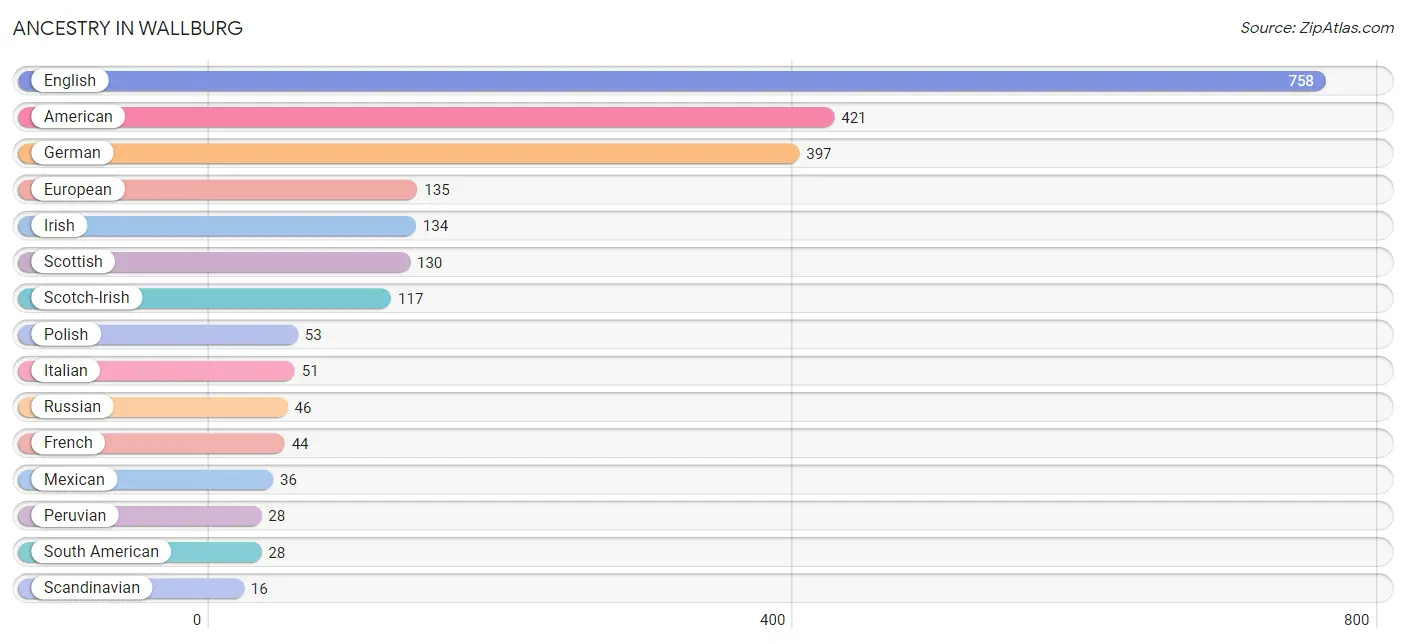
Ancestry in Wallburg
The most populous ancestries reported in Wallburg are English (758 | 24.6%), American (421 | 13.7%), German (397 | 12.9%), European (135 | 4.4%), and Irish (134 | 4.3%), together accounting for 59.9% of all Wallburg residents.
| Ancestry | # Population | % Population |
| American | 421 | 13.7% |
| British | 9 | 0.3% |
| Danish | 3 | 0.1% |
| English | 758 | 24.6% |
| European | 135 | 4.4% |
| French | 44 | 1.4% |
| German | 397 | 12.9% |
| Irish | 134 | 4.3% |
| Italian | 51 | 1.7% |
| Lithuanian | 7 | 0.2% |
| Lumbee | 7 | 0.2% |
| Mexican | 36 | 1.2% |
| Peruvian | 28 | 0.9% |
| Polish | 53 | 1.7% |
| Puerto Rican | 6 | 0.2% |
| Russian | 46 | 1.5% |
| Scandinavian | 16 | 0.5% |
| Scotch-Irish | 117 | 3.8% |
| Scottish | 130 | 4.2% |
| South American | 28 | 0.9% |
| Sri Lankan | 14 | 0.4% |
| Swedish | 7 | 0.2% | View All 22 Rows |
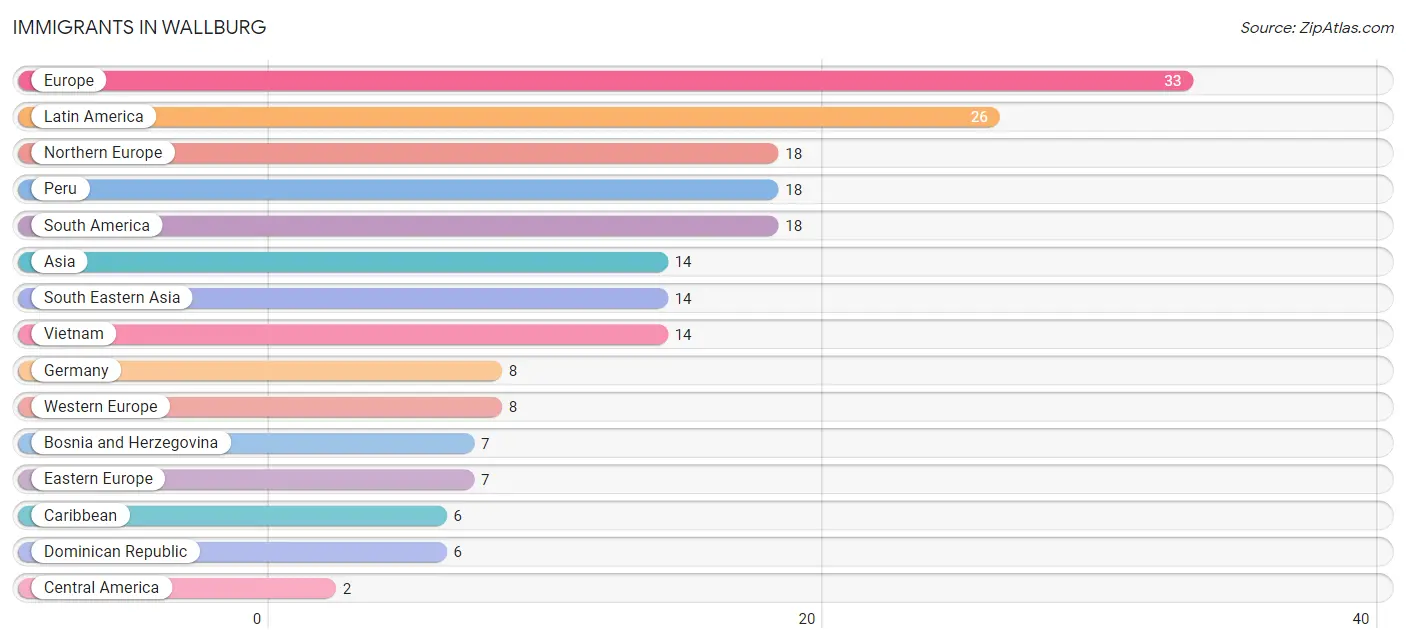
Immigrants in Wallburg
The most numerous immigrant groups reported in Wallburg came from Europe (33 | 1.1%), Latin America (26 | 0.8%), Northern Europe (18 | 0.6%), Peru (18 | 0.6%), and South America (18 | 0.6%), together accounting for 3.6% of all Wallburg residents.
| Immigration Origin | # Population | % Population |
| Asia | 14 | 0.4% |
| Bosnia and Herzegovina | 7 | 0.2% |
| Caribbean | 6 | 0.2% |
| Central America | 2 | 0.1% |
| Dominican Republic | 6 | 0.2% |
| Eastern Europe | 7 | 0.2% |
| Europe | 33 | 1.1% |
| Germany | 8 | 0.3% |
| Latin America | 26 | 0.8% |
| Mexico | 2 | 0.1% |
| Northern Europe | 18 | 0.6% |
| Peru | 18 | 0.6% |
| South America | 18 | 0.6% |
| South Eastern Asia | 14 | 0.4% |
| Vietnam | 14 | 0.4% |
| Western Europe | 8 | 0.3% | View All 16 Rows |
Sex and Age in Wallburg
Sex and Age in Wallburg
The most populous age groups in Wallburg are 60 to 64 Years (214 | 13.6%) for men and 60 to 64 Years (199 | 13.2%) for women.
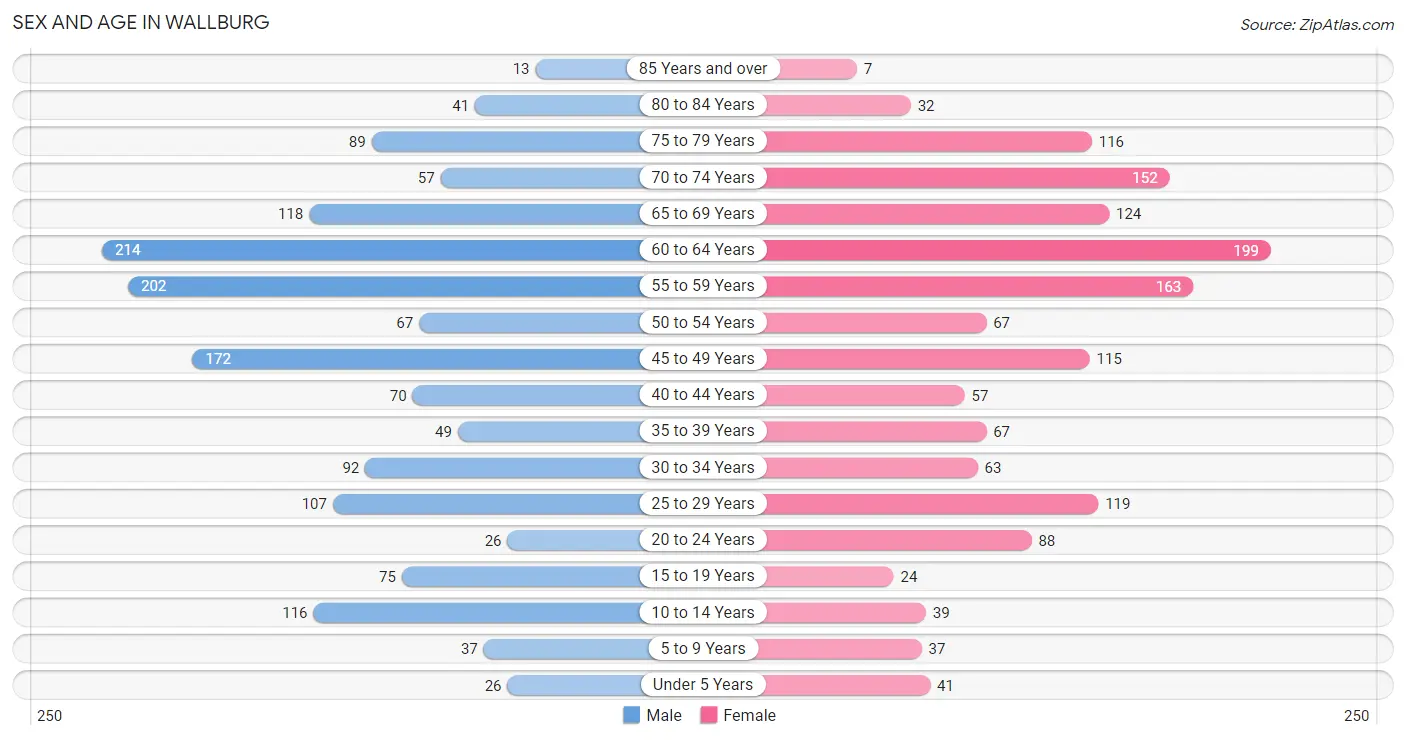
| Age Bracket | Male | Female |
| Under 5 Years | 26 (1.7%) | 41 (2.7%) |
| 5 to 9 Years | 37 (2.4%) | 37 (2.5%) |
| 10 to 14 Years | 116 (7.4%) | 39 (2.6%) |
| 15 to 19 Years | 75 (4.8%) | 24 (1.6%) |
| 20 to 24 Years | 26 (1.7%) | 88 (5.8%) |
| 25 to 29 Years | 107 (6.8%) | 119 (7.9%) |
| 30 to 34 Years | 92 (5.9%) | 63 (4.2%) |
| 35 to 39 Years | 49 (3.1%) | 67 (4.4%) |
| 40 to 44 Years | 70 (4.5%) | 57 (3.8%) |
| 45 to 49 Years | 172 (11.0%) | 115 (7.6%) |
| 50 to 54 Years | 67 (4.3%) | 67 (4.4%) |
| 55 to 59 Years | 202 (12.9%) | 163 (10.8%) |
| 60 to 64 Years | 214 (13.6%) | 199 (13.2%) |
| 65 to 69 Years | 118 (7.5%) | 124 (8.2%) |
| 70 to 74 Years | 57 (3.6%) | 152 (10.1%) |
| 75 to 79 Years | 89 (5.7%) | 116 (7.7%) |
| 80 to 84 Years | 41 (2.6%) | 32 (2.1%) |
| 85 Years and over | 13 (0.8%) | 7 (0.5%) |
| Total | 1,571 (100.0%) | 1,510 (100.0%) |
Families and Households in Wallburg
Median Family Size in Wallburg
The median family size in Wallburg is 2.62 persons per family, with single male/father families (23 | 2.2%) accounting for the largest median family size of 2.96 persons per family. On the other hand, single female/mother families (142 | 13.8%) represent the smallest median family size with 2.46 persons per family.
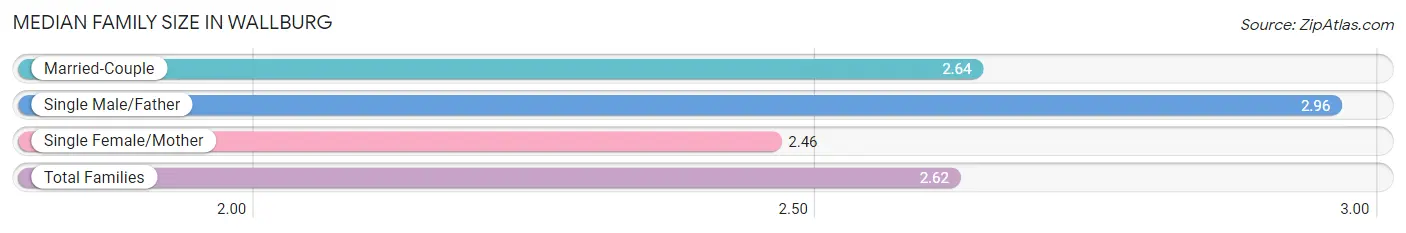
| Family Type | # Families | Family Size |
| Married-Couple | 867 (84.0%) | 2.64 |
| Single Male/Father | 23 (2.2%) | 2.96 |
| Single Female/Mother | 142 (13.8%) | 2.46 |
| Total Families | 1,032 (100.0%) | 2.62 |
Median Household Size in Wallburg
The median household size in Wallburg is 2.32 persons per household, with single male/father households (23 | 1.7%) accounting for the largest median household size of 2.96 persons per household. non-family households (296 | 22.3%) represent the smallest median household size with 1.05 persons per household.
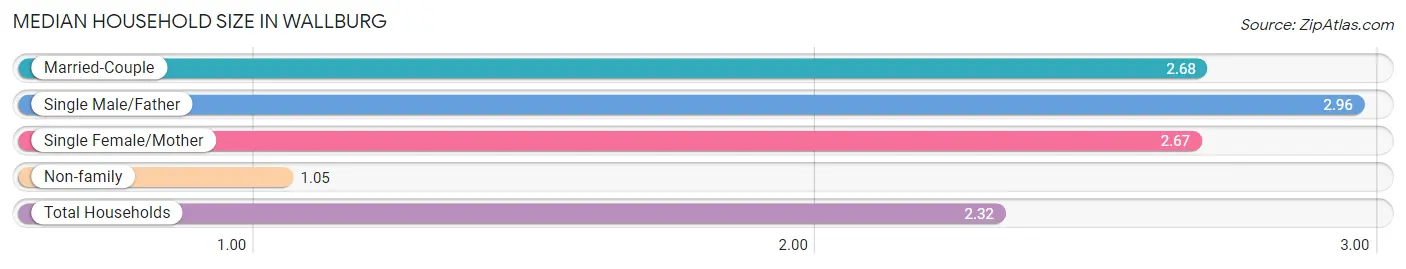
| Household Type | # Households | Household Size |
| Married-Couple | 867 (65.3%) | 2.68 |
| Single Male/Father | 23 (1.7%) | 2.96 |
| Single Female/Mother | 142 (10.7%) | 2.67 |
| Non-family | 296 (22.3%) | 1.05 |
| Total Households | 1,328 (100.0%) | 2.32 |
Household Size by Marriage Status in Wallburg
Out of a total of 1,328 households in Wallburg, 1,032 (77.7%) are family households, while 296 (22.3%) are nonfamily households. The most numerous type of family households are 2-person households, comprising 625, and the most common type of nonfamily households are 1-person households, comprising 278.
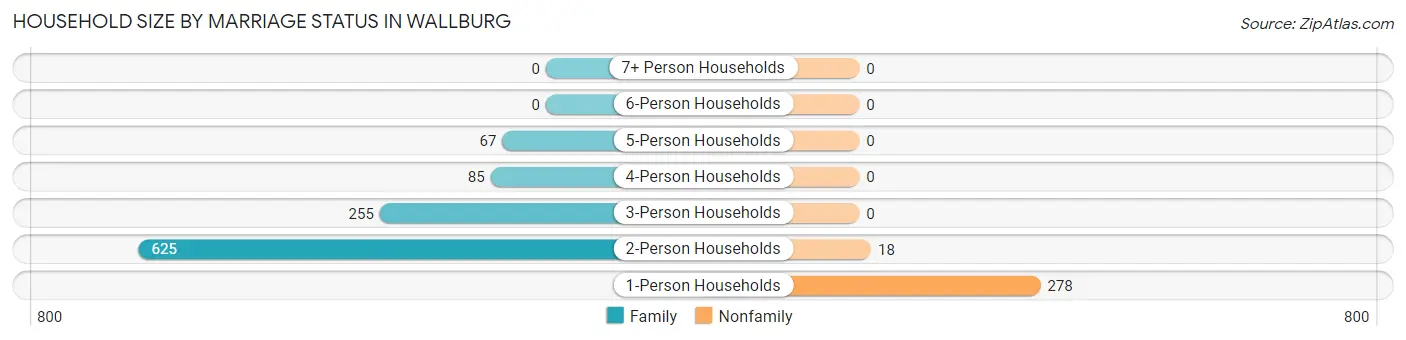
| Household Size | Family Households | Nonfamily Households |
| 1-Person Households | - | 278 (20.9%) |
| 2-Person Households | 625 (47.1%) | 18 (1.4%) |
| 3-Person Households | 255 (19.2%) | 0 (0.0%) |
| 4-Person Households | 85 (6.4%) | 0 (0.0%) |
| 5-Person Households | 67 (5.1%) | 0 (0.0%) |
| 6-Person Households | 0 (0.0%) | 0 (0.0%) |
| 7+ Person Households | 0 (0.0%) | 0 (0.0%) |
| Total | 1,032 (77.7%) | 296 (22.3%) |
Female Fertility in Wallburg
Fertility by Age in Wallburg
Average fertility rate in Wallburg is 30.0 births per 1,000 women. Women in the age bracket of 20 to 34 years have the highest fertility rate with 63.0 births per 1,000 women. Women in the age bracket of 20 to 34 years acount for 100.0% of all women with births.
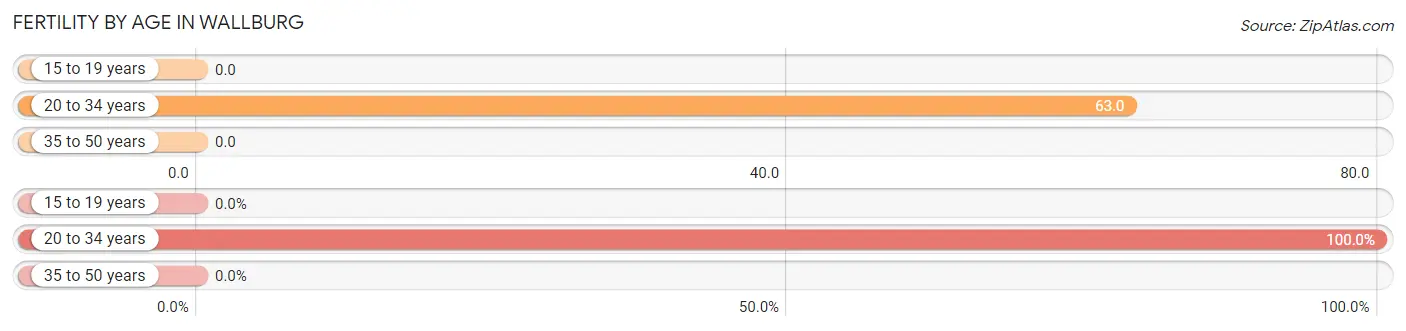
| Age Bracket | Women with Births | Births / 1,000 Women |
| 15 to 19 years | 0 (0.0%) | 0.0 |
| 20 to 34 years | 17 (100.0%) | 63.0 |
| 35 to 50 years | 0 (0.0%) | 0.0 |
| Total | 17 (100.0%) | 30.0 |
Fertility by Age by Marriage Status in Wallburg
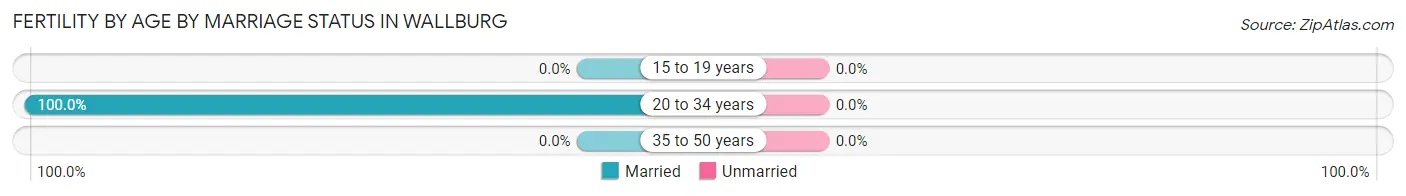
| Age Bracket | Married | Unmarried |
| 15 to 19 years | 0 (0.0%) | 0 (0.0%) |
| 20 to 34 years | 17 (100.0%) | 0 (0.0%) |
| 35 to 50 years | 0 (0.0%) | 0 (0.0%) |
| Total | 17 (100.0%) | 0 (0.0%) |
Fertility by Education in Wallburg
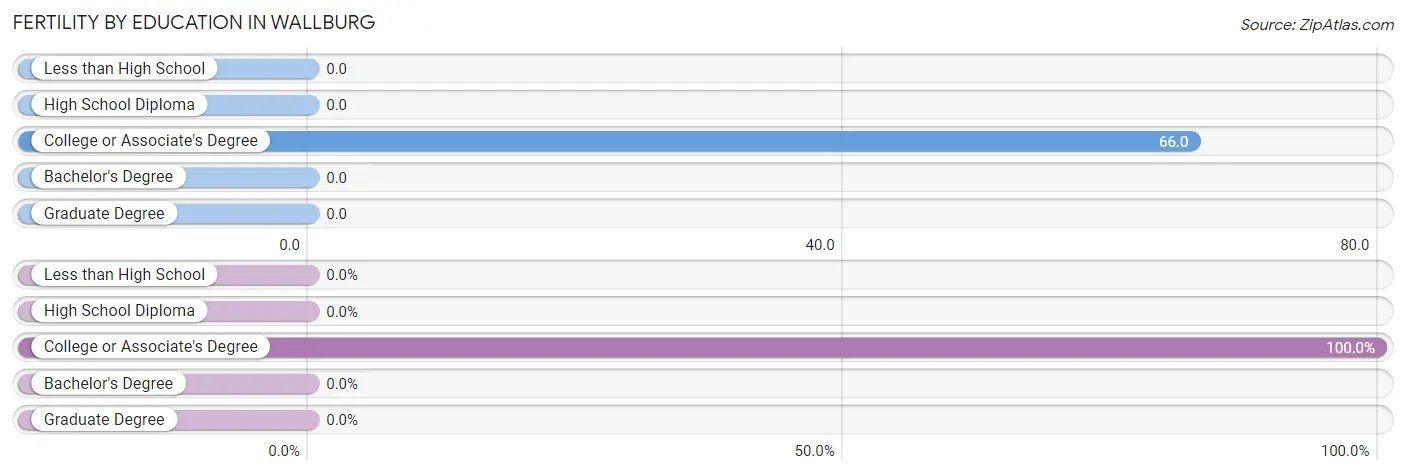
| Educational Attainment | Women with Births | Births / 1,000 Women |
| Less than High School | 0 (0.0%) | 0.0 |
| High School Diploma | 0 (0.0%) | 0.0 |
| College or Associate's Degree | 17 (100.0%) | 66.0 |
| Bachelor's Degree | 0 (0.0%) | 0.0 |
| Graduate Degree | 0 (0.0%) | 0.0 |
| Total | 17 (100.0%) | 30.0 |
Fertility by Education by Marriage Status in Wallburg
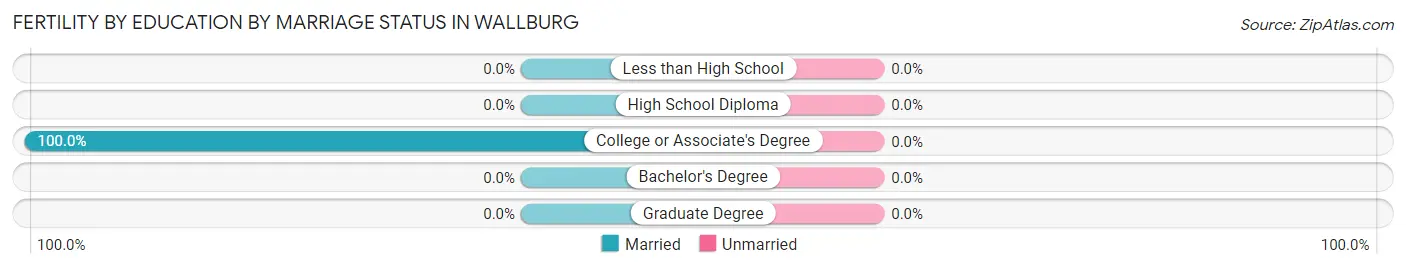
| Educational Attainment | Married | Unmarried |
| Less than High School | 0 (0.0%) | 0 (0.0%) |
| High School Diploma | 0 (0.0%) | 0 (0.0%) |
| College or Associate's Degree | 17 (100.0%) | 0 (0.0%) |
| Bachelor's Degree | 0 (0.0%) | 0 (0.0%) |
| Graduate Degree | 0 (0.0%) | 0 (0.0%) |
| Total | 17 (100.0%) | 0 (0.0%) |
Income in Wallburg
Income Overview in Wallburg
Per Capita Income in Wallburg is $40,645, while median incomes of families and households are $92,619 and $80,592 respectively.
| Characteristic | Number | Measure |
| Per Capita Income | 3,081 | $40,645 |
| Median Family Income | 1,032 | $92,619 |
| Mean Family Income | 1,032 | $106,088 |
| Median Household Income | 1,328 | $80,592 |
| Mean Household Income | 1,328 | $93,632 |
| Income Deficit | 1,032 | $0 |
| Wage / Income Gap (%) | 3,081 | 38.75% |
| Wage / Income Gap ($) | 3,081 | 61.25¢ per $1 |
| Gini / Inequality Index | 3,081 | 0.40 |
Earnings by Sex in Wallburg
Average Earnings in Wallburg are $44,482, $56,184 for men and $34,414 for women, a difference of 38.8%.
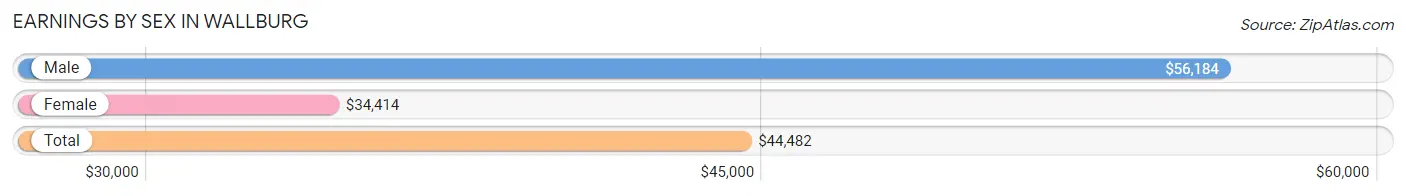
| Sex | Number | Average Earnings |
| Male | 902 (54.8%) | $56,184 |
| Female | 743 (45.2%) | $34,414 |
| Total | 1,645 (100.0%) | $44,482 |
Earnings by Sex by Income Bracket in Wallburg
The most common earnings brackets in Wallburg are $75,000 to $99,999 for men (130 | 14.4%) and $12,500 to $14,999 for women (121 | 16.3%).
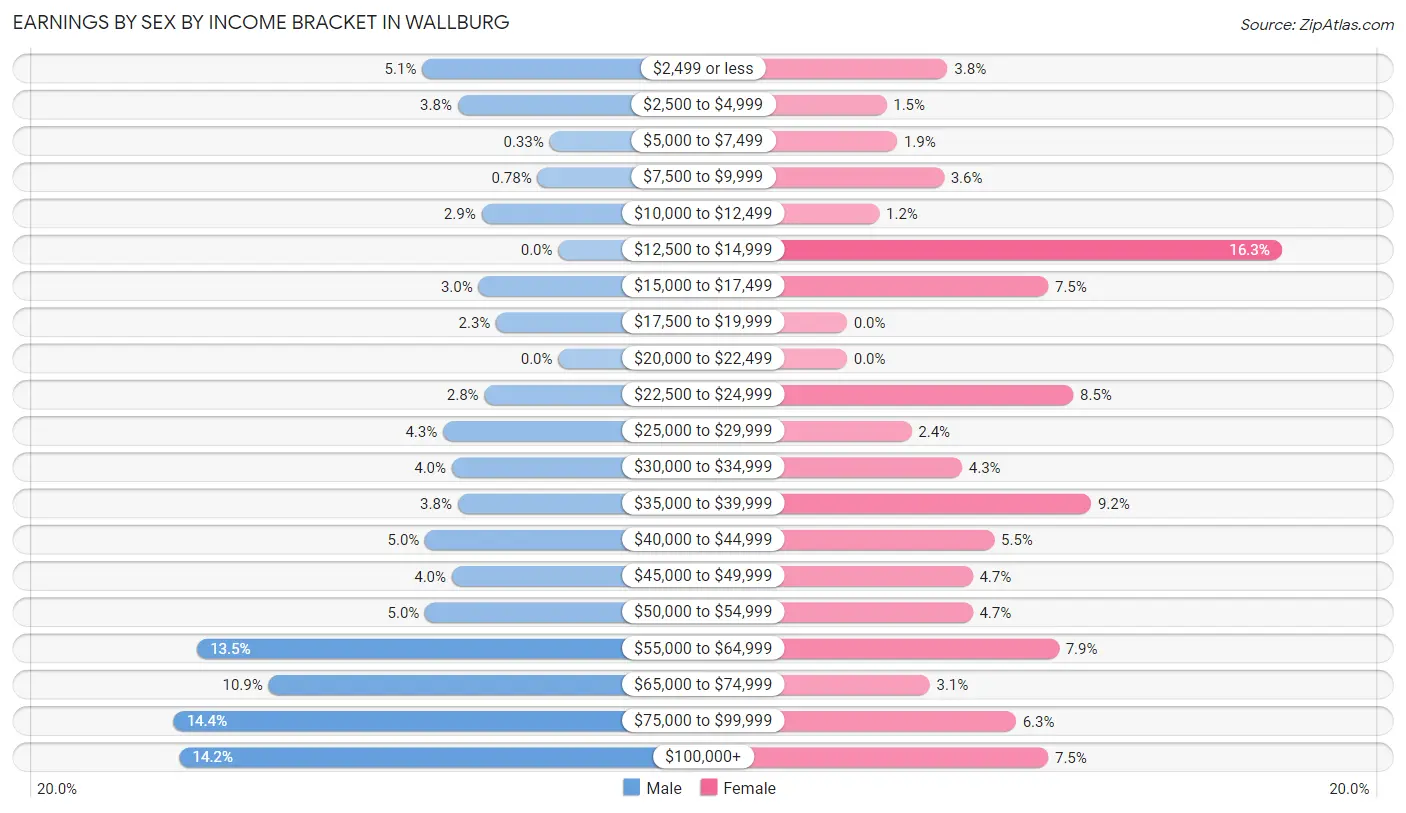
| Income | Male | Female |
| $2,499 or less | 46 (5.1%) | 28 (3.8%) |
| $2,500 to $4,999 | 34 (3.8%) | 11 (1.5%) |
| $5,000 to $7,499 | 3 (0.3%) | 14 (1.9%) |
| $7,500 to $9,999 | 7 (0.8%) | 27 (3.6%) |
| $10,000 to $12,499 | 26 (2.9%) | 9 (1.2%) |
| $12,500 to $14,999 | 0 (0.0%) | 121 (16.3%) |
| $15,000 to $17,499 | 27 (3.0%) | 56 (7.5%) |
| $17,500 to $19,999 | 21 (2.3%) | 0 (0.0%) |
| $20,000 to $22,499 | 0 (0.0%) | 0 (0.0%) |
| $22,500 to $24,999 | 25 (2.8%) | 63 (8.5%) |
| $25,000 to $29,999 | 39 (4.3%) | 18 (2.4%) |
| $30,000 to $34,999 | 36 (4.0%) | 32 (4.3%) |
| $35,000 to $39,999 | 34 (3.8%) | 68 (9.1%) |
| $40,000 to $44,999 | 45 (5.0%) | 41 (5.5%) |
| $45,000 to $49,999 | 36 (4.0%) | 35 (4.7%) |
| $50,000 to $54,999 | 45 (5.0%) | 35 (4.7%) |
| $55,000 to $64,999 | 122 (13.5%) | 59 (7.9%) |
| $65,000 to $74,999 | 98 (10.9%) | 23 (3.1%) |
| $75,000 to $99,999 | 130 (14.4%) | 47 (6.3%) |
| $100,000+ | 128 (14.2%) | 56 (7.5%) |
| Total | 902 (100.0%) | 743 (100.0%) |
Earnings by Sex by Educational Attainment in Wallburg
Average earnings in Wallburg are $57,563 for men and $37,401 for women, a difference of 35.0%. Men with an educational attainment of bachelor's degree enjoy the highest average annual earnings of $78,009, while those with high school diploma education earn the least with $42,212. Women with an educational attainment of high school diploma earn the most with the average annual earnings of $45,272, while those with college or associate's degree education have the smallest earnings of $37,875.
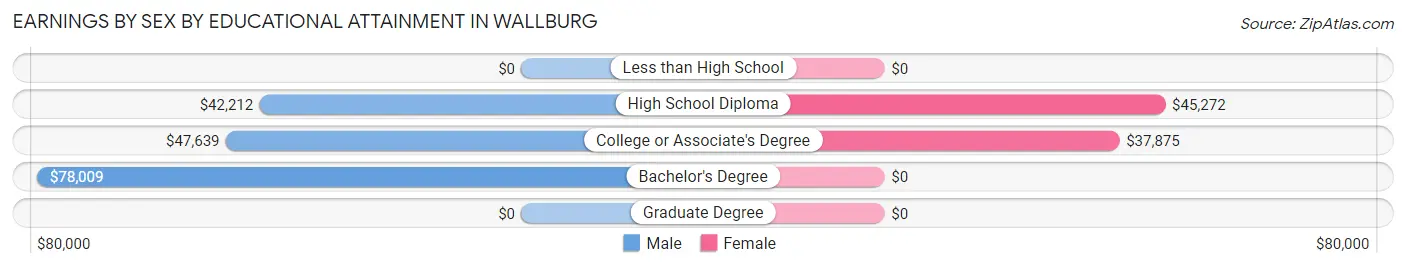
| Educational Attainment | Male Income | Female Income |
| Less than High School | - | - |
| High School Diploma | $42,212 | $45,272 |
| College or Associate's Degree | $47,639 | $37,875 |
| Bachelor's Degree | $78,009 | $0 |
| Graduate Degree | - | - |
| Total | $57,563 | $37,401 |
Family Income in Wallburg
Family Income Brackets in Wallburg
According to the Wallburg family income data, there are 239 families falling into the $75,000 to $99,999 income range, which is the most common income bracket and makes up 23.2% of all families. Conversely, the less than $10,000 income bracket is the least frequent group with only 7 families (0.7%) belonging to this category.
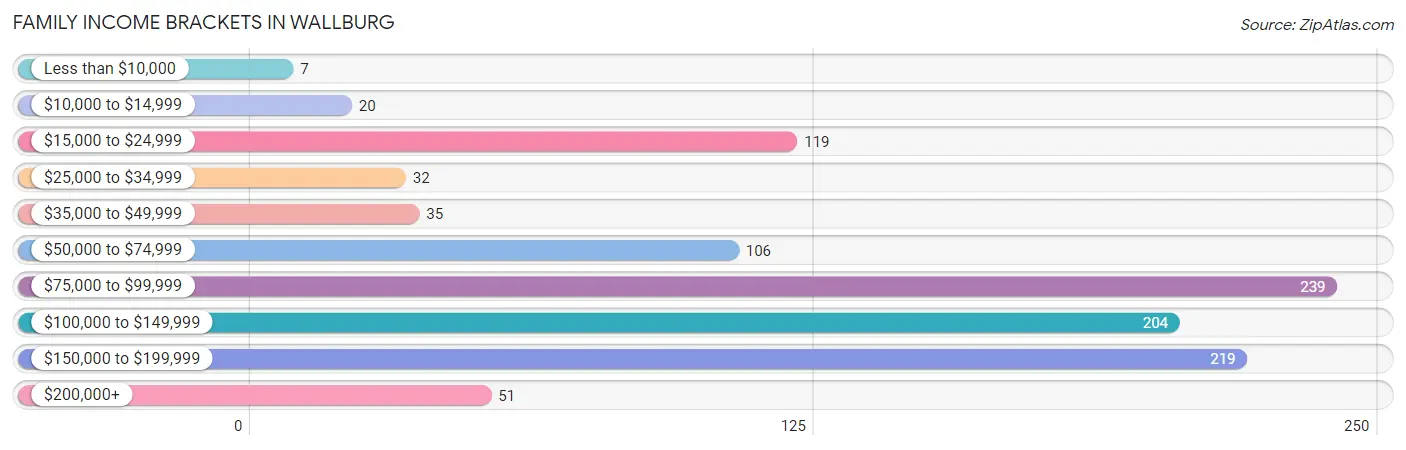
| Income Bracket | # Families | % Families |
| Less than $10,000 | 7 | 0.7% |
| $10,000 to $14,999 | 20 | 1.9% |
| $15,000 to $24,999 | 119 | 11.5% |
| $25,000 to $34,999 | 32 | 3.1% |
| $35,000 to $49,999 | 35 | 3.4% |
| $50,000 to $74,999 | 106 | 10.3% |
| $75,000 to $99,999 | 239 | 23.2% |
| $100,000 to $149,999 | 204 | 19.8% |
| $150,000 to $199,999 | 219 | 21.2% |
| $200,000+ | 51 | 4.9% |
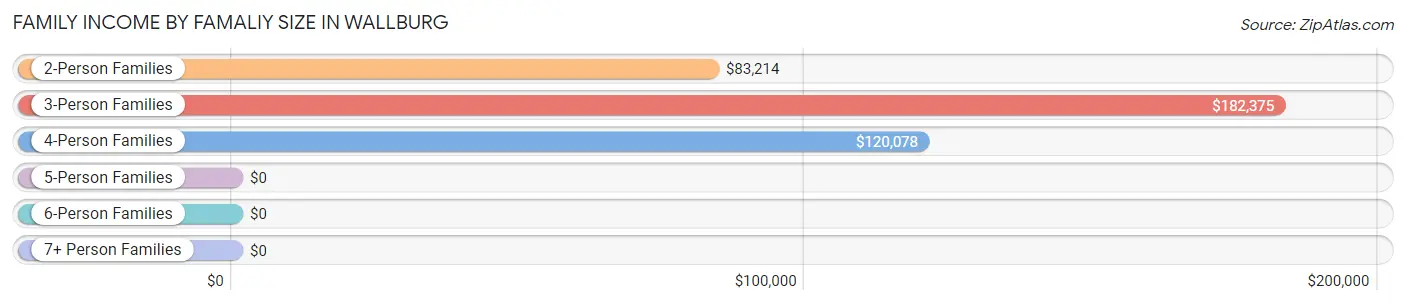
Family Income by Famaliy Size in Wallburg
3-person families (234 | 22.7%) account for the highest median family income in Wallburg with $182,375 per family, while 3-person families (234 | 22.7%) have the highest median income of $60,792 per family member.
| Income Bracket | # Families | Median Income |
| 2-Person Families | 646 (62.6%) | $83,214 |
| 3-Person Families | 234 (22.7%) | $182,375 |
| 4-Person Families | 121 (11.7%) | $120,078 |
| 5-Person Families | 31 (3.0%) | $0 |
| 6-Person Families | 0 (0.0%) | $0 |
| 7+ Person Families | 0 (0.0%) | $0 |
| Total | 1,032 (100.0%) | $92,619 |
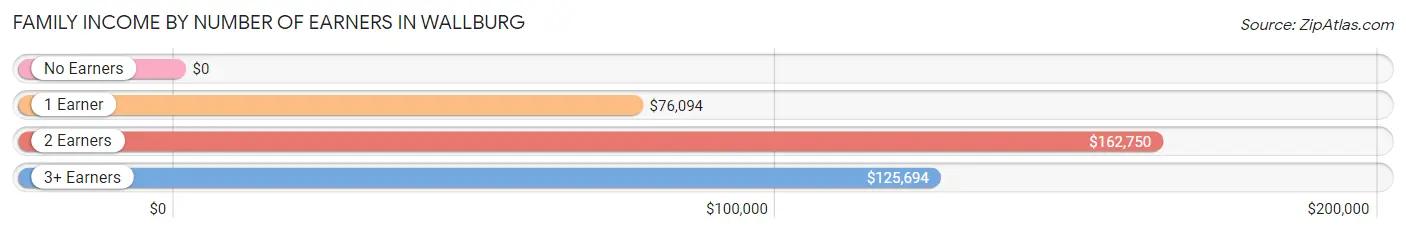
Family Income by Number of Earners in Wallburg
| Number of Earners | # Families | Median Income |
| No Earners | 262 (25.4%) | $0 |
| 1 Earner | 253 (24.5%) | $76,094 |
| 2 Earners | 465 (45.1%) | $162,750 |
| 3+ Earners | 52 (5.0%) | $125,694 |
| Total | 1,032 (100.0%) | $92,619 |
Household Income in Wallburg
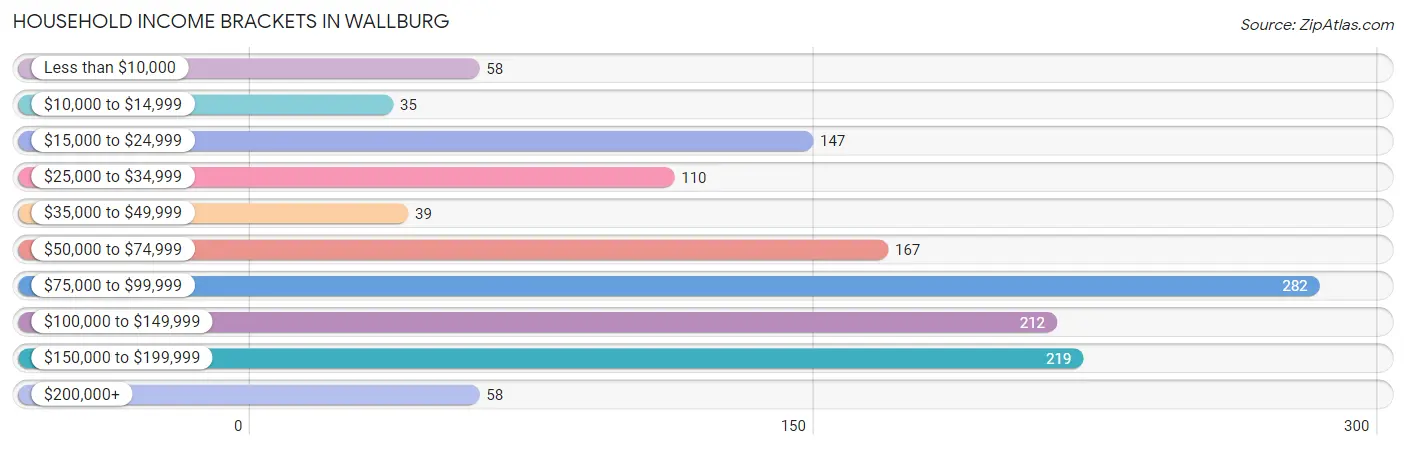
Household Income Brackets in Wallburg
With 282 households falling in the category, the $75,000 to $99,999 income range is the most frequent in Wallburg, accounting for 21.2% of all households. In contrast, only 35 households (2.6%) fall into the $10,000 to $14,999 income bracket, making it the least populous group.
| Income Bracket | # Households | % Households |
| Less than $10,000 | 58 | 4.4% |
| $10,000 to $14,999 | 35 | 2.6% |
| $15,000 to $24,999 | 147 | 11.1% |
| $25,000 to $34,999 | 110 | 8.3% |
| $35,000 to $49,999 | 39 | 2.9% |
| $50,000 to $74,999 | 167 | 12.6% |
| $75,000 to $99,999 | 282 | 21.2% |
| $100,000 to $149,999 | 212 | 16.0% |
| $150,000 to $199,999 | 219 | 16.5% |
| $200,000+ | 58 | 4.4% |
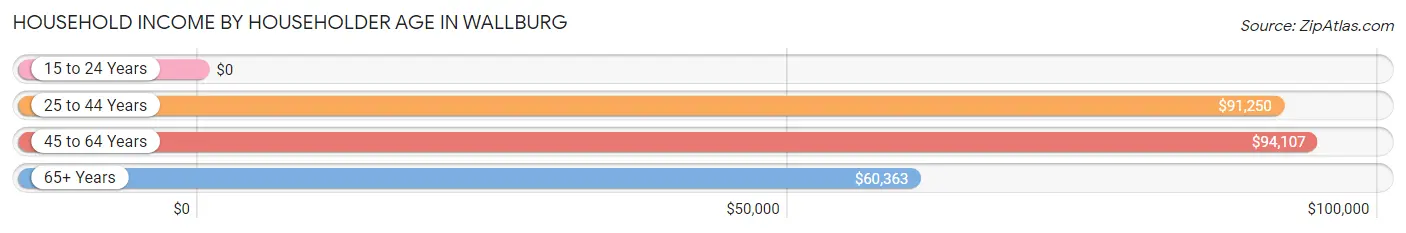
Household Income by Householder Age in Wallburg
The median household income in Wallburg is $80,592, with the highest median household income of $94,107 found in the 45 to 64 years age bracket for the primary householder. A total of 624 households (47.0%) fall into this category. Meanwhile, the 15 to 24 years age bracket for the primary householder has the lowest median household income of $0, with 21 households (1.6%) in this group.
| Income Bracket | # Households | Median Income |
| 15 to 24 Years | 21 (1.6%) | $0 |
| 25 to 44 Years | 182 (13.7%) | $91,250 |
| 45 to 64 Years | 624 (47.0%) | $94,107 |
| 65+ Years | 501 (37.7%) | $60,363 |
| Total | 1,328 (100.0%) | $80,592 |
Poverty in Wallburg
Income Below Poverty by Sex and Age in Wallburg
With 9.9% poverty level for males and 8.7% for females among the residents of Wallburg, 18 to 24 year old males and 15 year old females are the most vulnerable to poverty, with 23 males (34.3%) and 9 females (100.0%) in their respective age groups living below the poverty level.
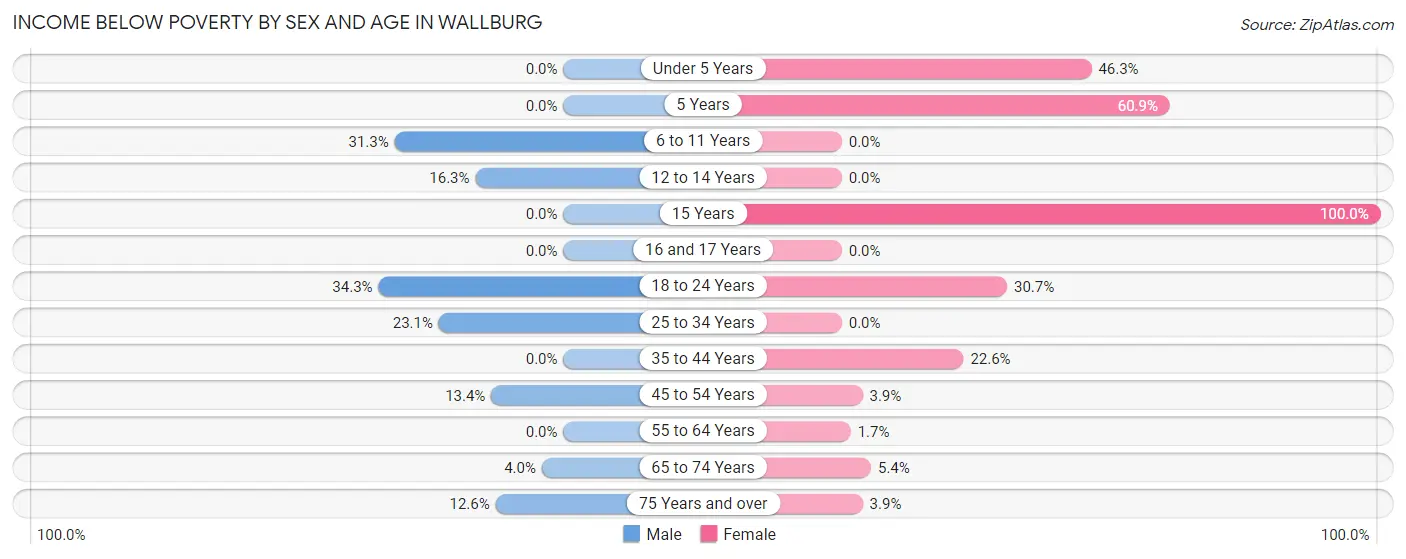
| Age Bracket | Male | Female |
| Under 5 Years | 0 (0.0%) | 19 (46.3%) |
| 5 Years | 0 (0.0%) | 14 (60.9%) |
| 6 to 11 Years | 21 (31.3%) | 0 (0.0%) |
| 12 to 14 Years | 8 (16.3%) | 0 (0.0%) |
| 15 Years | 0 (0.0%) | 9 (100.0%) |
| 16 and 17 Years | 0 (0.0%) | 0 (0.0%) |
| 18 to 24 Years | 23 (34.3%) | 27 (30.7%) |
| 25 to 34 Years | 46 (23.1%) | 0 (0.0%) |
| 35 to 44 Years | 0 (0.0%) | 28 (22.6%) |
| 45 to 54 Years | 32 (13.4%) | 7 (3.8%) |
| 55 to 64 Years | 0 (0.0%) | 6 (1.7%) |
| 65 to 74 Years | 7 (4.0%) | 15 (5.4%) |
| 75 Years and over | 18 (12.6%) | 6 (3.9%) |
| Total | 155 (9.9%) | 131 (8.7%) |
Income Above Poverty by Sex and Age in Wallburg
According to the poverty statistics in Wallburg, males aged under 5 years and females aged 6 to 11 years are the age groups that are most secure financially, with 100.0% of males and 100.0% of females in these age groups living above the poverty line.
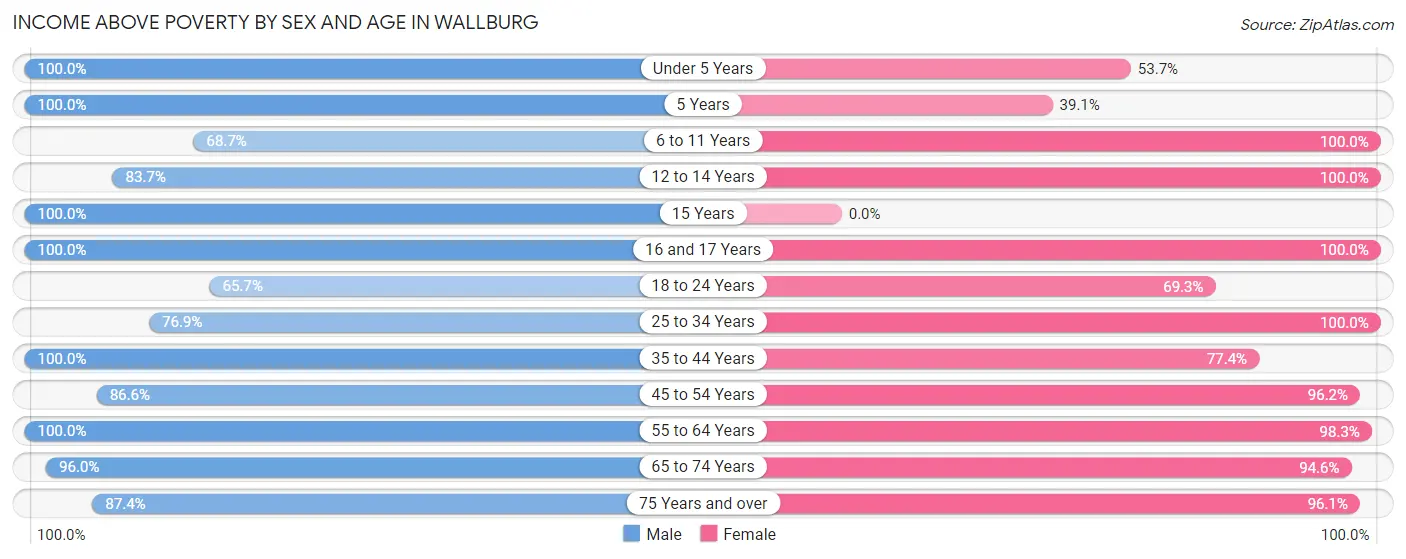
| Age Bracket | Male | Female |
| Under 5 Years | 26 (100.0%) | 22 (53.7%) |
| 5 Years | 37 (100.0%) | 9 (39.1%) |
| 6 to 11 Years | 46 (68.7%) | 17 (100.0%) |
| 12 to 14 Years | 41 (83.7%) | 36 (100.0%) |
| 15 Years | 24 (100.0%) | 0 (0.0%) |
| 16 and 17 Years | 10 (100.0%) | 15 (100.0%) |
| 18 to 24 Years | 44 (65.7%) | 61 (69.3%) |
| 25 to 34 Years | 153 (76.9%) | 182 (100.0%) |
| 35 to 44 Years | 119 (100.0%) | 96 (77.4%) |
| 45 to 54 Years | 207 (86.6%) | 175 (96.2%) |
| 55 to 64 Years | 416 (100.0%) | 356 (98.3%) |
| 65 to 74 Years | 168 (96.0%) | 261 (94.6%) |
| 75 Years and over | 125 (87.4%) | 149 (96.1%) |
| Total | 1,416 (90.1%) | 1,379 (91.3%) |
Income Below Poverty Among Married-Couple Families in Wallburg
The poverty statistics for married-couple families in Wallburg show that 4.0% or 35 of the total 867 families live below the poverty line. Families with 3 or 4 children have the highest poverty rate of 45.2%, comprising of 14 families. On the other hand, families with no children have the lowest poverty rate of 2.0%, which includes 14 families.
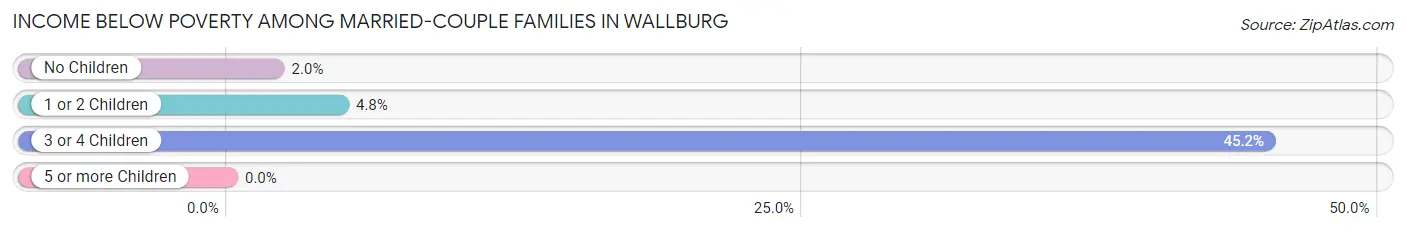
| Children | Above Poverty | Below Poverty |
| No Children | 677 (98.0%) | 14 (2.0%) |
| 1 or 2 Children | 138 (95.2%) | 7 (4.8%) |
| 3 or 4 Children | 17 (54.8%) | 14 (45.2%) |
| 5 or more Children | 0 (0.0%) | 0 (0.0%) |
| Total | 832 (96.0%) | 35 (4.0%) |
Income Below Poverty Among Single-Parent Households in Wallburg
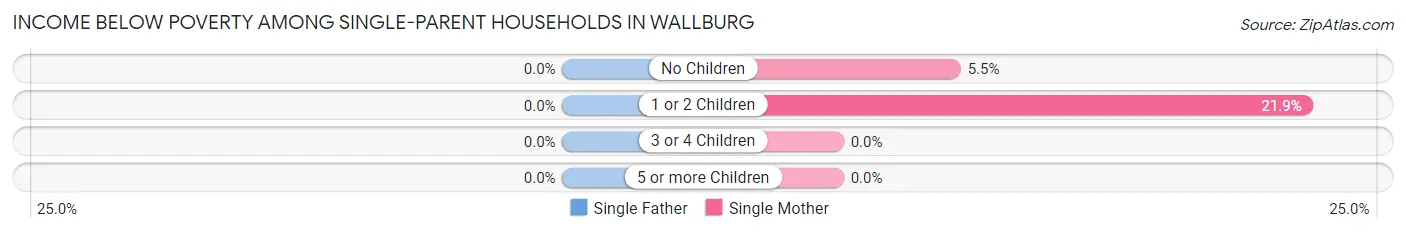
| Children | Single Father | Single Mother |
| No Children | 0 (0.0%) | 6 (5.4%) |
| 1 or 2 Children | 0 (0.0%) | 7 (21.9%) |
| 3 or 4 Children | 0 (0.0%) | 0 (0.0%) |
| 5 or more Children | 0 (0.0%) | 0 (0.0%) |
| Total | 0 (0.0%) | 13 (9.1%) |
Income Below Poverty Among Married-Couple vs Single-Parent Households in Wallburg
The poverty data for Wallburg shows that 35 of the married-couple family households (4.0%) and 13 of the single-parent households (7.9%) are living below the poverty level. Within the married-couple family households, those with 3 or 4 children have the highest poverty rate, with 14 households (45.2%) falling below the poverty line. Among the single-parent households, those with 1 or 2 children have the highest poverty rate, with 7 household (21.9%) living below poverty.
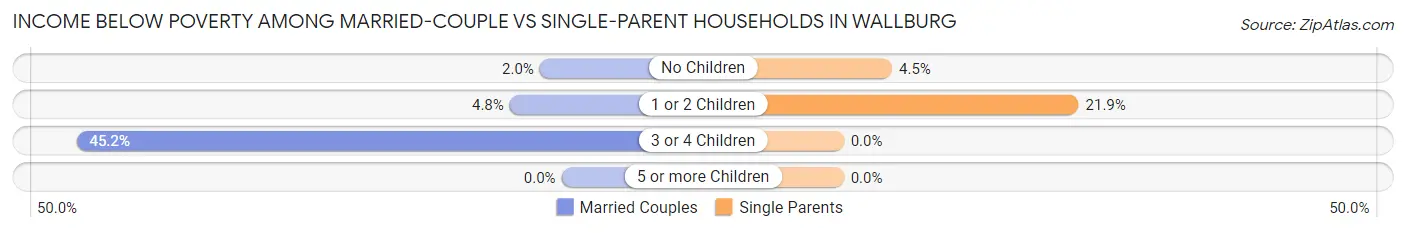
| Children | Married-Couple Families | Single-Parent Households |
| No Children | 14 (2.0%) | 6 (4.5%) |
| 1 or 2 Children | 7 (4.8%) | 7 (21.9%) |
| 3 or 4 Children | 14 (45.2%) | 0 (0.0%) |
| 5 or more Children | 0 (0.0%) | 0 (0.0%) |
| Total | 35 (4.0%) | 13 (7.9%) |
Employment Characteristics in Wallburg
Employment by Class of Employer in Wallburg
Among the 1,505 employed individuals in Wallburg, private company employees (1,022 | 67.9%), not-for-profit organizations (157 | 10.4%), and local government employees (110 | 7.3%) make up the most common classes of employment.
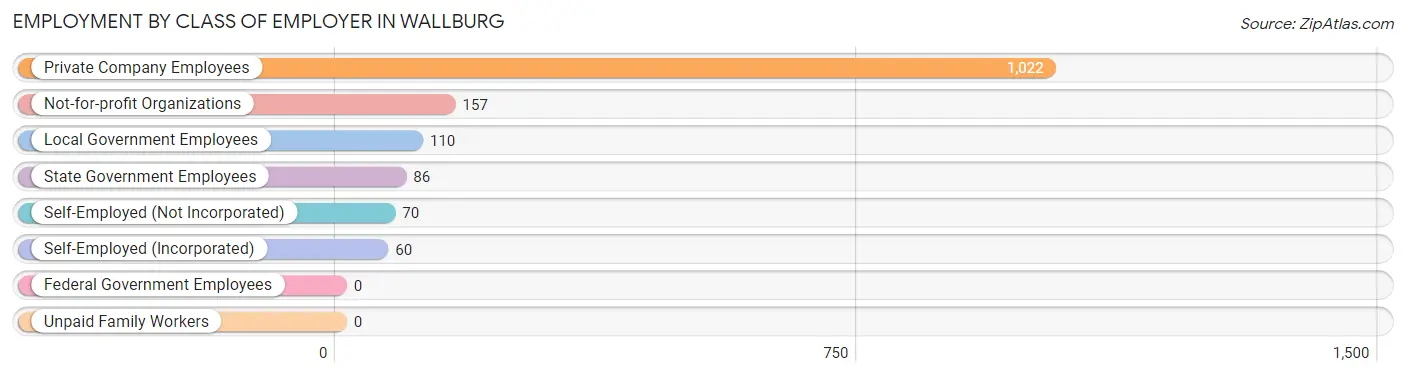
| Employer Class | # Employees | % Employees |
| Private Company Employees | 1,022 | 67.9% |
| Self-Employed (Incorporated) | 60 | 4.0% |
| Self-Employed (Not Incorporated) | 70 | 4.6% |
| Not-for-profit Organizations | 157 | 10.4% |
| Local Government Employees | 110 | 7.3% |
| State Government Employees | 86 | 5.7% |
| Federal Government Employees | 0 | 0.0% |
| Unpaid Family Workers | 0 | 0.0% |
| Total | 1,505 | 100.0% |
Employment Status by Age in Wallburg
According to the labor force statistics for Wallburg, out of the total population over 16 years of age (2,752), 59.6% or 1,640 individuals are in the labor force, with 8.2% or 134 of them unemployed. The age group with the highest labor force participation rate is 20 to 24 years, with 100.0% or 114 individuals in the labor force. Within the labor force, the 25 to 29 years age range has the highest percentage of unemployed individuals, with 45.0% or 94 of them being unemployed.
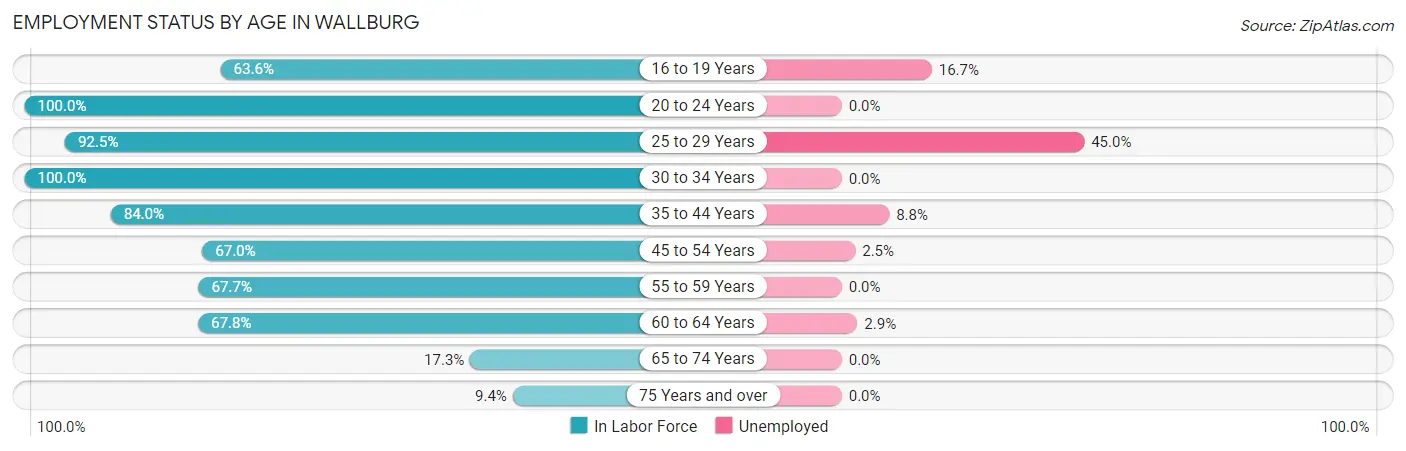
| Age Bracket | In Labor Force | Unemployed |
| 16 to 19 Years | 42 (63.6%) | 7 (16.7%) |
| 20 to 24 Years | 114 (100.0%) | 0 (0.0%) |
| 25 to 29 Years | 209 (92.5%) | 94 (45.0%) |
| 30 to 34 Years | 155 (100.0%) | 0 (0.0%) |
| 35 to 44 Years | 204 (84.0%) | 18 (8.8%) |
| 45 to 54 Years | 282 (67.0%) | 7 (2.5%) |
| 55 to 59 Years | 247 (67.7%) | 0 (0.0%) |
| 60 to 64 Years | 280 (67.8%) | 8 (2.9%) |
| 65 to 74 Years | 78 (17.3%) | 0 (0.0%) |
| 75 Years and over | 28 (9.4%) | 0 (0.0%) |
| Total | 1,640 (59.6%) | 134 (8.2%) |
Employment Status by Educational Attainment in Wallburg
According to labor force statistics for Wallburg, 75.5% of individuals (1,376) out of the total population between 25 and 64 years of age (1,823) are in the labor force, with 9.2% or 127 of them being unemployed. The group with the highest labor force participation rate are those with the educational attainment of college / associate degree, with 78.4% or 461 individuals in the labor force. Within the labor force, individuals with bachelor's degree or higher education have the highest percentage of unemployment, with 17.6% or 94 of them being unemployed.
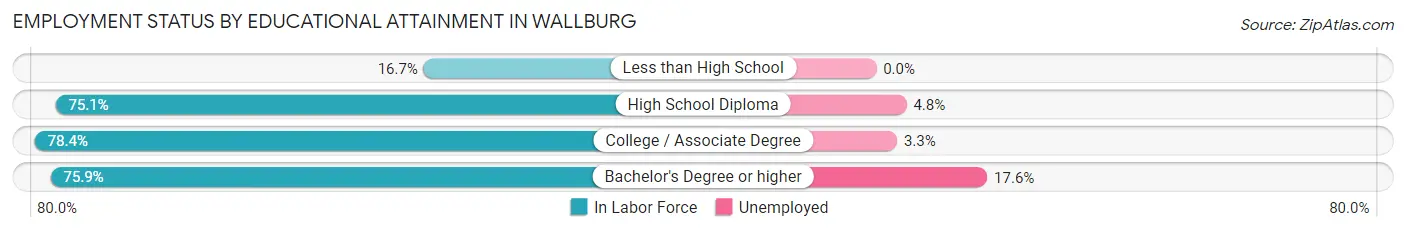
| Educational Attainment | In Labor Force | Unemployed |
| Less than High School | 5 (16.7%) | 0 (0.0%) |
| High School Diploma | 378 (75.1%) | 24 (4.8%) |
| College / Associate Degree | 461 (78.4%) | 19 (3.3%) |
| Bachelor's Degree or higher | 533 (75.9%) | 124 (17.6%) |
| Total | 1,376 (75.5%) | 168 (9.2%) |
Employment Occupations by Sex in Wallburg
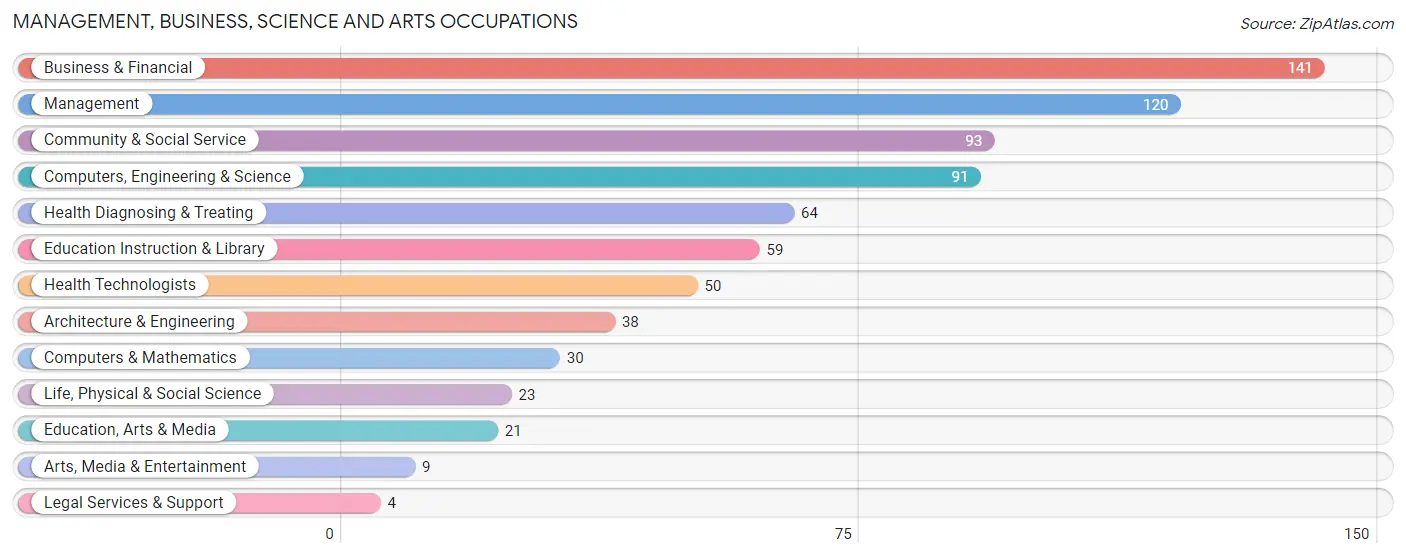
Management, Business, Science and Arts Occupations
The most common Management, Business, Science and Arts occupations in Wallburg are Business & Financial (141 | 9.4%), Management (120 | 8.0%), Community & Social Service (93 | 6.2%), Computers, Engineering & Science (91 | 6.0%), and Health Diagnosing & Treating (64 | 4.3%).
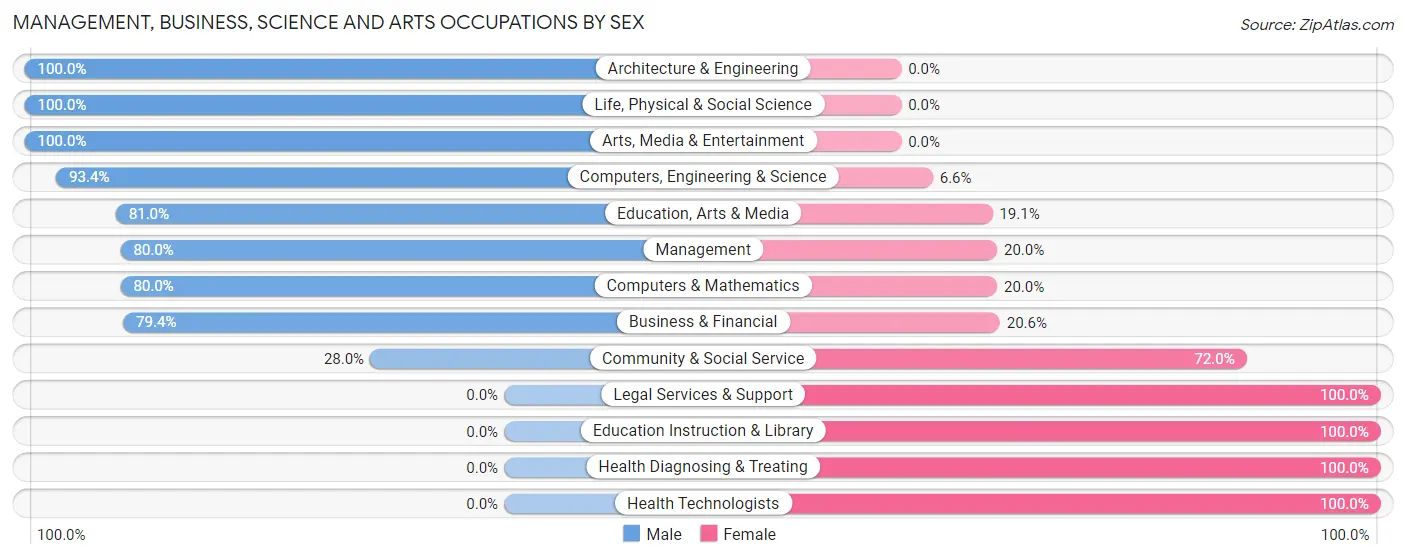
Management, Business, Science and Arts Occupations by Sex
Within the Management, Business, Science and Arts occupations in Wallburg, the most male-oriented occupations are Architecture & Engineering (100.0%), Life, Physical & Social Science (100.0%), and Arts, Media & Entertainment (100.0%), while the most female-oriented occupations are Legal Services & Support (100.0%), Education Instruction & Library (100.0%), and Health Diagnosing & Treating (100.0%).
| Occupation | Male | Female |
| Management | 96 (80.0%) | 24 (20.0%) |
| Business & Financial | 112 (79.4%) | 29 (20.6%) |
| Computers, Engineering & Science | 85 (93.4%) | 6 (6.6%) |
| Computers & Mathematics | 24 (80.0%) | 6 (20.0%) |
| Architecture & Engineering | 38 (100.0%) | 0 (0.0%) |
| Life, Physical & Social Science | 23 (100.0%) | 0 (0.0%) |
| Community & Social Service | 26 (28.0%) | 67 (72.0%) |
| Education, Arts & Media | 17 (80.9%) | 4 (19.1%) |
| Legal Services & Support | 0 (0.0%) | 4 (100.0%) |
| Education Instruction & Library | 0 (0.0%) | 59 (100.0%) |
| Arts, Media & Entertainment | 9 (100.0%) | 0 (0.0%) |
| Health Diagnosing & Treating | 0 (0.0%) | 64 (100.0%) |
| Health Technologists | 0 (0.0%) | 50 (100.0%) |
| Total (Category) | 319 (62.7%) | 190 (37.3%) |
| Total (Overall) | 881 (58.5%) | 624 (41.5%) |
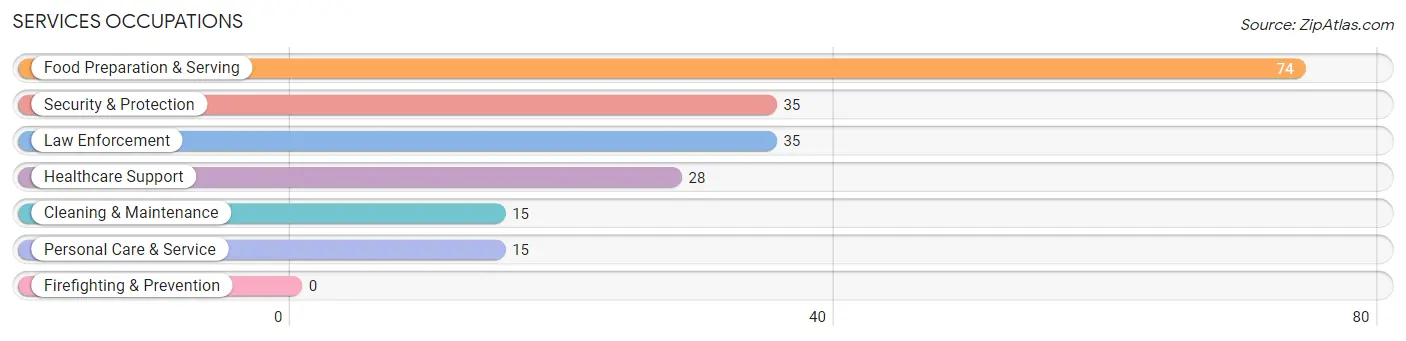
Services Occupations
The most common Services occupations in Wallburg are Food Preparation & Serving (74 | 4.9%), Security & Protection (35 | 2.3%), Law Enforcement (35 | 2.3%), Healthcare Support (28 | 1.9%), and Cleaning & Maintenance (15 | 1.0%).
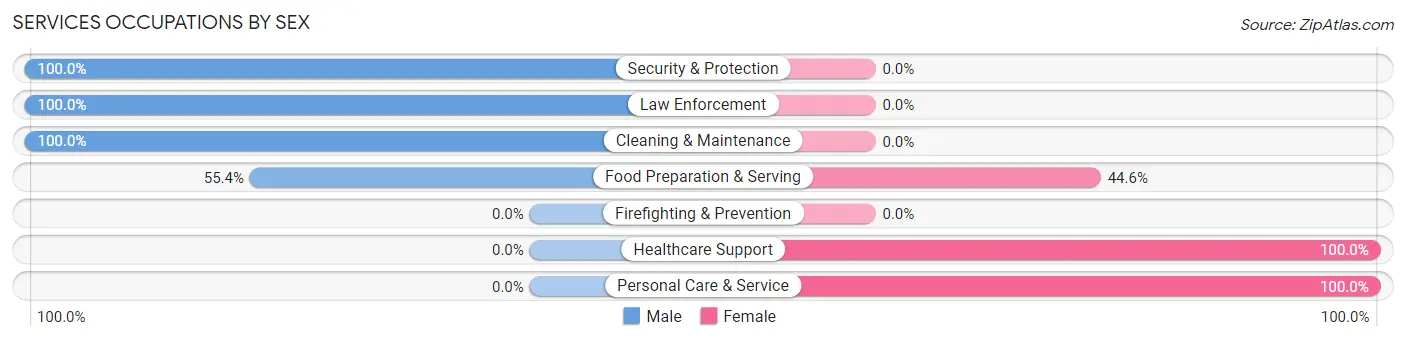
Services Occupations by Sex
Within the Services occupations in Wallburg, the most male-oriented occupations are Security & Protection (100.0%), Law Enforcement (100.0%), and Cleaning & Maintenance (100.0%), while the most female-oriented occupations are Healthcare Support (100.0%), Personal Care & Service (100.0%), and Food Preparation & Serving (44.6%).
| Occupation | Male | Female |
| Healthcare Support | 0 (0.0%) | 28 (100.0%) |
| Security & Protection | 35 (100.0%) | 0 (0.0%) |
| Firefighting & Prevention | 0 (0.0%) | 0 (0.0%) |
| Law Enforcement | 35 (100.0%) | 0 (0.0%) |
| Food Preparation & Serving | 41 (55.4%) | 33 (44.6%) |
| Cleaning & Maintenance | 15 (100.0%) | 0 (0.0%) |
| Personal Care & Service | 0 (0.0%) | 15 (100.0%) |
| Total (Category) | 91 (54.5%) | 76 (45.5%) |
| Total (Overall) | 881 (58.5%) | 624 (41.5%) |
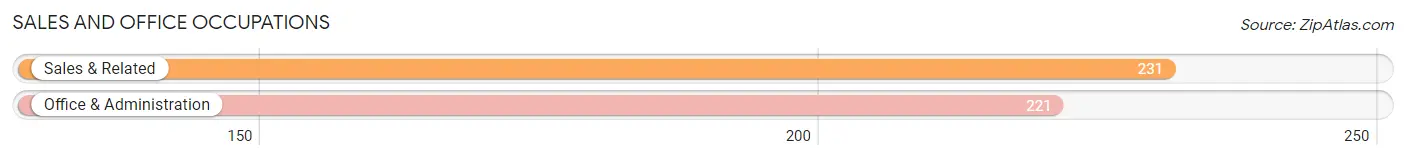
Sales and Office Occupations
The most common Sales and Office occupations in Wallburg are Sales & Related (231 | 15.3%), and Office & Administration (221 | 14.7%).
Sales and Office Occupations by Sex

| Occupation | Male | Female |
| Sales & Related | 92 (39.8%) | 139 (60.2%) |
| Office & Administration | 28 (12.7%) | 193 (87.3%) |
| Total (Category) | 120 (26.6%) | 332 (73.5%) |
| Total (Overall) | 881 (58.5%) | 624 (41.5%) |
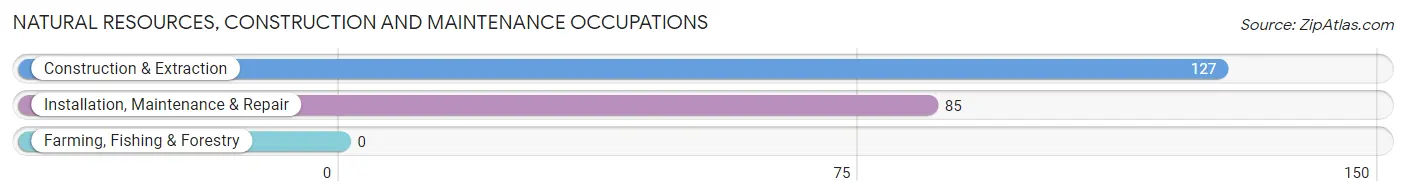
Natural Resources, Construction and Maintenance Occupations
The most common Natural Resources, Construction and Maintenance occupations in Wallburg are Construction & Extraction (127 | 8.4%), and Installation, Maintenance & Repair (85 | 5.7%).
Natural Resources, Construction and Maintenance Occupations by Sex
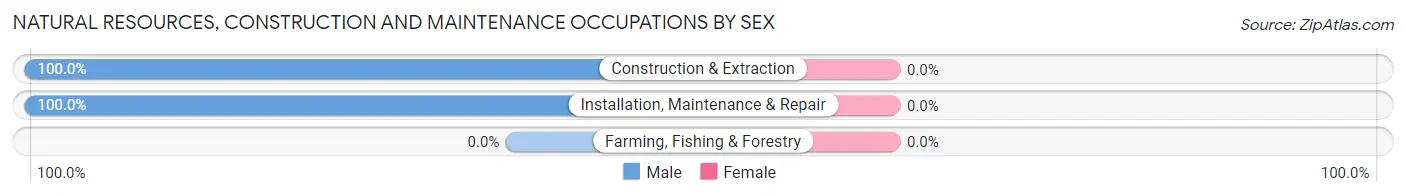
| Occupation | Male | Female |
| Farming, Fishing & Forestry | 0 (0.0%) | 0 (0.0%) |
| Construction & Extraction | 127 (100.0%) | 0 (0.0%) |
| Installation, Maintenance & Repair | 85 (100.0%) | 0 (0.0%) |
| Total (Category) | 212 (100.0%) | 0 (0.0%) |
| Total (Overall) | 881 (58.5%) | 624 (41.5%) |
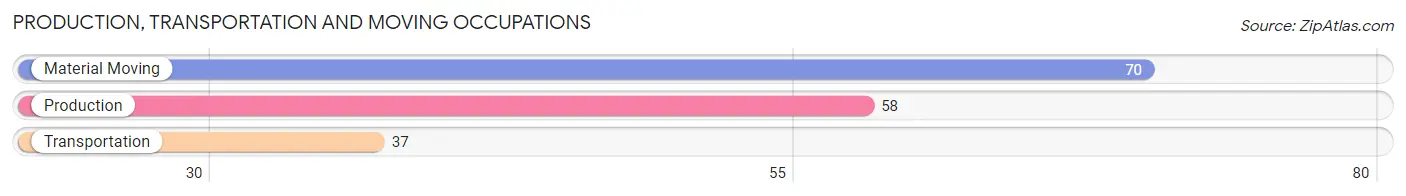
Production, Transportation and Moving Occupations
The most common Production, Transportation and Moving occupations in Wallburg are Material Moving (70 | 4.6%), Production (58 | 3.8%), and Transportation (37 | 2.5%).
Production, Transportation and Moving Occupations by Sex
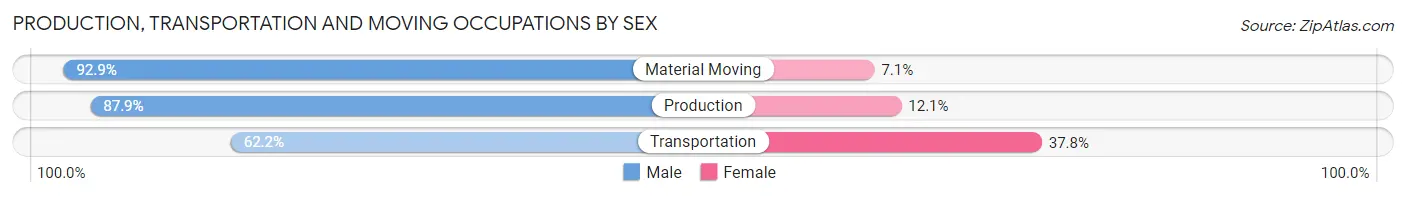
| Occupation | Male | Female |
| Production | 51 (87.9%) | 7 (12.1%) |
| Transportation | 23 (62.2%) | 14 (37.8%) |
| Material Moving | 65 (92.9%) | 5 (7.1%) |
| Total (Category) | 139 (84.2%) | 26 (15.8%) |
| Total (Overall) | 881 (58.5%) | 624 (41.5%) |
Employment Industries by Sex in Wallburg
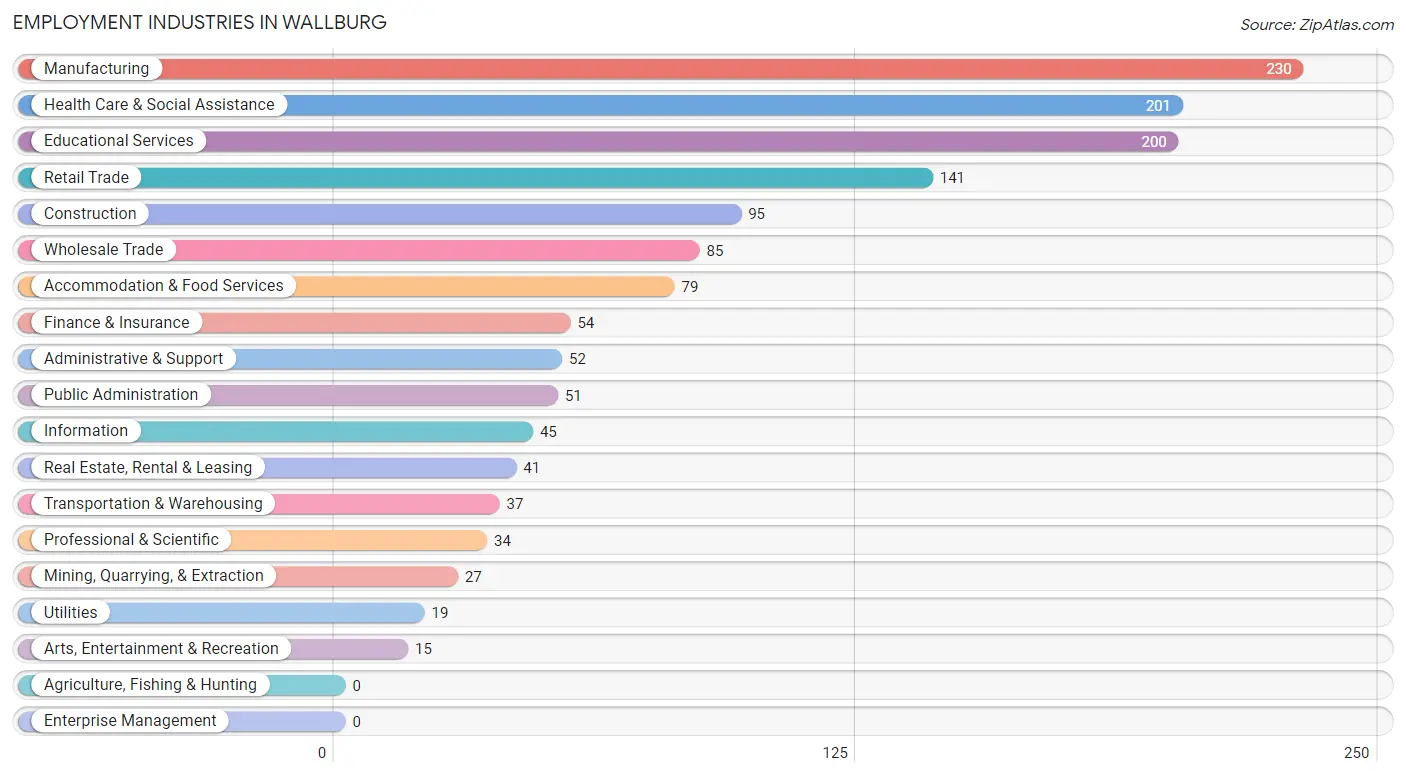
Employment Industries in Wallburg
The major employment industries in Wallburg include Manufacturing (230 | 15.3%), Health Care & Social Assistance (201 | 13.4%), Educational Services (200 | 13.3%), Retail Trade (141 | 9.4%), and Construction (95 | 6.3%).
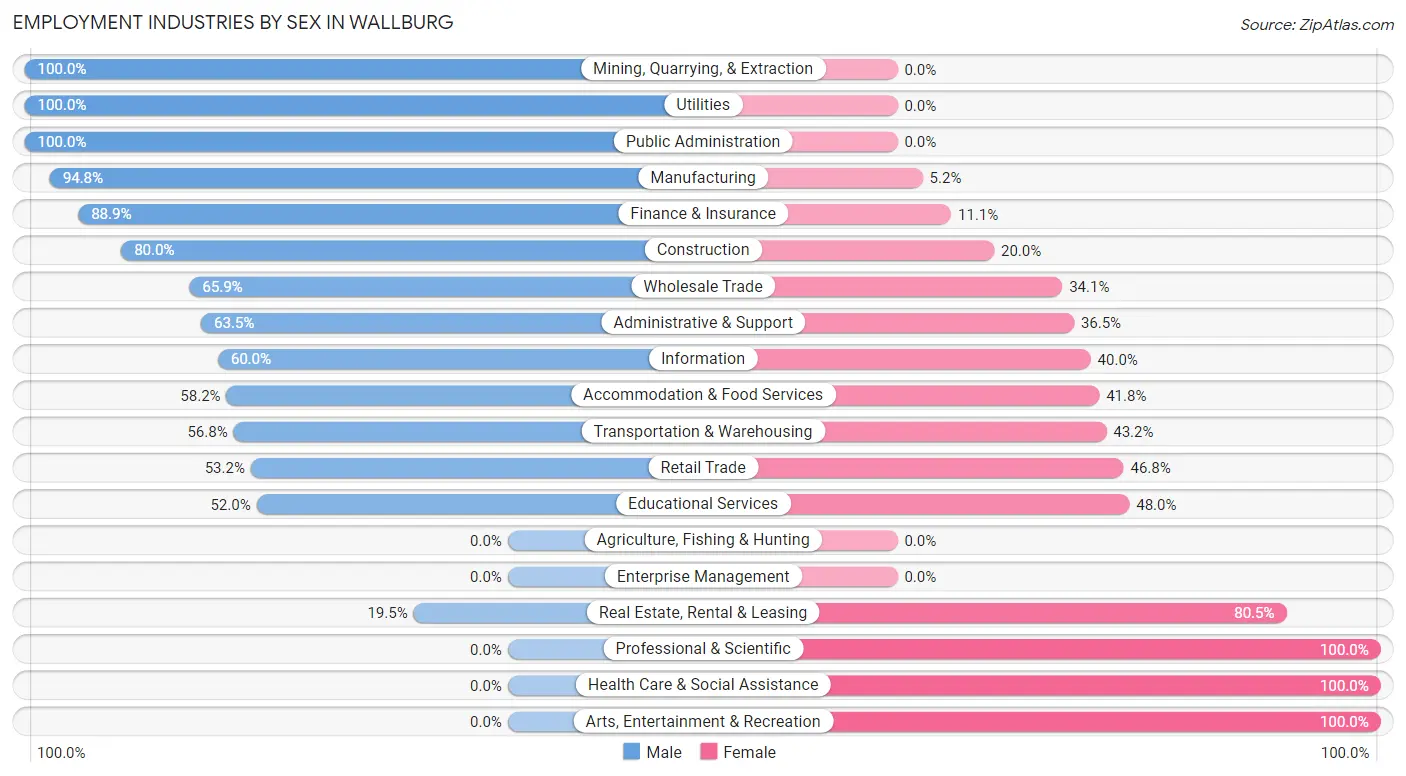
Employment Industries by Sex in Wallburg
The Wallburg industries that see more men than women are Mining, Quarrying, & Extraction (100.0%), Utilities (100.0%), and Public Administration (100.0%), whereas the industries that tend to have a higher number of women are Professional & Scientific (100.0%), Health Care & Social Assistance (100.0%), and Arts, Entertainment & Recreation (100.0%).
| Industry | Male | Female |
| Agriculture, Fishing & Hunting | 0 (0.0%) | 0 (0.0%) |
| Mining, Quarrying, & Extraction | 27 (100.0%) | 0 (0.0%) |
| Construction | 76 (80.0%) | 19 (20.0%) |
| Manufacturing | 218 (94.8%) | 12 (5.2%) |
| Wholesale Trade | 56 (65.9%) | 29 (34.1%) |
| Retail Trade | 75 (53.2%) | 66 (46.8%) |
| Transportation & Warehousing | 21 (56.8%) | 16 (43.2%) |
| Utilities | 19 (100.0%) | 0 (0.0%) |
| Information | 27 (60.0%) | 18 (40.0%) |
| Finance & Insurance | 48 (88.9%) | 6 (11.1%) |
| Real Estate, Rental & Leasing | 8 (19.5%) | 33 (80.5%) |
| Professional & Scientific | 0 (0.0%) | 34 (100.0%) |
| Enterprise Management | 0 (0.0%) | 0 (0.0%) |
| Administrative & Support | 33 (63.5%) | 19 (36.5%) |
| Educational Services | 104 (52.0%) | 96 (48.0%) |
| Health Care & Social Assistance | 0 (0.0%) | 201 (100.0%) |
| Arts, Entertainment & Recreation | 0 (0.0%) | 15 (100.0%) |
| Accommodation & Food Services | 46 (58.2%) | 33 (41.8%) |
| Public Administration | 51 (100.0%) | 0 (0.0%) |
| Total | 881 (58.5%) | 624 (41.5%) |
Education in Wallburg
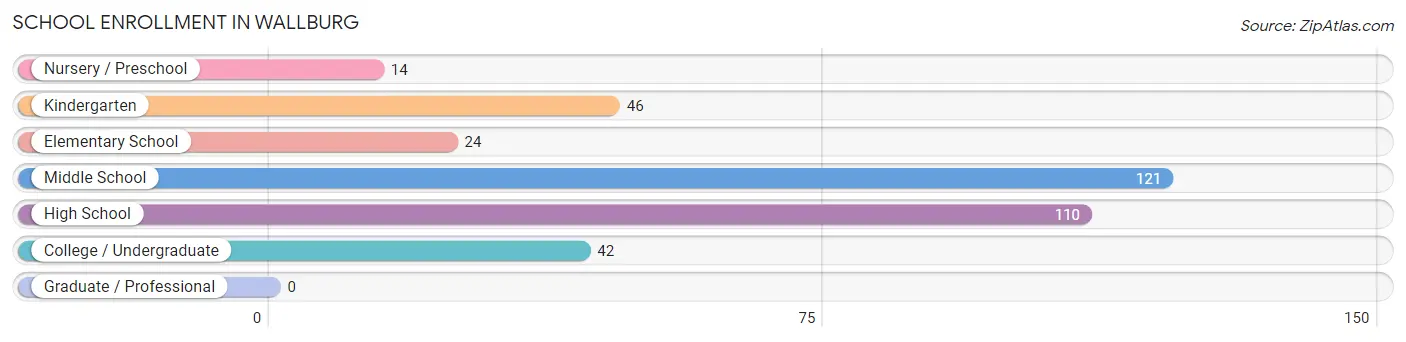
School Enrollment in Wallburg
The most common levels of schooling among the 357 students in Wallburg are middle school (121 | 33.9%), high school (110 | 30.8%), and kindergarten (46 | 12.9%).
| School Level | # Students | % Students |
| Nursery / Preschool | 14 | 3.9% |
| Kindergarten | 46 | 12.9% |
| Elementary School | 24 | 6.7% |
| Middle School | 121 | 33.9% |
| High School | 110 | 30.8% |
| College / Undergraduate | 42 | 11.8% |
| Graduate / Professional | 0 | 0.0% |
| Total | 357 | 100.0% |
School Enrollment by Age by Funding Source in Wallburg
Out of a total of 357 students who are enrolled in schools in Wallburg, 104 (29.1%) attend a private institution, while the remaining 253 (70.9%) are enrolled in public schools. The age group of 25 to 34 year olds has the highest likelihood of being enrolled in private schools, with 18 (100.0% in the age bracket) enrolled. Conversely, the age group of 15 to 17 year olds has the lowest likelihood of being enrolled in a private school, with 58 (100.0% in the age bracket) attending a public institution.
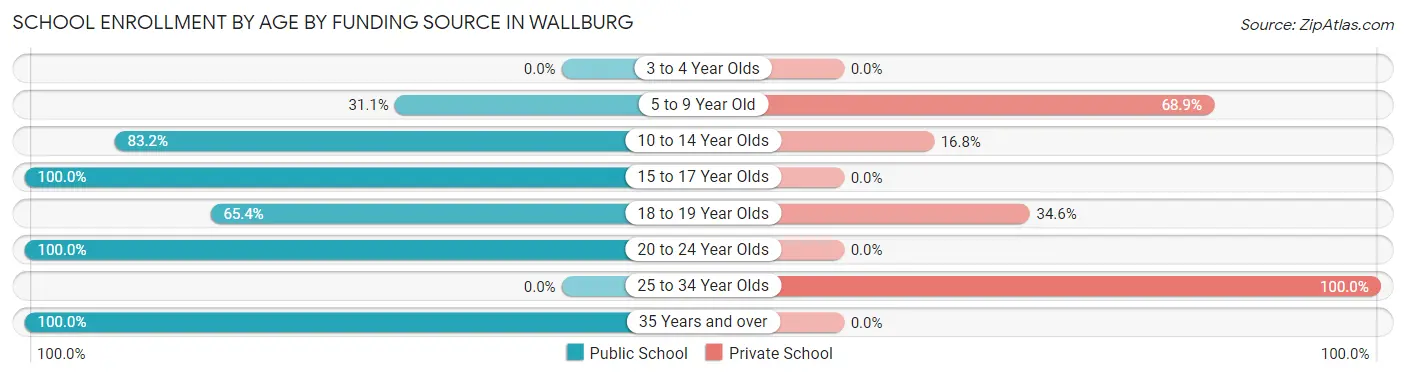
| Age Bracket | Public School | Private School |
| 3 to 4 Year Olds | 0 (0.0%) | 0 (0.0%) |
| 5 to 9 Year Old | 23 (31.1%) | 51 (68.9%) |
| 10 to 14 Year Olds | 129 (83.2%) | 26 (16.8%) |
| 15 to 17 Year Olds | 58 (100.0%) | 0 (0.0%) |
| 18 to 19 Year Olds | 17 (65.4%) | 9 (34.6%) |
| 20 to 24 Year Olds | 20 (100.0%) | 0 (0.0%) |
| 25 to 34 Year Olds | 0 (0.0%) | 18 (100.0%) |
| 35 Years and over | 6 (100.0%) | 0 (0.0%) |
| Total | 253 (70.9%) | 104 (29.1%) |
Educational Attainment by Field of Study in Wallburg
Business (260 | 27.5%), literature & languages (161 | 17.0%), education (144 | 15.2%), computers & mathematics (95 | 10.0%), and social sciences (84 | 8.9%) are the most common fields of study among 946 individuals in Wallburg who have obtained a bachelor's degree or higher.
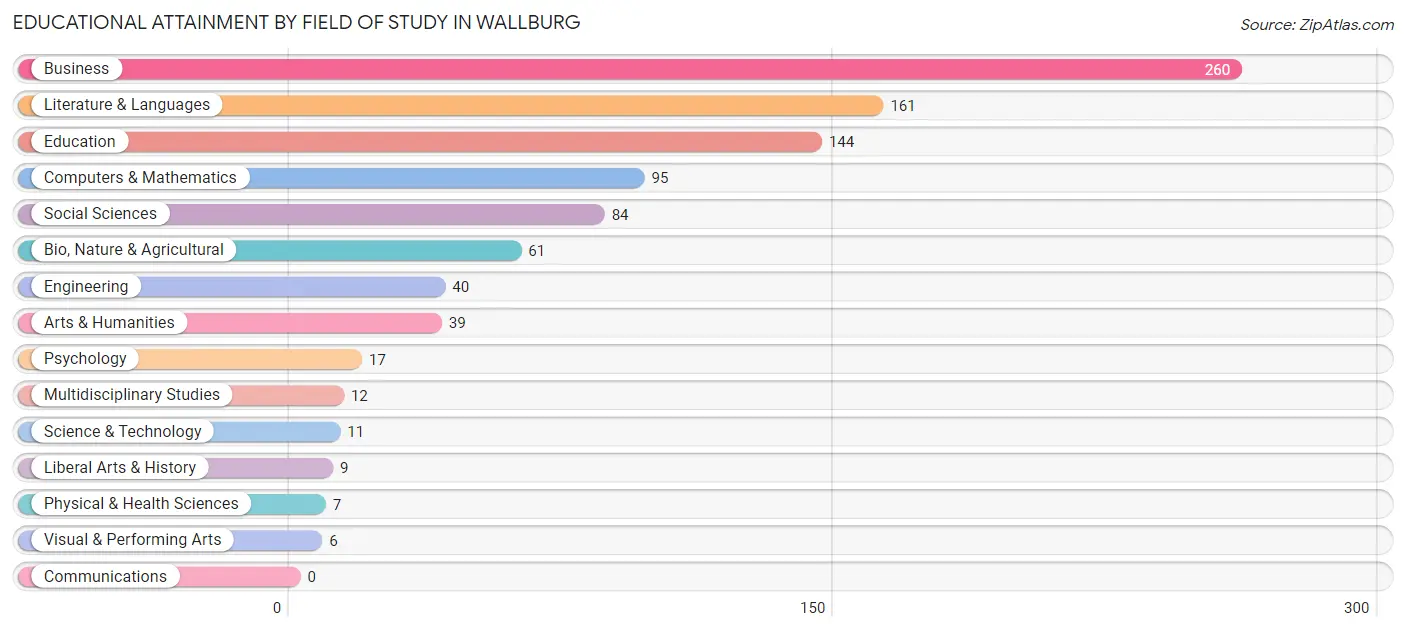
| Field of Study | # Graduates | % Graduates |
| Computers & Mathematics | 95 | 10.0% |
| Bio, Nature & Agricultural | 61 | 6.5% |
| Physical & Health Sciences | 7 | 0.7% |
| Psychology | 17 | 1.8% |
| Social Sciences | 84 | 8.9% |
| Engineering | 40 | 4.2% |
| Multidisciplinary Studies | 12 | 1.3% |
| Science & Technology | 11 | 1.2% |
| Business | 260 | 27.5% |
| Education | 144 | 15.2% |
| Literature & Languages | 161 | 17.0% |
| Liberal Arts & History | 9 | 0.9% |
| Visual & Performing Arts | 6 | 0.6% |
| Communications | 0 | 0.0% |
| Arts & Humanities | 39 | 4.1% |
| Total | 946 | 100.0% |
Transportation & Commute in Wallburg
Vehicle Availability by Sex in Wallburg
The most prevalent vehicle ownership categories in Wallburg are males with 3 vehicles (287, accounting for 32.6%) and females with 3 vehicles (168, making up 46.0%).
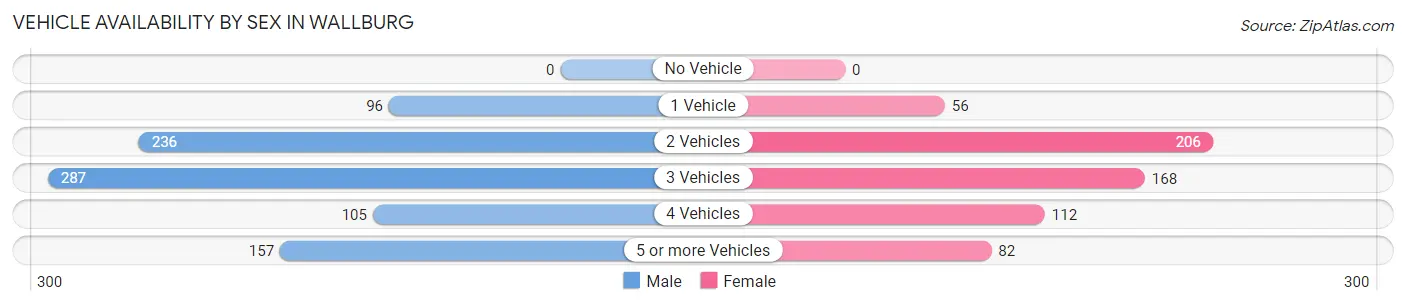
| Vehicles Available | Male | Female |
| No Vehicle | 0 (0.0%) | 0 (0.0%) |
| 1 Vehicle | 96 (10.9%) | 56 (9.0%) |
| 2 Vehicles | 236 (26.8%) | 206 (33.0%) |
| 3 Vehicles | 287 (32.6%) | 168 (26.9%) |
| 4 Vehicles | 105 (11.9%) | 112 (17.9%) |
| 5 or more Vehicles | 157 (17.8%) | 82 (13.1%) |
| Total | 881 (100.0%) | 624 (100.0%) |
Commute Time in Wallburg
The most frequently occuring commute durations in Wallburg are 20 to 24 minutes (398 commuters, 27.9%), 30 to 34 minutes (192 commuters, 13.5%), and 25 to 29 minutes (180 commuters, 12.6%).
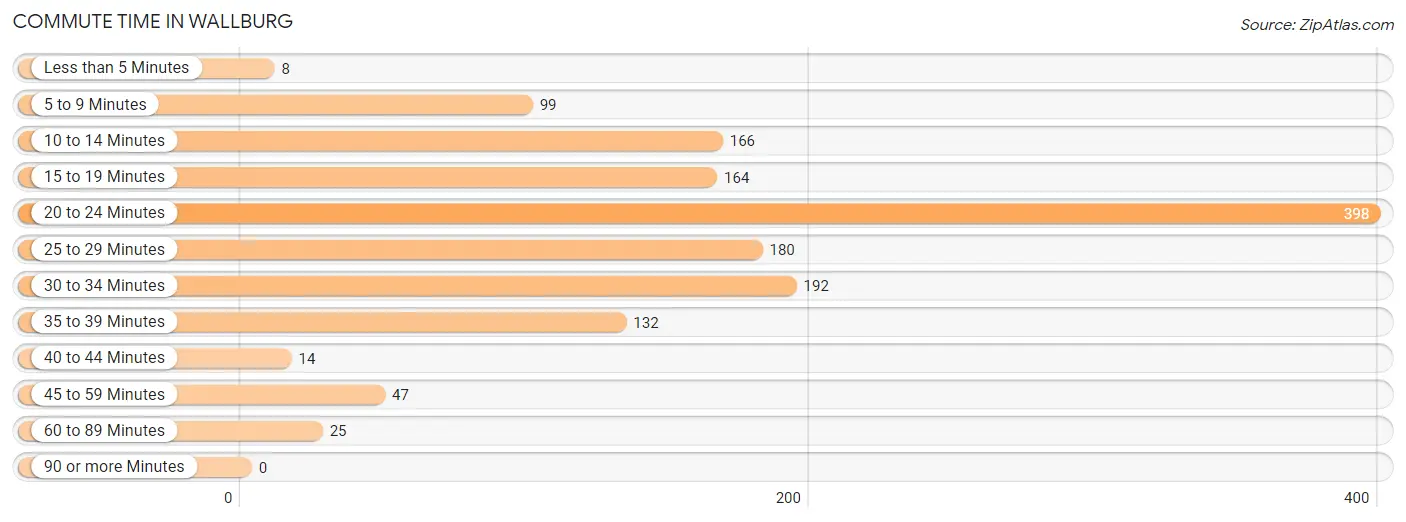
| Commute Time | # Commuters | % Commuters |
| Less than 5 Minutes | 8 | 0.6% |
| 5 to 9 Minutes | 99 | 7.0% |
| 10 to 14 Minutes | 166 | 11.7% |
| 15 to 19 Minutes | 164 | 11.5% |
| 20 to 24 Minutes | 398 | 27.9% |
| 25 to 29 Minutes | 180 | 12.6% |
| 30 to 34 Minutes | 192 | 13.5% |
| 35 to 39 Minutes | 132 | 9.3% |
| 40 to 44 Minutes | 14 | 1.0% |
| 45 to 59 Minutes | 47 | 3.3% |
| 60 to 89 Minutes | 25 | 1.8% |
| 90 or more Minutes | 0 | 0.0% |
Commute Time by Sex in Wallburg
The most common commute times in Wallburg are 20 to 24 minutes (178 commuters, 20.8%) for males and 20 to 24 minutes (220 commuters, 38.6%) for females.
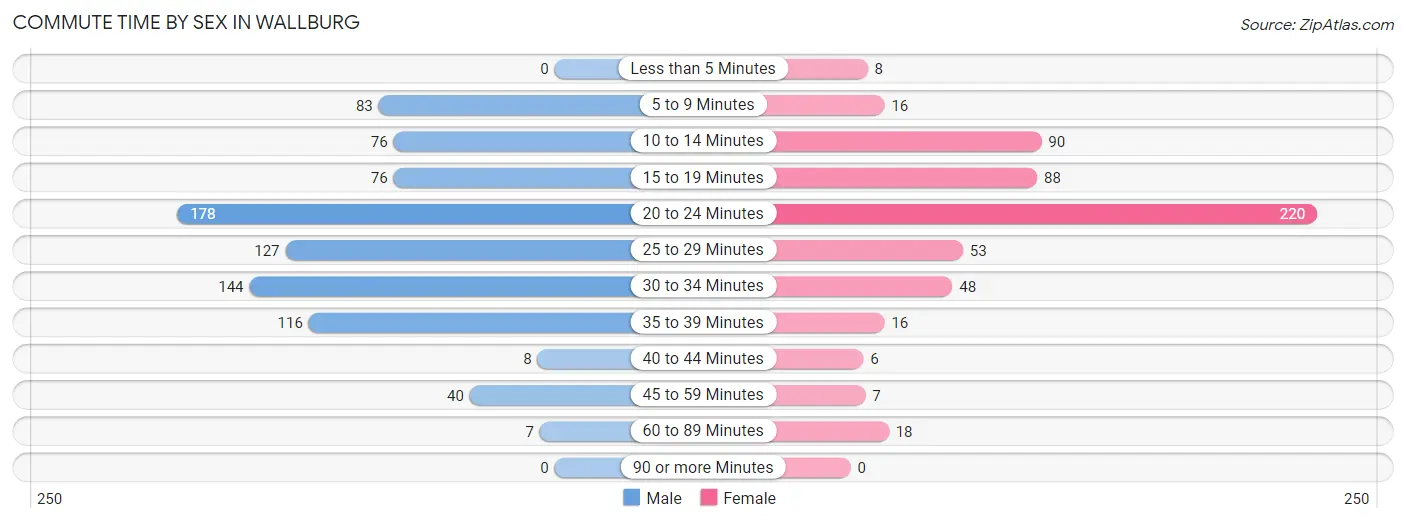
| Commute Time | Male | Female |
| Less than 5 Minutes | 0 (0.0%) | 8 (1.4%) |
| 5 to 9 Minutes | 83 (9.7%) | 16 (2.8%) |
| 10 to 14 Minutes | 76 (8.9%) | 90 (15.8%) |
| 15 to 19 Minutes | 76 (8.9%) | 88 (15.4%) |
| 20 to 24 Minutes | 178 (20.8%) | 220 (38.6%) |
| 25 to 29 Minutes | 127 (14.8%) | 53 (9.3%) |
| 30 to 34 Minutes | 144 (16.8%) | 48 (8.4%) |
| 35 to 39 Minutes | 116 (13.6%) | 16 (2.8%) |
| 40 to 44 Minutes | 8 (0.9%) | 6 (1.1%) |
| 45 to 59 Minutes | 40 (4.7%) | 7 (1.2%) |
| 60 to 89 Minutes | 7 (0.8%) | 18 (3.2%) |
| 90 or more Minutes | 0 (0.0%) | 0 (0.0%) |
Time of Departure to Work by Sex in Wallburg
The most frequent times of departure to work in Wallburg are 7:30 AM to 7:59 AM (190, 22.2%) for males and 7:30 AM to 7:59 AM (138, 24.2%) for females.
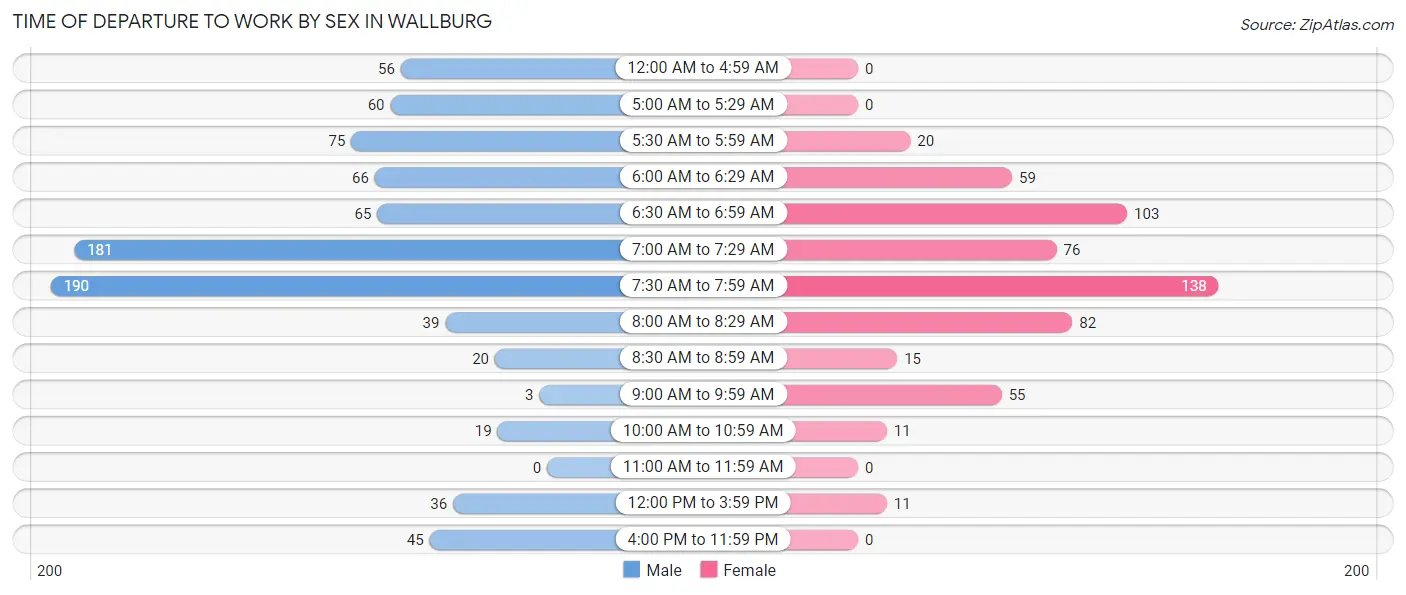
| Time of Departure | Male | Female |
| 12:00 AM to 4:59 AM | 56 (6.6%) | 0 (0.0%) |
| 5:00 AM to 5:29 AM | 60 (7.0%) | 0 (0.0%) |
| 5:30 AM to 5:59 AM | 75 (8.8%) | 20 (3.5%) |
| 6:00 AM to 6:29 AM | 66 (7.7%) | 59 (10.3%) |
| 6:30 AM to 6:59 AM | 65 (7.6%) | 103 (18.1%) |
| 7:00 AM to 7:29 AM | 181 (21.2%) | 76 (13.3%) |
| 7:30 AM to 7:59 AM | 190 (22.2%) | 138 (24.2%) |
| 8:00 AM to 8:29 AM | 39 (4.6%) | 82 (14.4%) |
| 8:30 AM to 8:59 AM | 20 (2.3%) | 15 (2.6%) |
| 9:00 AM to 9:59 AM | 3 (0.4%) | 55 (9.7%) |
| 10:00 AM to 10:59 AM | 19 (2.2%) | 11 (1.9%) |
| 11:00 AM to 11:59 AM | 0 (0.0%) | 0 (0.0%) |
| 12:00 PM to 3:59 PM | 36 (4.2%) | 11 (1.9%) |
| 4:00 PM to 11:59 PM | 45 (5.3%) | 0 (0.0%) |
| Total | 855 (100.0%) | 570 (100.0%) |
Housing Occupancy in Wallburg
Occupancy by Ownership in Wallburg
Of the total 1,328 dwellings in Wallburg, owner-occupied units account for 1,250 (94.1%), while renter-occupied units make up 78 (5.9%).
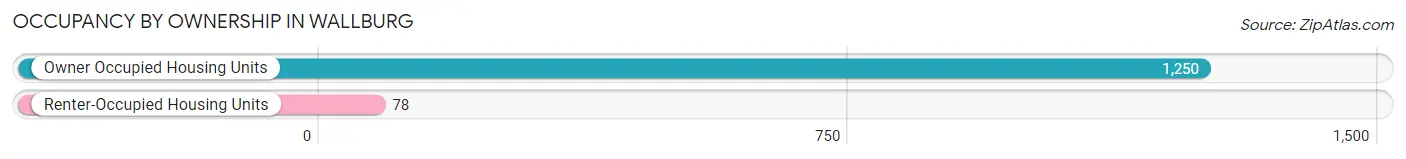
| Occupancy | # Housing Units | % Housing Units |
| Owner Occupied Housing Units | 1,250 | 94.1% |
| Renter-Occupied Housing Units | 78 | 5.9% |
| Total Occupied Housing Units | 1,328 | 100.0% |
Occupancy by Household Size in Wallburg
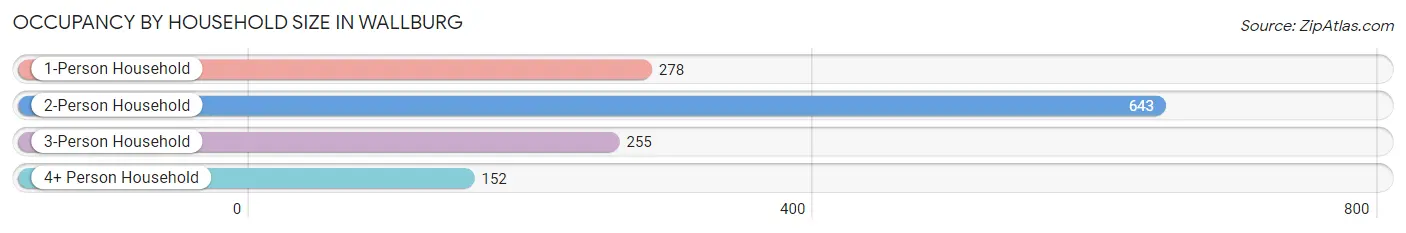
| Household Size | # Housing Units | % Housing Units |
| 1-Person Household | 278 | 20.9% |
| 2-Person Household | 643 | 48.4% |
| 3-Person Household | 255 | 19.2% |
| 4+ Person Household | 152 | 11.5% |
| Total Housing Units | 1,328 | 100.0% |
Occupancy by Ownership by Household Size in Wallburg
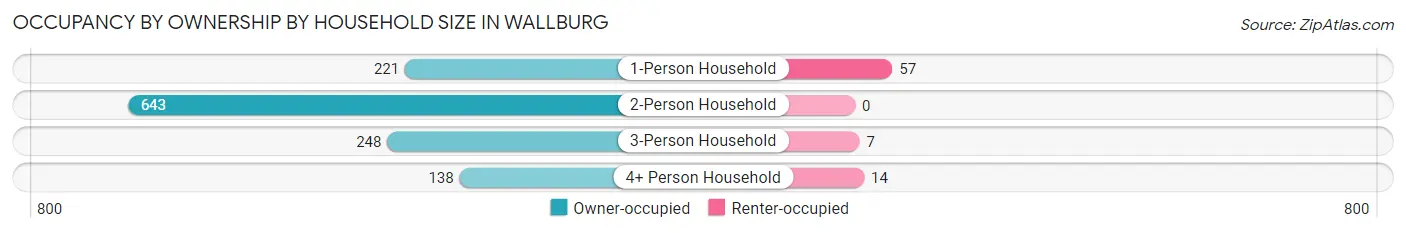
| Household Size | Owner-occupied | Renter-occupied |
| 1-Person Household | 221 (79.5%) | 57 (20.5%) |
| 2-Person Household | 643 (100.0%) | 0 (0.0%) |
| 3-Person Household | 248 (97.3%) | 7 (2.8%) |
| 4+ Person Household | 138 (90.8%) | 14 (9.2%) |
| Total Housing Units | 1,250 (94.1%) | 78 (5.9%) |
Occupancy by Educational Attainment in Wallburg
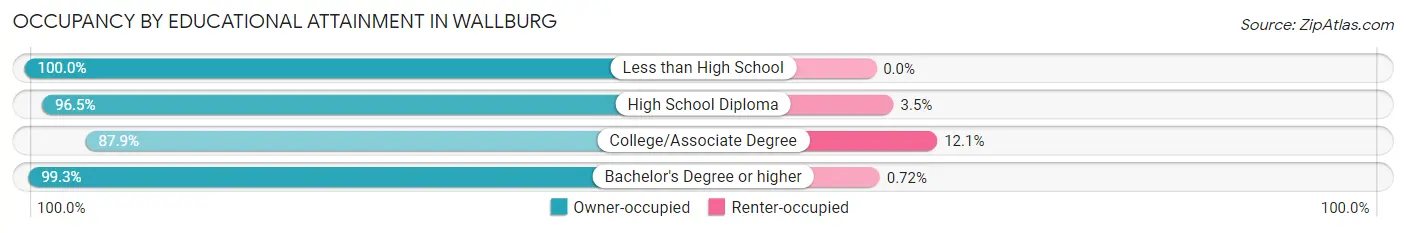
| Household Size | Owner-occupied | Renter-occupied |
| Less than High School | 23 (100.0%) | 0 (0.0%) |
| High School Diploma | 363 (96.5%) | 13 (3.5%) |
| College/Associate Degree | 450 (87.9%) | 62 (12.1%) |
| Bachelor's Degree or higher | 414 (99.3%) | 3 (0.7%) |
Occupancy by Age of Householder in Wallburg
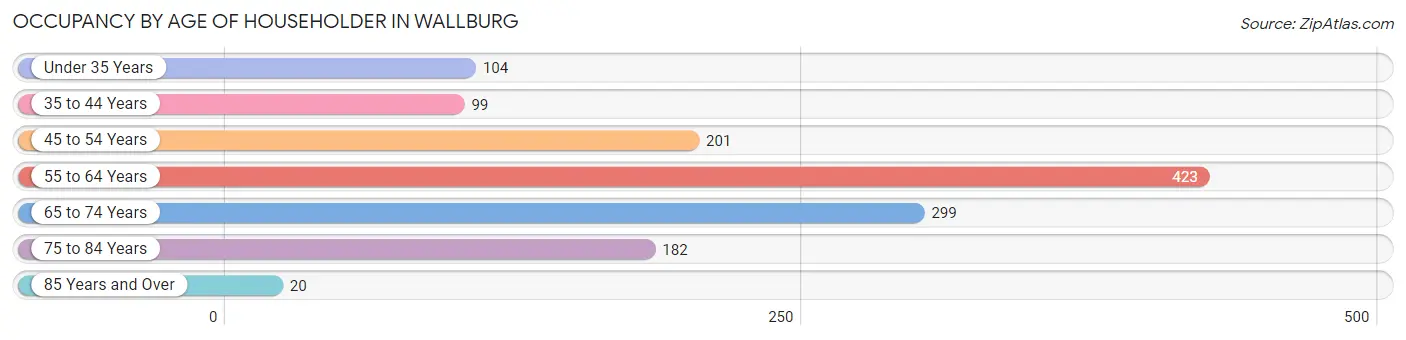
| Age Bracket | # Households | % Households |
| Under 35 Years | 104 | 7.8% |
| 35 to 44 Years | 99 | 7.4% |
| 45 to 54 Years | 201 | 15.1% |
| 55 to 64 Years | 423 | 31.9% |
| 65 to 74 Years | 299 | 22.5% |
| 75 to 84 Years | 182 | 13.7% |
| 85 Years and Over | 20 | 1.5% |
| Total | 1,328 | 100.0% |
Housing Finances in Wallburg
Median Income by Occupancy in Wallburg
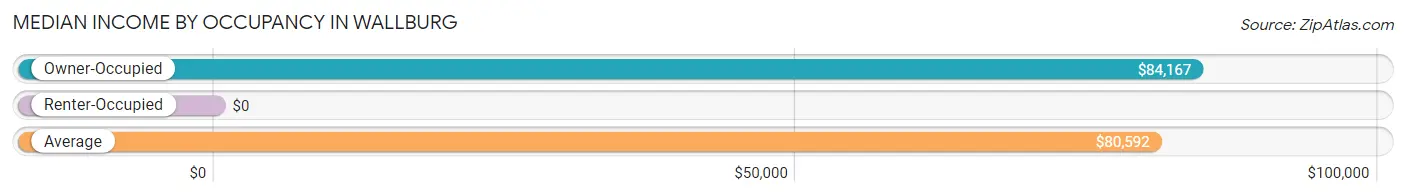
| Occupancy Type | # Households | Median Income |
| Owner-Occupied | 1,250 (94.1%) | $84,167 |
| Renter-Occupied | 78 (5.9%) | $0 |
| Average | 1,328 (100.0%) | $80,592 |
Occupancy by Householder Income Bracket in Wallburg
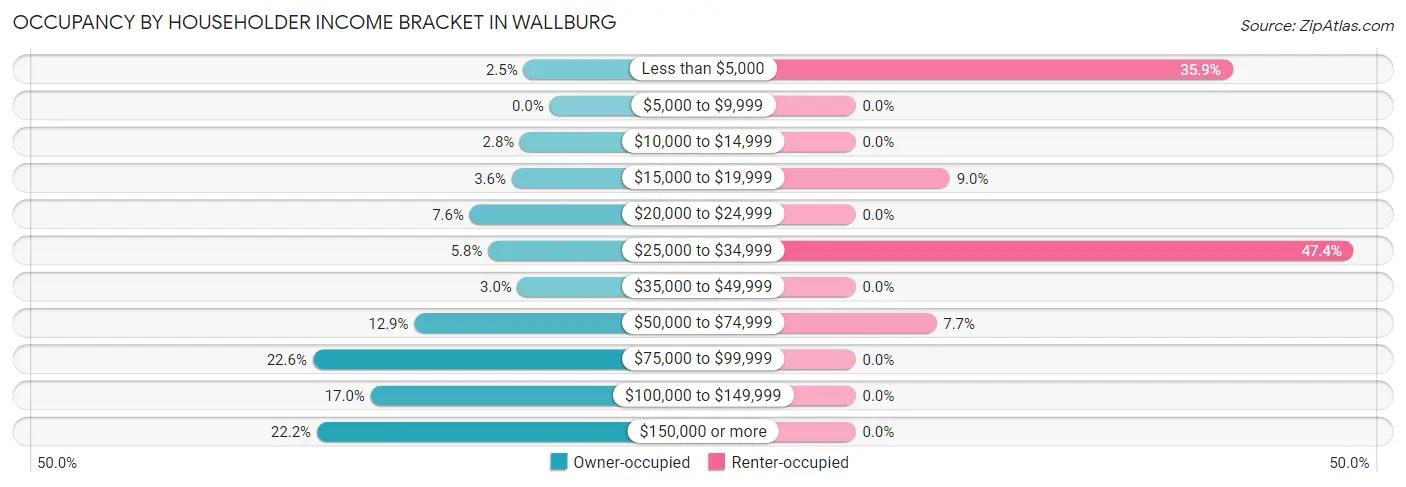
| Income Bracket | Owner-occupied | Renter-occupied |
| Less than $5,000 | 31 (2.5%) | 28 (35.9%) |
| $5,000 to $9,999 | 0 (0.0%) | 0 (0.0%) |
| $10,000 to $14,999 | 35 (2.8%) | 0 (0.0%) |
| $15,000 to $19,999 | 45 (3.6%) | 7 (9.0%) |
| $20,000 to $24,999 | 95 (7.6%) | 0 (0.0%) |
| $25,000 to $34,999 | 73 (5.8%) | 37 (47.4%) |
| $35,000 to $49,999 | 38 (3.0%) | 0 (0.0%) |
| $50,000 to $74,999 | 161 (12.9%) | 6 (7.7%) |
| $75,000 to $99,999 | 282 (22.6%) | 0 (0.0%) |
| $100,000 to $149,999 | 213 (17.0%) | 0 (0.0%) |
| $150,000 or more | 277 (22.2%) | 0 (0.0%) |
| Total | 1,250 (100.0%) | 78 (100.0%) |
Monthly Housing Cost Tiers in Wallburg

| Monthly Cost | Owner-occupied | Renter-occupied |
| Less than $300 | 84 (6.7%) | 0 (0.0%) |
| $300 to $499 | 377 (30.2%) | 0 (0.0%) |
| $500 to $799 | 273 (21.8%) | 7 (9.0%) |
| $800 to $999 | 102 (8.2%) | 62 (79.5%) |
| $1,000 to $1,499 | 194 (15.5%) | 6 (7.7%) |
| $1,500 to $1,999 | 105 (8.4%) | 0 (0.0%) |
| $2,000 to $2,499 | 112 (9.0%) | 0 (0.0%) |
| $2,500 to $2,999 | 3 (0.2%) | 0 (0.0%) |
| $3,000 or more | 0 (0.0%) | 0 (0.0%) |
| Total | 1,250 (100.0%) | 78 (100.0%) |
Physical Housing Characteristics in Wallburg
Housing Structures in Wallburg
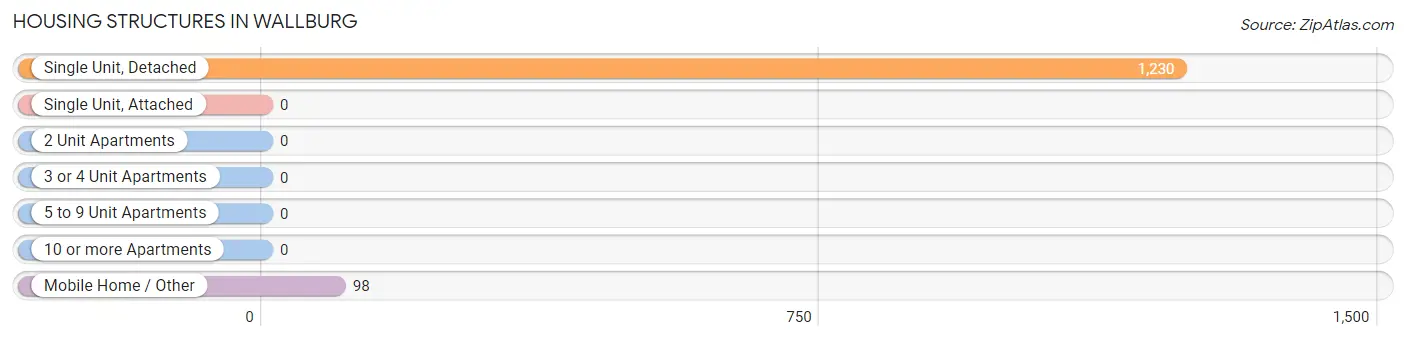
| Structure Type | # Housing Units | % Housing Units |
| Single Unit, Detached | 1,230 | 92.6% |
| Single Unit, Attached | 0 | 0.0% |
| 2 Unit Apartments | 0 | 0.0% |
| 3 or 4 Unit Apartments | 0 | 0.0% |
| 5 to 9 Unit Apartments | 0 | 0.0% |
| 10 or more Apartments | 0 | 0.0% |
| Mobile Home / Other | 98 | 7.4% |
| Total | 1,328 | 100.0% |
Housing Structures by Occupancy in Wallburg
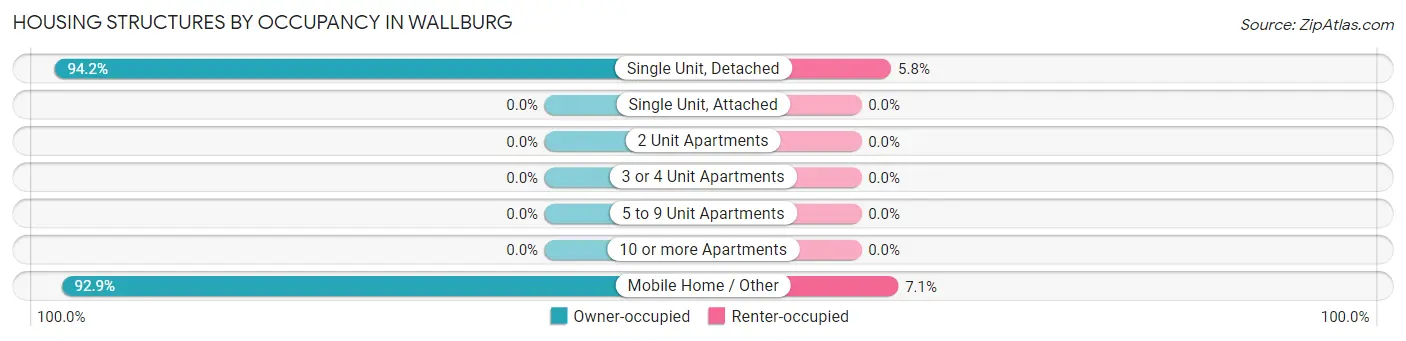
| Structure Type | Owner-occupied | Renter-occupied |
| Single Unit, Detached | 1,159 (94.2%) | 71 (5.8%) |
| Single Unit, Attached | 0 (0.0%) | 0 (0.0%) |
| 2 Unit Apartments | 0 (0.0%) | 0 (0.0%) |
| 3 or 4 Unit Apartments | 0 (0.0%) | 0 (0.0%) |
| 5 to 9 Unit Apartments | 0 (0.0%) | 0 (0.0%) |
| 10 or more Apartments | 0 (0.0%) | 0 (0.0%) |
| Mobile Home / Other | 91 (92.9%) | 7 (7.1%) |
| Total | 1,250 (94.1%) | 78 (5.9%) |
Housing Structures by Number of Rooms in Wallburg
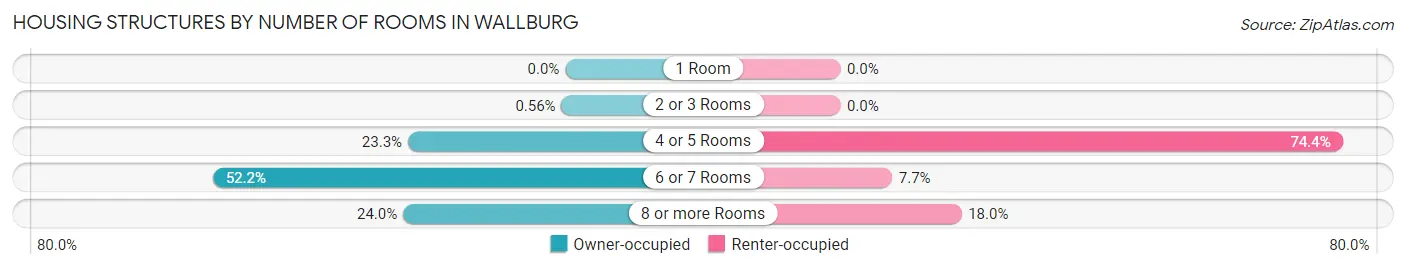
| Number of Rooms | Owner-occupied | Renter-occupied |
| 1 Room | 0 (0.0%) | 0 (0.0%) |
| 2 or 3 Rooms | 7 (0.6%) | 0 (0.0%) |
| 4 or 5 Rooms | 291 (23.3%) | 58 (74.4%) |
| 6 or 7 Rooms | 652 (52.2%) | 6 (7.7%) |
| 8 or more Rooms | 300 (24.0%) | 14 (17.9%) |
| Total | 1,250 (100.0%) | 78 (100.0%) |
Housing Structure by Heating Type in Wallburg
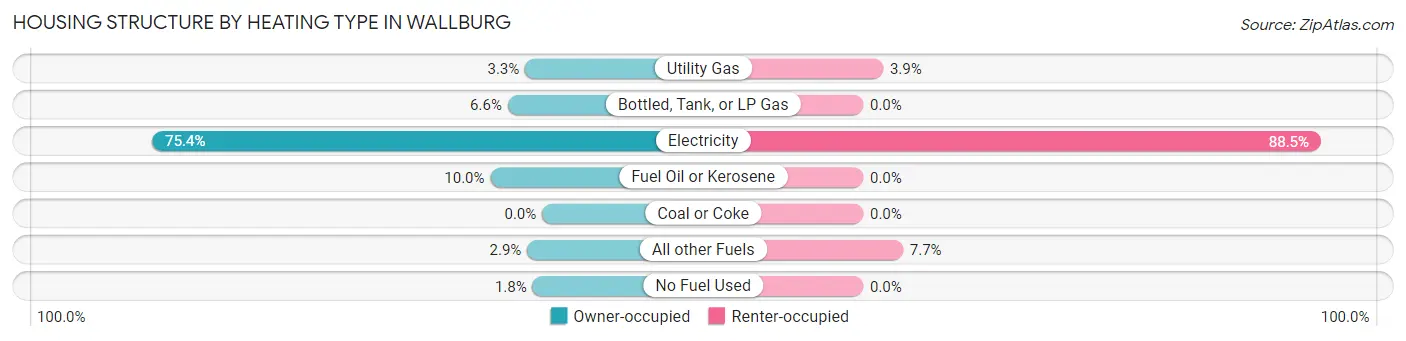
| Heating Type | Owner-occupied | Renter-occupied |
| Utility Gas | 41 (3.3%) | 3 (3.8%) |
| Bottled, Tank, or LP Gas | 83 (6.6%) | 0 (0.0%) |
| Electricity | 942 (75.4%) | 69 (88.5%) |
| Fuel Oil or Kerosene | 125 (10.0%) | 0 (0.0%) |
| Coal or Coke | 0 (0.0%) | 0 (0.0%) |
| All other Fuels | 36 (2.9%) | 6 (7.7%) |
| No Fuel Used | 23 (1.8%) | 0 (0.0%) |
| Total | 1,250 (100.0%) | 78 (100.0%) |
Household Vehicle Usage in Wallburg
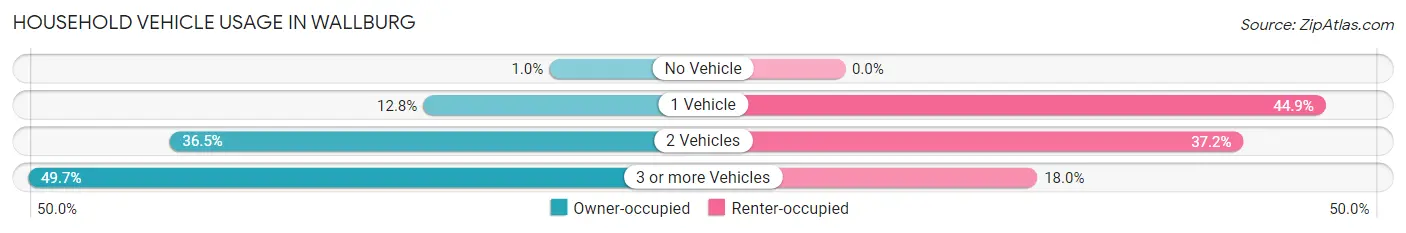
| Vehicles per Household | Owner-occupied | Renter-occupied |
| No Vehicle | 13 (1.0%) | 0 (0.0%) |
| 1 Vehicle | 160 (12.8%) | 35 (44.9%) |
| 2 Vehicles | 456 (36.5%) | 29 (37.2%) |
| 3 or more Vehicles | 621 (49.7%) | 14 (17.9%) |
| Total | 1,250 (100.0%) | 78 (100.0%) |
Real Estate & Mortgages in Wallburg
Real Estate and Mortgage Overview in Wallburg
| Characteristic | Without Mortgage | With Mortgage |
| Housing Units | 659 | 591 |
| Median Property Value | $238,100 | $258,900 |
| Median Household Income | $76,536 | $148 |
| Monthly Housing Costs | $448 | $0 |
| Real Estate Taxes | $1,481 | $5 |
Property Value by Mortgage Status in Wallburg
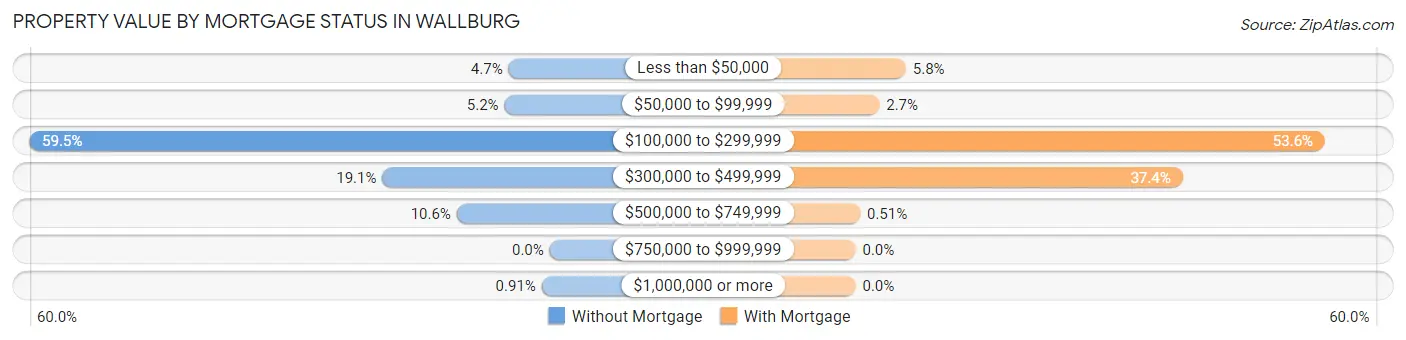
| Property Value | Without Mortgage | With Mortgage |
| Less than $50,000 | 31 (4.7%) | 34 (5.8%) |
| $50,000 to $99,999 | 34 (5.2%) | 16 (2.7%) |
| $100,000 to $299,999 | 392 (59.5%) | 317 (53.6%) |
| $300,000 to $499,999 | 126 (19.1%) | 221 (37.4%) |
| $500,000 to $749,999 | 70 (10.6%) | 3 (0.5%) |
| $750,000 to $999,999 | 0 (0.0%) | 0 (0.0%) |
| $1,000,000 or more | 6 (0.9%) | 0 (0.0%) |
| Total | 659 (100.0%) | 591 (100.0%) |
Household Income by Mortgage Status in Wallburg
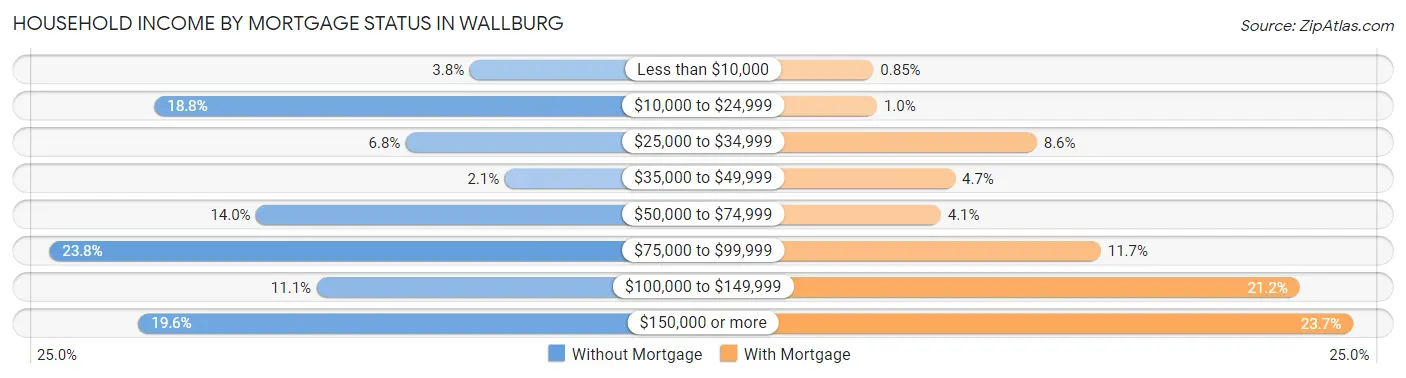
| Household Income | Without Mortgage | With Mortgage |
| Less than $10,000 | 25 (3.8%) | 5 (0.9%) |
| $10,000 to $24,999 | 124 (18.8%) | 6 (1.0%) |
| $25,000 to $34,999 | 45 (6.8%) | 51 (8.6%) |
| $35,000 to $49,999 | 14 (2.1%) | 28 (4.7%) |
| $50,000 to $74,999 | 92 (14.0%) | 24 (4.1%) |
| $75,000 to $99,999 | 157 (23.8%) | 69 (11.7%) |
| $100,000 to $149,999 | 73 (11.1%) | 125 (21.1%) |
| $150,000 or more | 129 (19.6%) | 140 (23.7%) |
| Total | 659 (100.0%) | 591 (100.0%) |
Property Value to Household Income Ratio in Wallburg
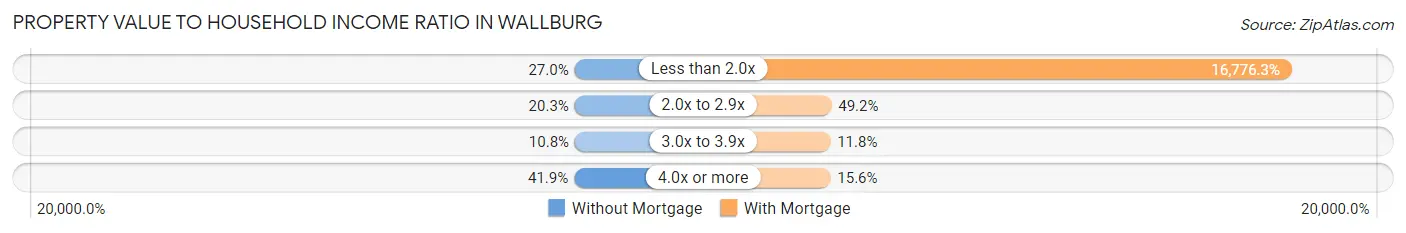
| Value-to-Income Ratio | Without Mortgage | With Mortgage |
| Less than 2.0x | 178 (27.0%) | 99,148 (16,776.3%) |
| 2.0x to 2.9x | 134 (20.3%) | 291 (49.2%) |
| 3.0x to 3.9x | 71 (10.8%) | 70 (11.8%) |
| 4.0x or more | 276 (41.9%) | 92 (15.6%) |
| Total | 659 (100.0%) | 591 (100.0%) |
Real Estate Taxes by Mortgage Status in Wallburg
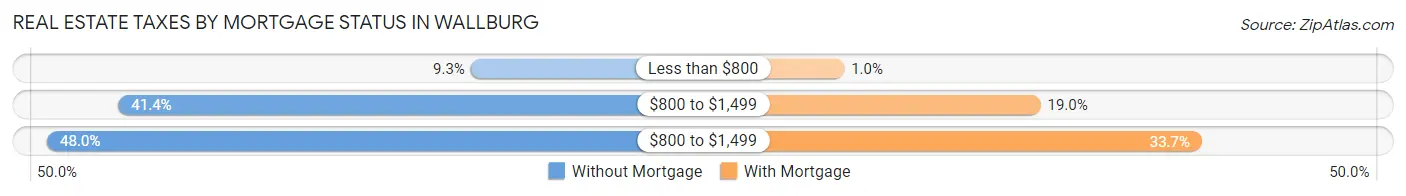
| Property Taxes | Without Mortgage | With Mortgage |
| Less than $800 | 61 (9.3%) | 6 (1.0%) |
| $800 to $1,499 | 273 (41.4%) | 112 (19.0%) |
| $800 to $1,499 | 316 (47.9%) | 199 (33.7%) |
| Total | 659 (100.0%) | 591 (100.0%) |
Health & Disability in Wallburg
Health Insurance Coverage by Age in Wallburg
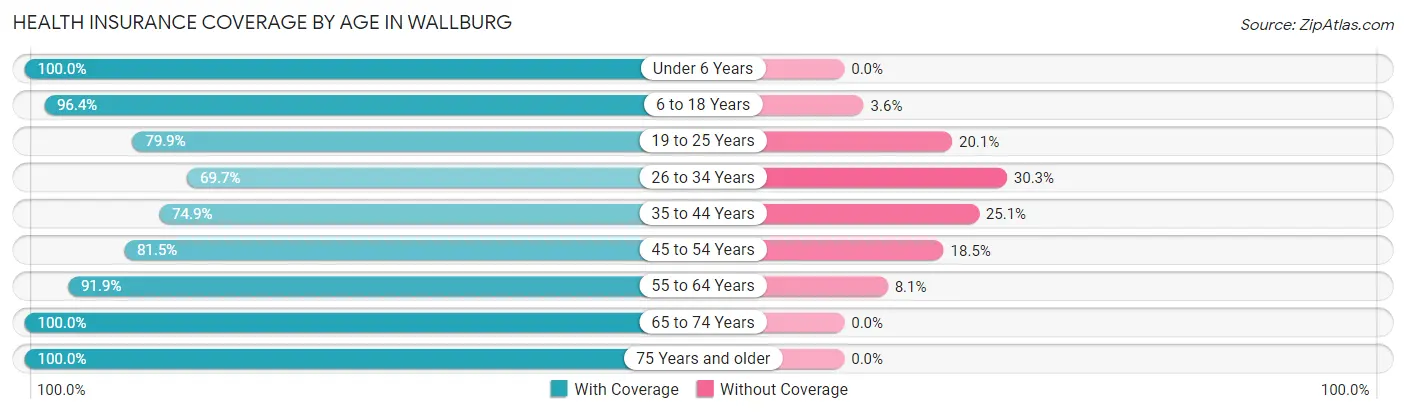
| Age Bracket | With Coverage | Without Coverage |
| Under 6 Years | 127 (100.0%) | 0 (0.0%) |
| 6 to 18 Years | 240 (96.4%) | 9 (3.6%) |
| 19 to 25 Years | 163 (79.9%) | 41 (20.1%) |
| 26 to 34 Years | 216 (69.7%) | 94 (30.3%) |
| 35 to 44 Years | 182 (74.9%) | 61 (25.1%) |
| 45 to 54 Years | 343 (81.5%) | 78 (18.5%) |
| 55 to 64 Years | 715 (91.9%) | 63 (8.1%) |
| 65 to 74 Years | 451 (100.0%) | 0 (0.0%) |
| 75 Years and older | 298 (100.0%) | 0 (0.0%) |
| Total | 2,735 (88.8%) | 346 (11.2%) |
Health Insurance Coverage by Citizenship Status in Wallburg

| Citizenship Status | With Coverage | Without Coverage |
| Native Born | 127 (100.0%) | 0 (0.0%) |
| Foreign Born, Citizen | 240 (96.4%) | 9 (3.6%) |
| Foreign Born, not a Citizen | 163 (79.9%) | 41 (20.1%) |
Health Insurance Coverage by Household Income in Wallburg
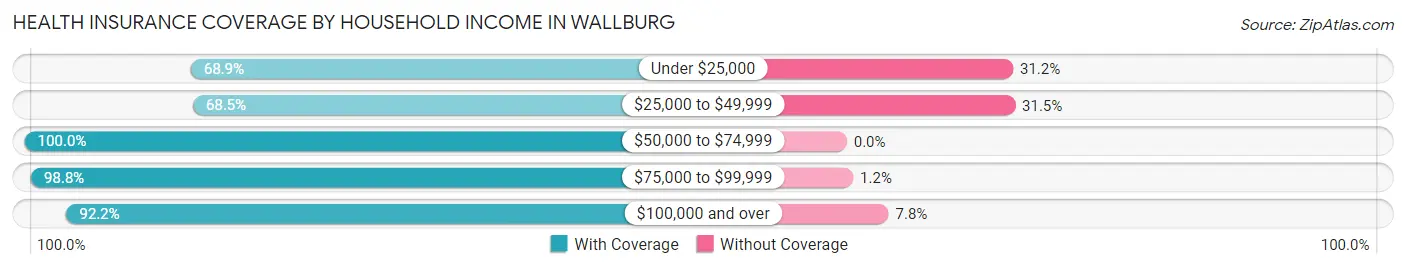
| Household Income | With Coverage | Without Coverage |
| Under $25,000 | 305 (68.9%) | 138 (31.1%) |
| $25,000 to $49,999 | 202 (68.5%) | 93 (31.5%) |
| $50,000 to $74,999 | 302 (100.0%) | 0 (0.0%) |
| $75,000 to $99,999 | 666 (98.8%) | 8 (1.2%) |
| $100,000 and over | 1,260 (92.2%) | 107 (7.8%) |
Public vs Private Health Insurance Coverage by Age in Wallburg
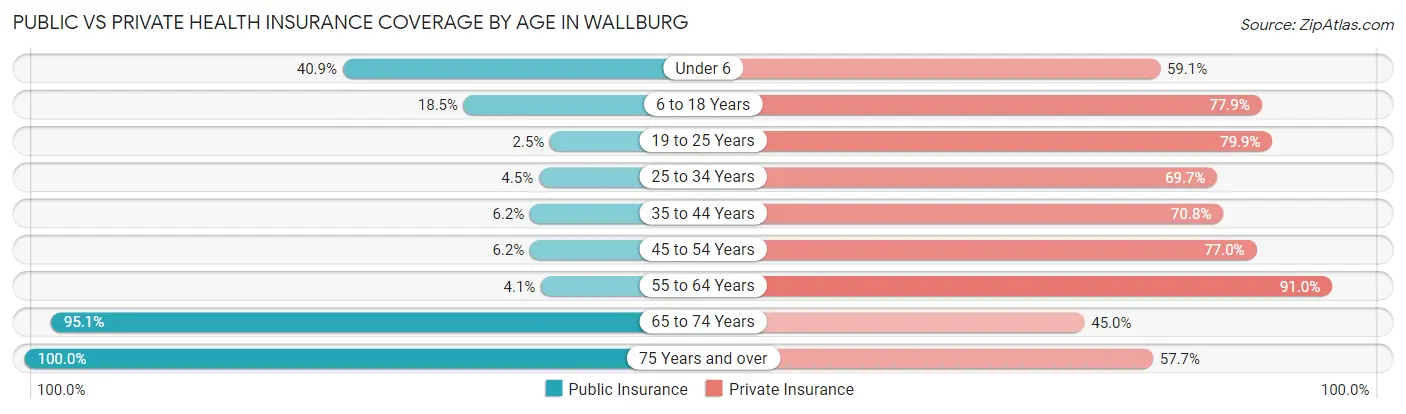
| Age Bracket | Public Insurance | Private Insurance |
| Under 6 | 52 (40.9%) | 75 (59.1%) |
| 6 to 18 Years | 46 (18.5%) | 194 (77.9%) |
| 19 to 25 Years | 5 (2.5%) | 163 (79.9%) |
| 25 to 34 Years | 14 (4.5%) | 216 (69.7%) |
| 35 to 44 Years | 15 (6.2%) | 172 (70.8%) |
| 45 to 54 Years | 26 (6.2%) | 324 (77.0%) |
| 55 to 64 Years | 32 (4.1%) | 708 (91.0%) |
| 65 to 74 Years | 429 (95.1%) | 203 (45.0%) |
| 75 Years and over | 298 (100.0%) | 172 (57.7%) |
| Total | 917 (29.8%) | 2,227 (72.3%) |
Disability Status by Sex by Age in Wallburg
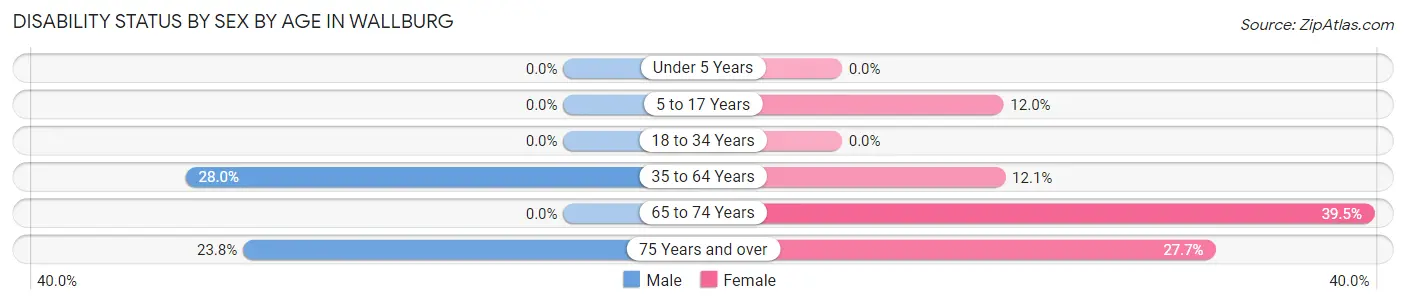
| Age Bracket | Male | Female |
| Under 5 Years | 0 (0.0%) | 0 (0.0%) |
| 5 to 17 Years | 0 (0.0%) | 12 (12.0%) |
| 18 to 34 Years | 0 (0.0%) | 0 (0.0%) |
| 35 to 64 Years | 217 (28.0%) | 81 (12.1%) |
| 65 to 74 Years | 0 (0.0%) | 109 (39.5%) |
| 75 Years and over | 34 (23.8%) | 43 (27.7%) |
Disability Class by Sex by Age in Wallburg
Disability Class: Hearing Difficulty
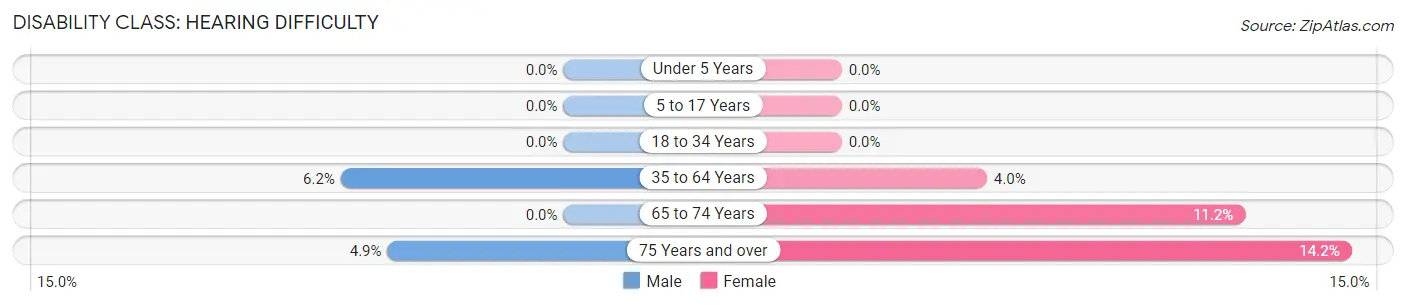
| Age Bracket | Male | Female |
| Under 5 Years | 0 (0.0%) | 0 (0.0%) |
| 5 to 17 Years | 0 (0.0%) | 0 (0.0%) |
| 18 to 34 Years | 0 (0.0%) | 0 (0.0%) |
| 35 to 64 Years | 48 (6.2%) | 27 (4.0%) |
| 65 to 74 Years | 0 (0.0%) | 31 (11.2%) |
| 75 Years and over | 7 (4.9%) | 22 (14.2%) |
Disability Class: Vision Difficulty
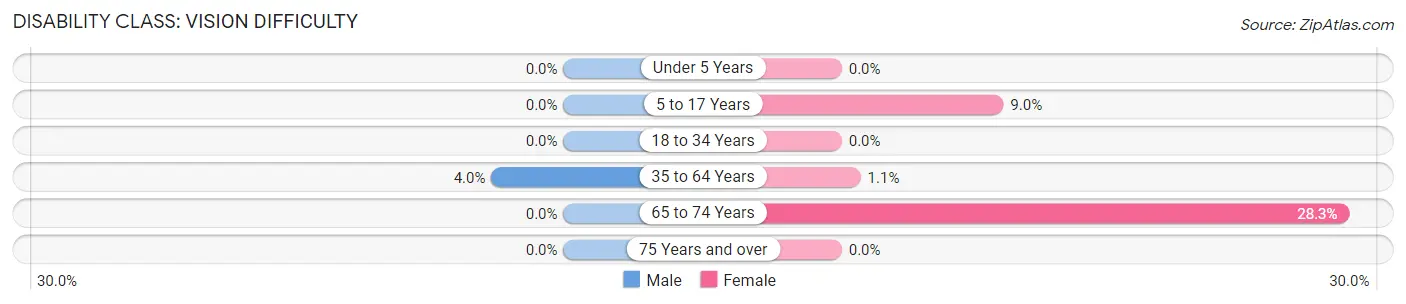
| Age Bracket | Male | Female |
| Under 5 Years | 0 (0.0%) | 0 (0.0%) |
| 5 to 17 Years | 0 (0.0%) | 9 (9.0%) |
| 18 to 34 Years | 0 (0.0%) | 0 (0.0%) |
| 35 to 64 Years | 31 (4.0%) | 7 (1.1%) |
| 65 to 74 Years | 0 (0.0%) | 78 (28.3%) |
| 75 Years and over | 0 (0.0%) | 0 (0.0%) |
Disability Class: Cognitive Difficulty
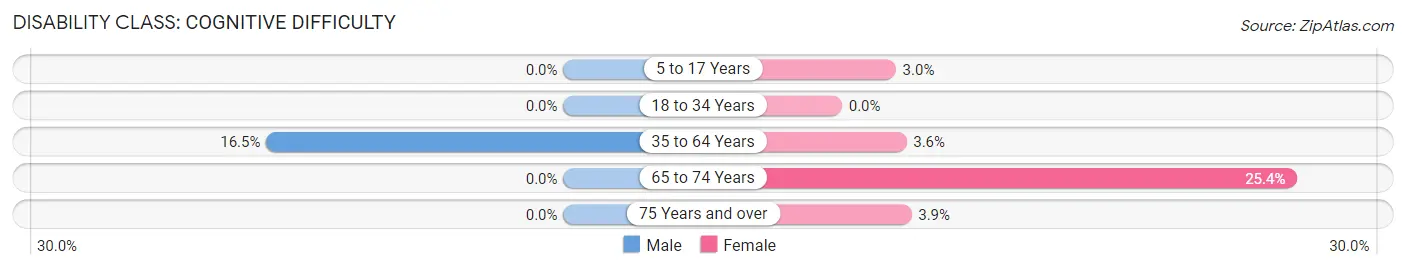
| Age Bracket | Male | Female |
| 5 to 17 Years | 0 (0.0%) | 3 (3.0%) |
| 18 to 34 Years | 0 (0.0%) | 0 (0.0%) |
| 35 to 64 Years | 128 (16.5%) | 24 (3.6%) |
| 65 to 74 Years | 0 (0.0%) | 70 (25.4%) |
| 75 Years and over | 0 (0.0%) | 6 (3.9%) |
Disability Class: Ambulatory Difficulty
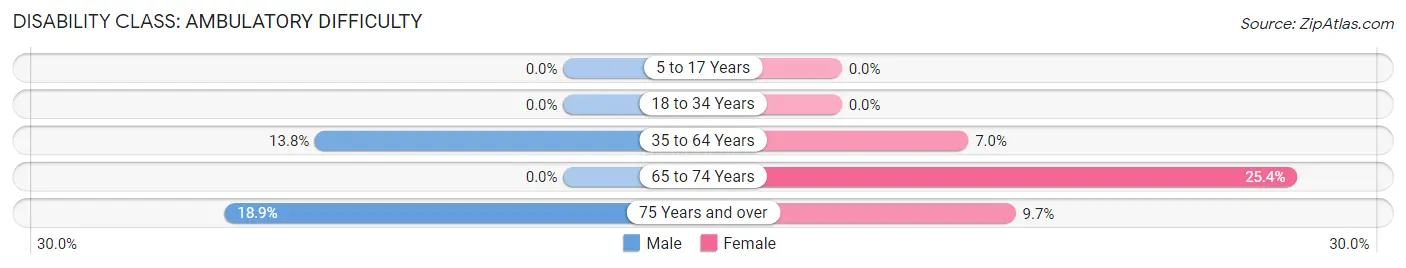
| Age Bracket | Male | Female |
| 5 to 17 Years | 0 (0.0%) | 0 (0.0%) |
| 18 to 34 Years | 0 (0.0%) | 0 (0.0%) |
| 35 to 64 Years | 107 (13.8%) | 47 (7.0%) |
| 65 to 74 Years | 0 (0.0%) | 70 (25.4%) |
| 75 Years and over | 27 (18.9%) | 15 (9.7%) |
Disability Class: Self-Care Difficulty
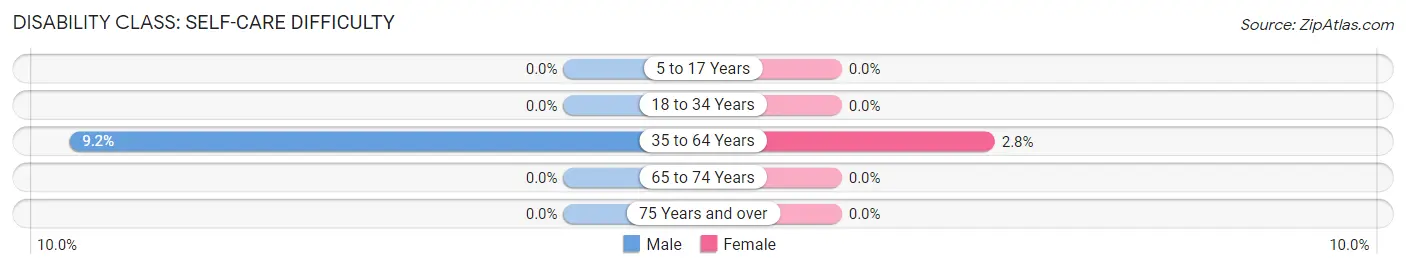
| Age Bracket | Male | Female |
| 5 to 17 Years | 0 (0.0%) | 0 (0.0%) |
| 18 to 34 Years | 0 (0.0%) | 0 (0.0%) |
| 35 to 64 Years | 71 (9.2%) | 19 (2.8%) |
| 65 to 74 Years | 0 (0.0%) | 0 (0.0%) |
| 75 Years and over | 0 (0.0%) | 0 (0.0%) |
Technology Access in Wallburg
Computing Device Access in Wallburg
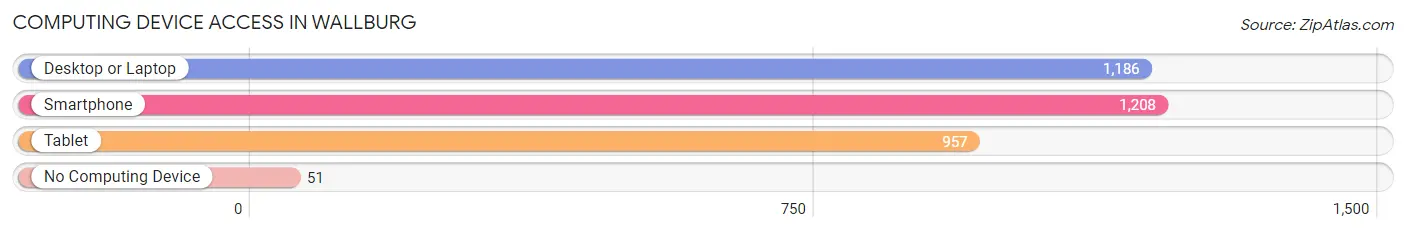
| Device Type | # Households | % Households |
| Desktop or Laptop | 1,186 | 89.3% |
| Smartphone | 1,208 | 91.0% |
| Tablet | 957 | 72.1% |
| No Computing Device | 51 | 3.8% |
| Total | 1,328 | 100.0% |
Internet Access in Wallburg
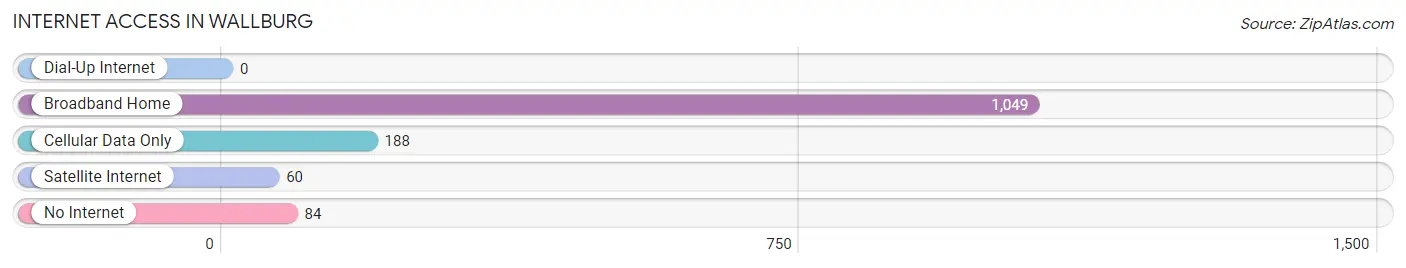
| Internet Type | # Households | % Households |
| Dial-Up Internet | 0 | 0.0% |
| Broadband Home | 1,049 | 79.0% |
| Cellular Data Only | 188 | 14.2% |
| Satellite Internet | 60 | 4.5% |
| No Internet | 84 | 6.3% |
| Total | 1,328 | 100.0% |
Wallburg Summary
Wallburg is a small unincorporated community located in Davidson County, North Carolina. It is situated in the foothills of the Blue Ridge Mountains, approximately 20 miles north of Winston-Salem. The population of Wallburg was estimated to be 1,845 in 2019.
History
Wallburg was first settled in the late 1700s by German immigrants. The town was named after the Wallburg family, who were among the first settlers. The Wallburg family owned a large tract of land in the area, and the town was built around their homestead.
The town was officially incorporated in 1891. During the early 1900s, Wallburg was a thriving agricultural community. The town was home to several cotton mills, a grist mill, and a sawmill. The town also had a post office, a general store, and a hotel.
In the 1950s, Wallburg began to decline as the cotton mills closed and the population began to move away. The town was eventually annexed by the city of Winston-Salem in the 1970s.
Geography
Wallburg is located in the foothills of the Blue Ridge Mountains in Davidson County, North Carolina. The town is situated along the banks of the Yadkin River. The town is approximately 20 miles north of Winston-Salem and is bordered by the towns of Arcadia, Midway, and Welcome.
The terrain of Wallburg is mostly hilly, with some flat areas. The town is located at an elevation of 890 feet above sea level. The climate in Wallburg is mild, with temperatures ranging from the mid-30s in the winter to the mid-80s in the summer.
Economy
Wallburg’s economy is largely based on agriculture. The town is home to several farms, which produce a variety of crops, including corn, soybeans, and tobacco. The town also has several small businesses, including a gas station, a convenience store, and a restaurant.
Demographics
As of 2019, the population of Wallburg was estimated to be 1,845. The town is predominantly white, with a small African American population. The median household income in Wallburg is $45,000, and the median home value is $150,000.
Conclusion
Wallburg is a small unincorporated community located in Davidson County, North Carolina. It is situated in the foothills of the Blue Ridge Mountains, approximately 20 miles north of Winston-Salem. The town was first settled in the late 1700s by German immigrants, and was officially incorporated in 1891. Wallburg’s economy is largely based on agriculture, and the town is home to several small businesses. The population of Wallburg was estimated to be 1,845 in 2019.
Common Questions
What is the Total Population of Wallburg?
Total Population of Wallburg is 3,081.
What is the Total Male Population of Wallburg?
Total Male Population of Wallburg is 1,571.
What is the Total Female Population of Wallburg?
Total Female Population of Wallburg is 1,510.
What is the Ratio of Males per 100 Females in Wallburg?
There are 104.04 Males per 100 Females in Wallburg.
What is the Ratio of Females per 100 Males in Wallburg?
There are 96.12 Females per 100 Males in Wallburg.
What is the Median Population Age in Wallburg?
Median Population Age in Wallburg is 53.7 Years.
What is the Average Family Size in Wallburg
Average Family Size in Wallburg is 2.6 People.
What is the Average Household Size in Wallburg
Average Household Size in Wallburg is 2.3 People.
What is Per Capita Income in Wallburg?
Per Capita income in Wallburg is $40,645.
What is the Median Family Income in Wallburg?
Median Family Income in Wallburg is $92,619.
What is the Median Household income in Wallburg?
Median Household Income in Wallburg is $80,592.
What is Income or Wage Gap in Wallburg?
Income or Wage Gap in Wallburg is 38.7%.
Women in Wallburg earn 61.3 cents for every dollar earned by a man.
What is Inequality or Gini Index in Wallburg?
Inequality or Gini Index in Wallburg is 0.40.
How Large is the Labor Force in Wallburg?
There are 1,640 People in the Labor Forcein in Wallburg.
What is the Percentage of People in the Labor Force in Wallburg?
59.6% of People are in the Labor Force in Wallburg.
What is the Unemployment Rate in Wallburg?
Unemployment Rate in Wallburg is 8.2%.