Minnesott Beach, NC
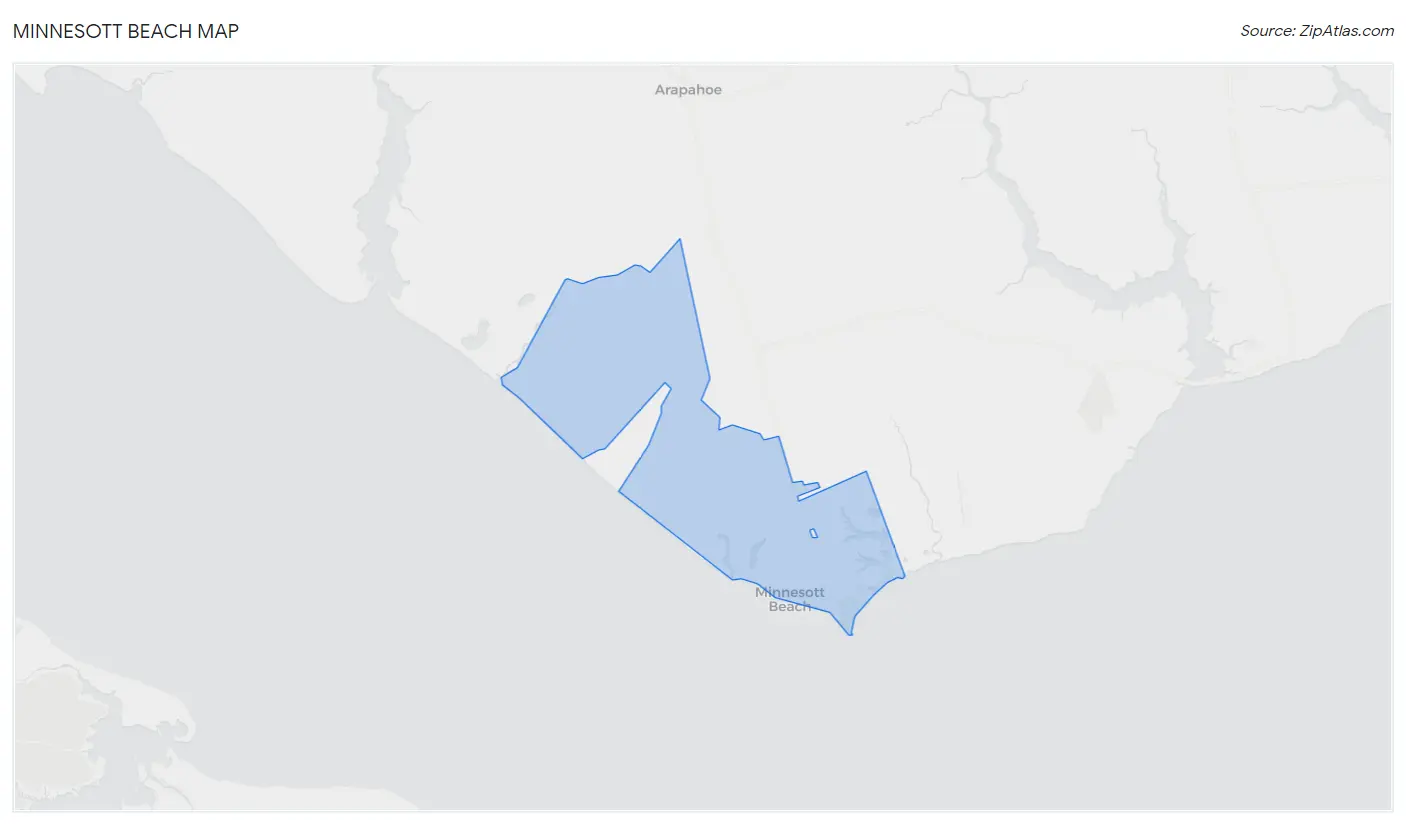
Minnesott Beach Map
Minnesott Beach Overview
486
TOTAL POPULATION
251
MALE POPULATION
235
FEMALE POPULATION
106.81
MALES / 100 FEMALES
93.63
FEMALES / 100 MALES
65.5
MEDIAN AGE
2.3
AVG FAMILY SIZE
1.9
AVG HOUSEHOLD SIZE
$51,136
PER CAPITA INCOME
$92,188
AVG FAMILY INCOME
$77,596
AVG HOUSEHOLD INCOME
25.5%
WAGE / INCOME GAP [ % ]
74.5¢/ $1
WAGE / INCOME GAP [ $ ]
0.43
INEQUALITY / GINI INDEX
156
LABOR FORCE [ PEOPLE ]
34.6%
PERCENT IN LABOR FORCE
Minnesott Beach Area Codes
Race in Minnesott Beach
The most populous races in Minnesott Beach are White / Caucasian (468 | 96.3%), Hispanic or Latino (38 | 7.8%), and Two or more Races (11 | 2.3%).
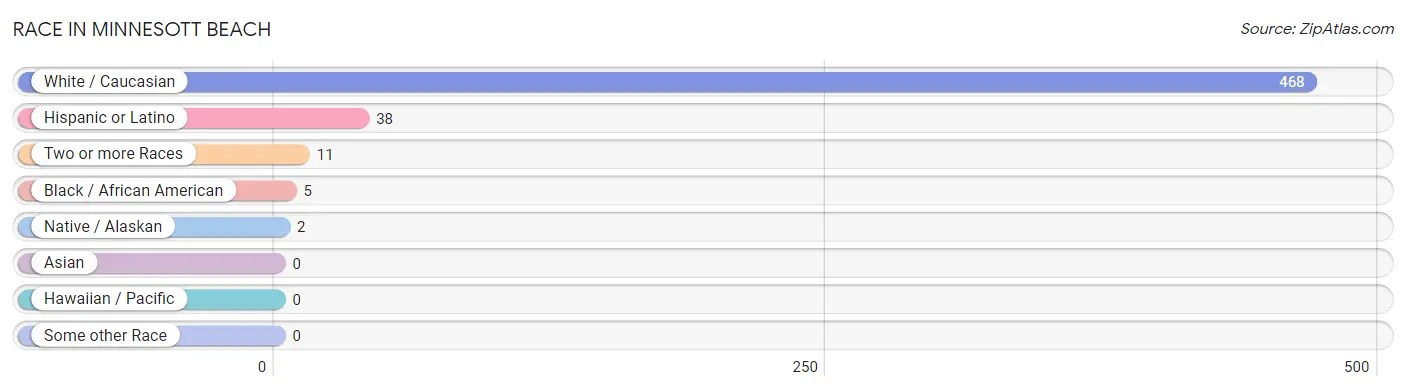
| Race | # Population | % Population |
| Asian | 0 | 0.0% |
| Black / African American | 5 | 1.0% |
| Hawaiian / Pacific | 0 | 0.0% |
| Hispanic or Latino | 38 | 7.8% |
| Native / Alaskan | 2 | 0.4% |
| White / Caucasian | 468 | 96.3% |
| Two or more Races | 11 | 2.3% |
| Some other Race | 0 | 0.0% |
| Total | 486 | 100.0% |
Ancestry in Minnesott Beach
The most populous ancestries reported in Minnesott Beach are Irish (93 | 19.1%), English (85 | 17.5%), American (59 | 12.1%), German (55 | 11.3%), and Scottish (29 | 6.0%), together accounting for 66.1% of all Minnesott Beach residents.
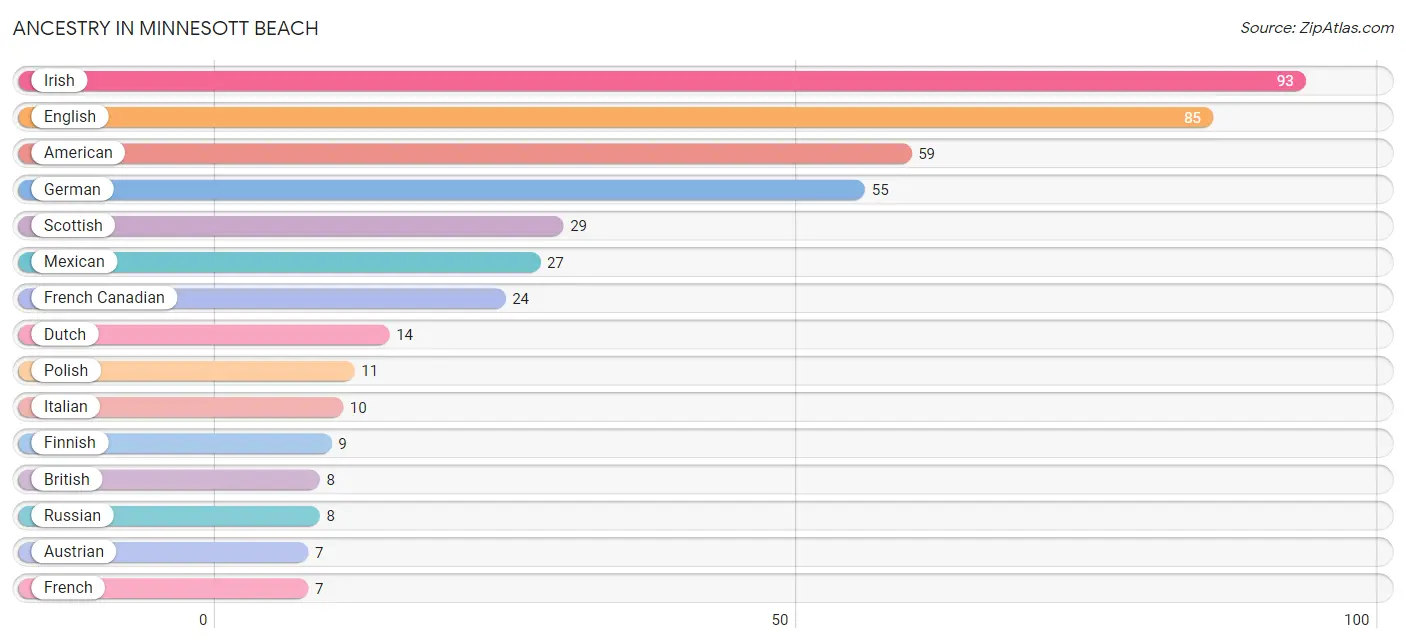
| Ancestry | # Population | % Population |
| American | 59 | 12.1% |
| Arab | 3 | 0.6% |
| Austrian | 7 | 1.4% |
| British | 8 | 1.7% |
| Croatian | 5 | 1.0% |
| Cuban | 3 | 0.6% |
| Dutch | 14 | 2.9% |
| Eastern European | 4 | 0.8% |
| English | 85 | 17.5% |
| European | 6 | 1.2% |
| Finnish | 9 | 1.8% |
| French | 7 | 1.4% |
| French Canadian | 24 | 4.9% |
| German | 55 | 11.3% |
| Greek | 2 | 0.4% |
| Irish | 93 | 19.1% |
| Iroquois | 2 | 0.4% |
| Italian | 10 | 2.1% |
| Lebanese | 3 | 0.6% |
| Mexican | 27 | 5.6% |
| Norwegian | 5 | 1.0% |
| Polish | 11 | 2.3% |
| Portuguese | 2 | 0.4% |
| Puerto Rican | 3 | 0.6% |
| Russian | 8 | 1.7% |
| Scandinavian | 2 | 0.4% |
| Scotch-Irish | 7 | 1.4% |
| Scottish | 29 | 6.0% |
| Spanish | 5 | 1.0% |
| Swedish | 2 | 0.4% |
| Welsh | 2 | 0.4% | View All 31 Rows |
Immigrants in Minnesott Beach
The most numerous immigrant groups reported in Minnesott Beach came from Europe (10 | 2.1%), Central America (5 | 1.0%), Croatia (5 | 1.0%), Eastern Europe (5 | 1.0%), and Latin America (5 | 1.0%), together accounting for 6.2% of all Minnesott Beach residents.
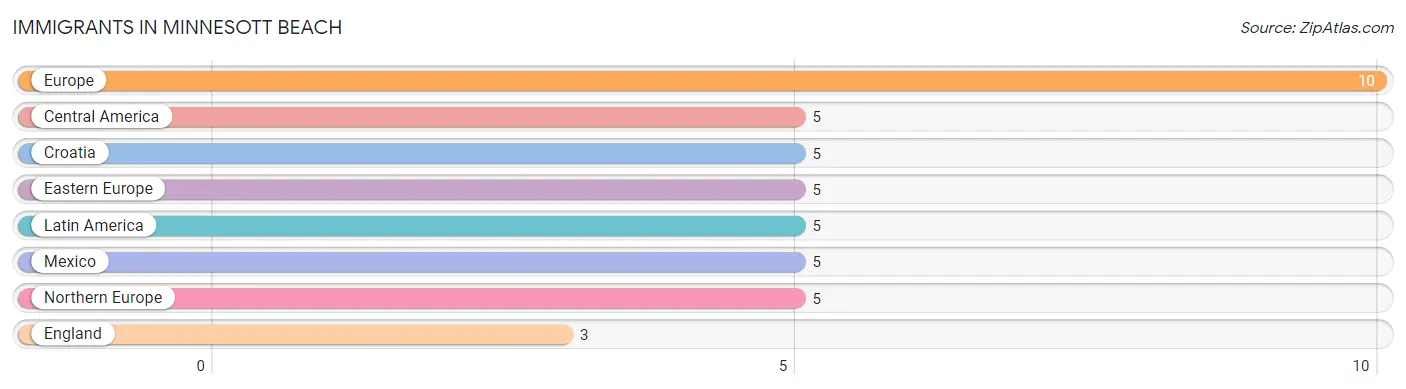
| Immigration Origin | # Population | % Population |
| Central America | 5 | 1.0% |
| Croatia | 5 | 1.0% |
| Eastern Europe | 5 | 1.0% |
| England | 3 | 0.6% |
| Europe | 10 | 2.1% |
| Latin America | 5 | 1.0% |
| Mexico | 5 | 1.0% |
| Northern Europe | 5 | 1.0% | View All 8 Rows |
Sex and Age in Minnesott Beach
Sex and Age in Minnesott Beach
The most populous age groups in Minnesott Beach are 65 to 69 Years (47 | 18.7%) for men and 65 to 69 Years (50 | 21.3%) for women.
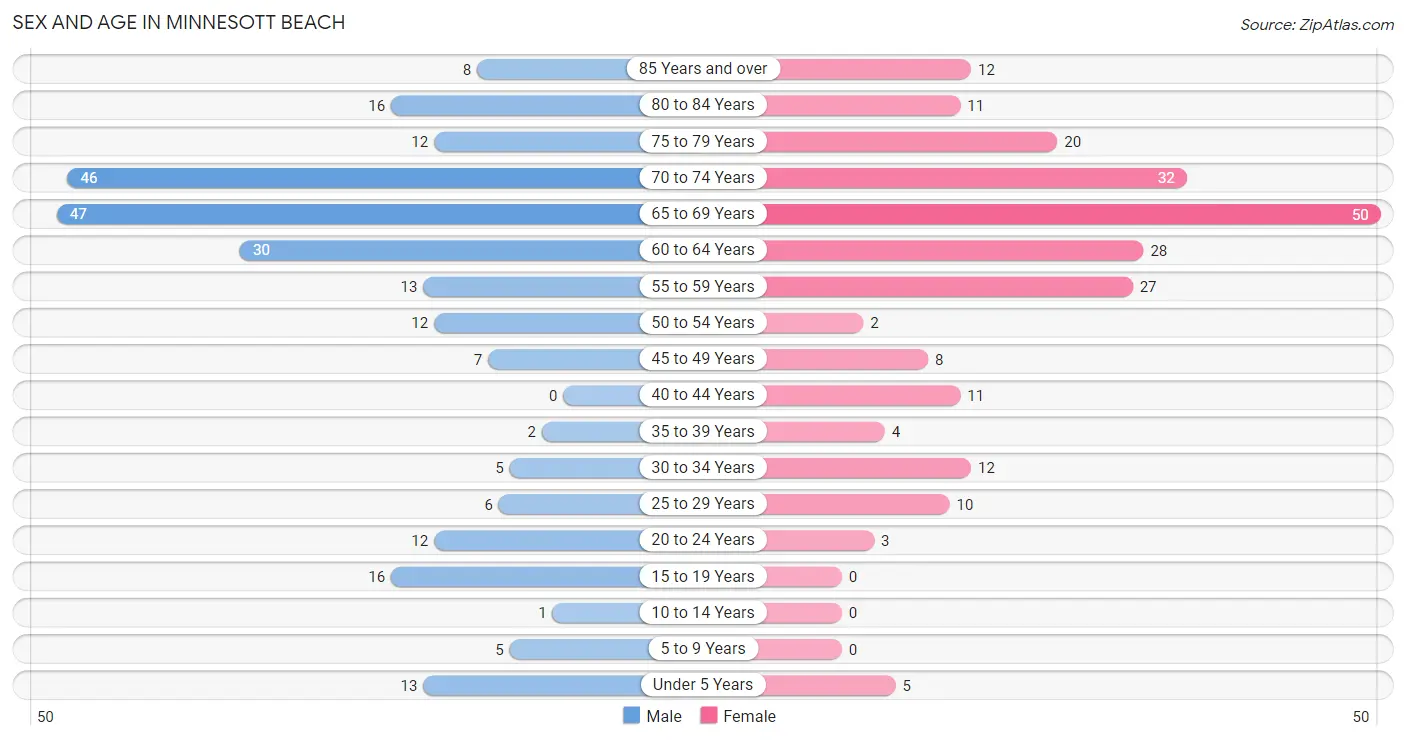
| Age Bracket | Male | Female |
| Under 5 Years | 13 (5.2%) | 5 (2.1%) |
| 5 to 9 Years | 5 (2.0%) | 0 (0.0%) |
| 10 to 14 Years | 1 (0.4%) | 0 (0.0%) |
| 15 to 19 Years | 16 (6.4%) | 0 (0.0%) |
| 20 to 24 Years | 12 (4.8%) | 3 (1.3%) |
| 25 to 29 Years | 6 (2.4%) | 10 (4.3%) |
| 30 to 34 Years | 5 (2.0%) | 12 (5.1%) |
| 35 to 39 Years | 2 (0.8%) | 4 (1.7%) |
| 40 to 44 Years | 0 (0.0%) | 11 (4.7%) |
| 45 to 49 Years | 7 (2.8%) | 8 (3.4%) |
| 50 to 54 Years | 12 (4.8%) | 2 (0.9%) |
| 55 to 59 Years | 13 (5.2%) | 27 (11.5%) |
| 60 to 64 Years | 30 (11.9%) | 28 (11.9%) |
| 65 to 69 Years | 47 (18.7%) | 50 (21.3%) |
| 70 to 74 Years | 46 (18.3%) | 32 (13.6%) |
| 75 to 79 Years | 12 (4.8%) | 20 (8.5%) |
| 80 to 84 Years | 16 (6.4%) | 11 (4.7%) |
| 85 Years and over | 8 (3.2%) | 12 (5.1%) |
| Total | 251 (100.0%) | 235 (100.0%) |
Families and Households in Minnesott Beach
Median Family Size in Minnesott Beach
The median family size in Minnesott Beach is 2.26 persons per family, with single male/father families (9 | 5.4%) accounting for the largest median family size of 3.89 persons per family. On the other hand, married-couple families (149 | 89.2%) represent the smallest median family size with 2.13 persons per family.
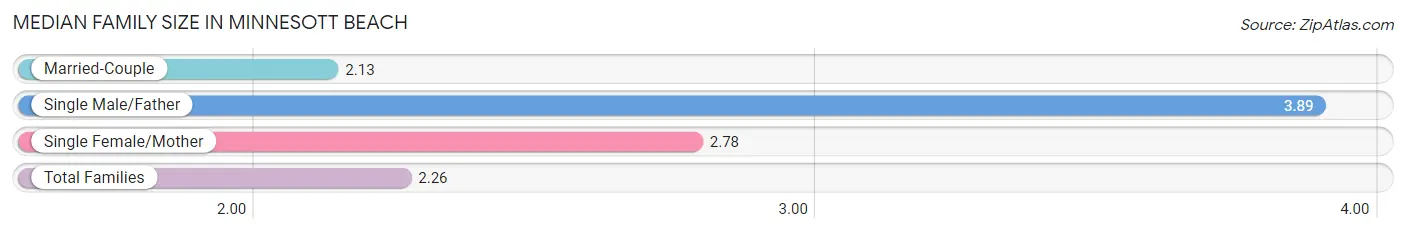
| Family Type | # Families | Family Size |
| Married-Couple | 149 (89.2%) | 2.13 |
| Single Male/Father | 9 (5.4%) | 3.89 |
| Single Female/Mother | 9 (5.4%) | 2.78 |
| Total Families | 167 (100.0%) | 2.26 |
Median Household Size in Minnesott Beach
The median household size in Minnesott Beach is 1.88 persons per household, with single male/father households (9 | 3.5%) accounting for the largest median household size of 3.89 persons per household. non-family households (92 | 35.5%) represent the smallest median household size with 1.13 persons per household.
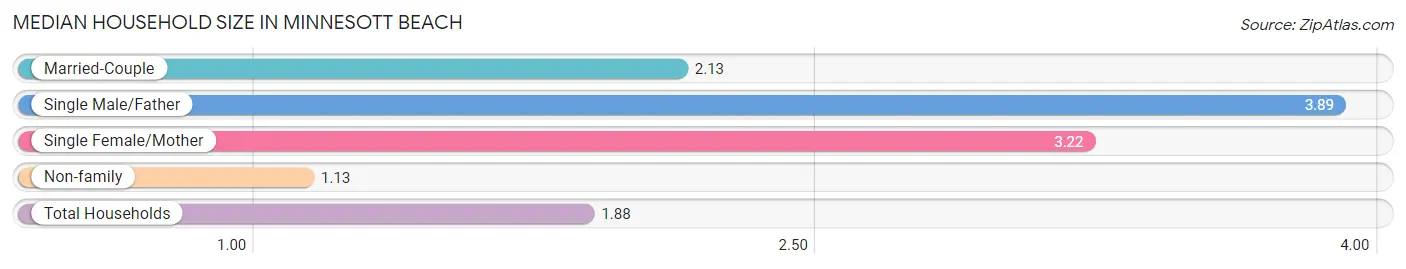
| Household Type | # Households | Household Size |
| Married-Couple | 149 (57.5%) | 2.13 |
| Single Male/Father | 9 (3.5%) | 3.89 |
| Single Female/Mother | 9 (3.5%) | 3.22 |
| Non-family | 92 (35.5%) | 1.13 |
| Total Households | 259 (100.0%) | 1.88 |
Household Size by Marriage Status in Minnesott Beach
Out of a total of 259 households in Minnesott Beach, 167 (64.5%) are family households, while 92 (35.5%) are nonfamily households. The most numerous type of family households are 2-person households, comprising 124, and the most common type of nonfamily households are 1-person households, comprising 81.
| Household Size | Family Households | Nonfamily Households |
| 1-Person Households | - | 81 (31.3%) |
| 2-Person Households | 124 (47.9%) | 11 (4.3%) |
| 3-Person Households | 32 (12.4%) | 0 (0.0%) |
| 4-Person Households | 11 (4.3%) | 0 (0.0%) |
| 5-Person Households | 0 (0.0%) | 0 (0.0%) |
| 6-Person Households | 0 (0.0%) | 0 (0.0%) |
| 7+ Person Households | 0 (0.0%) | 0 (0.0%) |
| Total | 167 (64.5%) | 92 (35.5%) |
Female Fertility in Minnesott Beach
Fertility by Age in Minnesott Beach
Average fertility rate in Minnesott Beach is 167.0 births per 1,000 women. Women in the age bracket of 20 to 34 years have the highest fertility rate with 320.0 births per 1,000 women. Women in the age bracket of 20 to 34 years acount for 100.0% of all women with births.
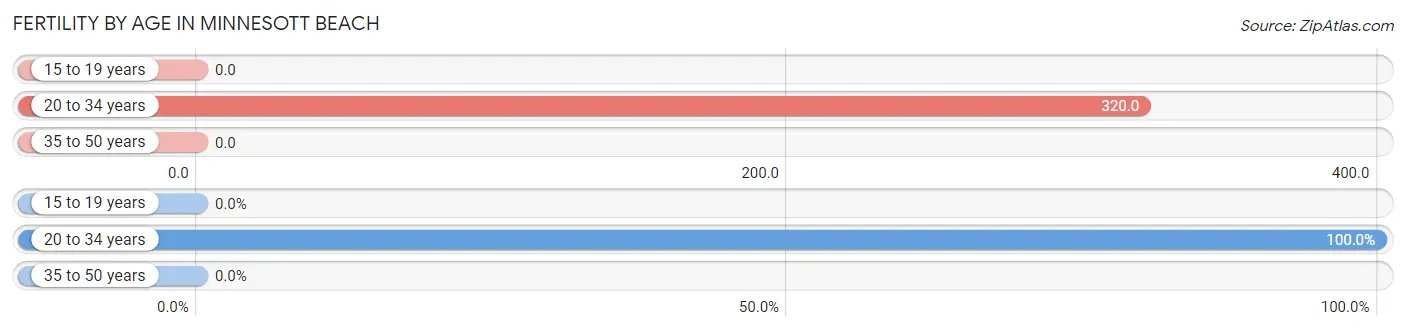
| Age Bracket | Women with Births | Births / 1,000 Women |
| 15 to 19 years | 0 (0.0%) | 0.0 |
| 20 to 34 years | 8 (100.0%) | 320.0 |
| 35 to 50 years | 0 (0.0%) | 0.0 |
| Total | 8 (100.0%) | 167.0 |
Fertility by Age by Marriage Status in Minnesott Beach
37.5% of women with births (8) in Minnesott Beach are married. The highest percentage of unmarried women with births falls into 20 to 34 years age bracket with 62.5% of them unmarried at the time of birth, while the lowest percentage of unmarried women with births belong to 20 to 34 years age bracket with 62.5% of them unmarried.
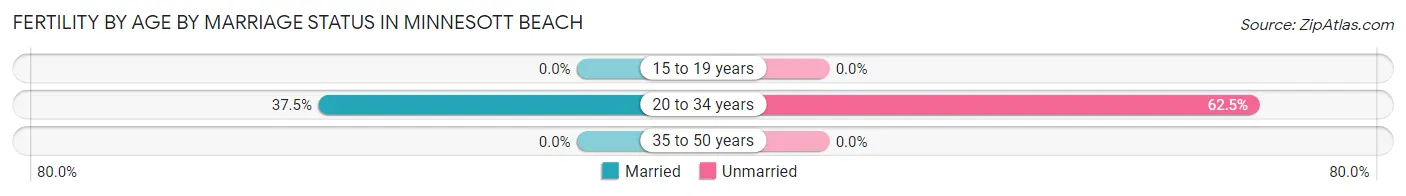
| Age Bracket | Married | Unmarried |
| 15 to 19 years | 0 (0.0%) | 0 (0.0%) |
| 20 to 34 years | 3 (37.5%) | 5 (62.5%) |
| 35 to 50 years | 0 (0.0%) | 0 (0.0%) |
| Total | 3 (37.5%) | 5 (62.5%) |
Fertility by Education in Minnesott Beach
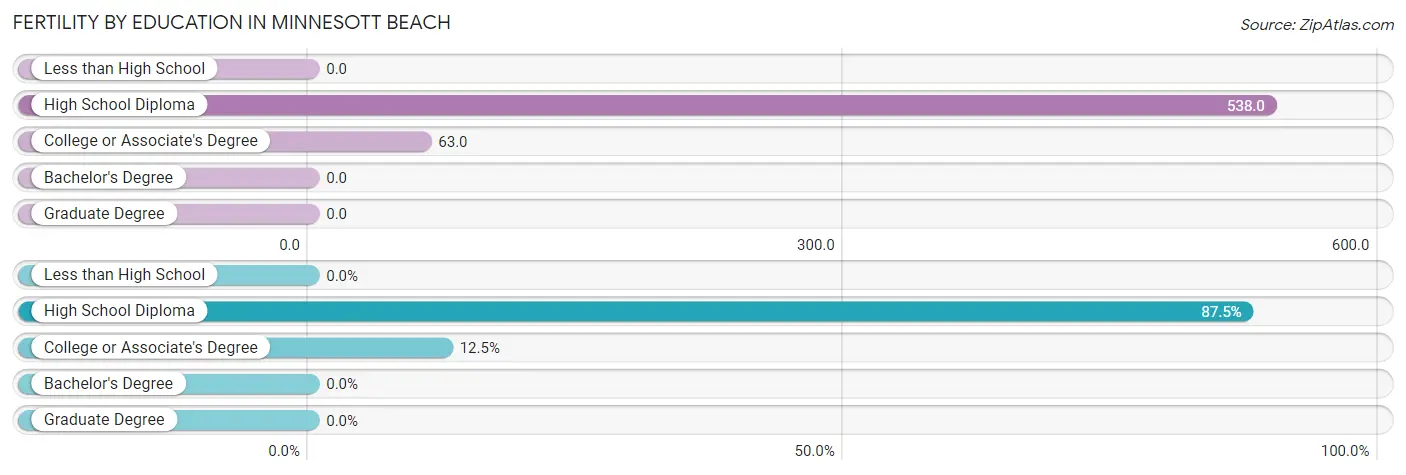
| Educational Attainment | Women with Births | Births / 1,000 Women |
| Less than High School | 0 (0.0%) | 0.0 |
| High School Diploma | 7 (87.5%) | 538.0 |
| College or Associate's Degree | 1 (12.5%) | 63.0 |
| Bachelor's Degree | 0 (0.0%) | 0.0 |
| Graduate Degree | 0 (0.0%) | 0.0 |
| Total | 8 (100.0%) | 167.0 |
Fertility by Education by Marriage Status in Minnesott Beach
62.5% of women with births in Minnesott Beach are unmarried. Women with the educational attainment of college or associate's degree are most likely to be married with 100.0% of them married at childbirth, while women with the educational attainment of high school diploma are least likely to be married with 71.4% of them unmarried at childbirth.
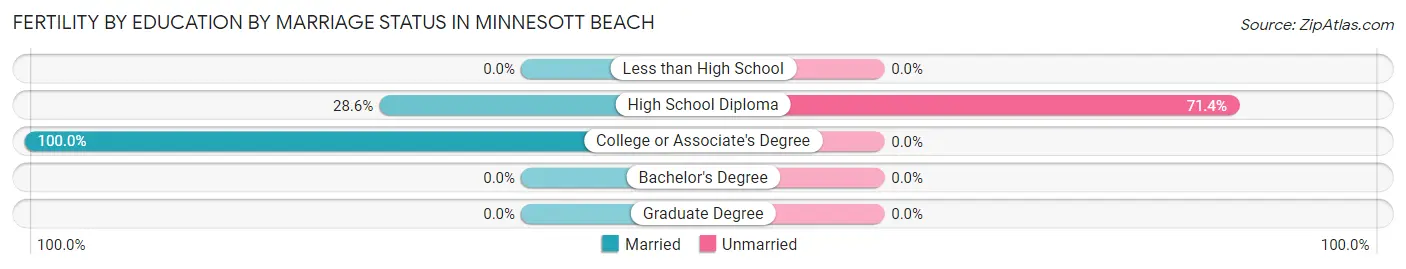
| Educational Attainment | Married | Unmarried |
| Less than High School | 0 (0.0%) | 0 (0.0%) |
| High School Diploma | 2 (28.6%) | 5 (71.4%) |
| College or Associate's Degree | 1 (100.0%) | 0 (0.0%) |
| Bachelor's Degree | 0 (0.0%) | 0 (0.0%) |
| Graduate Degree | 0 (0.0%) | 0 (0.0%) |
| Total | 3 (37.5%) | 5 (62.5%) |
Income in Minnesott Beach
Income Overview in Minnesott Beach
Per Capita Income in Minnesott Beach is $51,136, while median incomes of families and households are $92,188 and $77,596 respectively.
| Characteristic | Number | Measure |
| Per Capita Income | 486 | $51,136 |
| Median Family Income | 167 | $92,188 |
| Mean Family Income | 167 | $119,670 |
| Median Household Income | 259 | $77,596 |
| Mean Household Income | 259 | $101,060 |
| Income Deficit | 167 | $0 |
| Wage / Income Gap (%) | 486 | 25.47% |
| Wage / Income Gap ($) | 486 | 74.53¢ per $1 |
| Gini / Inequality Index | 486 | 0.43 |
Earnings by Sex in Minnesott Beach
Average Earnings in Minnesott Beach are $61,667, $66,250 for men and $49,375 for women, a difference of 25.5%.
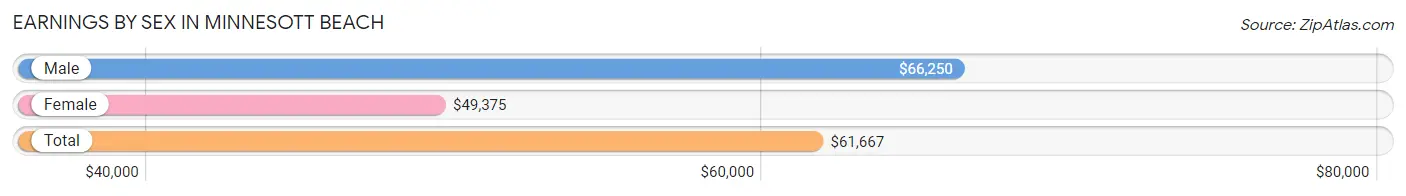
| Sex | Number | Average Earnings |
| Male | 83 (50.0%) | $66,250 |
| Female | 83 (50.0%) | $49,375 |
| Total | 166 (100.0%) | $61,667 |
Earnings by Sex by Income Bracket in Minnesott Beach
The most common earnings brackets in Minnesott Beach are $100,000+ for men (33 | 39.8%) and $75,000 to $99,999 for women (22 | 26.5%).
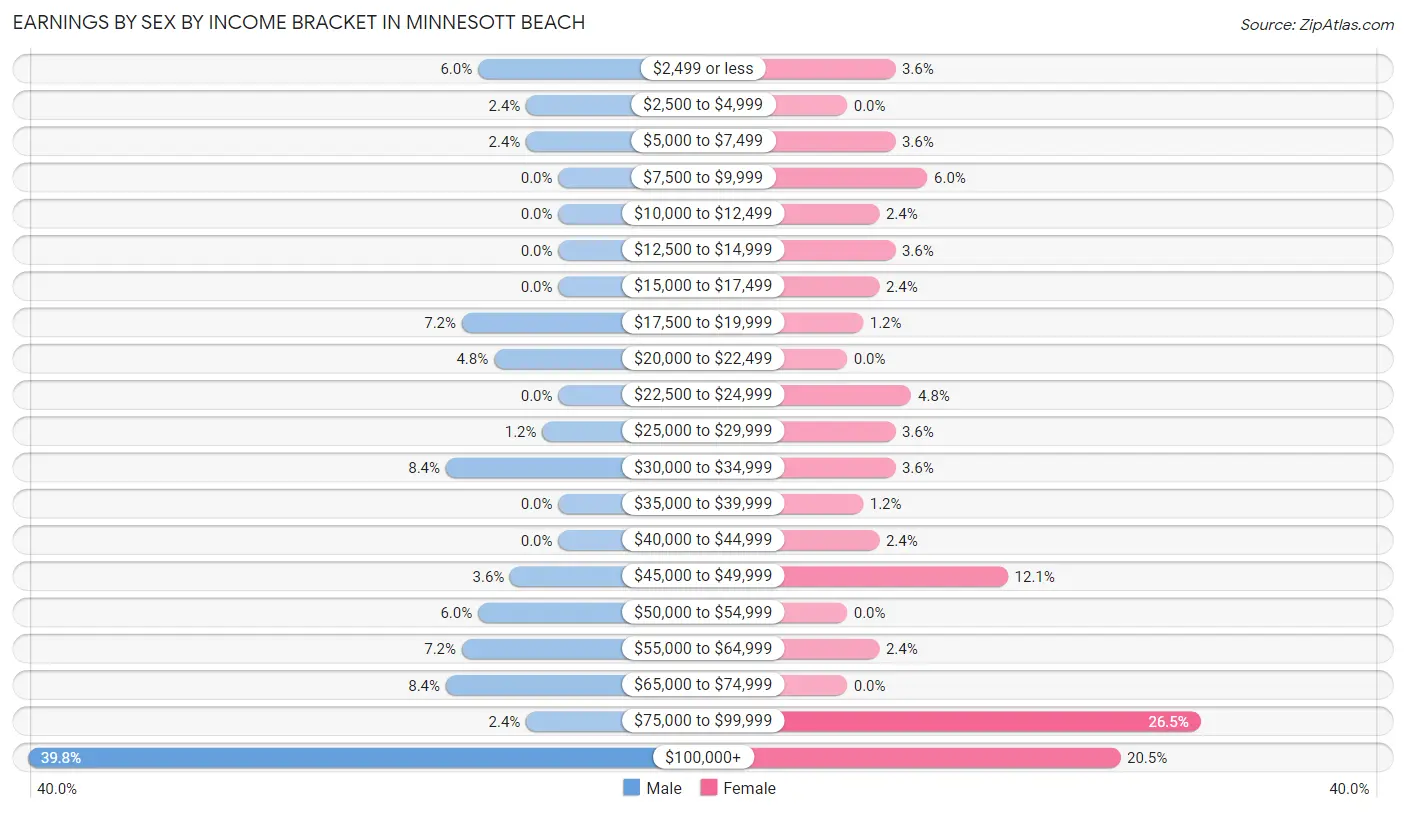
| Income | Male | Female |
| $2,499 or less | 5 (6.0%) | 3 (3.6%) |
| $2,500 to $4,999 | 2 (2.4%) | 0 (0.0%) |
| $5,000 to $7,499 | 2 (2.4%) | 3 (3.6%) |
| $7,500 to $9,999 | 0 (0.0%) | 5 (6.0%) |
| $10,000 to $12,499 | 0 (0.0%) | 2 (2.4%) |
| $12,500 to $14,999 | 0 (0.0%) | 3 (3.6%) |
| $15,000 to $17,499 | 0 (0.0%) | 2 (2.4%) |
| $17,500 to $19,999 | 6 (7.2%) | 1 (1.2%) |
| $20,000 to $22,499 | 4 (4.8%) | 0 (0.0%) |
| $22,500 to $24,999 | 0 (0.0%) | 4 (4.8%) |
| $25,000 to $29,999 | 1 (1.2%) | 3 (3.6%) |
| $30,000 to $34,999 | 7 (8.4%) | 3 (3.6%) |
| $35,000 to $39,999 | 0 (0.0%) | 1 (1.2%) |
| $40,000 to $44,999 | 0 (0.0%) | 2 (2.4%) |
| $45,000 to $49,999 | 3 (3.6%) | 10 (12.0%) |
| $50,000 to $54,999 | 5 (6.0%) | 0 (0.0%) |
| $55,000 to $64,999 | 6 (7.2%) | 2 (2.4%) |
| $65,000 to $74,999 | 7 (8.4%) | 0 (0.0%) |
| $75,000 to $99,999 | 2 (2.4%) | 22 (26.5%) |
| $100,000+ | 33 (39.8%) | 17 (20.5%) |
| Total | 83 (100.0%) | 83 (100.0%) |
Earnings by Sex by Educational Attainment in Minnesott Beach
Average earnings in Minnesott Beach are $72,500 for men and $61,250 for women, a difference of 15.5%. Men with an educational attainment of high school diploma enjoy the highest average annual earnings of $115,250, while those with high school diploma education earn the least with $115,250. Women with an educational attainment of graduate degree earn the most with the average annual earnings of $92,500, while those with high school diploma education have the smallest earnings of $41,250.
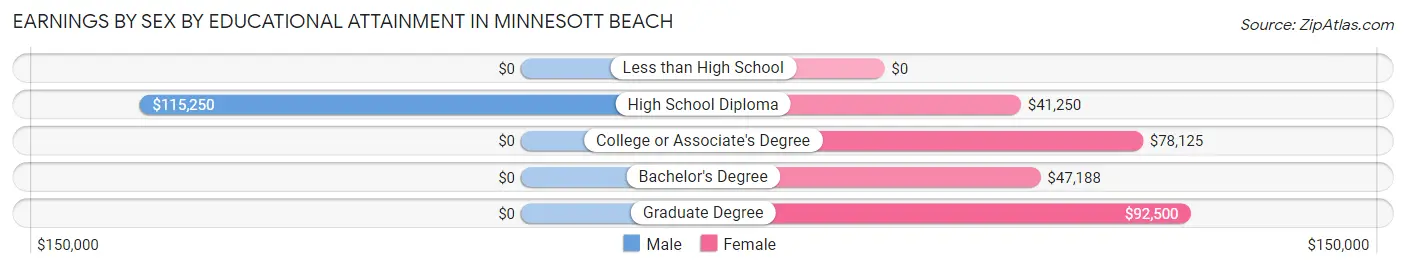
| Educational Attainment | Male Income | Female Income |
| Less than High School | - | - |
| High School Diploma | $115,250 | $41,250 |
| College or Associate's Degree | - | - |
| Bachelor's Degree | - | - |
| Graduate Degree | - | - |
| Total | $72,500 | $61,250 |
Family Income in Minnesott Beach
Family Income Brackets in Minnesott Beach
According to the Minnesott Beach family income data, there are 44 families falling into the $100,000 to $149,999 income range, which is the most common income bracket and makes up 26.4% of all families. Conversely, the $25,000 to $34,999 income bracket is the least frequent group with only 1 families (0.6%) belonging to this category.
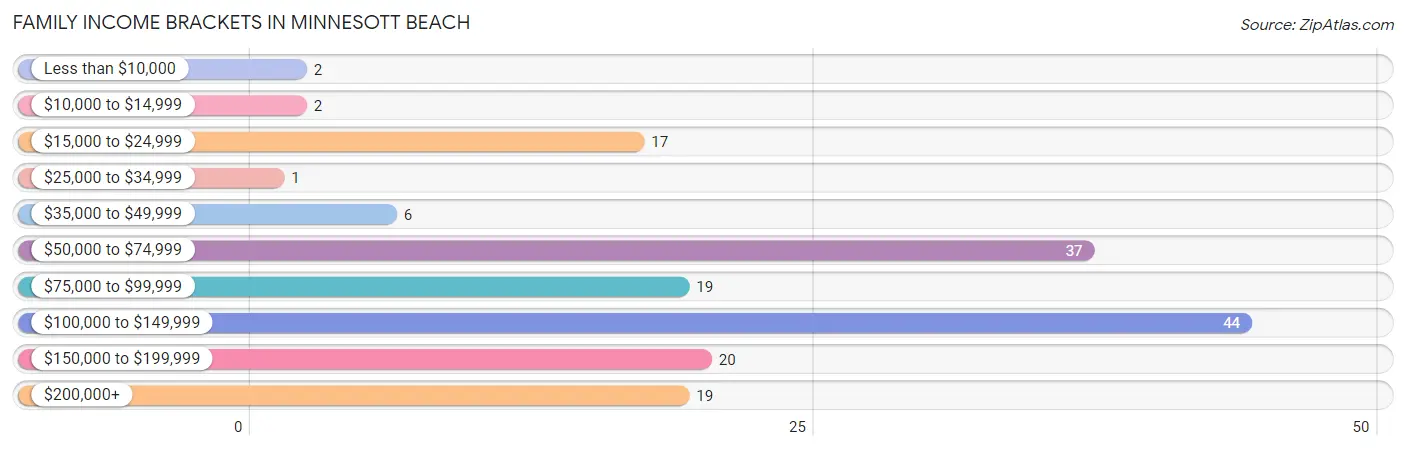
| Income Bracket | # Families | % Families |
| Less than $10,000 | 2 | 1.2% |
| $10,000 to $14,999 | 2 | 1.2% |
| $15,000 to $24,999 | 17 | 10.2% |
| $25,000 to $34,999 | 1 | 0.6% |
| $35,000 to $49,999 | 6 | 3.6% |
| $50,000 to $74,999 | 37 | 22.2% |
| $75,000 to $99,999 | 19 | 11.4% |
| $100,000 to $149,999 | 44 | 26.3% |
| $150,000 to $199,999 | 20 | 12.0% |
| $200,000+ | 19 | 11.4% |
Family Income by Famaliy Size in Minnesott Beach
3-person families (31 | 18.6%) account for the highest median family income in Minnesott Beach with $158,750 per family, while 3-person families (31 | 18.6%) have the highest median income of $52,917 per family member.
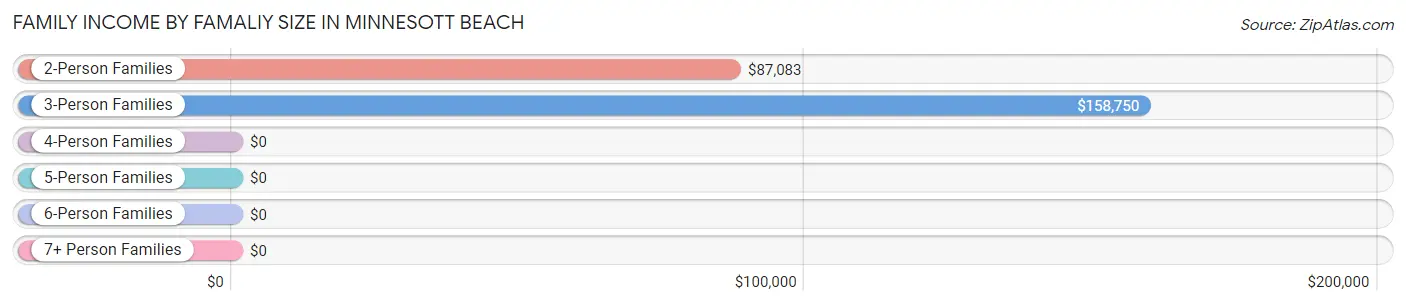
| Income Bracket | # Families | Median Income |
| 2-Person Families | 126 (75.4%) | $87,083 |
| 3-Person Families | 31 (18.6%) | $158,750 |
| 4-Person Families | 10 (6.0%) | $0 |
| 5-Person Families | 0 (0.0%) | $0 |
| 6-Person Families | 0 (0.0%) | $0 |
| 7+ Person Families | 0 (0.0%) | $0 |
| Total | 167 (100.0%) | $92,188 |
Family Income by Number of Earners in Minnesott Beach
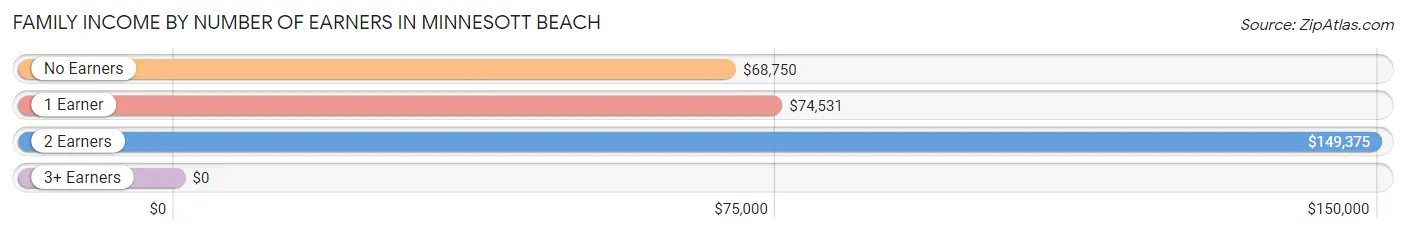
| Number of Earners | # Families | Median Income |
| No Earners | 78 (46.7%) | $68,750 |
| 1 Earner | 31 (18.6%) | $74,531 |
| 2 Earners | 58 (34.7%) | $149,375 |
| 3+ Earners | 0 (0.0%) | $0 |
| Total | 167 (100.0%) | $92,188 |
Household Income in Minnesott Beach
Household Income Brackets in Minnesott Beach
With 63 households falling in the category, the $100,000 to $149,999 income range is the most frequent in Minnesott Beach, accounting for 24.3% of all households. In contrast, only 4 households (1.5%) fall into the less than $10,000 income bracket, making it the least populous group.
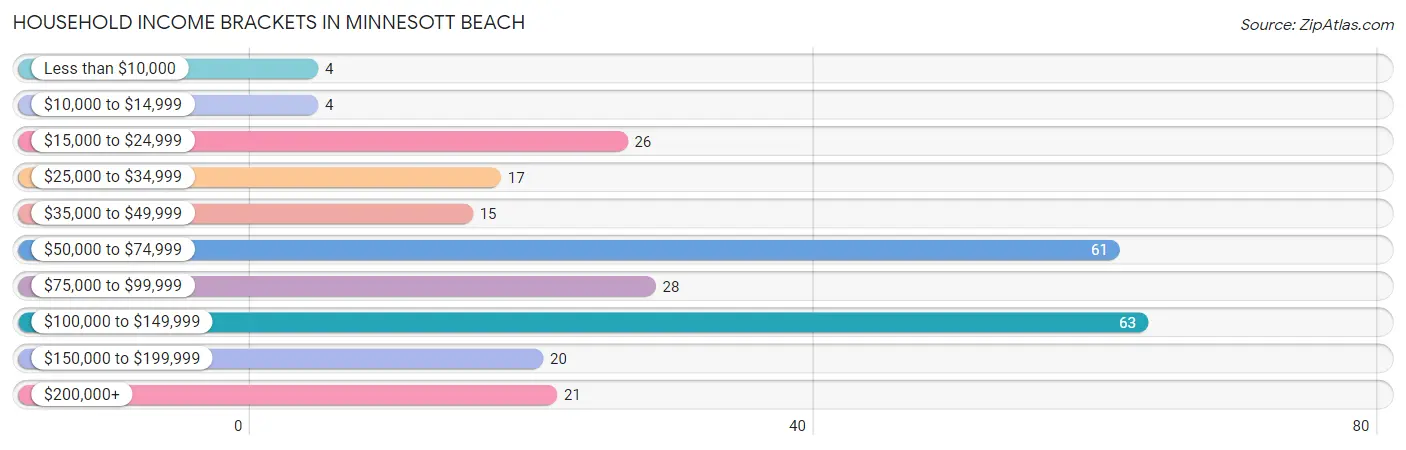
| Income Bracket | # Households | % Households |
| Less than $10,000 | 4 | 1.5% |
| $10,000 to $14,999 | 4 | 1.5% |
| $15,000 to $24,999 | 26 | 10.0% |
| $25,000 to $34,999 | 17 | 6.6% |
| $35,000 to $49,999 | 15 | 5.8% |
| $50,000 to $74,999 | 61 | 23.6% |
| $75,000 to $99,999 | 28 | 10.8% |
| $100,000 to $149,999 | 63 | 24.3% |
| $150,000 to $199,999 | 20 | 7.7% |
| $200,000+ | 21 | 8.1% |
Household Income by Householder Age in Minnesott Beach
The median household income in Minnesott Beach is $77,596, with the highest median household income of $159,375 found in the 25 to 44 years age bracket for the primary householder. A total of 27 households (10.4%) fall into this category.
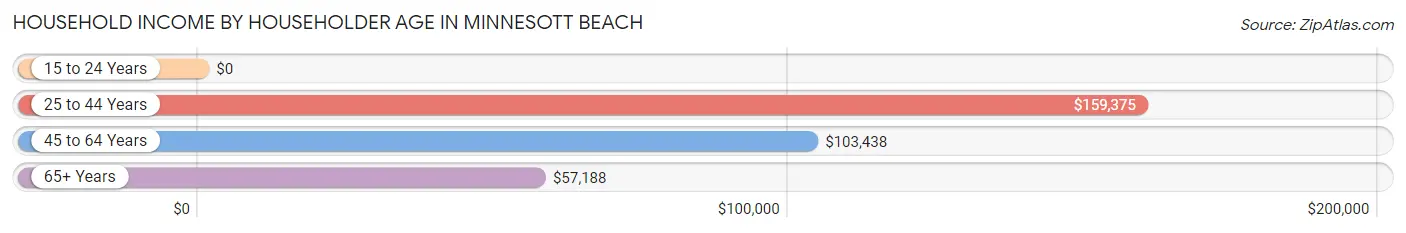
| Income Bracket | # Households | Median Income |
| 15 to 24 Years | 0 (0.0%) | $0 |
| 25 to 44 Years | 27 (10.4%) | $159,375 |
| 45 to 64 Years | 75 (29.0%) | $103,438 |
| 65+ Years | 157 (60.6%) | $57,188 |
| Total | 259 (100.0%) | $77,596 |
Poverty in Minnesott Beach
Income Below Poverty by Sex and Age in Minnesott Beach
With 16.7% poverty level for males and 10.6% for females among the residents of Minnesott Beach, 18 to 24 year old males and 45 to 54 year old females are the most vulnerable to poverty, with 12 males (100.0%) and 5 females (50.0%) in their respective age groups living below the poverty level.
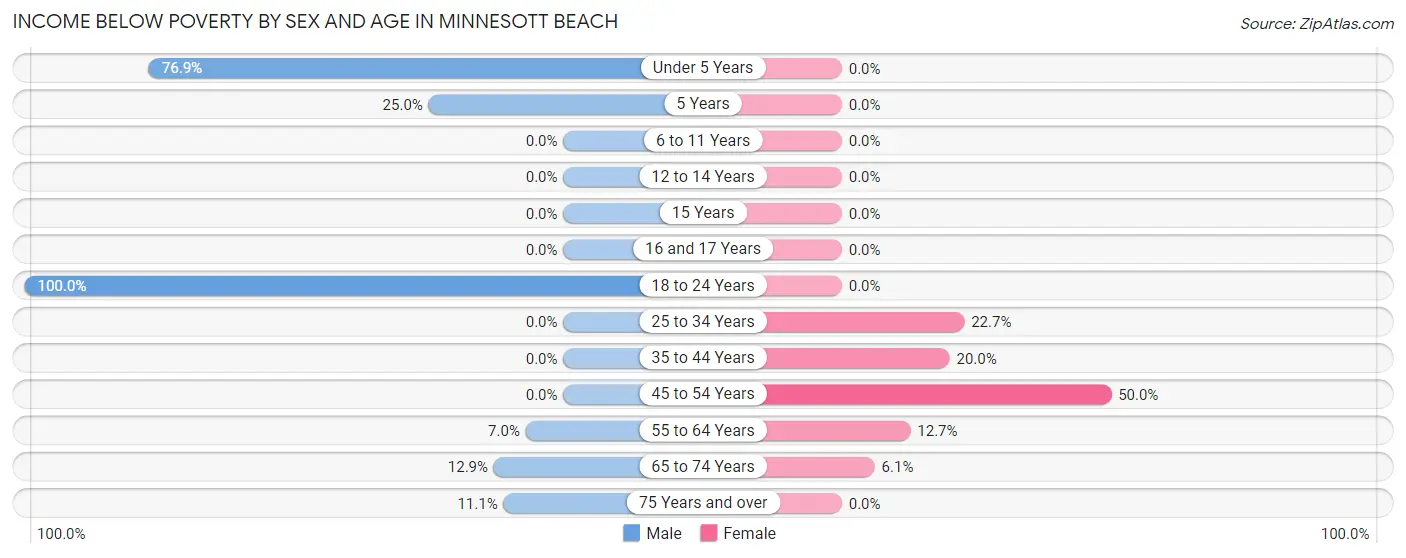
| Age Bracket | Male | Female |
| Under 5 Years | 10 (76.9%) | 0 (0.0%) |
| 5 Years | 1 (25.0%) | 0 (0.0%) |
| 6 to 11 Years | 0 (0.0%) | 0 (0.0%) |
| 12 to 14 Years | 0 (0.0%) | 0 (0.0%) |
| 15 Years | 0 (0.0%) | 0 (0.0%) |
| 16 and 17 Years | 0 (0.0%) | 0 (0.0%) |
| 18 to 24 Years | 12 (100.0%) | 0 (0.0%) |
| 25 to 34 Years | 0 (0.0%) | 5 (22.7%) |
| 35 to 44 Years | 0 (0.0%) | 3 (20.0%) |
| 45 to 54 Years | 0 (0.0%) | 5 (50.0%) |
| 55 to 64 Years | 3 (7.0%) | 7 (12.7%) |
| 65 to 74 Years | 12 (12.9%) | 5 (6.1%) |
| 75 Years and over | 4 (11.1%) | 0 (0.0%) |
| Total | 42 (16.7%) | 25 (10.6%) |
Income Above Poverty by Sex and Age in Minnesott Beach
According to the poverty statistics in Minnesott Beach, males aged 6 to 11 years and females aged under 5 years are the age groups that are most secure financially, with 100.0% of males and 100.0% of females in these age groups living above the poverty line.
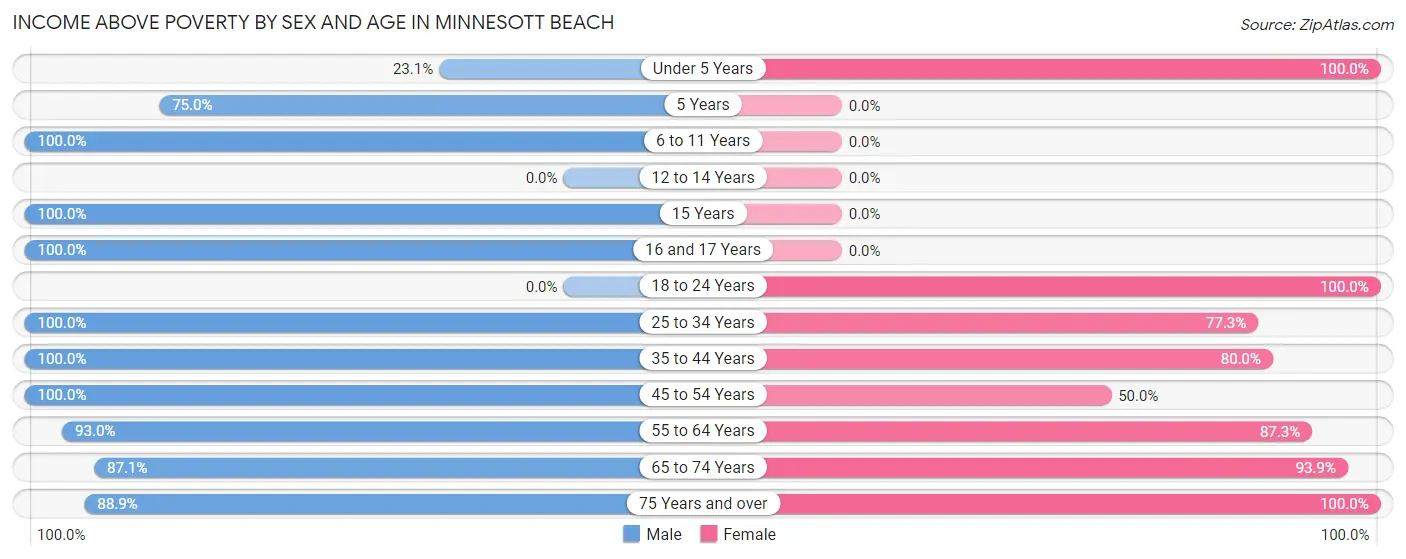
| Age Bracket | Male | Female |
| Under 5 Years | 3 (23.1%) | 5 (100.0%) |
| 5 Years | 3 (75.0%) | 0 (0.0%) |
| 6 to 11 Years | 2 (100.0%) | 0 (0.0%) |
| 12 to 14 Years | 0 (0.0%) | 0 (0.0%) |
| 15 Years | 11 (100.0%) | 0 (0.0%) |
| 16 and 17 Years | 5 (100.0%) | 0 (0.0%) |
| 18 to 24 Years | 0 (0.0%) | 3 (100.0%) |
| 25 to 34 Years | 11 (100.0%) | 17 (77.3%) |
| 35 to 44 Years | 2 (100.0%) | 12 (80.0%) |
| 45 to 54 Years | 19 (100.0%) | 5 (50.0%) |
| 55 to 64 Years | 40 (93.0%) | 48 (87.3%) |
| 65 to 74 Years | 81 (87.1%) | 77 (93.9%) |
| 75 Years and over | 32 (88.9%) | 43 (100.0%) |
| Total | 209 (83.3%) | 210 (89.4%) |
Income Below Poverty Among Married-Couple Families in Minnesott Beach
The poverty statistics for married-couple families in Minnesott Beach show that 2.7% or 4 of the total 149 families live below the poverty line. Families with no children have the highest poverty rate of 3.3%, comprising of 4 families. On the other hand, families with 1 or 2 children have the lowest poverty rate of 0.0%, which includes 0 families.
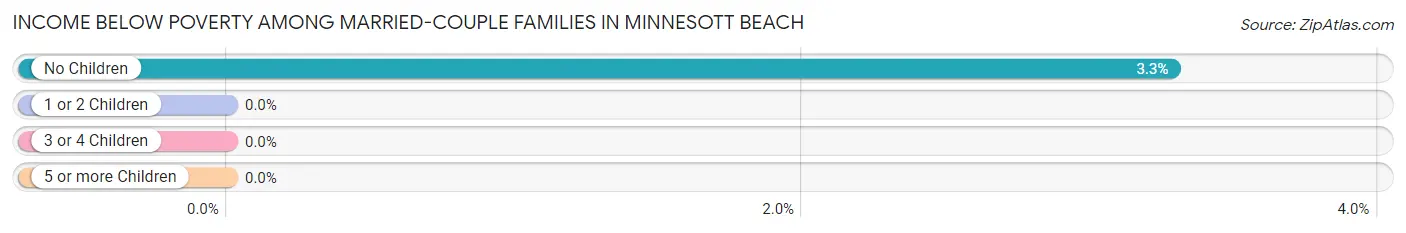
| Children | Above Poverty | Below Poverty |
| No Children | 118 (96.7%) | 4 (3.3%) |
| 1 or 2 Children | 27 (100.0%) | 0 (0.0%) |
| 3 or 4 Children | 0 (0.0%) | 0 (0.0%) |
| 5 or more Children | 0 (0.0%) | 0 (0.0%) |
| Total | 145 (97.3%) | 4 (2.7%) |
Income Below Poverty Among Single-Parent Households in Minnesott Beach
According to the poverty data in Minnesott Beach, 77.8% or 7 single-father households and 44.4% or 4 single-mother households are living below the poverty line. Among single-father households, those with 1 or 2 children have the highest poverty rate, with 7 households (100.0%) experiencing poverty. Likewise, among single-mother households, those with 1 or 2 children have the highest poverty rate, with 1 households (100.0%) falling below the poverty line.
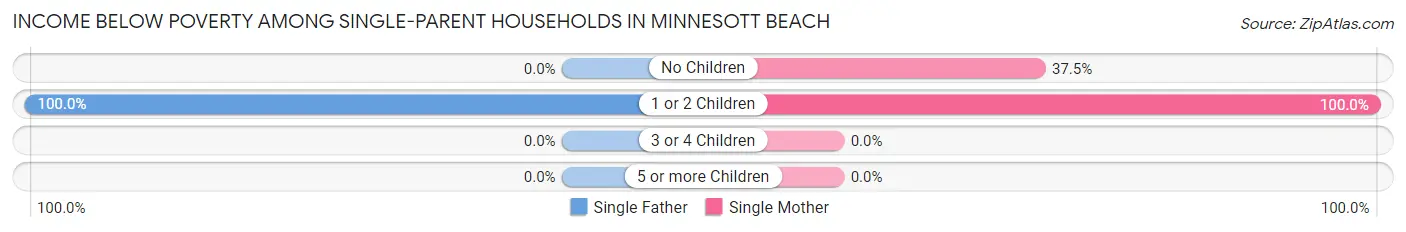
| Children | Single Father | Single Mother |
| No Children | 0 (0.0%) | 3 (37.5%) |
| 1 or 2 Children | 7 (100.0%) | 1 (100.0%) |
| 3 or 4 Children | 0 (0.0%) | 0 (0.0%) |
| 5 or more Children | 0 (0.0%) | 0 (0.0%) |
| Total | 7 (77.8%) | 4 (44.4%) |
Income Below Poverty Among Married-Couple vs Single-Parent Households in Minnesott Beach
The poverty data for Minnesott Beach shows that 4 of the married-couple family households (2.7%) and 11 of the single-parent households (61.1%) are living below the poverty level. Within the married-couple family households, those with no children have the highest poverty rate, with 4 households (3.3%) falling below the poverty line. Among the single-parent households, those with 1 or 2 children have the highest poverty rate, with 8 household (100.0%) living below poverty.
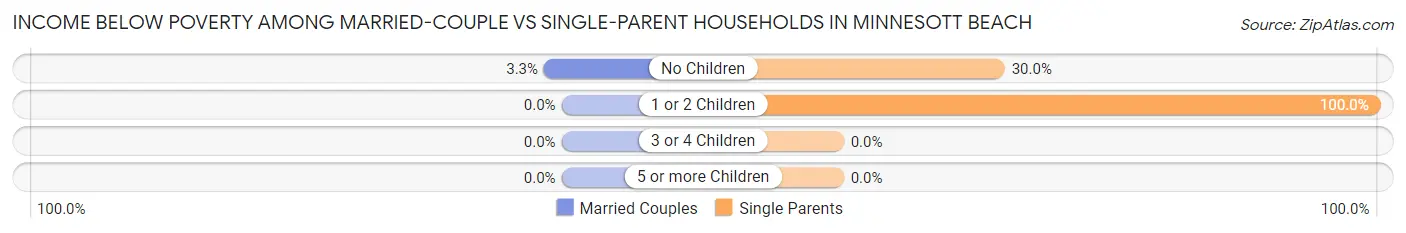
| Children | Married-Couple Families | Single-Parent Households |
| No Children | 4 (3.3%) | 3 (30.0%) |
| 1 or 2 Children | 0 (0.0%) | 8 (100.0%) |
| 3 or 4 Children | 0 (0.0%) | 0 (0.0%) |
| 5 or more Children | 0 (0.0%) | 0 (0.0%) |
| Total | 4 (2.7%) | 11 (61.1%) |
Employment Characteristics in Minnesott Beach
Employment by Class of Employer in Minnesott Beach
Among the 146 employed individuals in Minnesott Beach, private company employees (93 | 63.7%), state government employees (18 | 12.3%), and not-for-profit organizations (14 | 9.6%) make up the most common classes of employment.
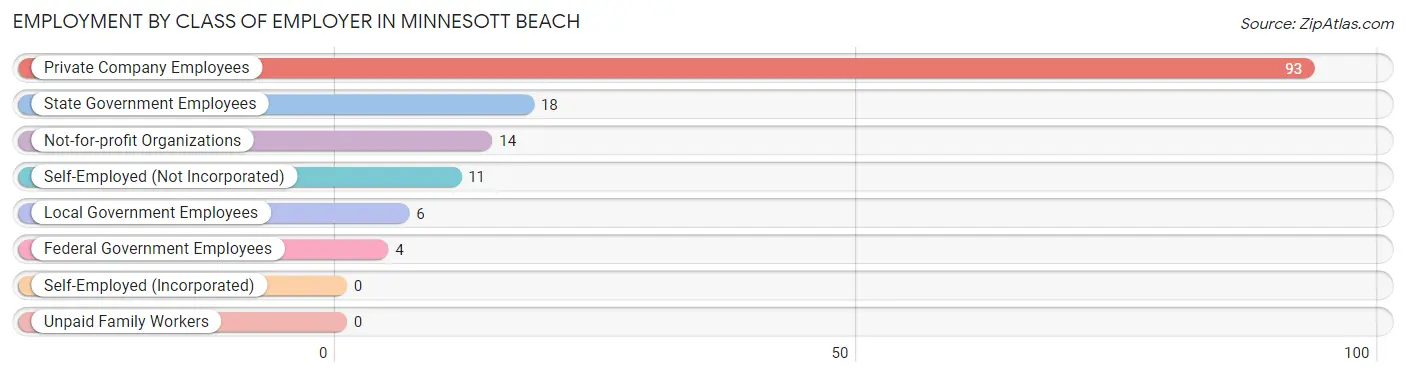
| Employer Class | # Employees | % Employees |
| Private Company Employees | 93 | 63.7% |
| Self-Employed (Incorporated) | 0 | 0.0% |
| Self-Employed (Not Incorporated) | 11 | 7.5% |
| Not-for-profit Organizations | 14 | 9.6% |
| Local Government Employees | 6 | 4.1% |
| State Government Employees | 18 | 12.3% |
| Federal Government Employees | 4 | 2.7% |
| Unpaid Family Workers | 0 | 0.0% |
| Total | 146 | 100.0% |
Employment Status by Age in Minnesott Beach
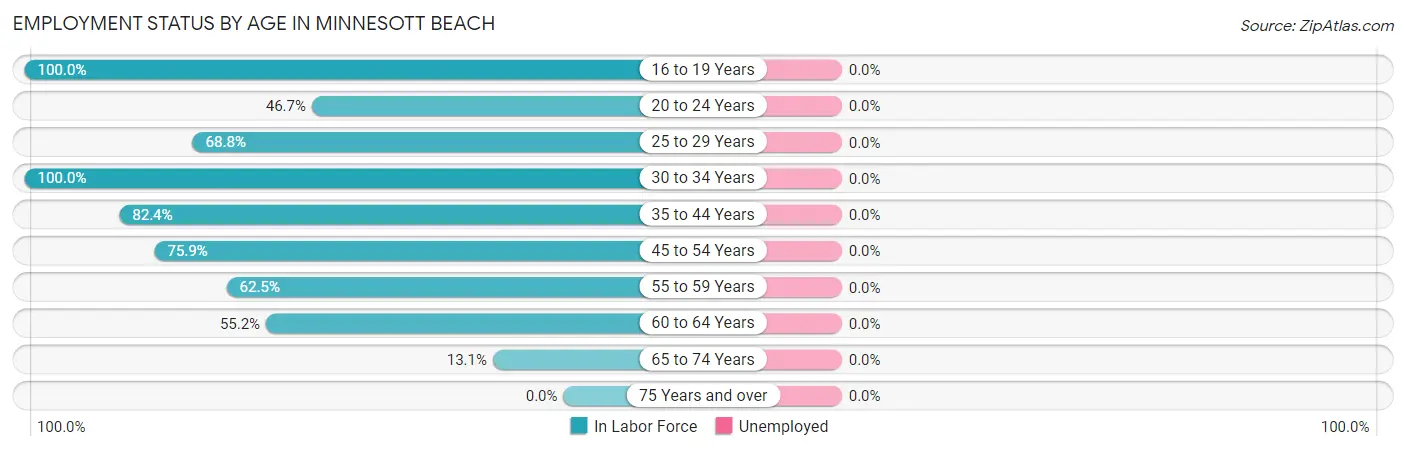
| Age Bracket | In Labor Force | Unemployed |
| 16 to 19 Years | 5 (100.0%) | 0 (0.0%) |
| 20 to 24 Years | 7 (46.7%) | 0 (0.0%) |
| 25 to 29 Years | 11 (68.8%) | 0 (0.0%) |
| 30 to 34 Years | 17 (100.0%) | 0 (0.0%) |
| 35 to 44 Years | 14 (82.4%) | 0 (0.0%) |
| 45 to 54 Years | 22 (75.9%) | 0 (0.0%) |
| 55 to 59 Years | 25 (62.5%) | 0 (0.0%) |
| 60 to 64 Years | 32 (55.2%) | 0 (0.0%) |
| 65 to 74 Years | 23 (13.1%) | 0 (0.0%) |
| 75 Years and over | 0 (0.0%) | 0 (0.0%) |
| Total | 156 (34.6%) | 0 (0.0%) |
Employment Status by Educational Attainment in Minnesott Beach
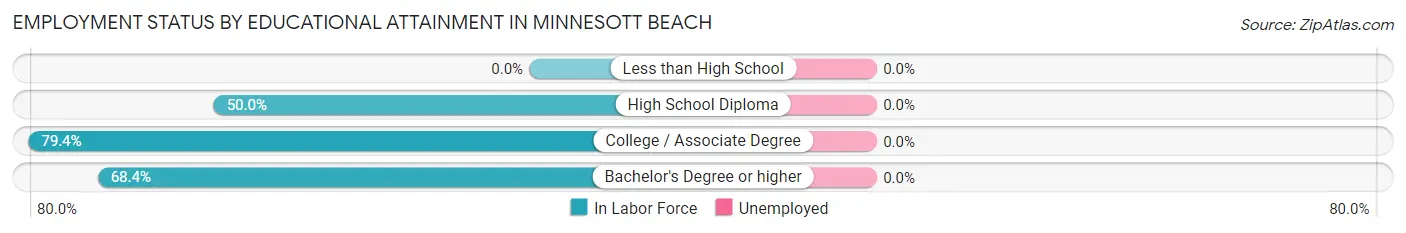
| Educational Attainment | In Labor Force | Unemployed |
| Less than High School | 0 (0.0%) | 0 (0.0%) |
| High School Diploma | 15 (50.0%) | 0 (0.0%) |
| College / Associate Degree | 54 (79.4%) | 0 (0.0%) |
| Bachelor's Degree or higher | 52 (68.4%) | 0 (0.0%) |
| Total | 121 (68.4%) | 0 (0.0%) |
Employment Occupations by Sex in Minnesott Beach
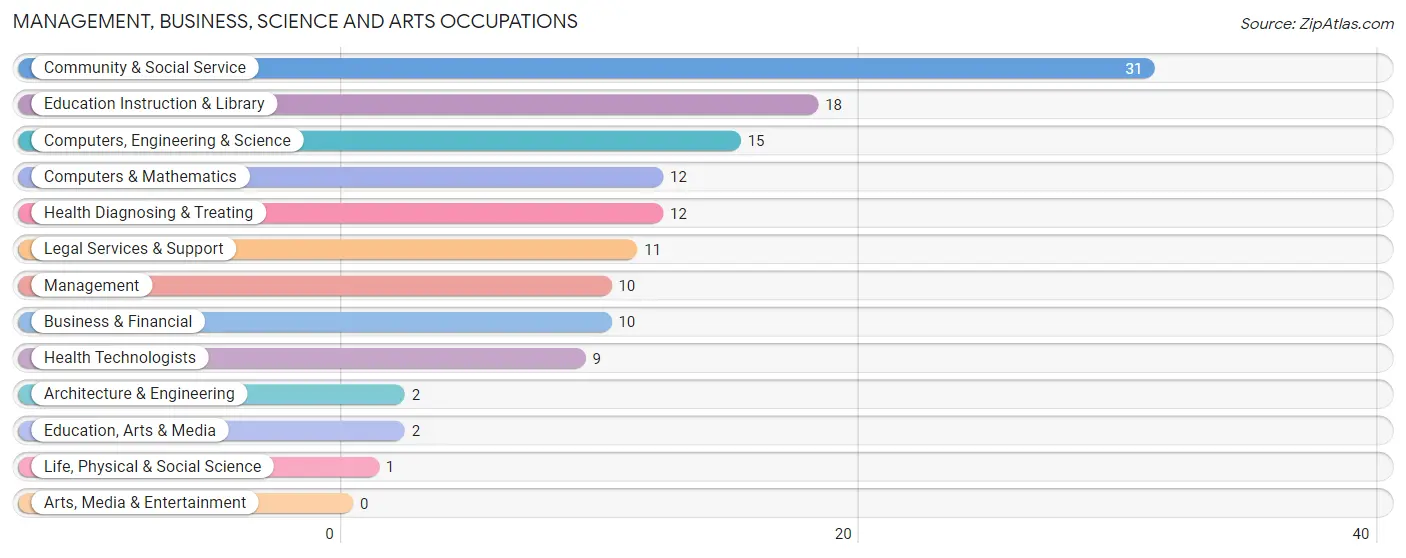
Management, Business, Science and Arts Occupations
The most common Management, Business, Science and Arts occupations in Minnesott Beach are Community & Social Service (31 | 19.9%), Education Instruction & Library (18 | 11.5%), Computers, Engineering & Science (15 | 9.6%), Computers & Mathematics (12 | 7.7%), and Health Diagnosing & Treating (12 | 7.7%).
Management, Business, Science and Arts Occupations by Sex
Within the Management, Business, Science and Arts occupations in Minnesott Beach, the most male-oriented occupations are Management (100.0%), Education, Arts & Media (100.0%), and Business & Financial (80.0%), while the most female-oriented occupations are Architecture & Engineering (100.0%), Life, Physical & Social Science (100.0%), and Legal Services & Support (100.0%).
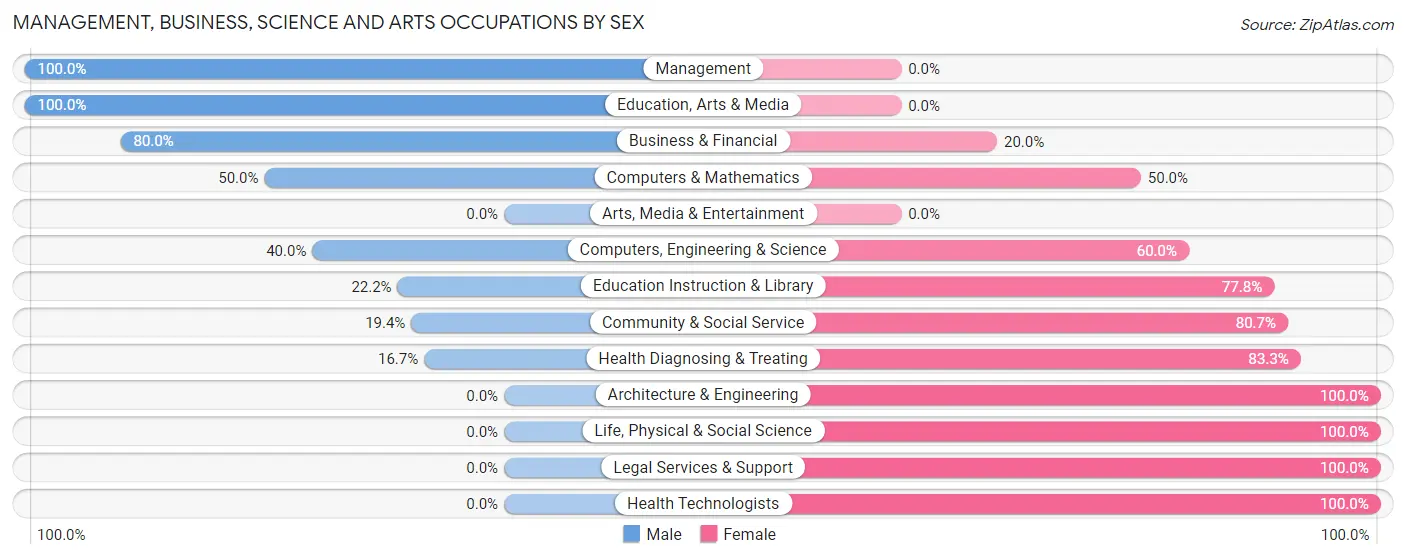
| Occupation | Male | Female |
| Management | 10 (100.0%) | 0 (0.0%) |
| Business & Financial | 8 (80.0%) | 2 (20.0%) |
| Computers, Engineering & Science | 6 (40.0%) | 9 (60.0%) |
| Computers & Mathematics | 6 (50.0%) | 6 (50.0%) |
| Architecture & Engineering | 0 (0.0%) | 2 (100.0%) |
| Life, Physical & Social Science | 0 (0.0%) | 1 (100.0%) |
| Community & Social Service | 6 (19.4%) | 25 (80.6%) |
| Education, Arts & Media | 2 (100.0%) | 0 (0.0%) |
| Legal Services & Support | 0 (0.0%) | 11 (100.0%) |
| Education Instruction & Library | 4 (22.2%) | 14 (77.8%) |
| Arts, Media & Entertainment | 0 (0.0%) | 0 (0.0%) |
| Health Diagnosing & Treating | 2 (16.7%) | 10 (83.3%) |
| Health Technologists | 0 (0.0%) | 9 (100.0%) |
| Total (Category) | 32 (41.0%) | 46 (59.0%) |
| Total (Overall) | 80 (51.3%) | 76 (48.7%) |
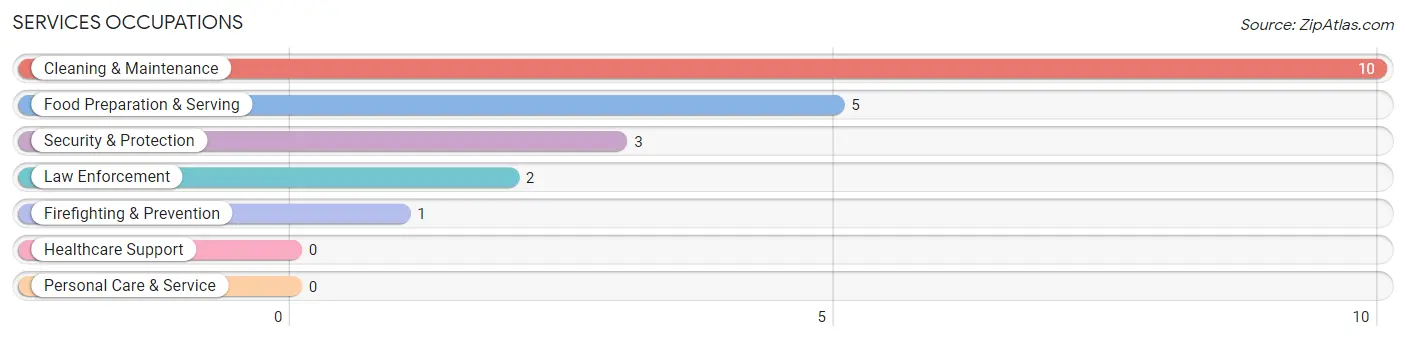
Services Occupations
The most common Services occupations in Minnesott Beach are Cleaning & Maintenance (10 | 6.4%), Food Preparation & Serving (5 | 3.2%), Security & Protection (3 | 1.9%), Law Enforcement (2 | 1.3%), and Firefighting & Prevention (1 | 0.6%).
Services Occupations by Sex
Within the Services occupations in Minnesott Beach, the most male-oriented occupations are Firefighting & Prevention (100.0%), Cleaning & Maintenance (100.0%), and Security & Protection (33.3%), while the most female-oriented occupations are Law Enforcement (100.0%), Food Preparation & Serving (100.0%), and Security & Protection (66.7%).
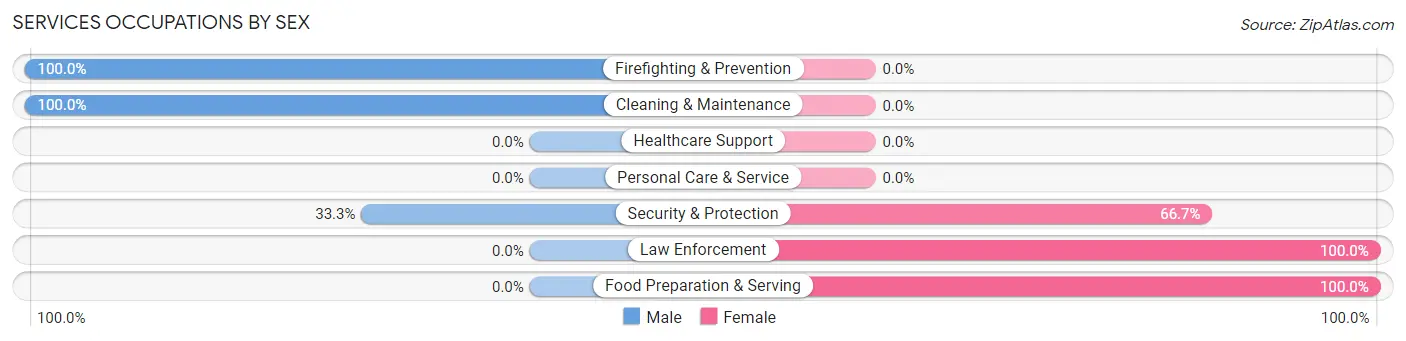
| Occupation | Male | Female |
| Healthcare Support | 0 (0.0%) | 0 (0.0%) |
| Security & Protection | 1 (33.3%) | 2 (66.7%) |
| Firefighting & Prevention | 1 (100.0%) | 0 (0.0%) |
| Law Enforcement | 0 (0.0%) | 2 (100.0%) |
| Food Preparation & Serving | 0 (0.0%) | 5 (100.0%) |
| Cleaning & Maintenance | 10 (100.0%) | 0 (0.0%) |
| Personal Care & Service | 0 (0.0%) | 0 (0.0%) |
| Total (Category) | 11 (61.1%) | 7 (38.9%) |
| Total (Overall) | 80 (51.3%) | 76 (48.7%) |
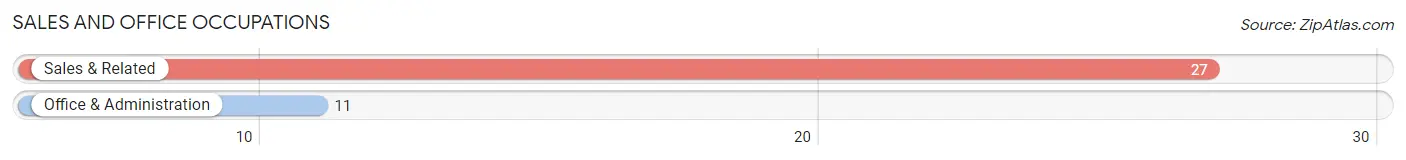
Sales and Office Occupations
The most common Sales and Office occupations in Minnesott Beach are Sales & Related (27 | 17.3%), and Office & Administration (11 | 7.0%).
Sales and Office Occupations by Sex
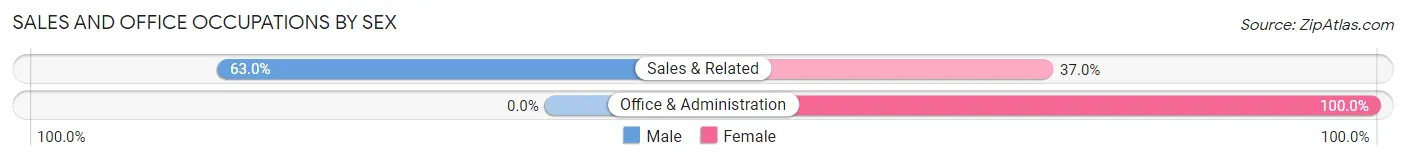
| Occupation | Male | Female |
| Sales & Related | 17 (63.0%) | 10 (37.0%) |
| Office & Administration | 0 (0.0%) | 11 (100.0%) |
| Total (Category) | 17 (44.7%) | 21 (55.3%) |
| Total (Overall) | 80 (51.3%) | 76 (48.7%) |
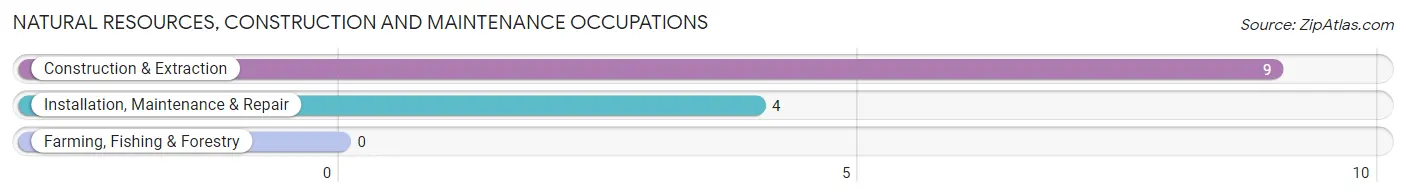
Natural Resources, Construction and Maintenance Occupations
The most common Natural Resources, Construction and Maintenance occupations in Minnesott Beach are Construction & Extraction (9 | 5.8%), and Installation, Maintenance & Repair (4 | 2.6%).
Natural Resources, Construction and Maintenance Occupations by Sex
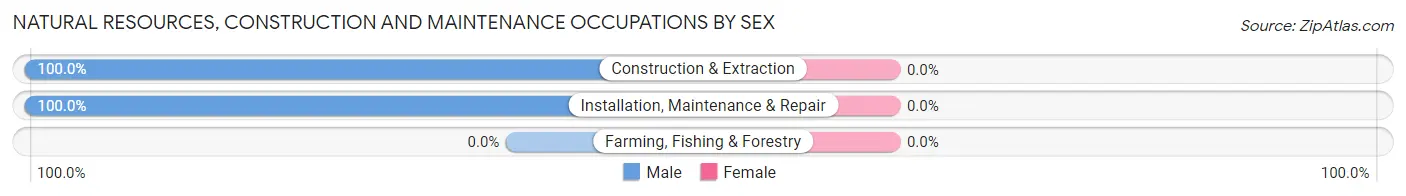
| Occupation | Male | Female |
| Farming, Fishing & Forestry | 0 (0.0%) | 0 (0.0%) |
| Construction & Extraction | 9 (100.0%) | 0 (0.0%) |
| Installation, Maintenance & Repair | 4 (100.0%) | 0 (0.0%) |
| Total (Category) | 13 (100.0%) | 0 (0.0%) |
| Total (Overall) | 80 (51.3%) | 76 (48.7%) |
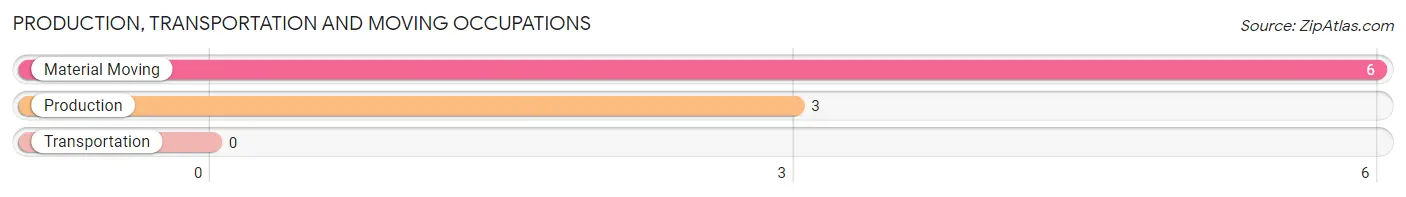
Production, Transportation and Moving Occupations
The most common Production, Transportation and Moving occupations in Minnesott Beach are Material Moving (6 | 3.8%), and Production (3 | 1.9%).
Production, Transportation and Moving Occupations by Sex
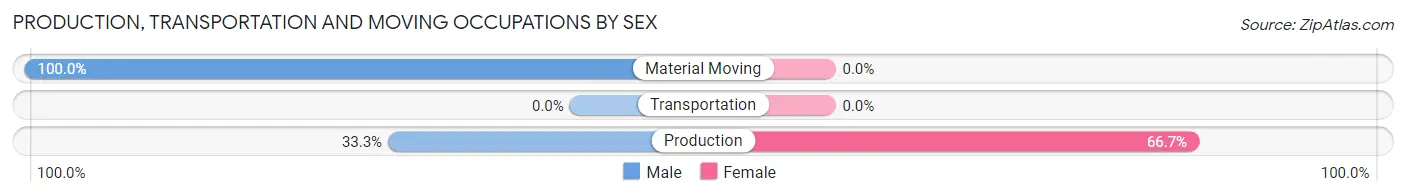
| Occupation | Male | Female |
| Production | 1 (33.3%) | 2 (66.7%) |
| Transportation | 0 (0.0%) | 0 (0.0%) |
| Material Moving | 6 (100.0%) | 0 (0.0%) |
| Total (Category) | 7 (77.8%) | 2 (22.2%) |
| Total (Overall) | 80 (51.3%) | 76 (48.7%) |
Employment Industries by Sex in Minnesott Beach
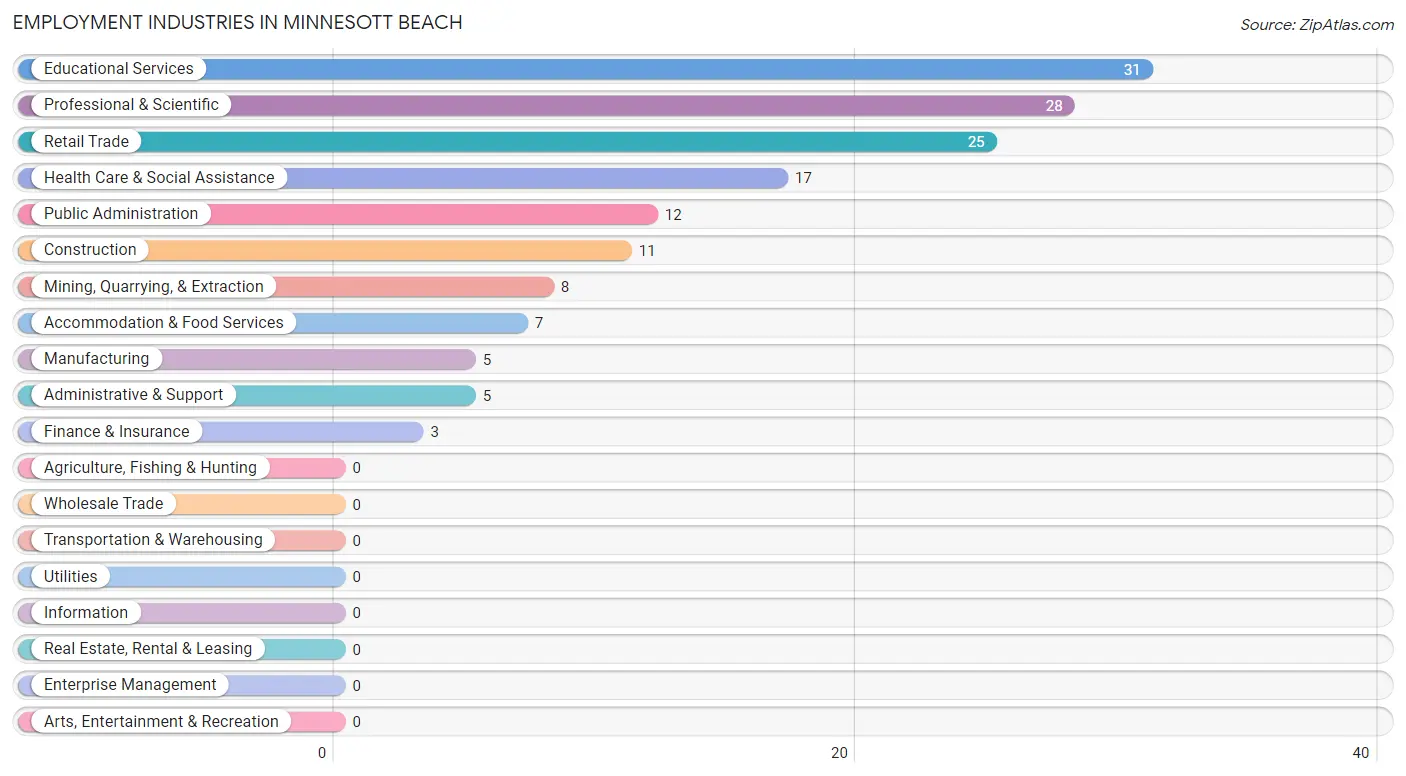
Employment Industries in Minnesott Beach
The major employment industries in Minnesott Beach include Educational Services (31 | 19.9%), Professional & Scientific (28 | 17.9%), Retail Trade (25 | 16.0%), Health Care & Social Assistance (17 | 10.9%), and Public Administration (12 | 7.7%).
Employment Industries by Sex in Minnesott Beach
The Minnesott Beach industries that see more men than women are Mining, Quarrying, & Extraction (100.0%), Construction (100.0%), and Administrative & Support (100.0%), whereas the industries that tend to have a higher number of women are Finance & Insurance (100.0%), Educational Services (77.4%), and Accommodation & Food Services (71.4%).
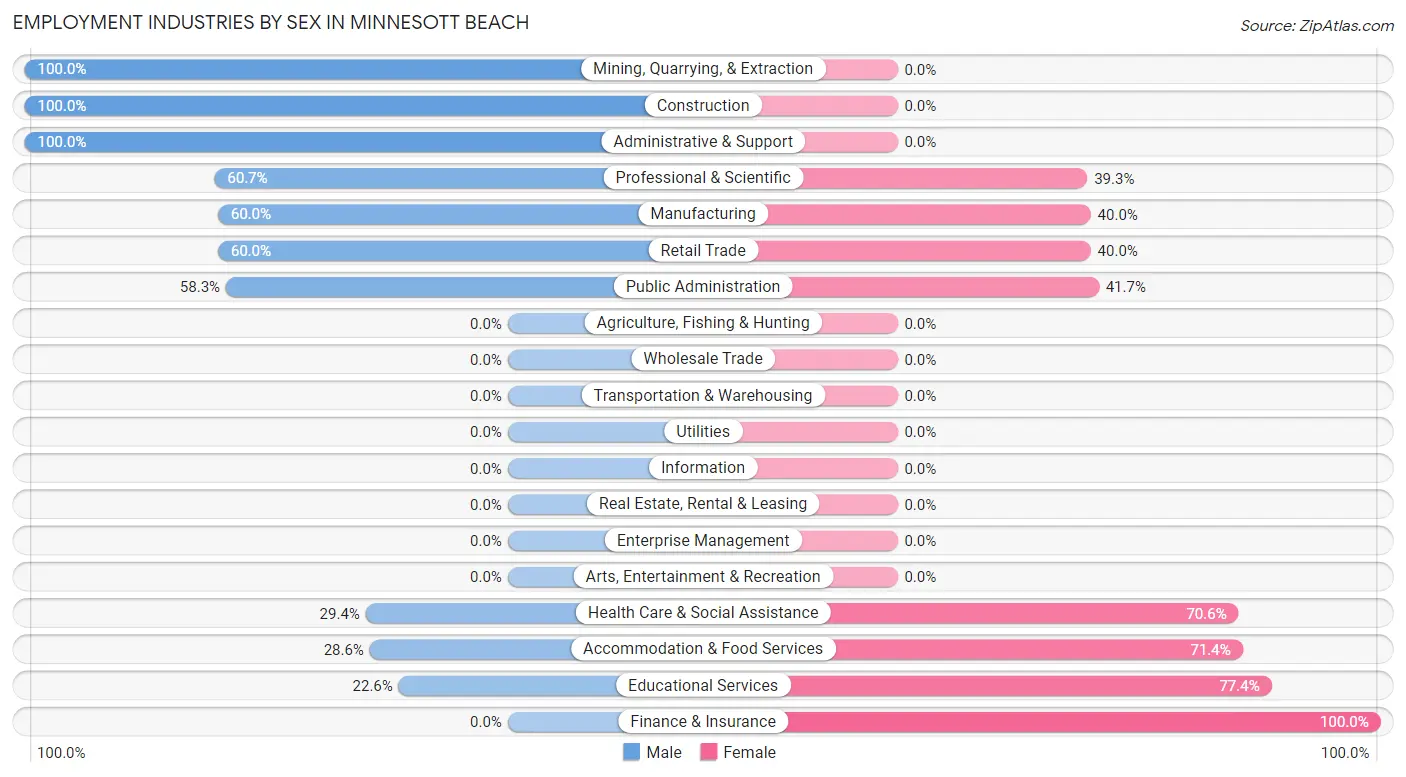
| Industry | Male | Female |
| Agriculture, Fishing & Hunting | 0 (0.0%) | 0 (0.0%) |
| Mining, Quarrying, & Extraction | 8 (100.0%) | 0 (0.0%) |
| Construction | 11 (100.0%) | 0 (0.0%) |
| Manufacturing | 3 (60.0%) | 2 (40.0%) |
| Wholesale Trade | 0 (0.0%) | 0 (0.0%) |
| Retail Trade | 15 (60.0%) | 10 (40.0%) |
| Transportation & Warehousing | 0 (0.0%) | 0 (0.0%) |
| Utilities | 0 (0.0%) | 0 (0.0%) |
| Information | 0 (0.0%) | 0 (0.0%) |
| Finance & Insurance | 0 (0.0%) | 3 (100.0%) |
| Real Estate, Rental & Leasing | 0 (0.0%) | 0 (0.0%) |
| Professional & Scientific | 17 (60.7%) | 11 (39.3%) |
| Enterprise Management | 0 (0.0%) | 0 (0.0%) |
| Administrative & Support | 5 (100.0%) | 0 (0.0%) |
| Educational Services | 7 (22.6%) | 24 (77.4%) |
| Health Care & Social Assistance | 5 (29.4%) | 12 (70.6%) |
| Arts, Entertainment & Recreation | 0 (0.0%) | 0 (0.0%) |
| Accommodation & Food Services | 2 (28.6%) | 5 (71.4%) |
| Public Administration | 7 (58.3%) | 5 (41.7%) |
| Total | 80 (51.3%) | 76 (48.7%) |
Education in Minnesott Beach
School Enrollment in Minnesott Beach
The most common levels of schooling among the 30 students in Minnesott Beach are high school (16 | 53.3%), college / undergraduate (8 | 26.7%), and nursery / preschool (4 | 13.3%).
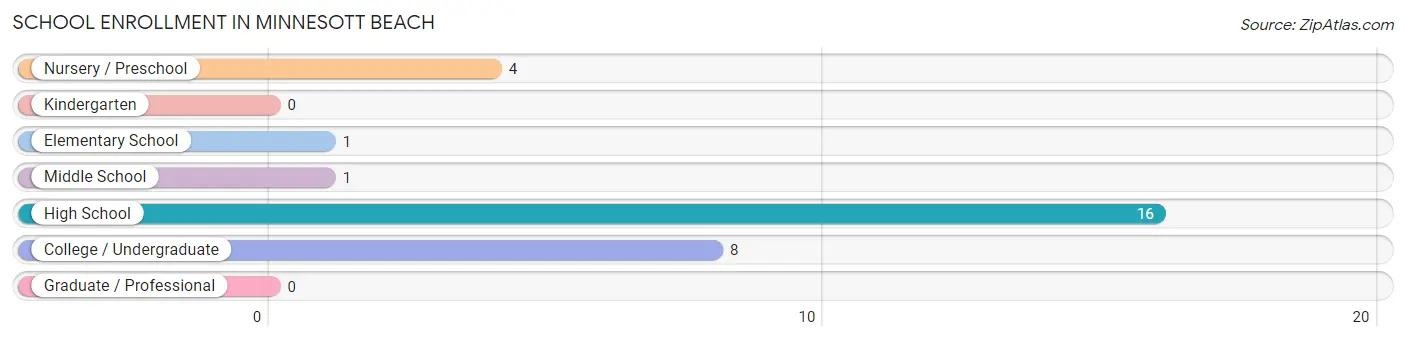
| School Level | # Students | % Students |
| Nursery / Preschool | 4 | 13.3% |
| Kindergarten | 0 | 0.0% |
| Elementary School | 1 | 3.3% |
| Middle School | 1 | 3.3% |
| High School | 16 | 53.3% |
| College / Undergraduate | 8 | 26.7% |
| Graduate / Professional | 0 | 0.0% |
| Total | 30 | 100.0% |
School Enrollment by Age by Funding Source in Minnesott Beach
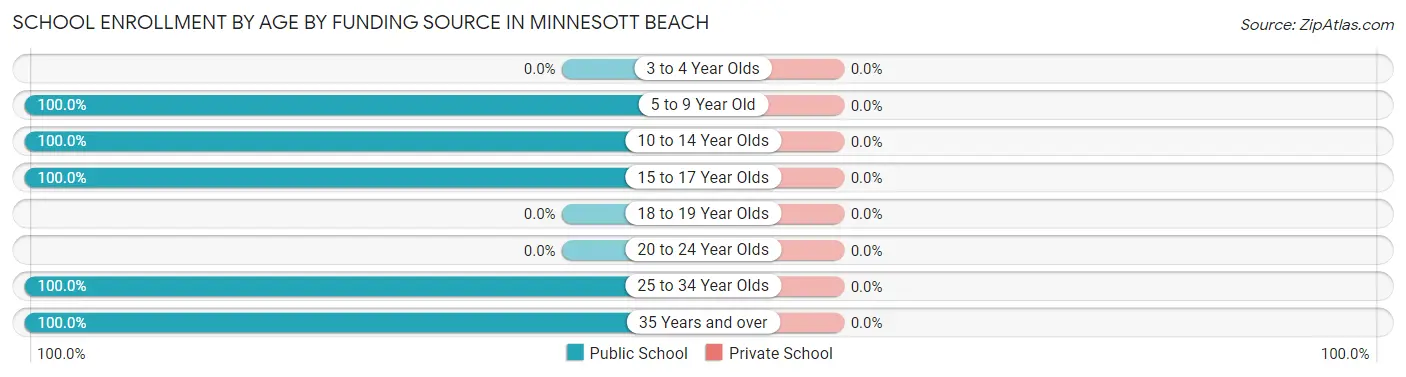
| Age Bracket | Public School | Private School |
| 3 to 4 Year Olds | 0 (0.0%) | 0 (0.0%) |
| 5 to 9 Year Old | 5 (100.0%) | 0 (0.0%) |
| 10 to 14 Year Olds | 1 (100.0%) | 0 (0.0%) |
| 15 to 17 Year Olds | 16 (100.0%) | 0 (0.0%) |
| 18 to 19 Year Olds | 0 (0.0%) | 0 (0.0%) |
| 20 to 24 Year Olds | 0 (0.0%) | 0 (0.0%) |
| 25 to 34 Year Olds | 3 (100.0%) | 0 (0.0%) |
| 35 Years and over | 5 (100.0%) | 0 (0.0%) |
| Total | 30 (100.0%) | 0 (0.0%) |
Educational Attainment by Field of Study in Minnesott Beach
Education (45 | 27.1%), business (23 | 13.9%), science & technology (20 | 12.0%), bio, nature & agricultural (16 | 9.6%), and literature & languages (15 | 9.0%) are the most common fields of study among 166 individuals in Minnesott Beach who have obtained a bachelor's degree or higher.
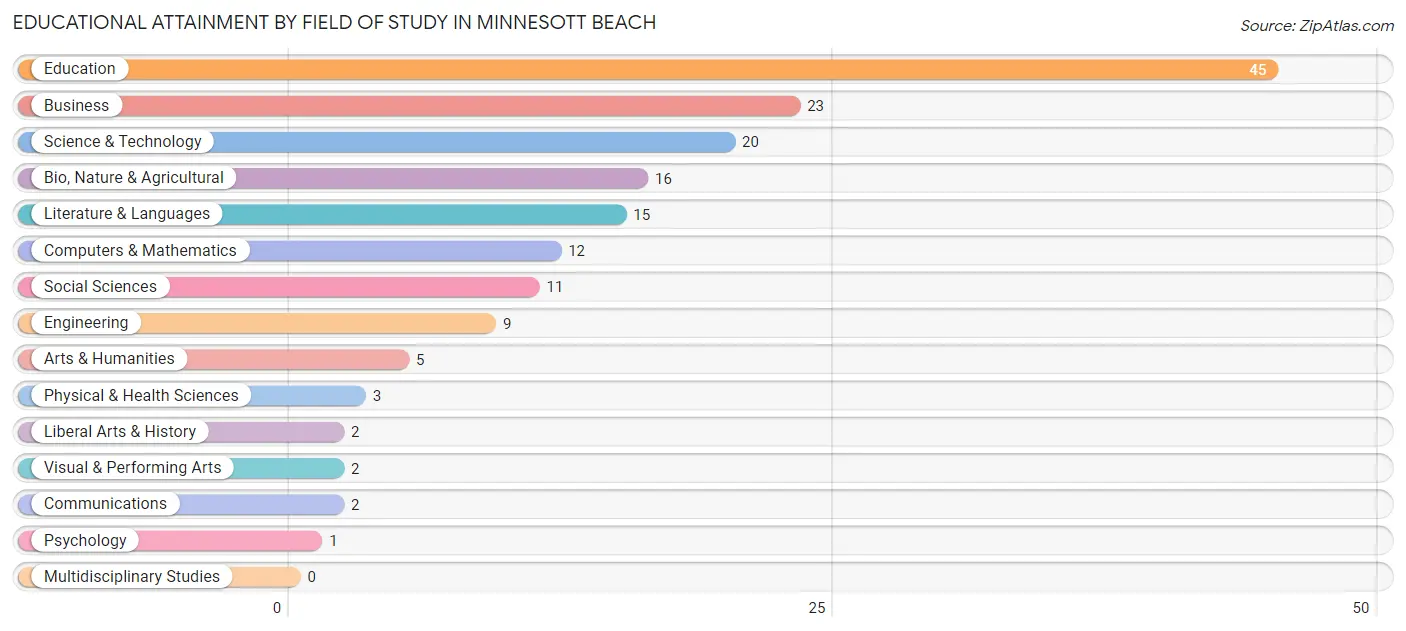
| Field of Study | # Graduates | % Graduates |
| Computers & Mathematics | 12 | 7.2% |
| Bio, Nature & Agricultural | 16 | 9.6% |
| Physical & Health Sciences | 3 | 1.8% |
| Psychology | 1 | 0.6% |
| Social Sciences | 11 | 6.6% |
| Engineering | 9 | 5.4% |
| Multidisciplinary Studies | 0 | 0.0% |
| Science & Technology | 20 | 12.0% |
| Business | 23 | 13.9% |
| Education | 45 | 27.1% |
| Literature & Languages | 15 | 9.0% |
| Liberal Arts & History | 2 | 1.2% |
| Visual & Performing Arts | 2 | 1.2% |
| Communications | 2 | 1.2% |
| Arts & Humanities | 5 | 3.0% |
| Total | 166 | 100.0% |
Transportation & Commute in Minnesott Beach
Vehicle Availability by Sex in Minnesott Beach
The most prevalent vehicle ownership categories in Minnesott Beach are males with 2 vehicles (41, accounting for 52.6%) and females with 2 vehicles (35, making up 60.3%).
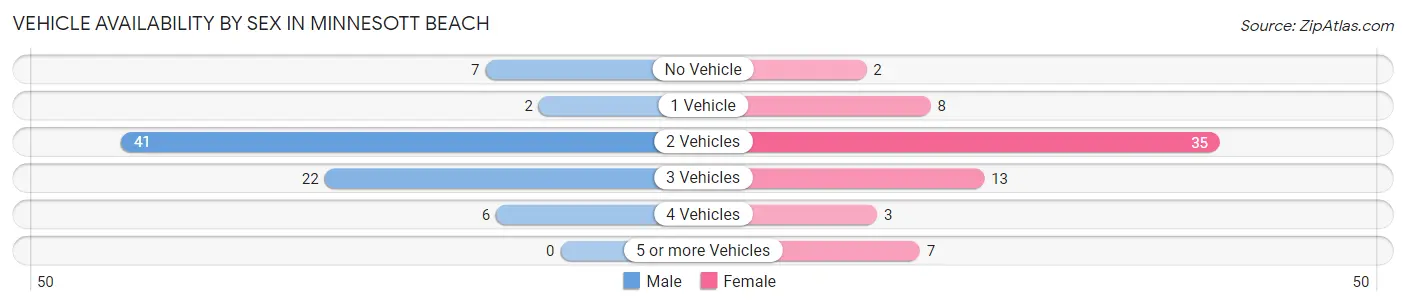
| Vehicles Available | Male | Female |
| No Vehicle | 7 (9.0%) | 2 (2.9%) |
| 1 Vehicle | 2 (2.6%) | 8 (11.8%) |
| 2 Vehicles | 41 (52.6%) | 35 (51.5%) |
| 3 Vehicles | 22 (28.2%) | 13 (19.1%) |
| 4 Vehicles | 6 (7.7%) | 3 (4.4%) |
| 5 or more Vehicles | 0 (0.0%) | 7 (10.3%) |
| Total | 78 (100.0%) | 68 (100.0%) |
Commute Time in Minnesott Beach
The most frequently occuring commute durations in Minnesott Beach are 40 to 44 minutes (29 commuters, 23.4%), 45 to 59 minutes (18 commuters, 14.5%), and 35 to 39 minutes (15 commuters, 12.1%).
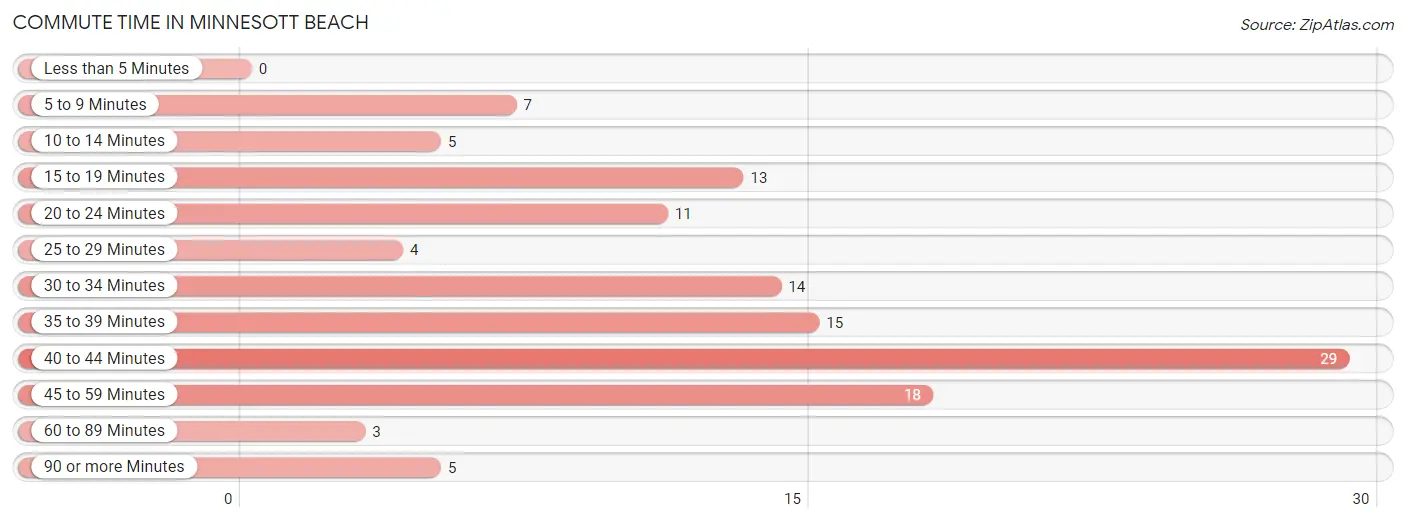
| Commute Time | # Commuters | % Commuters |
| Less than 5 Minutes | 0 | 0.0% |
| 5 to 9 Minutes | 7 | 5.7% |
| 10 to 14 Minutes | 5 | 4.0% |
| 15 to 19 Minutes | 13 | 10.5% |
| 20 to 24 Minutes | 11 | 8.9% |
| 25 to 29 Minutes | 4 | 3.2% |
| 30 to 34 Minutes | 14 | 11.3% |
| 35 to 39 Minutes | 15 | 12.1% |
| 40 to 44 Minutes | 29 | 23.4% |
| 45 to 59 Minutes | 18 | 14.5% |
| 60 to 89 Minutes | 3 | 2.4% |
| 90 or more Minutes | 5 | 4.0% |
Commute Time by Sex in Minnesott Beach
The most common commute times in Minnesott Beach are 30 to 34 minutes (14 commuters, 20.6%) for males and 40 to 44 minutes (17 commuters, 30.4%) for females.
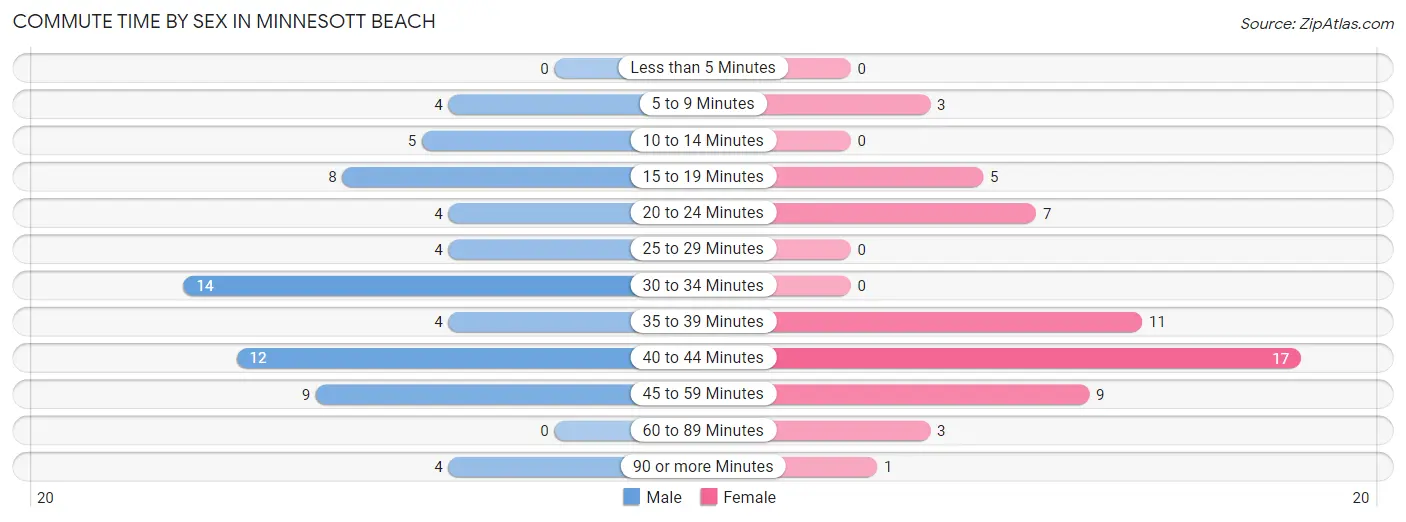
| Commute Time | Male | Female |
| Less than 5 Minutes | 0 (0.0%) | 0 (0.0%) |
| 5 to 9 Minutes | 4 (5.9%) | 3 (5.4%) |
| 10 to 14 Minutes | 5 (7.3%) | 0 (0.0%) |
| 15 to 19 Minutes | 8 (11.8%) | 5 (8.9%) |
| 20 to 24 Minutes | 4 (5.9%) | 7 (12.5%) |
| 25 to 29 Minutes | 4 (5.9%) | 0 (0.0%) |
| 30 to 34 Minutes | 14 (20.6%) | 0 (0.0%) |
| 35 to 39 Minutes | 4 (5.9%) | 11 (19.6%) |
| 40 to 44 Minutes | 12 (17.6%) | 17 (30.4%) |
| 45 to 59 Minutes | 9 (13.2%) | 9 (16.1%) |
| 60 to 89 Minutes | 0 (0.0%) | 3 (5.4%) |
| 90 or more Minutes | 4 (5.9%) | 1 (1.8%) |
Time of Departure to Work by Sex in Minnesott Beach
The most frequent times of departure to work in Minnesott Beach are 8:00 AM to 8:29 AM (15, 22.1%) for males and 7:00 AM to 7:29 AM (17, 30.4%) for females.
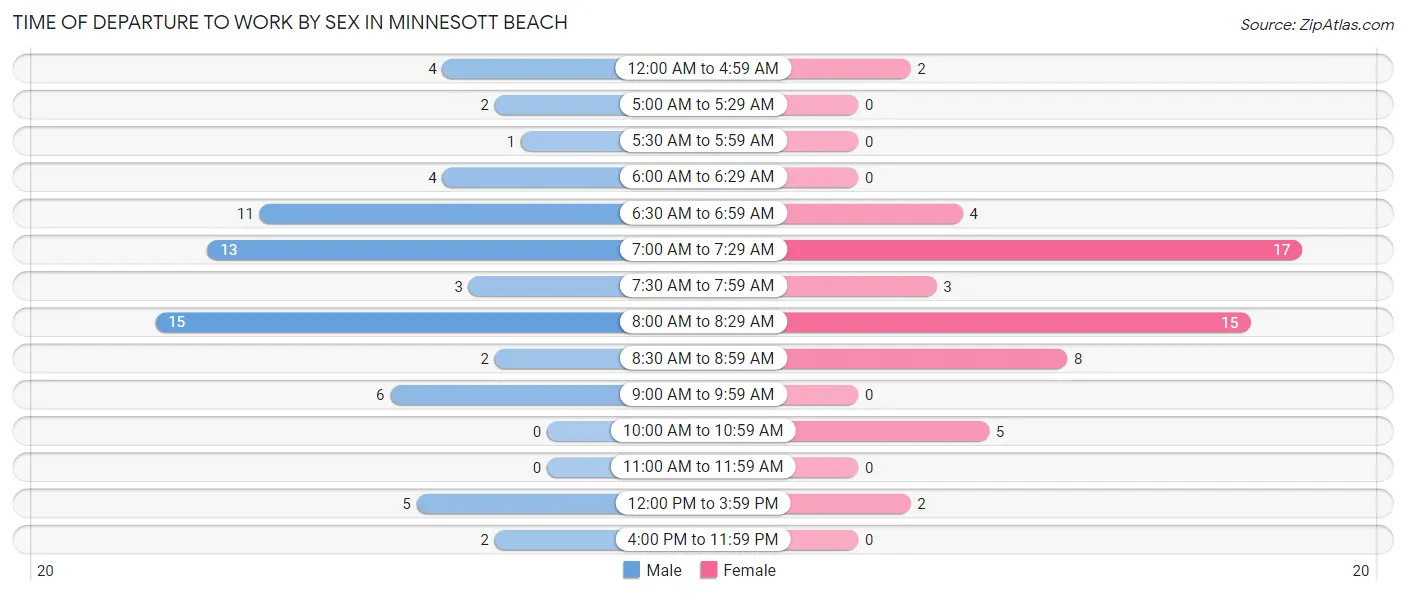
| Time of Departure | Male | Female |
| 12:00 AM to 4:59 AM | 4 (5.9%) | 2 (3.6%) |
| 5:00 AM to 5:29 AM | 2 (2.9%) | 0 (0.0%) |
| 5:30 AM to 5:59 AM | 1 (1.5%) | 0 (0.0%) |
| 6:00 AM to 6:29 AM | 4 (5.9%) | 0 (0.0%) |
| 6:30 AM to 6:59 AM | 11 (16.2%) | 4 (7.1%) |
| 7:00 AM to 7:29 AM | 13 (19.1%) | 17 (30.4%) |
| 7:30 AM to 7:59 AM | 3 (4.4%) | 3 (5.4%) |
| 8:00 AM to 8:29 AM | 15 (22.1%) | 15 (26.8%) |
| 8:30 AM to 8:59 AM | 2 (2.9%) | 8 (14.3%) |
| 9:00 AM to 9:59 AM | 6 (8.8%) | 0 (0.0%) |
| 10:00 AM to 10:59 AM | 0 (0.0%) | 5 (8.9%) |
| 11:00 AM to 11:59 AM | 0 (0.0%) | 0 (0.0%) |
| 12:00 PM to 3:59 PM | 5 (7.3%) | 2 (3.6%) |
| 4:00 PM to 11:59 PM | 2 (2.9%) | 0 (0.0%) |
| Total | 68 (100.0%) | 56 (100.0%) |
Housing Occupancy in Minnesott Beach
Occupancy by Ownership in Minnesott Beach
Of the total 259 dwellings in Minnesott Beach, owner-occupied units account for 215 (83.0%), while renter-occupied units make up 44 (17.0%).
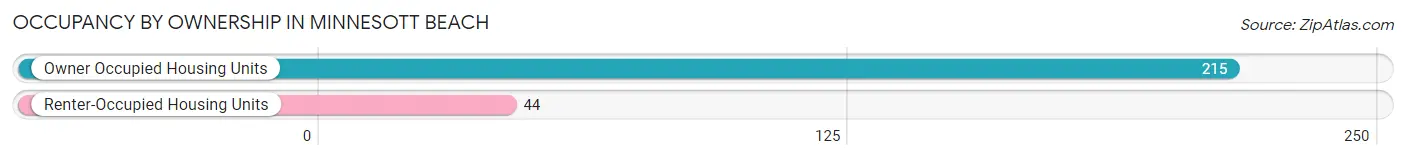
| Occupancy | # Housing Units | % Housing Units |
| Owner Occupied Housing Units | 215 | 83.0% |
| Renter-Occupied Housing Units | 44 | 17.0% |
| Total Occupied Housing Units | 259 | 100.0% |
Occupancy by Household Size in Minnesott Beach
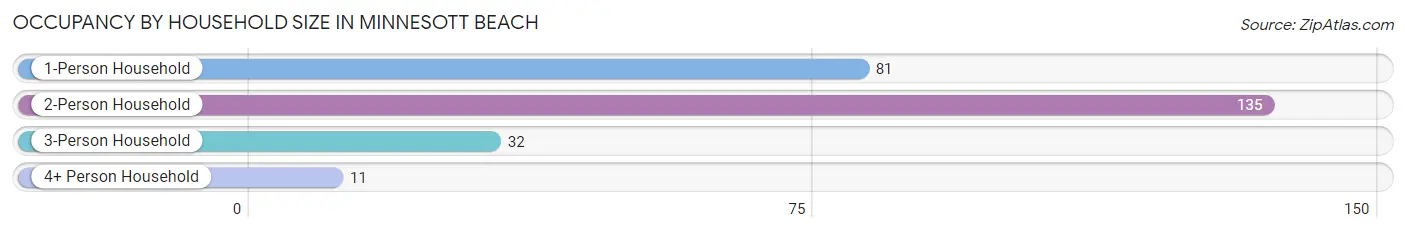
| Household Size | # Housing Units | % Housing Units |
| 1-Person Household | 81 | 31.3% |
| 2-Person Household | 135 | 52.1% |
| 3-Person Household | 32 | 12.4% |
| 4+ Person Household | 11 | 4.3% |
| Total Housing Units | 259 | 100.0% |
Occupancy by Ownership by Household Size in Minnesott Beach
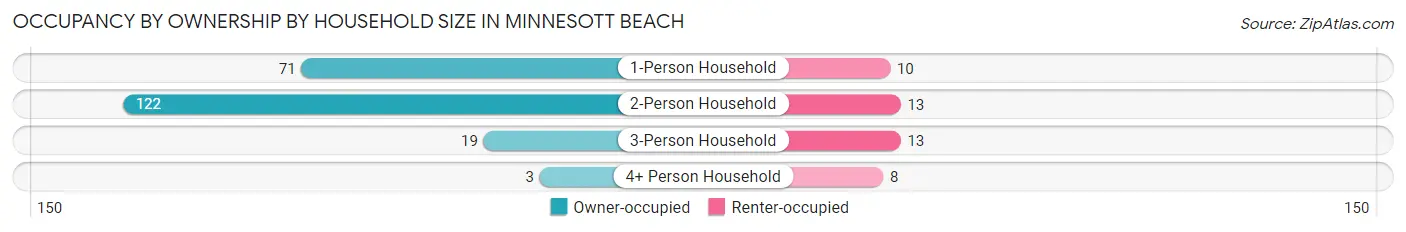
| Household Size | Owner-occupied | Renter-occupied |
| 1-Person Household | 71 (87.6%) | 10 (12.3%) |
| 2-Person Household | 122 (90.4%) | 13 (9.6%) |
| 3-Person Household | 19 (59.4%) | 13 (40.6%) |
| 4+ Person Household | 3 (27.3%) | 8 (72.7%) |
| Total Housing Units | 215 (83.0%) | 44 (17.0%) |
Occupancy by Educational Attainment in Minnesott Beach
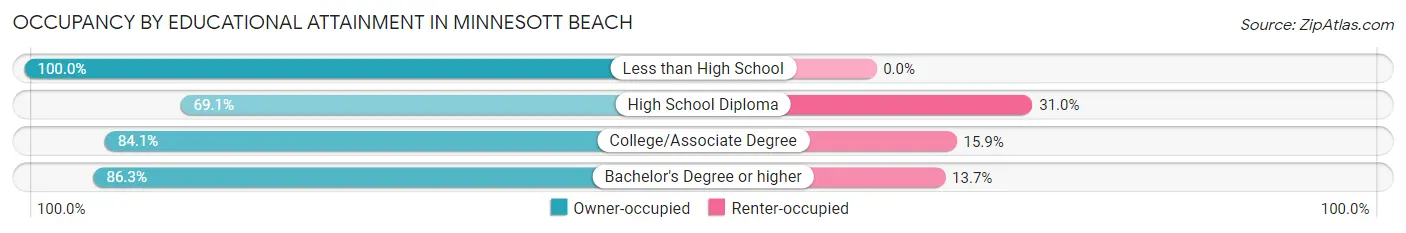
| Household Size | Owner-occupied | Renter-occupied |
| Less than High School | 9 (100.0%) | 0 (0.0%) |
| High School Diploma | 29 (69.1%) | 13 (30.9%) |
| College/Associate Degree | 95 (84.1%) | 18 (15.9%) |
| Bachelor's Degree or higher | 82 (86.3%) | 13 (13.7%) |
Occupancy by Age of Householder in Minnesott Beach
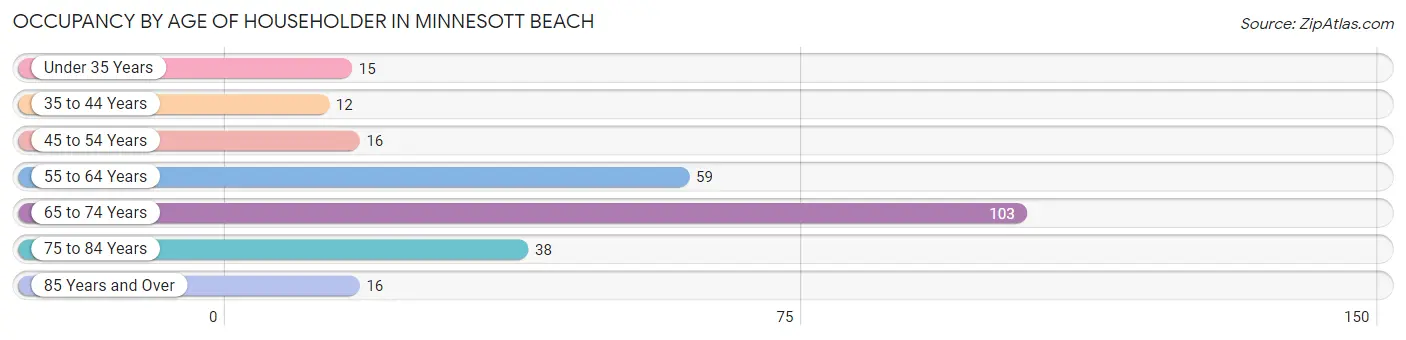
| Age Bracket | # Households | % Households |
| Under 35 Years | 15 | 5.8% |
| 35 to 44 Years | 12 | 4.6% |
| 45 to 54 Years | 16 | 6.2% |
| 55 to 64 Years | 59 | 22.8% |
| 65 to 74 Years | 103 | 39.8% |
| 75 to 84 Years | 38 | 14.7% |
| 85 Years and Over | 16 | 6.2% |
| Total | 259 | 100.0% |
Housing Finances in Minnesott Beach
Median Income by Occupancy in Minnesott Beach
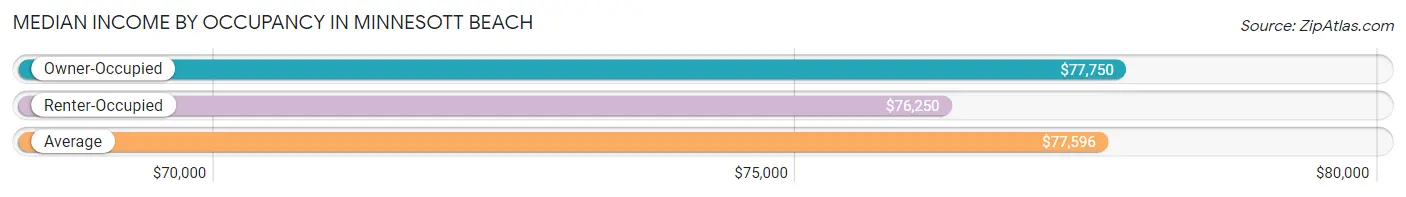
| Occupancy Type | # Households | Median Income |
| Owner-Occupied | 215 (83.0%) | $77,750 |
| Renter-Occupied | 44 (17.0%) | $76,250 |
| Average | 259 (100.0%) | $77,596 |
Occupancy by Householder Income Bracket in Minnesott Beach
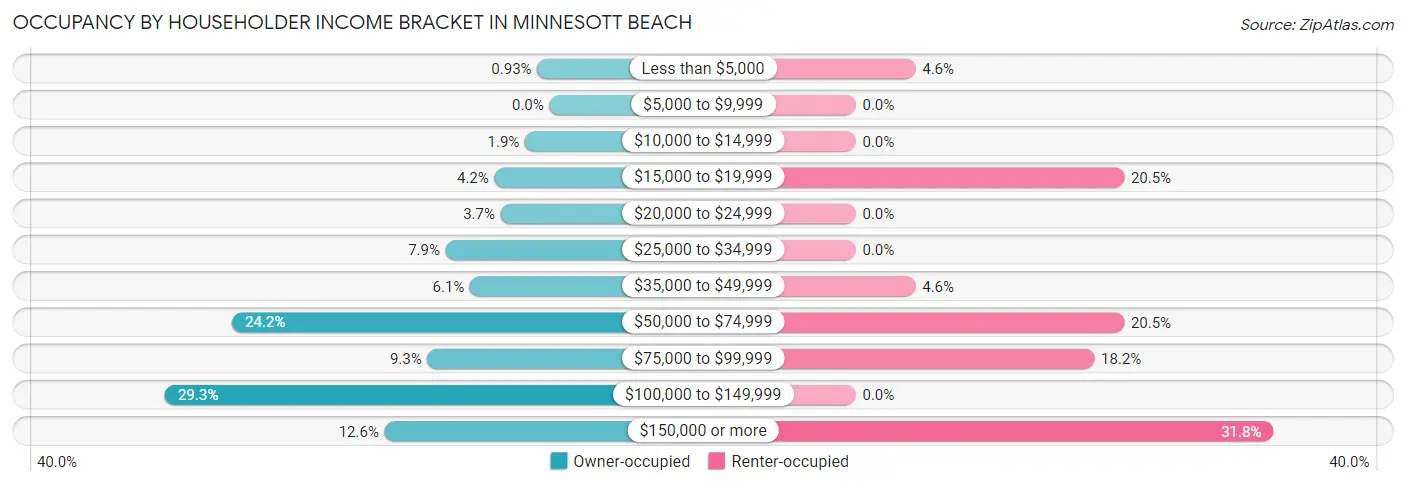
| Income Bracket | Owner-occupied | Renter-occupied |
| Less than $5,000 | 2 (0.9%) | 2 (4.5%) |
| $5,000 to $9,999 | 0 (0.0%) | 0 (0.0%) |
| $10,000 to $14,999 | 4 (1.9%) | 0 (0.0%) |
| $15,000 to $19,999 | 9 (4.2%) | 9 (20.4%) |
| $20,000 to $24,999 | 8 (3.7%) | 0 (0.0%) |
| $25,000 to $34,999 | 17 (7.9%) | 0 (0.0%) |
| $35,000 to $49,999 | 13 (6.0%) | 2 (4.5%) |
| $50,000 to $74,999 | 52 (24.2%) | 9 (20.4%) |
| $75,000 to $99,999 | 20 (9.3%) | 8 (18.2%) |
| $100,000 to $149,999 | 63 (29.3%) | 0 (0.0%) |
| $150,000 or more | 27 (12.6%) | 14 (31.8%) |
| Total | 215 (100.0%) | 44 (100.0%) |
Monthly Housing Cost Tiers in Minnesott Beach
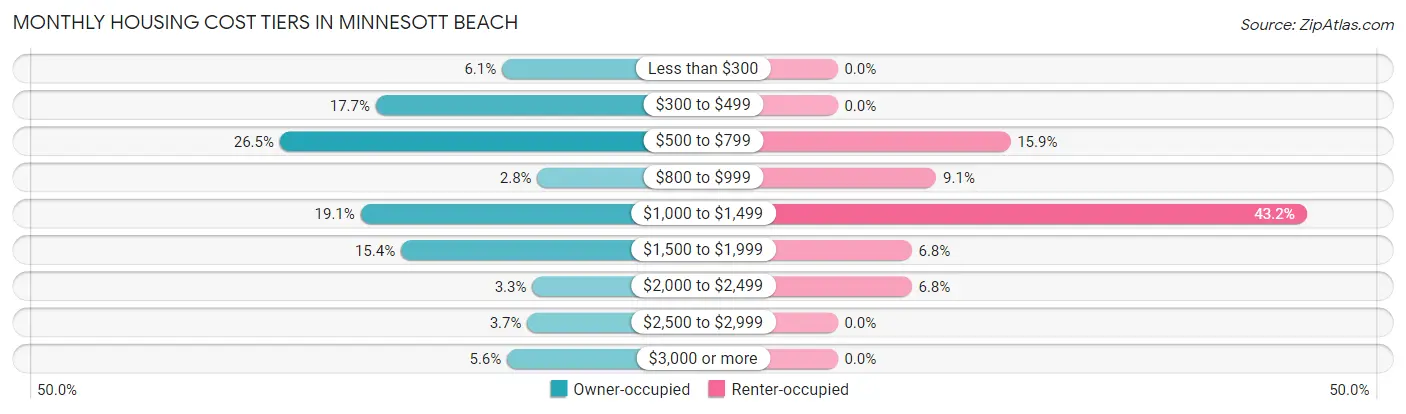
| Monthly Cost | Owner-occupied | Renter-occupied |
| Less than $300 | 13 (6.0%) | 0 (0.0%) |
| $300 to $499 | 38 (17.7%) | 0 (0.0%) |
| $500 to $799 | 57 (26.5%) | 7 (15.9%) |
| $800 to $999 | 6 (2.8%) | 4 (9.1%) |
| $1,000 to $1,499 | 41 (19.1%) | 19 (43.2%) |
| $1,500 to $1,999 | 33 (15.3%) | 3 (6.8%) |
| $2,000 to $2,499 | 7 (3.3%) | 3 (6.8%) |
| $2,500 to $2,999 | 8 (3.7%) | 0 (0.0%) |
| $3,000 or more | 12 (5.6%) | 0 (0.0%) |
| Total | 215 (100.0%) | 44 (100.0%) |
Physical Housing Characteristics in Minnesott Beach
Housing Structures in Minnesott Beach
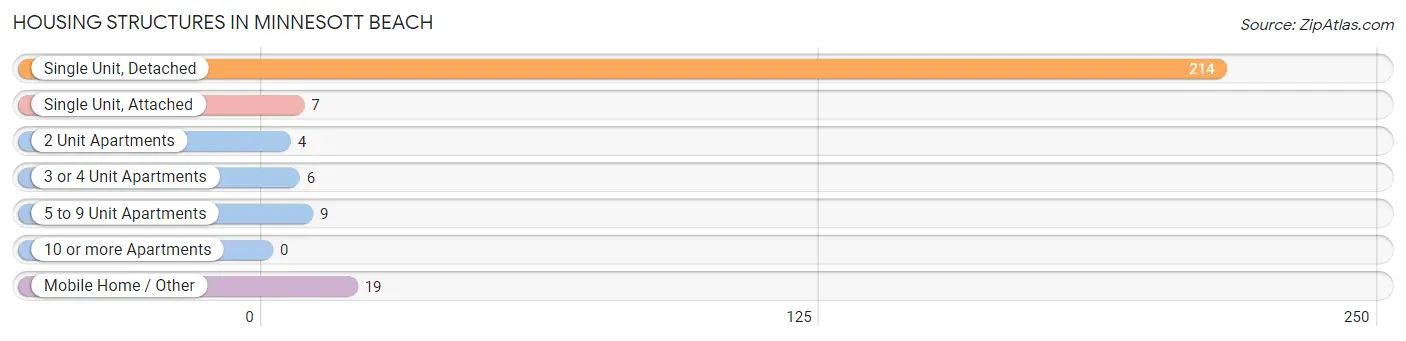
| Structure Type | # Housing Units | % Housing Units |
| Single Unit, Detached | 214 | 82.6% |
| Single Unit, Attached | 7 | 2.7% |
| 2 Unit Apartments | 4 | 1.5% |
| 3 or 4 Unit Apartments | 6 | 2.3% |
| 5 to 9 Unit Apartments | 9 | 3.5% |
| 10 or more Apartments | 0 | 0.0% |
| Mobile Home / Other | 19 | 7.3% |
| Total | 259 | 100.0% |
Housing Structures by Occupancy in Minnesott Beach
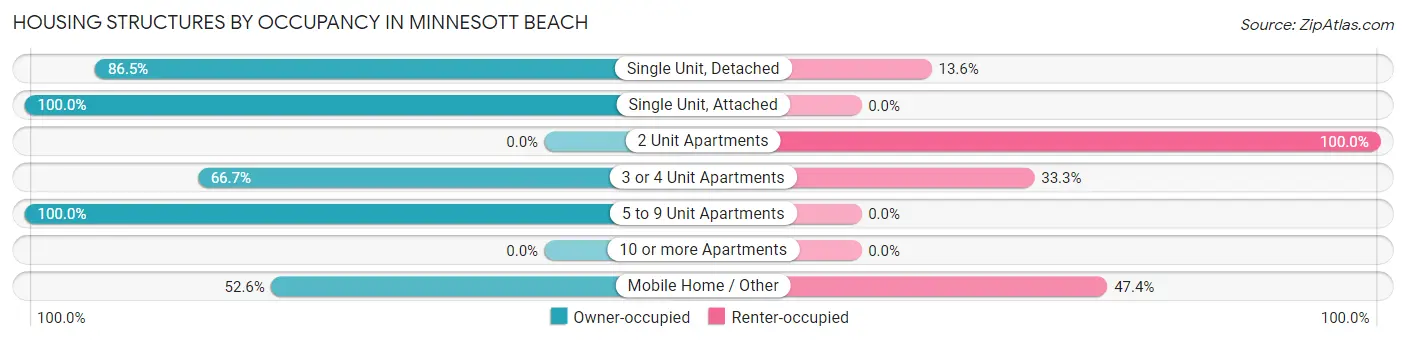
| Structure Type | Owner-occupied | Renter-occupied |
| Single Unit, Detached | 185 (86.5%) | 29 (13.6%) |
| Single Unit, Attached | 7 (100.0%) | 0 (0.0%) |
| 2 Unit Apartments | 0 (0.0%) | 4 (100.0%) |
| 3 or 4 Unit Apartments | 4 (66.7%) | 2 (33.3%) |
| 5 to 9 Unit Apartments | 9 (100.0%) | 0 (0.0%) |
| 10 or more Apartments | 0 (0.0%) | 0 (0.0%) |
| Mobile Home / Other | 10 (52.6%) | 9 (47.4%) |
| Total | 215 (83.0%) | 44 (17.0%) |
Housing Structures by Number of Rooms in Minnesott Beach
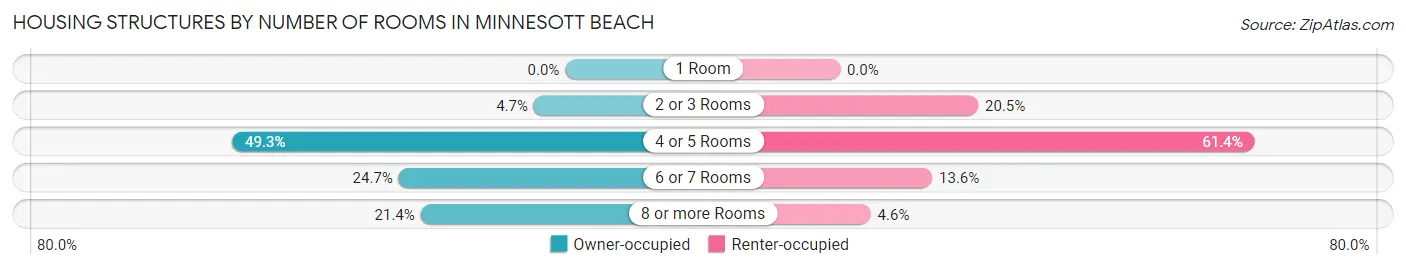
| Number of Rooms | Owner-occupied | Renter-occupied |
| 1 Room | 0 (0.0%) | 0 (0.0%) |
| 2 or 3 Rooms | 10 (4.6%) | 9 (20.4%) |
| 4 or 5 Rooms | 106 (49.3%) | 27 (61.4%) |
| 6 or 7 Rooms | 53 (24.6%) | 6 (13.6%) |
| 8 or more Rooms | 46 (21.4%) | 2 (4.5%) |
| Total | 215 (100.0%) | 44 (100.0%) |
Housing Structure by Heating Type in Minnesott Beach
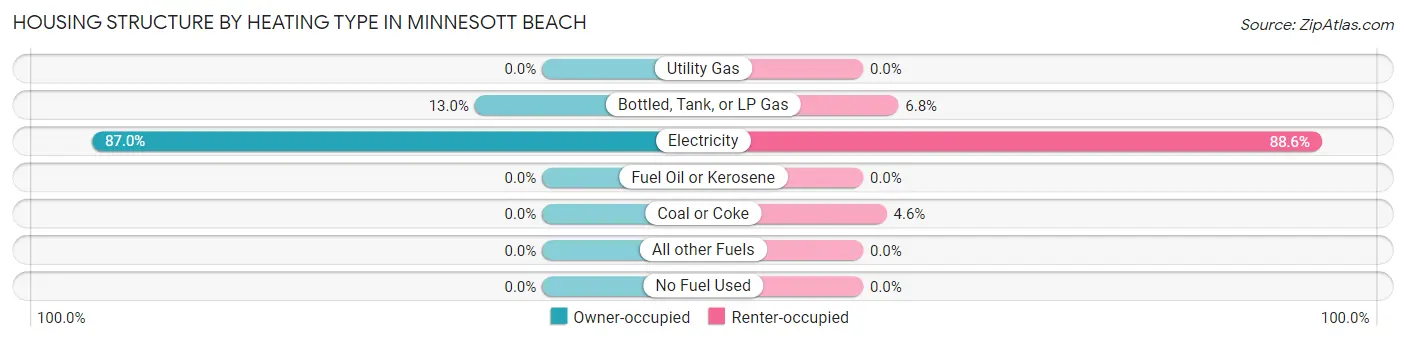
| Heating Type | Owner-occupied | Renter-occupied |
| Utility Gas | 0 (0.0%) | 0 (0.0%) |
| Bottled, Tank, or LP Gas | 28 (13.0%) | 3 (6.8%) |
| Electricity | 187 (87.0%) | 39 (88.6%) |
| Fuel Oil or Kerosene | 0 (0.0%) | 0 (0.0%) |
| Coal or Coke | 0 (0.0%) | 2 (4.5%) |
| All other Fuels | 0 (0.0%) | 0 (0.0%) |
| No Fuel Used | 0 (0.0%) | 0 (0.0%) |
| Total | 215 (100.0%) | 44 (100.0%) |
Household Vehicle Usage in Minnesott Beach
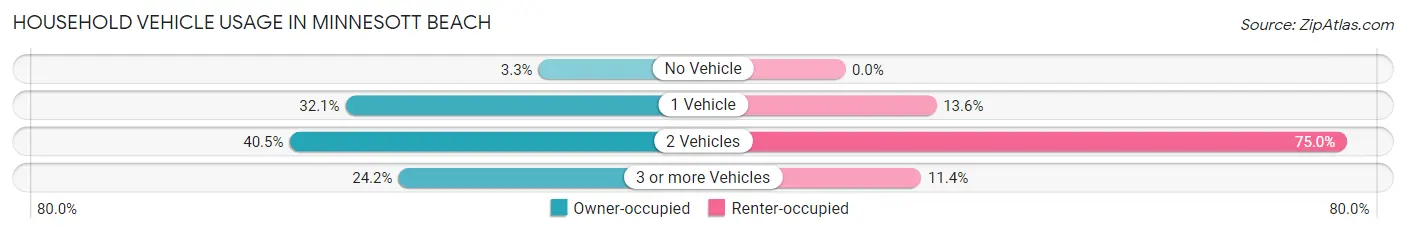
| Vehicles per Household | Owner-occupied | Renter-occupied |
| No Vehicle | 7 (3.3%) | 0 (0.0%) |
| 1 Vehicle | 69 (32.1%) | 6 (13.6%) |
| 2 Vehicles | 87 (40.5%) | 33 (75.0%) |
| 3 or more Vehicles | 52 (24.2%) | 5 (11.4%) |
| Total | 215 (100.0%) | 44 (100.0%) |
Real Estate & Mortgages in Minnesott Beach
Real Estate and Mortgage Overview in Minnesott Beach
| Characteristic | Without Mortgage | With Mortgage |
| Housing Units | 110 | 105 |
| Median Property Value | $320,800 | $282,800 |
| Median Household Income | $66,250 | $20 |
| Monthly Housing Costs | $572 | $12 |
| Real Estate Taxes | $1,882 | $2 |
Property Value by Mortgage Status in Minnesott Beach
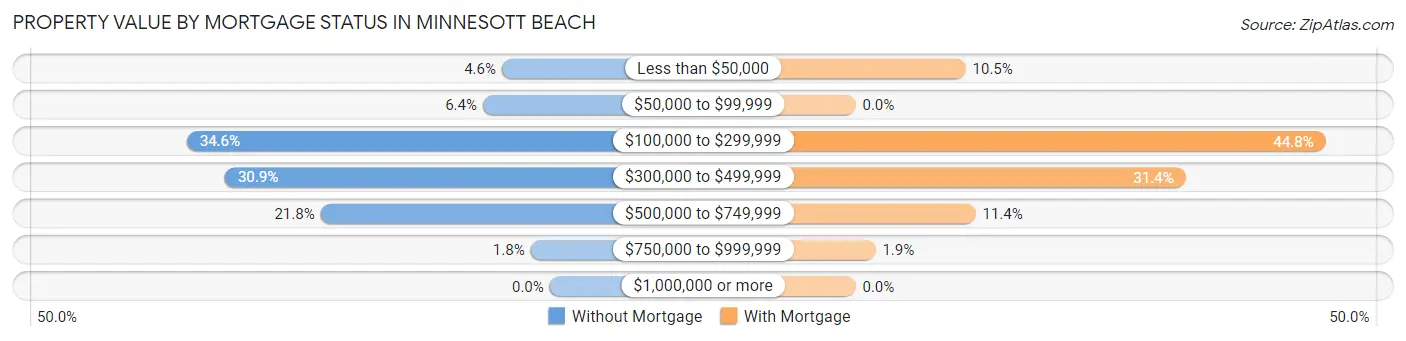
| Property Value | Without Mortgage | With Mortgage |
| Less than $50,000 | 5 (4.5%) | 11 (10.5%) |
| $50,000 to $99,999 | 7 (6.4%) | 0 (0.0%) |
| $100,000 to $299,999 | 38 (34.5%) | 47 (44.8%) |
| $300,000 to $499,999 | 34 (30.9%) | 33 (31.4%) |
| $500,000 to $749,999 | 24 (21.8%) | 12 (11.4%) |
| $750,000 to $999,999 | 2 (1.8%) | 2 (1.9%) |
| $1,000,000 or more | 0 (0.0%) | 0 (0.0%) |
| Total | 110 (100.0%) | 105 (100.0%) |
Household Income by Mortgage Status in Minnesott Beach
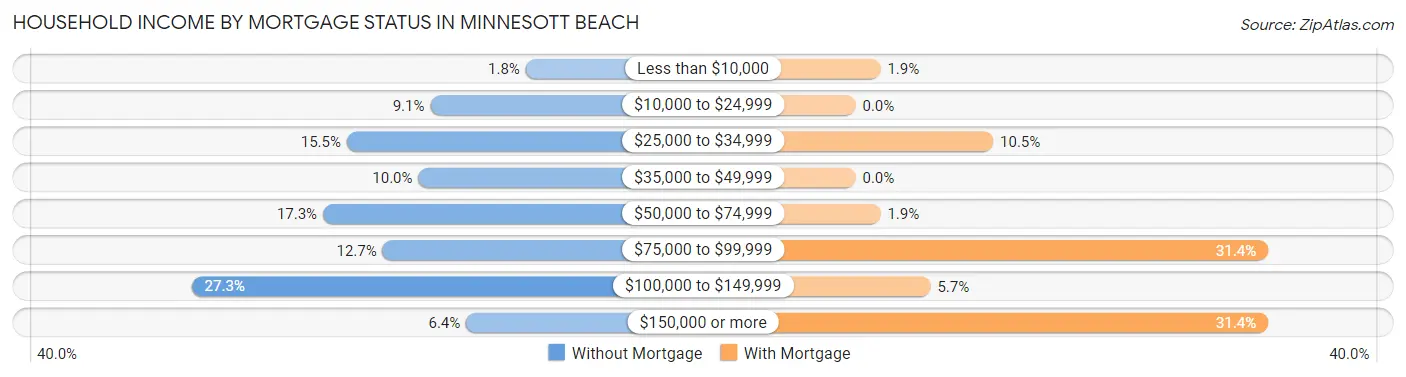
| Household Income | Without Mortgage | With Mortgage |
| Less than $10,000 | 2 (1.8%) | 2 (1.9%) |
| $10,000 to $24,999 | 10 (9.1%) | 0 (0.0%) |
| $25,000 to $34,999 | 17 (15.4%) | 11 (10.5%) |
| $35,000 to $49,999 | 11 (10.0%) | 0 (0.0%) |
| $50,000 to $74,999 | 19 (17.3%) | 2 (1.9%) |
| $75,000 to $99,999 | 14 (12.7%) | 33 (31.4%) |
| $100,000 to $149,999 | 30 (27.3%) | 6 (5.7%) |
| $150,000 or more | 7 (6.4%) | 33 (31.4%) |
| Total | 110 (100.0%) | 105 (100.0%) |
Property Value to Household Income Ratio in Minnesott Beach
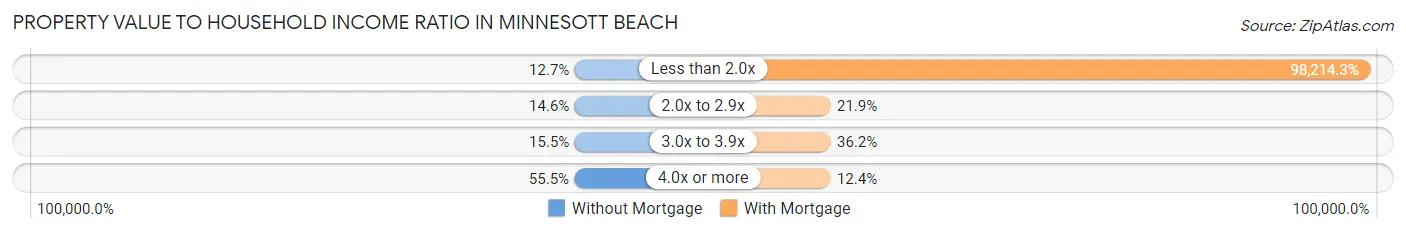
| Value-to-Income Ratio | Without Mortgage | With Mortgage |
| Less than 2.0x | 14 (12.7%) | 103,125 (98,214.3%) |
| 2.0x to 2.9x | 16 (14.5%) | 23 (21.9%) |
| 3.0x to 3.9x | 17 (15.4%) | 38 (36.2%) |
| 4.0x or more | 61 (55.4%) | 13 (12.4%) |
| Total | 110 (100.0%) | 105 (100.0%) |
Real Estate Taxes by Mortgage Status in Minnesott Beach
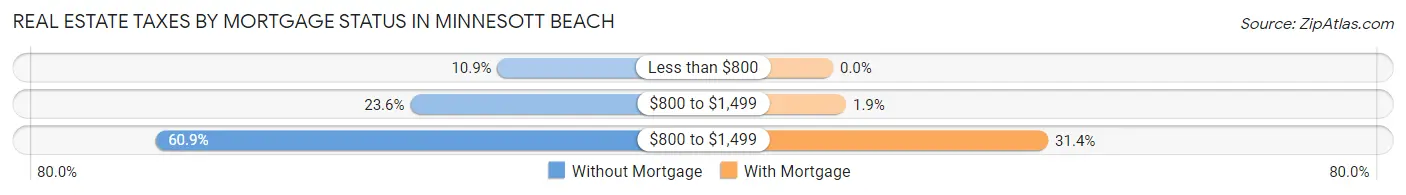
| Property Taxes | Without Mortgage | With Mortgage |
| Less than $800 | 12 (10.9%) | 0 (0.0%) |
| $800 to $1,499 | 26 (23.6%) | 2 (1.9%) |
| $800 to $1,499 | 67 (60.9%) | 33 (31.4%) |
| Total | 110 (100.0%) | 105 (100.0%) |
Health & Disability in Minnesott Beach
Health Insurance Coverage by Age in Minnesott Beach
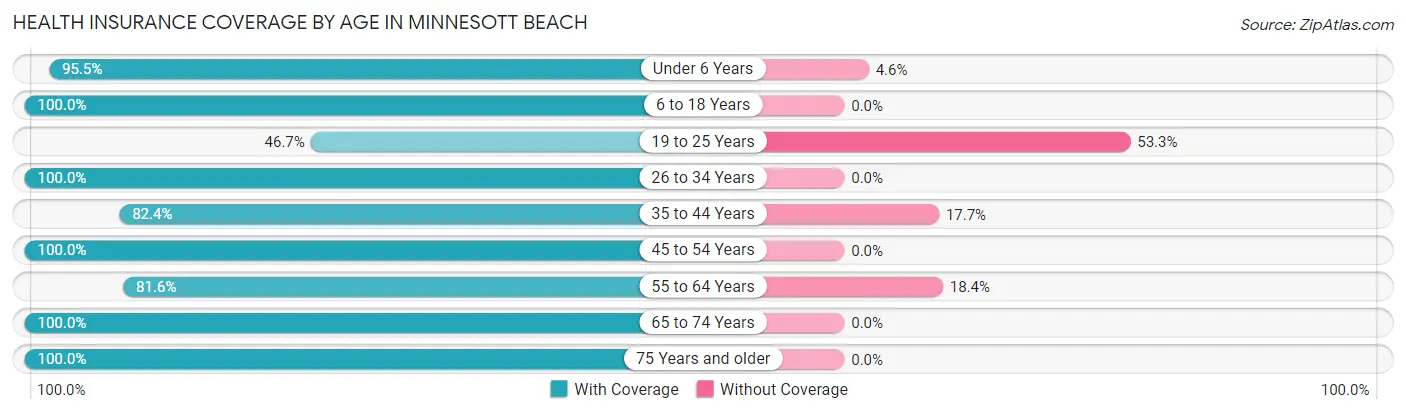
| Age Bracket | With Coverage | Without Coverage |
| Under 6 Years | 21 (95.5%) | 1 (4.5%) |
| 6 to 18 Years | 18 (100.0%) | 0 (0.0%) |
| 19 to 25 Years | 7 (46.7%) | 8 (53.3%) |
| 26 to 34 Years | 33 (100.0%) | 0 (0.0%) |
| 35 to 44 Years | 14 (82.4%) | 3 (17.6%) |
| 45 to 54 Years | 29 (100.0%) | 0 (0.0%) |
| 55 to 64 Years | 80 (81.6%) | 18 (18.4%) |
| 65 to 74 Years | 175 (100.0%) | 0 (0.0%) |
| 75 Years and older | 79 (100.0%) | 0 (0.0%) |
| Total | 456 (93.8%) | 30 (6.2%) |
Health Insurance Coverage by Citizenship Status in Minnesott Beach
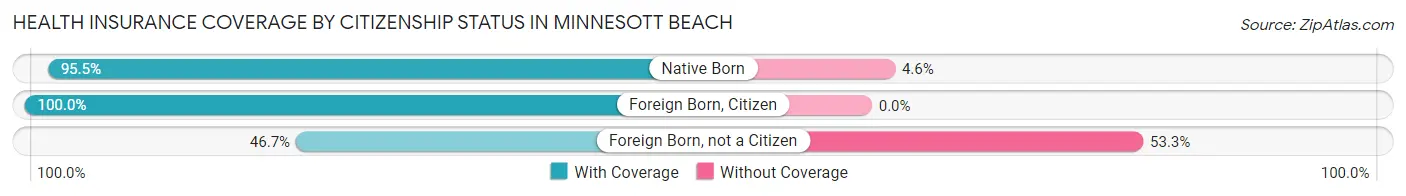
| Citizenship Status | With Coverage | Without Coverage |
| Native Born | 21 (95.5%) | 1 (4.5%) |
| Foreign Born, Citizen | 18 (100.0%) | 0 (0.0%) |
| Foreign Born, not a Citizen | 7 (46.7%) | 8 (53.3%) |
Health Insurance Coverage by Household Income in Minnesott Beach
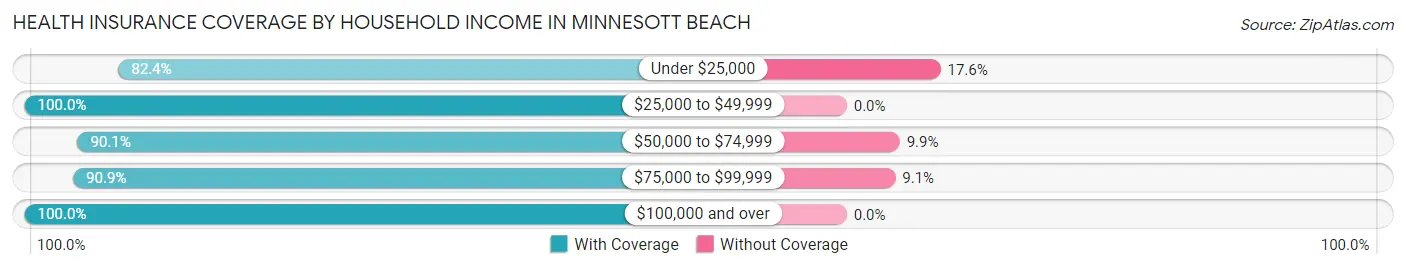
| Household Income | With Coverage | Without Coverage |
| Under $25,000 | 61 (82.4%) | 13 (17.6%) |
| $25,000 to $49,999 | 39 (100.0%) | 0 (0.0%) |
| $50,000 to $74,999 | 109 (90.1%) | 12 (9.9%) |
| $75,000 to $99,999 | 50 (90.9%) | 5 (9.1%) |
| $100,000 and over | 197 (100.0%) | 0 (0.0%) |
Public vs Private Health Insurance Coverage by Age in Minnesott Beach
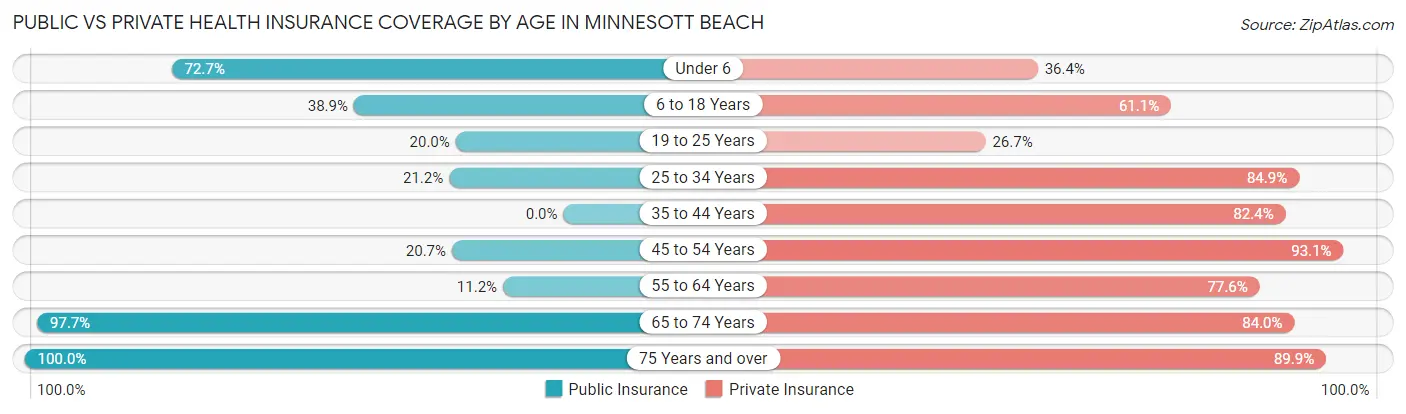
| Age Bracket | Public Insurance | Private Insurance |
| Under 6 | 16 (72.7%) | 8 (36.4%) |
| 6 to 18 Years | 7 (38.9%) | 11 (61.1%) |
| 19 to 25 Years | 3 (20.0%) | 4 (26.7%) |
| 25 to 34 Years | 7 (21.2%) | 28 (84.9%) |
| 35 to 44 Years | 0 (0.0%) | 14 (82.4%) |
| 45 to 54 Years | 6 (20.7%) | 27 (93.1%) |
| 55 to 64 Years | 11 (11.2%) | 76 (77.5%) |
| 65 to 74 Years | 171 (97.7%) | 147 (84.0%) |
| 75 Years and over | 79 (100.0%) | 71 (89.9%) |
| Total | 300 (61.7%) | 386 (79.4%) |
Disability Status by Sex by Age in Minnesott Beach
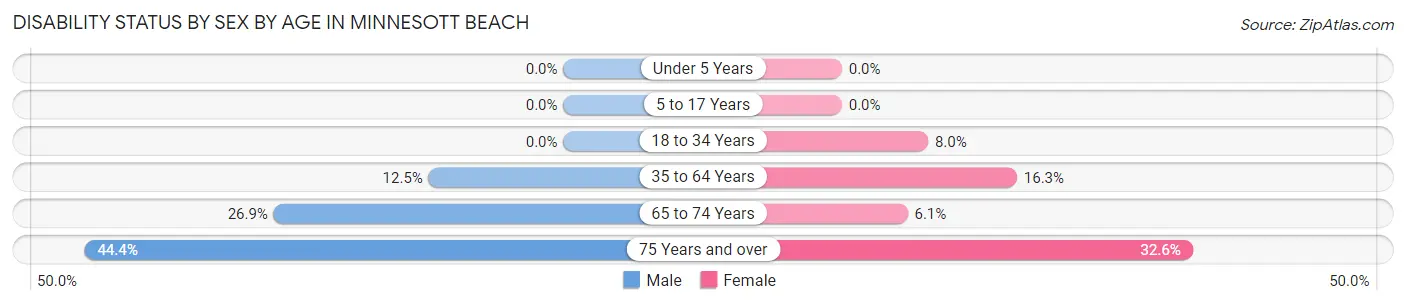
| Age Bracket | Male | Female |
| Under 5 Years | 0 (0.0%) | 0 (0.0%) |
| 5 to 17 Years | 0 (0.0%) | 0 (0.0%) |
| 18 to 34 Years | 0 (0.0%) | 2 (8.0%) |
| 35 to 64 Years | 8 (12.5%) | 13 (16.3%) |
| 65 to 74 Years | 25 (26.9%) | 5 (6.1%) |
| 75 Years and over | 16 (44.4%) | 14 (32.6%) |
Disability Class by Sex by Age in Minnesott Beach
Disability Class: Hearing Difficulty
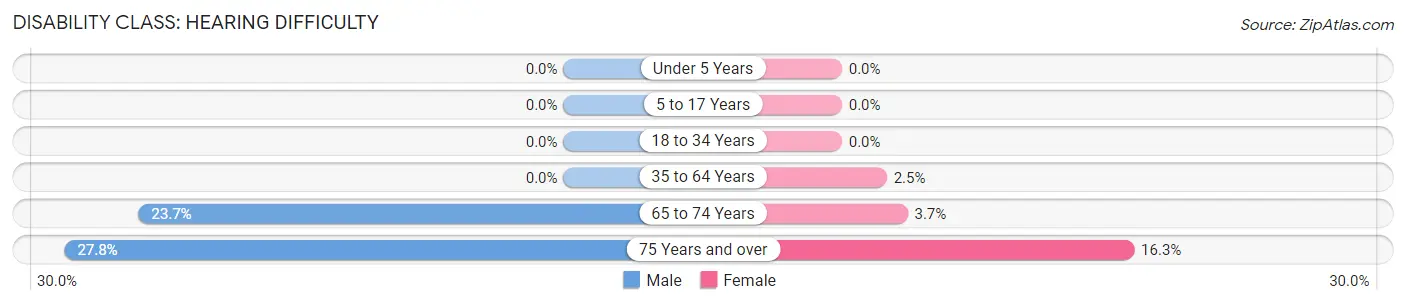
| Age Bracket | Male | Female |
| Under 5 Years | 0 (0.0%) | 0 (0.0%) |
| 5 to 17 Years | 0 (0.0%) | 0 (0.0%) |
| 18 to 34 Years | 0 (0.0%) | 0 (0.0%) |
| 35 to 64 Years | 0 (0.0%) | 2 (2.5%) |
| 65 to 74 Years | 22 (23.7%) | 3 (3.7%) |
| 75 Years and over | 10 (27.8%) | 7 (16.3%) |
Disability Class: Vision Difficulty
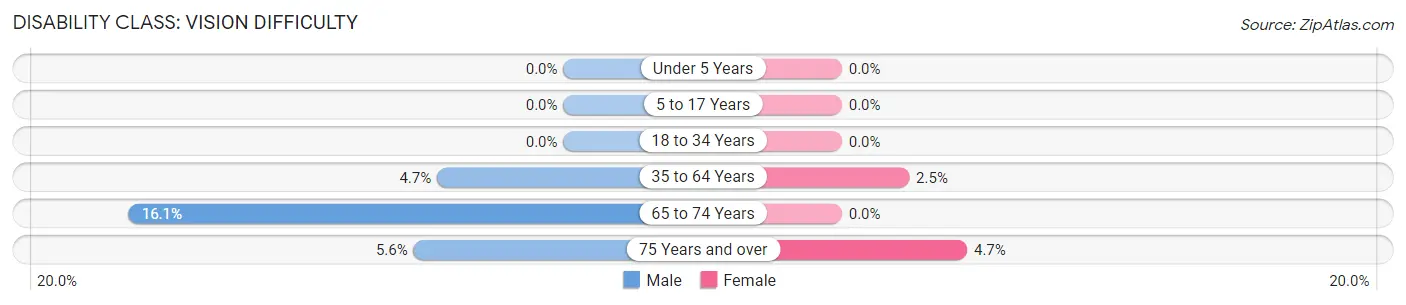
| Age Bracket | Male | Female |
| Under 5 Years | 0 (0.0%) | 0 (0.0%) |
| 5 to 17 Years | 0 (0.0%) | 0 (0.0%) |
| 18 to 34 Years | 0 (0.0%) | 0 (0.0%) |
| 35 to 64 Years | 3 (4.7%) | 2 (2.5%) |
| 65 to 74 Years | 15 (16.1%) | 0 (0.0%) |
| 75 Years and over | 2 (5.6%) | 2 (4.6%) |
Disability Class: Cognitive Difficulty
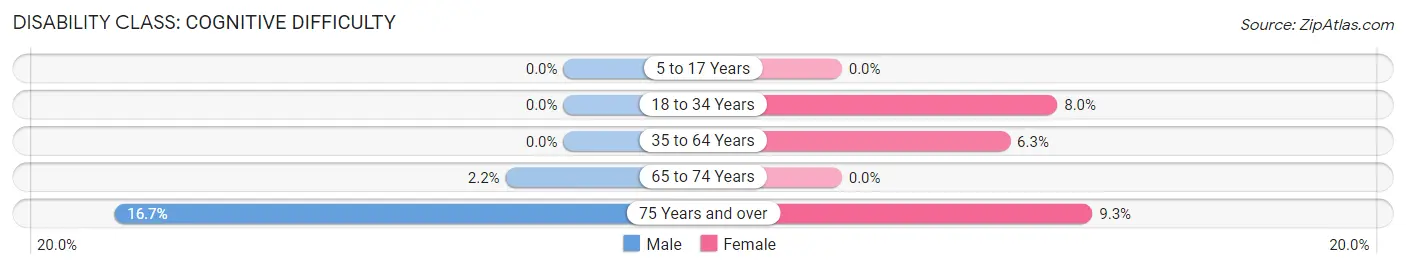
| Age Bracket | Male | Female |
| 5 to 17 Years | 0 (0.0%) | 0 (0.0%) |
| 18 to 34 Years | 0 (0.0%) | 2 (8.0%) |
| 35 to 64 Years | 0 (0.0%) | 5 (6.2%) |
| 65 to 74 Years | 2 (2.1%) | 0 (0.0%) |
| 75 Years and over | 6 (16.7%) | 4 (9.3%) |
Disability Class: Ambulatory Difficulty
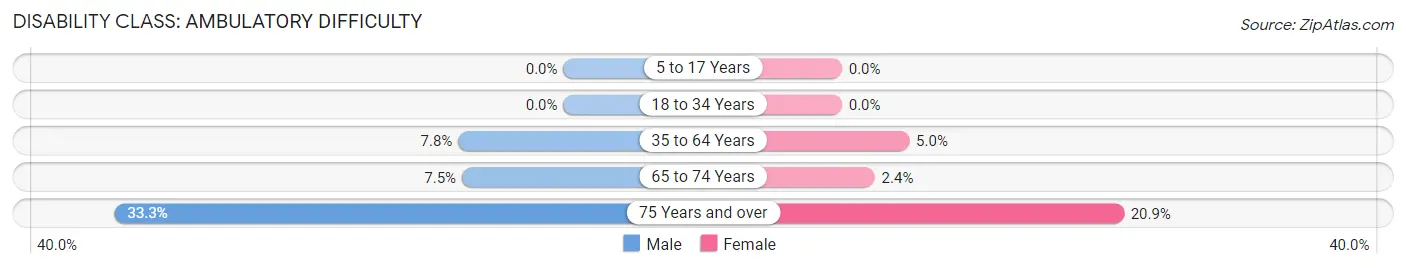
| Age Bracket | Male | Female |
| 5 to 17 Years | 0 (0.0%) | 0 (0.0%) |
| 18 to 34 Years | 0 (0.0%) | 0 (0.0%) |
| 35 to 64 Years | 5 (7.8%) | 4 (5.0%) |
| 65 to 74 Years | 7 (7.5%) | 2 (2.4%) |
| 75 Years and over | 12 (33.3%) | 9 (20.9%) |
Disability Class: Self-Care Difficulty
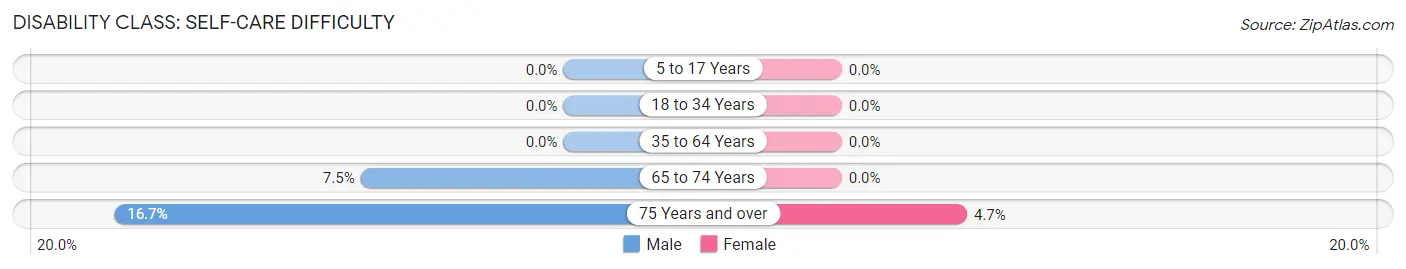
| Age Bracket | Male | Female |
| 5 to 17 Years | 0 (0.0%) | 0 (0.0%) |
| 18 to 34 Years | 0 (0.0%) | 0 (0.0%) |
| 35 to 64 Years | 0 (0.0%) | 0 (0.0%) |
| 65 to 74 Years | 7 (7.5%) | 0 (0.0%) |
| 75 Years and over | 6 (16.7%) | 2 (4.6%) |
Technology Access in Minnesott Beach
Computing Device Access in Minnesott Beach
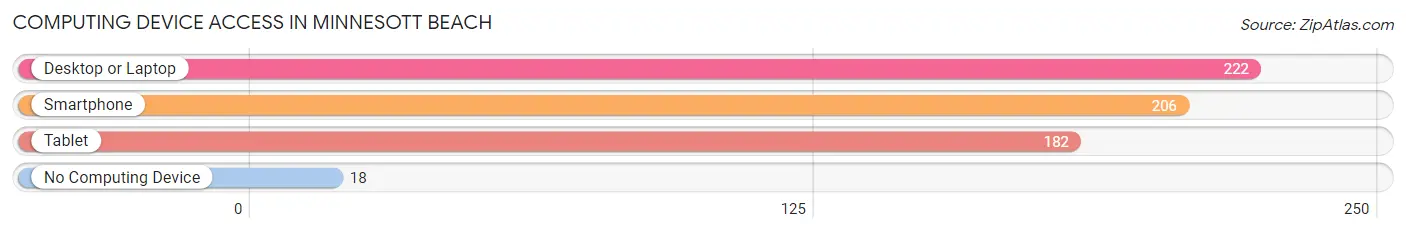
| Device Type | # Households | % Households |
| Desktop or Laptop | 222 | 85.7% |
| Smartphone | 206 | 79.5% |
| Tablet | 182 | 70.3% |
| No Computing Device | 18 | 7.0% |
| Total | 259 | 100.0% |
Internet Access in Minnesott Beach
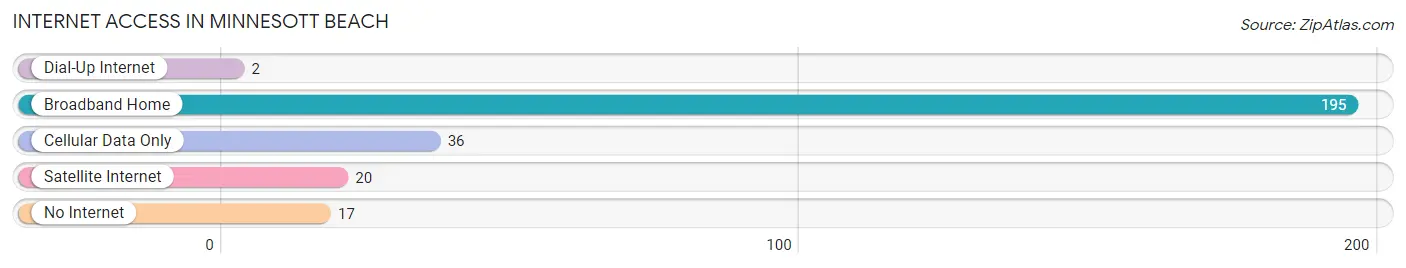
| Internet Type | # Households | % Households |
| Dial-Up Internet | 2 | 0.8% |
| Broadband Home | 195 | 75.3% |
| Cellular Data Only | 36 | 13.9% |
| Satellite Internet | 20 | 7.7% |
| No Internet | 17 | 6.6% |
| Total | 259 | 100.0% |
Minnesott Beach Summary
Minnesott Beach is a small unincorporated community located in Pamlico County, North Carolina. It is situated on the northern shore of the Neuse River, approximately 20 miles east of New Bern. The community is part of the New Bern Metropolitan Statistical Area and is home to approximately 1,000 people.
History
Minnesott Beach was first settled in the late 1700s by a group of German immigrants. The community was originally known as “Minnesott”, which is derived from the German word “minne”, meaning “love”. The name was later changed to “Minnesott Beach” when the community was incorporated in 1891.
The community was a popular vacation spot for wealthy families from the nearby cities of New Bern and Washington. The area was known for its beautiful beaches and tranquil atmosphere. In the early 1900s, the community was home to several large resorts, including the Minnesott Beach Hotel and the Minnesott Beach Club.
Geography
Minnesott Beach is located in Pamlico County, North Carolina. It is situated on the northern shore of the Neuse River, approximately 20 miles east of New Bern. The community is part of the New Bern Metropolitan Statistical Area.
The area is characterized by flat terrain and sandy beaches. The climate is humid subtropical, with hot, humid summers and mild winters. The average annual temperature is around 70 degrees Fahrenheit.
Economy
The economy of Minnesott Beach is largely based on tourism. The area is home to several resorts and vacation rental properties, as well as a variety of restaurants and shops. The community is also home to a marina, which provides access to the Neuse River.
In addition to tourism, the area is home to several small businesses, including a boat repair shop, a bait and tackle shop, and a seafood market. The community is also home to a number of small farms, which produce a variety of crops, including corn, soybeans, and cotton.
Demographics
As of the 2010 census, the population of Minnesott Beach was 1,000. The racial makeup of the community was 94.2% White, 2.7% African American, 0.7% Native American, 0.3% Asian, and 2.1% from other races. The median household income was $41,250, and the median family income was $50,000.
Conclusion
Minnesott Beach is a small unincorporated community located in Pamlico County, North Carolina. It is situated on the northern shore of the Neuse River, approximately 20 miles east of New Bern. The community is part of the New Bern Metropolitan Statistical Area and is home to approximately 1,000 people. The economy of Minnesott Beach is largely based on tourism, with a variety of resorts, restaurants, and shops. The area is also home to several small businesses and farms. The population of Minnesott Beach is predominantly White, with a median household income of $41,250.
Common Questions
What is the Total Population of Minnesott Beach?
Total Population of Minnesott Beach is 486.
What is the Total Male Population of Minnesott Beach?
Total Male Population of Minnesott Beach is 251.
What is the Total Female Population of Minnesott Beach?
Total Female Population of Minnesott Beach is 235.
What is the Ratio of Males per 100 Females in Minnesott Beach?
There are 106.81 Males per 100 Females in Minnesott Beach.
What is the Ratio of Females per 100 Males in Minnesott Beach?
There are 93.63 Females per 100 Males in Minnesott Beach.
What is the Median Population Age in Minnesott Beach?
Median Population Age in Minnesott Beach is 65.5 Years.
What is the Average Family Size in Minnesott Beach
Average Family Size in Minnesott Beach is 2.3 People.
What is the Average Household Size in Minnesott Beach
Average Household Size in Minnesott Beach is 1.9 People.
What is Per Capita Income in Minnesott Beach?
Per Capita income in Minnesott Beach is $51,136.
What is the Median Family Income in Minnesott Beach?
Median Family Income in Minnesott Beach is $92,188.
What is the Median Household income in Minnesott Beach?
Median Household Income in Minnesott Beach is $77,596.
What is Income or Wage Gap in Minnesott Beach?
Income or Wage Gap in Minnesott Beach is 25.5%.
Women in Minnesott Beach earn 74.5 cents for every dollar earned by a man.
What is Inequality or Gini Index in Minnesott Beach?
Inequality or Gini Index in Minnesott Beach is 0.43.
How Large is the Labor Force in Minnesott Beach?
There are 156 People in the Labor Forcein in Minnesott Beach.
What is the Percentage of People in the Labor Force in Minnesott Beach?
34.6% of People are in the Labor Force in Minnesott Beach.