Salem, NC
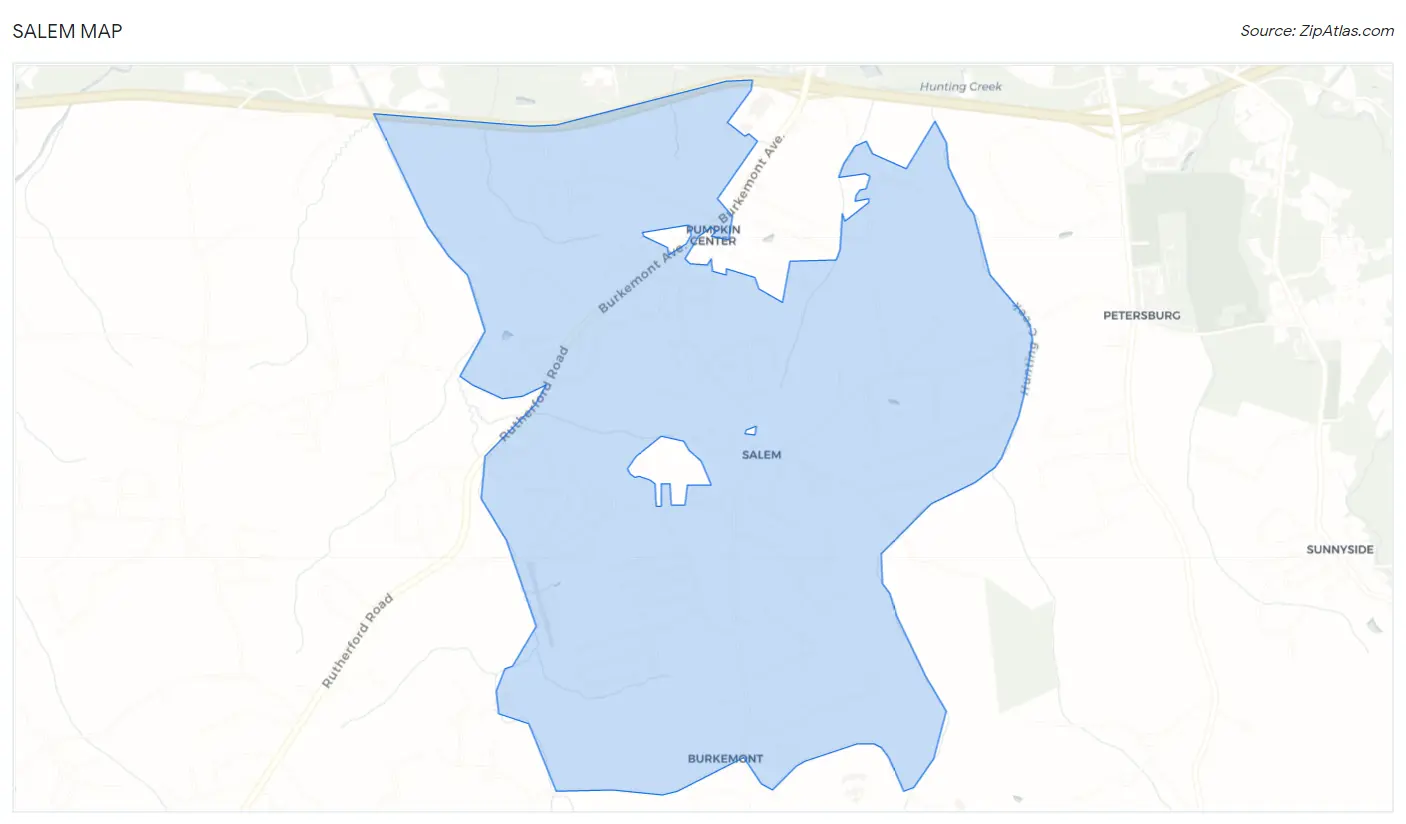
Salem Map
Salem Overview
1,634
TOTAL POPULATION
740
MALE POPULATION
894
FEMALE POPULATION
82.77
MALES / 100 FEMALES
120.81
FEMALES / 100 MALES
40.0
MEDIAN AGE
3.1
AVG FAMILY SIZE
2.3
AVG HOUSEHOLD SIZE
$26,415
PER CAPITA INCOME
$74,261
AVG FAMILY INCOME
$55,156
AVG HOUSEHOLD INCOME
16.2%
WAGE / INCOME GAP [ % ]
83.8¢/ $1
WAGE / INCOME GAP [ $ ]
0.37
INEQUALITY / GINI INDEX
771
LABOR FORCE [ PEOPLE ]
57.0%
PERCENT IN LABOR FORCE
5.8%
UNEMPLOYMENT RATE
Race in Salem
The most populous races in Salem are White / Caucasian (1,316 | 80.5%), Hispanic or Latino (256 | 15.7%), and Some other Race (206 | 12.6%).
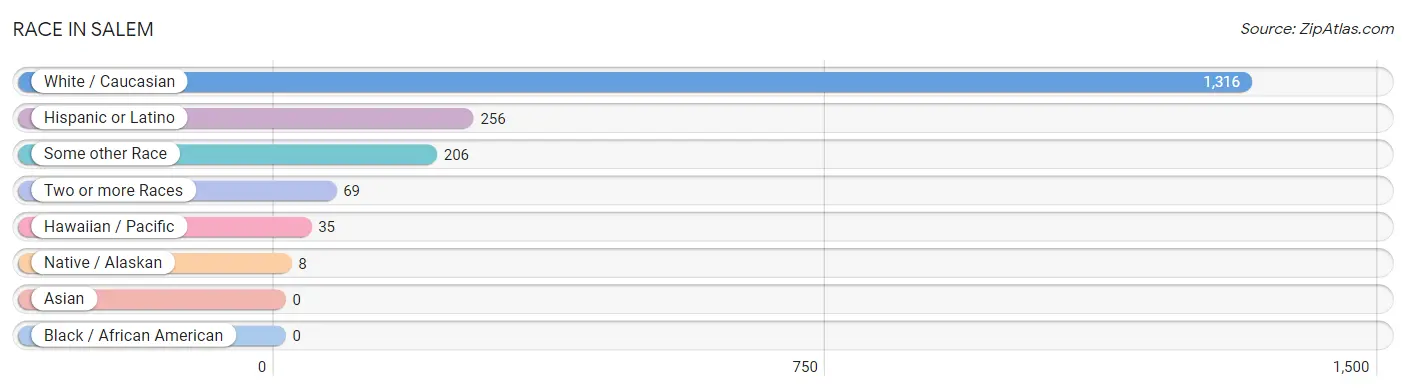
| Race | # Population | % Population |
| Asian | 0 | 0.0% |
| Black / African American | 0 | 0.0% |
| Hawaiian / Pacific | 35 | 2.1% |
| Hispanic or Latino | 256 | 15.7% |
| Native / Alaskan | 8 | 0.5% |
| White / Caucasian | 1,316 | 80.5% |
| Two or more Races | 69 | 4.2% |
| Some other Race | 206 | 12.6% |
| Total | 1,634 | 100.0% |
Ancestry in Salem
The most populous ancestries reported in Salem are American (437 | 26.7%), German (250 | 15.3%), English (246 | 15.1%), Irish (145 | 8.9%), and Central American (95 | 5.8%), together accounting for 71.8% of all Salem residents.
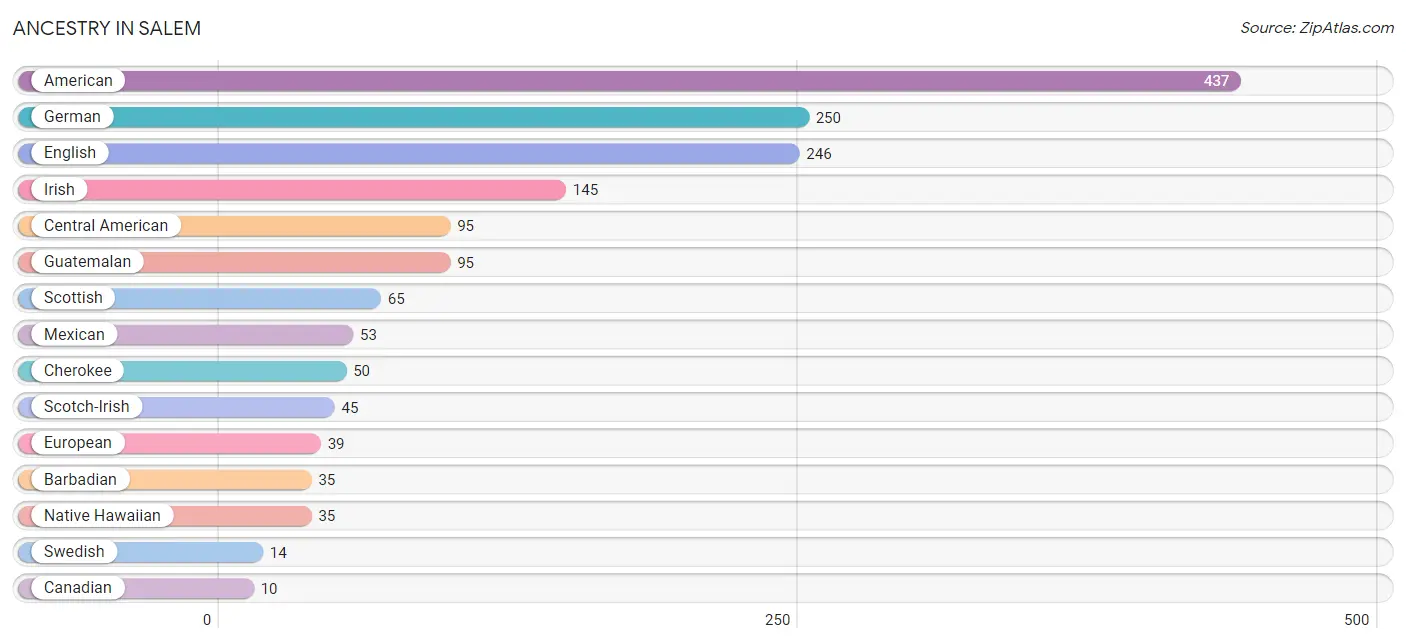
| Ancestry | # Population | % Population |
| American | 437 | 26.7% |
| Arab | 6 | 0.4% |
| Barbadian | 35 | 2.1% |
| Canadian | 10 | 0.6% |
| Central American | 95 | 5.8% |
| Central American Indian | 8 | 0.5% |
| Cherokee | 50 | 3.1% |
| Dutch | 8 | 0.5% |
| English | 246 | 15.1% |
| European | 39 | 2.4% |
| French | 6 | 0.4% |
| German | 250 | 15.3% |
| Guatemalan | 95 | 5.8% |
| Irish | 145 | 8.9% |
| Lebanese | 6 | 0.4% |
| Mexican | 53 | 3.2% |
| Native Hawaiian | 35 | 2.1% |
| Scotch-Irish | 45 | 2.8% |
| Scottish | 65 | 4.0% |
| Swedish | 14 | 0.9% | View All 20 Rows |
Immigrants in Salem
The most numerous immigrant groups reported in Salem came from Central America (81 | 5.0%), Latin America (81 | 5.0%), Guatemala (70 | 4.3%), Mexico (11 | 0.7%), and England (9 | 0.5%), together accounting for 15.4% of all Salem residents.
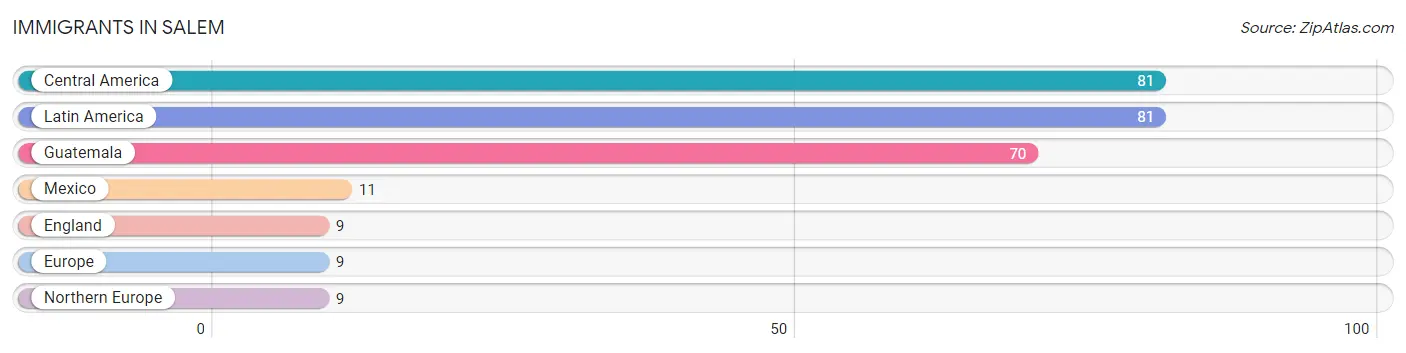
| Immigration Origin | # Population | % Population |
| Central America | 81 | 5.0% |
| England | 9 | 0.5% |
| Europe | 9 | 0.5% |
| Guatemala | 70 | 4.3% |
| Latin America | 81 | 5.0% |
| Mexico | 11 | 0.7% |
| Northern Europe | 9 | 0.5% | View All 7 Rows |
Sex and Age in Salem
Sex and Age in Salem
The most populous age groups in Salem are 35 to 39 Years (134 | 18.1%) for men and 30 to 34 Years (120 | 13.4%) for women.
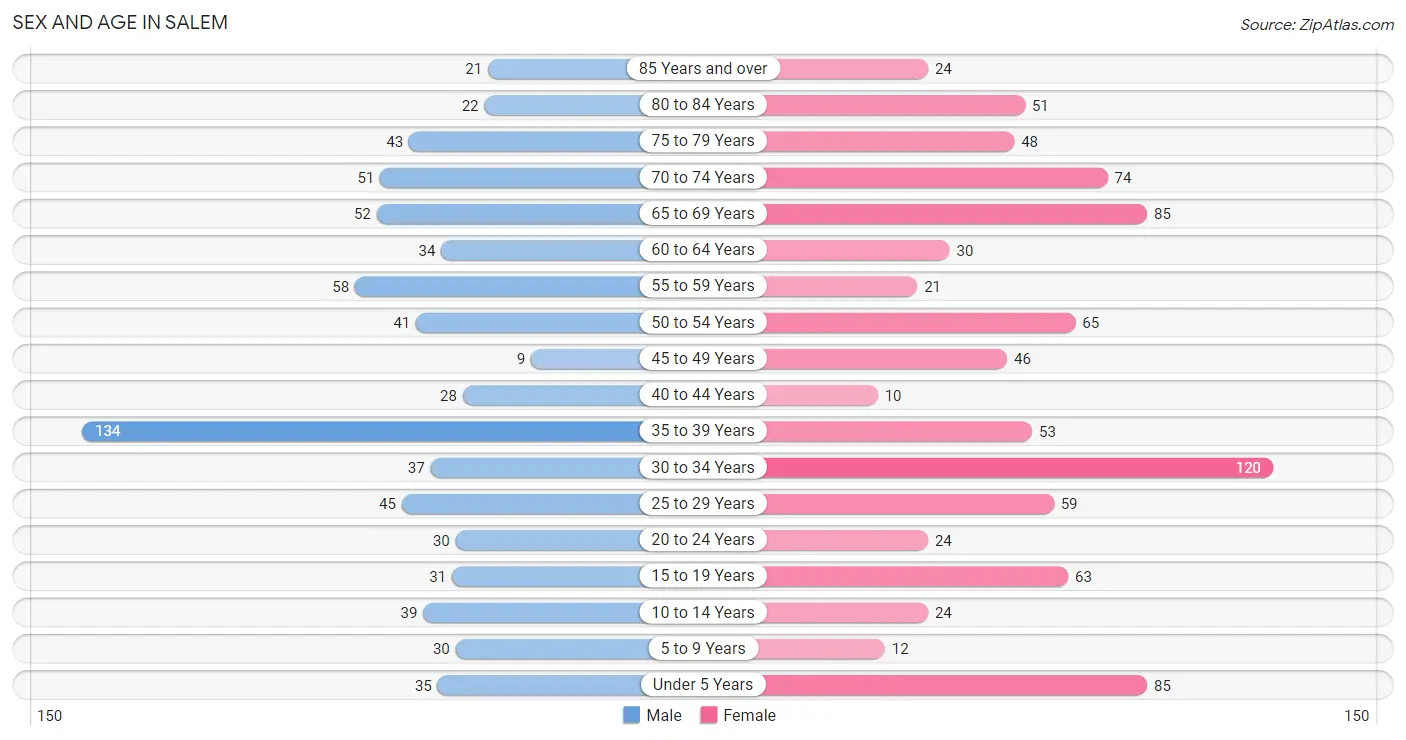
| Age Bracket | Male | Female |
| Under 5 Years | 35 (4.7%) | 85 (9.5%) |
| 5 to 9 Years | 30 (4.1%) | 12 (1.3%) |
| 10 to 14 Years | 39 (5.3%) | 24 (2.7%) |
| 15 to 19 Years | 31 (4.2%) | 63 (7.0%) |
| 20 to 24 Years | 30 (4.1%) | 24 (2.7%) |
| 25 to 29 Years | 45 (6.1%) | 59 (6.6%) |
| 30 to 34 Years | 37 (5.0%) | 120 (13.4%) |
| 35 to 39 Years | 134 (18.1%) | 53 (5.9%) |
| 40 to 44 Years | 28 (3.8%) | 10 (1.1%) |
| 45 to 49 Years | 9 (1.2%) | 46 (5.1%) |
| 50 to 54 Years | 41 (5.5%) | 65 (7.3%) |
| 55 to 59 Years | 58 (7.8%) | 21 (2.4%) |
| 60 to 64 Years | 34 (4.6%) | 30 (3.4%) |
| 65 to 69 Years | 52 (7.0%) | 85 (9.5%) |
| 70 to 74 Years | 51 (6.9%) | 74 (8.3%) |
| 75 to 79 Years | 43 (5.8%) | 48 (5.4%) |
| 80 to 84 Years | 22 (3.0%) | 51 (5.7%) |
| 85 Years and over | 21 (2.8%) | 24 (2.7%) |
| Total | 740 (100.0%) | 894 (100.0%) |
Families and Households in Salem
Median Family Size in Salem
The median family size in Salem is 3.08 persons per family, with married-couple families (290 | 76.5%) accounting for the largest median family size of 3.31 persons per family. On the other hand, single male/father families (39 | 10.3%) represent the smallest median family size with 1.92 persons per family.
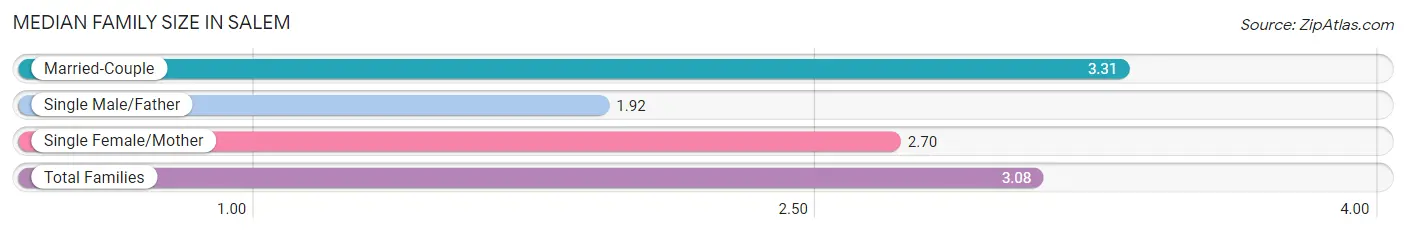
| Family Type | # Families | Family Size |
| Married-Couple | 290 (76.5%) | 3.31 |
| Single Male/Father | 39 (10.3%) | 1.92 |
| Single Female/Mother | 50 (13.2%) | 2.70 |
| Total Families | 379 (100.0%) | 3.08 |
Median Household Size in Salem
The median household size in Salem is 2.27 persons per household, with married-couple households (290 | 40.3%) accounting for the largest median household size of 3.31 persons per household. non-family households (341 | 47.4%) represent the smallest median household size with 1.28 persons per household.
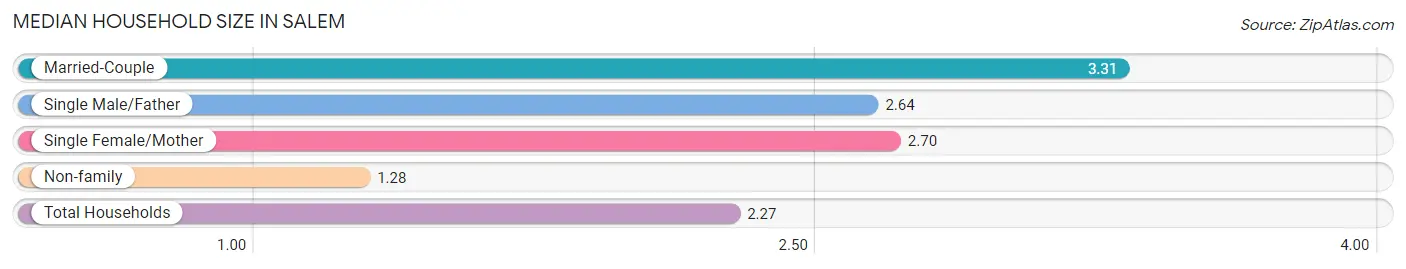
| Household Type | # Households | Household Size |
| Married-Couple | 290 (40.3%) | 3.31 |
| Single Male/Father | 39 (5.4%) | 2.64 |
| Single Female/Mother | 50 (6.9%) | 2.70 |
| Non-family | 341 (47.4%) | 1.28 |
| Total Households | 720 (100.0%) | 2.27 |
Household Size by Marriage Status in Salem
Out of a total of 720 households in Salem, 379 (52.6%) are family households, while 341 (47.4%) are nonfamily households. The most numerous type of family households are 2-person households, comprising 170, and the most common type of nonfamily households are 1-person households, comprising 267.
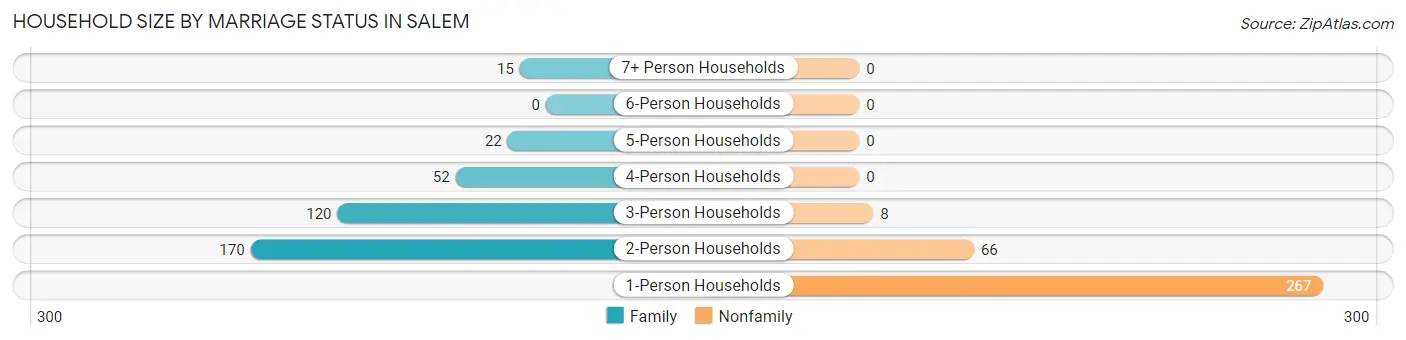
| Household Size | Family Households | Nonfamily Households |
| 1-Person Households | - | 267 (37.1%) |
| 2-Person Households | 170 (23.6%) | 66 (9.2%) |
| 3-Person Households | 120 (16.7%) | 8 (1.1%) |
| 4-Person Households | 52 (7.2%) | 0 (0.0%) |
| 5-Person Households | 22 (3.1%) | 0 (0.0%) |
| 6-Person Households | 0 (0.0%) | 0 (0.0%) |
| 7+ Person Households | 15 (2.1%) | 0 (0.0%) |
| Total | 379 (52.6%) | 341 (47.4%) |
Female Fertility in Salem
Fertility by Age in Salem
Average fertility rate in Salem is 121.0 births per 1,000 women. Women in the age bracket of 20 to 34 years have the highest fertility rate with 251.0 births per 1,000 women. Women in the age bracket of 20 to 34 years acount for 100.0% of all women with births.
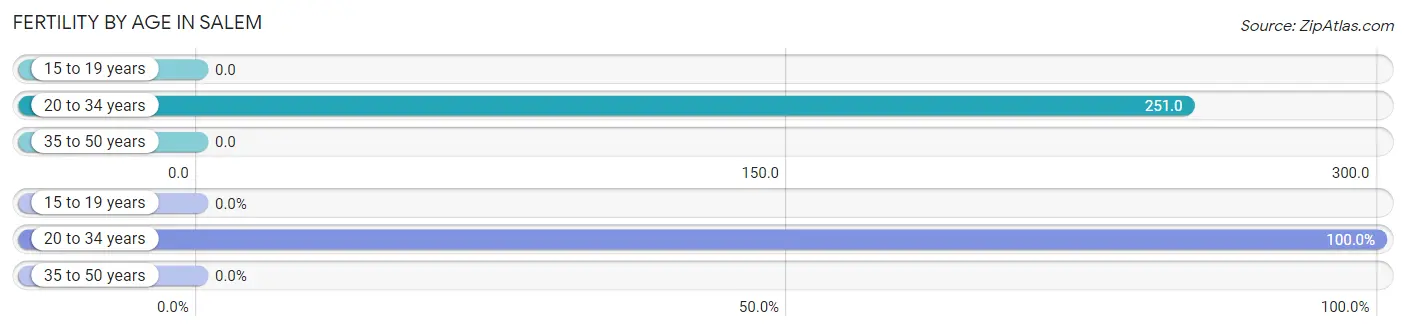
| Age Bracket | Women with Births | Births / 1,000 Women |
| 15 to 19 years | 0 (0.0%) | 0.0 |
| 20 to 34 years | 51 (100.0%) | 251.0 |
| 35 to 50 years | 0 (0.0%) | 0.0 |
| Total | 51 (100.0%) | 121.0 |
Fertility by Age by Marriage Status in Salem
23.5% of women with births (51) in Salem are married. The highest percentage of unmarried women with births falls into 20 to 34 years age bracket with 76.5% of them unmarried at the time of birth, while the lowest percentage of unmarried women with births belong to 20 to 34 years age bracket with 76.5% of them unmarried.
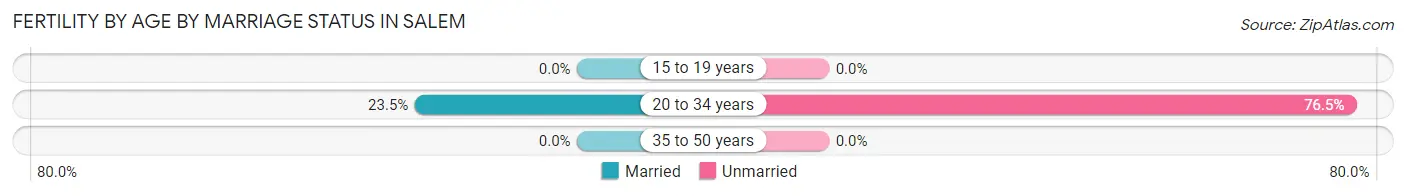
| Age Bracket | Married | Unmarried |
| 15 to 19 years | 0 (0.0%) | 0 (0.0%) |
| 20 to 34 years | 12 (23.5%) | 39 (76.5%) |
| 35 to 50 years | 0 (0.0%) | 0 (0.0%) |
| Total | 12 (23.5%) | 39 (76.5%) |
Fertility by Education in Salem
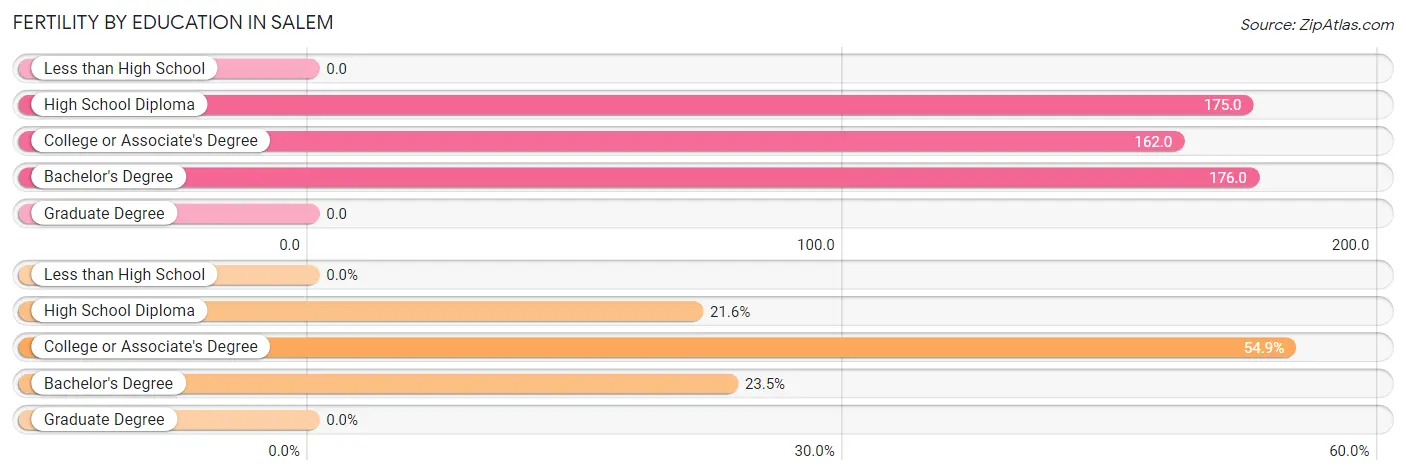
| Educational Attainment | Women with Births | Births / 1,000 Women |
| Less than High School | 0 (0.0%) | 0.0 |
| High School Diploma | 11 (21.6%) | 175.0 |
| College or Associate's Degree | 28 (54.9%) | 162.0 |
| Bachelor's Degree | 12 (23.5%) | 176.0 |
| Graduate Degree | 0 (0.0%) | 0.0 |
| Total | 51 (100.0%) | 121.0 |
Fertility by Education by Marriage Status in Salem
76.5% of women with births in Salem are unmarried. Women with the educational attainment of bachelor's degree are most likely to be married with 100.0% of them married at childbirth, while women with the educational attainment of high school diploma are least likely to be married with 100.0% of them unmarried at childbirth.
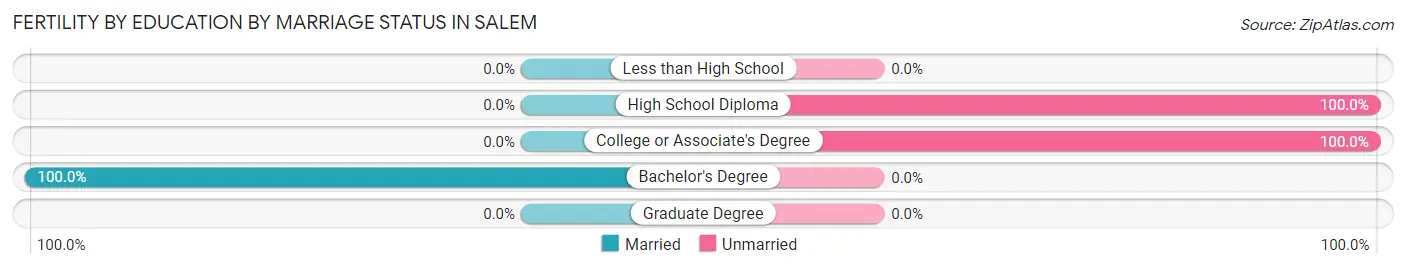
| Educational Attainment | Married | Unmarried |
| Less than High School | 0 (0.0%) | 0 (0.0%) |
| High School Diploma | 0 (0.0%) | 11 (100.0%) |
| College or Associate's Degree | 0 (0.0%) | 28 (100.0%) |
| Bachelor's Degree | 12 (100.0%) | 0 (0.0%) |
| Graduate Degree | 0 (0.0%) | 0 (0.0%) |
| Total | 12 (23.5%) | 39 (76.5%) |
Income in Salem
Income Overview in Salem
Per Capita Income in Salem is $26,415, while median incomes of families and households are $74,261 and $55,156 respectively.
| Characteristic | Number | Measure |
| Per Capita Income | 1,634 | $26,415 |
| Median Family Income | 379 | $74,261 |
| Mean Family Income | 379 | $77,068 |
| Median Household Income | 720 | $55,156 |
| Mean Household Income | 720 | $57,392 |
| Income Deficit | 379 | $0 |
| Wage / Income Gap (%) | 1,634 | 16.18% |
| Wage / Income Gap ($) | 1,634 | 83.82¢ per $1 |
| Gini / Inequality Index | 1,634 | 0.37 |
Earnings by Sex in Salem
Average Earnings in Salem are $37,898, $41,154 for men and $34,494 for women, a difference of 16.2%.
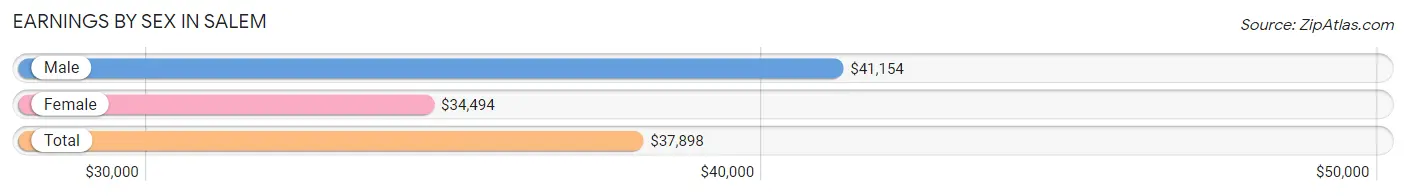
| Sex | Number | Average Earnings |
| Male | 346 (45.4%) | $41,154 |
| Female | 417 (54.6%) | $34,494 |
| Total | 763 (100.0%) | $37,898 |
Earnings by Sex by Income Bracket in Salem
The most common earnings brackets in Salem are $45,000 to $49,999 for men (82 | 23.7%) and $35,000 to $39,999 for women (96 | 23.0%).
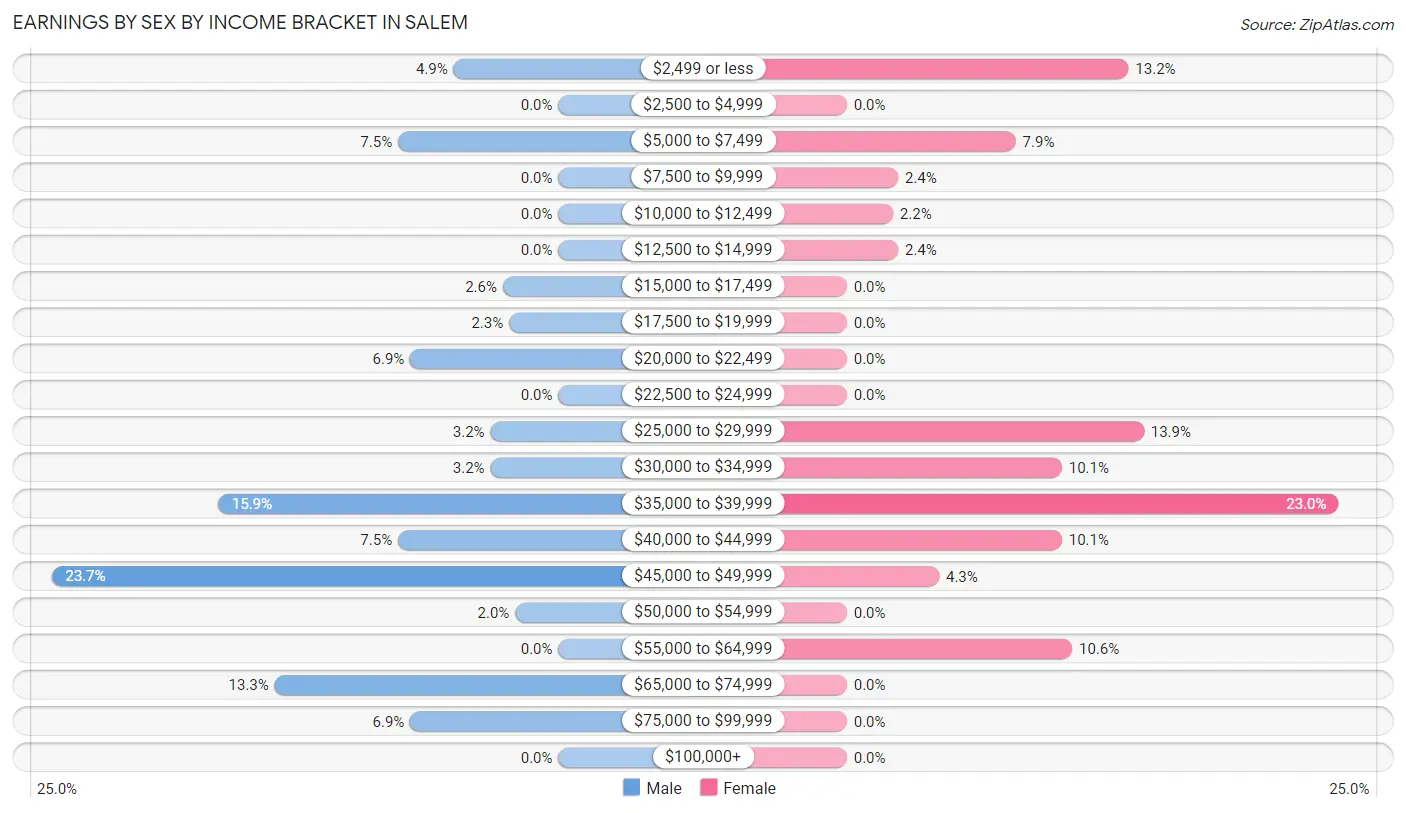
| Income | Male | Female |
| $2,499 or less | 17 (4.9%) | 55 (13.2%) |
| $2,500 to $4,999 | 0 (0.0%) | 0 (0.0%) |
| $5,000 to $7,499 | 26 (7.5%) | 33 (7.9%) |
| $7,500 to $9,999 | 0 (0.0%) | 10 (2.4%) |
| $10,000 to $12,499 | 0 (0.0%) | 9 (2.2%) |
| $12,500 to $14,999 | 0 (0.0%) | 10 (2.4%) |
| $15,000 to $17,499 | 9 (2.6%) | 0 (0.0%) |
| $17,500 to $19,999 | 8 (2.3%) | 0 (0.0%) |
| $20,000 to $22,499 | 24 (6.9%) | 0 (0.0%) |
| $22,500 to $24,999 | 0 (0.0%) | 0 (0.0%) |
| $25,000 to $29,999 | 11 (3.2%) | 58 (13.9%) |
| $30,000 to $34,999 | 11 (3.2%) | 42 (10.1%) |
| $35,000 to $39,999 | 55 (15.9%) | 96 (23.0%) |
| $40,000 to $44,999 | 26 (7.5%) | 42 (10.1%) |
| $45,000 to $49,999 | 82 (23.7%) | 18 (4.3%) |
| $50,000 to $54,999 | 7 (2.0%) | 0 (0.0%) |
| $55,000 to $64,999 | 0 (0.0%) | 44 (10.5%) |
| $65,000 to $74,999 | 46 (13.3%) | 0 (0.0%) |
| $75,000 to $99,999 | 24 (6.9%) | 0 (0.0%) |
| $100,000+ | 0 (0.0%) | 0 (0.0%) |
| Total | 346 (100.0%) | 417 (100.0%) |
Earnings by Sex by Educational Attainment in Salem
Average earnings in Salem are $41,202 for men and $37,574 for women, a difference of 8.8%. Men with an educational attainment of college or associate's degree enjoy the highest average annual earnings of $45,893, while those with high school diploma education earn the least with $45,573. Women with an educational attainment of bachelor's degree earn the most with the average annual earnings of $39,549, while those with college or associate's degree education have the smallest earnings of $34,044.
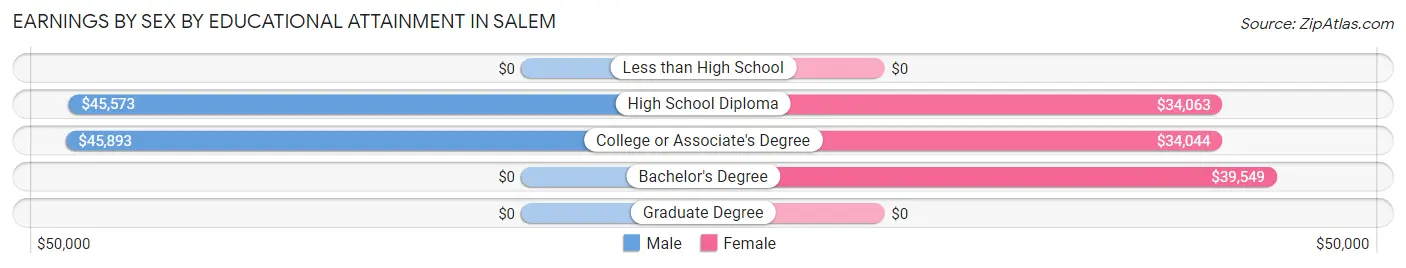
| Educational Attainment | Male Income | Female Income |
| Less than High School | - | - |
| High School Diploma | $45,573 | $34,063 |
| College or Associate's Degree | $45,893 | $34,044 |
| Bachelor's Degree | - | - |
| Graduate Degree | - | - |
| Total | $41,202 | $37,574 |
Family Income in Salem
Family Income Brackets in Salem
According to the Salem family income data, there are 130 families falling into the $50,000 to $74,999 income range, which is the most common income bracket and makes up 34.3% of all families.
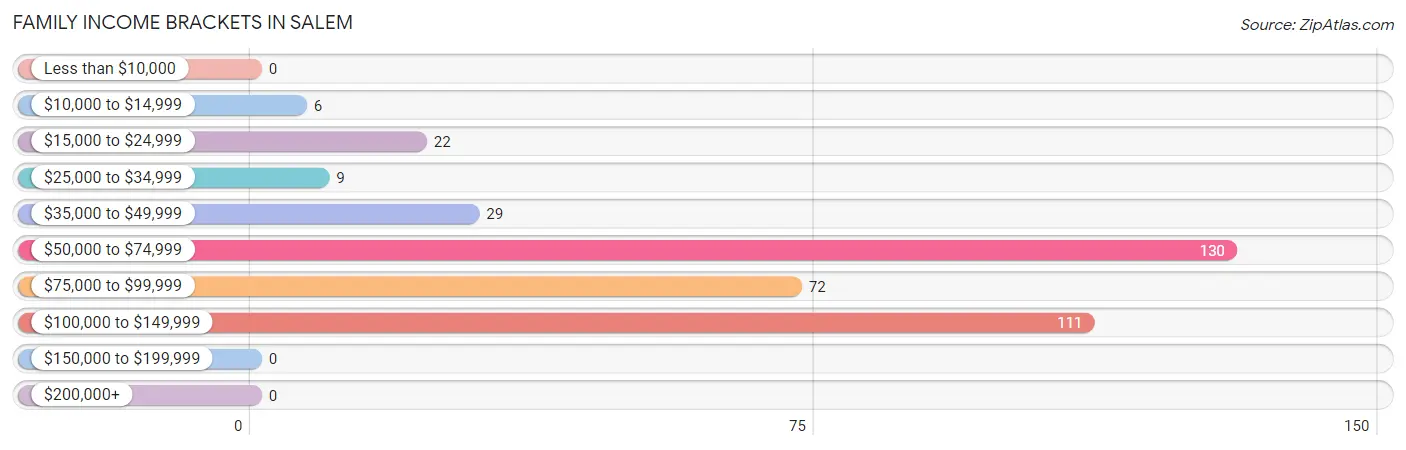
| Income Bracket | # Families | % Families |
| Less than $10,000 | 0 | 0.0% |
| $10,000 to $14,999 | 6 | 1.6% |
| $15,000 to $24,999 | 22 | 5.8% |
| $25,000 to $34,999 | 9 | 2.4% |
| $35,000 to $49,999 | 29 | 7.7% |
| $50,000 to $74,999 | 130 | 34.3% |
| $75,000 to $99,999 | 72 | 19.0% |
| $100,000 to $149,999 | 111 | 29.3% |
| $150,000 to $199,999 | 0 | 0.0% |
| $200,000+ | 0 | 0.0% |
Family Income by Famaliy Size in Salem
5-person families (22 | 5.8%) account for the highest median family income in Salem with $93,750 per family, while 2-person families (197 | 52.0%) have the highest median income of $33,282 per family member.
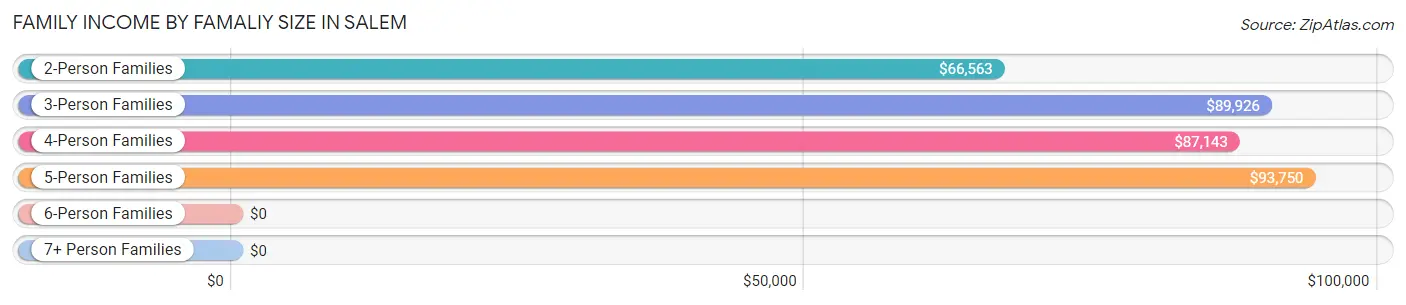
| Income Bracket | # Families | Median Income |
| 2-Person Families | 197 (52.0%) | $66,563 |
| 3-Person Families | 93 (24.5%) | $89,926 |
| 4-Person Families | 52 (13.7%) | $87,143 |
| 5-Person Families | 22 (5.8%) | $93,750 |
| 6-Person Families | 0 (0.0%) | $0 |
| 7+ Person Families | 15 (4.0%) | $0 |
| Total | 379 (100.0%) | $74,261 |
Family Income by Number of Earners in Salem
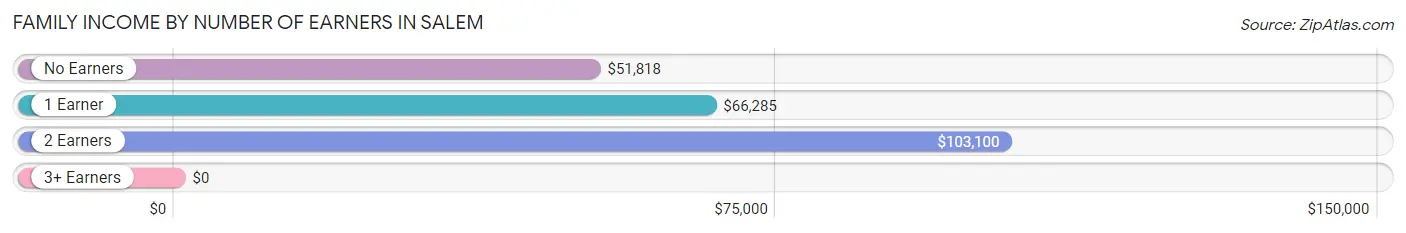
| Number of Earners | # Families | Median Income |
| No Earners | 64 (16.9%) | $51,818 |
| 1 Earner | 133 (35.1%) | $66,285 |
| 2 Earners | 166 (43.8%) | $103,100 |
| 3+ Earners | 16 (4.2%) | $0 |
| Total | 379 (100.0%) | $74,261 |
Household Income in Salem
Household Income Brackets in Salem
With 190 households falling in the category, the $50,000 to $74,999 income range is the most frequent in Salem, accounting for 26.4% of all households.
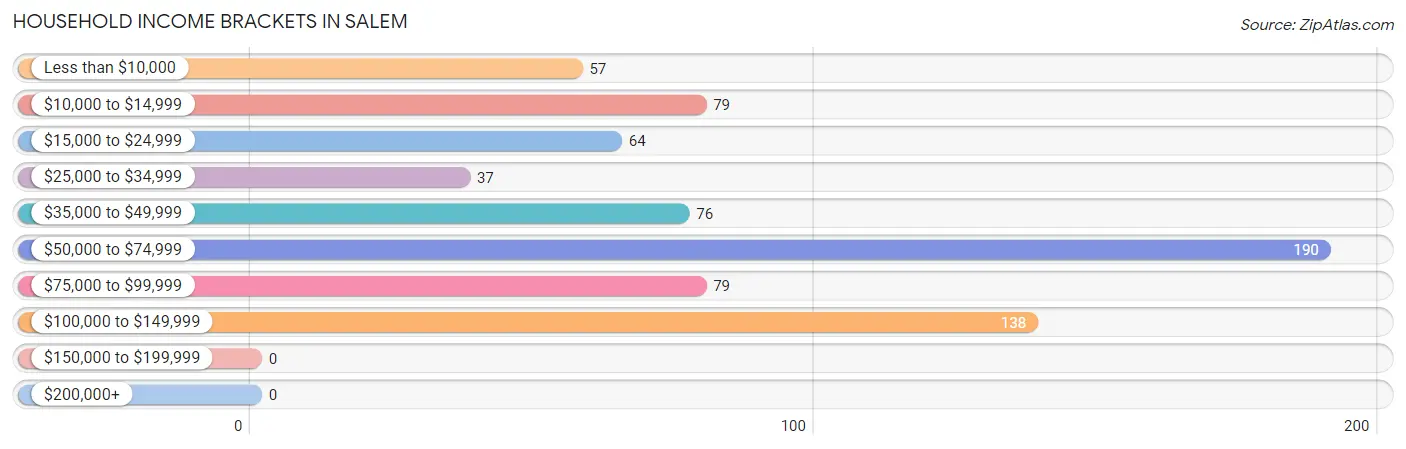
| Income Bracket | # Households | % Households |
| Less than $10,000 | 57 | 7.9% |
| $10,000 to $14,999 | 79 | 11.0% |
| $15,000 to $24,999 | 64 | 8.9% |
| $25,000 to $34,999 | 37 | 5.1% |
| $35,000 to $49,999 | 76 | 10.6% |
| $50,000 to $74,999 | 190 | 26.4% |
| $75,000 to $99,999 | 79 | 11.0% |
| $100,000 to $149,999 | 138 | 19.2% |
| $150,000 to $199,999 | 0 | 0.0% |
| $200,000+ | 0 | 0.0% |
Household Income by Householder Age in Salem
The median household income in Salem is $55,156, with the highest median household income of $68,587 found in the 45 to 64 years age bracket for the primary householder. A total of 186 households (25.8%) fall into this category.
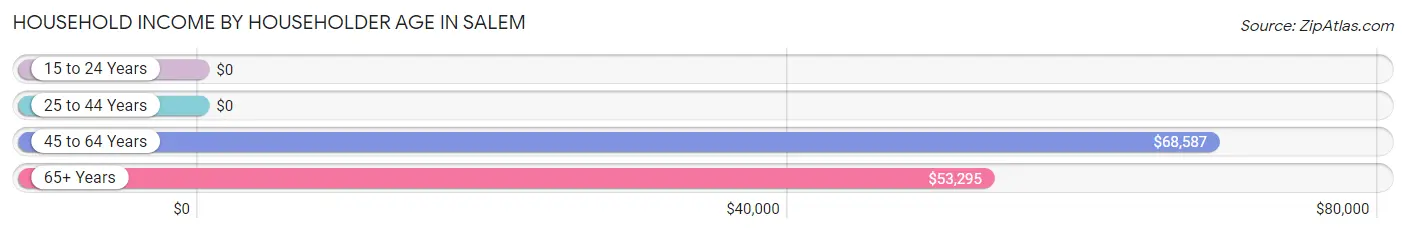
| Income Bracket | # Households | Median Income |
| 15 to 24 Years | 0 (0.0%) | $0 |
| 25 to 44 Years | 224 (31.1%) | $0 |
| 45 to 64 Years | 186 (25.8%) | $68,587 |
| 65+ Years | 310 (43.1%) | $53,295 |
| Total | 720 (100.0%) | $55,156 |
Poverty in Salem
Income Below Poverty by Sex and Age in Salem
With 21.1% poverty level for males and 18.9% for females among the residents of Salem, 6 to 11 year old males and 18 to 24 year old females are the most vulnerable to poverty, with 26 males (61.9%) and 20 females (45.5%) in their respective age groups living below the poverty level.
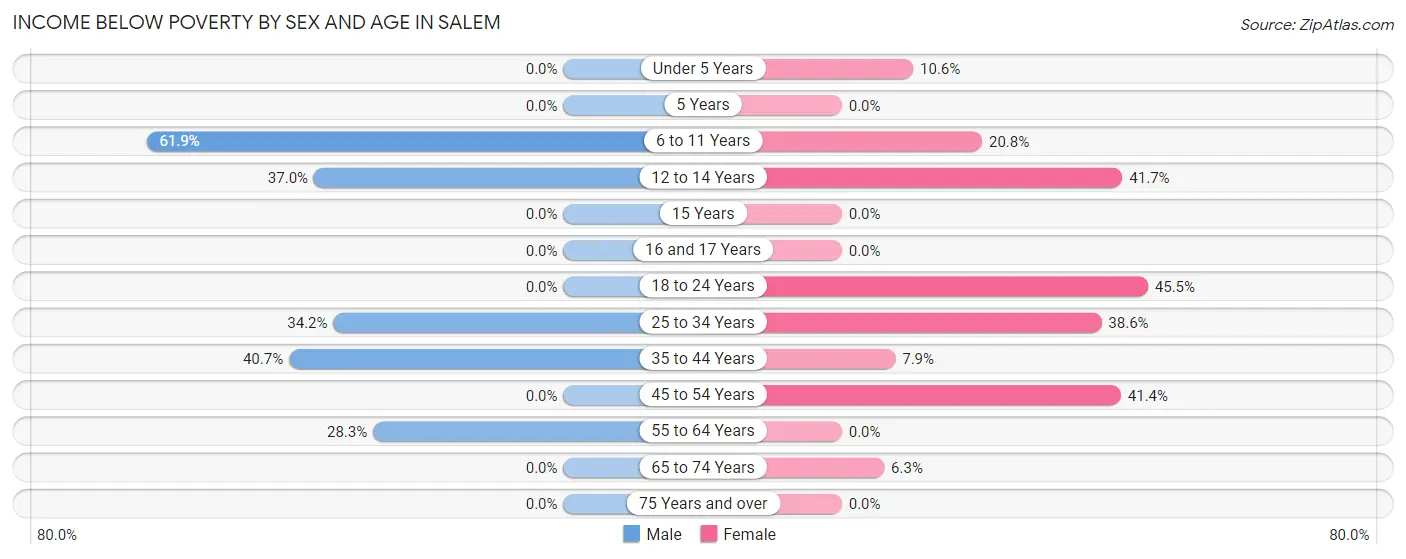
| Age Bracket | Male | Female |
| Under 5 Years | 0 (0.0%) | 9 (10.6%) |
| 5 Years | 0 (0.0%) | 0 (0.0%) |
| 6 to 11 Years | 26 (61.9%) | 5 (20.8%) |
| 12 to 14 Years | 10 (37.0%) | 5 (41.7%) |
| 15 Years | 0 (0.0%) | 0 (0.0%) |
| 16 and 17 Years | 0 (0.0%) | 0 (0.0%) |
| 18 to 24 Years | 0 (0.0%) | 20 (45.5%) |
| 25 to 34 Years | 28 (34.2%) | 69 (38.6%) |
| 35 to 44 Years | 66 (40.7%) | 5 (7.9%) |
| 45 to 54 Years | 0 (0.0%) | 46 (41.4%) |
| 55 to 64 Years | 26 (28.3%) | 0 (0.0%) |
| 65 to 74 Years | 0 (0.0%) | 10 (6.3%) |
| 75 Years and over | 0 (0.0%) | 0 (0.0%) |
| Total | 156 (21.1%) | 169 (18.9%) |
Income Above Poverty by Sex and Age in Salem
According to the poverty statistics in Salem, males aged under 5 years and females aged 15 years are the age groups that are most secure financially, with 100.0% of males and 100.0% of females in these age groups living above the poverty line.
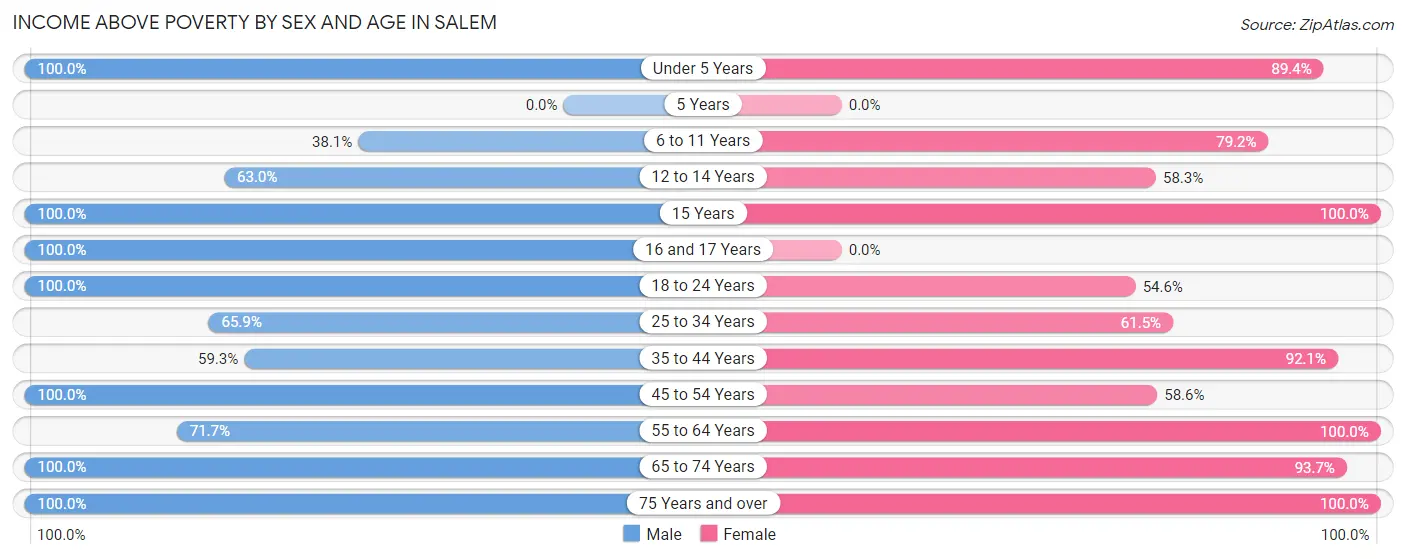
| Age Bracket | Male | Female |
| Under 5 Years | 35 (100.0%) | 76 (89.4%) |
| 5 Years | 0 (0.0%) | 0 (0.0%) |
| 6 to 11 Years | 16 (38.1%) | 19 (79.2%) |
| 12 to 14 Years | 17 (63.0%) | 7 (58.3%) |
| 15 Years | 13 (100.0%) | 43 (100.0%) |
| 16 and 17 Years | 7 (100.0%) | 0 (0.0%) |
| 18 to 24 Years | 41 (100.0%) | 24 (54.5%) |
| 25 to 34 Years | 54 (65.8%) | 110 (61.5%) |
| 35 to 44 Years | 96 (59.3%) | 58 (92.1%) |
| 45 to 54 Years | 50 (100.0%) | 65 (58.6%) |
| 55 to 64 Years | 66 (71.7%) | 51 (100.0%) |
| 65 to 74 Years | 103 (100.0%) | 149 (93.7%) |
| 75 Years and over | 86 (100.0%) | 123 (100.0%) |
| Total | 584 (78.9%) | 725 (81.1%) |
Income Below Poverty Among Married-Couple Families in Salem
The poverty statistics for married-couple families in Salem show that 7.2% or 21 of the total 290 families live below the poverty line. Families with 3 or 4 children have the highest poverty rate of 100.0%, comprising of 15 families. On the other hand, families with no children have the lowest poverty rate of 0.0%, which includes 0 families.
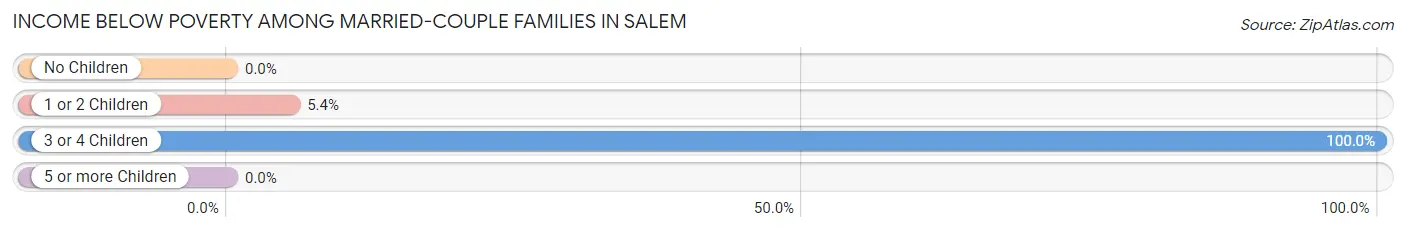
| Children | Above Poverty | Below Poverty |
| No Children | 164 (100.0%) | 0 (0.0%) |
| 1 or 2 Children | 105 (94.6%) | 6 (5.4%) |
| 3 or 4 Children | 0 (0.0%) | 15 (100.0%) |
| 5 or more Children | 0 (0.0%) | 0 (0.0%) |
| Total | 269 (92.8%) | 21 (7.2%) |
Income Below Poverty Among Single-Parent Households in Salem
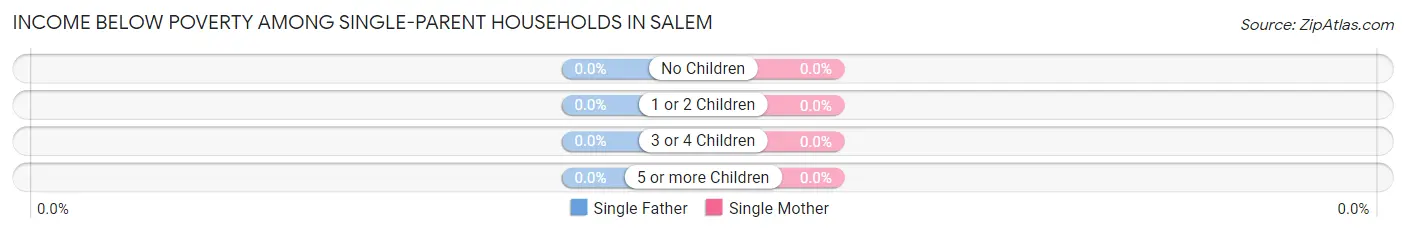
| Children | Single Father | Single Mother |
| No Children | 0 (0.0%) | 0 (0.0%) |
| 1 or 2 Children | 0 (0.0%) | 0 (0.0%) |
| 3 or 4 Children | 0 (0.0%) | 0 (0.0%) |
| 5 or more Children | 0 (0.0%) | 0 (0.0%) |
| Total | 0 (0.0%) | 0 (0.0%) |
Income Below Poverty Among Married-Couple vs Single-Parent Households in Salem
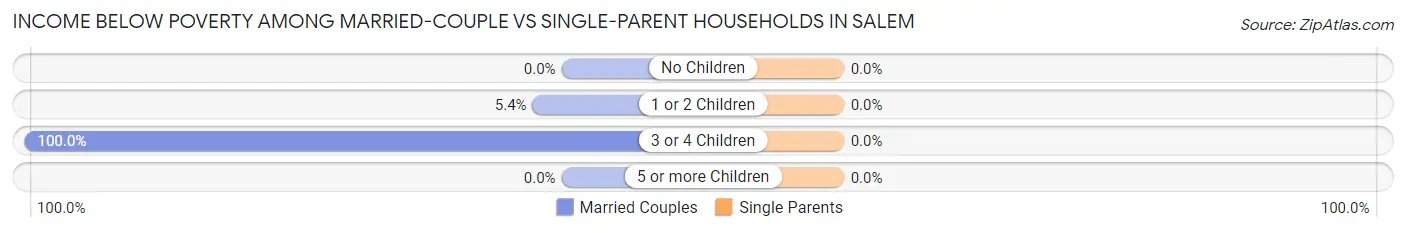
| Children | Married-Couple Families | Single-Parent Households |
| No Children | 0 (0.0%) | 0 (0.0%) |
| 1 or 2 Children | 6 (5.4%) | 0 (0.0%) |
| 3 or 4 Children | 15 (100.0%) | 0 (0.0%) |
| 5 or more Children | 0 (0.0%) | 0 (0.0%) |
| Total | 21 (7.2%) | 0 (0.0%) |
Employment Characteristics in Salem
Employment by Class of Employer in Salem
Among the 691 employed individuals in Salem, private company employees (416 | 60.2%), local government employees (98 | 14.2%), and state government employees (82 | 11.9%) make up the most common classes of employment.
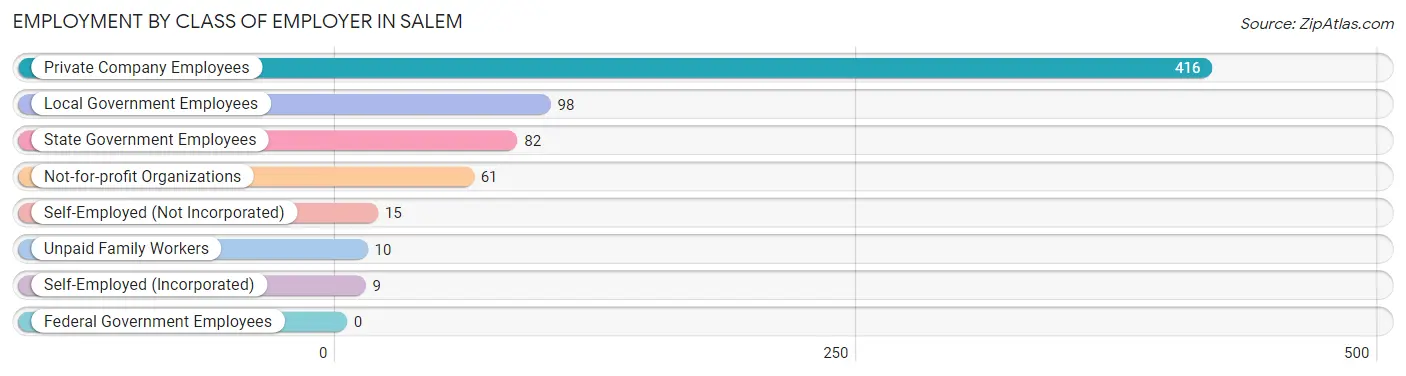
| Employer Class | # Employees | % Employees |
| Private Company Employees | 416 | 60.2% |
| Self-Employed (Incorporated) | 9 | 1.3% |
| Self-Employed (Not Incorporated) | 15 | 2.2% |
| Not-for-profit Organizations | 61 | 8.8% |
| Local Government Employees | 98 | 14.2% |
| State Government Employees | 82 | 11.9% |
| Federal Government Employees | 0 | 0.0% |
| Unpaid Family Workers | 10 | 1.5% |
| Total | 691 | 100.0% |
Employment Status by Age in Salem
According to the labor force statistics for Salem, out of the total population over 16 years of age (1,353), 57.0% or 771 individuals are in the labor force, with 5.8% or 45 of them unemployed. The age group with the highest labor force participation rate is 25 to 29 years, with 100.0% or 104 individuals in the labor force. Within the labor force, the 30 to 34 years age range has the highest percentage of unemployed individuals, with 42.4% or 36 of them being unemployed.
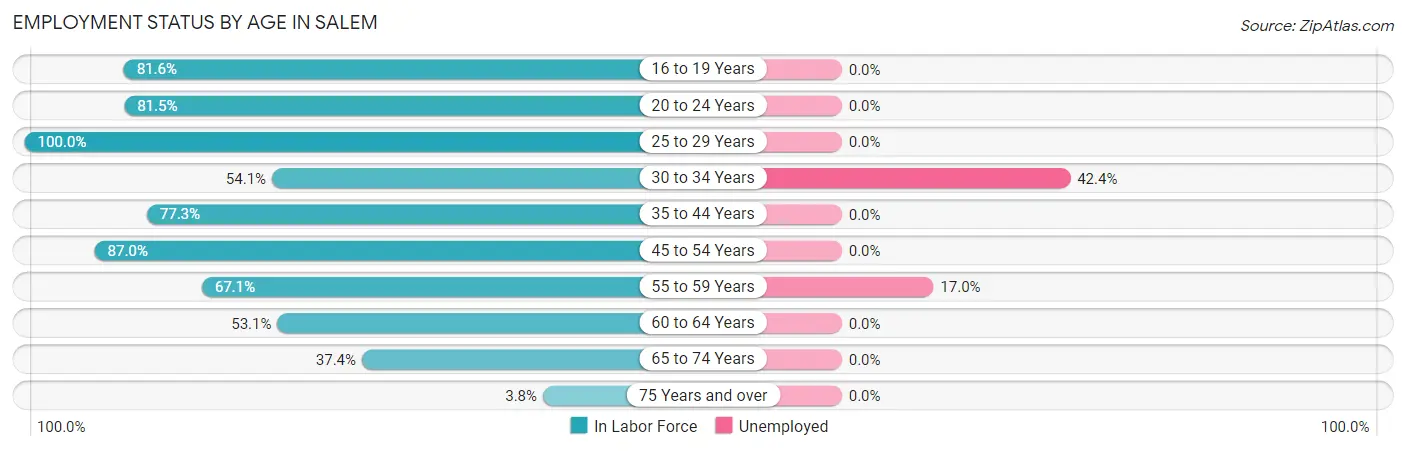
| Age Bracket | In Labor Force | Unemployed |
| 16 to 19 Years | 31 (81.6%) | 0 (0.0%) |
| 20 to 24 Years | 44 (81.5%) | 0 (0.0%) |
| 25 to 29 Years | 104 (100.0%) | 0 (0.0%) |
| 30 to 34 Years | 85 (54.1%) | 36 (42.4%) |
| 35 to 44 Years | 174 (77.3%) | 0 (0.0%) |
| 45 to 54 Years | 140 (87.0%) | 0 (0.0%) |
| 55 to 59 Years | 53 (67.1%) | 9 (17.0%) |
| 60 to 64 Years | 34 (53.1%) | 0 (0.0%) |
| 65 to 74 Years | 98 (37.4%) | 0 (0.0%) |
| 75 Years and over | 8 (3.8%) | 0 (0.0%) |
| Total | 771 (57.0%) | 45 (5.8%) |
Employment Status by Educational Attainment in Salem
According to labor force statistics for Salem, 74.7% of individuals (590) out of the total population between 25 and 64 years of age (790) are in the labor force, with 7.6% or 45 of them being unemployed. The group with the highest labor force participation rate are those with the educational attainment of high school diploma, with 93.0% or 147 individuals in the labor force. Within the labor force, individuals with less than high school education have the highest percentage of unemployment, with 63.2% or 36 of them being unemployed.
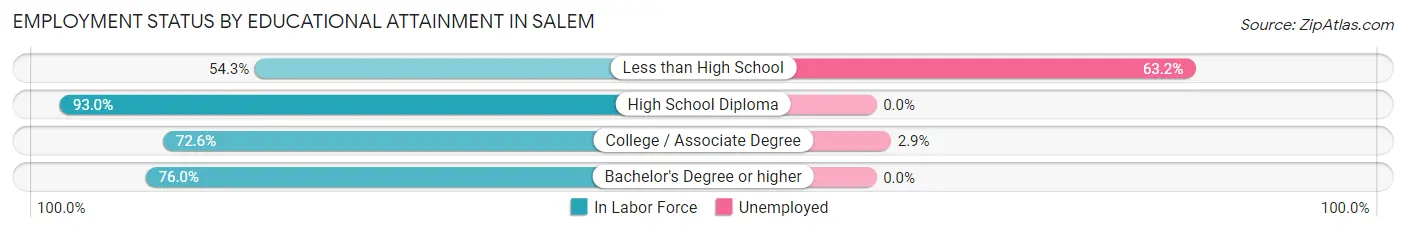
| Educational Attainment | In Labor Force | Unemployed |
| Less than High School | 57 (54.3%) | 66 (63.2%) |
| High School Diploma | 147 (93.0%) | 0 (0.0%) |
| College / Associate Degree | 307 (72.6%) | 12 (2.9%) |
| Bachelor's Degree or higher | 79 (76.0%) | 0 (0.0%) |
| Total | 590 (74.7%) | 60 (7.6%) |
Employment Occupations by Sex in Salem
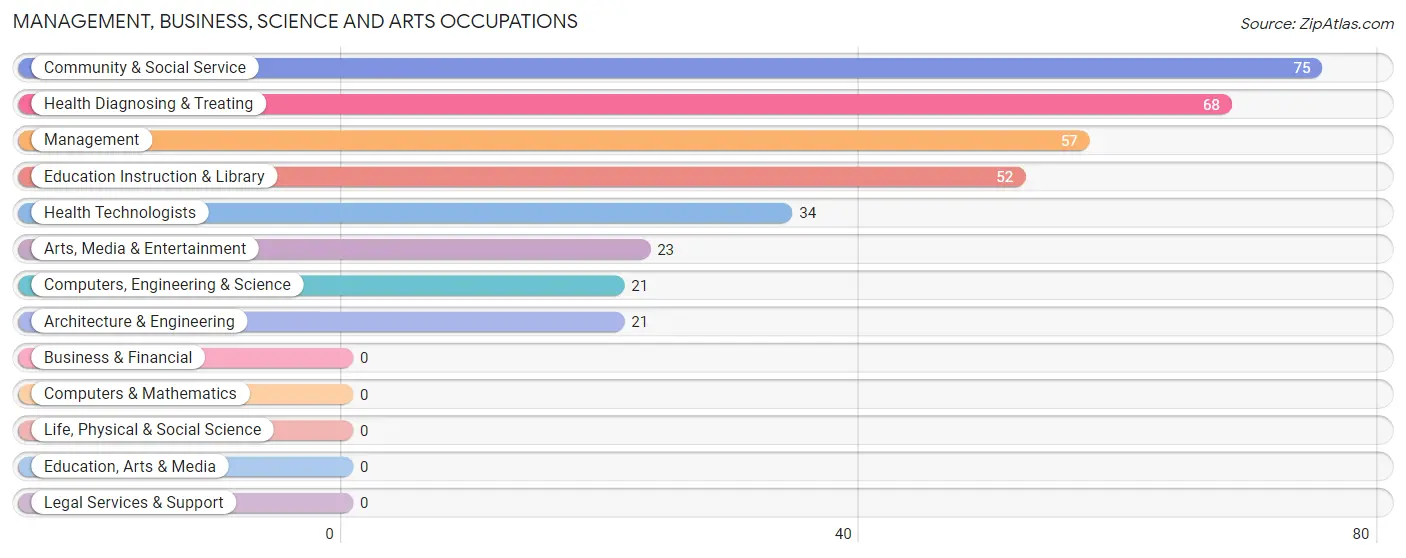
Management, Business, Science and Arts Occupations
The most common Management, Business, Science and Arts occupations in Salem are Community & Social Service (75 | 10.3%), Health Diagnosing & Treating (68 | 9.4%), Management (57 | 7.9%), Education Instruction & Library (52 | 7.2%), and Health Technologists (34 | 4.7%).
Management, Business, Science and Arts Occupations by Sex
Within the Management, Business, Science and Arts occupations in Salem, the most male-oriented occupations are Management (56.1%), Computers, Engineering & Science (47.6%), and Architecture & Engineering (47.6%), while the most female-oriented occupations are Community & Social Service (100.0%), Education Instruction & Library (100.0%), and Arts, Media & Entertainment (100.0%).
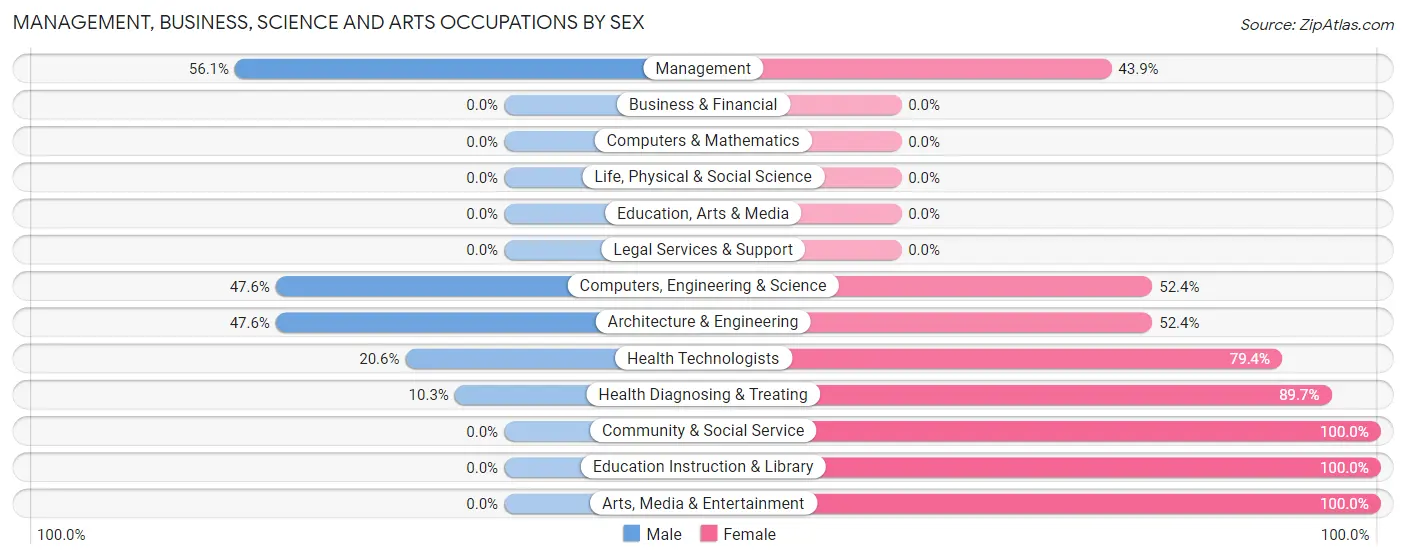
| Occupation | Male | Female |
| Management | 32 (56.1%) | 25 (43.9%) |
| Business & Financial | 0 (0.0%) | 0 (0.0%) |
| Computers, Engineering & Science | 10 (47.6%) | 11 (52.4%) |
| Computers & Mathematics | 0 (0.0%) | 0 (0.0%) |
| Architecture & Engineering | 10 (47.6%) | 11 (52.4%) |
| Life, Physical & Social Science | 0 (0.0%) | 0 (0.0%) |
| Community & Social Service | 0 (0.0%) | 75 (100.0%) |
| Education, Arts & Media | 0 (0.0%) | 0 (0.0%) |
| Legal Services & Support | 0 (0.0%) | 0 (0.0%) |
| Education Instruction & Library | 0 (0.0%) | 52 (100.0%) |
| Arts, Media & Entertainment | 0 (0.0%) | 23 (100.0%) |
| Health Diagnosing & Treating | 7 (10.3%) | 61 (89.7%) |
| Health Technologists | 7 (20.6%) | 27 (79.4%) |
| Total (Category) | 49 (22.2%) | 172 (77.8%) |
| Total (Overall) | 319 (43.9%) | 407 (56.1%) |
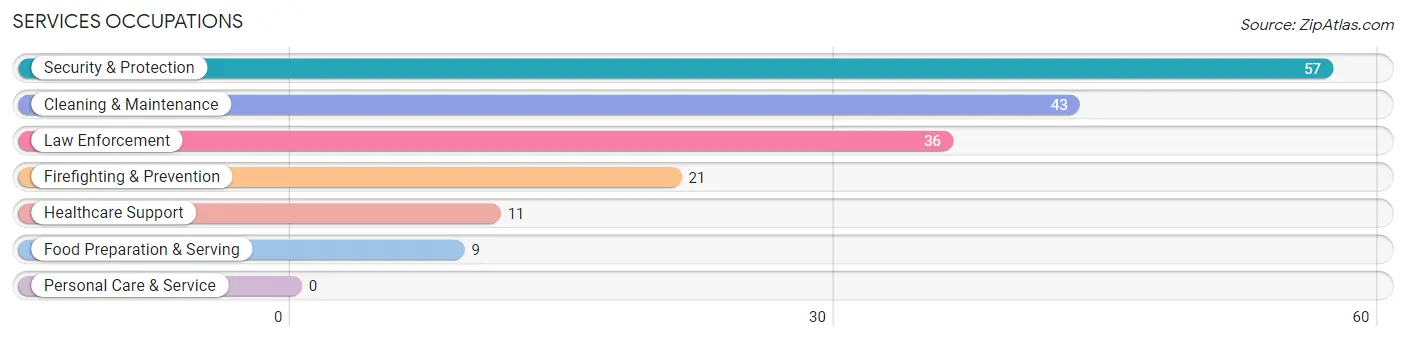
Services Occupations
The most common Services occupations in Salem are Security & Protection (57 | 7.9%), Cleaning & Maintenance (43 | 5.9%), Law Enforcement (36 | 5.0%), Firefighting & Prevention (21 | 2.9%), and Healthcare Support (11 | 1.5%).
Services Occupations by Sex
Within the Services occupations in Salem, the most male-oriented occupations are Law Enforcement (100.0%), Cleaning & Maintenance (100.0%), and Security & Protection (78.9%), while the most female-oriented occupations are Healthcare Support (100.0%), Food Preparation & Serving (100.0%), and Firefighting & Prevention (57.1%).
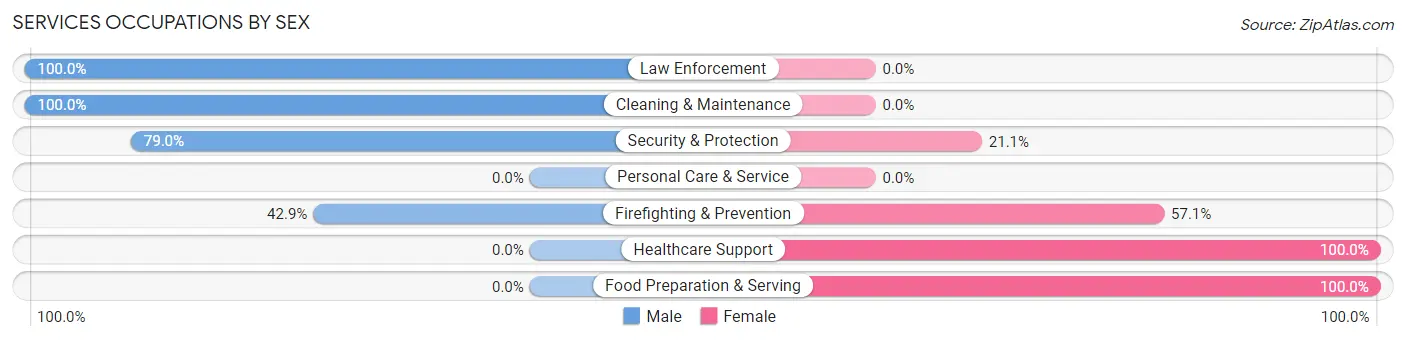
| Occupation | Male | Female |
| Healthcare Support | 0 (0.0%) | 11 (100.0%) |
| Security & Protection | 45 (78.9%) | 12 (21.0%) |
| Firefighting & Prevention | 9 (42.9%) | 12 (57.1%) |
| Law Enforcement | 36 (100.0%) | 0 (0.0%) |
| Food Preparation & Serving | 0 (0.0%) | 9 (100.0%) |
| Cleaning & Maintenance | 43 (100.0%) | 0 (0.0%) |
| Personal Care & Service | 0 (0.0%) | 0 (0.0%) |
| Total (Category) | 88 (73.3%) | 32 (26.7%) |
| Total (Overall) | 319 (43.9%) | 407 (56.1%) |
Sales and Office Occupations
The most common Sales and Office occupations in Salem are Office & Administration (122 | 16.8%), and Sales & Related (80 | 11.0%).
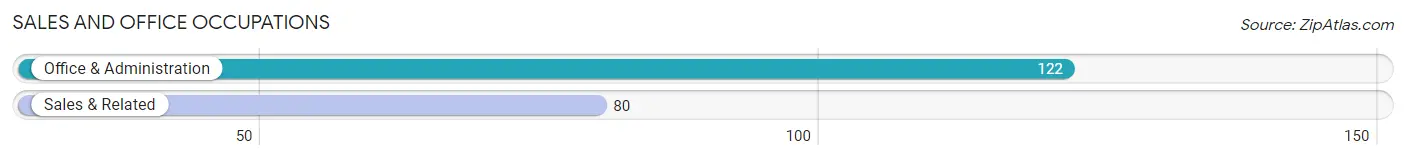
Sales and Office Occupations by Sex
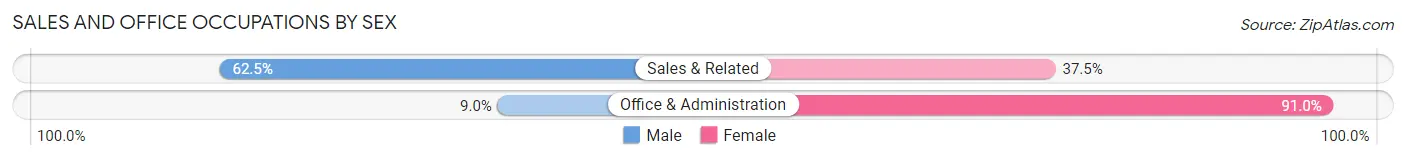
| Occupation | Male | Female |
| Sales & Related | 50 (62.5%) | 30 (37.5%) |
| Office & Administration | 11 (9.0%) | 111 (91.0%) |
| Total (Category) | 61 (30.2%) | 141 (69.8%) |
| Total (Overall) | 319 (43.9%) | 407 (56.1%) |
Natural Resources, Construction and Maintenance Occupations
The most common Natural Resources, Construction and Maintenance occupations in Salem are Construction & Extraction (21 | 2.9%), and Installation, Maintenance & Repair (8 | 1.1%).
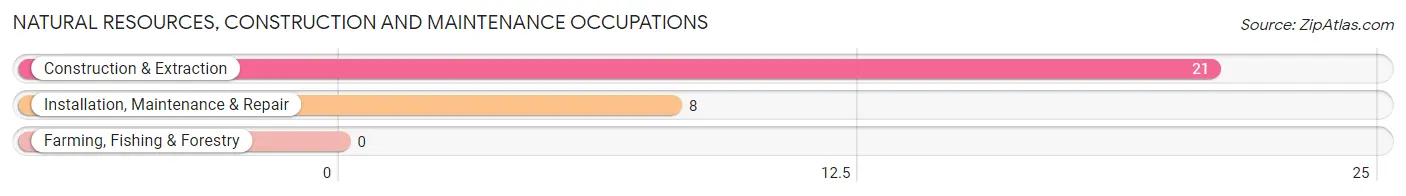
Natural Resources, Construction and Maintenance Occupations by Sex
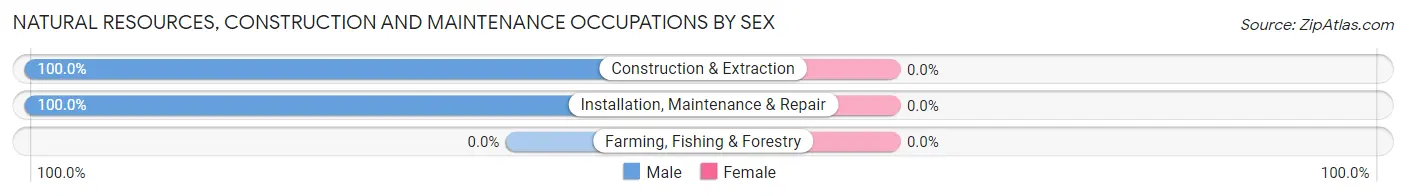
| Occupation | Male | Female |
| Farming, Fishing & Forestry | 0 (0.0%) | 0 (0.0%) |
| Construction & Extraction | 21 (100.0%) | 0 (0.0%) |
| Installation, Maintenance & Repair | 8 (100.0%) | 0 (0.0%) |
| Total (Category) | 29 (100.0%) | 0 (0.0%) |
| Total (Overall) | 319 (43.9%) | 407 (56.1%) |
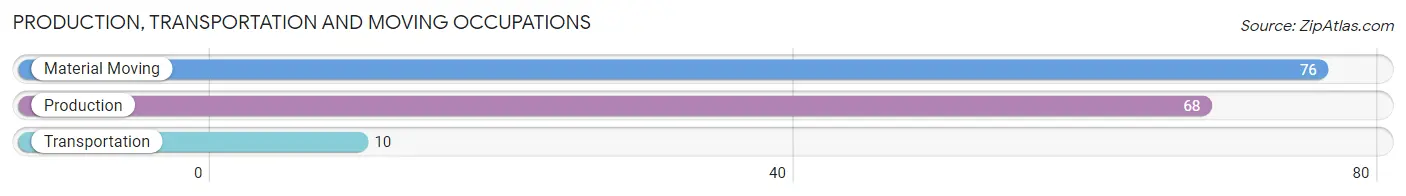
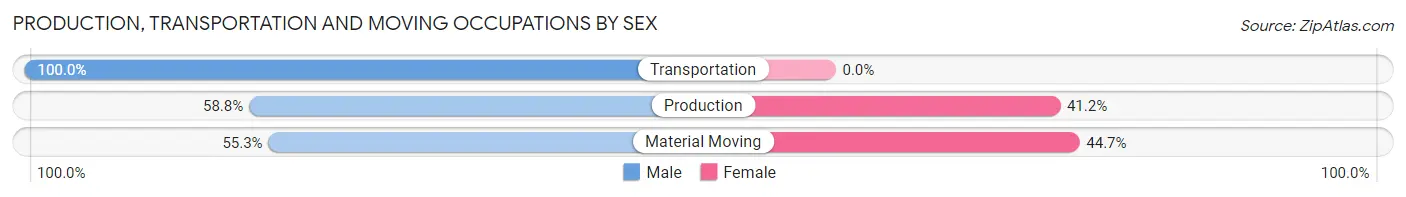
Production, Transportation and Moving Occupations
The most common Production, Transportation and Moving occupations in Salem are Material Moving (76 | 10.5%), Production (68 | 9.4%), and Transportation (10 | 1.4%).
Production, Transportation and Moving Occupations by Sex
| Occupation | Male | Female |
| Production | 40 (58.8%) | 28 (41.2%) |
| Transportation | 10 (100.0%) | 0 (0.0%) |
| Material Moving | 42 (55.3%) | 34 (44.7%) |
| Total (Category) | 92 (59.7%) | 62 (40.3%) |
| Total (Overall) | 319 (43.9%) | 407 (56.1%) |
Employment Industries by Sex in Salem
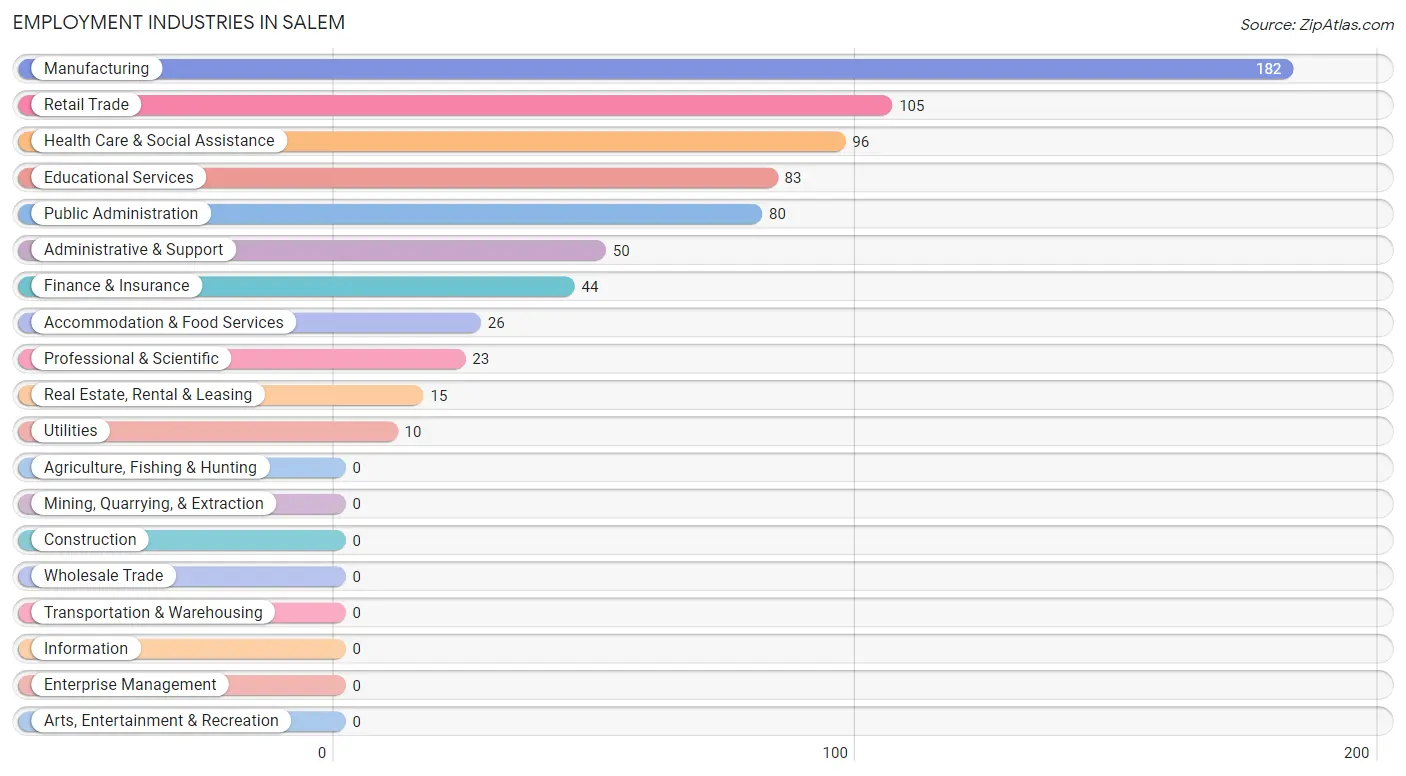
Employment Industries in Salem
The major employment industries in Salem include Manufacturing (182 | 25.1%), Retail Trade (105 | 14.5%), Health Care & Social Assistance (96 | 13.2%), Educational Services (83 | 11.4%), and Public Administration (80 | 11.0%).
Employment Industries by Sex in Salem
The Salem industries that see more men than women are Utilities (100.0%), Real Estate, Rental & Leasing (100.0%), and Manufacturing (75.3%), whereas the industries that tend to have a higher number of women are Finance & Insurance (100.0%), Professional & Scientific (100.0%), and Health Care & Social Assistance (92.7%).
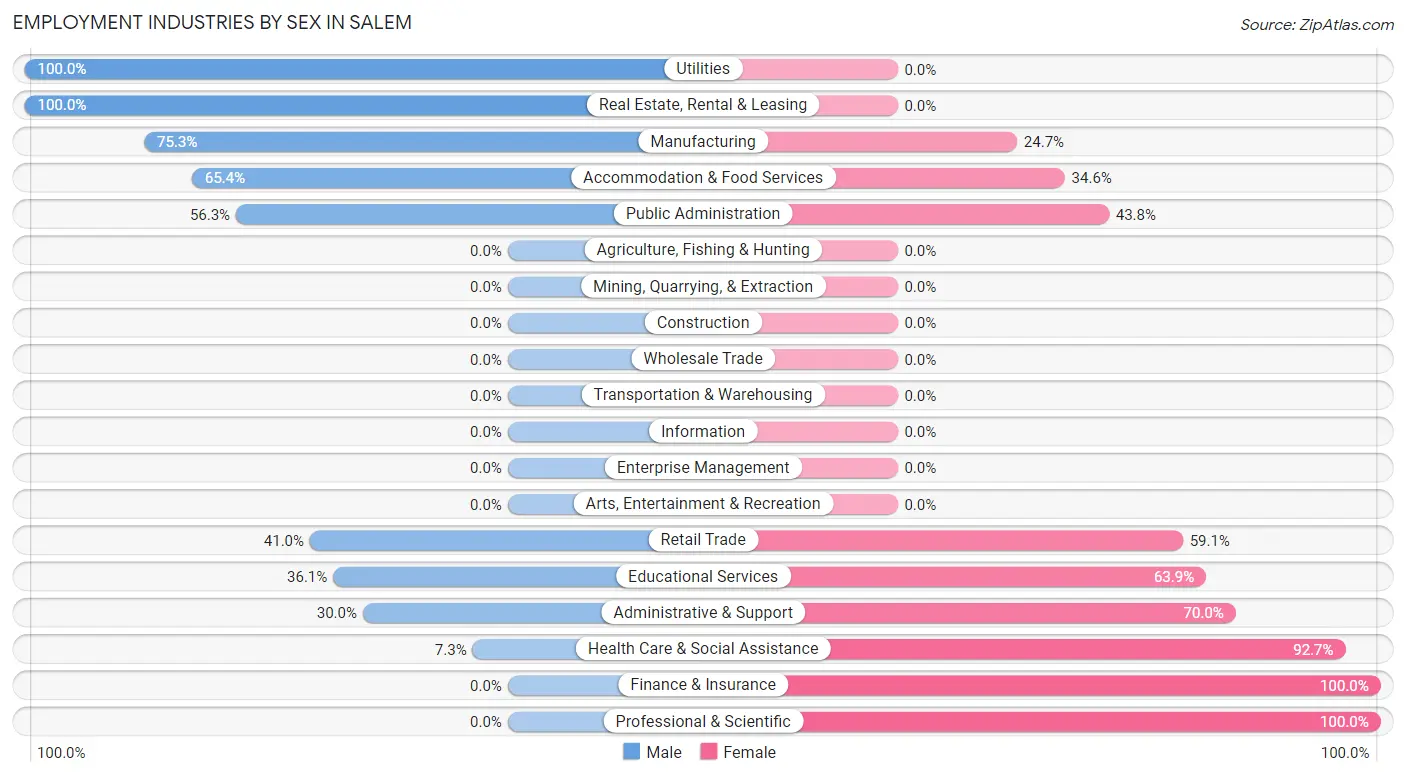
| Industry | Male | Female |
| Agriculture, Fishing & Hunting | 0 (0.0%) | 0 (0.0%) |
| Mining, Quarrying, & Extraction | 0 (0.0%) | 0 (0.0%) |
| Construction | 0 (0.0%) | 0 (0.0%) |
| Manufacturing | 137 (75.3%) | 45 (24.7%) |
| Wholesale Trade | 0 (0.0%) | 0 (0.0%) |
| Retail Trade | 43 (40.9%) | 62 (59.1%) |
| Transportation & Warehousing | 0 (0.0%) | 0 (0.0%) |
| Utilities | 10 (100.0%) | 0 (0.0%) |
| Information | 0 (0.0%) | 0 (0.0%) |
| Finance & Insurance | 0 (0.0%) | 44 (100.0%) |
| Real Estate, Rental & Leasing | 15 (100.0%) | 0 (0.0%) |
| Professional & Scientific | 0 (0.0%) | 23 (100.0%) |
| Enterprise Management | 0 (0.0%) | 0 (0.0%) |
| Administrative & Support | 15 (30.0%) | 35 (70.0%) |
| Educational Services | 30 (36.1%) | 53 (63.9%) |
| Health Care & Social Assistance | 7 (7.3%) | 89 (92.7%) |
| Arts, Entertainment & Recreation | 0 (0.0%) | 0 (0.0%) |
| Accommodation & Food Services | 17 (65.4%) | 9 (34.6%) |
| Public Administration | 45 (56.2%) | 35 (43.8%) |
| Total | 319 (43.9%) | 407 (56.1%) |
Education in Salem
School Enrollment in Salem
The most common levels of schooling among the 331 students in Salem are high school (79 | 23.9%), college / undergraduate (59 | 17.8%), and middle school (57 | 17.2%).
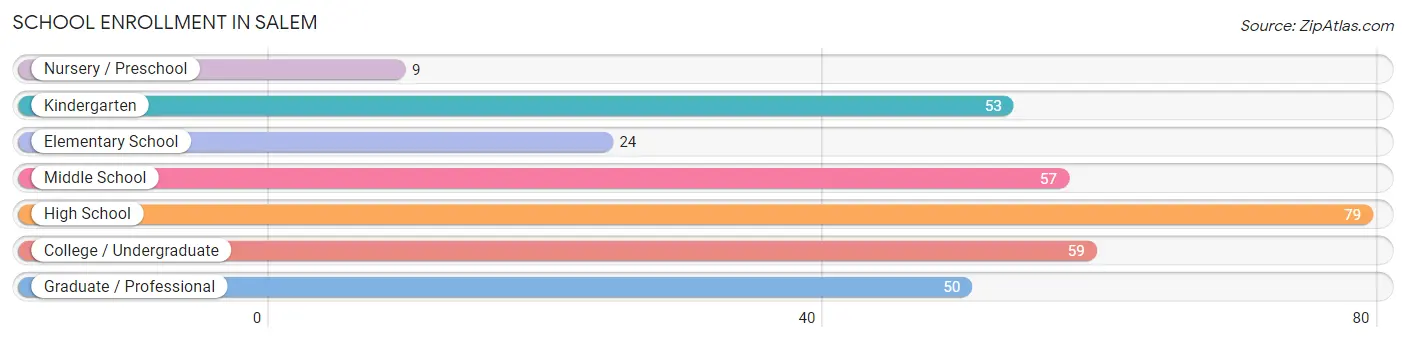
| School Level | # Students | % Students |
| Nursery / Preschool | 9 | 2.7% |
| Kindergarten | 53 | 16.0% |
| Elementary School | 24 | 7.2% |
| Middle School | 57 | 17.2% |
| High School | 79 | 23.9% |
| College / Undergraduate | 59 | 17.8% |
| Graduate / Professional | 50 | 15.1% |
| Total | 331 | 100.0% |
School Enrollment by Age by Funding Source in Salem
Out of a total of 331 students who are enrolled in schools in Salem, 34 (10.3%) attend a private institution, while the remaining 297 (89.7%) are enrolled in public schools. The age group of 20 to 24 year olds has the highest likelihood of being enrolled in private schools, with 10 (50.0% in the age bracket) enrolled. Conversely, the age group of 3 to 4 year olds has the lowest likelihood of being enrolled in a private school, with 40 (100.0% in the age bracket) attending a public institution.
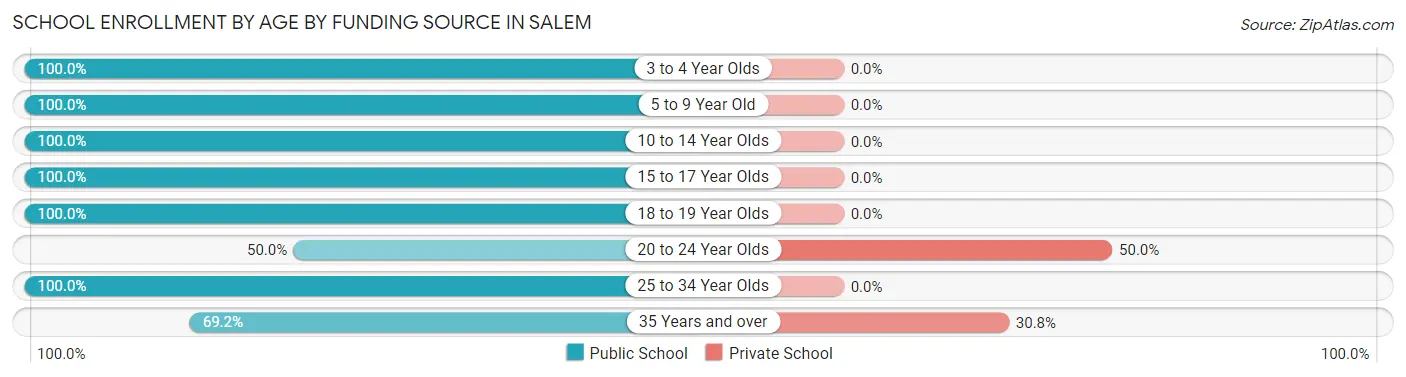
| Age Bracket | Public School | Private School |
| 3 to 4 Year Olds | 40 (100.0%) | 0 (0.0%) |
| 5 to 9 Year Old | 34 (100.0%) | 0 (0.0%) |
| 10 to 14 Year Olds | 63 (100.0%) | 0 (0.0%) |
| 15 to 17 Year Olds | 63 (100.0%) | 0 (0.0%) |
| 18 to 19 Year Olds | 21 (100.0%) | 0 (0.0%) |
| 20 to 24 Year Olds | 10 (50.0%) | 10 (50.0%) |
| 25 to 34 Year Olds | 12 (100.0%) | 0 (0.0%) |
| 35 Years and over | 54 (69.2%) | 24 (30.8%) |
| Total | 297 (89.7%) | 34 (10.3%) |
Educational Attainment by Field of Study in Salem
Education (60 | 31.1%), bio, nature & agricultural (26 | 13.5%), visual & performing arts (25 | 13.0%), computers & mathematics (22 | 11.4%), and science & technology (19 | 9.8%) are the most common fields of study among 193 individuals in Salem who have obtained a bachelor's degree or higher.
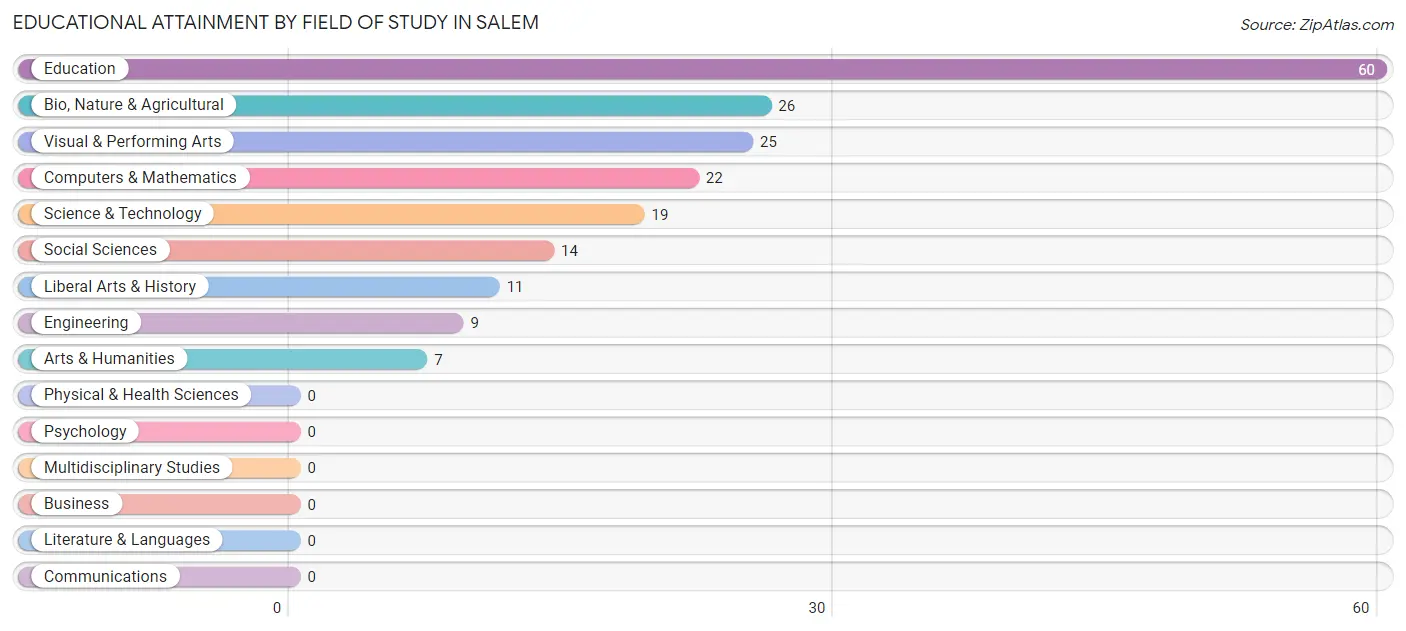
| Field of Study | # Graduates | % Graduates |
| Computers & Mathematics | 22 | 11.4% |
| Bio, Nature & Agricultural | 26 | 13.5% |
| Physical & Health Sciences | 0 | 0.0% |
| Psychology | 0 | 0.0% |
| Social Sciences | 14 | 7.2% |
| Engineering | 9 | 4.7% |
| Multidisciplinary Studies | 0 | 0.0% |
| Science & Technology | 19 | 9.8% |
| Business | 0 | 0.0% |
| Education | 60 | 31.1% |
| Literature & Languages | 0 | 0.0% |
| Liberal Arts & History | 11 | 5.7% |
| Visual & Performing Arts | 25 | 13.0% |
| Communications | 0 | 0.0% |
| Arts & Humanities | 7 | 3.6% |
| Total | 193 | 100.0% |
Transportation & Commute in Salem
Vehicle Availability by Sex in Salem
The most prevalent vehicle ownership categories in Salem are males with 2 vehicles (117, accounting for 36.7%) and females with 2 vehicles (109, making up 31.5%).
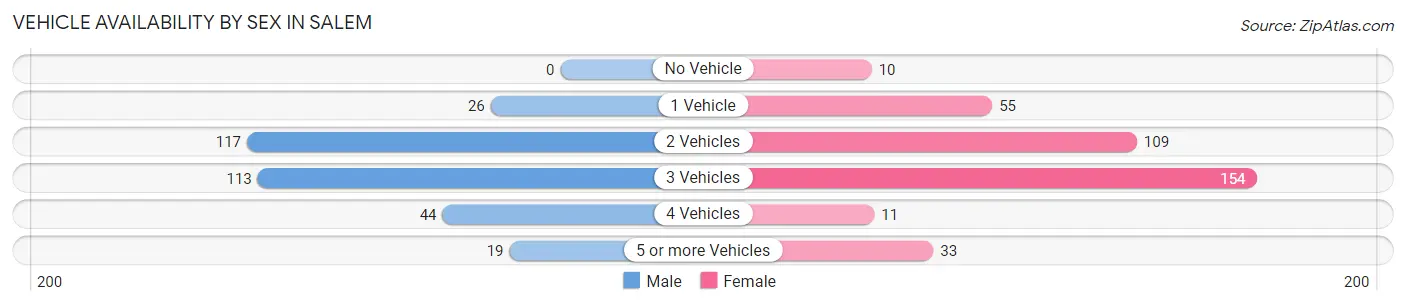
| Vehicles Available | Male | Female |
| No Vehicle | 0 (0.0%) | 10 (2.7%) |
| 1 Vehicle | 26 (8.2%) | 55 (14.8%) |
| 2 Vehicles | 117 (36.7%) | 109 (29.3%) |
| 3 Vehicles | 113 (35.4%) | 154 (41.4%) |
| 4 Vehicles | 44 (13.8%) | 11 (3.0%) |
| 5 or more Vehicles | 19 (6.0%) | 33 (8.9%) |
| Total | 319 (100.0%) | 372 (100.0%) |
Commute Time in Salem
The most frequently occuring commute durations in Salem are 10 to 14 minutes (199 commuters, 29.3%), 15 to 19 minutes (153 commuters, 22.5%), and 5 to 9 minutes (87 commuters, 12.8%).
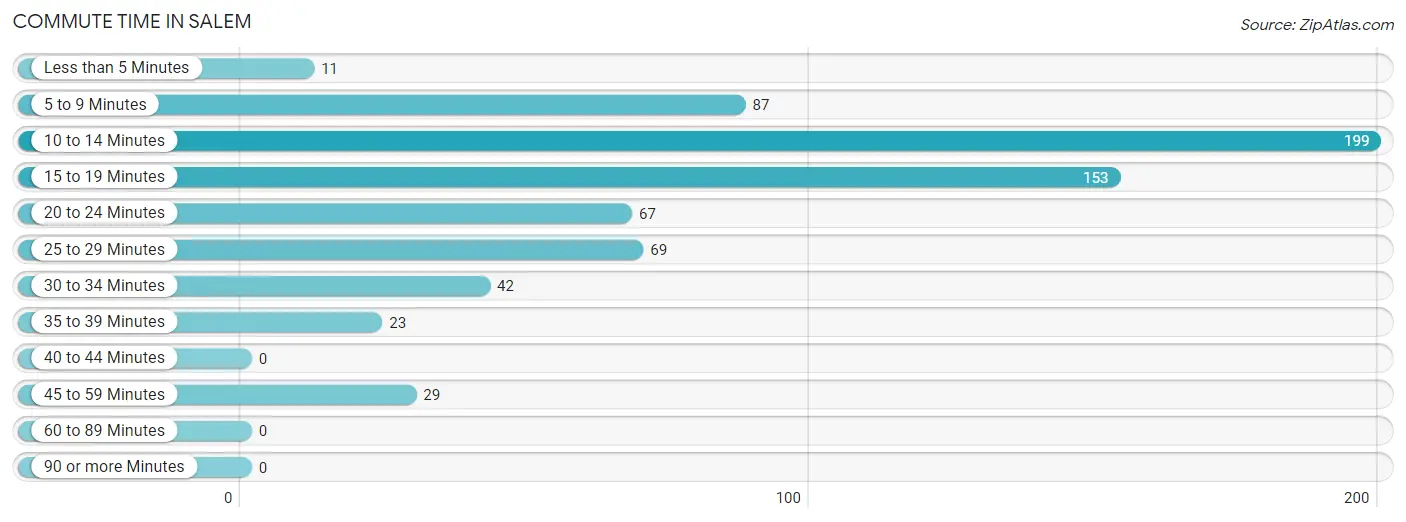
| Commute Time | # Commuters | % Commuters |
| Less than 5 Minutes | 11 | 1.6% |
| 5 to 9 Minutes | 87 | 12.8% |
| 10 to 14 Minutes | 199 | 29.3% |
| 15 to 19 Minutes | 153 | 22.5% |
| 20 to 24 Minutes | 67 | 9.9% |
| 25 to 29 Minutes | 69 | 10.2% |
| 30 to 34 Minutes | 42 | 6.2% |
| 35 to 39 Minutes | 23 | 3.4% |
| 40 to 44 Minutes | 0 | 0.0% |
| 45 to 59 Minutes | 29 | 4.3% |
| 60 to 89 Minutes | 0 | 0.0% |
| 90 or more Minutes | 0 | 0.0% |
Commute Time by Sex in Salem
The most common commute times in Salem are 15 to 19 minutes (94 commuters, 29.5%) for males and 10 to 14 minutes (107 commuters, 29.6%) for females.
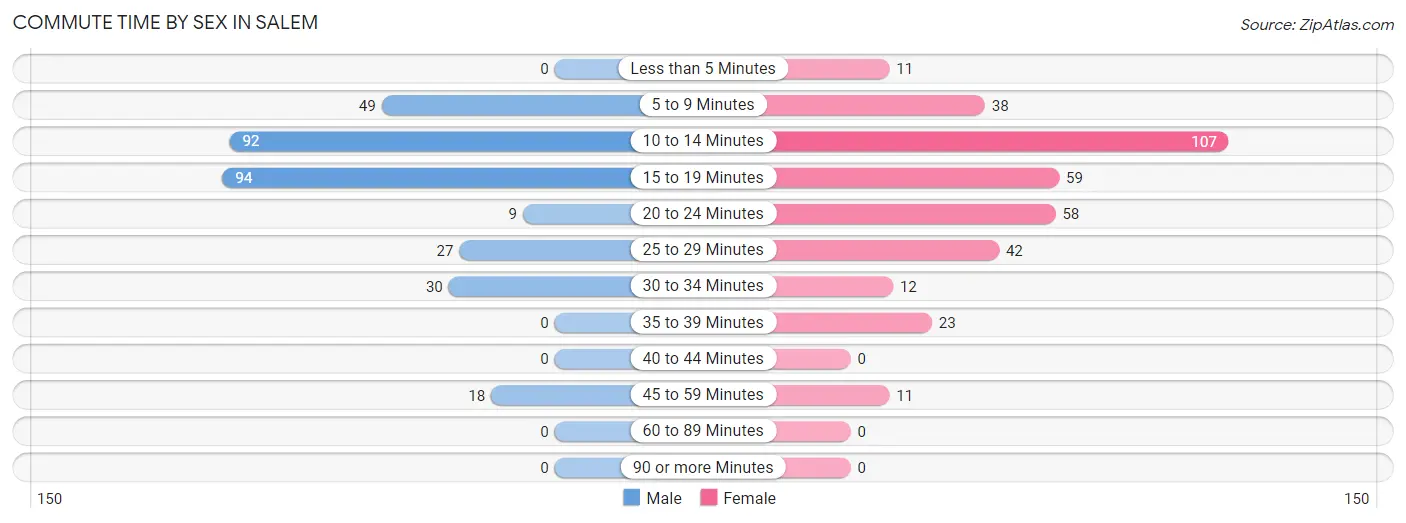
| Commute Time | Male | Female |
| Less than 5 Minutes | 0 (0.0%) | 11 (3.0%) |
| 5 to 9 Minutes | 49 (15.4%) | 38 (10.5%) |
| 10 to 14 Minutes | 92 (28.8%) | 107 (29.6%) |
| 15 to 19 Minutes | 94 (29.5%) | 59 (16.3%) |
| 20 to 24 Minutes | 9 (2.8%) | 58 (16.1%) |
| 25 to 29 Minutes | 27 (8.5%) | 42 (11.6%) |
| 30 to 34 Minutes | 30 (9.4%) | 12 (3.3%) |
| 35 to 39 Minutes | 0 (0.0%) | 23 (6.4%) |
| 40 to 44 Minutes | 0 (0.0%) | 0 (0.0%) |
| 45 to 59 Minutes | 18 (5.6%) | 11 (3.0%) |
| 60 to 89 Minutes | 0 (0.0%) | 0 (0.0%) |
| 90 or more Minutes | 0 (0.0%) | 0 (0.0%) |
Time of Departure to Work by Sex in Salem
The most frequent times of departure to work in Salem are 7:00 AM to 7:29 AM (76, 23.8%) for males and 7:30 AM to 7:59 AM (96, 26.6%) for females.
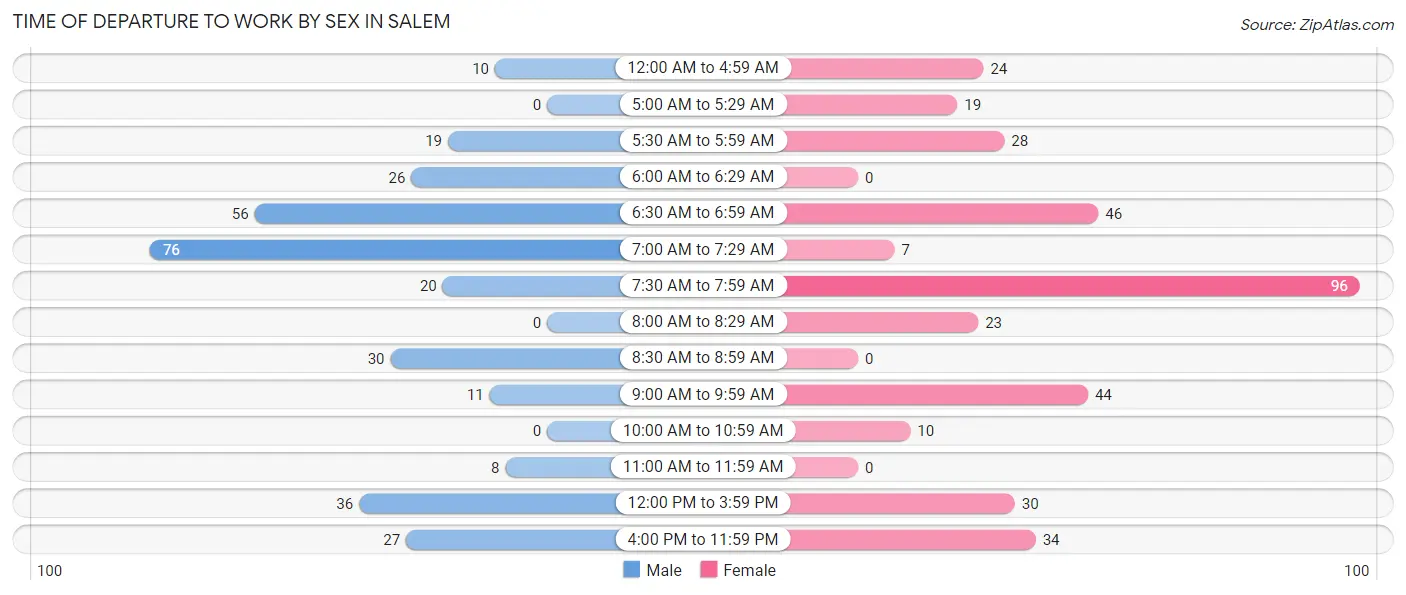
| Time of Departure | Male | Female |
| 12:00 AM to 4:59 AM | 10 (3.1%) | 24 (6.7%) |
| 5:00 AM to 5:29 AM | 0 (0.0%) | 19 (5.3%) |
| 5:30 AM to 5:59 AM | 19 (6.0%) | 28 (7.8%) |
| 6:00 AM to 6:29 AM | 26 (8.2%) | 0 (0.0%) |
| 6:30 AM to 6:59 AM | 56 (17.5%) | 46 (12.7%) |
| 7:00 AM to 7:29 AM | 76 (23.8%) | 7 (1.9%) |
| 7:30 AM to 7:59 AM | 20 (6.3%) | 96 (26.6%) |
| 8:00 AM to 8:29 AM | 0 (0.0%) | 23 (6.4%) |
| 8:30 AM to 8:59 AM | 30 (9.4%) | 0 (0.0%) |
| 9:00 AM to 9:59 AM | 11 (3.5%) | 44 (12.2%) |
| 10:00 AM to 10:59 AM | 0 (0.0%) | 10 (2.8%) |
| 11:00 AM to 11:59 AM | 8 (2.5%) | 0 (0.0%) |
| 12:00 PM to 3:59 PM | 36 (11.3%) | 30 (8.3%) |
| 4:00 PM to 11:59 PM | 27 (8.5%) | 34 (9.4%) |
| Total | 319 (100.0%) | 361 (100.0%) |
Housing Occupancy in Salem
Occupancy by Ownership in Salem
Of the total 720 dwellings in Salem, owner-occupied units account for 555 (77.1%), while renter-occupied units make up 165 (22.9%).
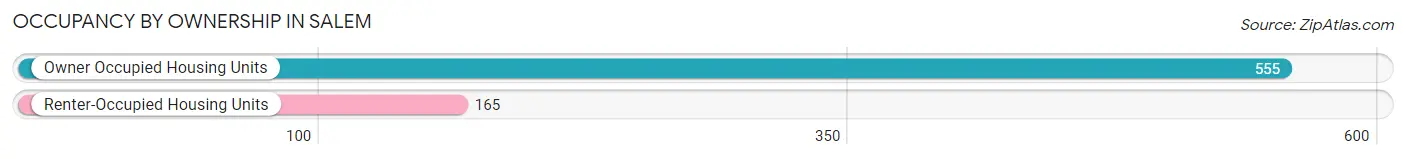
| Occupancy | # Housing Units | % Housing Units |
| Owner Occupied Housing Units | 555 | 77.1% |
| Renter-Occupied Housing Units | 165 | 22.9% |
| Total Occupied Housing Units | 720 | 100.0% |
Occupancy by Household Size in Salem
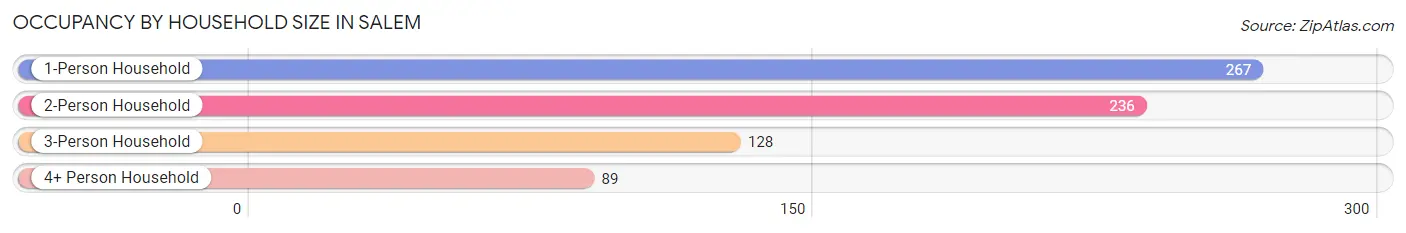
| Household Size | # Housing Units | % Housing Units |
| 1-Person Household | 267 | 37.1% |
| 2-Person Household | 236 | 32.8% |
| 3-Person Household | 128 | 17.8% |
| 4+ Person Household | 89 | 12.4% |
| Total Housing Units | 720 | 100.0% |
Occupancy by Ownership by Household Size in Salem
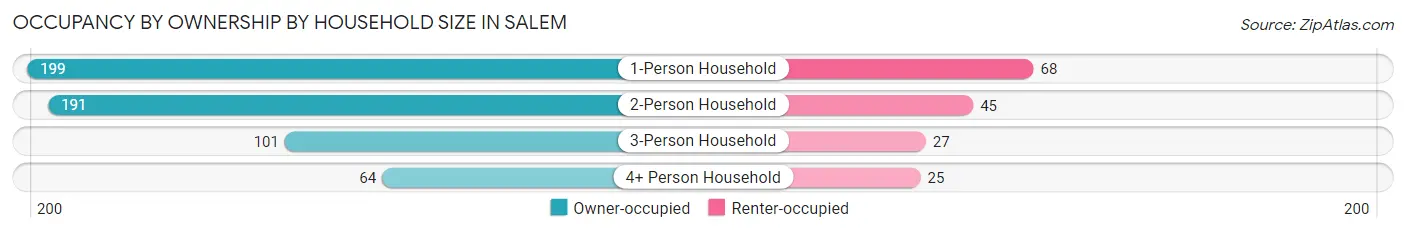
| Household Size | Owner-occupied | Renter-occupied |
| 1-Person Household | 199 (74.5%) | 68 (25.5%) |
| 2-Person Household | 191 (80.9%) | 45 (19.1%) |
| 3-Person Household | 101 (78.9%) | 27 (21.1%) |
| 4+ Person Household | 64 (71.9%) | 25 (28.1%) |
| Total Housing Units | 555 (77.1%) | 165 (22.9%) |
Occupancy by Educational Attainment in Salem
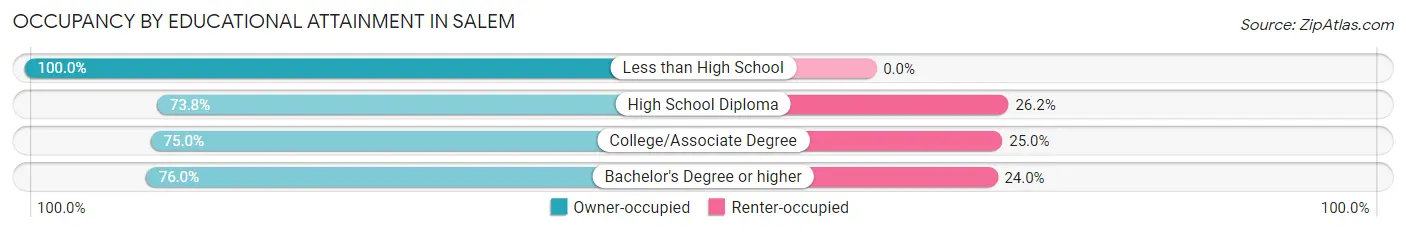
| Household Size | Owner-occupied | Renter-occupied |
| Less than High School | 62 (100.0%) | 0 (0.0%) |
| High School Diploma | 90 (73.8%) | 32 (26.2%) |
| College/Associate Degree | 324 (75.0%) | 108 (25.0%) |
| Bachelor's Degree or higher | 79 (76.0%) | 25 (24.0%) |
Occupancy by Age of Householder in Salem
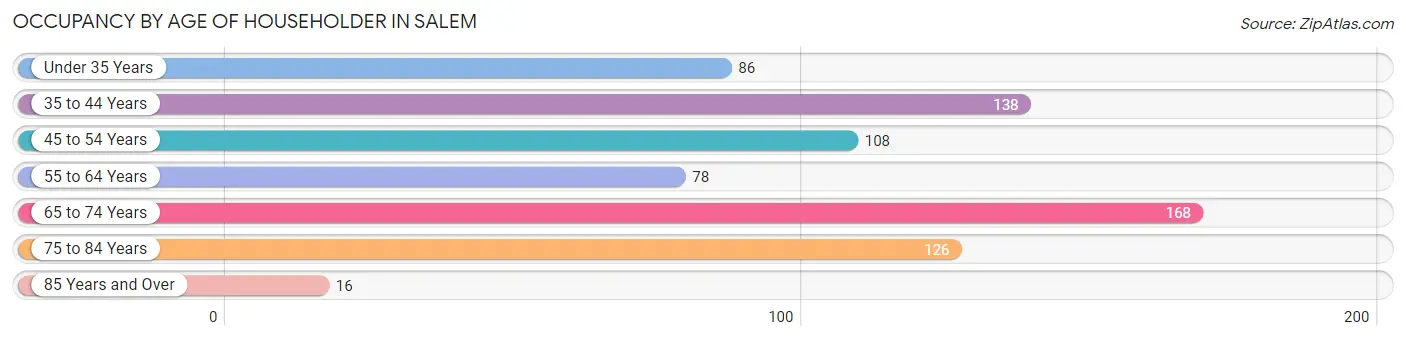
| Age Bracket | # Households | % Households |
| Under 35 Years | 86 | 11.9% |
| 35 to 44 Years | 138 | 19.2% |
| 45 to 54 Years | 108 | 15.0% |
| 55 to 64 Years | 78 | 10.8% |
| 65 to 74 Years | 168 | 23.3% |
| 75 to 84 Years | 126 | 17.5% |
| 85 Years and Over | 16 | 2.2% |
| Total | 720 | 100.0% |
Housing Finances in Salem
Median Income by Occupancy in Salem
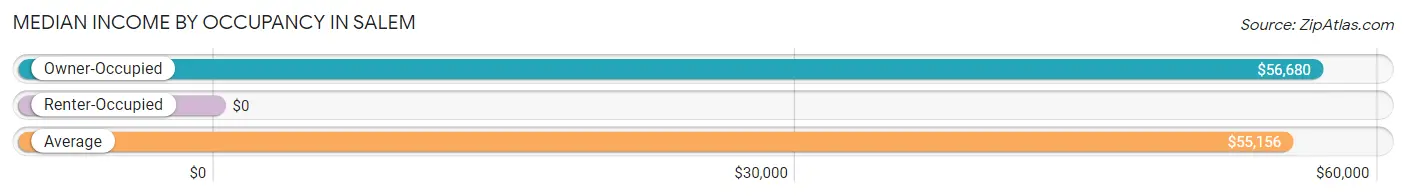
| Occupancy Type | # Households | Median Income |
| Owner-Occupied | 555 (77.1%) | $56,680 |
| Renter-Occupied | 165 (22.9%) | $0 |
| Average | 720 (100.0%) | $55,156 |
Occupancy by Householder Income Bracket in Salem
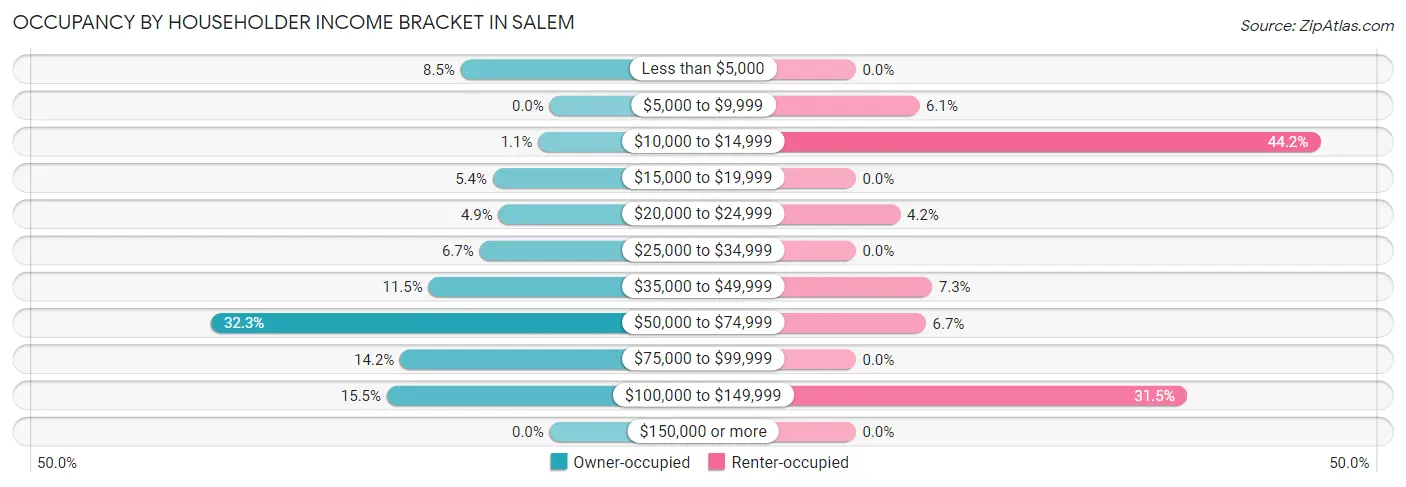
| Income Bracket | Owner-occupied | Renter-occupied |
| Less than $5,000 | 47 (8.5%) | 0 (0.0%) |
| $5,000 to $9,999 | 0 (0.0%) | 10 (6.1%) |
| $10,000 to $14,999 | 6 (1.1%) | 73 (44.2%) |
| $15,000 to $19,999 | 30 (5.4%) | 0 (0.0%) |
| $20,000 to $24,999 | 27 (4.9%) | 7 (4.2%) |
| $25,000 to $34,999 | 37 (6.7%) | 0 (0.0%) |
| $35,000 to $49,999 | 64 (11.5%) | 12 (7.3%) |
| $50,000 to $74,999 | 179 (32.3%) | 11 (6.7%) |
| $75,000 to $99,999 | 79 (14.2%) | 0 (0.0%) |
| $100,000 to $149,999 | 86 (15.5%) | 52 (31.5%) |
| $150,000 or more | 0 (0.0%) | 0 (0.0%) |
| Total | 555 (100.0%) | 165 (100.0%) |
Monthly Housing Cost Tiers in Salem
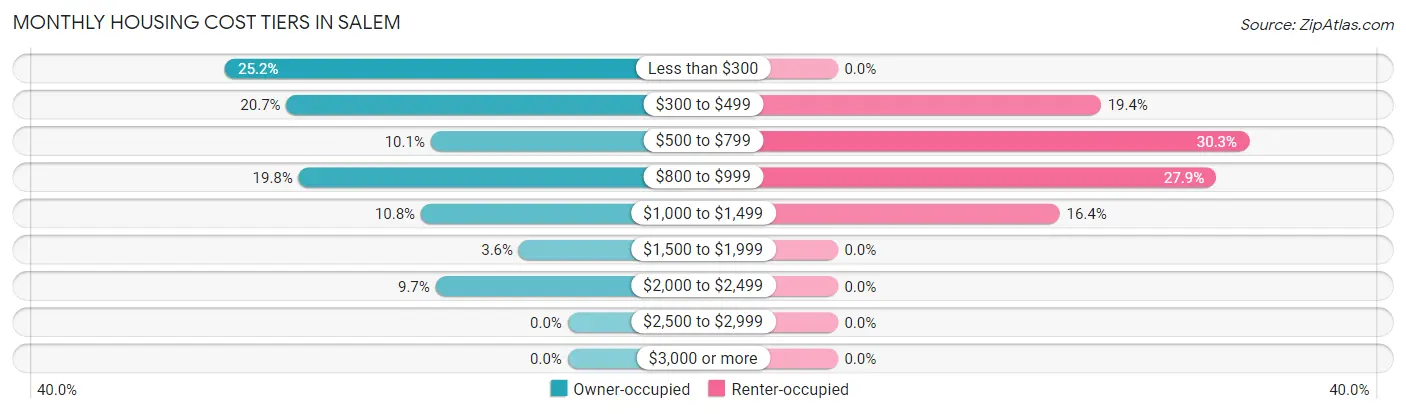
| Monthly Cost | Owner-occupied | Renter-occupied |
| Less than $300 | 140 (25.2%) | 0 (0.0%) |
| $300 to $499 | 115 (20.7%) | 32 (19.4%) |
| $500 to $799 | 56 (10.1%) | 50 (30.3%) |
| $800 to $999 | 110 (19.8%) | 46 (27.9%) |
| $1,000 to $1,499 | 60 (10.8%) | 27 (16.4%) |
| $1,500 to $1,999 | 20 (3.6%) | 0 (0.0%) |
| $2,000 to $2,499 | 54 (9.7%) | 0 (0.0%) |
| $2,500 to $2,999 | 0 (0.0%) | 0 (0.0%) |
| $3,000 or more | 0 (0.0%) | 0 (0.0%) |
| Total | 555 (100.0%) | 165 (100.0%) |
Physical Housing Characteristics in Salem
Housing Structures in Salem
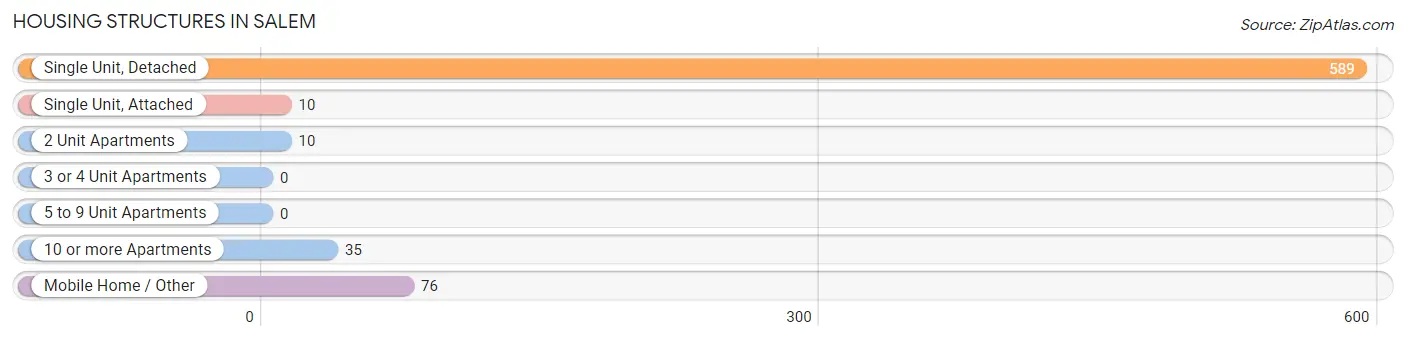
| Structure Type | # Housing Units | % Housing Units |
| Single Unit, Detached | 589 | 81.8% |
| Single Unit, Attached | 10 | 1.4% |
| 2 Unit Apartments | 10 | 1.4% |
| 3 or 4 Unit Apartments | 0 | 0.0% |
| 5 to 9 Unit Apartments | 0 | 0.0% |
| 10 or more Apartments | 35 | 4.9% |
| Mobile Home / Other | 76 | 10.6% |
| Total | 720 | 100.0% |
Housing Structures by Occupancy in Salem
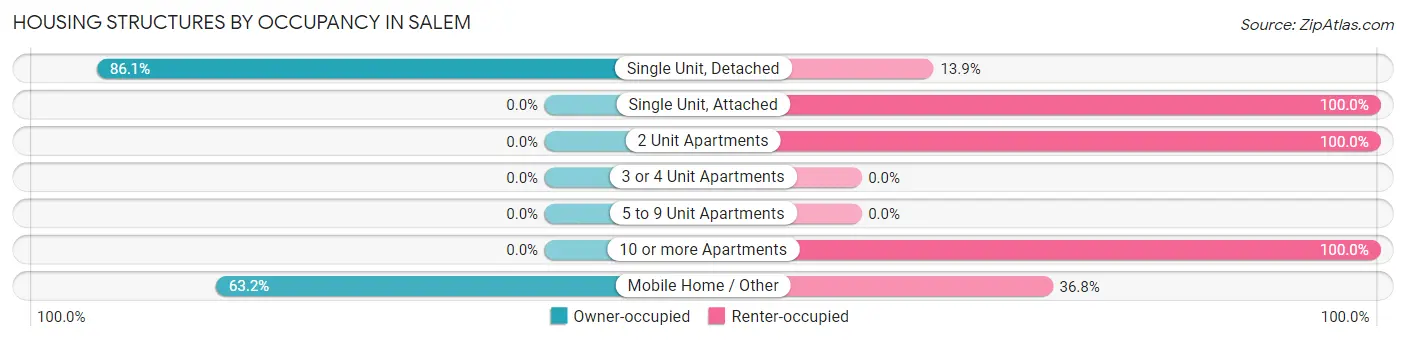
| Structure Type | Owner-occupied | Renter-occupied |
| Single Unit, Detached | 507 (86.1%) | 82 (13.9%) |
| Single Unit, Attached | 0 (0.0%) | 10 (100.0%) |
| 2 Unit Apartments | 0 (0.0%) | 10 (100.0%) |
| 3 or 4 Unit Apartments | 0 (0.0%) | 0 (0.0%) |
| 5 to 9 Unit Apartments | 0 (0.0%) | 0 (0.0%) |
| 10 or more Apartments | 0 (0.0%) | 35 (100.0%) |
| Mobile Home / Other | 48 (63.2%) | 28 (36.8%) |
| Total | 555 (77.1%) | 165 (22.9%) |
Housing Structures by Number of Rooms in Salem
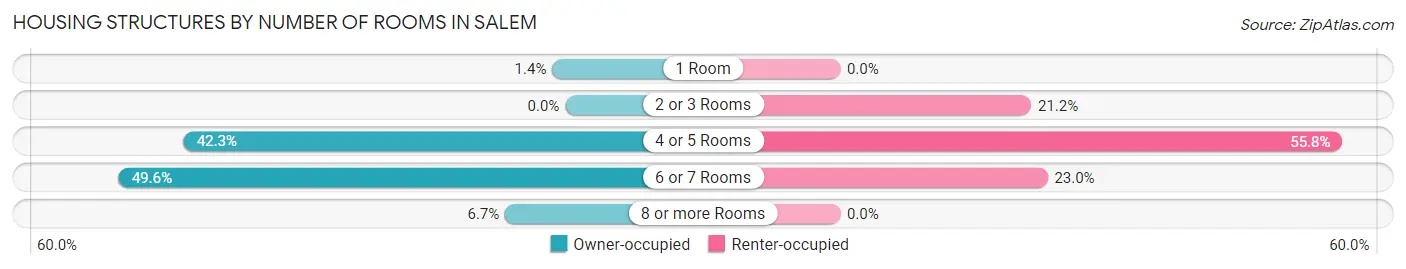
| Number of Rooms | Owner-occupied | Renter-occupied |
| 1 Room | 8 (1.4%) | 0 (0.0%) |
| 2 or 3 Rooms | 0 (0.0%) | 35 (21.2%) |
| 4 or 5 Rooms | 235 (42.3%) | 92 (55.8%) |
| 6 or 7 Rooms | 275 (49.5%) | 38 (23.0%) |
| 8 or more Rooms | 37 (6.7%) | 0 (0.0%) |
| Total | 555 (100.0%) | 165 (100.0%) |
Housing Structure by Heating Type in Salem
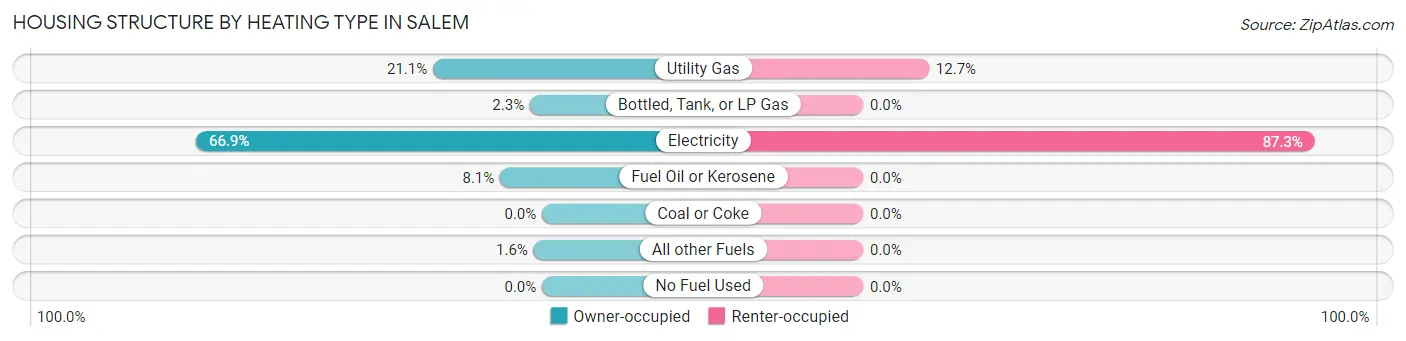
| Heating Type | Owner-occupied | Renter-occupied |
| Utility Gas | 117 (21.1%) | 21 (12.7%) |
| Bottled, Tank, or LP Gas | 13 (2.3%) | 0 (0.0%) |
| Electricity | 371 (66.8%) | 144 (87.3%) |
| Fuel Oil or Kerosene | 45 (8.1%) | 0 (0.0%) |
| Coal or Coke | 0 (0.0%) | 0 (0.0%) |
| All other Fuels | 9 (1.6%) | 0 (0.0%) |
| No Fuel Used | 0 (0.0%) | 0 (0.0%) |
| Total | 555 (100.0%) | 165 (100.0%) |
Household Vehicle Usage in Salem
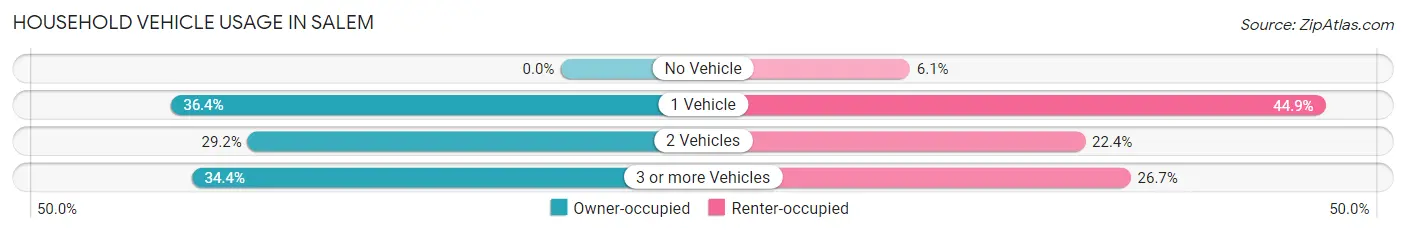
| Vehicles per Household | Owner-occupied | Renter-occupied |
| No Vehicle | 0 (0.0%) | 10 (6.1%) |
| 1 Vehicle | 202 (36.4%) | 74 (44.9%) |
| 2 Vehicles | 162 (29.2%) | 37 (22.4%) |
| 3 or more Vehicles | 191 (34.4%) | 44 (26.7%) |
| Total | 555 (100.0%) | 165 (100.0%) |
Real Estate & Mortgages in Salem
Real Estate and Mortgage Overview in Salem
| Characteristic | Without Mortgage | With Mortgage |
| Housing Units | 288 | 267 |
| Median Property Value | $133,500 | $147,800 |
| Median Household Income | $52,841 | $0 |
| Monthly Housing Costs | $305 | $0 |
| Real Estate Taxes | $889 | $0 |
Property Value by Mortgage Status in Salem
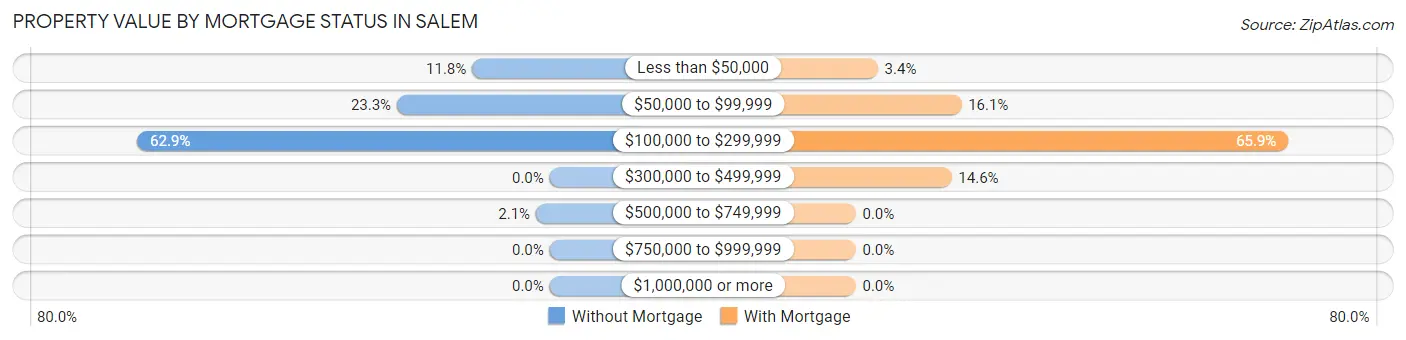
| Property Value | Without Mortgage | With Mortgage |
| Less than $50,000 | 34 (11.8%) | 9 (3.4%) |
| $50,000 to $99,999 | 67 (23.3%) | 43 (16.1%) |
| $100,000 to $299,999 | 181 (62.8%) | 176 (65.9%) |
| $300,000 to $499,999 | 0 (0.0%) | 39 (14.6%) |
| $500,000 to $749,999 | 6 (2.1%) | 0 (0.0%) |
| $750,000 to $999,999 | 0 (0.0%) | 0 (0.0%) |
| $1,000,000 or more | 0 (0.0%) | 0 (0.0%) |
| Total | 288 (100.0%) | 267 (100.0%) |
Household Income by Mortgage Status in Salem
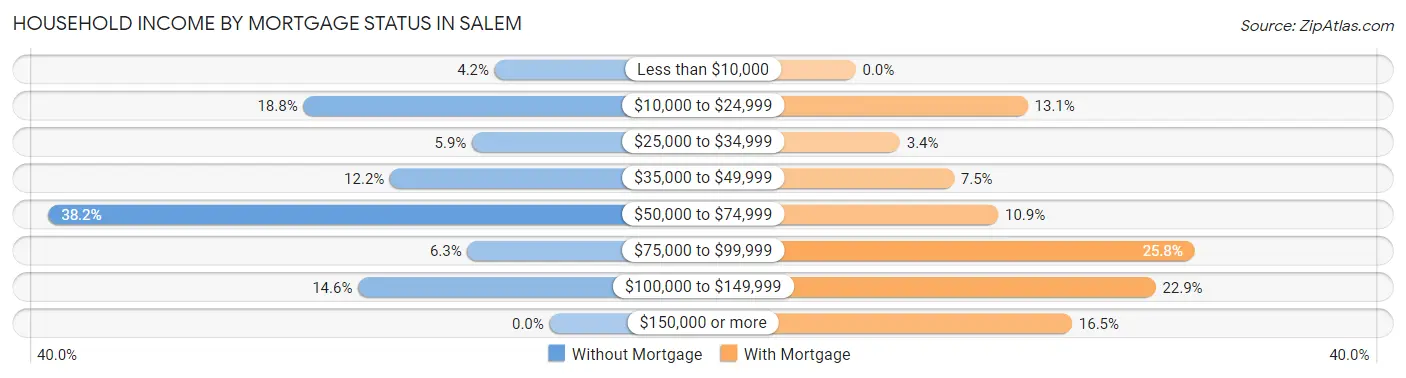
| Household Income | Without Mortgage | With Mortgage |
| Less than $10,000 | 12 (4.2%) | 0 (0.0%) |
| $10,000 to $24,999 | 54 (18.8%) | 35 (13.1%) |
| $25,000 to $34,999 | 17 (5.9%) | 9 (3.4%) |
| $35,000 to $49,999 | 35 (12.1%) | 20 (7.5%) |
| $50,000 to $74,999 | 110 (38.2%) | 29 (10.9%) |
| $75,000 to $99,999 | 18 (6.2%) | 69 (25.8%) |
| $100,000 to $149,999 | 42 (14.6%) | 61 (22.9%) |
| $150,000 or more | 0 (0.0%) | 44 (16.5%) |
| Total | 288 (100.0%) | 267 (100.0%) |
Property Value to Household Income Ratio in Salem
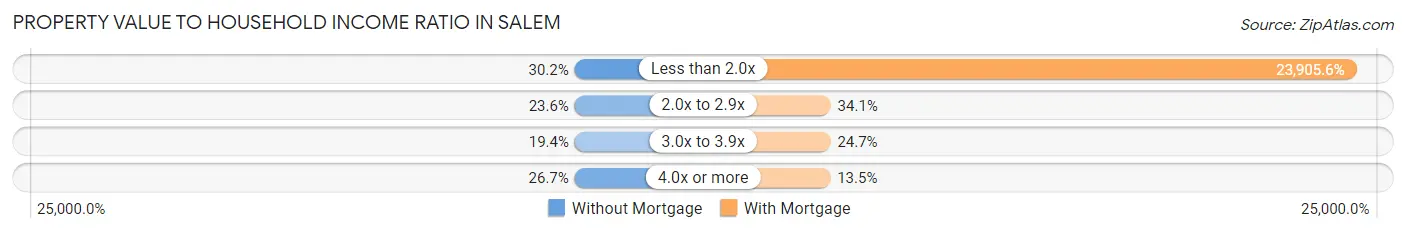
| Value-to-Income Ratio | Without Mortgage | With Mortgage |
| Less than 2.0x | 87 (30.2%) | 63,828 (23,905.6%) |
| 2.0x to 2.9x | 68 (23.6%) | 91 (34.1%) |
| 3.0x to 3.9x | 56 (19.4%) | 66 (24.7%) |
| 4.0x or more | 77 (26.7%) | 36 (13.5%) |
| Total | 288 (100.0%) | 267 (100.0%) |
Real Estate Taxes by Mortgage Status in Salem
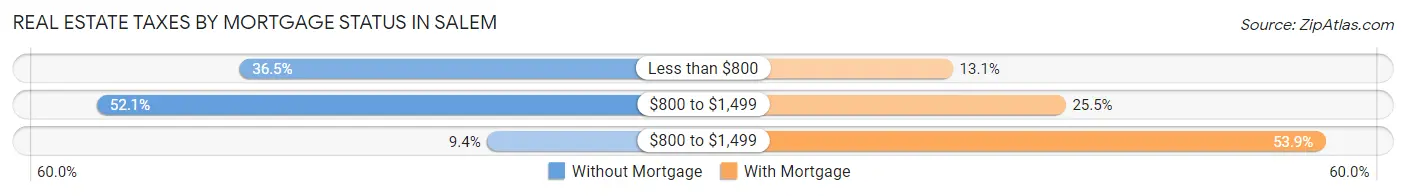
| Property Taxes | Without Mortgage | With Mortgage |
| Less than $800 | 105 (36.5%) | 35 (13.1%) |
| $800 to $1,499 | 150 (52.1%) | 68 (25.5%) |
| $800 to $1,499 | 27 (9.4%) | 144 (53.9%) |
| Total | 288 (100.0%) | 267 (100.0%) |
Health & Disability in Salem
Health Insurance Coverage by Age in Salem
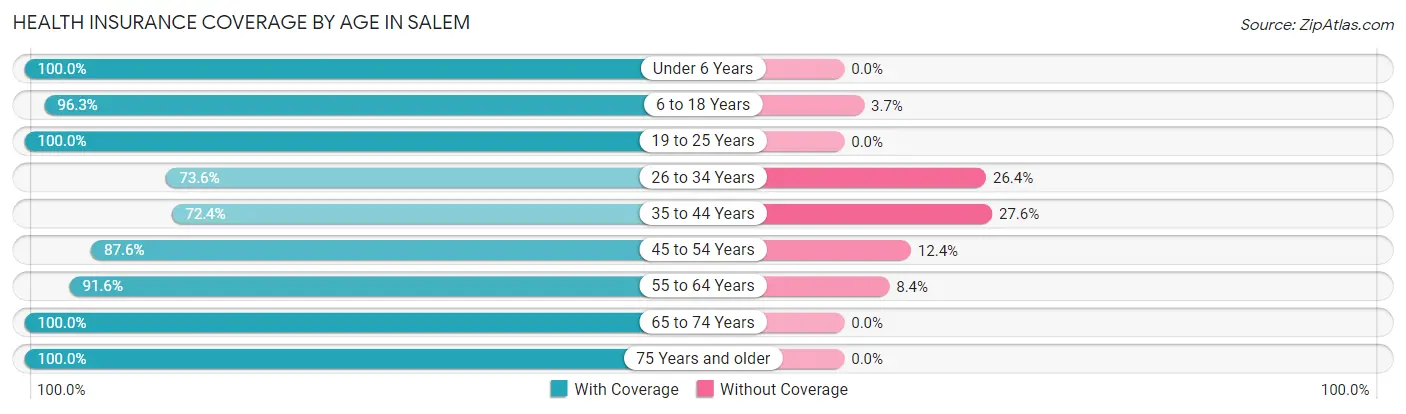
| Age Bracket | With Coverage | Without Coverage |
| Under 6 Years | 120 (100.0%) | 0 (0.0%) |
| 6 to 18 Years | 182 (96.3%) | 7 (3.7%) |
| 19 to 25 Years | 64 (100.0%) | 0 (0.0%) |
| 26 to 34 Years | 192 (73.6%) | 69 (26.4%) |
| 35 to 44 Years | 163 (72.4%) | 62 (27.6%) |
| 45 to 54 Years | 141 (87.6%) | 20 (12.4%) |
| 55 to 64 Years | 131 (91.6%) | 12 (8.4%) |
| 65 to 74 Years | 262 (100.0%) | 0 (0.0%) |
| 75 Years and older | 209 (100.0%) | 0 (0.0%) |
| Total | 1,464 (89.6%) | 170 (10.4%) |
Health Insurance Coverage by Citizenship Status in Salem
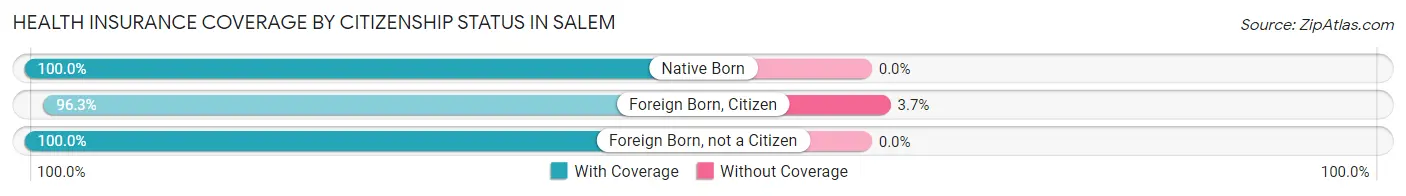
| Citizenship Status | With Coverage | Without Coverage |
| Native Born | 120 (100.0%) | 0 (0.0%) |
| Foreign Born, Citizen | 182 (96.3%) | 7 (3.7%) |
| Foreign Born, not a Citizen | 64 (100.0%) | 0 (0.0%) |
Health Insurance Coverage by Household Income in Salem
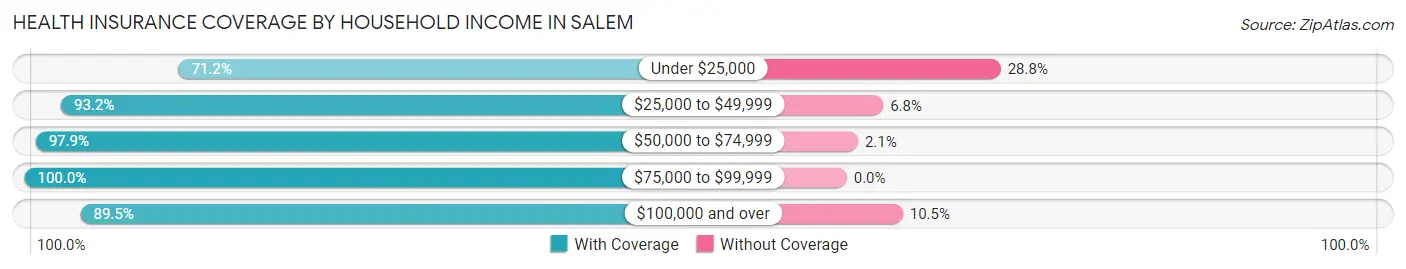
| Household Income | With Coverage | Without Coverage |
| Under $25,000 | 264 (71.2%) | 107 (28.8%) |
| $25,000 to $49,999 | 150 (93.2%) | 11 (6.8%) |
| $50,000 to $74,999 | 421 (97.9%) | 9 (2.1%) |
| $75,000 to $99,999 | 262 (100.0%) | 0 (0.0%) |
| $100,000 and over | 367 (89.5%) | 43 (10.5%) |
Public vs Private Health Insurance Coverage by Age in Salem
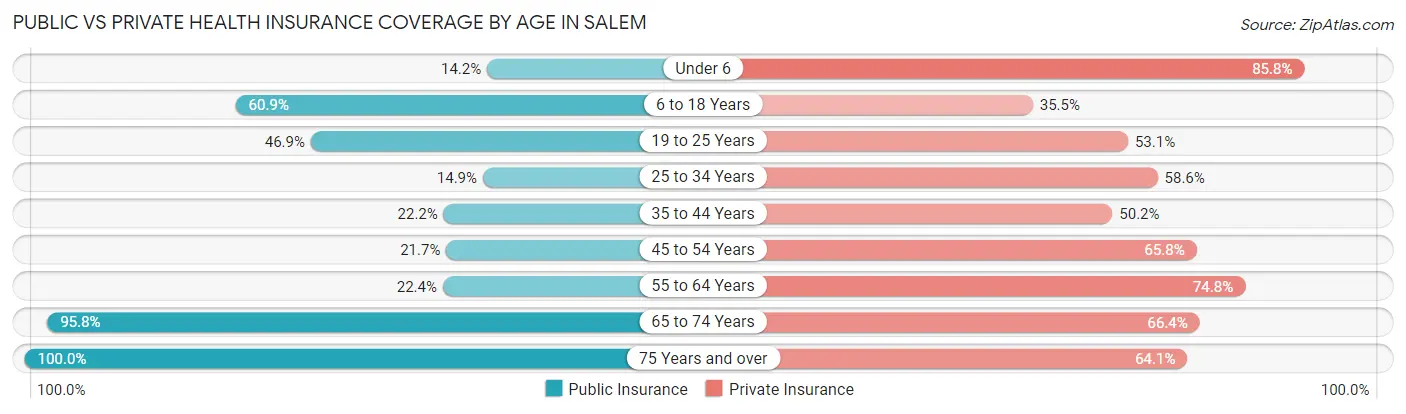
| Age Bracket | Public Insurance | Private Insurance |
| Under 6 | 17 (14.2%) | 103 (85.8%) |
| 6 to 18 Years | 115 (60.9%) | 67 (35.4%) |
| 19 to 25 Years | 30 (46.9%) | 34 (53.1%) |
| 25 to 34 Years | 39 (14.9%) | 153 (58.6%) |
| 35 to 44 Years | 50 (22.2%) | 113 (50.2%) |
| 45 to 54 Years | 35 (21.7%) | 106 (65.8%) |
| 55 to 64 Years | 32 (22.4%) | 107 (74.8%) |
| 65 to 74 Years | 251 (95.8%) | 174 (66.4%) |
| 75 Years and over | 209 (100.0%) | 134 (64.1%) |
| Total | 778 (47.6%) | 991 (60.7%) |
Disability Status by Sex by Age in Salem
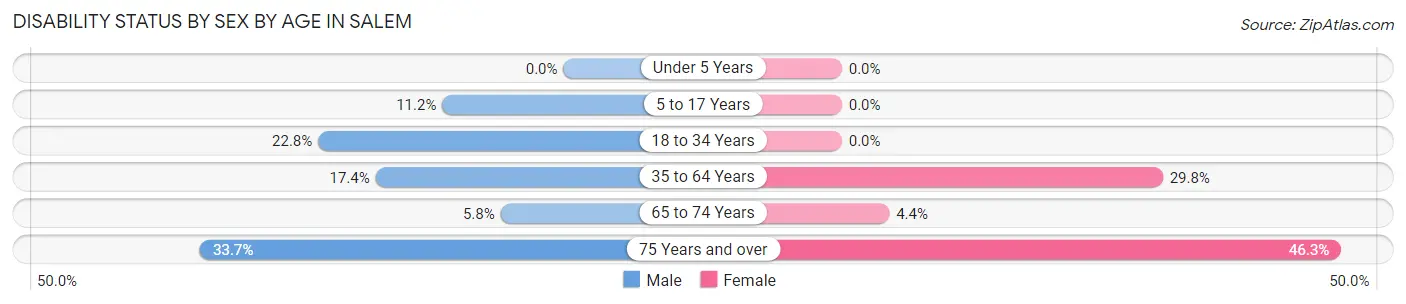
| Age Bracket | Male | Female |
| Under 5 Years | 0 (0.0%) | 0 (0.0%) |
| 5 to 17 Years | 10 (11.2%) | 0 (0.0%) |
| 18 to 34 Years | 28 (22.8%) | 0 (0.0%) |
| 35 to 64 Years | 53 (17.4%) | 67 (29.8%) |
| 65 to 74 Years | 6 (5.8%) | 7 (4.4%) |
| 75 Years and over | 29 (33.7%) | 57 (46.3%) |
Disability Class by Sex by Age in Salem
Disability Class: Hearing Difficulty
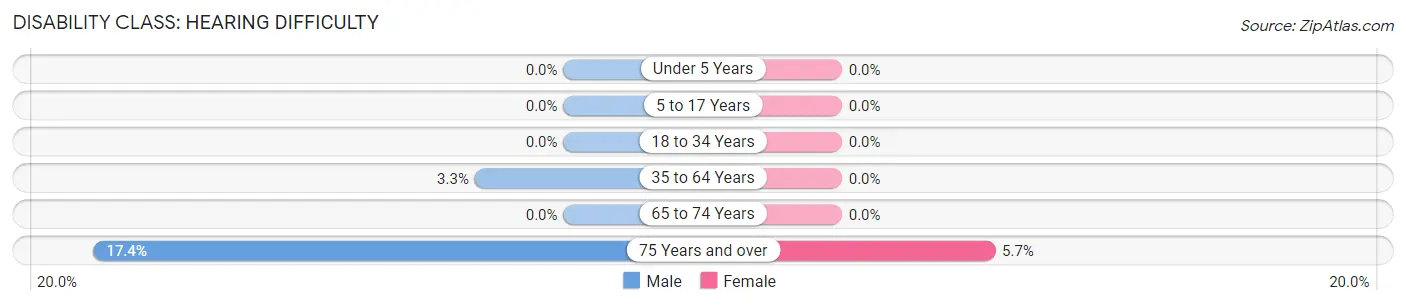
| Age Bracket | Male | Female |
| Under 5 Years | 0 (0.0%) | 0 (0.0%) |
| 5 to 17 Years | 0 (0.0%) | 0 (0.0%) |
| 18 to 34 Years | 0 (0.0%) | 0 (0.0%) |
| 35 to 64 Years | 10 (3.3%) | 0 (0.0%) |
| 65 to 74 Years | 0 (0.0%) | 0 (0.0%) |
| 75 Years and over | 15 (17.4%) | 7 (5.7%) |
Disability Class: Vision Difficulty
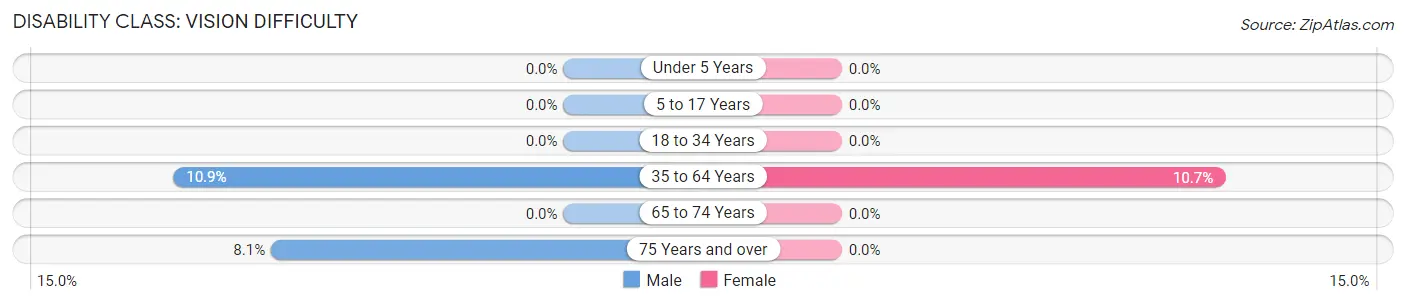
| Age Bracket | Male | Female |
| Under 5 Years | 0 (0.0%) | 0 (0.0%) |
| 5 to 17 Years | 0 (0.0%) | 0 (0.0%) |
| 18 to 34 Years | 0 (0.0%) | 0 (0.0%) |
| 35 to 64 Years | 33 (10.9%) | 24 (10.7%) |
| 65 to 74 Years | 0 (0.0%) | 0 (0.0%) |
| 75 Years and over | 7 (8.1%) | 0 (0.0%) |
Disability Class: Cognitive Difficulty
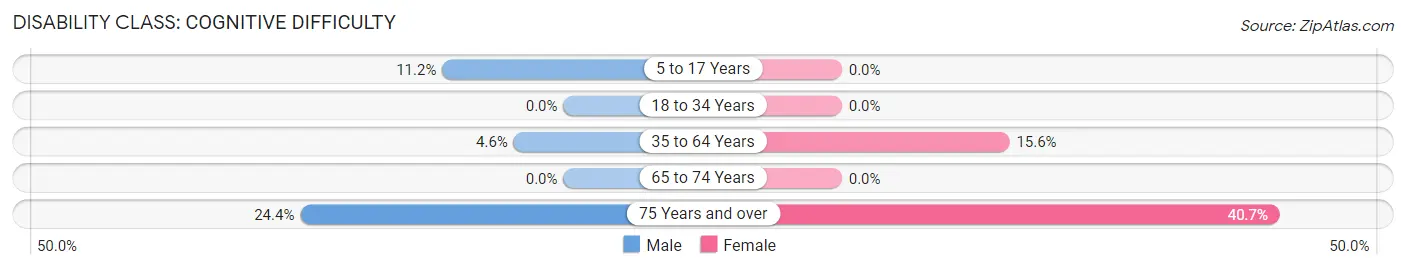
| Age Bracket | Male | Female |
| 5 to 17 Years | 10 (11.2%) | 0 (0.0%) |
| 18 to 34 Years | 0 (0.0%) | 0 (0.0%) |
| 35 to 64 Years | 14 (4.6%) | 35 (15.6%) |
| 65 to 74 Years | 0 (0.0%) | 0 (0.0%) |
| 75 Years and over | 21 (24.4%) | 50 (40.6%) |
Disability Class: Ambulatory Difficulty
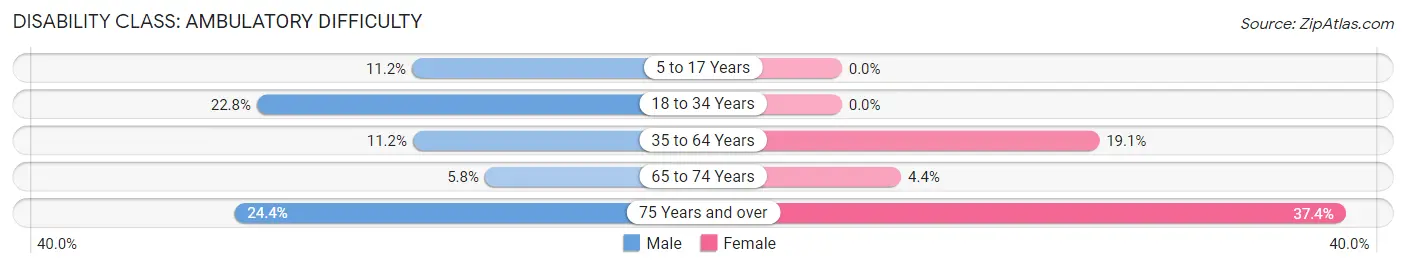
| Age Bracket | Male | Female |
| 5 to 17 Years | 10 (11.2%) | 0 (0.0%) |
| 18 to 34 Years | 28 (22.8%) | 0 (0.0%) |
| 35 to 64 Years | 34 (11.2%) | 43 (19.1%) |
| 65 to 74 Years | 6 (5.8%) | 7 (4.4%) |
| 75 Years and over | 21 (24.4%) | 46 (37.4%) |
Disability Class: Self-Care Difficulty
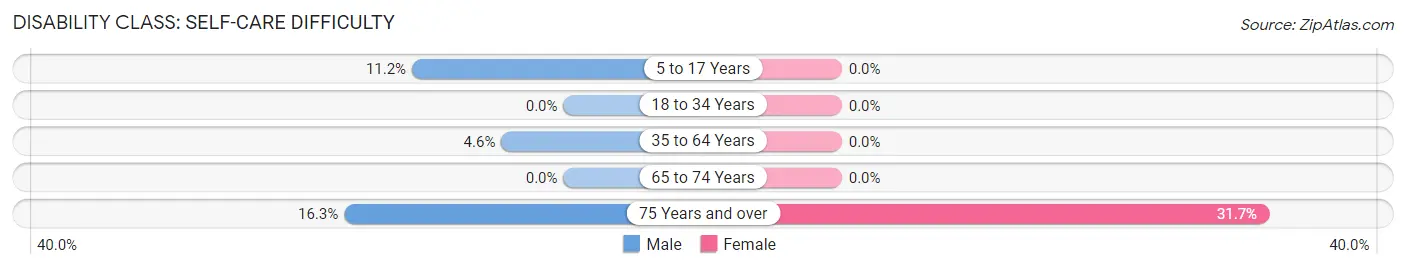
| Age Bracket | Male | Female |
| 5 to 17 Years | 10 (11.2%) | 0 (0.0%) |
| 18 to 34 Years | 0 (0.0%) | 0 (0.0%) |
| 35 to 64 Years | 14 (4.6%) | 0 (0.0%) |
| 65 to 74 Years | 0 (0.0%) | 0 (0.0%) |
| 75 Years and over | 14 (16.3%) | 39 (31.7%) |
Technology Access in Salem
Computing Device Access in Salem
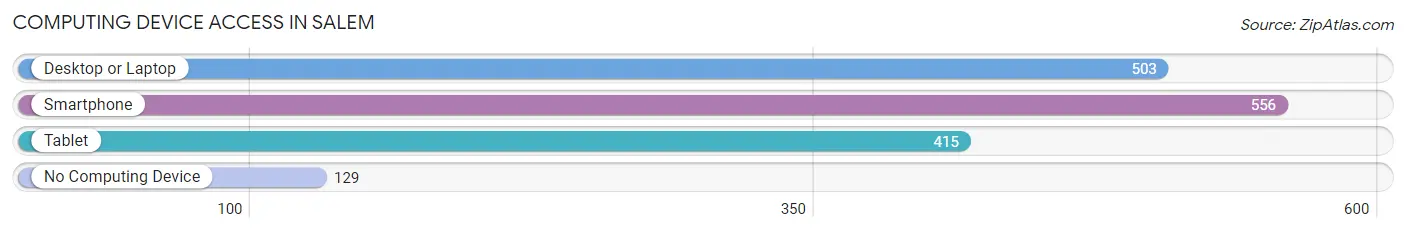
| Device Type | # Households | % Households |
| Desktop or Laptop | 503 | 69.9% |
| Smartphone | 556 | 77.2% |
| Tablet | 415 | 57.6% |
| No Computing Device | 129 | 17.9% |
| Total | 720 | 100.0% |
Internet Access in Salem
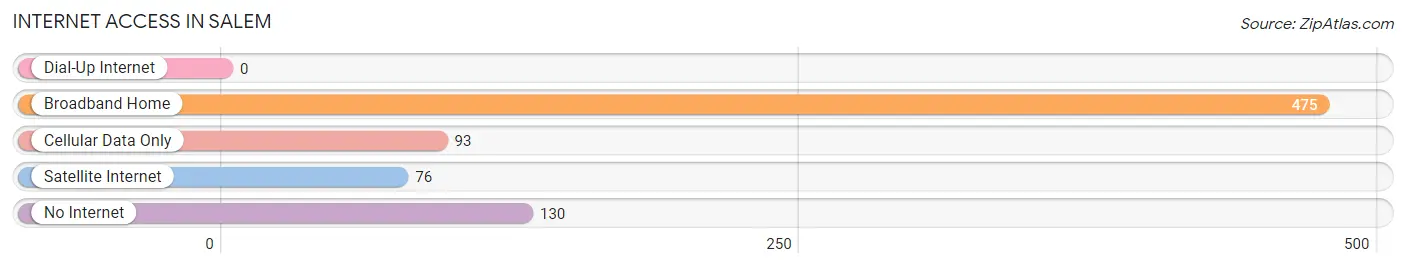
| Internet Type | # Households | % Households |
| Dial-Up Internet | 0 | 0.0% |
| Broadband Home | 475 | 66.0% |
| Cellular Data Only | 93 | 12.9% |
| Satellite Internet | 76 | 10.6% |
| No Internet | 130 | 18.1% |
| Total | 720 | 100.0% |
Salem Summary
Salem, North Carolina is a city located in Forsyth County, in the state of North Carolina. It is part of the Winston-Salem, North Carolina Metropolitan Statistical Area. The city has a population of approximately 25,000 people, and is located in the heart of the Piedmont Triad region.
History
Salem was founded in 1766 by a group of Moravian settlers from Pennsylvania. The settlers were led by Bishop August Gottlieb Spangenberg, and the town was named after the biblical city of Salem. The settlers were part of the Moravian Church, a Protestant denomination that was founded in the 15th century in what is now the Czech Republic. The Moravians were known for their strong religious beliefs and their commitment to education and social justice.
The town of Salem was laid out in a grid pattern, with a central square surrounded by streets and alleys. The town was divided into two sections, the “Germantown” and the “Englishtown”. The Germantown section was home to the Moravian settlers, while the Englishtown section was home to the English settlers.
The town of Salem quickly grew and prospered, and by the early 19th century it was a thriving commercial center. The town was home to a variety of businesses, including a tannery, a brewery, a gristmill, and a cotton mill. The town also had a variety of churches, including the Moravian Church, the Methodist Church, and the Baptist Church.
In 1849, the town of Salem was incorporated as a city. The city continued to grow and prosper, and by the late 19th century it was a major industrial center. The city was home to a variety of factories, including a cotton mill, a tobacco factory, and a furniture factory.
Geography
Salem is located in the Piedmont region of North Carolina, in the foothills of the Blue Ridge Mountains. The city is situated on the banks of the Yadkin River, and is surrounded by rolling hills and forests. The city has a total area of 8.3 square miles, and is located approximately 30 miles north of Winston-Salem.
The climate in Salem is mild and humid, with hot summers and cool winters. The average annual temperature is around 60 degrees Fahrenheit, and the average annual precipitation is around 45 inches.
Economy
The economy of Salem is largely based on manufacturing and services. The city is home to a variety of manufacturing companies, including a furniture factory, a textile mill, and a printing company. The city is also home to a variety of service-based businesses, including restaurants, hotels, and retail stores.
The city is also home to a variety of educational institutions, including Salem College, Forsyth Technical Community College, and Winston-Salem State University.
Demographics
As of the 2010 census, the population of Salem was 24,802. The racial makeup of the city was 79.3% White, 15.2% African American, 0.4% Native American, 1.2% Asian, 0.1% Pacific Islander, and 3.8% from other races. The median household income was $41,945, and the median family income was $50,945.
The city is home to a variety of religious denominations, including the Moravian Church, the Methodist Church, the Baptist Church, and the Roman Catholic Church. The city is also home to a variety of cultural and recreational activities, including the Salem Museum, the Salem Civic Center, and the Salem Little Theatre.
Common Questions
What is the Total Population of Salem?
Total Population of Salem is 1,634.
What is the Total Male Population of Salem?
Total Male Population of Salem is 740.
What is the Total Female Population of Salem?
Total Female Population of Salem is 894.
What is the Ratio of Males per 100 Females in Salem?
There are 82.77 Males per 100 Females in Salem.
What is the Ratio of Females per 100 Males in Salem?
There are 120.81 Females per 100 Males in Salem.
What is the Median Population Age in Salem?
Median Population Age in Salem is 40.0 Years.
What is the Average Family Size in Salem
Average Family Size in Salem is 3.1 People.
What is the Average Household Size in Salem
Average Household Size in Salem is 2.3 People.
What is Per Capita Income in Salem?
Per Capita income in Salem is $26,415.
What is the Median Family Income in Salem?
Median Family Income in Salem is $74,261.
What is the Median Household income in Salem?
Median Household Income in Salem is $55,156.
What is Income or Wage Gap in Salem?
Income or Wage Gap in Salem is 16.2%.
Women in Salem earn 83.8 cents for every dollar earned by a man.
What is Inequality or Gini Index in Salem?
Inequality or Gini Index in Salem is 0.37.
How Large is the Labor Force in Salem?
There are 771 People in the Labor Forcein in Salem.
What is the Percentage of People in the Labor Force in Salem?
57.0% of People are in the Labor Force in Salem.
What is the Unemployment Rate in Salem?
Unemployment Rate in Salem is 5.8%.