Glen Alpine, NC
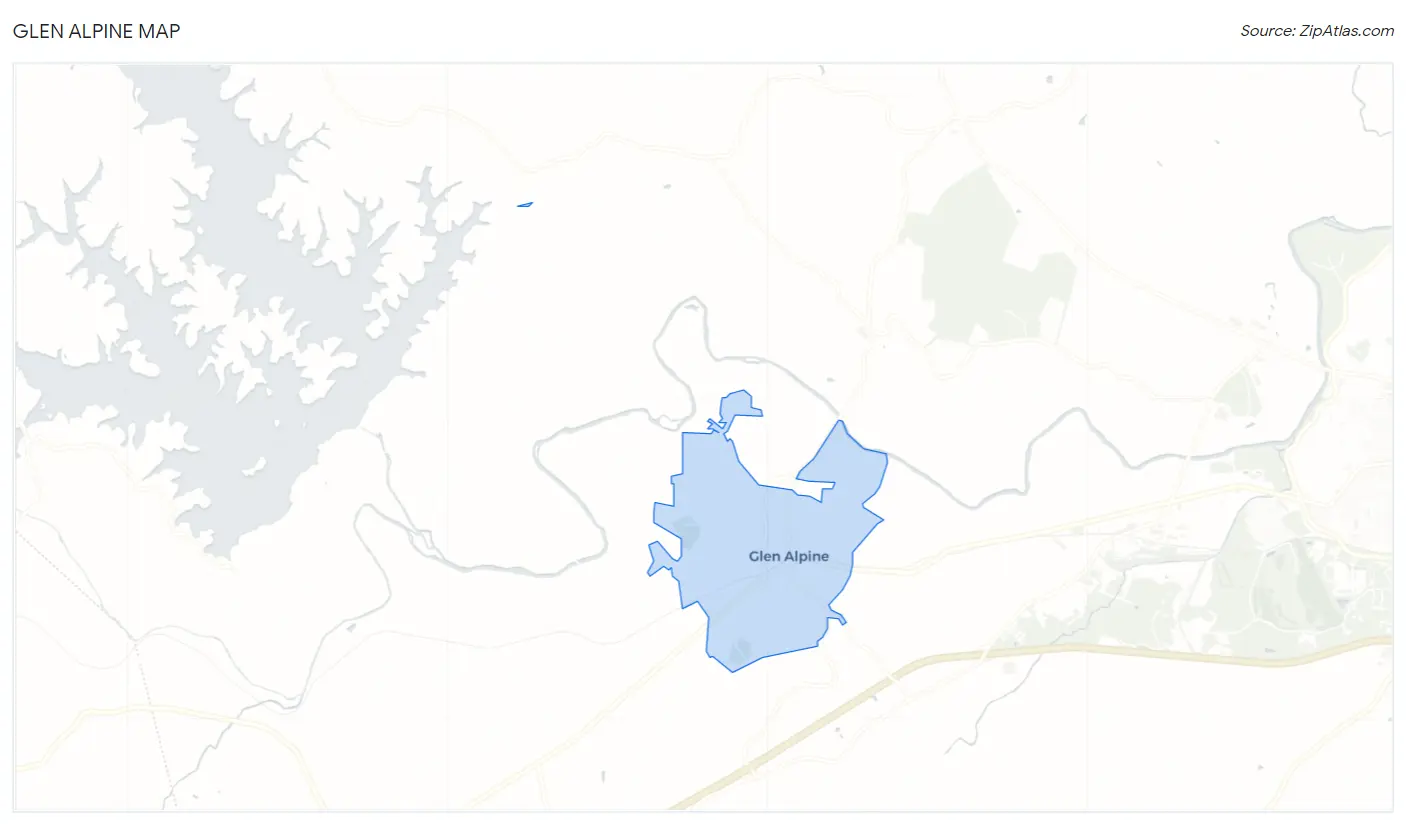
Glen Alpine Map
Glen Alpine Overview
1,896
TOTAL POPULATION
995
MALE POPULATION
901
FEMALE POPULATION
110.43
MALES / 100 FEMALES
90.55
FEMALES / 100 MALES
38.1
MEDIAN AGE
3.0
AVG FAMILY SIZE
2.7
AVG HOUSEHOLD SIZE
$26,927
PER CAPITA INCOME
$64,444
AVG FAMILY INCOME
$51,563
AVG HOUSEHOLD INCOME
13.1%
WAGE / INCOME GAP [ % ]
86.9¢/ $1
WAGE / INCOME GAP [ $ ]
0.40
INEQUALITY / GINI INDEX
960
LABOR FORCE [ PEOPLE ]
64.7%
PERCENT IN LABOR FORCE
4.2%
UNEMPLOYMENT RATE
Glen Alpine Zip Codes
Glen Alpine Area Codes
Race in Glen Alpine
The most populous races in Glen Alpine are White / Caucasian (1,678 | 88.5%), Two or more Races (107 | 5.6%), and Hispanic or Latino (93 | 4.9%).
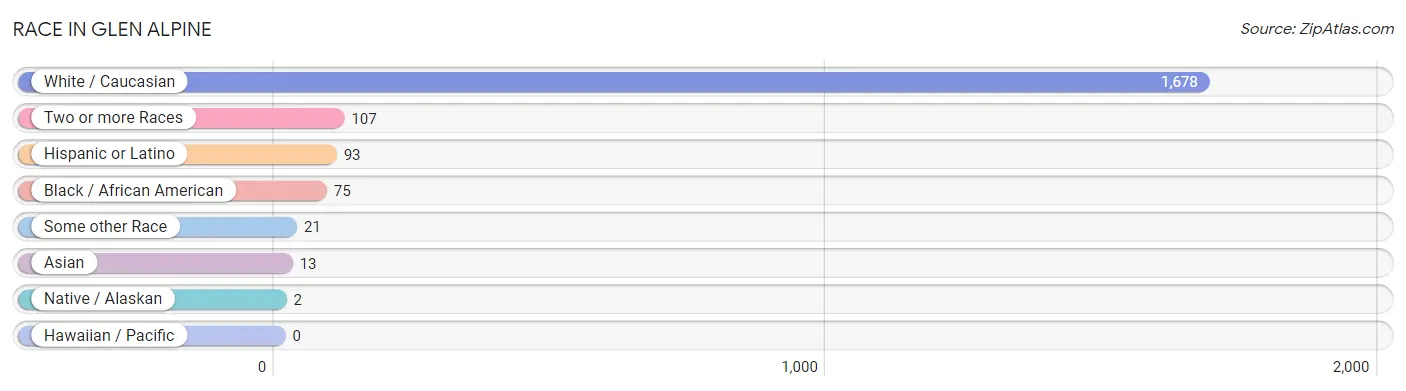
| Race | # Population | % Population |
| Asian | 13 | 0.7% |
| Black / African American | 75 | 4.0% |
| Hawaiian / Pacific | 0 | 0.0% |
| Hispanic or Latino | 93 | 4.9% |
| Native / Alaskan | 2 | 0.1% |
| White / Caucasian | 1,678 | 88.5% |
| Two or more Races | 107 | 5.6% |
| Some other Race | 21 | 1.1% |
| Total | 1,896 | 100.0% |
Ancestry in Glen Alpine
The most populous ancestries reported in Glen Alpine are American (446 | 23.5%), German (266 | 14.0%), Irish (240 | 12.7%), English (136 | 7.2%), and Scottish (67 | 3.5%), together accounting for 60.9% of all Glen Alpine residents.
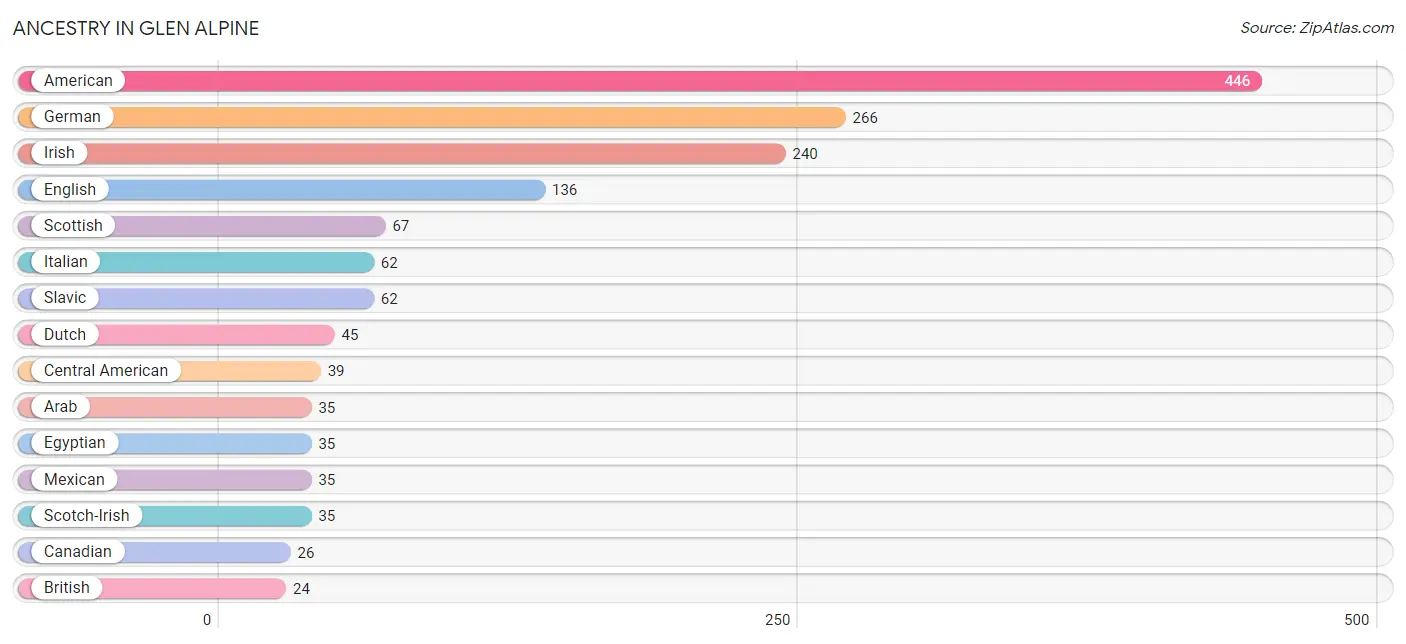
| Ancestry | # Population | % Population |
| American | 446 | 23.5% |
| Arab | 35 | 1.8% |
| Austrian | 12 | 0.6% |
| Blackfeet | 2 | 0.1% |
| British | 24 | 1.3% |
| Canadian | 26 | 1.4% |
| Central American | 39 | 2.1% |
| Cherokee | 12 | 0.6% |
| Dutch | 45 | 2.4% |
| Egyptian | 35 | 1.8% |
| English | 136 | 7.2% |
| European | 13 | 0.7% |
| French | 24 | 1.3% |
| German | 266 | 14.0% |
| Greek | 1 | 0.1% |
| Guatemalan | 16 | 0.8% |
| Haitian | 8 | 0.4% |
| Honduran | 3 | 0.2% |
| Indian (Asian) | 6 | 0.3% |
| Irish | 240 | 12.7% |
| Italian | 62 | 3.3% |
| Korean | 17 | 0.9% |
| Mexican | 35 | 1.8% |
| Norwegian | 18 | 0.9% |
| Polish | 17 | 0.9% |
| Puerto Rican | 19 | 1.0% |
| Russian | 10 | 0.5% |
| Salvadoran | 20 | 1.1% |
| Scotch-Irish | 35 | 1.8% |
| Scottish | 67 | 3.5% |
| Slavic | 62 | 3.3% |
| Welsh | 2 | 0.1% | View All 32 Rows |
Immigrants in Glen Alpine
The most numerous immigrant groups reported in Glen Alpine came from Eastern Europe (62 | 3.3%), Europe (62 | 3.3%), Poland (62 | 3.3%), Central America (24 | 1.3%), and Latin America (24 | 1.3%), together accounting for 12.3% of all Glen Alpine residents.
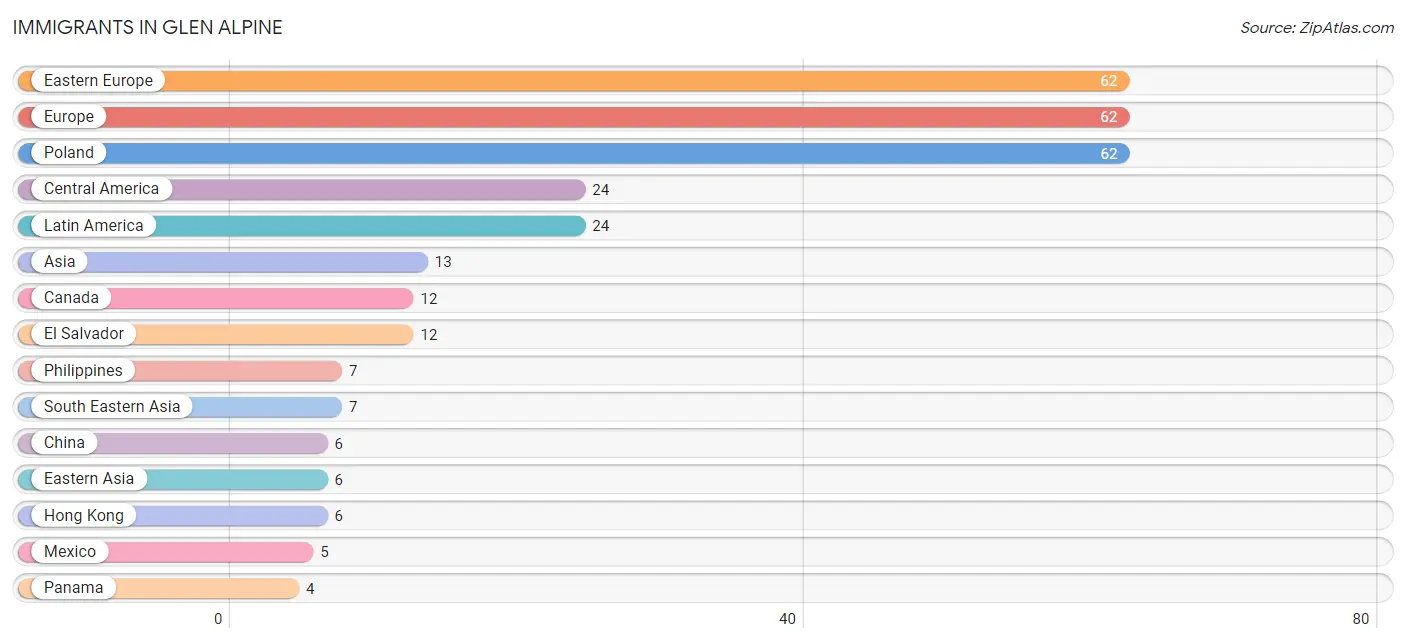
| Immigration Origin | # Population | % Population |
| Asia | 13 | 0.7% |
| Canada | 12 | 0.6% |
| Central America | 24 | 1.3% |
| China | 6 | 0.3% |
| Eastern Asia | 6 | 0.3% |
| Eastern Europe | 62 | 3.3% |
| El Salvador | 12 | 0.6% |
| Europe | 62 | 3.3% |
| Honduras | 3 | 0.2% |
| Hong Kong | 6 | 0.3% |
| Latin America | 24 | 1.3% |
| Mexico | 5 | 0.3% |
| Panama | 4 | 0.2% |
| Philippines | 7 | 0.4% |
| Poland | 62 | 3.3% |
| South Eastern Asia | 7 | 0.4% | View All 16 Rows |
Sex and Age in Glen Alpine
Sex and Age in Glen Alpine
The most populous age groups in Glen Alpine are 10 to 14 Years (125 | 12.6%) for men and 35 to 39 Years (113 | 12.5%) for women.
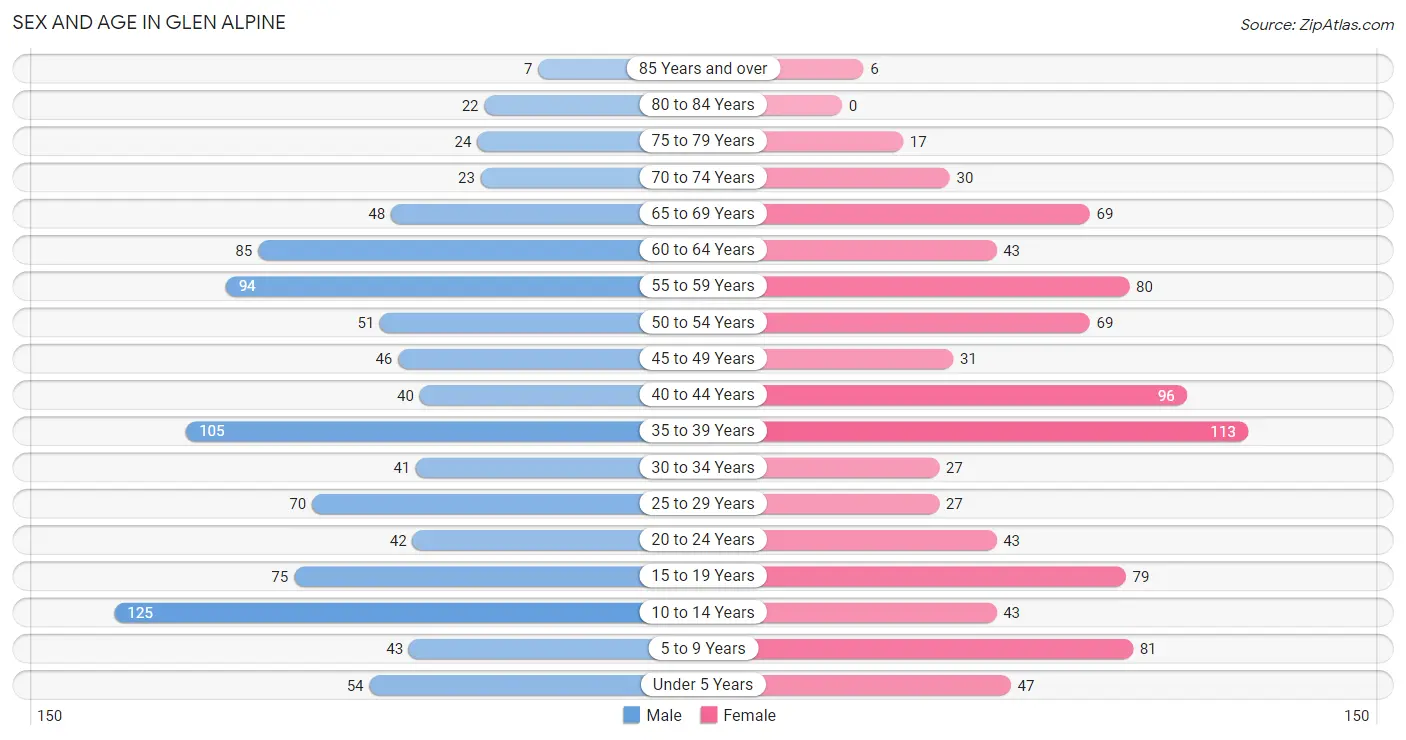
| Age Bracket | Male | Female |
| Under 5 Years | 54 (5.4%) | 47 (5.2%) |
| 5 to 9 Years | 43 (4.3%) | 81 (9.0%) |
| 10 to 14 Years | 125 (12.6%) | 43 (4.8%) |
| 15 to 19 Years | 75 (7.5%) | 79 (8.8%) |
| 20 to 24 Years | 42 (4.2%) | 43 (4.8%) |
| 25 to 29 Years | 70 (7.0%) | 27 (3.0%) |
| 30 to 34 Years | 41 (4.1%) | 27 (3.0%) |
| 35 to 39 Years | 105 (10.5%) | 113 (12.5%) |
| 40 to 44 Years | 40 (4.0%) | 96 (10.6%) |
| 45 to 49 Years | 46 (4.6%) | 31 (3.4%) |
| 50 to 54 Years | 51 (5.1%) | 69 (7.7%) |
| 55 to 59 Years | 94 (9.5%) | 80 (8.9%) |
| 60 to 64 Years | 85 (8.5%) | 43 (4.8%) |
| 65 to 69 Years | 48 (4.8%) | 69 (7.7%) |
| 70 to 74 Years | 23 (2.3%) | 30 (3.3%) |
| 75 to 79 Years | 24 (2.4%) | 17 (1.9%) |
| 80 to 84 Years | 22 (2.2%) | 0 (0.0%) |
| 85 Years and over | 7 (0.7%) | 6 (0.7%) |
| Total | 995 (100.0%) | 901 (100.0%) |
Families and Households in Glen Alpine
Median Family Size in Glen Alpine
The median family size in Glen Alpine is 3.04 persons per family, with married-couple families (357 | 71.1%) accounting for the largest median family size of 3.12 persons per family. On the other hand, single female/mother families (127 | 25.3%) represent the smallest median family size with 2.83 persons per family.
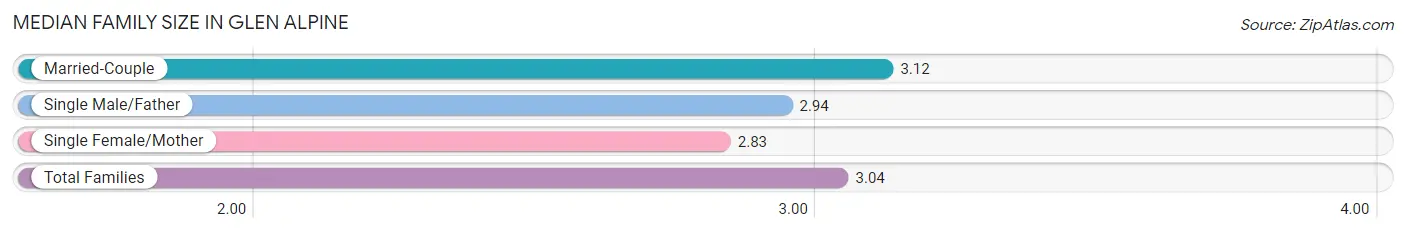
| Family Type | # Families | Family Size |
| Married-Couple | 357 (71.1%) | 3.12 |
| Single Male/Father | 18 (3.6%) | 2.94 |
| Single Female/Mother | 127 (25.3%) | 2.83 |
| Total Families | 502 (100.0%) | 3.04 |
Median Household Size in Glen Alpine
The median household size in Glen Alpine is 2.73 persons per household, with single male/father households (18 | 2.6%) accounting for the largest median household size of 4.22 persons per household. non-family households (192 | 27.7%) represent the smallest median household size with 1.48 persons per household.
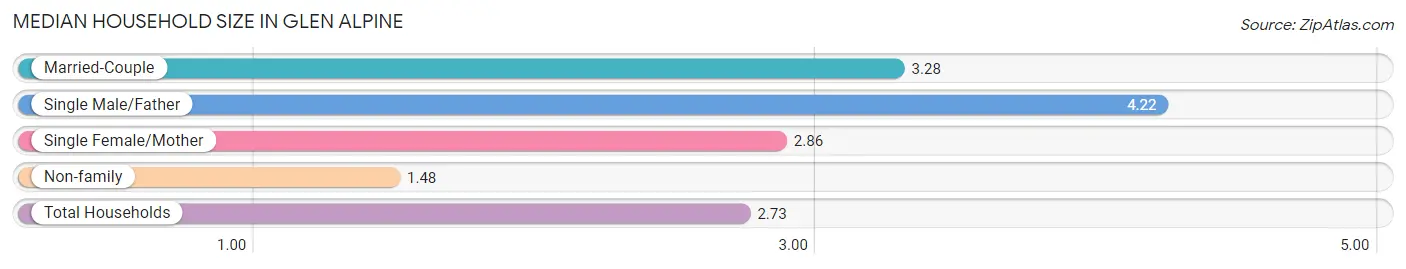
| Household Type | # Households | Household Size |
| Married-Couple | 357 (51.4%) | 3.28 |
| Single Male/Father | 18 (2.6%) | 4.22 |
| Single Female/Mother | 127 (18.3%) | 2.86 |
| Non-family | 192 (27.7%) | 1.48 |
| Total Households | 694 (100.0%) | 2.73 |
Household Size by Marriage Status in Glen Alpine
Out of a total of 694 households in Glen Alpine, 502 (72.3%) are family households, while 192 (27.7%) are nonfamily households. The most numerous type of family households are 2-person households, comprising 187, and the most common type of nonfamily households are 1-person households, comprising 145.
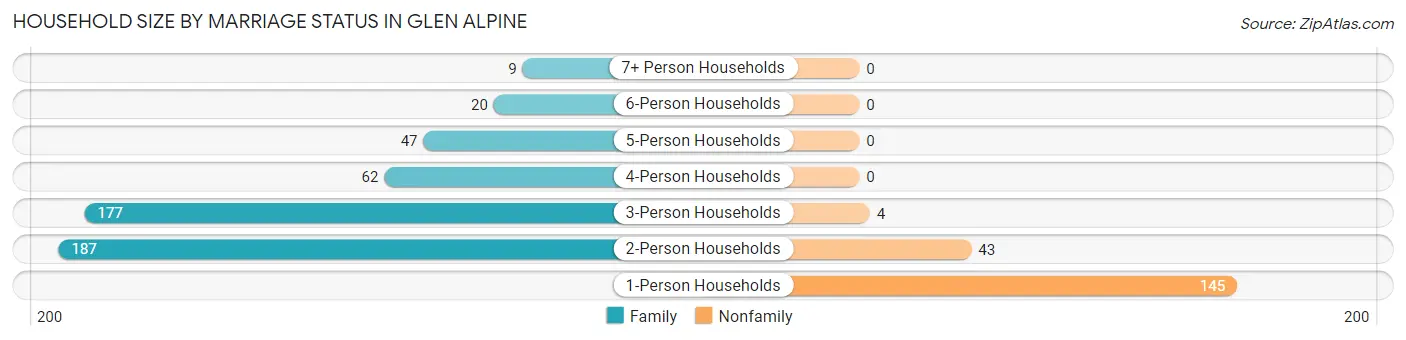
| Household Size | Family Households | Nonfamily Households |
| 1-Person Households | - | 145 (20.9%) |
| 2-Person Households | 187 (27.0%) | 43 (6.2%) |
| 3-Person Households | 177 (25.5%) | 4 (0.6%) |
| 4-Person Households | 62 (8.9%) | 0 (0.0%) |
| 5-Person Households | 47 (6.8%) | 0 (0.0%) |
| 6-Person Households | 20 (2.9%) | 0 (0.0%) |
| 7+ Person Households | 9 (1.3%) | 0 (0.0%) |
| Total | 502 (72.3%) | 192 (27.7%) |
Female Fertility in Glen Alpine
Fertility by Age in Glen Alpine
Average fertility rate in Glen Alpine is 28.0 births per 1,000 women. Women in the age bracket of 20 to 34 years have the highest fertility rate with 124.0 births per 1,000 women. Women in the age bracket of 20 to 34 years acount for 100.0% of all women with births.
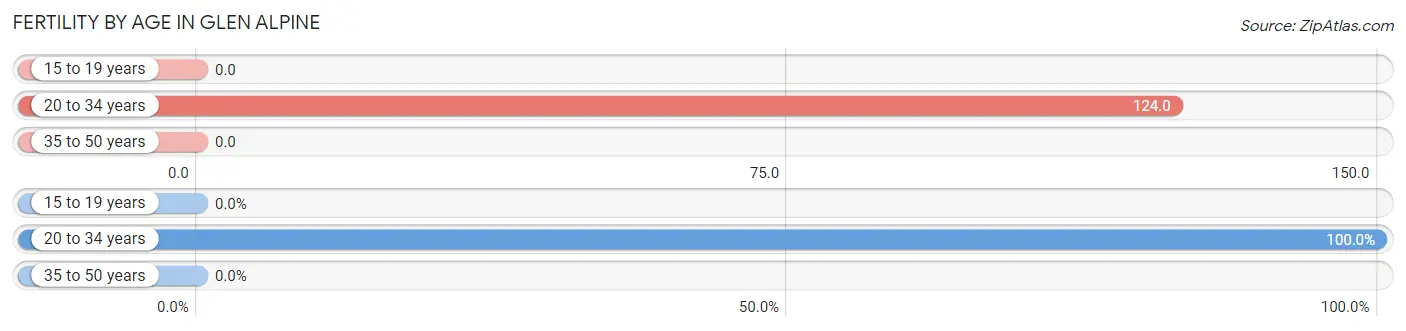
| Age Bracket | Women with Births | Births / 1,000 Women |
| 15 to 19 years | 0 (0.0%) | 0.0 |
| 20 to 34 years | 12 (100.0%) | 124.0 |
| 35 to 50 years | 0 (0.0%) | 0.0 |
| Total | 12 (100.0%) | 28.0 |
Fertility by Age by Marriage Status in Glen Alpine
41.7% of women with births (12) in Glen Alpine are married. The highest percentage of unmarried women with births falls into 20 to 34 years age bracket with 58.3% of them unmarried at the time of birth, while the lowest percentage of unmarried women with births belong to 20 to 34 years age bracket with 58.3% of them unmarried.
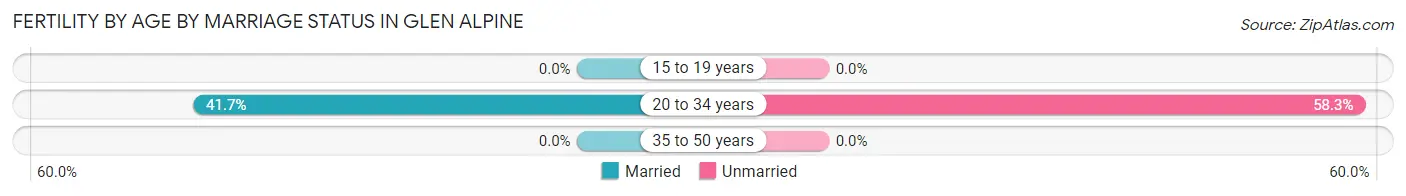
| Age Bracket | Married | Unmarried |
| 15 to 19 years | 0 (0.0%) | 0 (0.0%) |
| 20 to 34 years | 5 (41.7%) | 7 (58.3%) |
| 35 to 50 years | 0 (0.0%) | 0 (0.0%) |
| Total | 5 (41.7%) | 7 (58.3%) |
Fertility by Education in Glen Alpine
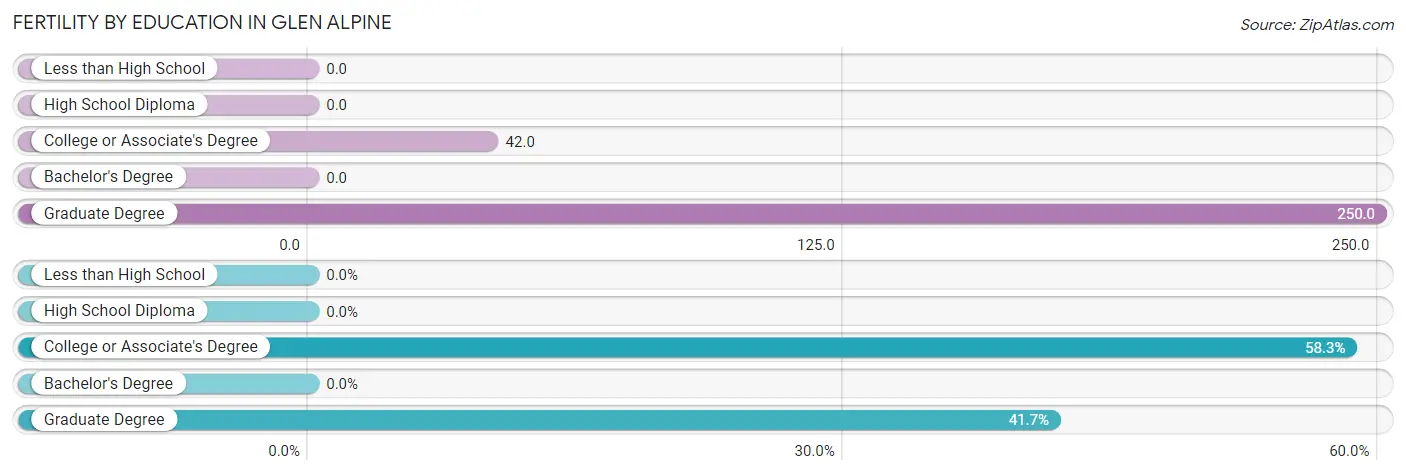
| Educational Attainment | Women with Births | Births / 1,000 Women |
| Less than High School | 0 (0.0%) | 0.0 |
| High School Diploma | 0 (0.0%) | 0.0 |
| College or Associate's Degree | 7 (58.3%) | 42.0 |
| Bachelor's Degree | 0 (0.0%) | 0.0 |
| Graduate Degree | 5 (41.7%) | 250.0 |
| Total | 12 (100.0%) | 28.0 |
Fertility by Education by Marriage Status in Glen Alpine
58.3% of women with births in Glen Alpine are unmarried. Women with the educational attainment of graduate degree are most likely to be married with 100.0% of them married at childbirth, while women with the educational attainment of college or associate's degree are least likely to be married with 100.0% of them unmarried at childbirth.
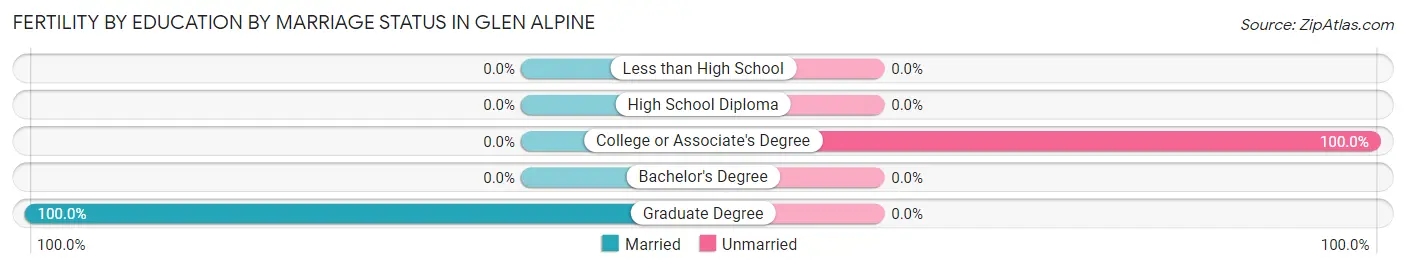
| Educational Attainment | Married | Unmarried |
| Less than High School | 0 (0.0%) | 0 (0.0%) |
| High School Diploma | 0 (0.0%) | 0 (0.0%) |
| College or Associate's Degree | 0 (0.0%) | 7 (100.0%) |
| Bachelor's Degree | 0 (0.0%) | 0 (0.0%) |
| Graduate Degree | 5 (100.0%) | 0 (0.0%) |
| Total | 5 (41.7%) | 7 (58.3%) |
Income in Glen Alpine
Income Overview in Glen Alpine
Per Capita Income in Glen Alpine is $26,927, while median incomes of families and households are $64,444 and $51,563 respectively.
| Characteristic | Number | Measure |
| Per Capita Income | 1,896 | $26,927 |
| Median Family Income | 502 | $64,444 |
| Mean Family Income | 502 | $76,827 |
| Median Household Income | 694 | $51,563 |
| Mean Household Income | 694 | $68,744 |
| Income Deficit | 502 | $0 |
| Wage / Income Gap (%) | 1,896 | 13.08% |
| Wage / Income Gap ($) | 1,896 | 86.92¢ per $1 |
| Gini / Inequality Index | 1,896 | 0.40 |
Earnings by Sex in Glen Alpine
Average Earnings in Glen Alpine are $34,060, $34,774 for men and $30,227 for women, a difference of 13.1%.
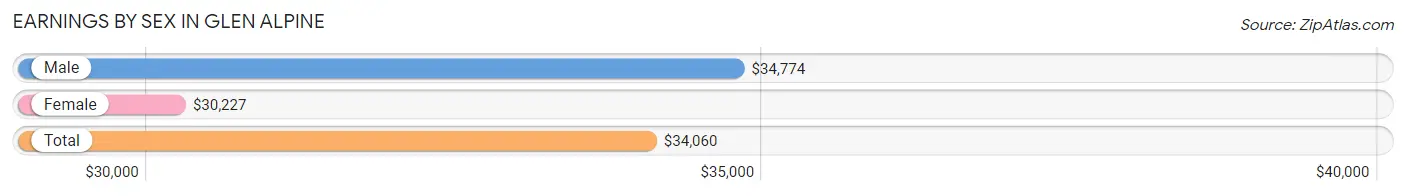
| Sex | Number | Average Earnings |
| Male | 491 (50.0%) | $34,774 |
| Female | 490 (49.9%) | $30,227 |
| Total | 981 (100.0%) | $34,060 |
Earnings by Sex by Income Bracket in Glen Alpine
The most common earnings brackets in Glen Alpine are $30,000 to $34,999 for men (101 | 20.6%) and $35,000 to $39,999 for women (64 | 13.1%).
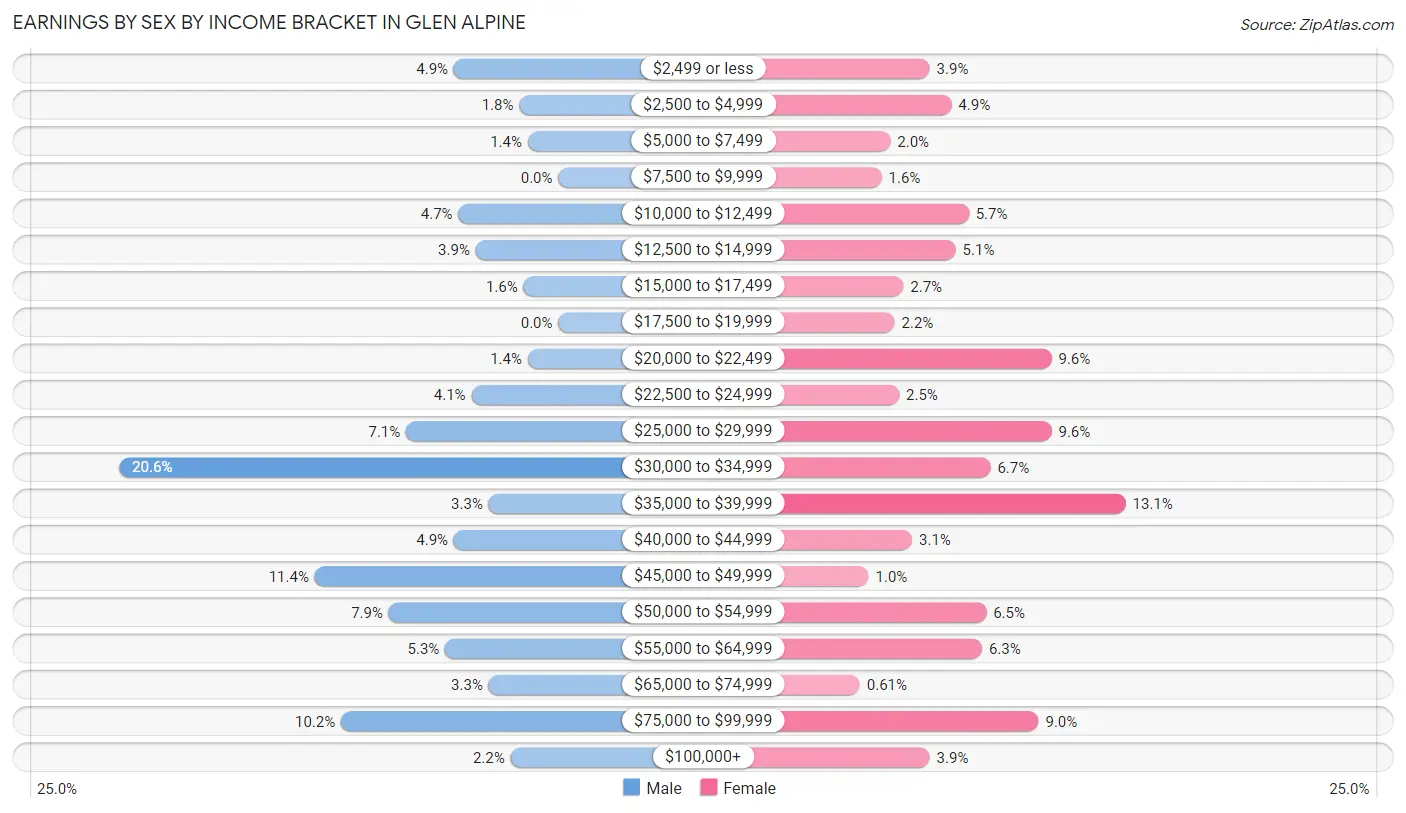
| Income | Male | Female |
| $2,499 or less | 24 (4.9%) | 19 (3.9%) |
| $2,500 to $4,999 | 9 (1.8%) | 24 (4.9%) |
| $5,000 to $7,499 | 7 (1.4%) | 10 (2.0%) |
| $7,500 to $9,999 | 0 (0.0%) | 8 (1.6%) |
| $10,000 to $12,499 | 23 (4.7%) | 28 (5.7%) |
| $12,500 to $14,999 | 19 (3.9%) | 25 (5.1%) |
| $15,000 to $17,499 | 8 (1.6%) | 13 (2.6%) |
| $17,500 to $19,999 | 0 (0.0%) | 11 (2.2%) |
| $20,000 to $22,499 | 7 (1.4%) | 47 (9.6%) |
| $22,500 to $24,999 | 20 (4.1%) | 12 (2.5%) |
| $25,000 to $29,999 | 35 (7.1%) | 47 (9.6%) |
| $30,000 to $34,999 | 101 (20.6%) | 33 (6.7%) |
| $35,000 to $39,999 | 16 (3.3%) | 64 (13.1%) |
| $40,000 to $44,999 | 24 (4.9%) | 15 (3.1%) |
| $45,000 to $49,999 | 56 (11.4%) | 5 (1.0%) |
| $50,000 to $54,999 | 39 (7.9%) | 32 (6.5%) |
| $55,000 to $64,999 | 26 (5.3%) | 31 (6.3%) |
| $65,000 to $74,999 | 16 (3.3%) | 3 (0.6%) |
| $75,000 to $99,999 | 50 (10.2%) | 44 (9.0%) |
| $100,000+ | 11 (2.2%) | 19 (3.9%) |
| Total | 491 (100.0%) | 490 (100.0%) |
Earnings by Sex by Educational Attainment in Glen Alpine
Average earnings in Glen Alpine are $41,125 for men and $35,789 for women, a difference of 13.0%. Men with an educational attainment of college or associate's degree enjoy the highest average annual earnings of $48,036, while those with high school diploma education earn the least with $33,690. Women with an educational attainment of high school diploma earn the most with the average annual earnings of $35,577, while those with college or associate's degree education have the smallest earnings of $35,250.
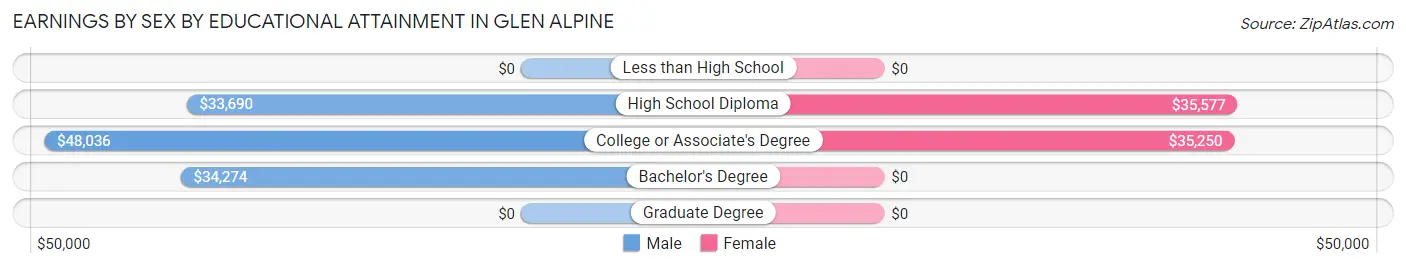
| Educational Attainment | Male Income | Female Income |
| Less than High School | - | - |
| High School Diploma | $33,690 | $35,577 |
| College or Associate's Degree | $48,036 | $35,250 |
| Bachelor's Degree | $34,274 | $0 |
| Graduate Degree | - | - |
| Total | $41,125 | $35,789 |
Family Income in Glen Alpine
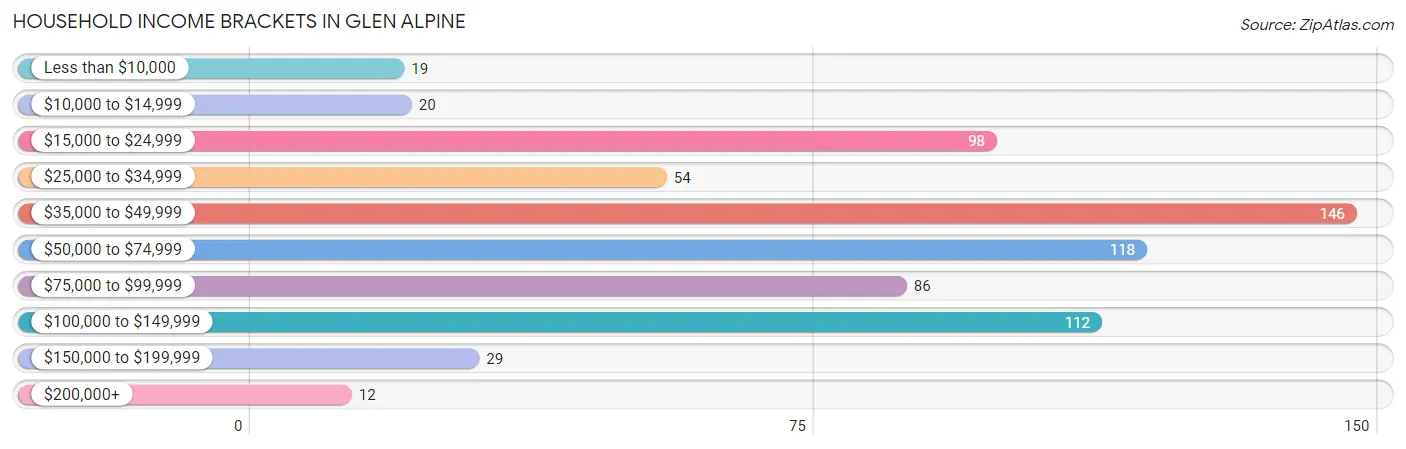
Family Income Brackets in Glen Alpine
According to the Glen Alpine family income data, there are 102 families falling into the $35,000 to $49,999 income range, which is the most common income bracket and makes up 20.3% of all families.
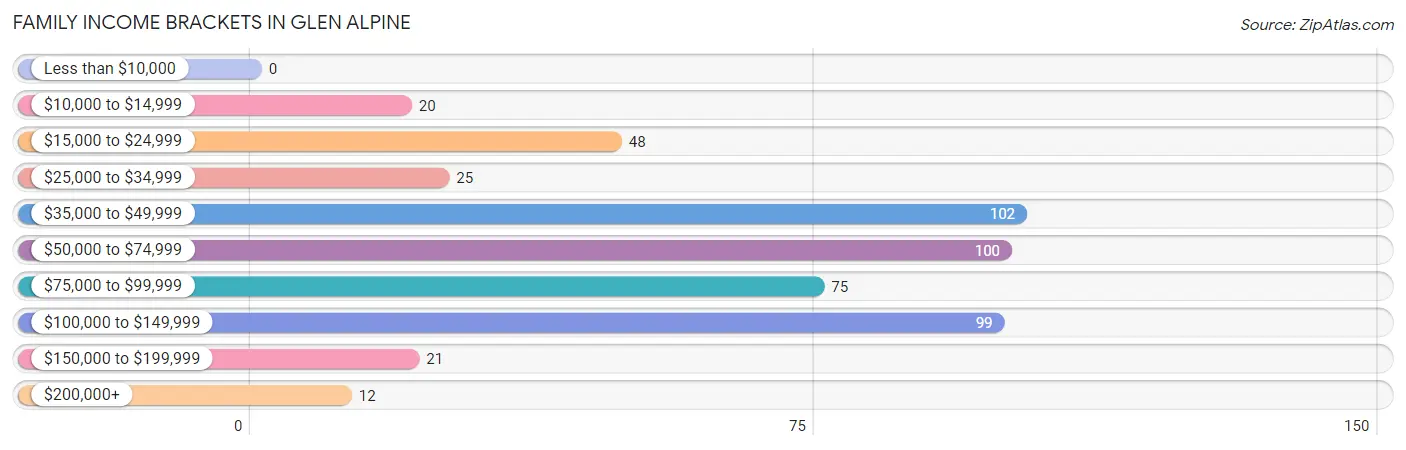
| Income Bracket | # Families | % Families |
| Less than $10,000 | 0 | 0.0% |
| $10,000 to $14,999 | 20 | 4.0% |
| $15,000 to $24,999 | 48 | 9.6% |
| $25,000 to $34,999 | 25 | 5.0% |
| $35,000 to $49,999 | 102 | 20.3% |
| $50,000 to $74,999 | 100 | 19.9% |
| $75,000 to $99,999 | 75 | 14.9% |
| $100,000 to $149,999 | 99 | 19.7% |
| $150,000 to $199,999 | 21 | 4.2% |
| $200,000+ | 12 | 2.4% |
Family Income by Famaliy Size in Glen Alpine
5-person families (33 | 6.6%) account for the highest median family income in Glen Alpine with $98,281 per family, while 2-person families (198 | 39.4%) have the highest median income of $36,042 per family member.
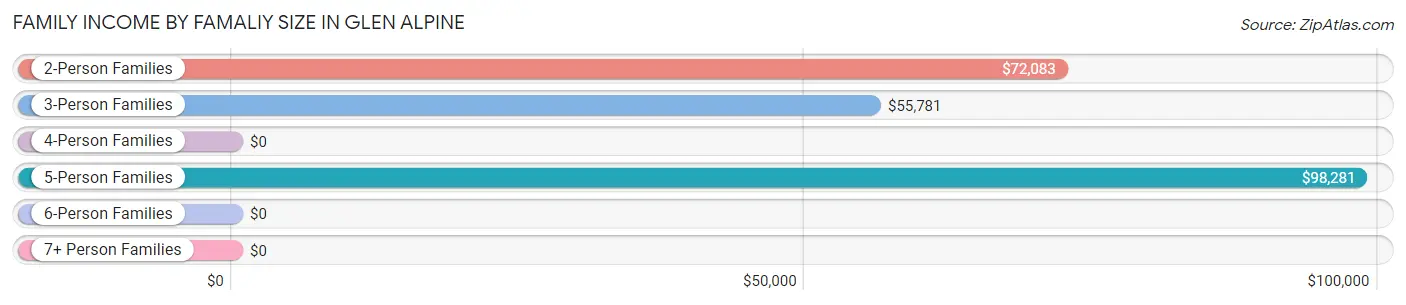
| Income Bracket | # Families | Median Income |
| 2-Person Families | 198 (39.4%) | $72,083 |
| 3-Person Families | 183 (36.4%) | $55,781 |
| 4-Person Families | 65 (13.0%) | $0 |
| 5-Person Families | 33 (6.6%) | $98,281 |
| 6-Person Families | 14 (2.8%) | $0 |
| 7+ Person Families | 9 (1.8%) | $0 |
| Total | 502 (100.0%) | $64,444 |
Family Income by Number of Earners in Glen Alpine
The median family income in Glen Alpine is $64,444, with families comprising 3+ earners (31) having the highest median family income of $156,528, while families with 1 earner (192) have the lowest median family income of $36,833, accounting for 6.2% and 38.3% of families, respectively.
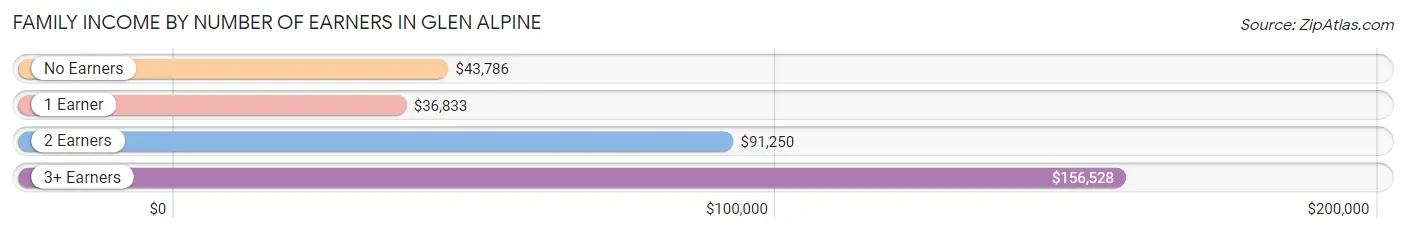
| Number of Earners | # Families | Median Income |
| No Earners | 50 (10.0%) | $43,786 |
| 1 Earner | 192 (38.3%) | $36,833 |
| 2 Earners | 229 (45.6%) | $91,250 |
| 3+ Earners | 31 (6.2%) | $156,528 |
| Total | 502 (100.0%) | $64,444 |
Household Income in Glen Alpine
Household Income Brackets in Glen Alpine
With 146 households falling in the category, the $35,000 to $49,999 income range is the most frequent in Glen Alpine, accounting for 21.0% of all households. In contrast, only 12 households (1.7%) fall into the $200,000+ income bracket, making it the least populous group.
| Income Bracket | # Households | % Households |
| Less than $10,000 | 19 | 2.7% |
| $10,000 to $14,999 | 20 | 2.9% |
| $15,000 to $24,999 | 98 | 14.1% |
| $25,000 to $34,999 | 54 | 7.8% |
| $35,000 to $49,999 | 146 | 21.0% |
| $50,000 to $74,999 | 118 | 17.0% |
| $75,000 to $99,999 | 86 | 12.4% |
| $100,000 to $149,999 | 112 | 16.1% |
| $150,000 to $199,999 | 29 | 4.2% |
| $200,000+ | 12 | 1.7% |
Household Income by Householder Age in Glen Alpine
The median household income in Glen Alpine is $51,563, with the highest median household income of $64,167 found in the 45 to 64 years age bracket for the primary householder. A total of 274 households (39.5%) fall into this category. Meanwhile, the 15 to 24 years age bracket for the primary householder has the lowest median household income of $0, with 15 households (2.2%) in this group.
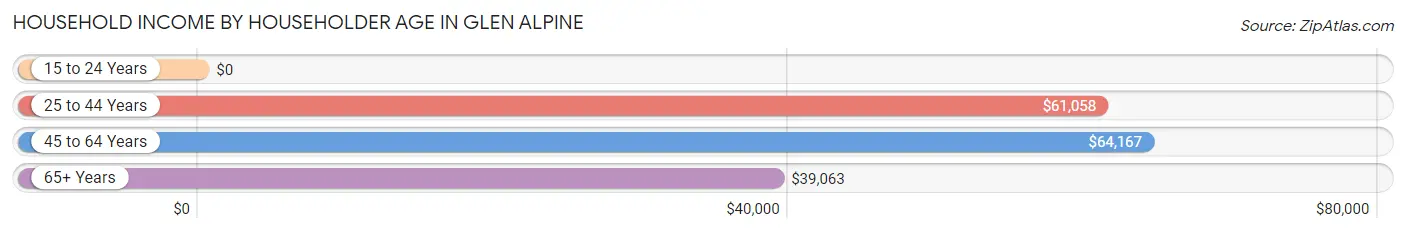
| Income Bracket | # Households | Median Income |
| 15 to 24 Years | 15 (2.2%) | $0 |
| 25 to 44 Years | 239 (34.4%) | $61,058 |
| 45 to 64 Years | 274 (39.5%) | $64,167 |
| 65+ Years | 166 (23.9%) | $39,063 |
| Total | 694 (100.0%) | $51,563 |
Poverty in Glen Alpine
Income Below Poverty by Sex and Age in Glen Alpine
With 7.2% poverty level for males and 14.5% for females among the residents of Glen Alpine, 6 to 11 year old males and 6 to 11 year old females are the most vulnerable to poverty, with 32 males (40.5%) and 41 females (45.1%) in their respective age groups living below the poverty level.
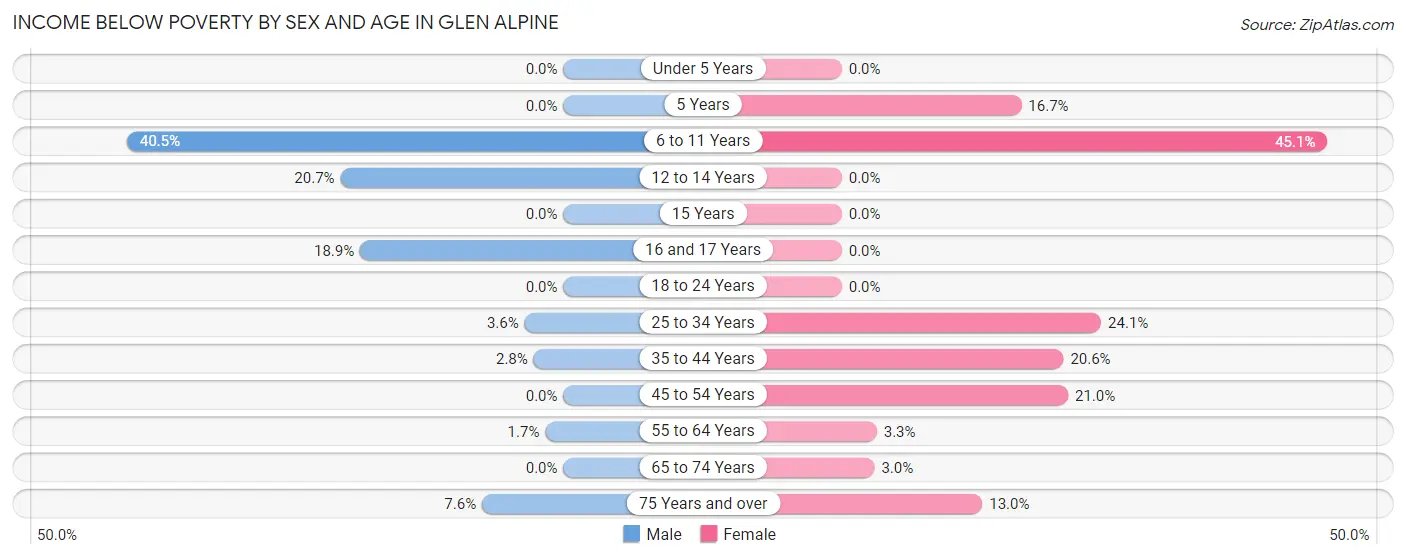
| Age Bracket | Male | Female |
| Under 5 Years | 0 (0.0%) | 0 (0.0%) |
| 5 Years | 0 (0.0%) | 2 (16.7%) |
| 6 to 11 Years | 32 (40.5%) | 41 (45.1%) |
| 12 to 14 Years | 12 (20.7%) | 0 (0.0%) |
| 15 Years | 0 (0.0%) | 0 (0.0%) |
| 16 and 17 Years | 10 (18.9%) | 0 (0.0%) |
| 18 to 24 Years | 0 (0.0%) | 0 (0.0%) |
| 25 to 34 Years | 4 (3.6%) | 13 (24.1%) |
| 35 to 44 Years | 4 (2.8%) | 43 (20.6%) |
| 45 to 54 Years | 0 (0.0%) | 21 (21.0%) |
| 55 to 64 Years | 3 (1.7%) | 4 (3.3%) |
| 65 to 74 Years | 0 (0.0%) | 3 (3.0%) |
| 75 Years and over | 4 (7.5%) | 3 (13.0%) |
| Total | 69 (7.2%) | 130 (14.5%) |
Income Above Poverty by Sex and Age in Glen Alpine
According to the poverty statistics in Glen Alpine, males aged under 5 years and females aged under 5 years are the age groups that are most secure financially, with 100.0% of males and 100.0% of females in these age groups living above the poverty line.
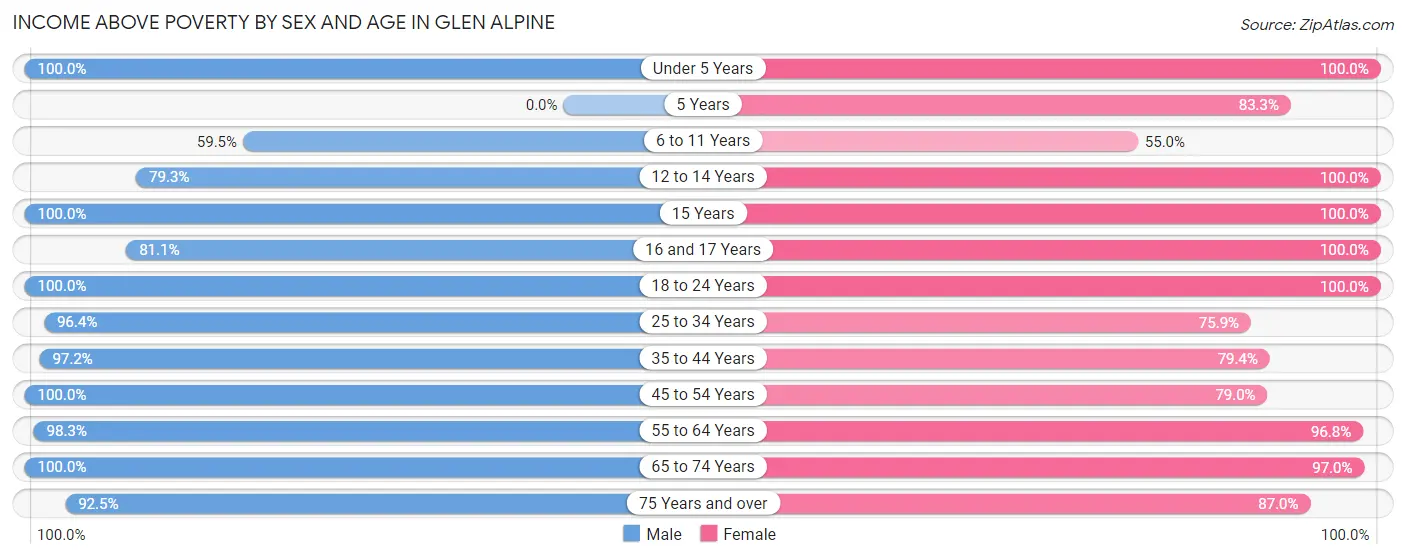
| Age Bracket | Male | Female |
| Under 5 Years | 54 (100.0%) | 47 (100.0%) |
| 5 Years | 0 (0.0%) | 10 (83.3%) |
| 6 to 11 Years | 47 (59.5%) | 50 (54.9%) |
| 12 to 14 Years | 46 (79.3%) | 16 (100.0%) |
| 15 Years | 8 (100.0%) | 11 (100.0%) |
| 16 and 17 Years | 43 (81.1%) | 23 (100.0%) |
| 18 to 24 Years | 56 (100.0%) | 88 (100.0%) |
| 25 to 34 Years | 107 (96.4%) | 41 (75.9%) |
| 35 to 44 Years | 141 (97.2%) | 166 (79.4%) |
| 45 to 54 Years | 97 (100.0%) | 79 (79.0%) |
| 55 to 64 Years | 176 (98.3%) | 119 (96.8%) |
| 65 to 74 Years | 71 (100.0%) | 96 (97.0%) |
| 75 Years and over | 49 (92.4%) | 20 (87.0%) |
| Total | 895 (92.8%) | 766 (85.5%) |
Income Below Poverty Among Married-Couple Families in Glen Alpine
The poverty statistics for married-couple families in Glen Alpine show that 1.1% or 4 of the total 357 families live below the poverty line. Families with no children have the highest poverty rate of 1.8%, comprising of 4 families. On the other hand, families with 1 or 2 children have the lowest poverty rate of 0.0%, which includes 0 families.
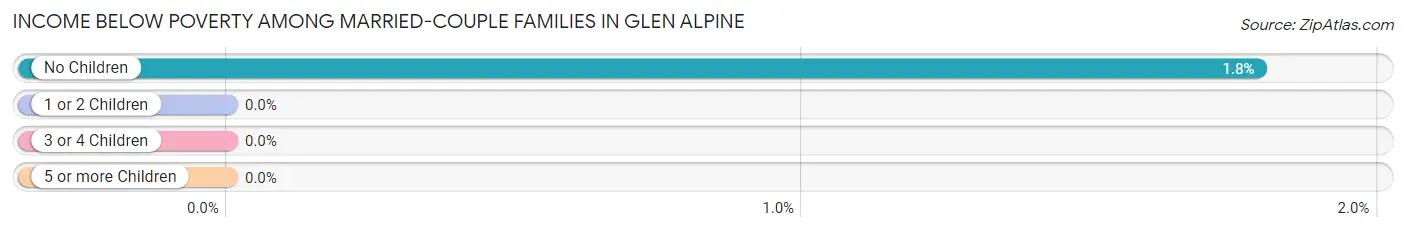
| Children | Above Poverty | Below Poverty |
| No Children | 219 (98.2%) | 4 (1.8%) |
| 1 or 2 Children | 101 (100.0%) | 0 (0.0%) |
| 3 or 4 Children | 33 (100.0%) | 0 (0.0%) |
| 5 or more Children | 0 (0.0%) | 0 (0.0%) |
| Total | 353 (98.9%) | 4 (1.1%) |
Income Below Poverty Among Single-Parent Households in Glen Alpine
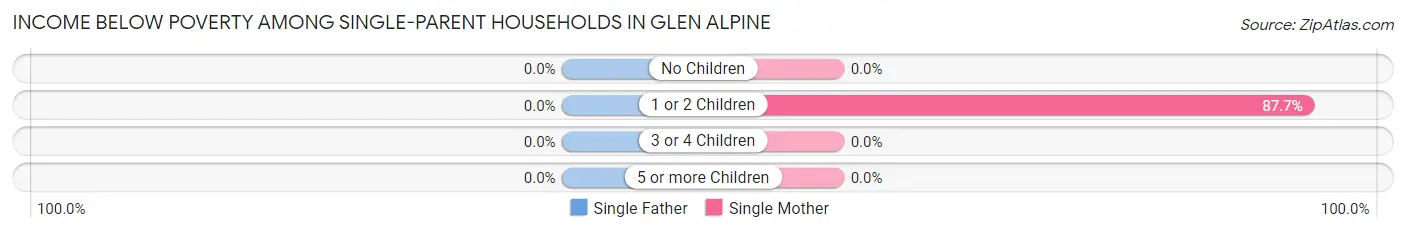
| Children | Single Father | Single Mother |
| No Children | 0 (0.0%) | 0 (0.0%) |
| 1 or 2 Children | 0 (0.0%) | 57 (87.7%) |
| 3 or 4 Children | 0 (0.0%) | 0 (0.0%) |
| 5 or more Children | 0 (0.0%) | 0 (0.0%) |
| Total | 0 (0.0%) | 57 (44.9%) |
Income Below Poverty Among Married-Couple vs Single-Parent Households in Glen Alpine
The poverty data for Glen Alpine shows that 4 of the married-couple family households (1.1%) and 57 of the single-parent households (39.3%) are living below the poverty level. Within the married-couple family households, those with no children have the highest poverty rate, with 4 households (1.8%) falling below the poverty line. Among the single-parent households, those with 1 or 2 children have the highest poverty rate, with 57 household (68.7%) living below poverty.
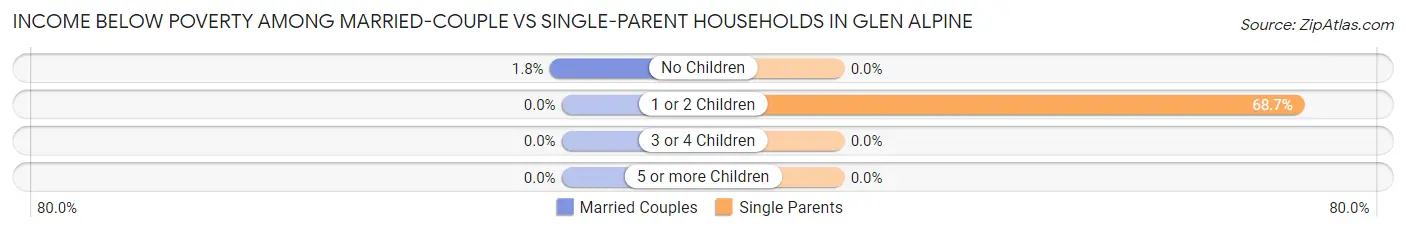
| Children | Married-Couple Families | Single-Parent Households |
| No Children | 4 (1.8%) | 0 (0.0%) |
| 1 or 2 Children | 0 (0.0%) | 57 (68.7%) |
| 3 or 4 Children | 0 (0.0%) | 0 (0.0%) |
| 5 or more Children | 0 (0.0%) | 0 (0.0%) |
| Total | 4 (1.1%) | 57 (39.3%) |
Employment Characteristics in Glen Alpine
Employment by Class of Employer in Glen Alpine
Among the 920 employed individuals in Glen Alpine, private company employees (599 | 65.1%), state government employees (98 | 10.6%), and local government employees (88 | 9.6%) make up the most common classes of employment.
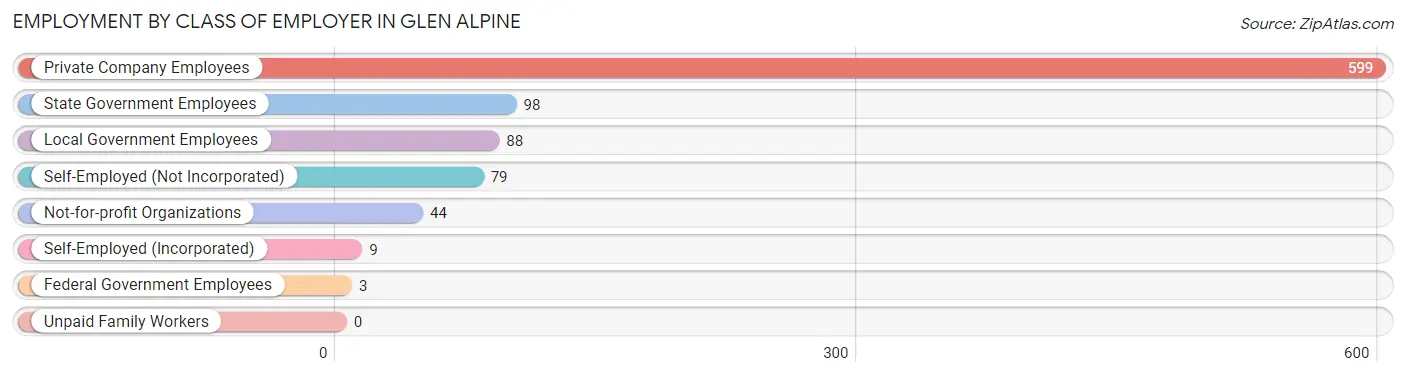
| Employer Class | # Employees | % Employees |
| Private Company Employees | 599 | 65.1% |
| Self-Employed (Incorporated) | 9 | 1.0% |
| Self-Employed (Not Incorporated) | 79 | 8.6% |
| Not-for-profit Organizations | 44 | 4.8% |
| Local Government Employees | 88 | 9.6% |
| State Government Employees | 98 | 10.6% |
| Federal Government Employees | 3 | 0.3% |
| Unpaid Family Workers | 0 | 0.0% |
| Total | 920 | 100.0% |
Employment Status by Age in Glen Alpine
According to the labor force statistics for Glen Alpine, out of the total population over 16 years of age (1,484), 64.7% or 960 individuals are in the labor force, with 4.2% or 40 of them unemployed. The age group with the highest labor force participation rate is 20 to 24 years, with 100.0% or 85 individuals in the labor force. Within the labor force, the 16 to 19 years age range has the highest percentage of unemployed individuals, with 33.9% or 20 of them being unemployed.
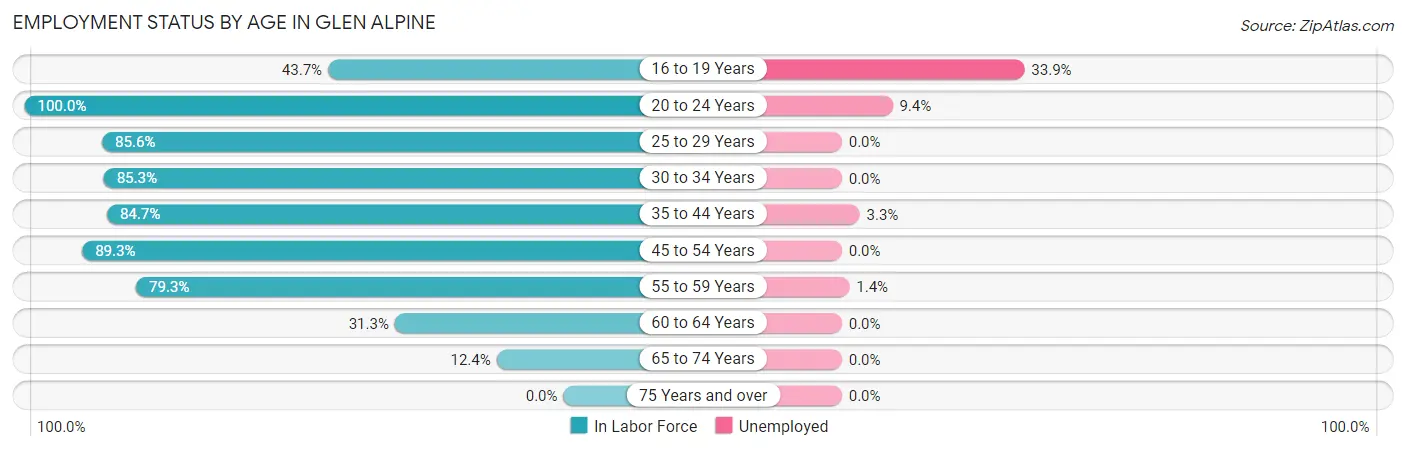
| Age Bracket | In Labor Force | Unemployed |
| 16 to 19 Years | 59 (43.7%) | 20 (33.9%) |
| 20 to 24 Years | 85 (100.0%) | 8 (9.4%) |
| 25 to 29 Years | 83 (85.6%) | 0 (0.0%) |
| 30 to 34 Years | 58 (85.3%) | 0 (0.0%) |
| 35 to 44 Years | 300 (84.7%) | 10 (3.3%) |
| 45 to 54 Years | 176 (89.3%) | 0 (0.0%) |
| 55 to 59 Years | 138 (79.3%) | 2 (1.4%) |
| 60 to 64 Years | 40 (31.3%) | 0 (0.0%) |
| 65 to 74 Years | 21 (12.4%) | 0 (0.0%) |
| 75 Years and over | 0 (0.0%) | 0 (0.0%) |
| Total | 960 (64.7%) | 40 (4.2%) |
Employment Status by Educational Attainment in Glen Alpine
According to labor force statistics for Glen Alpine, 78.1% of individuals (795) out of the total population between 25 and 64 years of age (1,018) are in the labor force, with 1.5% or 12 of them being unemployed. The group with the highest labor force participation rate are those with the educational attainment of bachelor's degree or higher, with 88.8% or 237 individuals in the labor force. Within the labor force, individuals with high school diploma education have the highest percentage of unemployment, with 3.8% or 10 of them being unemployed.
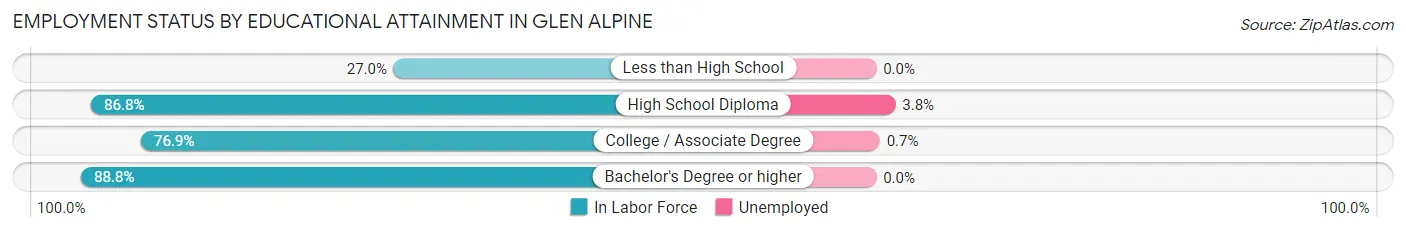
| Educational Attainment | In Labor Force | Unemployed |
| Less than High School | 27 (27.0%) | 0 (0.0%) |
| High School Diploma | 264 (86.8%) | 12 (3.8%) |
| College / Associate Degree | 267 (76.9%) | 2 (0.7%) |
| Bachelor's Degree or higher | 237 (88.8%) | 0 (0.0%) |
| Total | 795 (78.1%) | 15 (1.5%) |
Employment Occupations by Sex in Glen Alpine
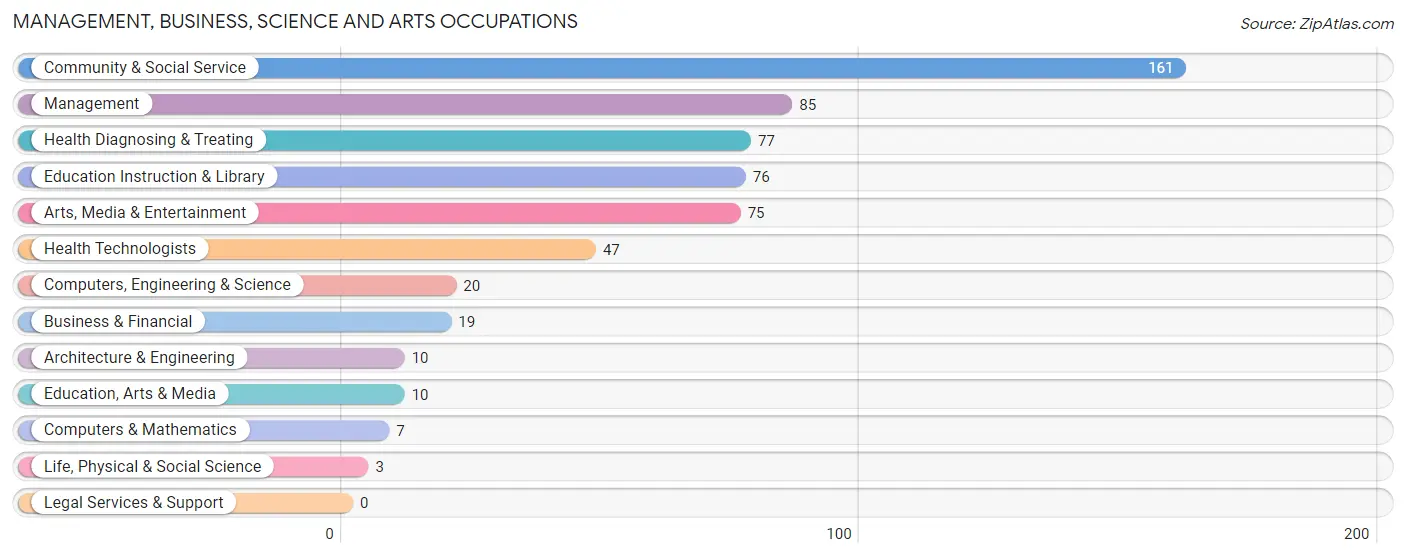
Management, Business, Science and Arts Occupations
The most common Management, Business, Science and Arts occupations in Glen Alpine are Community & Social Service (161 | 17.5%), Management (85 | 9.2%), Health Diagnosing & Treating (77 | 8.4%), Education Instruction & Library (76 | 8.3%), and Arts, Media & Entertainment (75 | 8.2%).
Management, Business, Science and Arts Occupations by Sex
Within the Management, Business, Science and Arts occupations in Glen Alpine, the most male-oriented occupations are Architecture & Engineering (100.0%), Arts, Media & Entertainment (90.7%), and Computers, Engineering & Science (65.0%), while the most female-oriented occupations are Life, Physical & Social Science (100.0%), Education, Arts & Media (100.0%), and Health Technologists (93.6%).
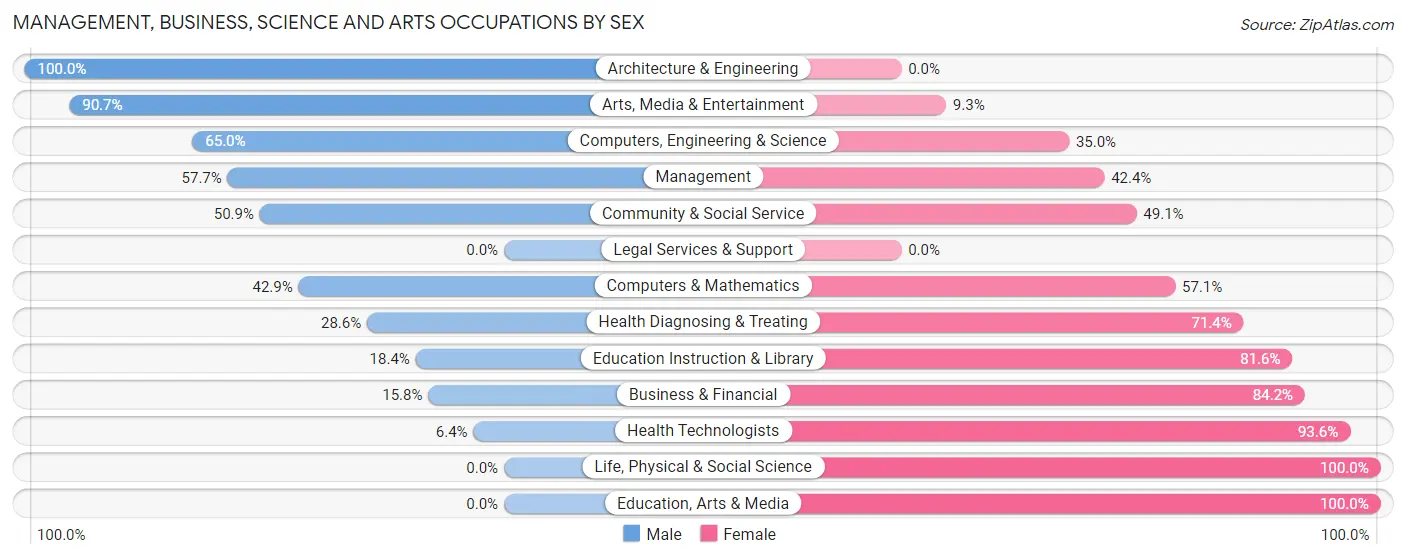
| Occupation | Male | Female |
| Management | 49 (57.7%) | 36 (42.3%) |
| Business & Financial | 3 (15.8%) | 16 (84.2%) |
| Computers, Engineering & Science | 13 (65.0%) | 7 (35.0%) |
| Computers & Mathematics | 3 (42.9%) | 4 (57.1%) |
| Architecture & Engineering | 10 (100.0%) | 0 (0.0%) |
| Life, Physical & Social Science | 0 (0.0%) | 3 (100.0%) |
| Community & Social Service | 82 (50.9%) | 79 (49.1%) |
| Education, Arts & Media | 0 (0.0%) | 10 (100.0%) |
| Legal Services & Support | 0 (0.0%) | 0 (0.0%) |
| Education Instruction & Library | 14 (18.4%) | 62 (81.6%) |
| Arts, Media & Entertainment | 68 (90.7%) | 7 (9.3%) |
| Health Diagnosing & Treating | 22 (28.6%) | 55 (71.4%) |
| Health Technologists | 3 (6.4%) | 44 (93.6%) |
| Total (Category) | 169 (46.7%) | 193 (53.3%) |
| Total (Overall) | 474 (51.5%) | 446 (48.5%) |
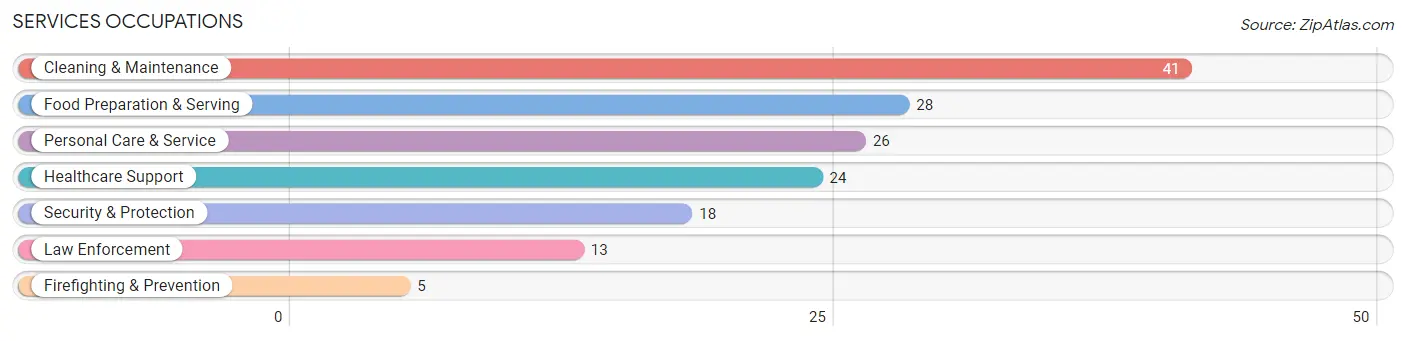
Services Occupations
The most common Services occupations in Glen Alpine are Cleaning & Maintenance (41 | 4.5%), Food Preparation & Serving (28 | 3.0%), Personal Care & Service (26 | 2.8%), Healthcare Support (24 | 2.6%), and Security & Protection (18 | 2.0%).
Services Occupations by Sex
Within the Services occupations in Glen Alpine, the most male-oriented occupations are Law Enforcement (100.0%), Security & Protection (72.2%), and Cleaning & Maintenance (39.0%), while the most female-oriented occupations are Firefighting & Prevention (100.0%), Personal Care & Service (84.6%), and Healthcare Support (75.0%).
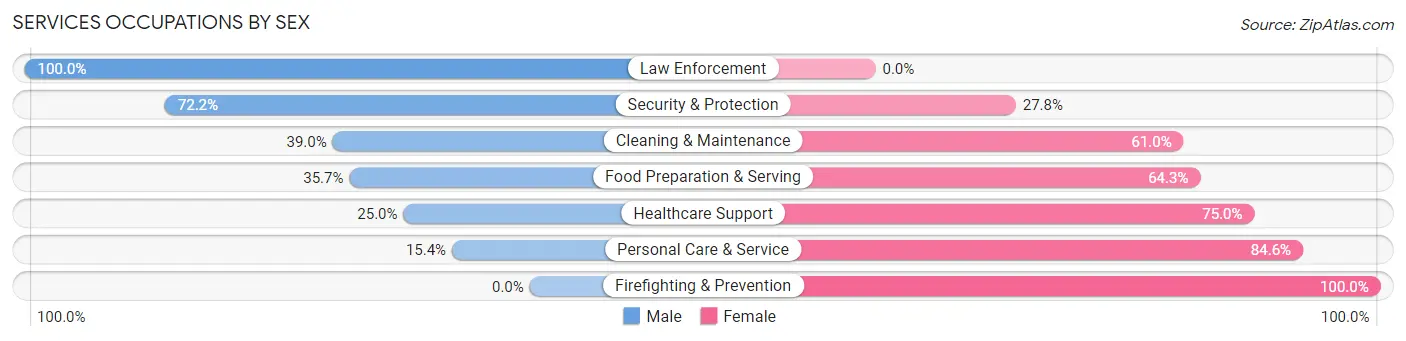
| Occupation | Male | Female |
| Healthcare Support | 6 (25.0%) | 18 (75.0%) |
| Security & Protection | 13 (72.2%) | 5 (27.8%) |
| Firefighting & Prevention | 0 (0.0%) | 5 (100.0%) |
| Law Enforcement | 13 (100.0%) | 0 (0.0%) |
| Food Preparation & Serving | 10 (35.7%) | 18 (64.3%) |
| Cleaning & Maintenance | 16 (39.0%) | 25 (61.0%) |
| Personal Care & Service | 4 (15.4%) | 22 (84.6%) |
| Total (Category) | 49 (35.8%) | 88 (64.2%) |
| Total (Overall) | 474 (51.5%) | 446 (48.5%) |
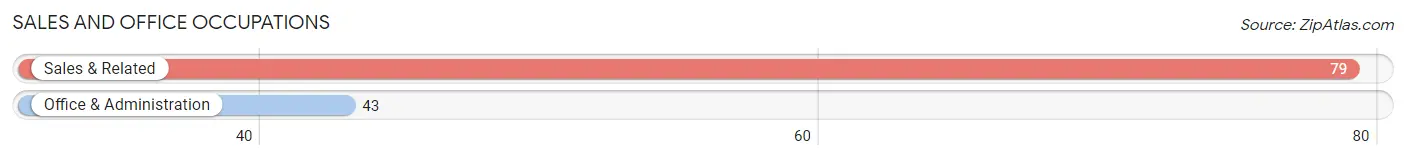
Sales and Office Occupations
The most common Sales and Office occupations in Glen Alpine are Sales & Related (79 | 8.6%), and Office & Administration (43 | 4.7%).
Sales and Office Occupations by Sex
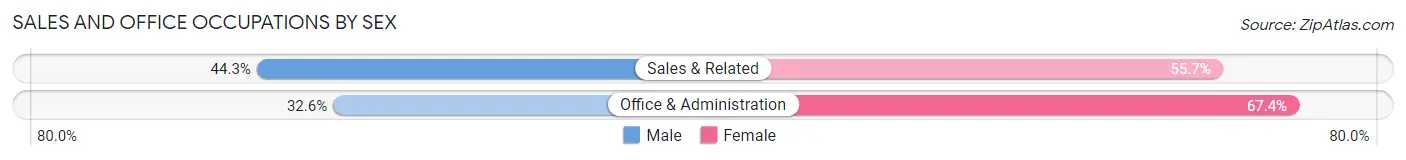
| Occupation | Male | Female |
| Sales & Related | 35 (44.3%) | 44 (55.7%) |
| Office & Administration | 14 (32.6%) | 29 (67.4%) |
| Total (Category) | 49 (40.2%) | 73 (59.8%) |
| Total (Overall) | 474 (51.5%) | 446 (48.5%) |
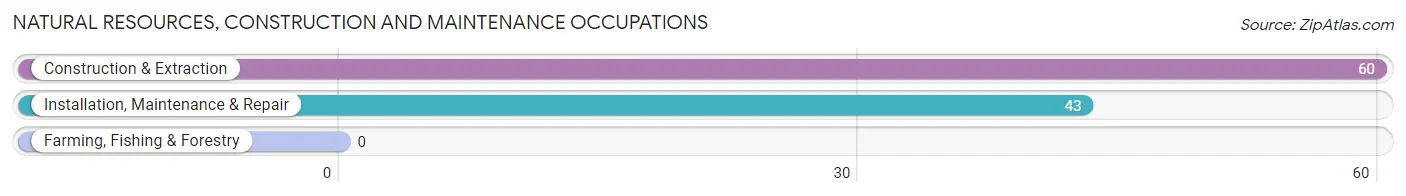
Natural Resources, Construction and Maintenance Occupations
The most common Natural Resources, Construction and Maintenance occupations in Glen Alpine are Construction & Extraction (60 | 6.5%), and Installation, Maintenance & Repair (43 | 4.7%).
Natural Resources, Construction and Maintenance Occupations by Sex
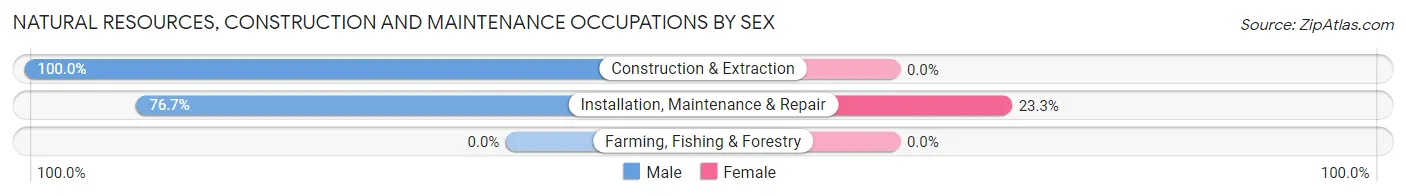
| Occupation | Male | Female |
| Farming, Fishing & Forestry | 0 (0.0%) | 0 (0.0%) |
| Construction & Extraction | 60 (100.0%) | 0 (0.0%) |
| Installation, Maintenance & Repair | 33 (76.7%) | 10 (23.3%) |
| Total (Category) | 93 (90.3%) | 10 (9.7%) |
| Total (Overall) | 474 (51.5%) | 446 (48.5%) |
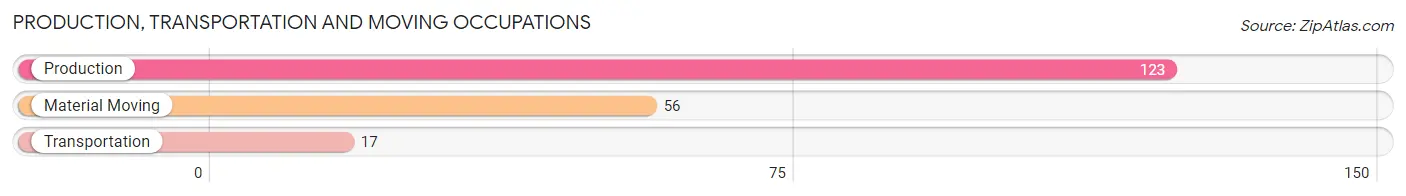
Production, Transportation and Moving Occupations
The most common Production, Transportation and Moving occupations in Glen Alpine are Production (123 | 13.4%), Material Moving (56 | 6.1%), and Transportation (17 | 1.8%).
Production, Transportation and Moving Occupations by Sex
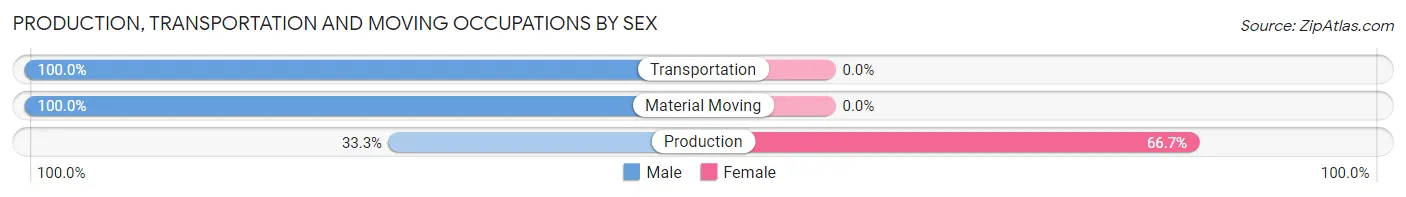
| Occupation | Male | Female |
| Production | 41 (33.3%) | 82 (66.7%) |
| Transportation | 17 (100.0%) | 0 (0.0%) |
| Material Moving | 56 (100.0%) | 0 (0.0%) |
| Total (Category) | 114 (58.2%) | 82 (41.8%) |
| Total (Overall) | 474 (51.5%) | 446 (48.5%) |
Employment Industries by Sex in Glen Alpine
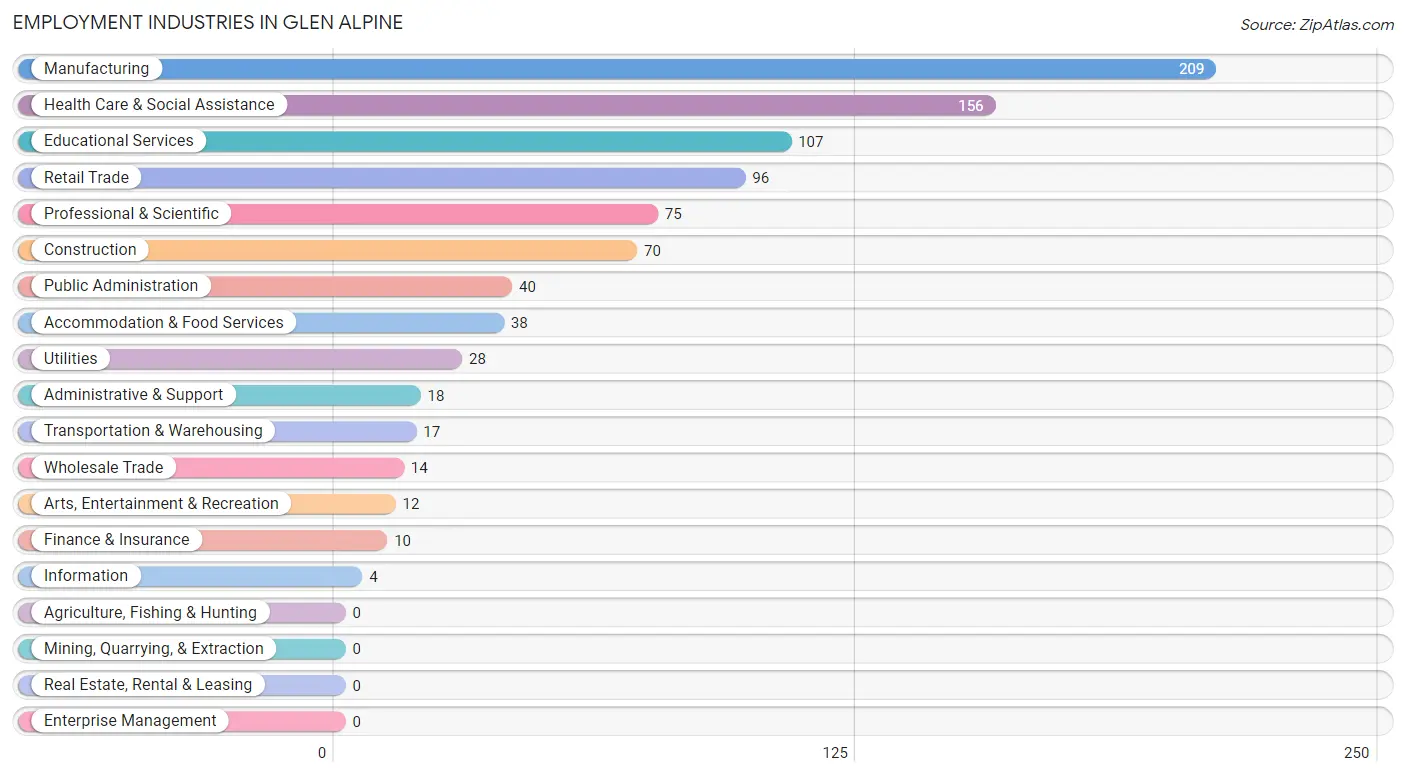
Employment Industries in Glen Alpine
The major employment industries in Glen Alpine include Manufacturing (209 | 22.7%), Health Care & Social Assistance (156 | 17.0%), Educational Services (107 | 11.6%), Retail Trade (96 | 10.4%), and Professional & Scientific (75 | 8.2%).
Employment Industries by Sex in Glen Alpine
The Glen Alpine industries that see more men than women are Construction (100.0%), Transportation & Warehousing (100.0%), and Utilities (100.0%), whereas the industries that tend to have a higher number of women are Finance & Insurance (100.0%), Educational Services (87.8%), and Wholesale Trade (78.6%).
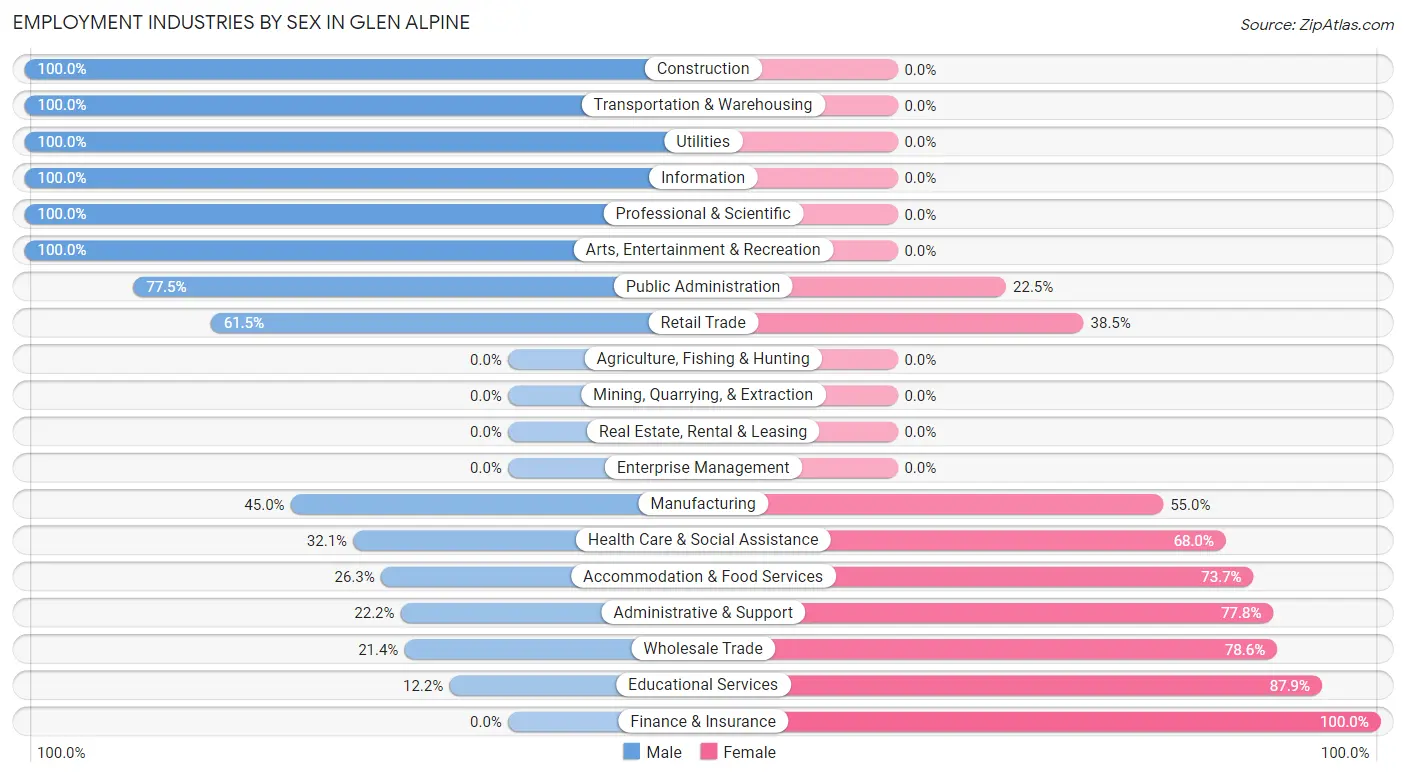
| Industry | Male | Female |
| Agriculture, Fishing & Hunting | 0 (0.0%) | 0 (0.0%) |
| Mining, Quarrying, & Extraction | 0 (0.0%) | 0 (0.0%) |
| Construction | 70 (100.0%) | 0 (0.0%) |
| Manufacturing | 94 (45.0%) | 115 (55.0%) |
| Wholesale Trade | 3 (21.4%) | 11 (78.6%) |
| Retail Trade | 59 (61.5%) | 37 (38.5%) |
| Transportation & Warehousing | 17 (100.0%) | 0 (0.0%) |
| Utilities | 28 (100.0%) | 0 (0.0%) |
| Information | 4 (100.0%) | 0 (0.0%) |
| Finance & Insurance | 0 (0.0%) | 10 (100.0%) |
| Real Estate, Rental & Leasing | 0 (0.0%) | 0 (0.0%) |
| Professional & Scientific | 75 (100.0%) | 0 (0.0%) |
| Enterprise Management | 0 (0.0%) | 0 (0.0%) |
| Administrative & Support | 4 (22.2%) | 14 (77.8%) |
| Educational Services | 13 (12.1%) | 94 (87.8%) |
| Health Care & Social Assistance | 50 (32.1%) | 106 (67.9%) |
| Arts, Entertainment & Recreation | 12 (100.0%) | 0 (0.0%) |
| Accommodation & Food Services | 10 (26.3%) | 28 (73.7%) |
| Public Administration | 31 (77.5%) | 9 (22.5%) |
| Total | 474 (51.5%) | 446 (48.5%) |
Education in Glen Alpine
School Enrollment in Glen Alpine
The most common levels of schooling among the 467 students in Glen Alpine are middle school (131 | 28.1%), high school (106 | 22.7%), and elementary school (91 | 19.5%).
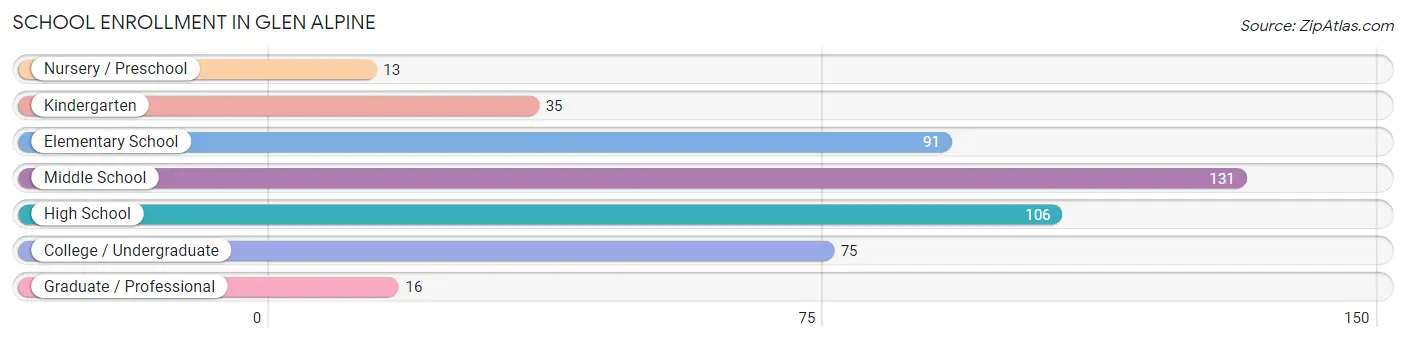
| School Level | # Students | % Students |
| Nursery / Preschool | 13 | 2.8% |
| Kindergarten | 35 | 7.5% |
| Elementary School | 91 | 19.5% |
| Middle School | 131 | 28.1% |
| High School | 106 | 22.7% |
| College / Undergraduate | 75 | 16.1% |
| Graduate / Professional | 16 | 3.4% |
| Total | 467 | 100.0% |
School Enrollment by Age by Funding Source in Glen Alpine
Out of a total of 467 students who are enrolled in schools in Glen Alpine, 35 (7.5%) attend a private institution, while the remaining 432 (92.5%) are enrolled in public schools. The age group of 3 to 4 year olds has the highest likelihood of being enrolled in private schools, with 13 (100.0% in the age bracket) enrolled. Conversely, the age group of 15 to 17 year olds has the lowest likelihood of being enrolled in a private school, with 95 (100.0% in the age bracket) attending a public institution.
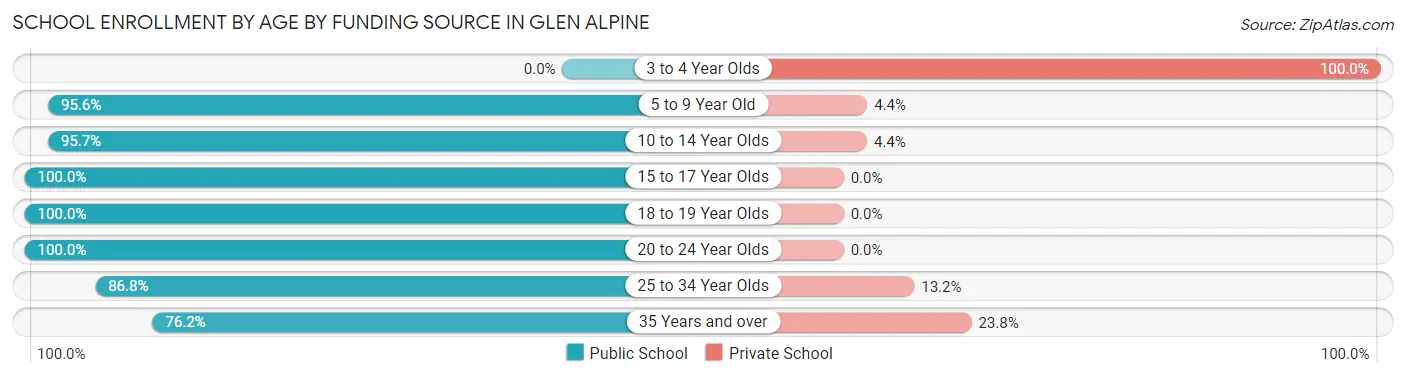
| Age Bracket | Public School | Private School |
| 3 to 4 Year Olds | 0 (0.0%) | 13 (100.0%) |
| 5 to 9 Year Old | 109 (95.6%) | 5 (4.4%) |
| 10 to 14 Year Olds | 154 (95.7%) | 7 (4.3%) |
| 15 to 17 Year Olds | 95 (100.0%) | 0 (0.0%) |
| 18 to 19 Year Olds | 14 (100.0%) | 0 (0.0%) |
| 20 to 24 Year Olds | 11 (100.0%) | 0 (0.0%) |
| 25 to 34 Year Olds | 33 (86.8%) | 5 (13.2%) |
| 35 Years and over | 16 (76.2%) | 5 (23.8%) |
| Total | 432 (92.5%) | 35 (7.5%) |
Educational Attainment by Field of Study in Glen Alpine
Computers & mathematics (75 | 23.4%), education (58 | 18.1%), science & technology (55 | 17.2%), arts & humanities (47 | 14.7%), and business (28 | 8.7%) are the most common fields of study among 320 individuals in Glen Alpine who have obtained a bachelor's degree or higher.
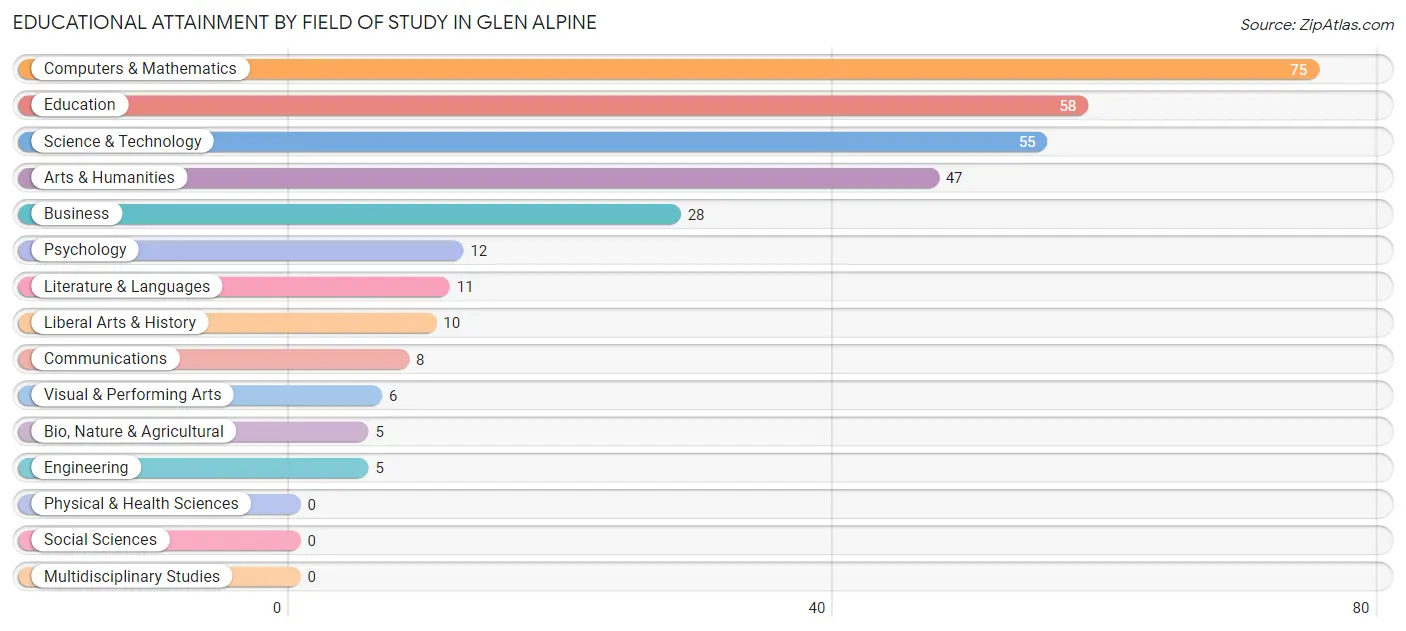
| Field of Study | # Graduates | % Graduates |
| Computers & Mathematics | 75 | 23.4% |
| Bio, Nature & Agricultural | 5 | 1.6% |
| Physical & Health Sciences | 0 | 0.0% |
| Psychology | 12 | 3.7% |
| Social Sciences | 0 | 0.0% |
| Engineering | 5 | 1.6% |
| Multidisciplinary Studies | 0 | 0.0% |
| Science & Technology | 55 | 17.2% |
| Business | 28 | 8.7% |
| Education | 58 | 18.1% |
| Literature & Languages | 11 | 3.4% |
| Liberal Arts & History | 10 | 3.1% |
| Visual & Performing Arts | 6 | 1.9% |
| Communications | 8 | 2.5% |
| Arts & Humanities | 47 | 14.7% |
| Total | 320 | 100.0% |
Transportation & Commute in Glen Alpine
Vehicle Availability by Sex in Glen Alpine
The most prevalent vehicle ownership categories in Glen Alpine are males with 2 vehicles (185, accounting for 39.0%) and females with 2 vehicles (198, making up 41.5%).
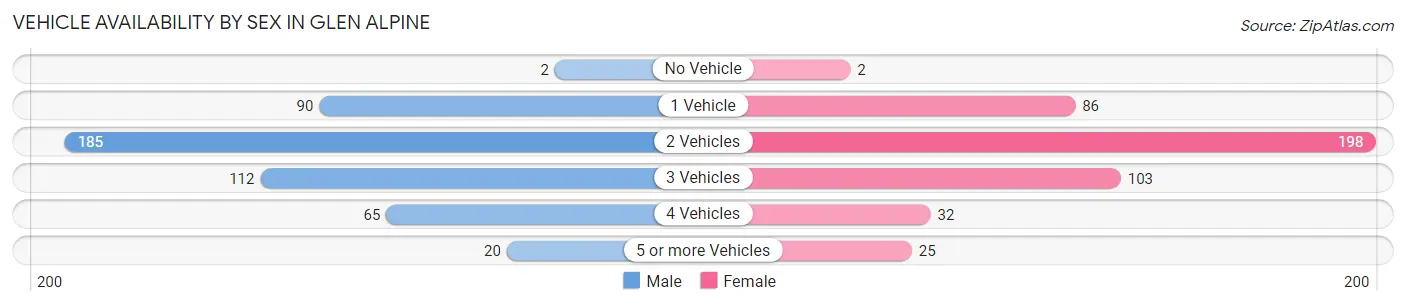
| Vehicles Available | Male | Female |
| No Vehicle | 2 (0.4%) | 2 (0.4%) |
| 1 Vehicle | 90 (19.0%) | 86 (19.3%) |
| 2 Vehicles | 185 (39.0%) | 198 (44.4%) |
| 3 Vehicles | 112 (23.6%) | 103 (23.1%) |
| 4 Vehicles | 65 (13.7%) | 32 (7.2%) |
| 5 or more Vehicles | 20 (4.2%) | 25 (5.6%) |
| Total | 474 (100.0%) | 446 (100.0%) |
Commute Time in Glen Alpine
The most frequently occuring commute durations in Glen Alpine are 15 to 19 minutes (189 commuters, 22.5%), 20 to 24 minutes (112 commuters, 13.3%), and 10 to 14 minutes (109 commuters, 13.0%).
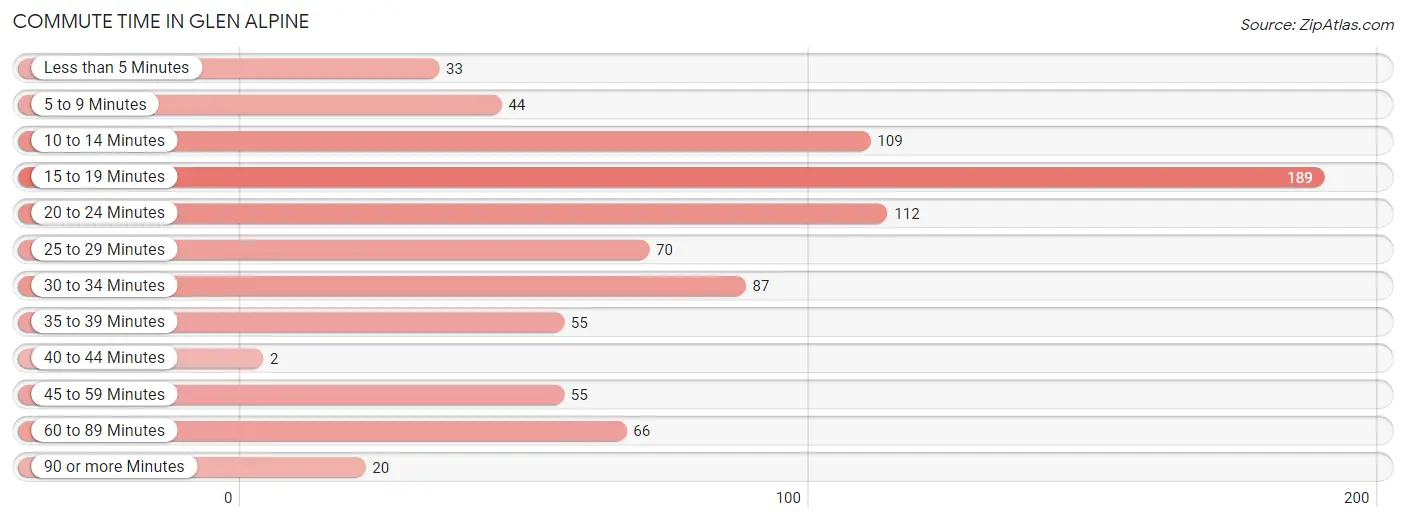
| Commute Time | # Commuters | % Commuters |
| Less than 5 Minutes | 33 | 3.9% |
| 5 to 9 Minutes | 44 | 5.2% |
| 10 to 14 Minutes | 109 | 13.0% |
| 15 to 19 Minutes | 189 | 22.5% |
| 20 to 24 Minutes | 112 | 13.3% |
| 25 to 29 Minutes | 70 | 8.3% |
| 30 to 34 Minutes | 87 | 10.3% |
| 35 to 39 Minutes | 55 | 6.5% |
| 40 to 44 Minutes | 2 | 0.2% |
| 45 to 59 Minutes | 55 | 6.5% |
| 60 to 89 Minutes | 66 | 7.8% |
| 90 or more Minutes | 20 | 2.4% |
Commute Time by Sex in Glen Alpine
The most common commute times in Glen Alpine are 15 to 19 minutes (97 commuters, 23.7%) for males and 15 to 19 minutes (92 commuters, 21.2%) for females.
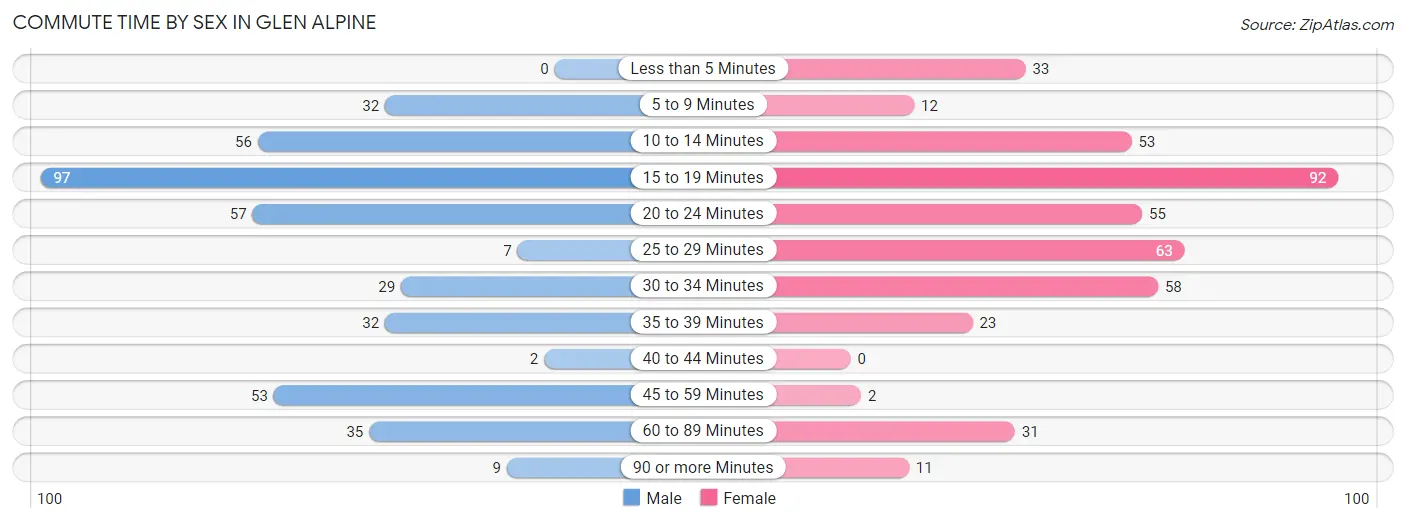
| Commute Time | Male | Female |
| Less than 5 Minutes | 0 (0.0%) | 33 (7.6%) |
| 5 to 9 Minutes | 32 (7.8%) | 12 (2.8%) |
| 10 to 14 Minutes | 56 (13.7%) | 53 (12.2%) |
| 15 to 19 Minutes | 97 (23.7%) | 92 (21.2%) |
| 20 to 24 Minutes | 57 (13.9%) | 55 (12.7%) |
| 25 to 29 Minutes | 7 (1.7%) | 63 (14.5%) |
| 30 to 34 Minutes | 29 (7.1%) | 58 (13.4%) |
| 35 to 39 Minutes | 32 (7.8%) | 23 (5.3%) |
| 40 to 44 Minutes | 2 (0.5%) | 0 (0.0%) |
| 45 to 59 Minutes | 53 (13.0%) | 2 (0.5%) |
| 60 to 89 Minutes | 35 (8.6%) | 31 (7.2%) |
| 90 or more Minutes | 9 (2.2%) | 11 (2.5%) |
Time of Departure to Work by Sex in Glen Alpine
The most frequent times of departure to work in Glen Alpine are 7:00 AM to 7:29 AM (111, 27.1%) for males and 7:00 AM to 7:29 AM (89, 20.5%) for females.
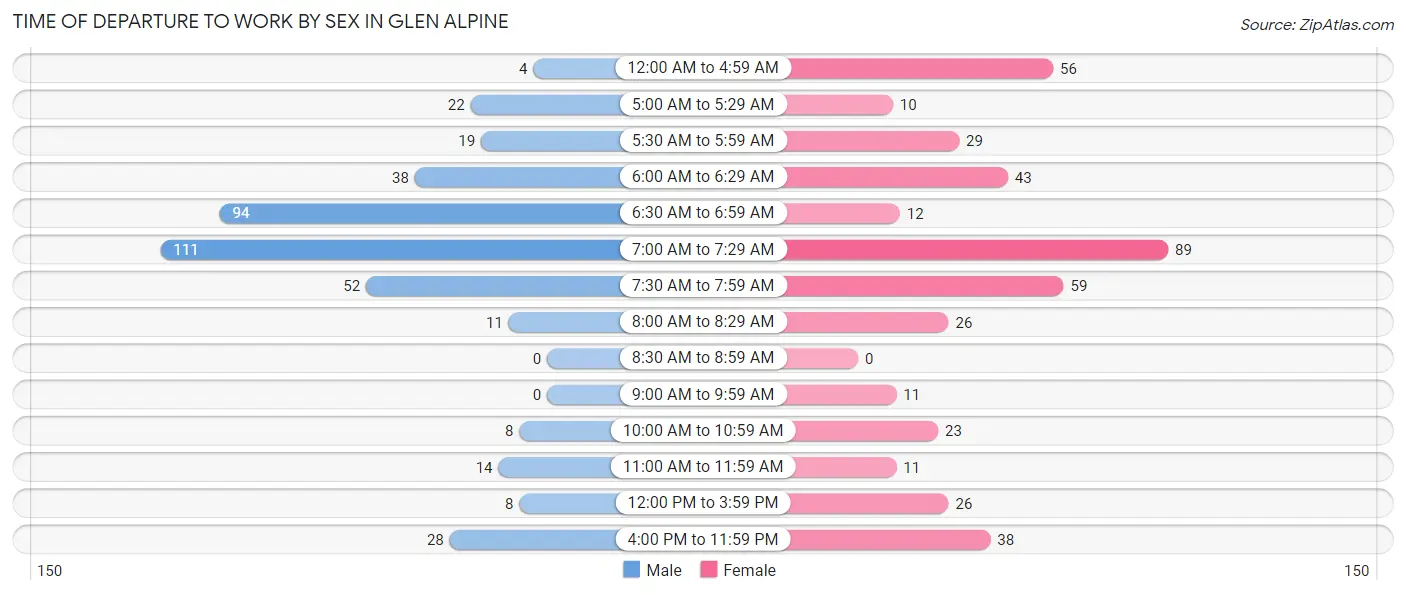
| Time of Departure | Male | Female |
| 12:00 AM to 4:59 AM | 4 (1.0%) | 56 (12.9%) |
| 5:00 AM to 5:29 AM | 22 (5.4%) | 10 (2.3%) |
| 5:30 AM to 5:59 AM | 19 (4.6%) | 29 (6.7%) |
| 6:00 AM to 6:29 AM | 38 (9.3%) | 43 (9.9%) |
| 6:30 AM to 6:59 AM | 94 (23.0%) | 12 (2.8%) |
| 7:00 AM to 7:29 AM | 111 (27.1%) | 89 (20.5%) |
| 7:30 AM to 7:59 AM | 52 (12.7%) | 59 (13.6%) |
| 8:00 AM to 8:29 AM | 11 (2.7%) | 26 (6.0%) |
| 8:30 AM to 8:59 AM | 0 (0.0%) | 0 (0.0%) |
| 9:00 AM to 9:59 AM | 0 (0.0%) | 11 (2.5%) |
| 10:00 AM to 10:59 AM | 8 (2.0%) | 23 (5.3%) |
| 11:00 AM to 11:59 AM | 14 (3.4%) | 11 (2.5%) |
| 12:00 PM to 3:59 PM | 8 (2.0%) | 26 (6.0%) |
| 4:00 PM to 11:59 PM | 28 (6.9%) | 38 (8.8%) |
| Total | 409 (100.0%) | 433 (100.0%) |
Housing Occupancy in Glen Alpine
Occupancy by Ownership in Glen Alpine
Of the total 694 dwellings in Glen Alpine, owner-occupied units account for 569 (82.0%), while renter-occupied units make up 125 (18.0%).
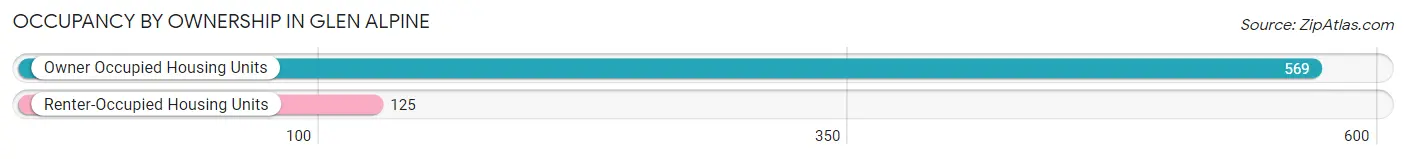
| Occupancy | # Housing Units | % Housing Units |
| Owner Occupied Housing Units | 569 | 82.0% |
| Renter-Occupied Housing Units | 125 | 18.0% |
| Total Occupied Housing Units | 694 | 100.0% |
Occupancy by Household Size in Glen Alpine
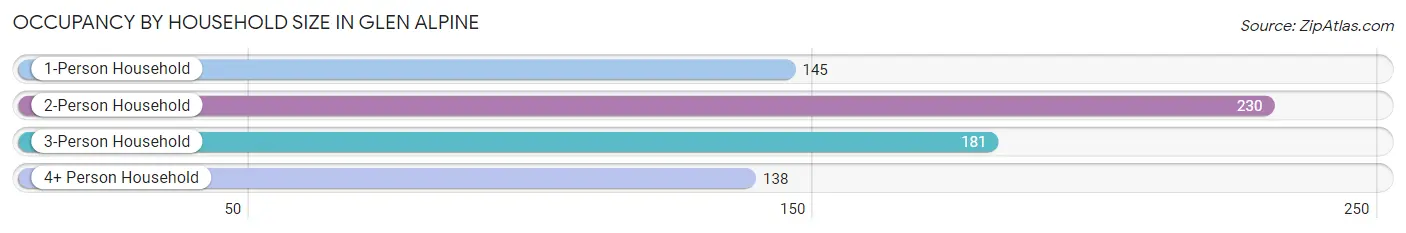
| Household Size | # Housing Units | % Housing Units |
| 1-Person Household | 145 | 20.9% |
| 2-Person Household | 230 | 33.1% |
| 3-Person Household | 181 | 26.1% |
| 4+ Person Household | 138 | 19.9% |
| Total Housing Units | 694 | 100.0% |
Occupancy by Ownership by Household Size in Glen Alpine
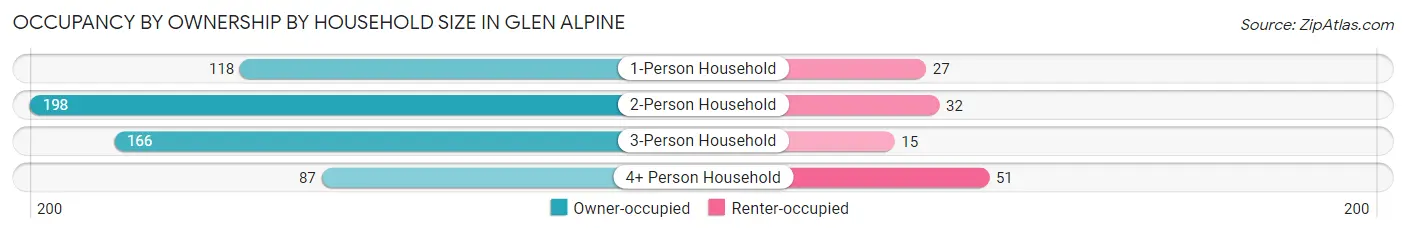
| Household Size | Owner-occupied | Renter-occupied |
| 1-Person Household | 118 (81.4%) | 27 (18.6%) |
| 2-Person Household | 198 (86.1%) | 32 (13.9%) |
| 3-Person Household | 166 (91.7%) | 15 (8.3%) |
| 4+ Person Household | 87 (63.0%) | 51 (37.0%) |
| Total Housing Units | 569 (82.0%) | 125 (18.0%) |
Occupancy by Educational Attainment in Glen Alpine
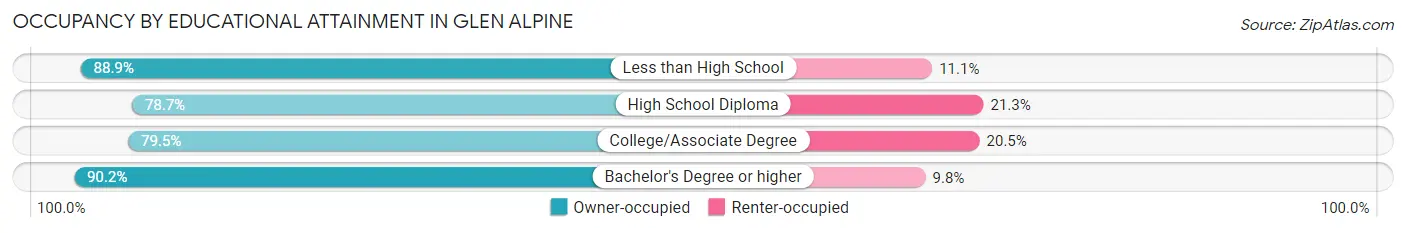
| Household Size | Owner-occupied | Renter-occupied |
| Less than High School | 24 (88.9%) | 3 (11.1%) |
| High School Diploma | 159 (78.7%) | 43 (21.3%) |
| College/Associate Degree | 248 (79.5%) | 64 (20.5%) |
| Bachelor's Degree or higher | 138 (90.2%) | 15 (9.8%) |
Occupancy by Age of Householder in Glen Alpine
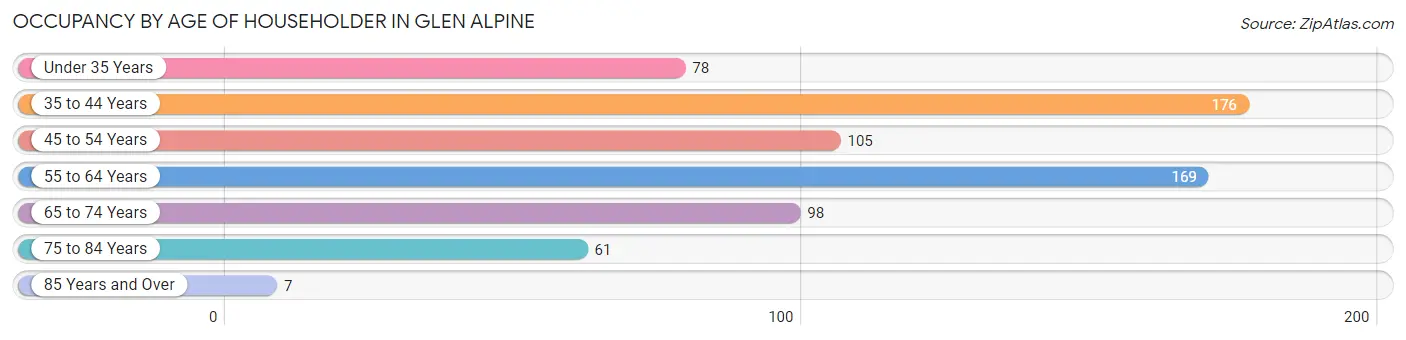
| Age Bracket | # Households | % Households |
| Under 35 Years | 78 | 11.2% |
| 35 to 44 Years | 176 | 25.4% |
| 45 to 54 Years | 105 | 15.1% |
| 55 to 64 Years | 169 | 24.3% |
| 65 to 74 Years | 98 | 14.1% |
| 75 to 84 Years | 61 | 8.8% |
| 85 Years and Over | 7 | 1.0% |
| Total | 694 | 100.0% |
Housing Finances in Glen Alpine
Median Income by Occupancy in Glen Alpine
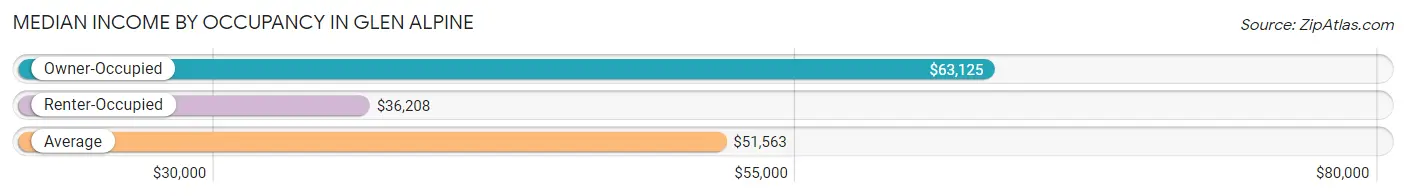
| Occupancy Type | # Households | Median Income |
| Owner-Occupied | 569 (82.0%) | $63,125 |
| Renter-Occupied | 125 (18.0%) | $36,208 |
| Average | 694 (100.0%) | $51,563 |
Occupancy by Householder Income Bracket in Glen Alpine
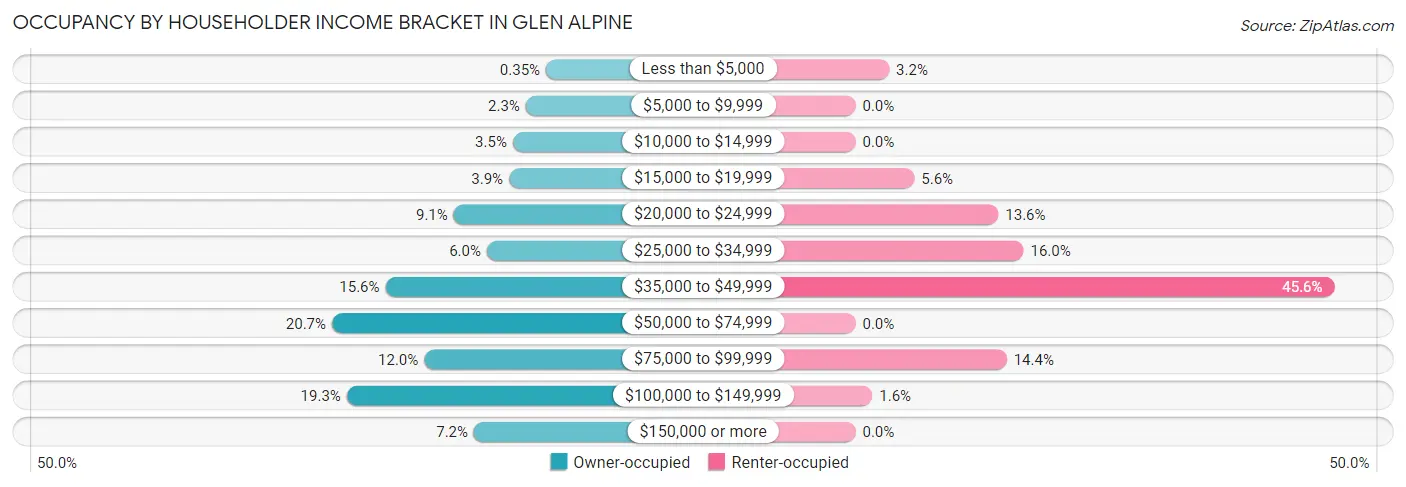
| Income Bracket | Owner-occupied | Renter-occupied |
| Less than $5,000 | 2 (0.4%) | 4 (3.2%) |
| $5,000 to $9,999 | 13 (2.3%) | 0 (0.0%) |
| $10,000 to $14,999 | 20 (3.5%) | 0 (0.0%) |
| $15,000 to $19,999 | 22 (3.9%) | 7 (5.6%) |
| $20,000 to $24,999 | 52 (9.1%) | 17 (13.6%) |
| $25,000 to $34,999 | 34 (6.0%) | 20 (16.0%) |
| $35,000 to $49,999 | 89 (15.6%) | 57 (45.6%) |
| $50,000 to $74,999 | 118 (20.7%) | 0 (0.0%) |
| $75,000 to $99,999 | 68 (11.9%) | 18 (14.4%) |
| $100,000 to $149,999 | 110 (19.3%) | 2 (1.6%) |
| $150,000 or more | 41 (7.2%) | 0 (0.0%) |
| Total | 569 (100.0%) | 125 (100.0%) |
Monthly Housing Cost Tiers in Glen Alpine
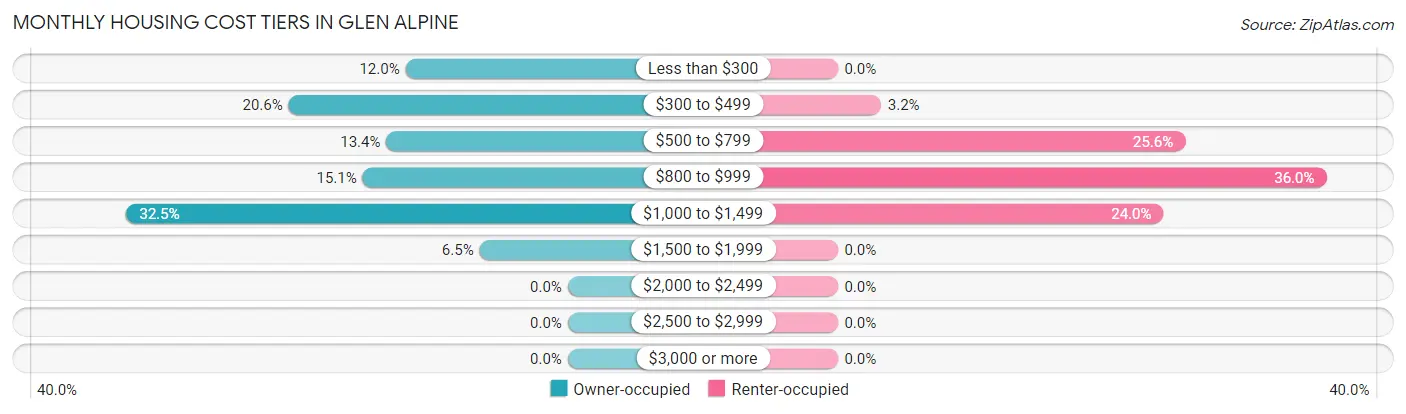
| Monthly Cost | Owner-occupied | Renter-occupied |
| Less than $300 | 68 (11.9%) | 0 (0.0%) |
| $300 to $499 | 117 (20.6%) | 4 (3.2%) |
| $500 to $799 | 76 (13.4%) | 32 (25.6%) |
| $800 to $999 | 86 (15.1%) | 45 (36.0%) |
| $1,000 to $1,499 | 185 (32.5%) | 30 (24.0%) |
| $1,500 to $1,999 | 37 (6.5%) | 0 (0.0%) |
| $2,000 to $2,499 | 0 (0.0%) | 0 (0.0%) |
| $2,500 to $2,999 | 0 (0.0%) | 0 (0.0%) |
| $3,000 or more | 0 (0.0%) | 0 (0.0%) |
| Total | 569 (100.0%) | 125 (100.0%) |
Physical Housing Characteristics in Glen Alpine
Housing Structures in Glen Alpine
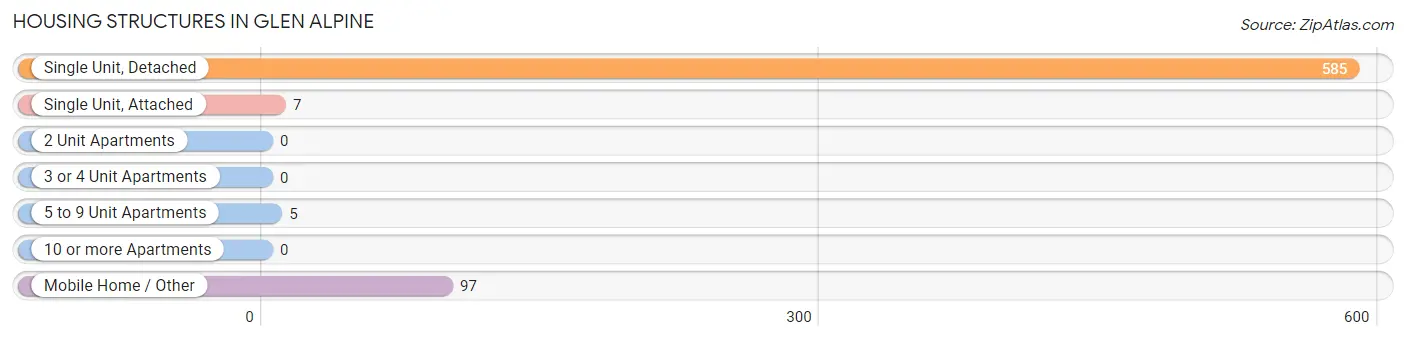
| Structure Type | # Housing Units | % Housing Units |
| Single Unit, Detached | 585 | 84.3% |
| Single Unit, Attached | 7 | 1.0% |
| 2 Unit Apartments | 0 | 0.0% |
| 3 or 4 Unit Apartments | 0 | 0.0% |
| 5 to 9 Unit Apartments | 5 | 0.7% |
| 10 or more Apartments | 0 | 0.0% |
| Mobile Home / Other | 97 | 14.0% |
| Total | 694 | 100.0% |
Housing Structures by Occupancy in Glen Alpine
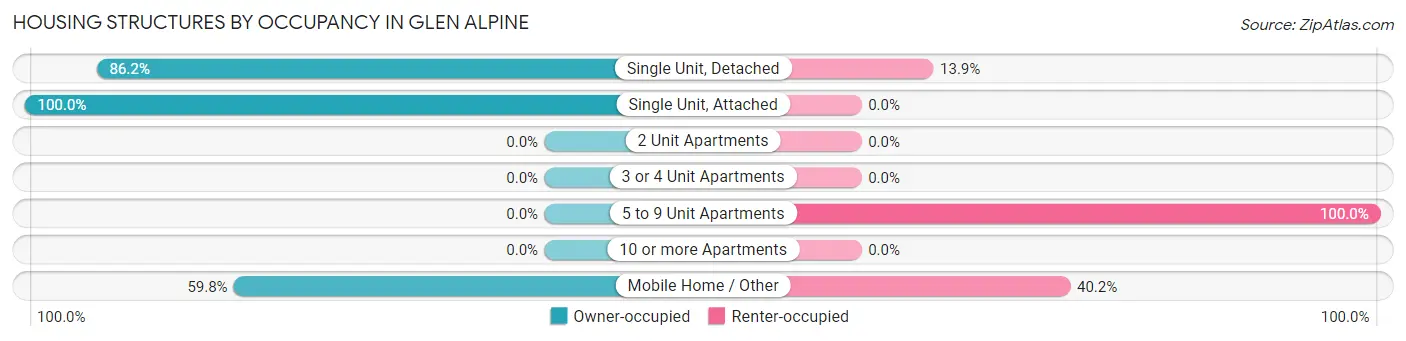
| Structure Type | Owner-occupied | Renter-occupied |
| Single Unit, Detached | 504 (86.2%) | 81 (13.9%) |
| Single Unit, Attached | 7 (100.0%) | 0 (0.0%) |
| 2 Unit Apartments | 0 (0.0%) | 0 (0.0%) |
| 3 or 4 Unit Apartments | 0 (0.0%) | 0 (0.0%) |
| 5 to 9 Unit Apartments | 0 (0.0%) | 5 (100.0%) |
| 10 or more Apartments | 0 (0.0%) | 0 (0.0%) |
| Mobile Home / Other | 58 (59.8%) | 39 (40.2%) |
| Total | 569 (82.0%) | 125 (18.0%) |
Housing Structures by Number of Rooms in Glen Alpine
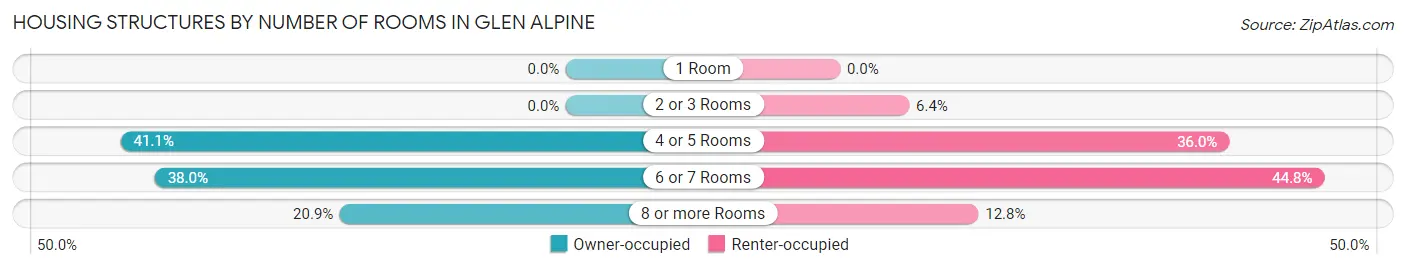
| Number of Rooms | Owner-occupied | Renter-occupied |
| 1 Room | 0 (0.0%) | 0 (0.0%) |
| 2 or 3 Rooms | 0 (0.0%) | 8 (6.4%) |
| 4 or 5 Rooms | 234 (41.1%) | 45 (36.0%) |
| 6 or 7 Rooms | 216 (38.0%) | 56 (44.8%) |
| 8 or more Rooms | 119 (20.9%) | 16 (12.8%) |
| Total | 569 (100.0%) | 125 (100.0%) |
Housing Structure by Heating Type in Glen Alpine
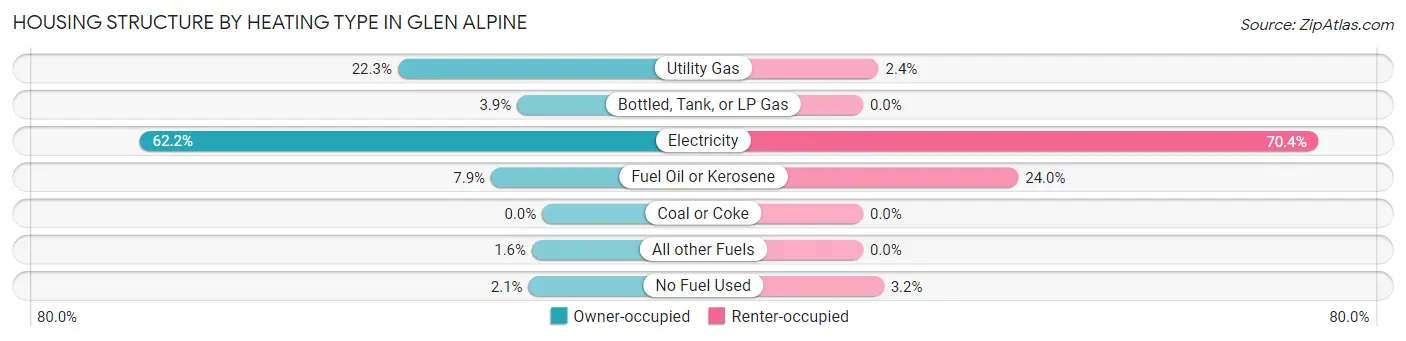
| Heating Type | Owner-occupied | Renter-occupied |
| Utility Gas | 127 (22.3%) | 3 (2.4%) |
| Bottled, Tank, or LP Gas | 22 (3.9%) | 0 (0.0%) |
| Electricity | 354 (62.2%) | 88 (70.4%) |
| Fuel Oil or Kerosene | 45 (7.9%) | 30 (24.0%) |
| Coal or Coke | 0 (0.0%) | 0 (0.0%) |
| All other Fuels | 9 (1.6%) | 0 (0.0%) |
| No Fuel Used | 12 (2.1%) | 4 (3.2%) |
| Total | 569 (100.0%) | 125 (100.0%) |
Household Vehicle Usage in Glen Alpine
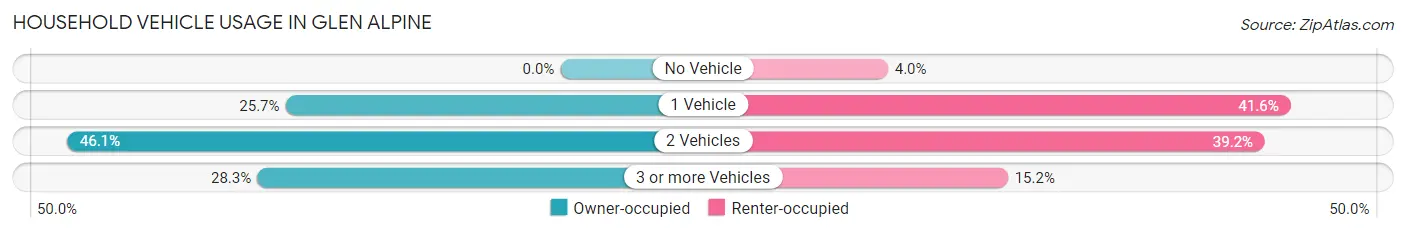
| Vehicles per Household | Owner-occupied | Renter-occupied |
| No Vehicle | 0 (0.0%) | 5 (4.0%) |
| 1 Vehicle | 146 (25.7%) | 52 (41.6%) |
| 2 Vehicles | 262 (46.1%) | 49 (39.2%) |
| 3 or more Vehicles | 161 (28.3%) | 19 (15.2%) |
| Total | 569 (100.0%) | 125 (100.0%) |
Real Estate & Mortgages in Glen Alpine
Real Estate and Mortgage Overview in Glen Alpine
| Characteristic | Without Mortgage | With Mortgage |
| Housing Units | 242 | 327 |
| Median Property Value | $114,500 | $172,100 |
| Median Household Income | $43,810 | $29 |
| Monthly Housing Costs | $423 | $0 |
| Real Estate Taxes | $855 | $16 |
Property Value by Mortgage Status in Glen Alpine
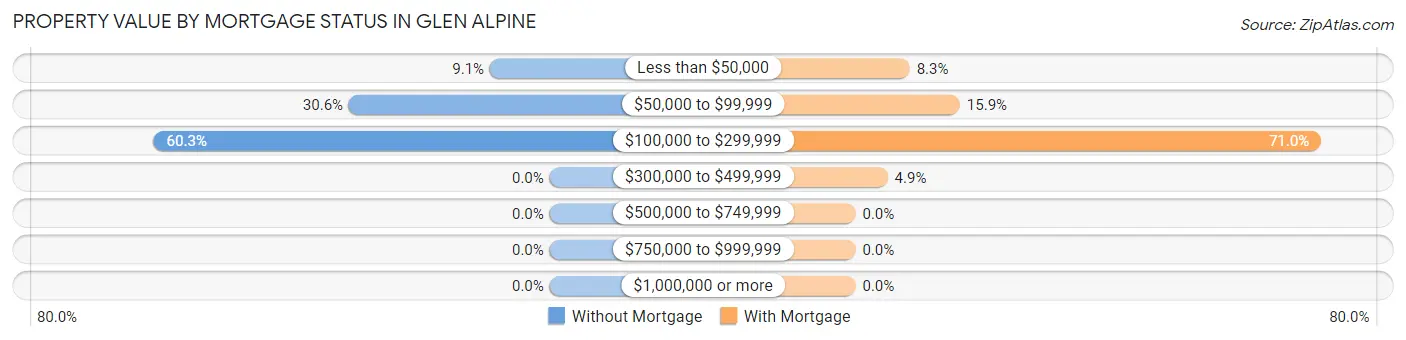
| Property Value | Without Mortgage | With Mortgage |
| Less than $50,000 | 22 (9.1%) | 27 (8.3%) |
| $50,000 to $99,999 | 74 (30.6%) | 52 (15.9%) |
| $100,000 to $299,999 | 146 (60.3%) | 232 (71.0%) |
| $300,000 to $499,999 | 0 (0.0%) | 16 (4.9%) |
| $500,000 to $749,999 | 0 (0.0%) | 0 (0.0%) |
| $750,000 to $999,999 | 0 (0.0%) | 0 (0.0%) |
| $1,000,000 or more | 0 (0.0%) | 0 (0.0%) |
| Total | 242 (100.0%) | 327 (100.0%) |
Household Income by Mortgage Status in Glen Alpine
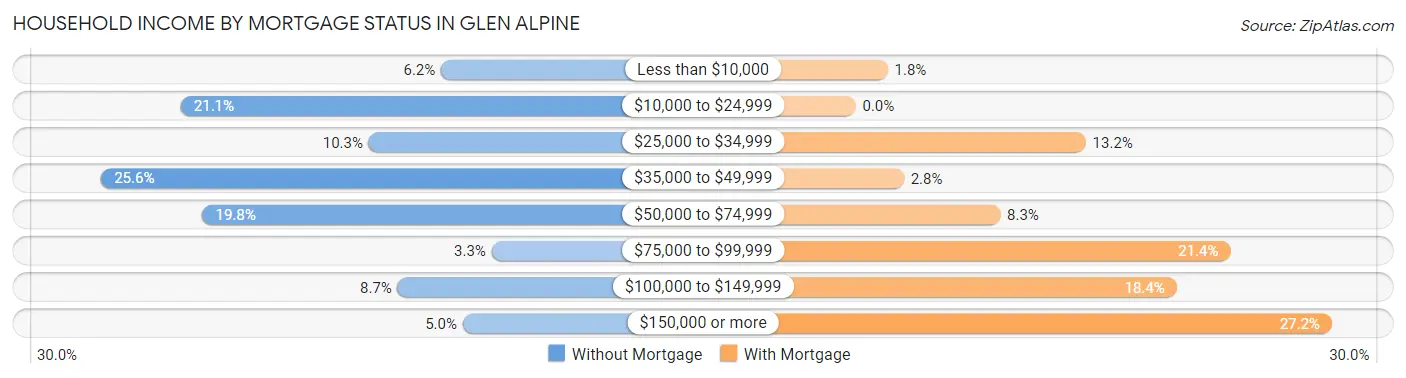
| Household Income | Without Mortgage | With Mortgage |
| Less than $10,000 | 15 (6.2%) | 6 (1.8%) |
| $10,000 to $24,999 | 51 (21.1%) | 0 (0.0%) |
| $25,000 to $34,999 | 25 (10.3%) | 43 (13.2%) |
| $35,000 to $49,999 | 62 (25.6%) | 9 (2.8%) |
| $50,000 to $74,999 | 48 (19.8%) | 27 (8.3%) |
| $75,000 to $99,999 | 8 (3.3%) | 70 (21.4%) |
| $100,000 to $149,999 | 21 (8.7%) | 60 (18.3%) |
| $150,000 or more | 12 (5.0%) | 89 (27.2%) |
| Total | 242 (100.0%) | 327 (100.0%) |
Property Value to Household Income Ratio in Glen Alpine
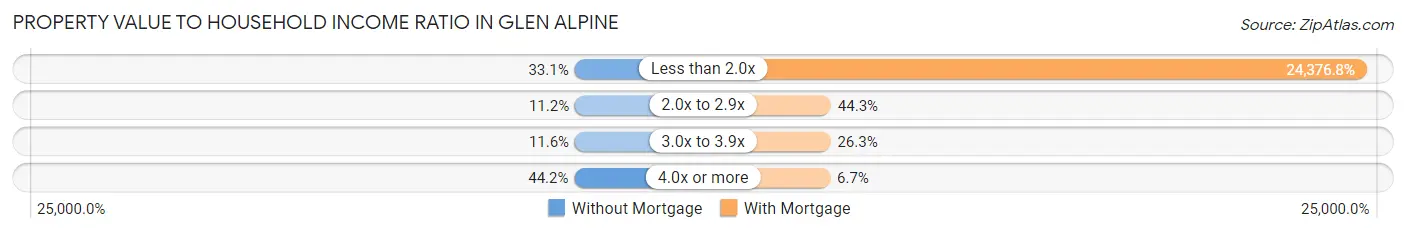
| Value-to-Income Ratio | Without Mortgage | With Mortgage |
| Less than 2.0x | 80 (33.1%) | 79,712 (24,376.8%) |
| 2.0x to 2.9x | 27 (11.2%) | 145 (44.3%) |
| 3.0x to 3.9x | 28 (11.6%) | 86 (26.3%) |
| 4.0x or more | 107 (44.2%) | 22 (6.7%) |
| Total | 242 (100.0%) | 327 (100.0%) |
Real Estate Taxes by Mortgage Status in Glen Alpine
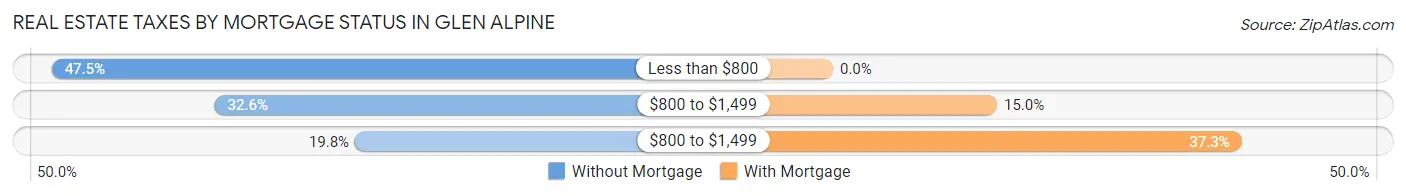
| Property Taxes | Without Mortgage | With Mortgage |
| Less than $800 | 115 (47.5%) | 0 (0.0%) |
| $800 to $1,499 | 79 (32.6%) | 49 (15.0%) |
| $800 to $1,499 | 48 (19.8%) | 122 (37.3%) |
| Total | 242 (100.0%) | 327 (100.0%) |
Health & Disability in Glen Alpine
Health Insurance Coverage by Age in Glen Alpine
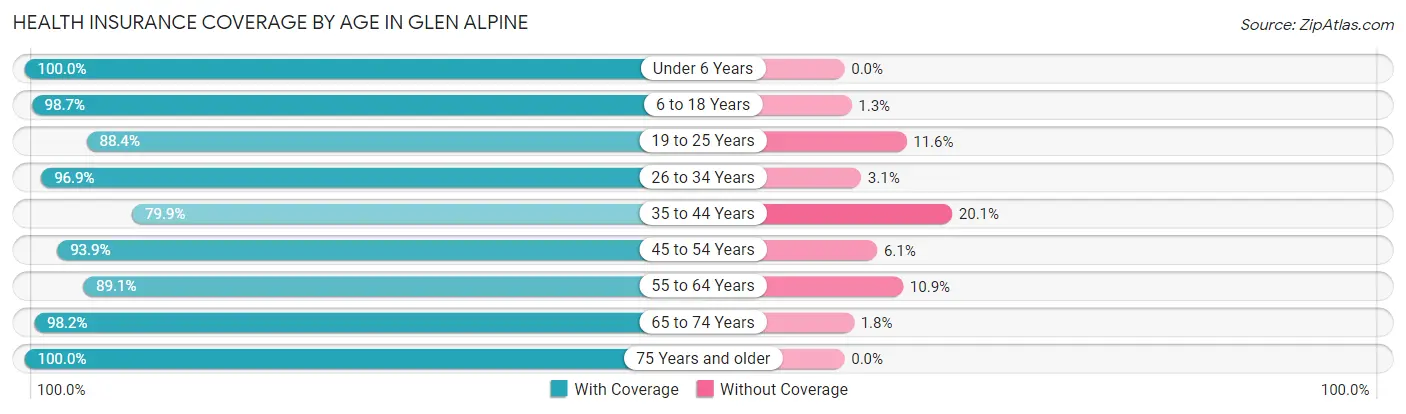
| Age Bracket | With Coverage | Without Coverage |
| Under 6 Years | 113 (100.0%) | 0 (0.0%) |
| 6 to 18 Years | 377 (98.7%) | 5 (1.3%) |
| 19 to 25 Years | 153 (88.4%) | 20 (11.6%) |
| 26 to 34 Years | 125 (96.9%) | 4 (3.1%) |
| 35 to 44 Years | 283 (79.9%) | 71 (20.1%) |
| 45 to 54 Years | 185 (93.9%) | 12 (6.1%) |
| 55 to 64 Years | 269 (89.1%) | 33 (10.9%) |
| 65 to 74 Years | 167 (98.2%) | 3 (1.8%) |
| 75 Years and older | 76 (100.0%) | 0 (0.0%) |
| Total | 1,748 (92.2%) | 148 (7.8%) |
Health Insurance Coverage by Citizenship Status in Glen Alpine
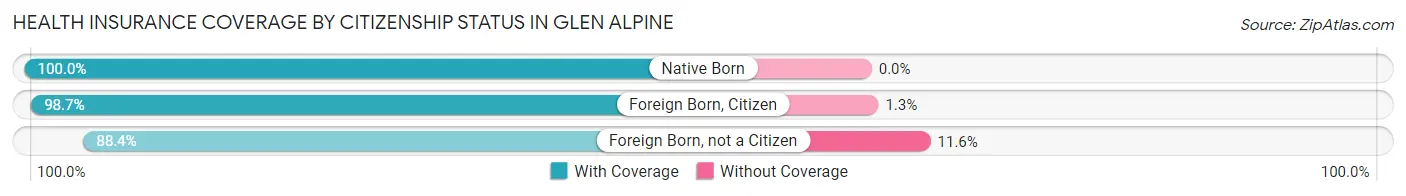
| Citizenship Status | With Coverage | Without Coverage |
| Native Born | 113 (100.0%) | 0 (0.0%) |
| Foreign Born, Citizen | 377 (98.7%) | 5 (1.3%) |
| Foreign Born, not a Citizen | 153 (88.4%) | 20 (11.6%) |
Health Insurance Coverage by Household Income in Glen Alpine
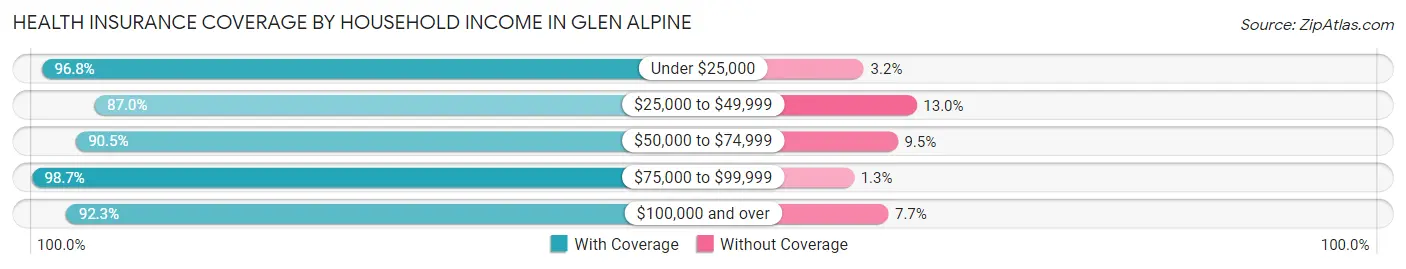
| Household Income | With Coverage | Without Coverage |
| Under $25,000 | 245 (96.8%) | 8 (3.2%) |
| $25,000 to $49,999 | 347 (87.0%) | 52 (13.0%) |
| $50,000 to $74,999 | 353 (90.5%) | 37 (9.5%) |
| $75,000 to $99,999 | 230 (98.7%) | 3 (1.3%) |
| $100,000 and over | 573 (92.3%) | 48 (7.7%) |
Public vs Private Health Insurance Coverage by Age in Glen Alpine
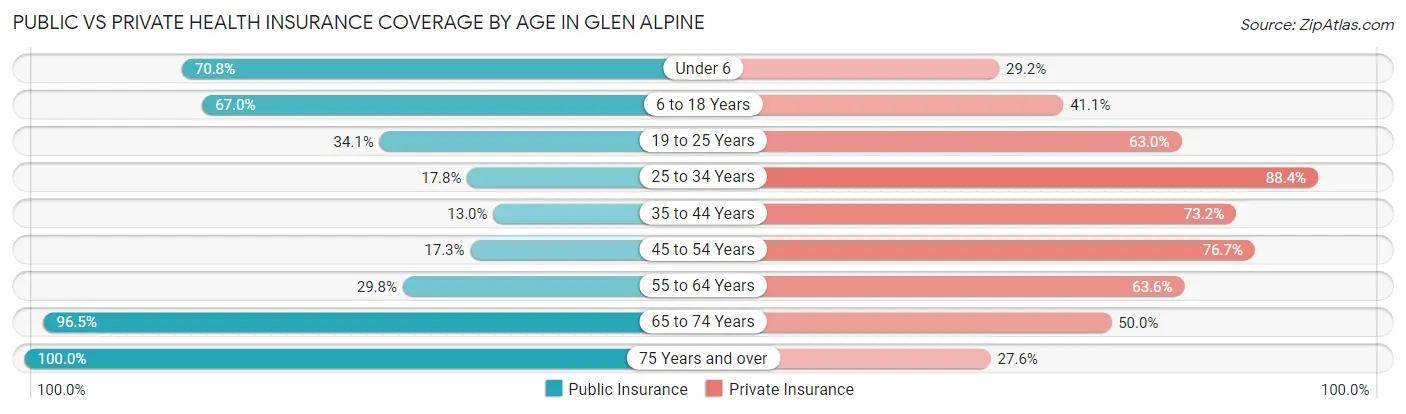
| Age Bracket | Public Insurance | Private Insurance |
| Under 6 | 80 (70.8%) | 33 (29.2%) |
| 6 to 18 Years | 256 (67.0%) | 157 (41.1%) |
| 19 to 25 Years | 59 (34.1%) | 109 (63.0%) |
| 25 to 34 Years | 23 (17.8%) | 114 (88.4%) |
| 35 to 44 Years | 46 (13.0%) | 259 (73.2%) |
| 45 to 54 Years | 34 (17.3%) | 151 (76.6%) |
| 55 to 64 Years | 90 (29.8%) | 192 (63.6%) |
| 65 to 74 Years | 164 (96.5%) | 85 (50.0%) |
| 75 Years and over | 76 (100.0%) | 21 (27.6%) |
| Total | 828 (43.7%) | 1,121 (59.1%) |
Disability Status by Sex by Age in Glen Alpine
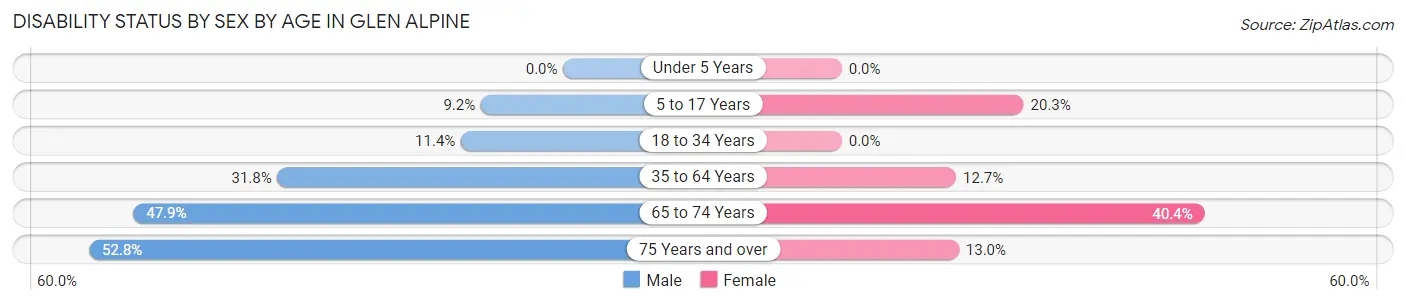
| Age Bracket | Male | Female |
| Under 5 Years | 0 (0.0%) | 0 (0.0%) |
| 5 to 17 Years | 21 (9.2%) | 32 (20.3%) |
| 18 to 34 Years | 19 (11.4%) | 0 (0.0%) |
| 35 to 64 Years | 134 (31.8%) | 55 (12.7%) |
| 65 to 74 Years | 34 (47.9%) | 40 (40.4%) |
| 75 Years and over | 28 (52.8%) | 3 (13.0%) |
Disability Class by Sex by Age in Glen Alpine
Disability Class: Hearing Difficulty
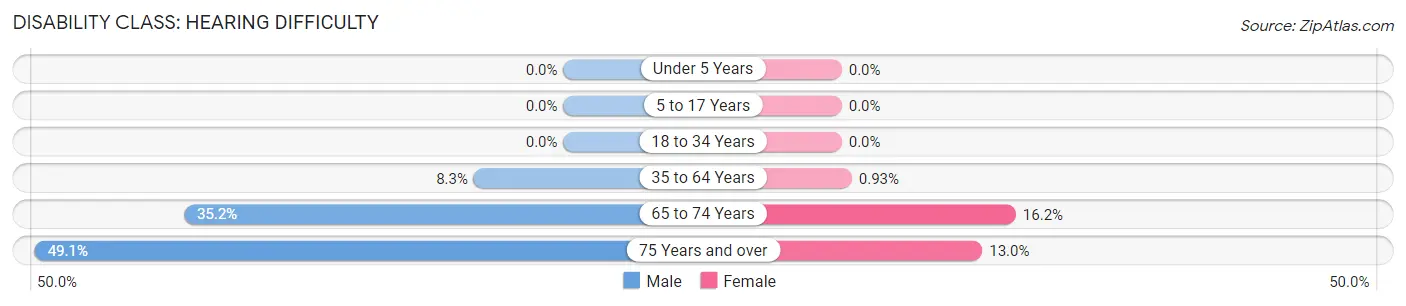
| Age Bracket | Male | Female |
| Under 5 Years | 0 (0.0%) | 0 (0.0%) |
| 5 to 17 Years | 0 (0.0%) | 0 (0.0%) |
| 18 to 34 Years | 0 (0.0%) | 0 (0.0%) |
| 35 to 64 Years | 35 (8.3%) | 4 (0.9%) |
| 65 to 74 Years | 25 (35.2%) | 16 (16.2%) |
| 75 Years and over | 26 (49.1%) | 3 (13.0%) |
Disability Class: Vision Difficulty
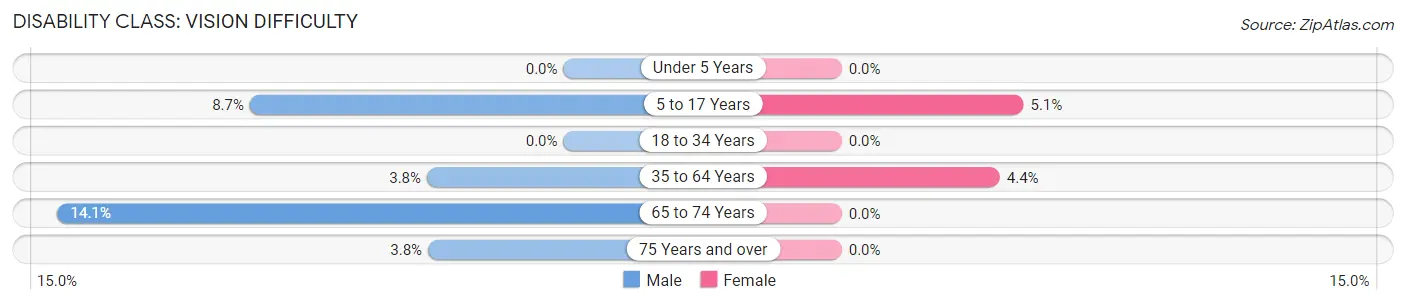
| Age Bracket | Male | Female |
| Under 5 Years | 0 (0.0%) | 0 (0.0%) |
| 5 to 17 Years | 20 (8.7%) | 8 (5.1%) |
| 18 to 34 Years | 0 (0.0%) | 0 (0.0%) |
| 35 to 64 Years | 16 (3.8%) | 19 (4.4%) |
| 65 to 74 Years | 10 (14.1%) | 0 (0.0%) |
| 75 Years and over | 2 (3.8%) | 0 (0.0%) |
Disability Class: Cognitive Difficulty
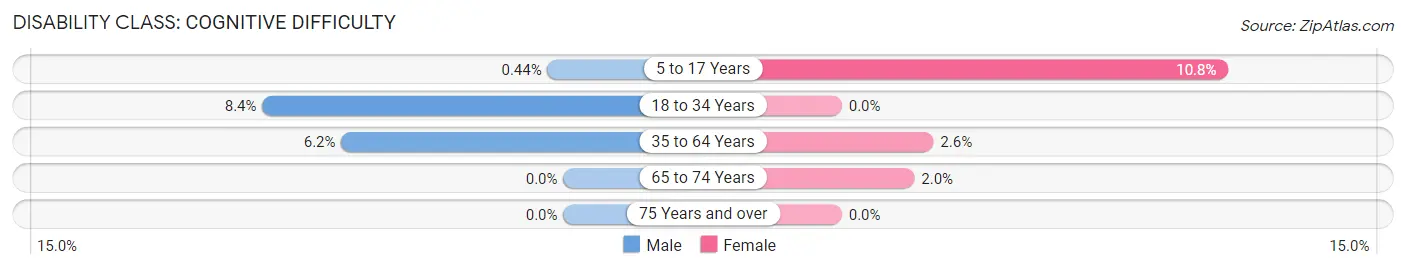
| Age Bracket | Male | Female |
| 5 to 17 Years | 1 (0.4%) | 17 (10.8%) |
| 18 to 34 Years | 14 (8.4%) | 0 (0.0%) |
| 35 to 64 Years | 26 (6.2%) | 11 (2.5%) |
| 65 to 74 Years | 0 (0.0%) | 2 (2.0%) |
| 75 Years and over | 0 (0.0%) | 0 (0.0%) |
Disability Class: Ambulatory Difficulty
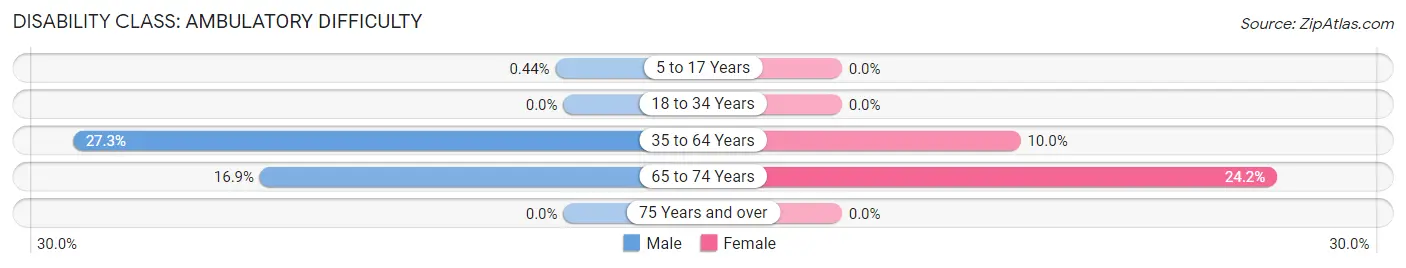
| Age Bracket | Male | Female |
| 5 to 17 Years | 1 (0.4%) | 0 (0.0%) |
| 18 to 34 Years | 0 (0.0%) | 0 (0.0%) |
| 35 to 64 Years | 115 (27.3%) | 43 (10.0%) |
| 65 to 74 Years | 12 (16.9%) | 24 (24.2%) |
| 75 Years and over | 0 (0.0%) | 0 (0.0%) |
Disability Class: Self-Care Difficulty
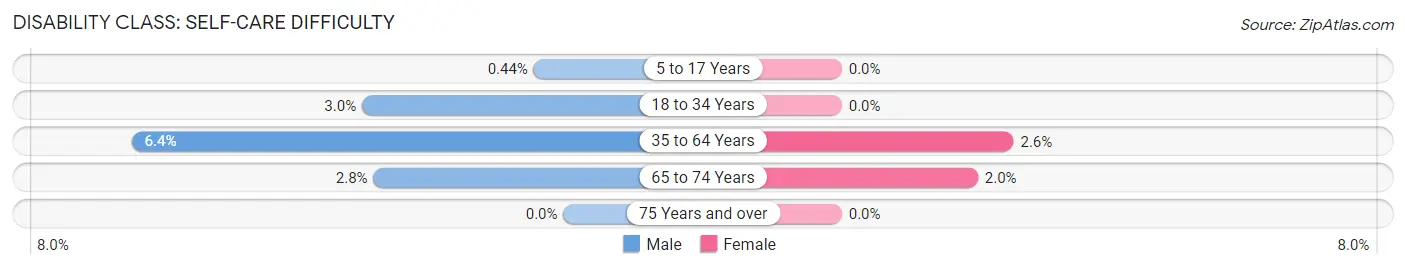
| Age Bracket | Male | Female |
| 5 to 17 Years | 1 (0.4%) | 0 (0.0%) |
| 18 to 34 Years | 5 (3.0%) | 0 (0.0%) |
| 35 to 64 Years | 27 (6.4%) | 11 (2.5%) |
| 65 to 74 Years | 2 (2.8%) | 2 (2.0%) |
| 75 Years and over | 0 (0.0%) | 0 (0.0%) |
Technology Access in Glen Alpine
Computing Device Access in Glen Alpine
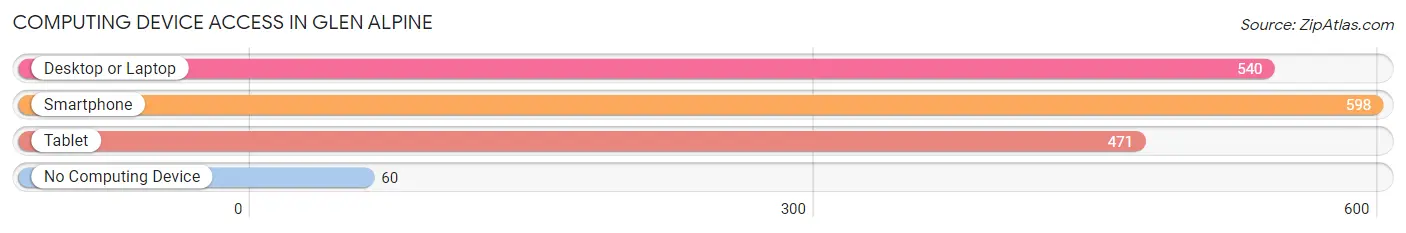
| Device Type | # Households | % Households |
| Desktop or Laptop | 540 | 77.8% |
| Smartphone | 598 | 86.2% |
| Tablet | 471 | 67.9% |
| No Computing Device | 60 | 8.6% |
| Total | 694 | 100.0% |
Internet Access in Glen Alpine
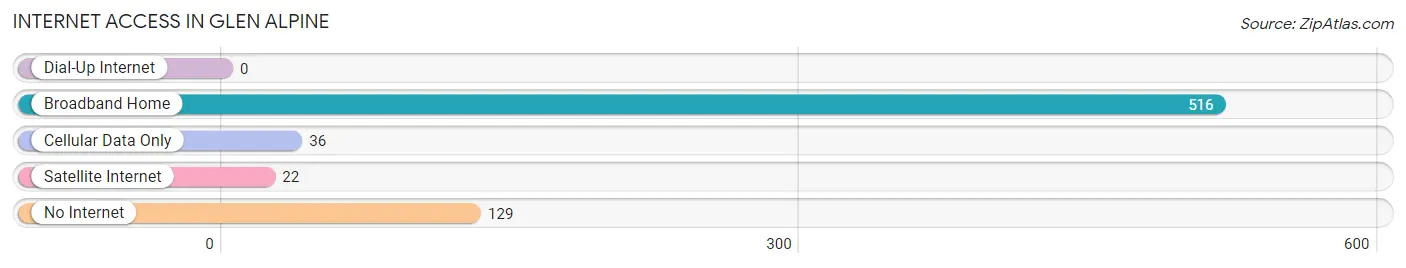
| Internet Type | # Households | % Households |
| Dial-Up Internet | 0 | 0.0% |
| Broadband Home | 516 | 74.4% |
| Cellular Data Only | 36 | 5.2% |
| Satellite Internet | 22 | 3.2% |
| No Internet | 129 | 18.6% |
| Total | 694 | 100.0% |
Glen Alpine Summary
Glen Alpine is a small town located in Burke County, North Carolina. It is situated in the foothills of the Blue Ridge Mountains, approximately 25 miles east of Asheville. The town was founded in 1883 and has a population of approximately 1,000 people.
Geography
Glen Alpine is located in the foothills of the Blue Ridge Mountains, at an elevation of 1,400 feet. The town is situated on the banks of the Catawba River, which flows through the area. The town is surrounded by rolling hills and lush forests, providing a picturesque backdrop for the town. The climate in Glen Alpine is mild, with temperatures ranging from the mid-50s in the winter to the mid-80s in the summer.
Economy
The economy of Glen Alpine is largely based on tourism. The town is home to several popular attractions, including the Catawba River, the Blue Ridge Parkway, and the Linville Gorge. The town also has several restaurants, shops, and lodging options. Additionally, the town is home to several small businesses, including a grocery store, a hardware store, and a gas station.
Demographics
As of the 2010 census, the population of Glen Alpine was 1,000. The racial makeup of the town was 95.2% White, 1.2% African American, 0.7% Native American, 0.3% Asian, 0.1% Pacific Islander, and 2.5% from other races. The median household income was $35,000, and the median age was 44.
History
Glen Alpine was founded in 1883 by a group of settlers from the nearby town of Morganton. The town was named after a nearby mountain, and the settlers chose the site due to its proximity to the Catawba River. The town quickly grew, and by the early 1900s, it had become a popular tourist destination. The town was home to several hotels, restaurants, and shops, and it was a popular destination for fishing and hunting.
In the mid-1900s, the town began to decline as the popularity of the nearby towns of Asheville and Morganton increased. However, in recent years, the town has seen a resurgence in popularity due to its proximity to the Blue Ridge Parkway and the Linville Gorge. Today, Glen Alpine is a popular destination for tourists and locals alike, and it is home to several restaurants, shops, and lodging options.
Common Questions
What is the Total Population of Glen Alpine?
Total Population of Glen Alpine is 1,896.
What is the Total Male Population of Glen Alpine?
Total Male Population of Glen Alpine is 995.
What is the Total Female Population of Glen Alpine?
Total Female Population of Glen Alpine is 901.
What is the Ratio of Males per 100 Females in Glen Alpine?
There are 110.43 Males per 100 Females in Glen Alpine.
What is the Ratio of Females per 100 Males in Glen Alpine?
There are 90.55 Females per 100 Males in Glen Alpine.
What is the Median Population Age in Glen Alpine?
Median Population Age in Glen Alpine is 38.1 Years.
What is the Average Family Size in Glen Alpine
Average Family Size in Glen Alpine is 3.0 People.
What is the Average Household Size in Glen Alpine
Average Household Size in Glen Alpine is 2.7 People.
What is Per Capita Income in Glen Alpine?
Per Capita income in Glen Alpine is $26,927.
What is the Median Family Income in Glen Alpine?
Median Family Income in Glen Alpine is $64,444.
What is the Median Household income in Glen Alpine?
Median Household Income in Glen Alpine is $51,563.
What is Income or Wage Gap in Glen Alpine?
Income or Wage Gap in Glen Alpine is 13.1%.
Women in Glen Alpine earn 86.9 cents for every dollar earned by a man.
What is Inequality or Gini Index in Glen Alpine?
Inequality or Gini Index in Glen Alpine is 0.40.
How Large is the Labor Force in Glen Alpine?
There are 960 People in the Labor Forcein in Glen Alpine.
What is the Percentage of People in the Labor Force in Glen Alpine?
64.7% of People are in the Labor Force in Glen Alpine.
What is the Unemployment Rate in Glen Alpine?
Unemployment Rate in Glen Alpine is 4.2%.