Lake City, MN
Lake City Map
Lake City Overview
5,108
TOTAL POPULATION
2,363
MALE POPULATION
2,745
FEMALE POPULATION
86.08
MALES / 100 FEMALES
116.17
FEMALES / 100 MALES
49.4
MEDIAN AGE
2.8
AVG FAMILY SIZE
2.1
AVG HOUSEHOLD SIZE
$39,865
PER CAPITA INCOME
$92,452
AVG FAMILY INCOME
$71,324
AVG HOUSEHOLD INCOME
29.4%
WAGE / INCOME GAP [ % ]
70.6¢/ $1
WAGE / INCOME GAP [ $ ]
0.40
INEQUALITY / GINI INDEX
2,563
LABOR FORCE [ PEOPLE ]
60.8%
PERCENT IN LABOR FORCE
0.5%
UNEMPLOYMENT RATE
Lake City Zip Codes
Lake City Area Codes
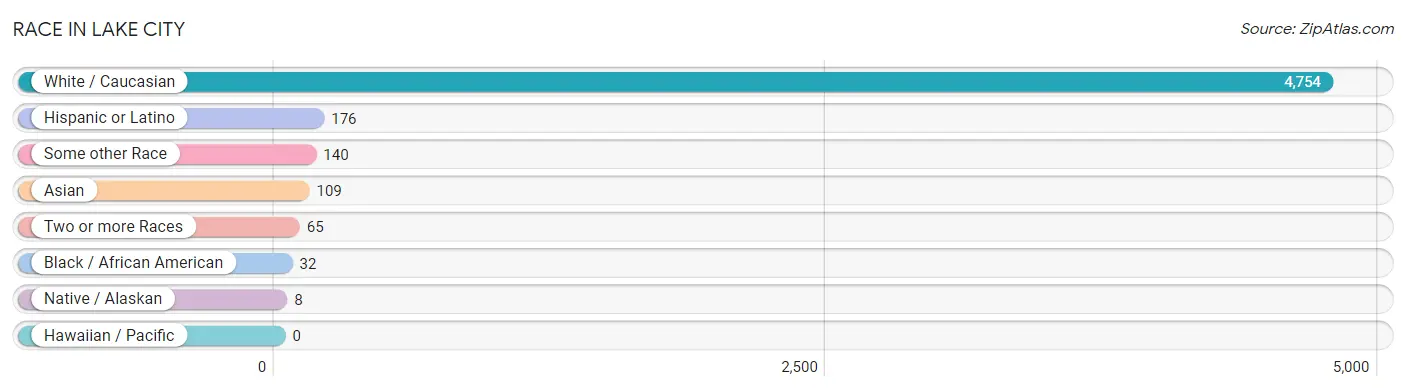
Race in Lake City
The most populous races in Lake City are White / Caucasian (4,754 | 93.1%), Hispanic or Latino (176 | 3.5%), and Some other Race (140 | 2.7%).
| Race | # Population | % Population |
| Asian | 109 | 2.1% |
| Black / African American | 32 | 0.6% |
| Hawaiian / Pacific | 0 | 0.0% |
| Hispanic or Latino | 176 | 3.5% |
| Native / Alaskan | 8 | 0.2% |
| White / Caucasian | 4,754 | 93.1% |
| Two or more Races | 65 | 1.3% |
| Some other Race | 140 | 2.7% |
| Total | 5,108 | 100.0% |
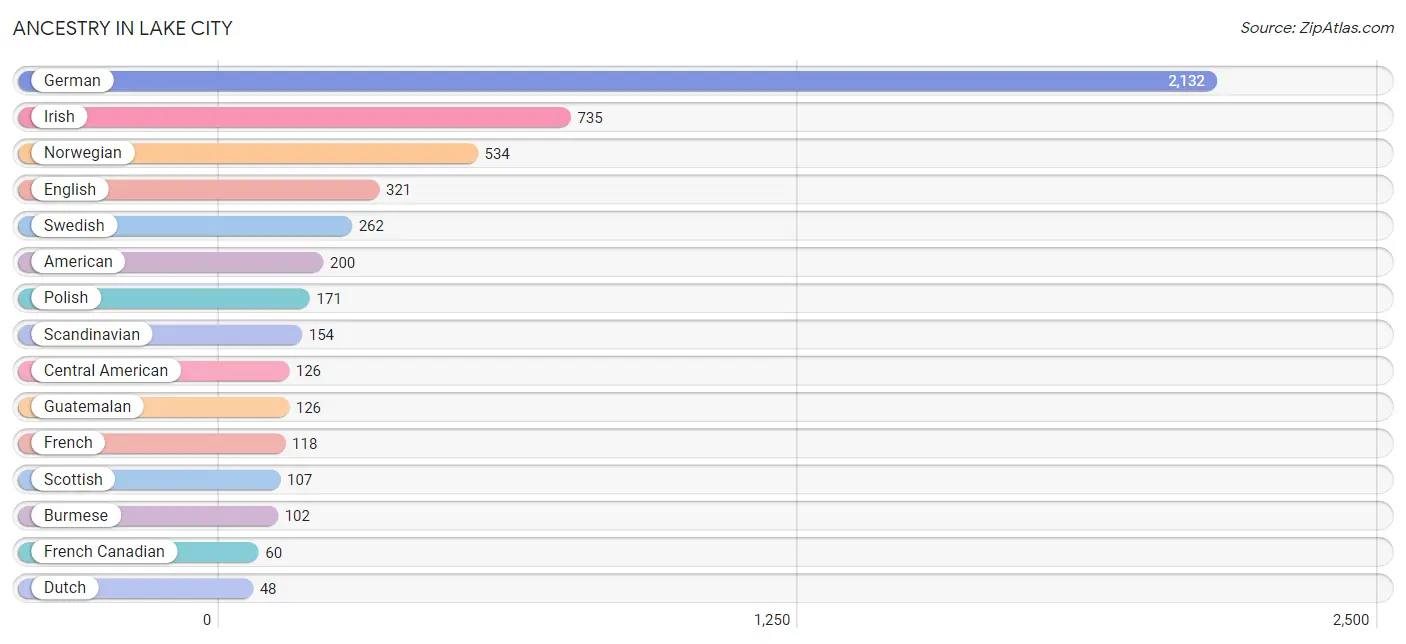
Ancestry in Lake City
The most populous ancestries reported in Lake City are German (2,132 | 41.7%), Irish (735 | 14.4%), Norwegian (534 | 10.4%), English (321 | 6.3%), and Swedish (262 | 5.1%), together accounting for 78.0% of all Lake City residents.
| Ancestry | # Population | % Population |
| American | 200 | 3.9% |
| Australian | 7 | 0.1% |
| Belgian | 6 | 0.1% |
| Bhutanese | 5 | 0.1% |
| British | 6 | 0.1% |
| Burmese | 102 | 2.0% |
| Central American | 126 | 2.5% |
| Chippewa | 9 | 0.2% |
| Cuban | 11 | 0.2% |
| Czech | 21 | 0.4% |
| Danish | 42 | 0.8% |
| Dutch | 48 | 0.9% |
| English | 321 | 6.3% |
| European | 22 | 0.4% |
| Finnish | 40 | 0.8% |
| French | 118 | 2.3% |
| French American Indian | 1 | 0.0% |
| French Canadian | 60 | 1.2% |
| German | 2,132 | 41.7% |
| Greek | 18 | 0.4% |
| Guatemalan | 126 | 2.5% |
| Hungarian | 4 | 0.1% |
| Indian (Asian) | 7 | 0.1% |
| Irish | 735 | 14.4% |
| Italian | 45 | 0.9% |
| Luxembourger | 13 | 0.3% |
| Mexican | 30 | 0.6% |
| Northern European | 19 | 0.4% |
| Norwegian | 534 | 10.4% |
| Peruvian | 8 | 0.2% |
| Polish | 171 | 3.4% |
| Scandinavian | 154 | 3.0% |
| Scotch-Irish | 14 | 0.3% |
| Scottish | 107 | 2.1% |
| Sioux | 16 | 0.3% |
| South American | 8 | 0.2% |
| Swedish | 262 | 5.1% |
| Swiss | 24 | 0.5% |
| Thai | 13 | 0.3% |
| Welsh | 8 | 0.2% | View All 40 Rows |
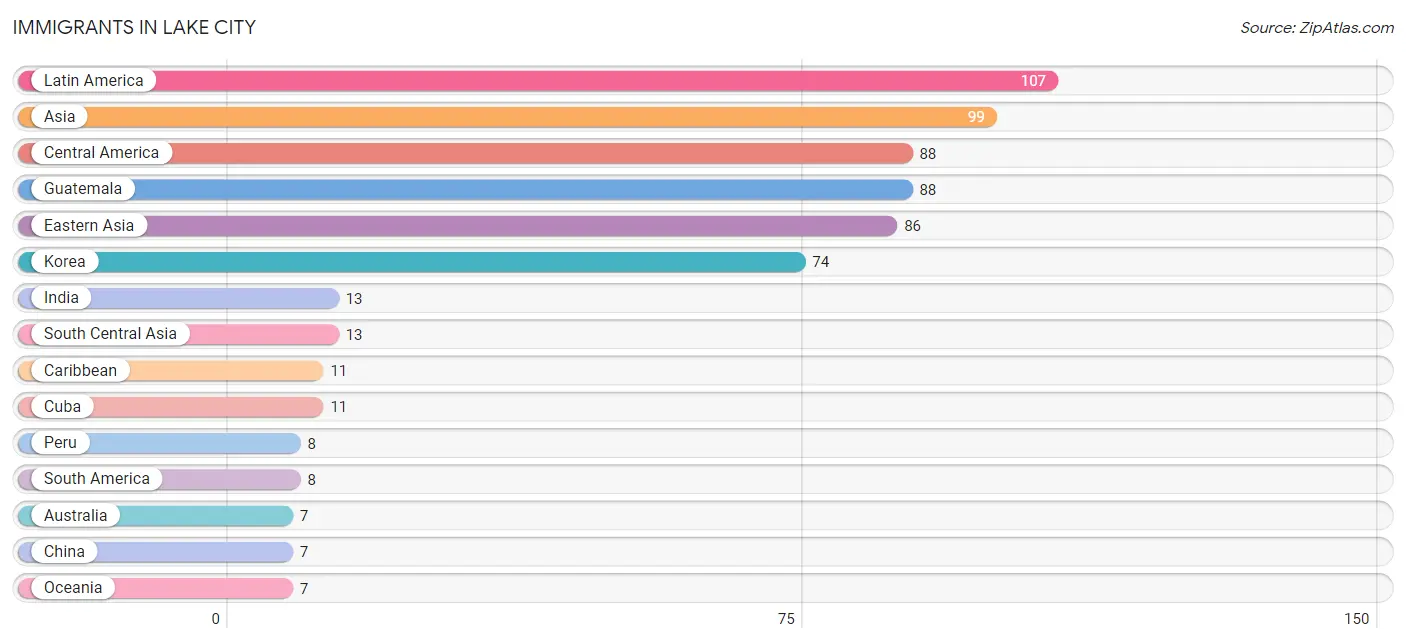
Immigrants in Lake City
The most numerous immigrant groups reported in Lake City came from Latin America (107 | 2.1%), Asia (99 | 1.9%), Central America (88 | 1.7%), Guatemala (88 | 1.7%), and Eastern Asia (86 | 1.7%), together accounting for 9.1% of all Lake City residents.
| Immigration Origin | # Population | % Population |
| Asia | 99 | 1.9% |
| Australia | 7 | 0.1% |
| Caribbean | 11 | 0.2% |
| Central America | 88 | 1.7% |
| China | 7 | 0.1% |
| Cuba | 11 | 0.2% |
| Eastern Asia | 86 | 1.7% |
| Guatemala | 88 | 1.7% |
| India | 13 | 0.3% |
| Japan | 5 | 0.1% |
| Korea | 74 | 1.5% |
| Latin America | 107 | 2.1% |
| Oceania | 7 | 0.1% |
| Peru | 8 | 0.2% |
| South America | 8 | 0.2% |
| South Central Asia | 13 | 0.3% | View All 16 Rows |
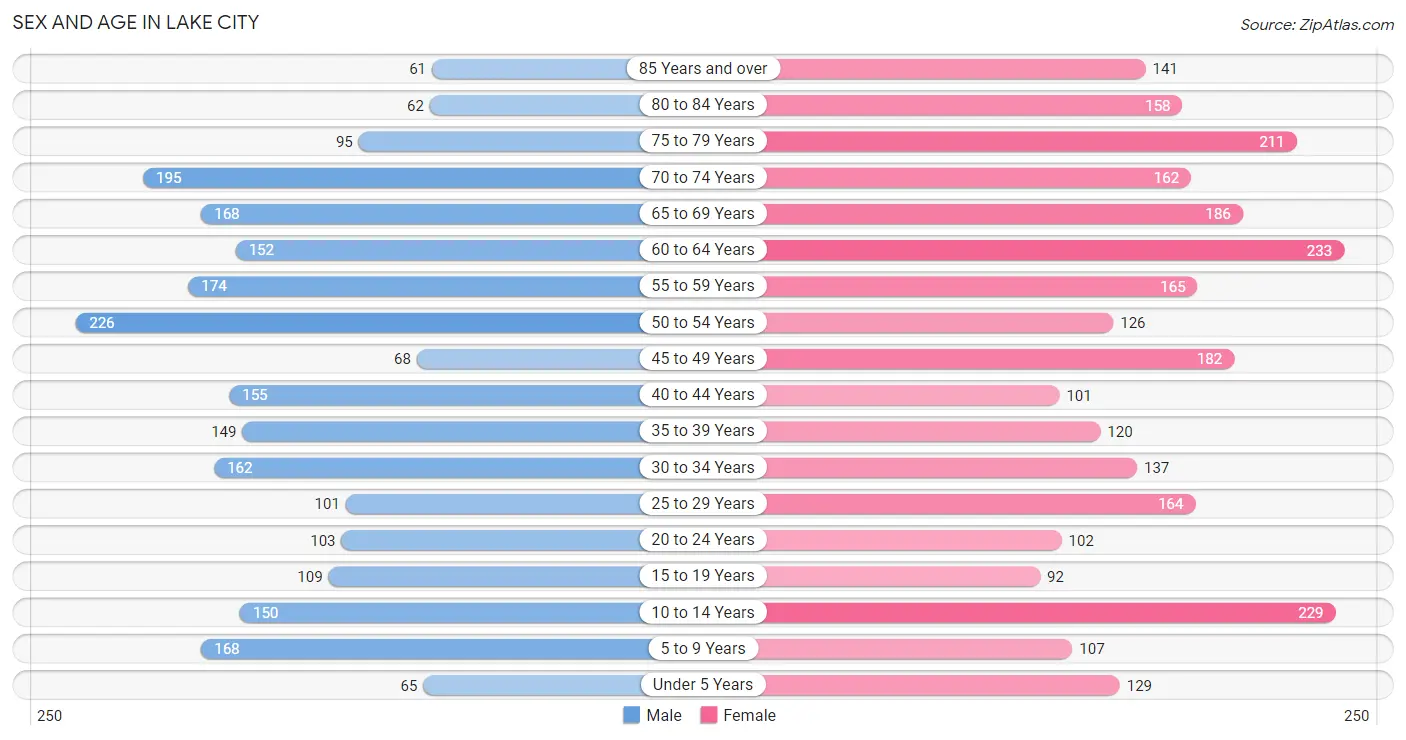
Sex and Age in Lake City
Sex and Age in Lake City
The most populous age groups in Lake City are 50 to 54 Years (226 | 9.6%) for men and 60 to 64 Years (233 | 8.5%) for women.
| Age Bracket | Male | Female |
| Under 5 Years | 65 (2.8%) | 129 (4.7%) |
| 5 to 9 Years | 168 (7.1%) | 107 (3.9%) |
| 10 to 14 Years | 150 (6.4%) | 229 (8.3%) |
| 15 to 19 Years | 109 (4.6%) | 92 (3.4%) |
| 20 to 24 Years | 103 (4.4%) | 102 (3.7%) |
| 25 to 29 Years | 101 (4.3%) | 164 (6.0%) |
| 30 to 34 Years | 162 (6.9%) | 137 (5.0%) |
| 35 to 39 Years | 149 (6.3%) | 120 (4.4%) |
| 40 to 44 Years | 155 (6.6%) | 101 (3.7%) |
| 45 to 49 Years | 68 (2.9%) | 182 (6.6%) |
| 50 to 54 Years | 226 (9.6%) | 126 (4.6%) |
| 55 to 59 Years | 174 (7.4%) | 165 (6.0%) |
| 60 to 64 Years | 152 (6.4%) | 233 (8.5%) |
| 65 to 69 Years | 168 (7.1%) | 186 (6.8%) |
| 70 to 74 Years | 195 (8.3%) | 162 (5.9%) |
| 75 to 79 Years | 95 (4.0%) | 211 (7.7%) |
| 80 to 84 Years | 62 (2.6%) | 158 (5.8%) |
| 85 Years and over | 61 (2.6%) | 141 (5.1%) |
| Total | 2,363 (100.0%) | 2,745 (100.0%) |
Families and Households in Lake City
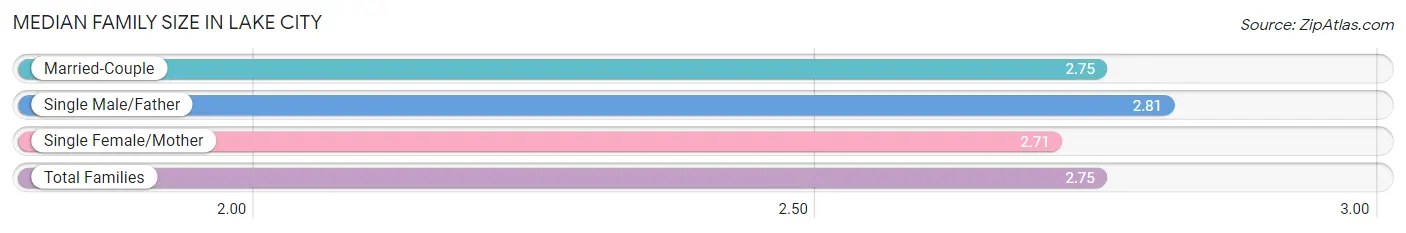
Median Family Size in Lake City
The median family size in Lake City is 2.75 persons per family, with single male/father families (72 | 5.1%) accounting for the largest median family size of 2.81 persons per family. On the other hand, single female/mother families (190 | 13.5%) represent the smallest median family size with 2.71 persons per family.
| Family Type | # Families | Family Size |
| Married-Couple | 1,151 (81.5%) | 2.75 |
| Single Male/Father | 72 (5.1%) | 2.81 |
| Single Female/Mother | 190 (13.5%) | 2.71 |
| Total Families | 1,413 (100.0%) | 2.75 |
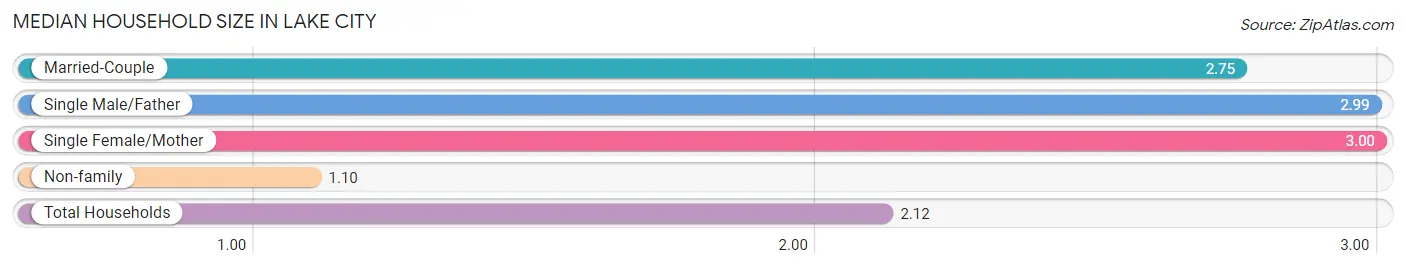
Median Household Size in Lake City
The median household size in Lake City is 2.12 persons per household, with single female/mother households (190 | 8.1%) accounting for the largest median household size of 3 persons per household. non-family households (933 | 39.8%) represent the smallest median household size with 1.10 persons per household.
| Household Type | # Households | Household Size |
| Married-Couple | 1,151 (49.1%) | 2.75 |
| Single Male/Father | 72 (3.1%) | 2.99 |
| Single Female/Mother | 190 (8.1%) | 3.00 |
| Non-family | 933 (39.8%) | 1.10 |
| Total Households | 2,346 (100.0%) | 2.12 |
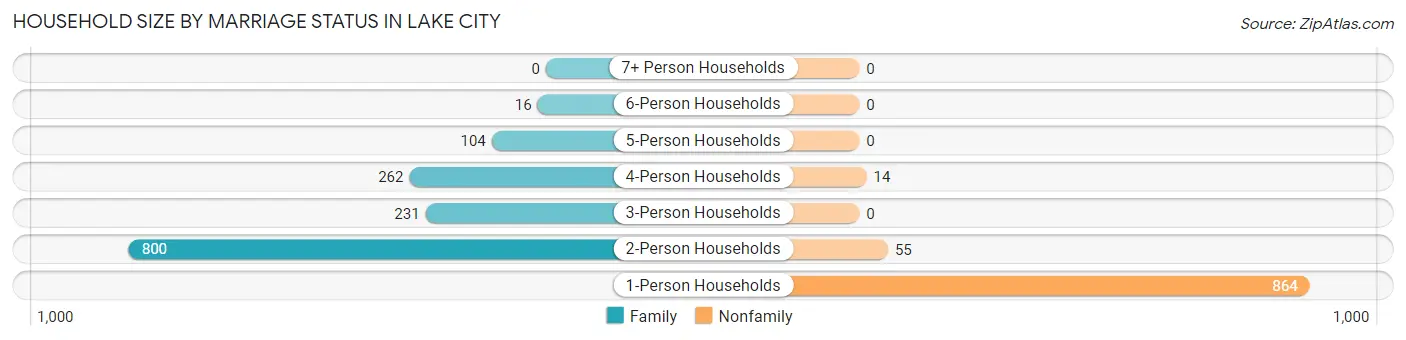
Household Size by Marriage Status in Lake City
Out of a total of 2,346 households in Lake City, 1,413 (60.2%) are family households, while 933 (39.8%) are nonfamily households. The most numerous type of family households are 2-person households, comprising 800, and the most common type of nonfamily households are 1-person households, comprising 864.
| Household Size | Family Households | Nonfamily Households |
| 1-Person Households | - | 864 (36.8%) |
| 2-Person Households | 800 (34.1%) | 55 (2.3%) |
| 3-Person Households | 231 (9.9%) | 0 (0.0%) |
| 4-Person Households | 262 (11.2%) | 14 (0.6%) |
| 5-Person Households | 104 (4.4%) | 0 (0.0%) |
| 6-Person Households | 16 (0.7%) | 0 (0.0%) |
| 7+ Person Households | 0 (0.0%) | 0 (0.0%) |
| Total | 1,413 (60.2%) | 933 (39.8%) |
Female Fertility in Lake City
Fertility by Age in Lake City
Average fertility rate in Lake City is 84.0 births per 1,000 women. Women in the age bracket of 20 to 34 years have the highest fertility rate with 189.0 births per 1,000 women. Women in the age bracket of 20 to 34 years acount for 100.0% of all women with births.
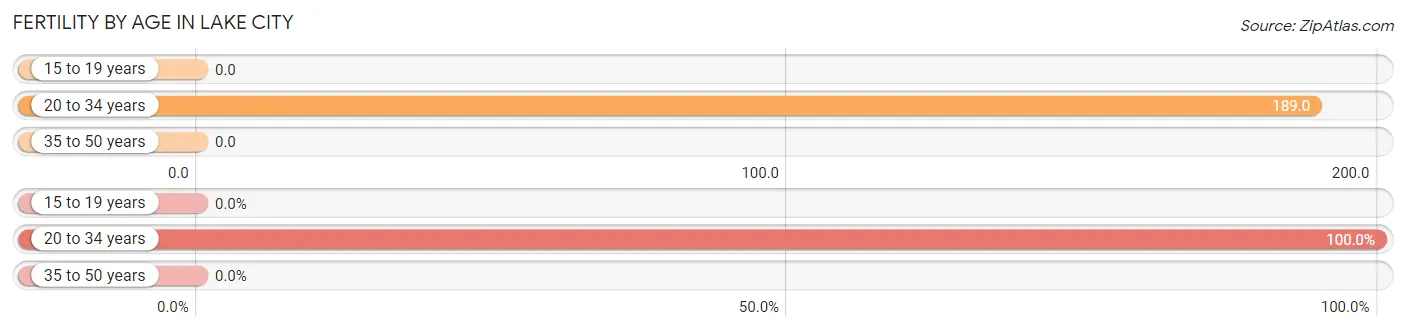
| Age Bracket | Women with Births | Births / 1,000 Women |
| 15 to 19 years | 0 (0.0%) | 0.0 |
| 20 to 34 years | 76 (100.0%) | 189.0 |
| 35 to 50 years | 0 (0.0%) | 0.0 |
| Total | 76 (100.0%) | 84.0 |
Fertility by Age by Marriage Status in Lake City
72.4% of women with births (76) in Lake City are married. The highest percentage of unmarried women with births falls into 20 to 34 years age bracket with 27.6% of them unmarried at the time of birth, while the lowest percentage of unmarried women with births belong to 20 to 34 years age bracket with 27.6% of them unmarried.
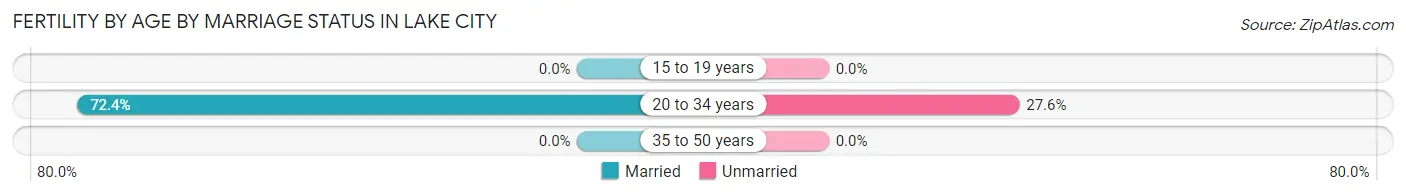
| Age Bracket | Married | Unmarried |
| 15 to 19 years | 0 (0.0%) | 0 (0.0%) |
| 20 to 34 years | 55 (72.4%) | 21 (27.6%) |
| 35 to 50 years | 0 (0.0%) | 0 (0.0%) |
| Total | 55 (72.4%) | 21 (27.6%) |
Fertility by Education in Lake City
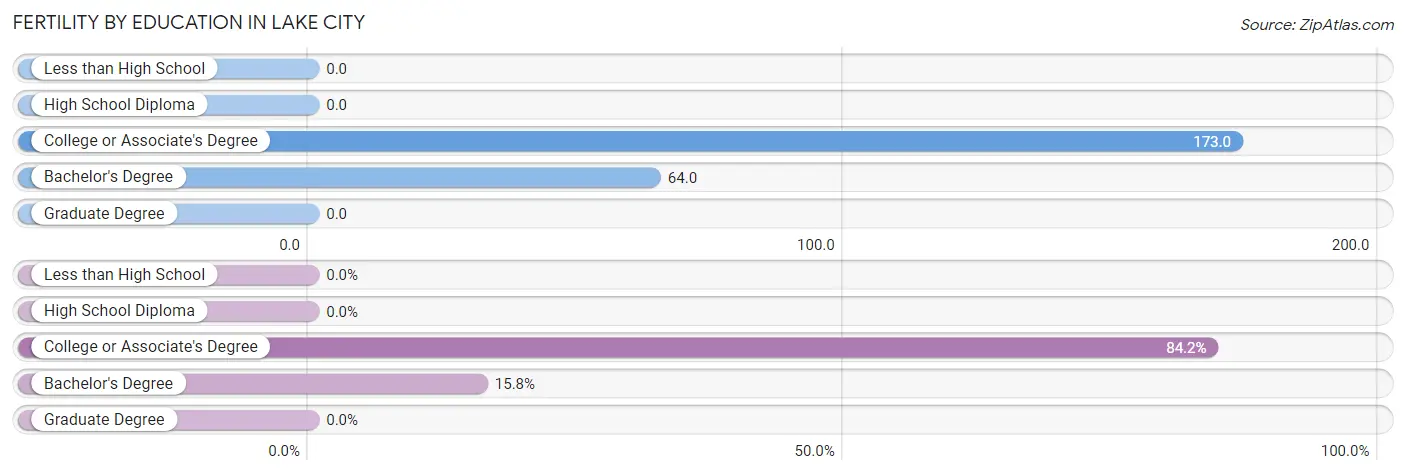
| Educational Attainment | Women with Births | Births / 1,000 Women |
| Less than High School | 0 (0.0%) | 0.0 |
| High School Diploma | 0 (0.0%) | 0.0 |
| College or Associate's Degree | 64 (84.2%) | 173.0 |
| Bachelor's Degree | 12 (15.8%) | 64.0 |
| Graduate Degree | 0 (0.0%) | 0.0 |
| Total | 76 (100.0%) | 84.0 |
Fertility by Education by Marriage Status in Lake City
27.6% of women with births in Lake City are unmarried. Women with the educational attainment of bachelor's degree are most likely to be married with 100.0% of them married at childbirth, while women with the educational attainment of college or associate's degree are least likely to be married with 32.8% of them unmarried at childbirth.
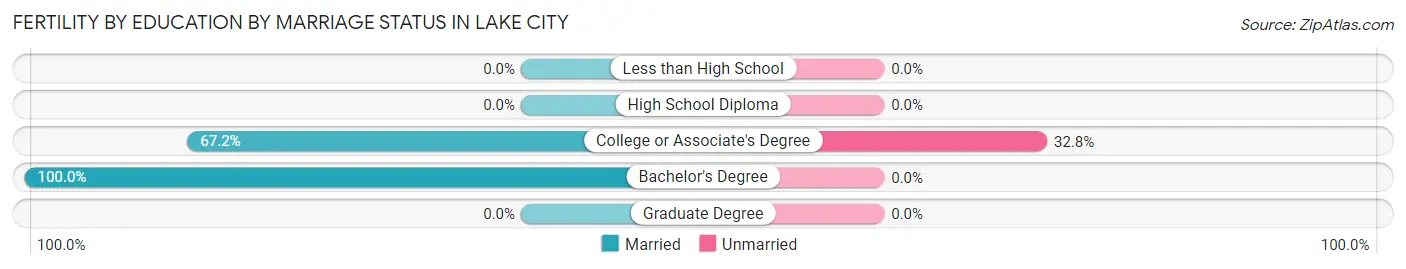
| Educational Attainment | Married | Unmarried |
| Less than High School | 0 (0.0%) | 0 (0.0%) |
| High School Diploma | 0 (0.0%) | 0 (0.0%) |
| College or Associate's Degree | 43 (67.2%) | 21 (32.8%) |
| Bachelor's Degree | 12 (100.0%) | 0 (0.0%) |
| Graduate Degree | 0 (0.0%) | 0 (0.0%) |
| Total | 55 (72.4%) | 21 (27.6%) |
Income in Lake City
Income Overview in Lake City
Per Capita Income in Lake City is $39,865, while median incomes of families and households are $92,452 and $71,324 respectively.
| Characteristic | Number | Measure |
| Per Capita Income | 5,108 | $39,865 |
| Median Family Income | 1,413 | $92,452 |
| Mean Family Income | 1,413 | $99,871 |
| Median Household Income | 2,346 | $71,324 |
| Mean Household Income | 2,346 | $82,478 |
| Income Deficit | 1,413 | $0 |
| Wage / Income Gap (%) | 5,108 | 29.45% |
| Wage / Income Gap ($) | 5,108 | 70.55¢ per $1 |
| Gini / Inequality Index | 5,108 | 0.40 |
Earnings by Sex in Lake City
Average Earnings in Lake City are $43,750, $54,211 for men and $38,246 for women, a difference of 29.4%.
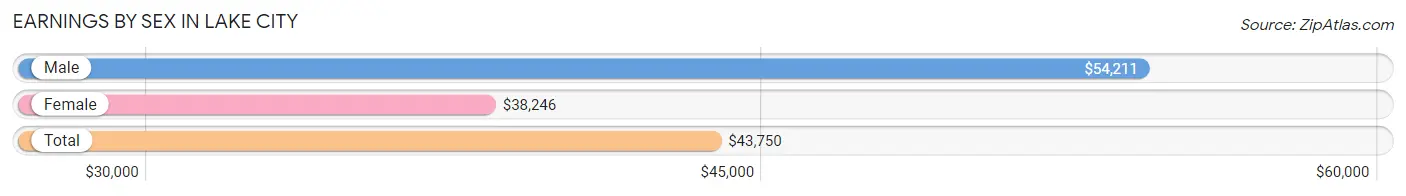
| Sex | Number | Average Earnings |
| Male | 1,428 (52.1%) | $54,211 |
| Female | 1,311 (47.9%) | $38,246 |
| Total | 2,739 (100.0%) | $43,750 |
Earnings by Sex by Income Bracket in Lake City
The most common earnings brackets in Lake City are $100,000+ for men (227 | 15.9%) and $35,000 to $39,999 for women (160 | 12.2%).
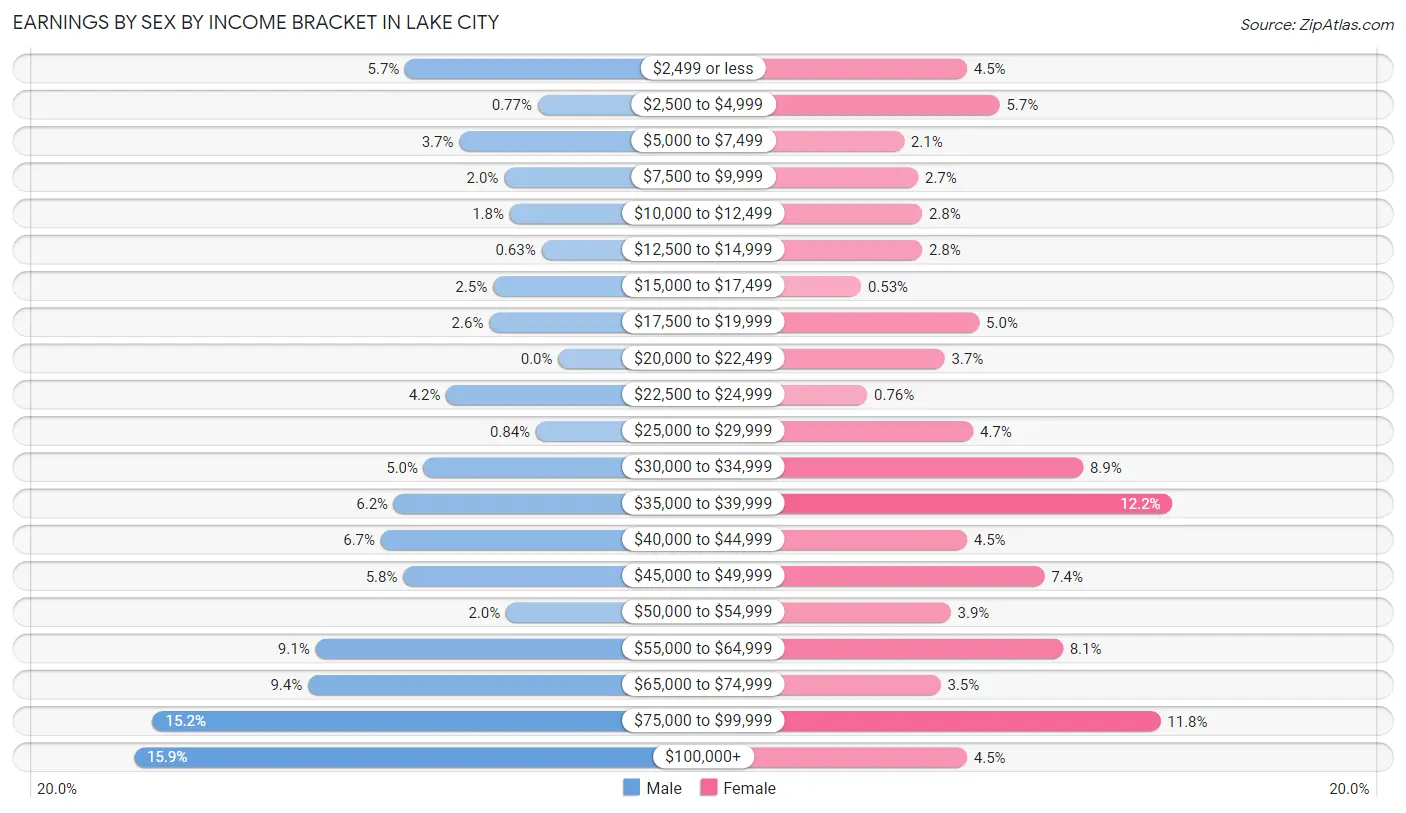
| Income | Male | Female |
| $2,499 or less | 82 (5.7%) | 59 (4.5%) |
| $2,500 to $4,999 | 11 (0.8%) | 75 (5.7%) |
| $5,000 to $7,499 | 53 (3.7%) | 28 (2.1%) |
| $7,500 to $9,999 | 29 (2.0%) | 35 (2.7%) |
| $10,000 to $12,499 | 26 (1.8%) | 37 (2.8%) |
| $12,500 to $14,999 | 9 (0.6%) | 37 (2.8%) |
| $15,000 to $17,499 | 35 (2.5%) | 7 (0.5%) |
| $17,500 to $19,999 | 37 (2.6%) | 65 (5.0%) |
| $20,000 to $22,499 | 0 (0.0%) | 48 (3.7%) |
| $22,500 to $24,999 | 60 (4.2%) | 10 (0.8%) |
| $25,000 to $29,999 | 12 (0.8%) | 62 (4.7%) |
| $30,000 to $34,999 | 72 (5.0%) | 116 (8.8%) |
| $35,000 to $39,999 | 88 (6.2%) | 160 (12.2%) |
| $40,000 to $44,999 | 95 (6.7%) | 59 (4.5%) |
| $45,000 to $49,999 | 83 (5.8%) | 97 (7.4%) |
| $50,000 to $54,999 | 28 (2.0%) | 51 (3.9%) |
| $55,000 to $64,999 | 130 (9.1%) | 106 (8.1%) |
| $65,000 to $74,999 | 134 (9.4%) | 46 (3.5%) |
| $75,000 to $99,999 | 217 (15.2%) | 154 (11.7%) |
| $100,000+ | 227 (15.9%) | 59 (4.5%) |
| Total | 1,428 (100.0%) | 1,311 (100.0%) |
Earnings by Sex by Educational Attainment in Lake City
Average earnings in Lake City are $58,424 for men and $40,000 for women, a difference of 31.5%. Men with an educational attainment of bachelor's degree enjoy the highest average annual earnings of $91,707, while those with high school diploma education earn the least with $41,516. Women with an educational attainment of graduate degree earn the most with the average annual earnings of $89,559, while those with less than high school education have the smallest earnings of $4,009.
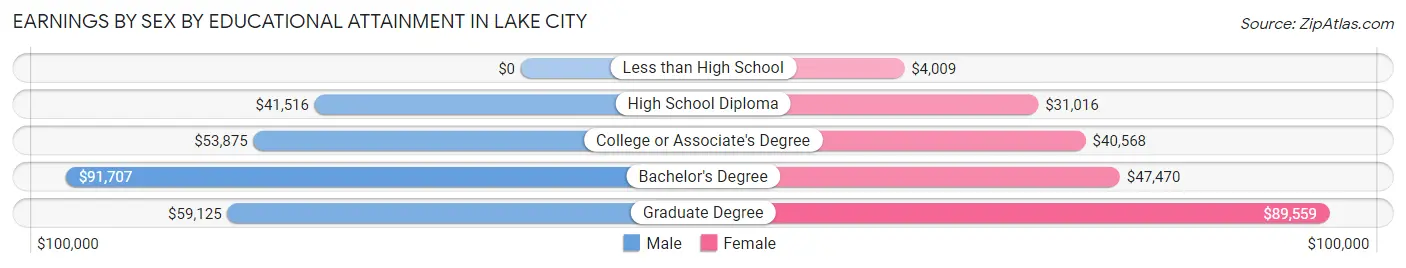
| Educational Attainment | Male Income | Female Income |
| Less than High School | - | - |
| High School Diploma | $41,516 | $31,016 |
| College or Associate's Degree | $53,875 | $40,568 |
| Bachelor's Degree | $91,707 | $47,470 |
| Graduate Degree | $59,125 | $89,559 |
| Total | $58,424 | $40,000 |
Family Income in Lake City
Family Income Brackets in Lake City
According to the Lake City family income data, there are 444 families falling into the $100,000 to $149,999 income range, which is the most common income bracket and makes up 31.4% of all families. Conversely, the less than $10,000 income bracket is the least frequent group with only 7 families (0.5%) belonging to this category.
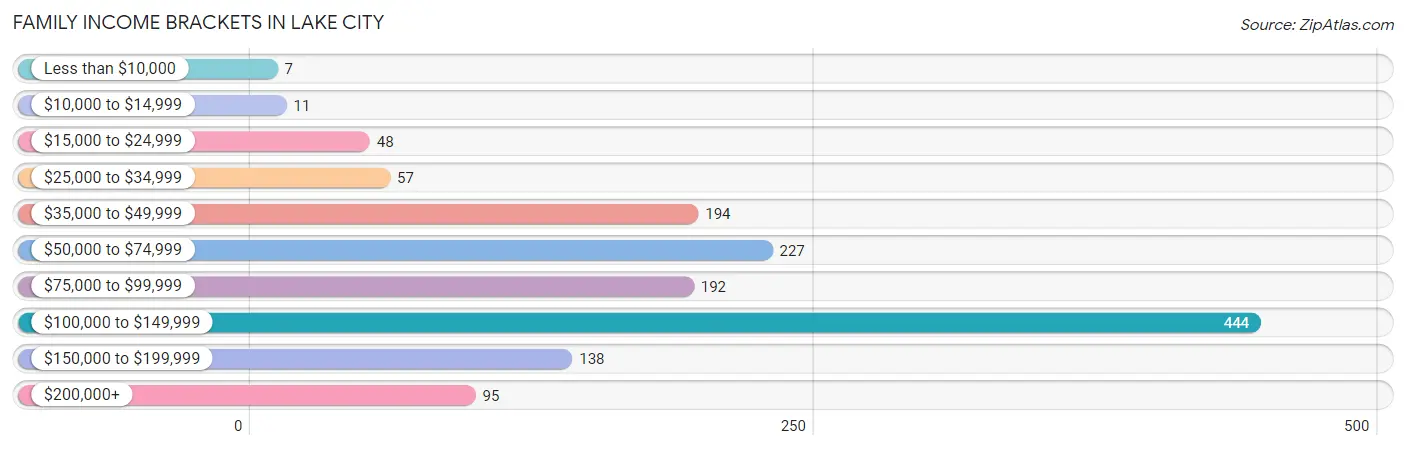
| Income Bracket | # Families | % Families |
| Less than $10,000 | 7 | 0.5% |
| $10,000 to $14,999 | 11 | 0.8% |
| $15,000 to $24,999 | 48 | 3.4% |
| $25,000 to $34,999 | 57 | 4.0% |
| $35,000 to $49,999 | 194 | 13.7% |
| $50,000 to $74,999 | 227 | 16.1% |
| $75,000 to $99,999 | 192 | 13.6% |
| $100,000 to $149,999 | 444 | 31.4% |
| $150,000 to $199,999 | 138 | 9.8% |
| $200,000+ | 95 | 6.7% |
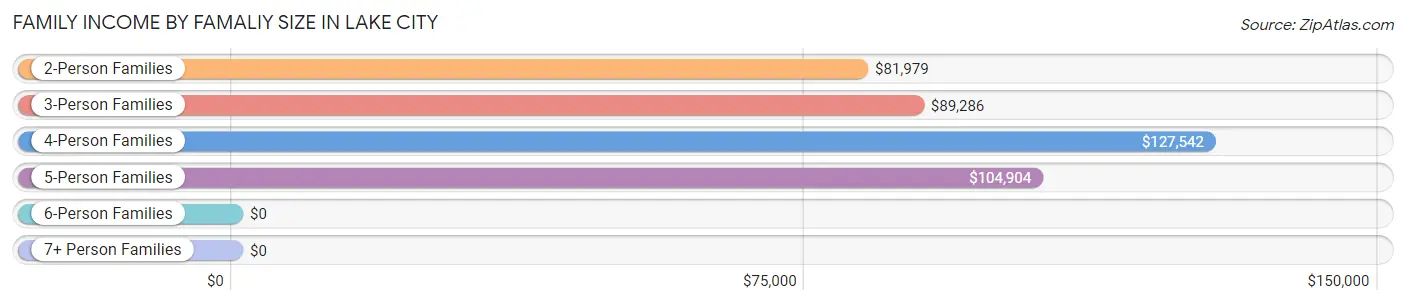
Family Income by Famaliy Size in Lake City
4-person families (257 | 18.2%) account for the highest median family income in Lake City with $127,542 per family, while 2-person families (843 | 59.7%) have the highest median income of $40,990 per family member.
| Income Bracket | # Families | Median Income |
| 2-Person Families | 843 (59.7%) | $81,979 |
| 3-Person Families | 202 (14.3%) | $89,286 |
| 4-Person Families | 257 (18.2%) | $127,542 |
| 5-Person Families | 95 (6.7%) | $104,904 |
| 6-Person Families | 16 (1.1%) | $0 |
| 7+ Person Families | 0 (0.0%) | $0 |
| Total | 1,413 (100.0%) | $92,452 |
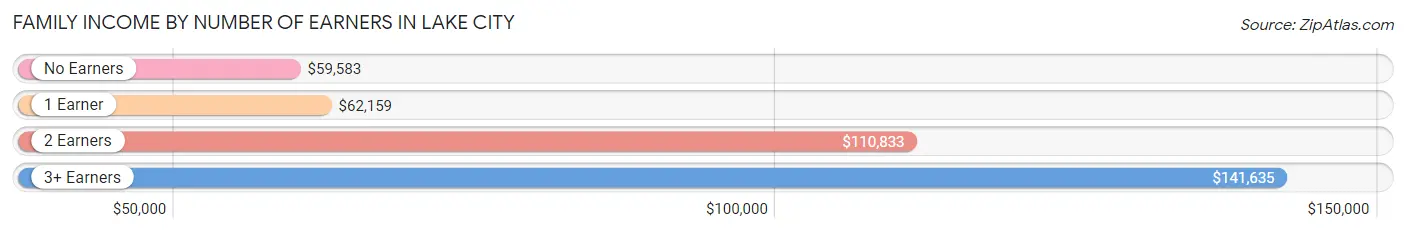
Family Income by Number of Earners in Lake City
The median family income in Lake City is $92,452, with families comprising 3+ earners (105) having the highest median family income of $141,635, while families with no earners (261) have the lowest median family income of $59,583, accounting for 7.4% and 18.5% of families, respectively.
| Number of Earners | # Families | Median Income |
| No Earners | 261 (18.5%) | $59,583 |
| 1 Earner | 319 (22.6%) | $62,159 |
| 2 Earners | 728 (51.5%) | $110,833 |
| 3+ Earners | 105 (7.4%) | $141,635 |
| Total | 1,413 (100.0%) | $92,452 |
Household Income in Lake City
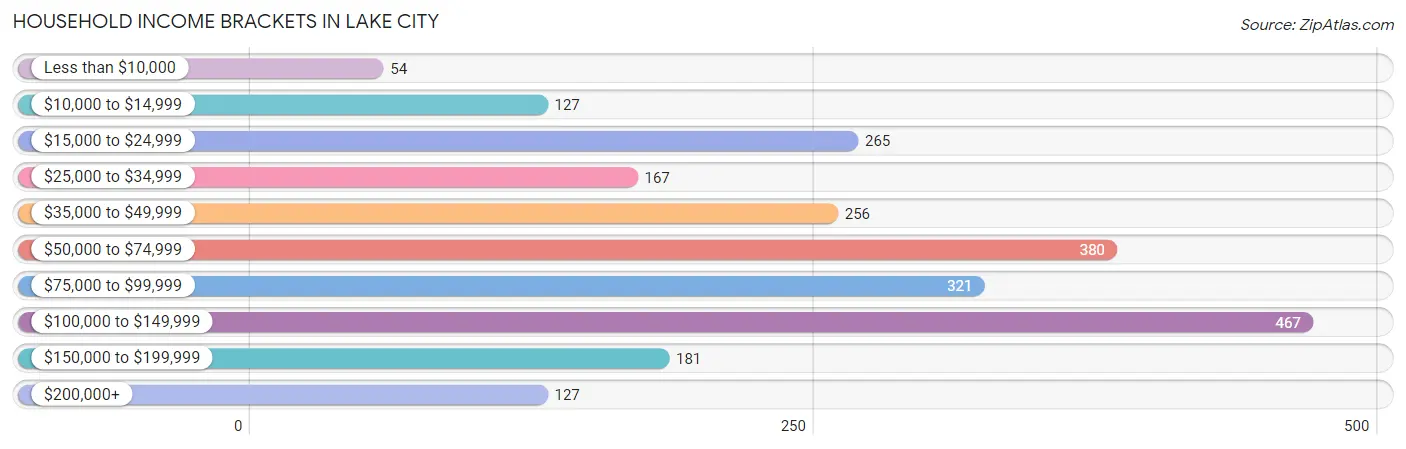
Household Income Brackets in Lake City
With 467 households falling in the category, the $100,000 to $149,999 income range is the most frequent in Lake City, accounting for 19.9% of all households. In contrast, only 54 households (2.3%) fall into the less than $10,000 income bracket, making it the least populous group.
| Income Bracket | # Households | % Households |
| Less than $10,000 | 54 | 2.3% |
| $10,000 to $14,999 | 127 | 5.4% |
| $15,000 to $24,999 | 265 | 11.3% |
| $25,000 to $34,999 | 167 | 7.1% |
| $35,000 to $49,999 | 256 | 10.9% |
| $50,000 to $74,999 | 380 | 16.2% |
| $75,000 to $99,999 | 321 | 13.7% |
| $100,000 to $149,999 | 467 | 19.9% |
| $150,000 to $199,999 | 181 | 7.7% |
| $200,000+ | 127 | 5.4% |
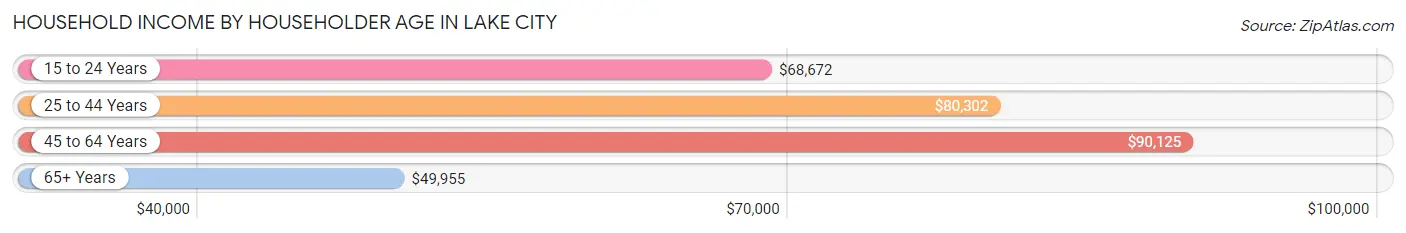
Household Income by Householder Age in Lake City
The median household income in Lake City is $71,324, with the highest median household income of $90,125 found in the 45 to 64 years age bracket for the primary householder. A total of 745 households (31.8%) fall into this category. Meanwhile, the 65+ years age bracket for the primary householder has the lowest median household income of $49,955, with 935 households (39.9%) in this group.
| Income Bracket | # Households | Median Income |
| 15 to 24 Years | 71 (3.0%) | $68,672 |
| 25 to 44 Years | 595 (25.4%) | $80,302 |
| 45 to 64 Years | 745 (31.8%) | $90,125 |
| 65+ Years | 935 (39.9%) | $49,955 |
| Total | 2,346 (100.0%) | $71,324 |
Poverty in Lake City
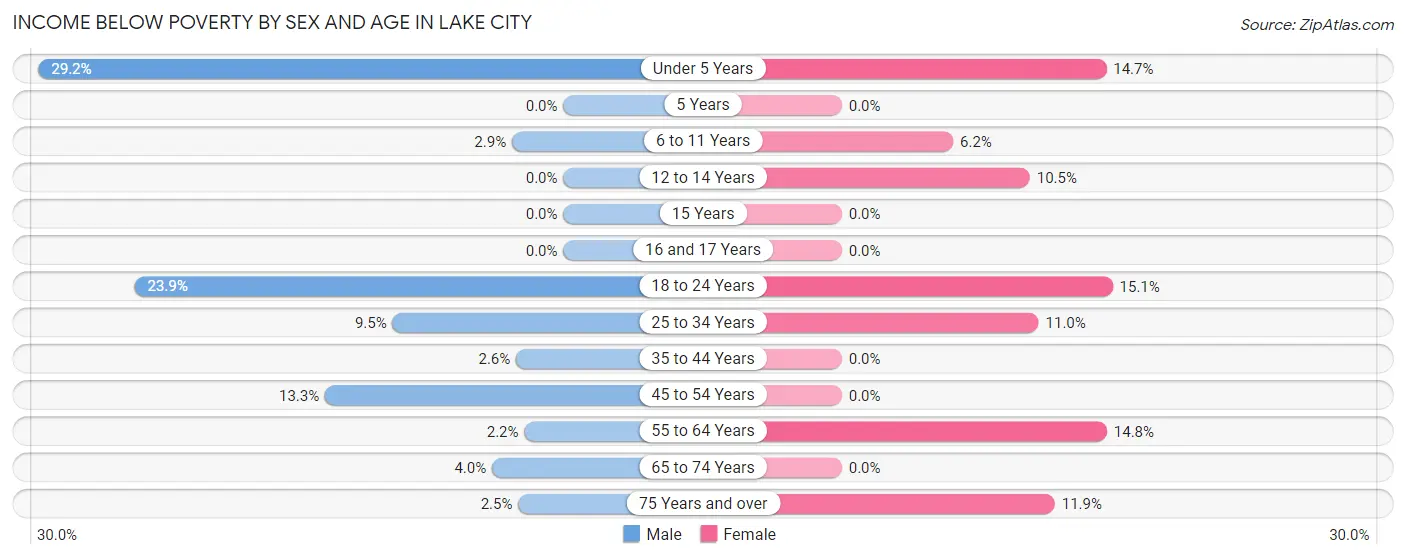
Income Below Poverty by Sex and Age in Lake City
With 6.7% poverty level for males and 7.9% for females among the residents of Lake City, under 5 year old males and 18 to 24 year old females are the most vulnerable to poverty, with 19 males (29.2%) and 19 females (15.1%) in their respective age groups living below the poverty level.
| Age Bracket | Male | Female |
| Under 5 Years | 19 (29.2%) | 19 (14.7%) |
| 5 Years | 0 (0.0%) | 0 (0.0%) |
| 6 to 11 Years | 6 (2.9%) | 8 (6.2%) |
| 12 to 14 Years | 0 (0.0%) | 20 (10.5%) |
| 15 Years | 0 (0.0%) | 0 (0.0%) |
| 16 and 17 Years | 0 (0.0%) | 0 (0.0%) |
| 18 to 24 Years | 32 (23.9%) | 19 (15.1%) |
| 25 to 34 Years | 25 (9.5%) | 33 (11.0%) |
| 35 to 44 Years | 8 (2.6%) | 0 (0.0%) |
| 45 to 54 Years | 39 (13.3%) | 0 (0.0%) |
| 55 to 64 Years | 7 (2.2%) | 58 (14.8%) |
| 65 to 74 Years | 14 (4.0%) | 0 (0.0%) |
| 75 Years and over | 5 (2.5%) | 53 (11.9%) |
| Total | 155 (6.7%) | 210 (7.9%) |
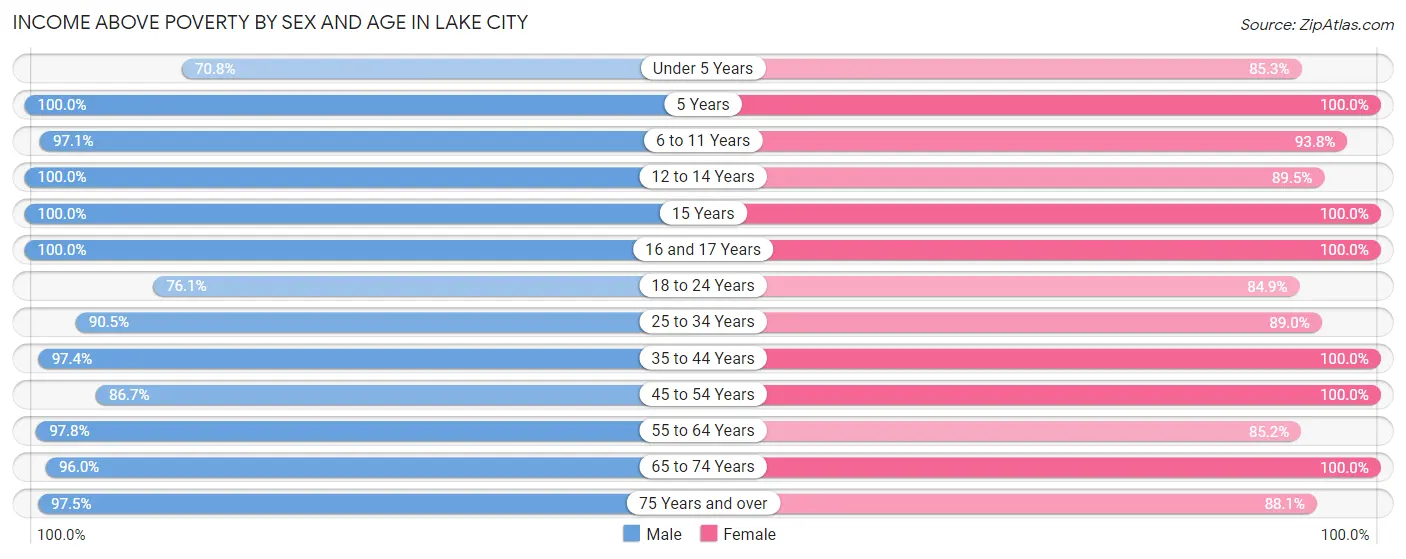
Income Above Poverty by Sex and Age in Lake City
According to the poverty statistics in Lake City, males aged 5 years and females aged 5 years are the age groups that are most secure financially, with 100.0% of males and 100.0% of females in these age groups living above the poverty line.
| Age Bracket | Male | Female |
| Under 5 Years | 46 (70.8%) | 110 (85.3%) |
| 5 Years | 20 (100.0%) | 16 (100.0%) |
| 6 to 11 Years | 204 (97.1%) | 121 (93.8%) |
| 12 to 14 Years | 87 (100.0%) | 171 (89.5%) |
| 15 Years | 26 (100.0%) | 18 (100.0%) |
| 16 and 17 Years | 52 (100.0%) | 50 (100.0%) |
| 18 to 24 Years | 102 (76.1%) | 107 (84.9%) |
| 25 to 34 Years | 238 (90.5%) | 268 (89.0%) |
| 35 to 44 Years | 296 (97.4%) | 221 (100.0%) |
| 45 to 54 Years | 255 (86.7%) | 303 (100.0%) |
| 55 to 64 Years | 316 (97.8%) | 335 (85.2%) |
| 65 to 74 Years | 339 (96.0%) | 340 (100.0%) |
| 75 Years and over | 194 (97.5%) | 394 (88.1%) |
| Total | 2,175 (93.3%) | 2,454 (92.1%) |
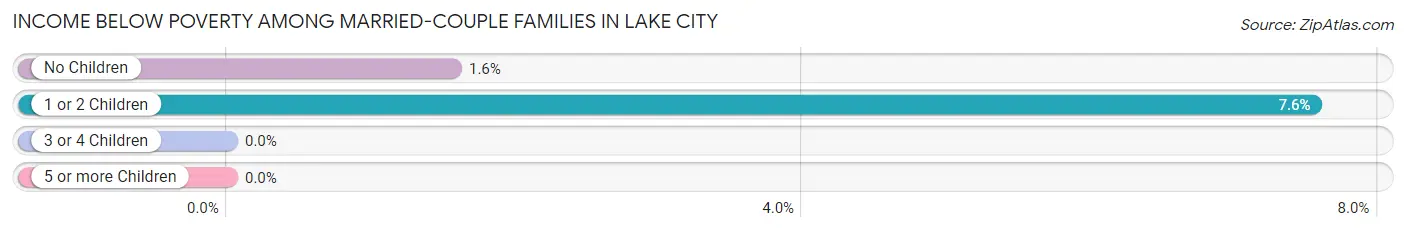
Income Below Poverty Among Married-Couple Families in Lake City
The poverty statistics for married-couple families in Lake City show that 2.9% or 33 of the total 1,151 families live below the poverty line. Families with 1 or 2 children have the highest poverty rate of 7.5%, comprising of 21 families. On the other hand, families with 3 or 4 children have the lowest poverty rate of 0.0%, which includes 0 families.
| Children | Above Poverty | Below Poverty |
| No Children | 757 (98.4%) | 12 (1.6%) |
| 1 or 2 Children | 257 (92.4%) | 21 (7.5%) |
| 3 or 4 Children | 104 (100.0%) | 0 (0.0%) |
| 5 or more Children | 0 (0.0%) | 0 (0.0%) |
| Total | 1,118 (97.1%) | 33 (2.9%) |
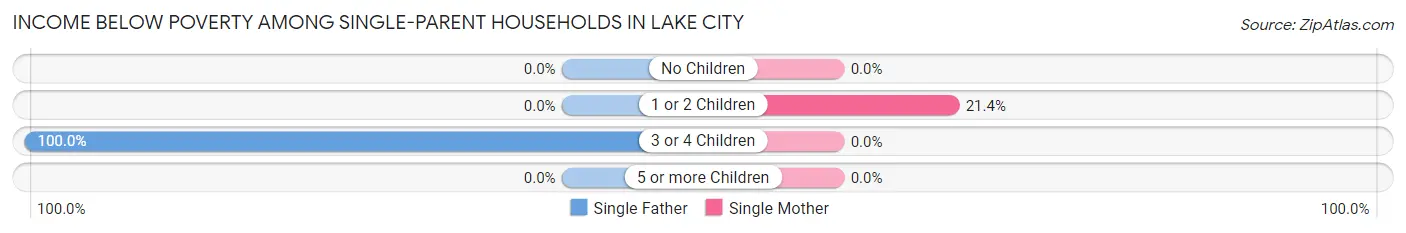
Income Below Poverty Among Single-Parent Households in Lake City
According to the poverty data in Lake City, 8.3% or 6 single-father households and 6.3% or 12 single-mother households are living below the poverty line. Among single-father households, those with 3 or 4 children have the highest poverty rate, with 6 households (100.0%) experiencing poverty. Likewise, among single-mother households, those with 1 or 2 children have the highest poverty rate, with 12 households (21.4%) falling below the poverty line.
| Children | Single Father | Single Mother |
| No Children | 0 (0.0%) | 0 (0.0%) |
| 1 or 2 Children | 0 (0.0%) | 12 (21.4%) |
| 3 or 4 Children | 6 (100.0%) | 0 (0.0%) |
| 5 or more Children | 0 (0.0%) | 0 (0.0%) |
| Total | 6 (8.3%) | 12 (6.3%) |
Income Below Poverty Among Married-Couple vs Single-Parent Households in Lake City
The poverty data for Lake City shows that 33 of the married-couple family households (2.9%) and 18 of the single-parent households (6.9%) are living below the poverty level. Within the married-couple family households, those with 1 or 2 children have the highest poverty rate, with 21 households (7.5%) falling below the poverty line. Among the single-parent households, those with 1 or 2 children have the highest poverty rate, with 12 household (12.9%) living below poverty.
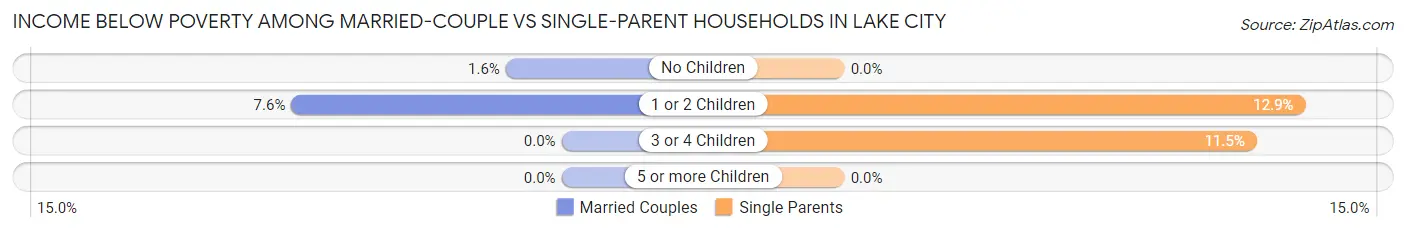
| Children | Married-Couple Families | Single-Parent Households |
| No Children | 12 (1.6%) | 0 (0.0%) |
| 1 or 2 Children | 21 (7.5%) | 12 (12.9%) |
| 3 or 4 Children | 0 (0.0%) | 6 (11.5%) |
| 5 or more Children | 0 (0.0%) | 0 (0.0%) |
| Total | 33 (2.9%) | 18 (6.9%) |
Employment Characteristics in Lake City
Employment by Class of Employer in Lake City
Among the 2,512 employed individuals in Lake City, private company employees (1,527 | 60.8%), not-for-profit organizations (384 | 15.3%), and self-employed (incorporated) (196 | 7.8%) make up the most common classes of employment.
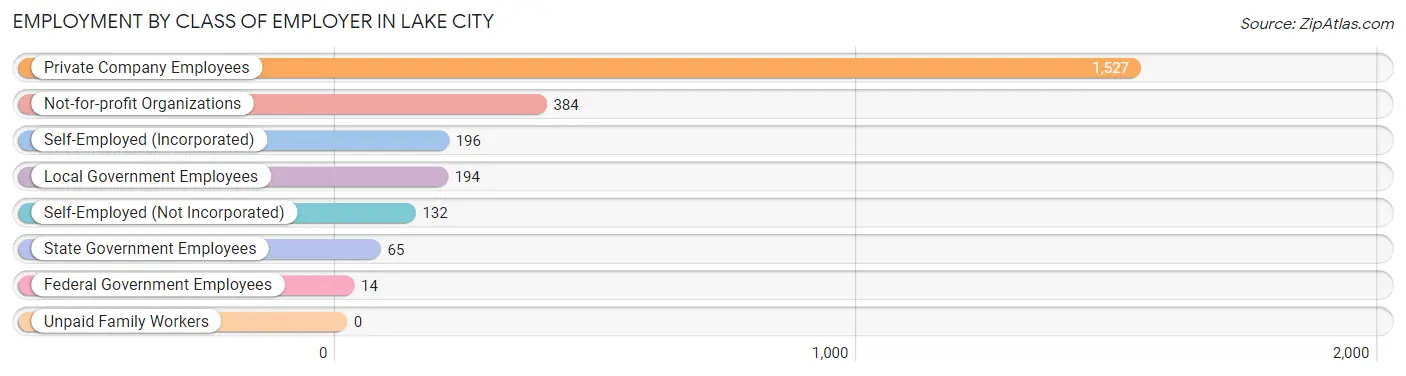
| Employer Class | # Employees | % Employees |
| Private Company Employees | 1,527 | 60.8% |
| Self-Employed (Incorporated) | 196 | 7.8% |
| Self-Employed (Not Incorporated) | 132 | 5.2% |
| Not-for-profit Organizations | 384 | 15.3% |
| Local Government Employees | 194 | 7.7% |
| State Government Employees | 65 | 2.6% |
| Federal Government Employees | 14 | 0.6% |
| Unpaid Family Workers | 0 | 0.0% |
| Total | 2,512 | 100.0% |
Employment Status by Age in Lake City
According to the labor force statistics for Lake City, out of the total population over 16 years of age (4,216), 60.8% or 2,563 individuals are in the labor force, with 0.5% or 13 of them unemployed. The age group with the highest labor force participation rate is 35 to 44 years, with 96.8% or 508 individuals in the labor force. Within the labor force, the 55 to 59 years age range has the highest percentage of unemployed individuals, with 5.2% or 14 of them being unemployed.
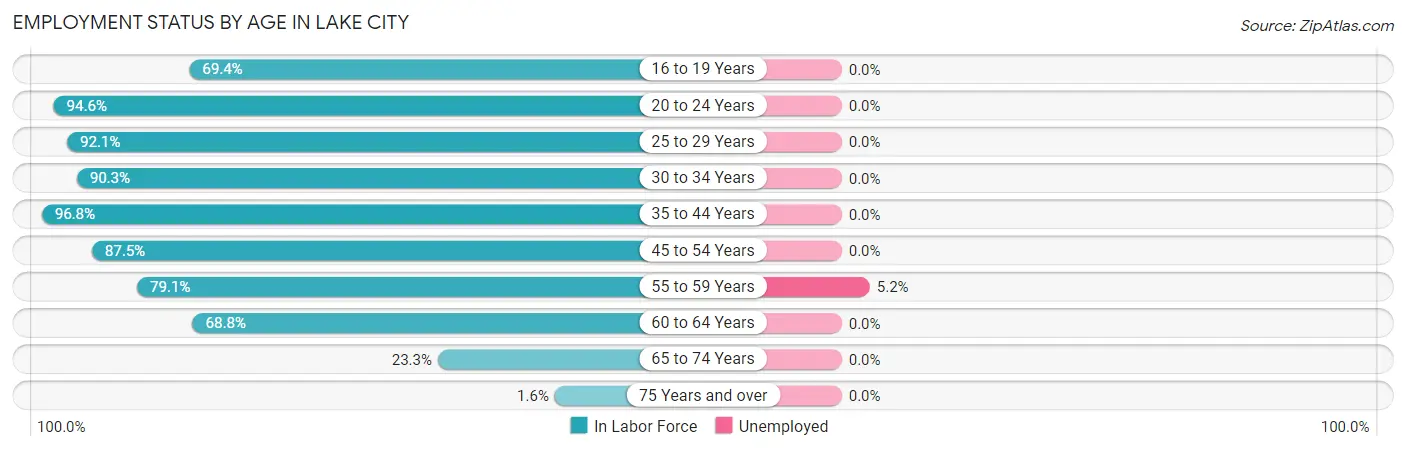
| Age Bracket | In Labor Force | Unemployed |
| 16 to 19 Years | 109 (69.4%) | 0 (0.0%) |
| 20 to 24 Years | 194 (94.6%) | 0 (0.0%) |
| 25 to 29 Years | 244 (92.1%) | 0 (0.0%) |
| 30 to 34 Years | 270 (90.3%) | 0 (0.0%) |
| 35 to 44 Years | 508 (96.8%) | 0 (0.0%) |
| 45 to 54 Years | 527 (87.5%) | 0 (0.0%) |
| 55 to 59 Years | 268 (79.1%) | 14 (5.2%) |
| 60 to 64 Years | 265 (68.8%) | 0 (0.0%) |
| 65 to 74 Years | 166 (23.3%) | 0 (0.0%) |
| 75 Years and over | 12 (1.6%) | 0 (0.0%) |
| Total | 2,563 (60.8%) | 13 (0.5%) |
Employment Status by Educational Attainment in Lake City
According to labor force statistics for Lake City, 86.2% of individuals (2,082) out of the total population between 25 and 64 years of age (2,415) are in the labor force, with 0.7% or 15 of them being unemployed. The group with the highest labor force participation rate are those with the educational attainment of bachelor's degree or higher, with 95.2% or 838 individuals in the labor force. Within the labor force, individuals with college / associate degree education have the highest percentage of unemployment, with 2.0% or 14 of them being unemployed.
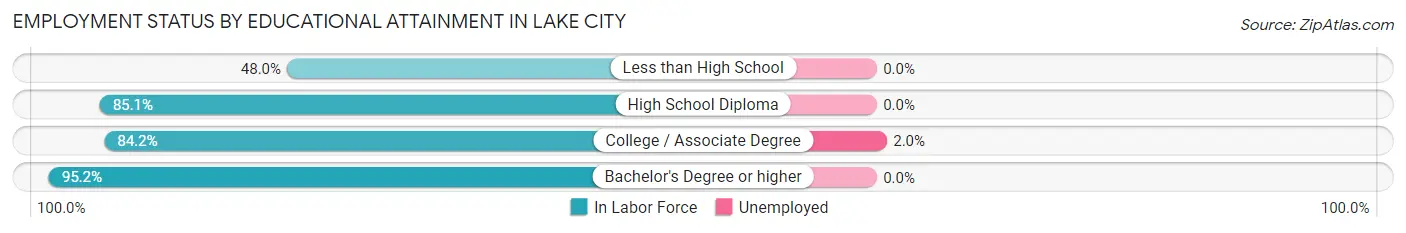
| Educational Attainment | In Labor Force | Unemployed |
| Less than High School | 71 (48.0%) | 0 (0.0%) |
| High School Diploma | 480 (85.1%) | 0 (0.0%) |
| College / Associate Degree | 693 (84.2%) | 16 (2.0%) |
| Bachelor's Degree or higher | 838 (95.2%) | 0 (0.0%) |
| Total | 2,082 (86.2%) | 17 (0.7%) |
Employment Occupations by Sex in Lake City
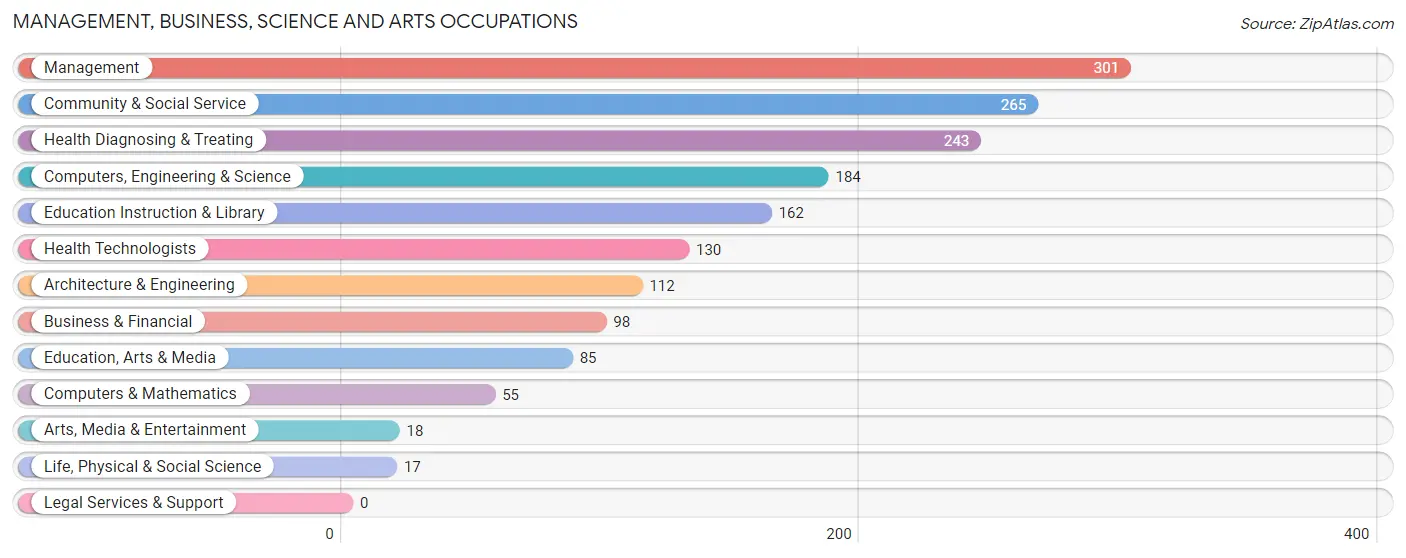
Management, Business, Science and Arts Occupations
The most common Management, Business, Science and Arts occupations in Lake City are Management (301 | 11.8%), Community & Social Service (265 | 10.4%), Health Diagnosing & Treating (243 | 9.6%), Computers, Engineering & Science (184 | 7.2%), and Education Instruction & Library (162 | 6.4%).
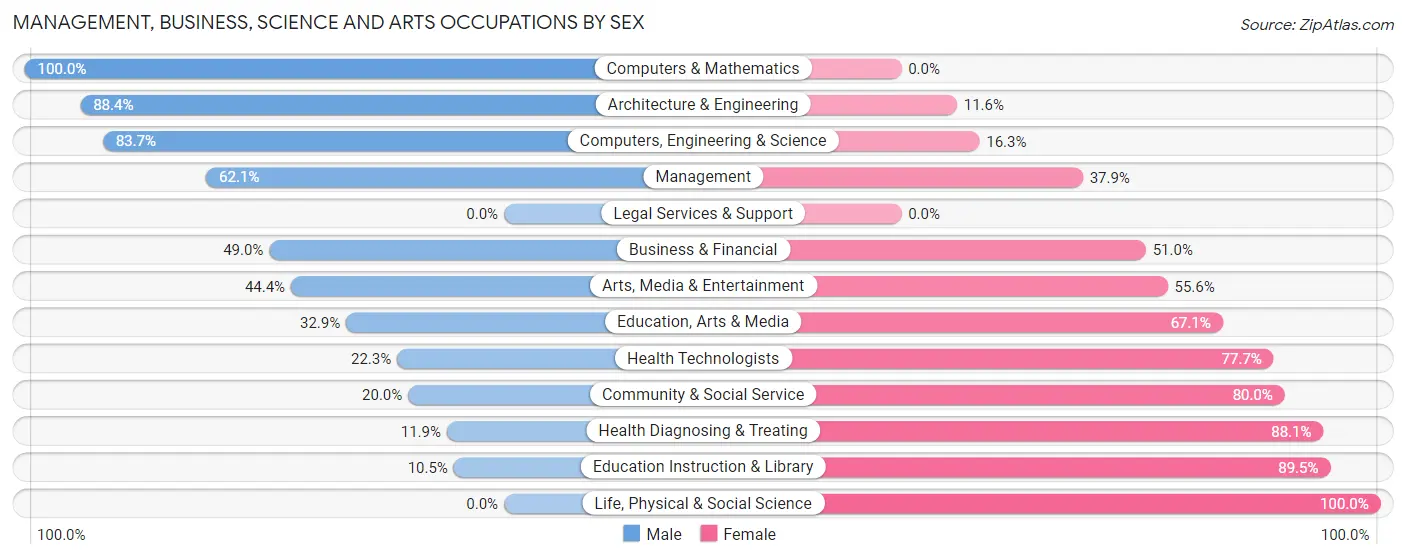
Management, Business, Science and Arts Occupations by Sex
Within the Management, Business, Science and Arts occupations in Lake City, the most male-oriented occupations are Computers & Mathematics (100.0%), Architecture & Engineering (88.4%), and Computers, Engineering & Science (83.7%), while the most female-oriented occupations are Life, Physical & Social Science (100.0%), Education Instruction & Library (89.5%), and Health Diagnosing & Treating (88.1%).
| Occupation | Male | Female |
| Management | 187 (62.1%) | 114 (37.9%) |
| Business & Financial | 48 (49.0%) | 50 (51.0%) |
| Computers, Engineering & Science | 154 (83.7%) | 30 (16.3%) |
| Computers & Mathematics | 55 (100.0%) | 0 (0.0%) |
| Architecture & Engineering | 99 (88.4%) | 13 (11.6%) |
| Life, Physical & Social Science | 0 (0.0%) | 17 (100.0%) |
| Community & Social Service | 53 (20.0%) | 212 (80.0%) |
| Education, Arts & Media | 28 (32.9%) | 57 (67.1%) |
| Legal Services & Support | 0 (0.0%) | 0 (0.0%) |
| Education Instruction & Library | 17 (10.5%) | 145 (89.5%) |
| Arts, Media & Entertainment | 8 (44.4%) | 10 (55.6%) |
| Health Diagnosing & Treating | 29 (11.9%) | 214 (88.1%) |
| Health Technologists | 29 (22.3%) | 101 (77.7%) |
| Total (Category) | 471 (43.2%) | 620 (56.8%) |
| Total (Overall) | 1,285 (50.5%) | 1,257 (49.4%) |
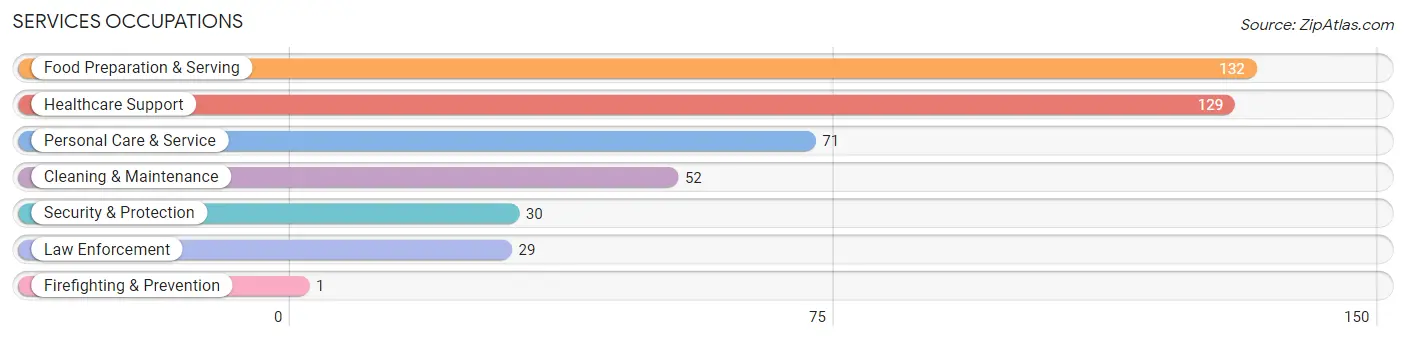
Services Occupations
The most common Services occupations in Lake City are Food Preparation & Serving (132 | 5.2%), Healthcare Support (129 | 5.1%), Personal Care & Service (71 | 2.8%), Cleaning & Maintenance (52 | 2.1%), and Security & Protection (30 | 1.2%).
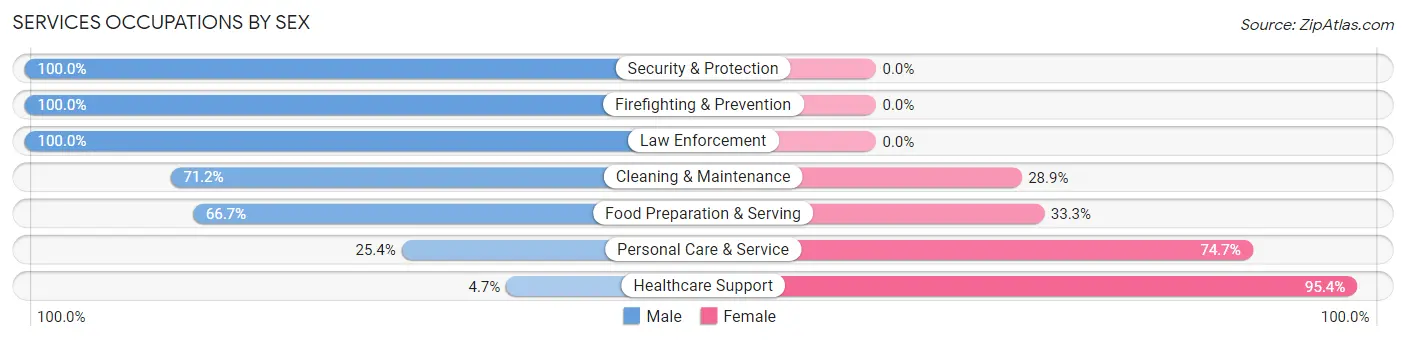
Services Occupations by Sex
Within the Services occupations in Lake City, the most male-oriented occupations are Security & Protection (100.0%), Firefighting & Prevention (100.0%), and Law Enforcement (100.0%), while the most female-oriented occupations are Healthcare Support (95.4%), Personal Care & Service (74.7%), and Food Preparation & Serving (33.3%).
| Occupation | Male | Female |
| Healthcare Support | 6 (4.6%) | 123 (95.4%) |
| Security & Protection | 30 (100.0%) | 0 (0.0%) |
| Firefighting & Prevention | 1 (100.0%) | 0 (0.0%) |
| Law Enforcement | 29 (100.0%) | 0 (0.0%) |
| Food Preparation & Serving | 88 (66.7%) | 44 (33.3%) |
| Cleaning & Maintenance | 37 (71.2%) | 15 (28.8%) |
| Personal Care & Service | 18 (25.4%) | 53 (74.7%) |
| Total (Category) | 179 (43.2%) | 235 (56.8%) |
| Total (Overall) | 1,285 (50.5%) | 1,257 (49.4%) |
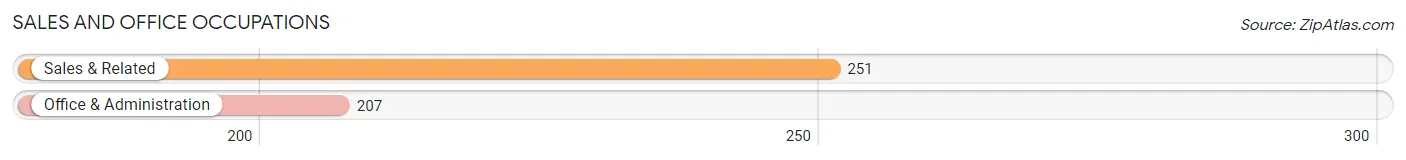
Sales and Office Occupations
The most common Sales and Office occupations in Lake City are Sales & Related (251 | 9.9%), and Office & Administration (207 | 8.1%).
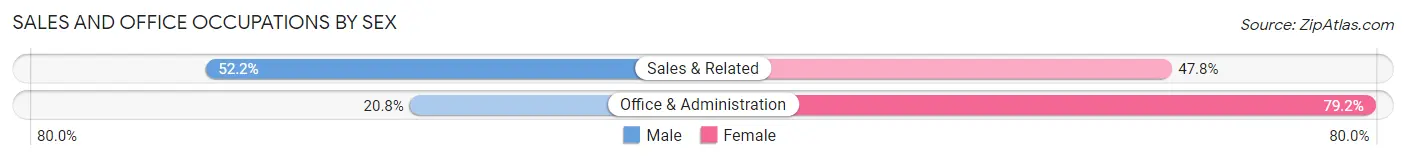
Sales and Office Occupations by Sex
| Occupation | Male | Female |
| Sales & Related | 131 (52.2%) | 120 (47.8%) |
| Office & Administration | 43 (20.8%) | 164 (79.2%) |
| Total (Category) | 174 (38.0%) | 284 (62.0%) |
| Total (Overall) | 1,285 (50.5%) | 1,257 (49.4%) |
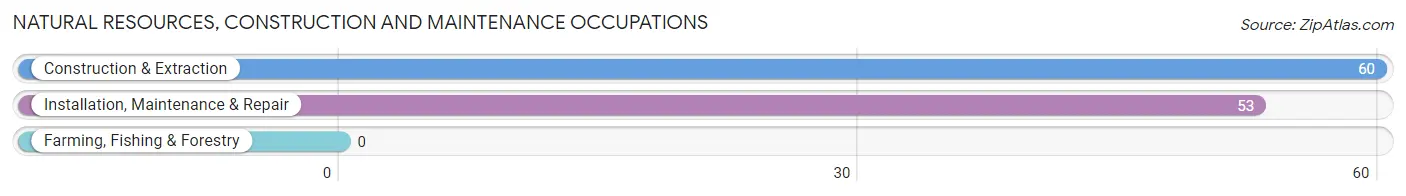
Natural Resources, Construction and Maintenance Occupations
The most common Natural Resources, Construction and Maintenance occupations in Lake City are Construction & Extraction (60 | 2.4%), and Installation, Maintenance & Repair (53 | 2.1%).
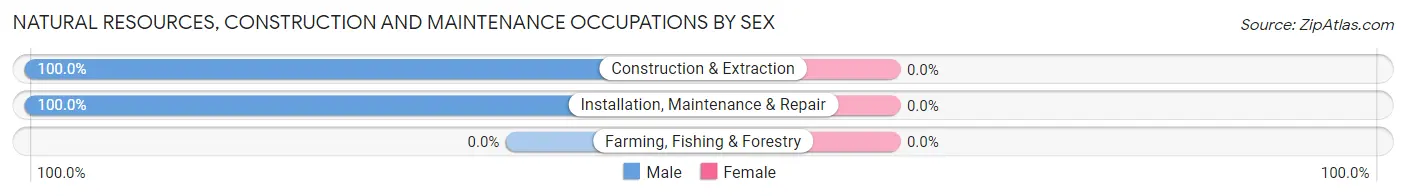
Natural Resources, Construction and Maintenance Occupations by Sex
| Occupation | Male | Female |
| Farming, Fishing & Forestry | 0 (0.0%) | 0 (0.0%) |
| Construction & Extraction | 60 (100.0%) | 0 (0.0%) |
| Installation, Maintenance & Repair | 53 (100.0%) | 0 (0.0%) |
| Total (Category) | 113 (100.0%) | 0 (0.0%) |
| Total (Overall) | 1,285 (50.5%) | 1,257 (49.4%) |
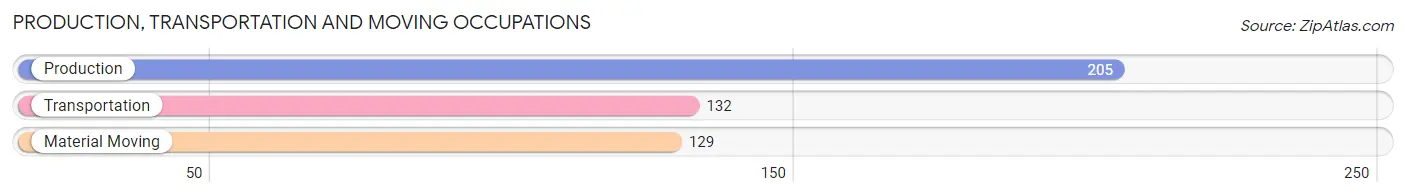
Production, Transportation and Moving Occupations
The most common Production, Transportation and Moving occupations in Lake City are Production (205 | 8.1%), Transportation (132 | 5.2%), and Material Moving (129 | 5.1%).
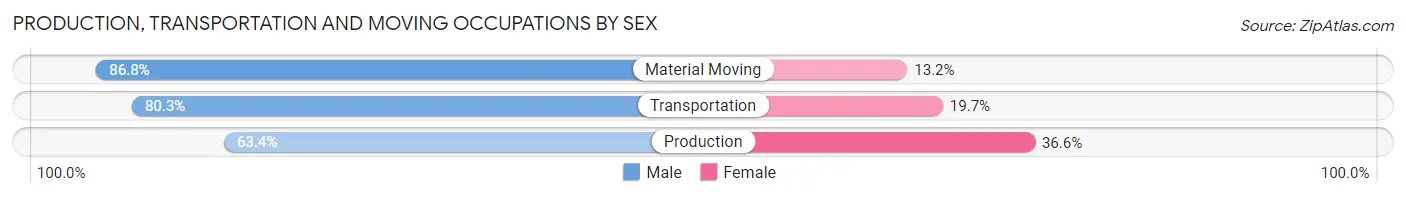
Production, Transportation and Moving Occupations by Sex
| Occupation | Male | Female |
| Production | 130 (63.4%) | 75 (36.6%) |
| Transportation | 106 (80.3%) | 26 (19.7%) |
| Material Moving | 112 (86.8%) | 17 (13.2%) |
| Total (Category) | 348 (74.7%) | 118 (25.3%) |
| Total (Overall) | 1,285 (50.5%) | 1,257 (49.4%) |
Employment Industries by Sex in Lake City
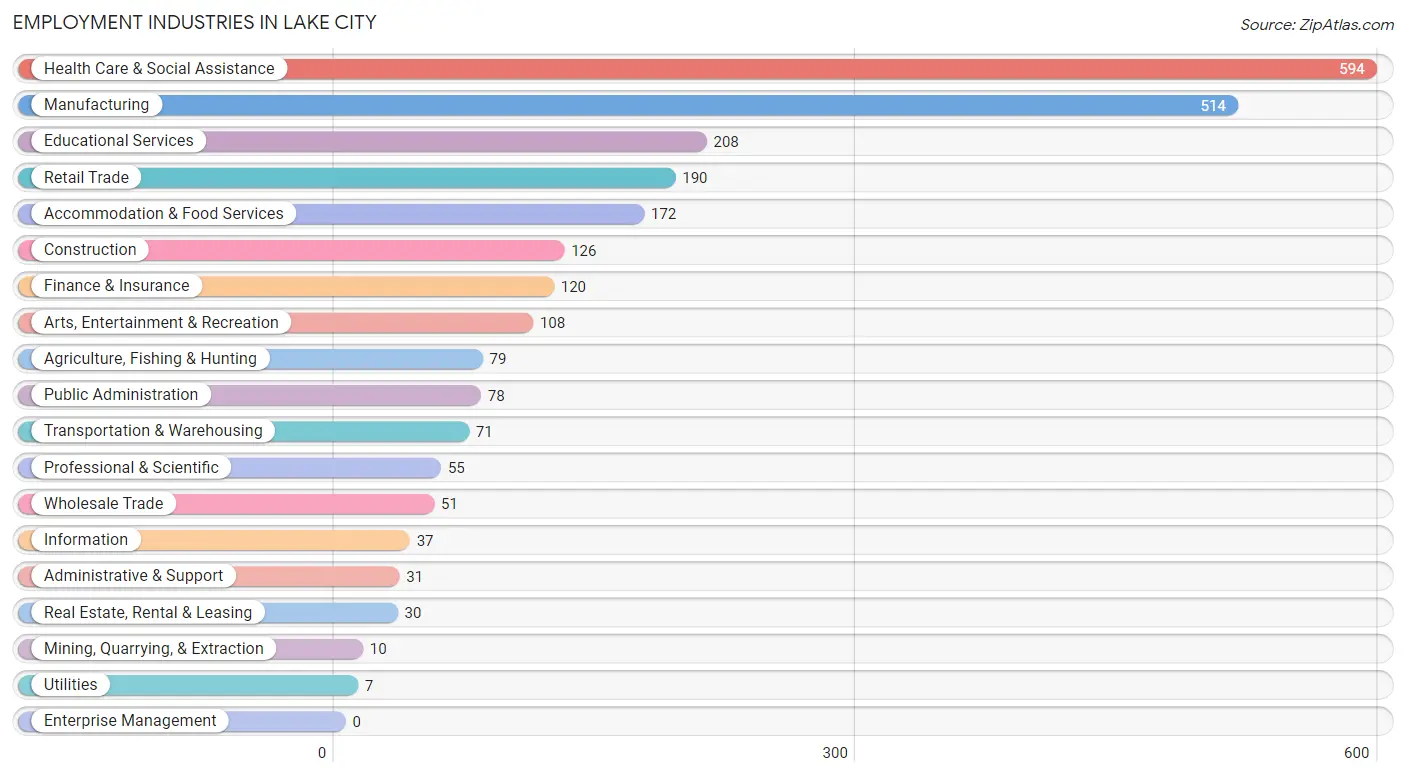
Employment Industries in Lake City
The major employment industries in Lake City include Health Care & Social Assistance (594 | 23.4%), Manufacturing (514 | 20.2%), Educational Services (208 | 8.2%), Retail Trade (190 | 7.5%), and Accommodation & Food Services (172 | 6.8%).
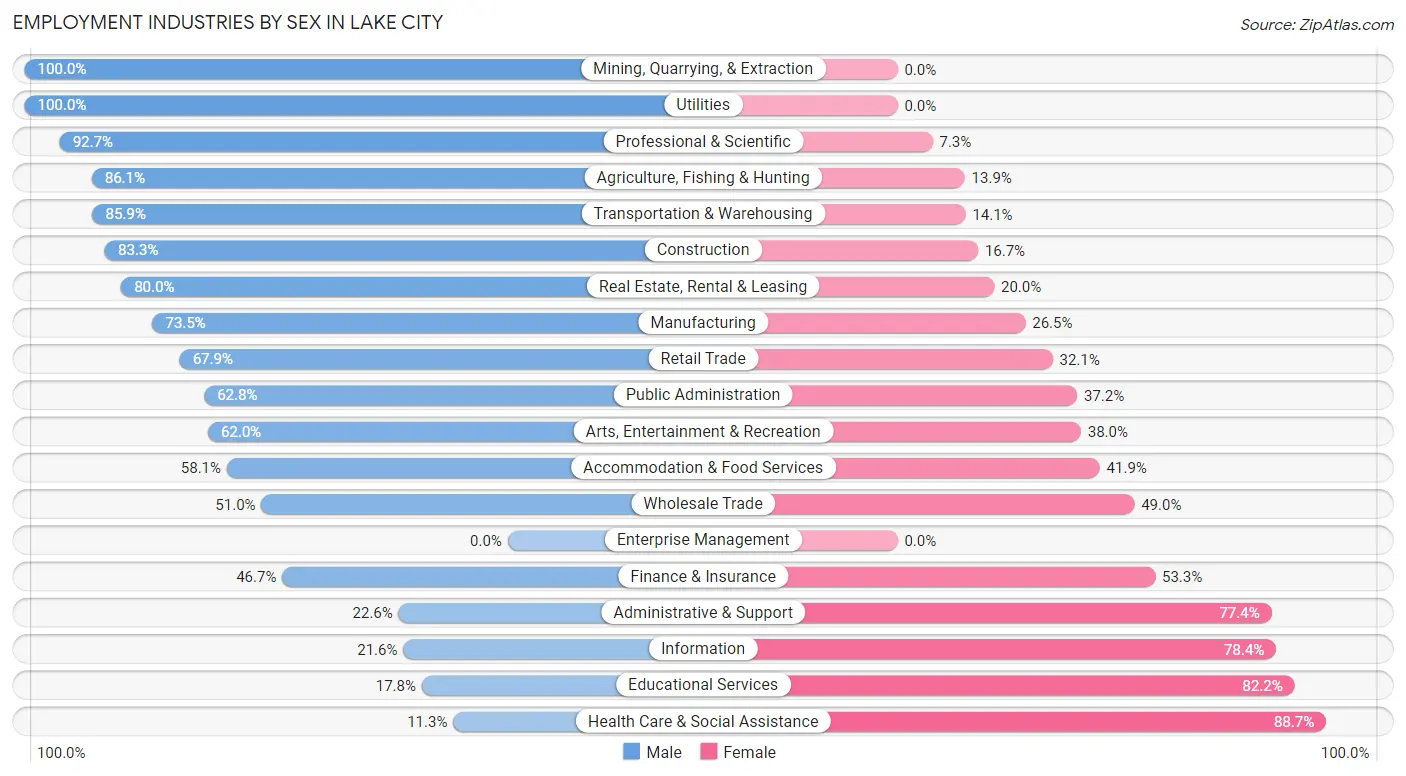
Employment Industries by Sex in Lake City
The Lake City industries that see more men than women are Mining, Quarrying, & Extraction (100.0%), Utilities (100.0%), and Professional & Scientific (92.7%), whereas the industries that tend to have a higher number of women are Health Care & Social Assistance (88.7%), Educational Services (82.2%), and Information (78.4%).
| Industry | Male | Female |
| Agriculture, Fishing & Hunting | 68 (86.1%) | 11 (13.9%) |
| Mining, Quarrying, & Extraction | 10 (100.0%) | 0 (0.0%) |
| Construction | 105 (83.3%) | 21 (16.7%) |
| Manufacturing | 378 (73.5%) | 136 (26.5%) |
| Wholesale Trade | 26 (51.0%) | 25 (49.0%) |
| Retail Trade | 129 (67.9%) | 61 (32.1%) |
| Transportation & Warehousing | 61 (85.9%) | 10 (14.1%) |
| Utilities | 7 (100.0%) | 0 (0.0%) |
| Information | 8 (21.6%) | 29 (78.4%) |
| Finance & Insurance | 56 (46.7%) | 64 (53.3%) |
| Real Estate, Rental & Leasing | 24 (80.0%) | 6 (20.0%) |
| Professional & Scientific | 51 (92.7%) | 4 (7.3%) |
| Enterprise Management | 0 (0.0%) | 0 (0.0%) |
| Administrative & Support | 7 (22.6%) | 24 (77.4%) |
| Educational Services | 37 (17.8%) | 171 (82.2%) |
| Health Care & Social Assistance | 67 (11.3%) | 527 (88.7%) |
| Arts, Entertainment & Recreation | 67 (62.0%) | 41 (38.0%) |
| Accommodation & Food Services | 100 (58.1%) | 72 (41.9%) |
| Public Administration | 49 (62.8%) | 29 (37.2%) |
| Total | 1,285 (50.5%) | 1,257 (49.4%) |
Education in Lake City
School Enrollment in Lake City
The most common levels of schooling among the 1,069 students in Lake City are middle school (298 | 27.9%), elementary school (203 | 19.0%), and high school (198 | 18.5%).
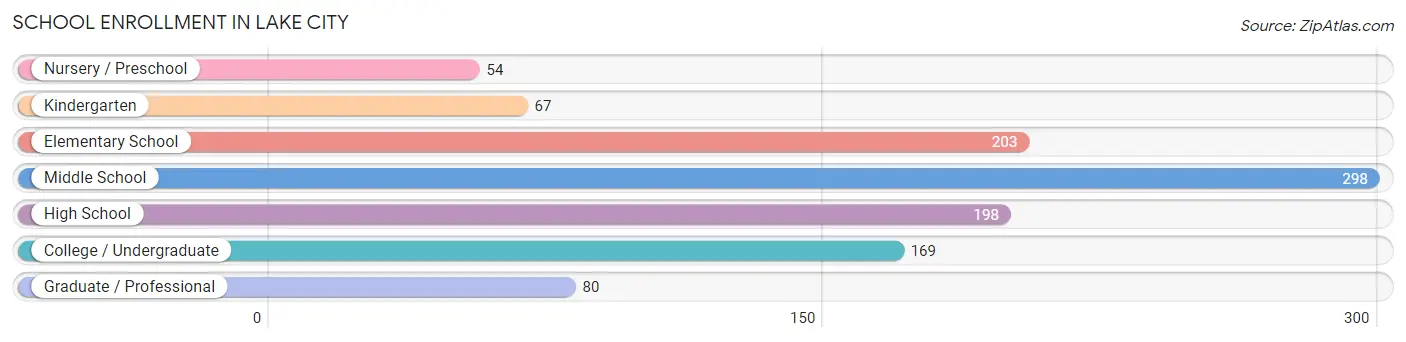
| School Level | # Students | % Students |
| Nursery / Preschool | 54 | 5.1% |
| Kindergarten | 67 | 6.3% |
| Elementary School | 203 | 19.0% |
| Middle School | 298 | 27.9% |
| High School | 198 | 18.5% |
| College / Undergraduate | 169 | 15.8% |
| Graduate / Professional | 80 | 7.5% |
| Total | 1,069 | 100.0% |
School Enrollment by Age by Funding Source in Lake City
Out of a total of 1,069 students who are enrolled in schools in Lake City, 100 (9.4%) attend a private institution, while the remaining 969 (90.6%) are enrolled in public schools. The age group of 20 to 24 year olds has the highest likelihood of being enrolled in private schools, with 41 (74.6% in the age bracket) enrolled. Conversely, the age group of 15 to 17 year olds has the lowest likelihood of being enrolled in a private school, with 114 (100.0% in the age bracket) attending a public institution.
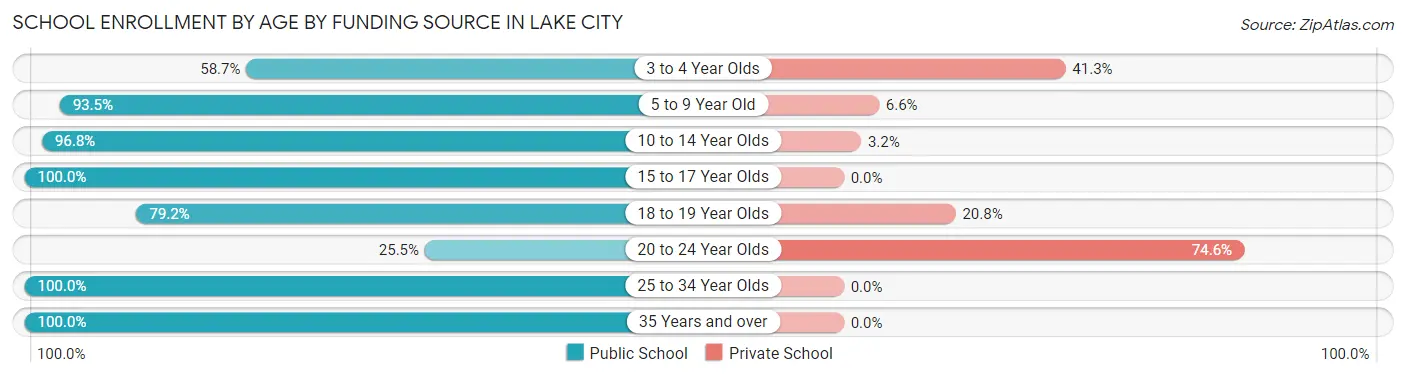
| Age Bracket | Public School | Private School |
| 3 to 4 Year Olds | 27 (58.7%) | 19 (41.3%) |
| 5 to 9 Year Old | 257 (93.4%) | 18 (6.6%) |
| 10 to 14 Year Olds | 360 (96.8%) | 12 (3.2%) |
| 15 to 17 Year Olds | 114 (100.0%) | 0 (0.0%) |
| 18 to 19 Year Olds | 38 (79.2%) | 10 (20.8%) |
| 20 to 24 Year Olds | 14 (25.5%) | 41 (74.6%) |
| 25 to 34 Year Olds | 46 (100.0%) | 0 (0.0%) |
| 35 Years and over | 113 (100.0%) | 0 (0.0%) |
| Total | 969 (90.6%) | 100 (9.4%) |
Educational Attainment by Field of Study in Lake City
Education (282 | 20.6%), business (214 | 15.6%), science & technology (213 | 15.6%), arts & humanities (154 | 11.3%), and social sciences (122 | 8.9%) are the most common fields of study among 1,368 individuals in Lake City who have obtained a bachelor's degree or higher.
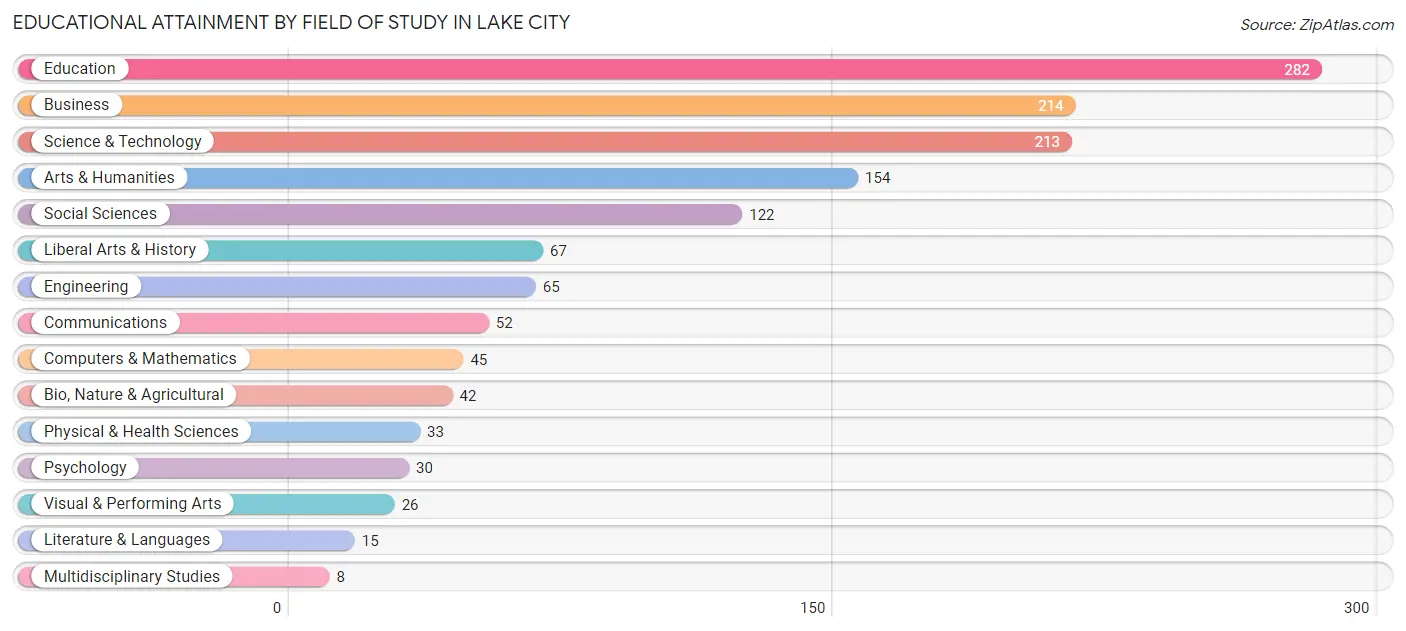
| Field of Study | # Graduates | % Graduates |
| Computers & Mathematics | 45 | 3.3% |
| Bio, Nature & Agricultural | 42 | 3.1% |
| Physical & Health Sciences | 33 | 2.4% |
| Psychology | 30 | 2.2% |
| Social Sciences | 122 | 8.9% |
| Engineering | 65 | 4.8% |
| Multidisciplinary Studies | 8 | 0.6% |
| Science & Technology | 213 | 15.6% |
| Business | 214 | 15.6% |
| Education | 282 | 20.6% |
| Literature & Languages | 15 | 1.1% |
| Liberal Arts & History | 67 | 4.9% |
| Visual & Performing Arts | 26 | 1.9% |
| Communications | 52 | 3.8% |
| Arts & Humanities | 154 | 11.3% |
| Total | 1,368 | 100.0% |
Transportation & Commute in Lake City
Vehicle Availability by Sex in Lake City
The most prevalent vehicle ownership categories in Lake City are males with 2 vehicles (538, accounting for 43.2%) and females with 2 vehicles (522, making up 43.1%).
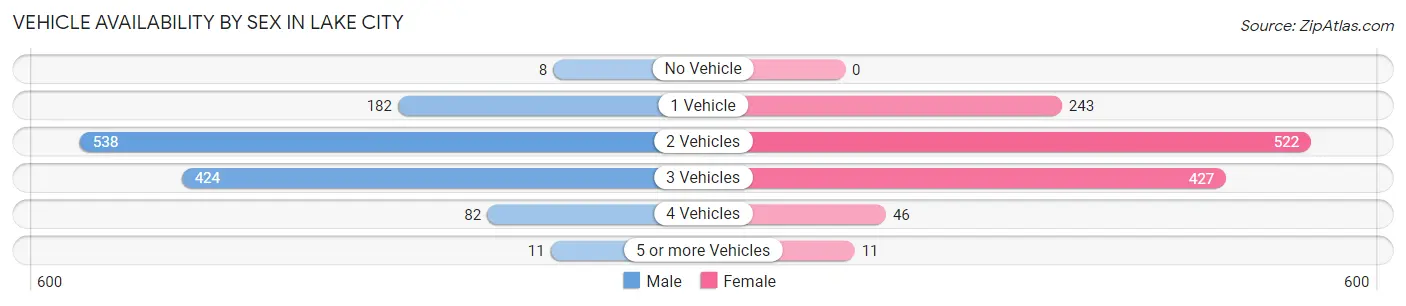
| Vehicles Available | Male | Female |
| No Vehicle | 8 (0.6%) | 0 (0.0%) |
| 1 Vehicle | 182 (14.6%) | 243 (19.5%) |
| 2 Vehicles | 538 (43.2%) | 522 (41.8%) |
| 3 Vehicles | 424 (34.1%) | 427 (34.2%) |
| 4 Vehicles | 82 (6.6%) | 46 (3.7%) |
| 5 or more Vehicles | 11 (0.9%) | 11 (0.9%) |
| Total | 1,245 (100.0%) | 1,249 (100.0%) |
Commute Time in Lake City
The most frequently occuring commute durations in Lake City are 5 to 9 minutes (538 commuters, 23.3%), less than 5 minutes (473 commuters, 20.5%), and 30 to 34 minutes (310 commuters, 13.4%).
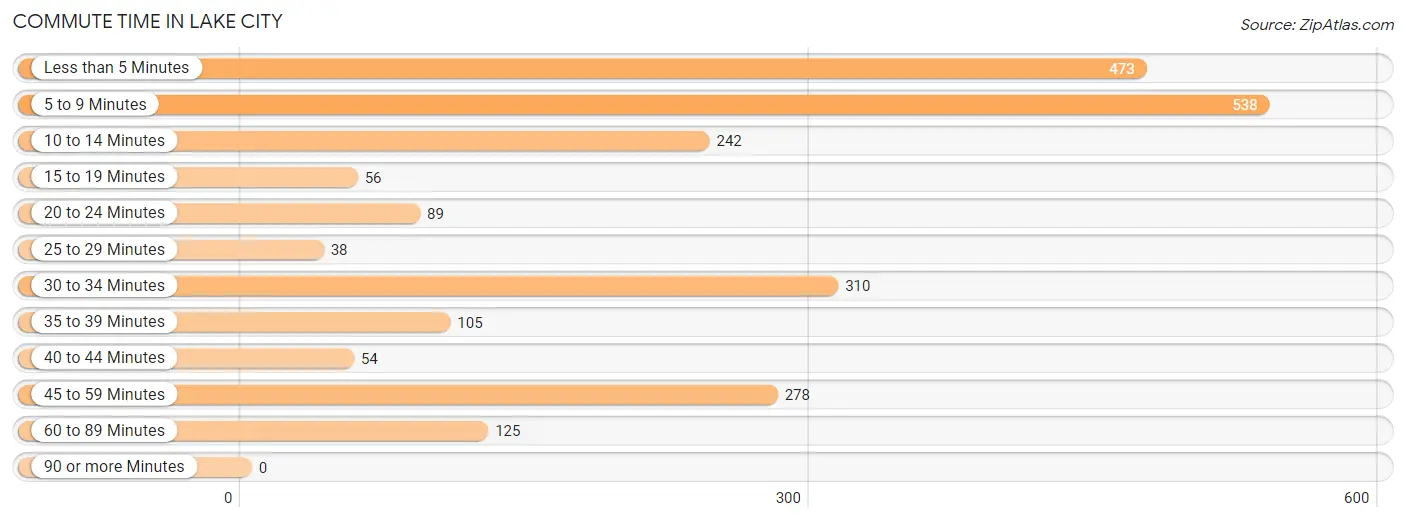
| Commute Time | # Commuters | % Commuters |
| Less than 5 Minutes | 473 | 20.5% |
| 5 to 9 Minutes | 538 | 23.3% |
| 10 to 14 Minutes | 242 | 10.5% |
| 15 to 19 Minutes | 56 | 2.4% |
| 20 to 24 Minutes | 89 | 3.9% |
| 25 to 29 Minutes | 38 | 1.7% |
| 30 to 34 Minutes | 310 | 13.4% |
| 35 to 39 Minutes | 105 | 4.5% |
| 40 to 44 Minutes | 54 | 2.3% |
| 45 to 59 Minutes | 278 | 12.0% |
| 60 to 89 Minutes | 125 | 5.4% |
| 90 or more Minutes | 0 | 0.0% |
Commute Time by Sex in Lake City
The most common commute times in Lake City are 5 to 9 minutes (310 commuters, 25.4%) for males and 5 to 9 minutes (228 commuters, 21.0%) for females.
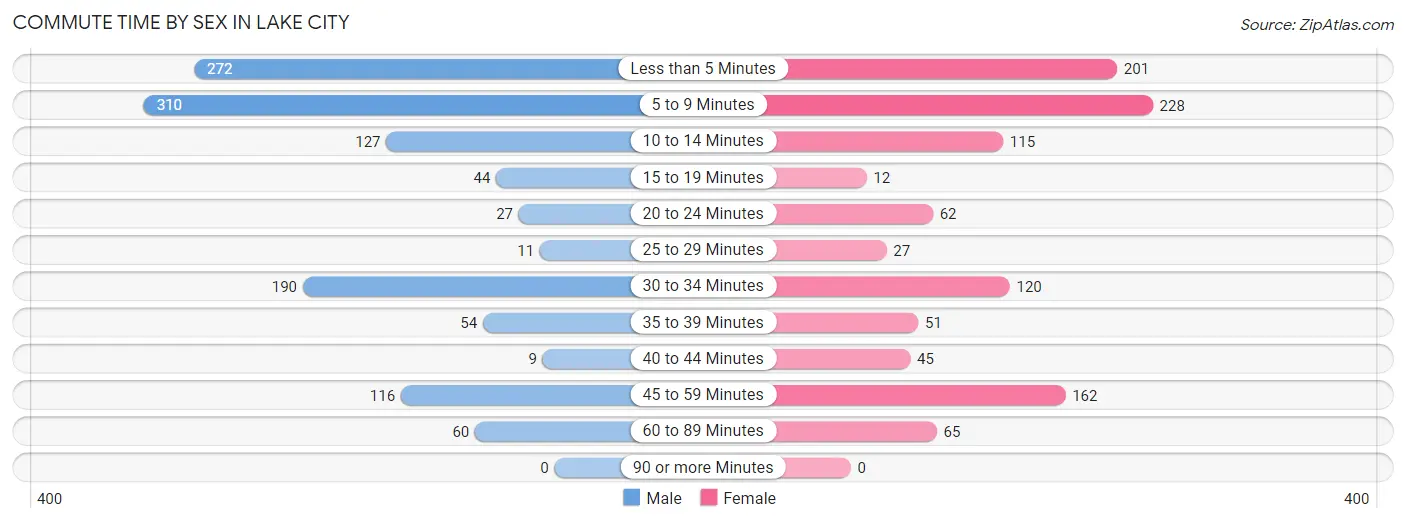
| Commute Time | Male | Female |
| Less than 5 Minutes | 272 (22.3%) | 201 (18.5%) |
| 5 to 9 Minutes | 310 (25.4%) | 228 (21.0%) |
| 10 to 14 Minutes | 127 (10.4%) | 115 (10.6%) |
| 15 to 19 Minutes | 44 (3.6%) | 12 (1.1%) |
| 20 to 24 Minutes | 27 (2.2%) | 62 (5.7%) |
| 25 to 29 Minutes | 11 (0.9%) | 27 (2.5%) |
| 30 to 34 Minutes | 190 (15.6%) | 120 (11.0%) |
| 35 to 39 Minutes | 54 (4.4%) | 51 (4.7%) |
| 40 to 44 Minutes | 9 (0.7%) | 45 (4.1%) |
| 45 to 59 Minutes | 116 (9.5%) | 162 (14.9%) |
| 60 to 89 Minutes | 60 (4.9%) | 65 (6.0%) |
| 90 or more Minutes | 0 (0.0%) | 0 (0.0%) |
Time of Departure to Work by Sex in Lake City
The most frequent times of departure to work in Lake City are 7:00 AM to 7:29 AM (264, 21.6%) for males and 7:30 AM to 7:59 AM (187, 17.2%) for females.
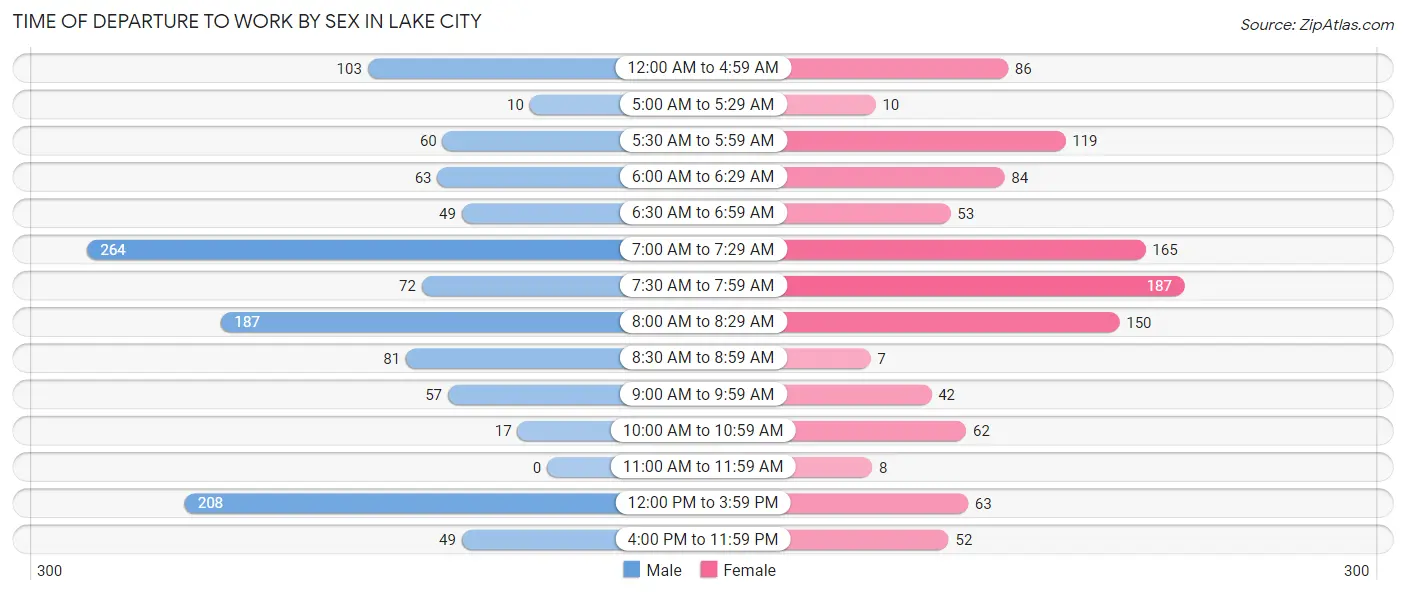
| Time of Departure | Male | Female |
| 12:00 AM to 4:59 AM | 103 (8.4%) | 86 (7.9%) |
| 5:00 AM to 5:29 AM | 10 (0.8%) | 10 (0.9%) |
| 5:30 AM to 5:59 AM | 60 (4.9%) | 119 (10.9%) |
| 6:00 AM to 6:29 AM | 63 (5.2%) | 84 (7.7%) |
| 6:30 AM to 6:59 AM | 49 (4.0%) | 53 (4.9%) |
| 7:00 AM to 7:29 AM | 264 (21.6%) | 165 (15.2%) |
| 7:30 AM to 7:59 AM | 72 (5.9%) | 187 (17.2%) |
| 8:00 AM to 8:29 AM | 187 (15.3%) | 150 (13.8%) |
| 8:30 AM to 8:59 AM | 81 (6.6%) | 7 (0.6%) |
| 9:00 AM to 9:59 AM | 57 (4.7%) | 42 (3.9%) |
| 10:00 AM to 10:59 AM | 17 (1.4%) | 62 (5.7%) |
| 11:00 AM to 11:59 AM | 0 (0.0%) | 8 (0.7%) |
| 12:00 PM to 3:59 PM | 208 (17.1%) | 63 (5.8%) |
| 4:00 PM to 11:59 PM | 49 (4.0%) | 52 (4.8%) |
| Total | 1,220 (100.0%) | 1,088 (100.0%) |
Housing Occupancy in Lake City
Occupancy by Ownership in Lake City
Of the total 2,346 dwellings in Lake City, owner-occupied units account for 1,787 (76.2%), while renter-occupied units make up 559 (23.8%).
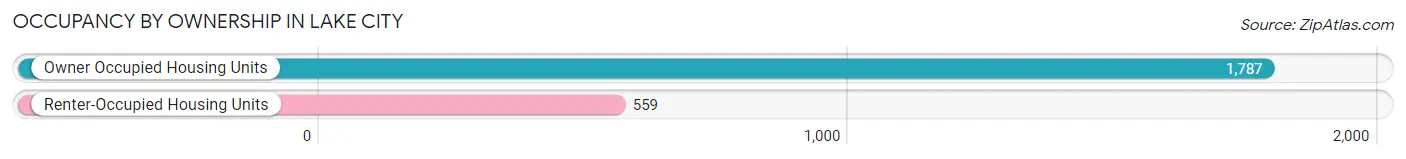
| Occupancy | # Housing Units | % Housing Units |
| Owner Occupied Housing Units | 1,787 | 76.2% |
| Renter-Occupied Housing Units | 559 | 23.8% |
| Total Occupied Housing Units | 2,346 | 100.0% |
Occupancy by Household Size in Lake City
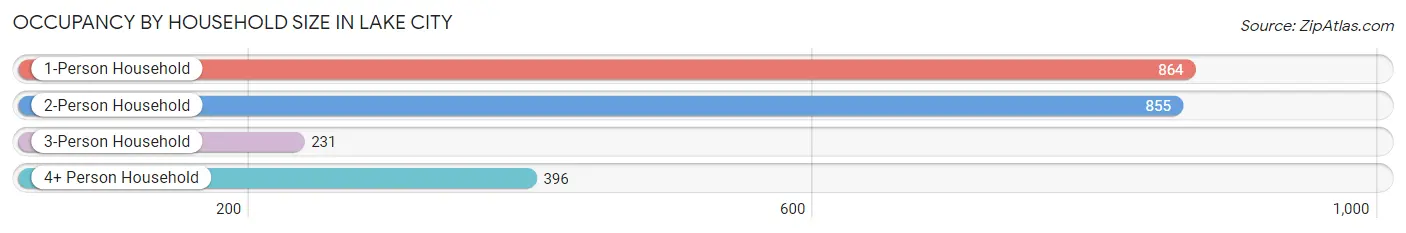
| Household Size | # Housing Units | % Housing Units |
| 1-Person Household | 864 | 36.8% |
| 2-Person Household | 855 | 36.4% |
| 3-Person Household | 231 | 9.9% |
| 4+ Person Household | 396 | 16.9% |
| Total Housing Units | 2,346 | 100.0% |
Occupancy by Ownership by Household Size in Lake City
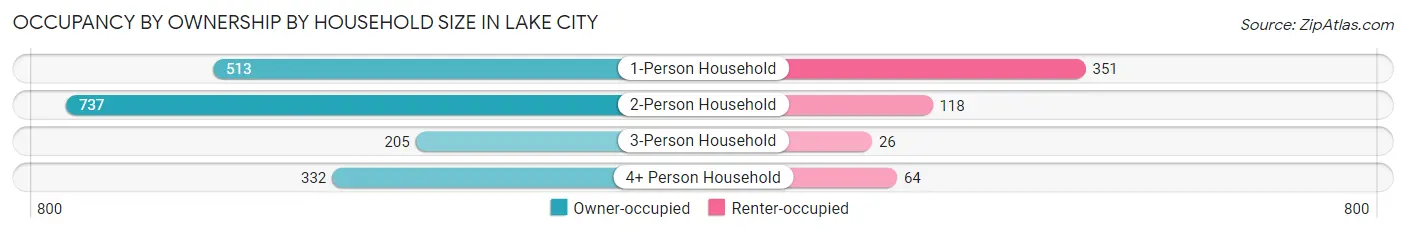
| Household Size | Owner-occupied | Renter-occupied |
| 1-Person Household | 513 (59.4%) | 351 (40.6%) |
| 2-Person Household | 737 (86.2%) | 118 (13.8%) |
| 3-Person Household | 205 (88.7%) | 26 (11.3%) |
| 4+ Person Household | 332 (83.8%) | 64 (16.2%) |
| Total Housing Units | 1,787 (76.2%) | 559 (23.8%) |
Occupancy by Educational Attainment in Lake City
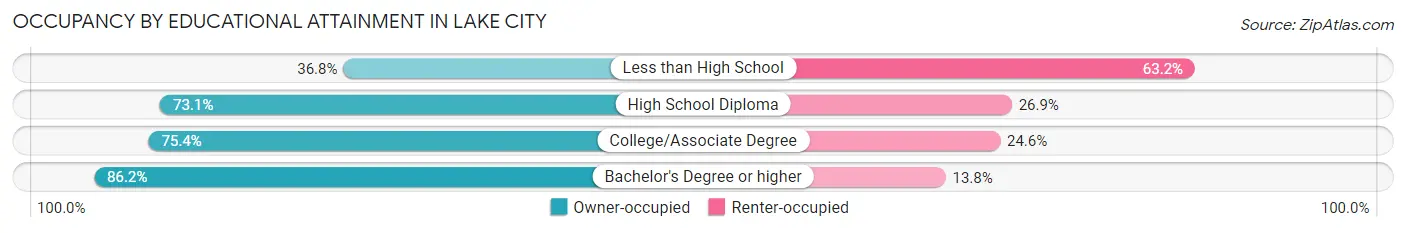
| Household Size | Owner-occupied | Renter-occupied |
| Less than High School | 53 (36.8%) | 91 (63.2%) |
| High School Diploma | 479 (73.1%) | 176 (26.9%) |
| College/Associate Degree | 553 (75.4%) | 180 (24.6%) |
| Bachelor's Degree or higher | 702 (86.2%) | 112 (13.8%) |
Occupancy by Age of Householder in Lake City
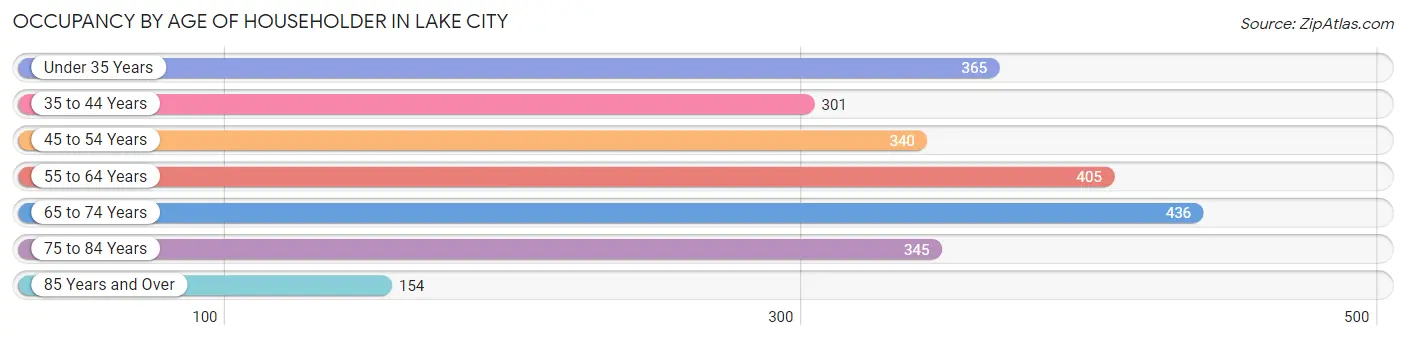
| Age Bracket | # Households | % Households |
| Under 35 Years | 365 | 15.6% |
| 35 to 44 Years | 301 | 12.8% |
| 45 to 54 Years | 340 | 14.5% |
| 55 to 64 Years | 405 | 17.3% |
| 65 to 74 Years | 436 | 18.6% |
| 75 to 84 Years | 345 | 14.7% |
| 85 Years and Over | 154 | 6.6% |
| Total | 2,346 | 100.0% |
Housing Finances in Lake City
Median Income by Occupancy in Lake City
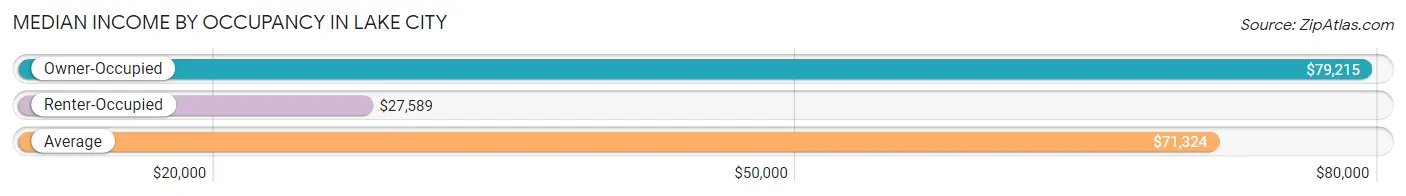
| Occupancy Type | # Households | Median Income |
| Owner-Occupied | 1,787 (76.2%) | $79,215 |
| Renter-Occupied | 559 (23.8%) | $27,589 |
| Average | 2,346 (100.0%) | $71,324 |
Occupancy by Householder Income Bracket in Lake City
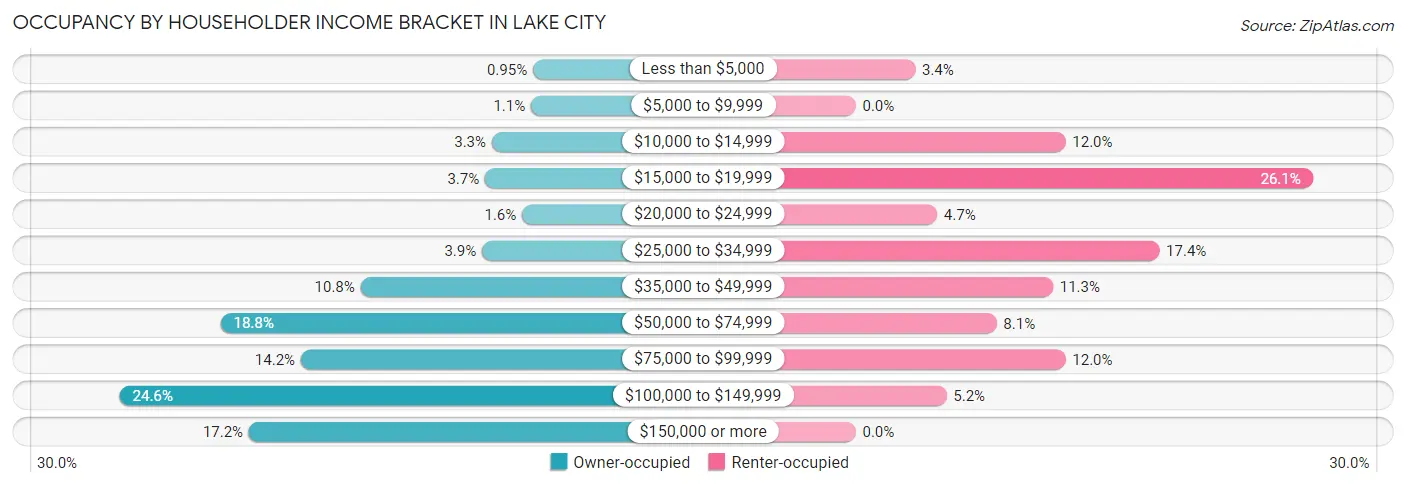
| Income Bracket | Owner-occupied | Renter-occupied |
| Less than $5,000 | 17 (0.9%) | 19 (3.4%) |
| $5,000 to $9,999 | 19 (1.1%) | 0 (0.0%) |
| $10,000 to $14,999 | 59 (3.3%) | 67 (12.0%) |
| $15,000 to $19,999 | 66 (3.7%) | 146 (26.1%) |
| $20,000 to $24,999 | 28 (1.6%) | 26 (4.6%) |
| $25,000 to $34,999 | 69 (3.9%) | 97 (17.3%) |
| $35,000 to $49,999 | 193 (10.8%) | 63 (11.3%) |
| $50,000 to $74,999 | 336 (18.8%) | 45 (8.1%) |
| $75,000 to $99,999 | 254 (14.2%) | 67 (12.0%) |
| $100,000 to $149,999 | 439 (24.6%) | 29 (5.2%) |
| $150,000 or more | 307 (17.2%) | 0 (0.0%) |
| Total | 1,787 (100.0%) | 559 (100.0%) |
Monthly Housing Cost Tiers in Lake City
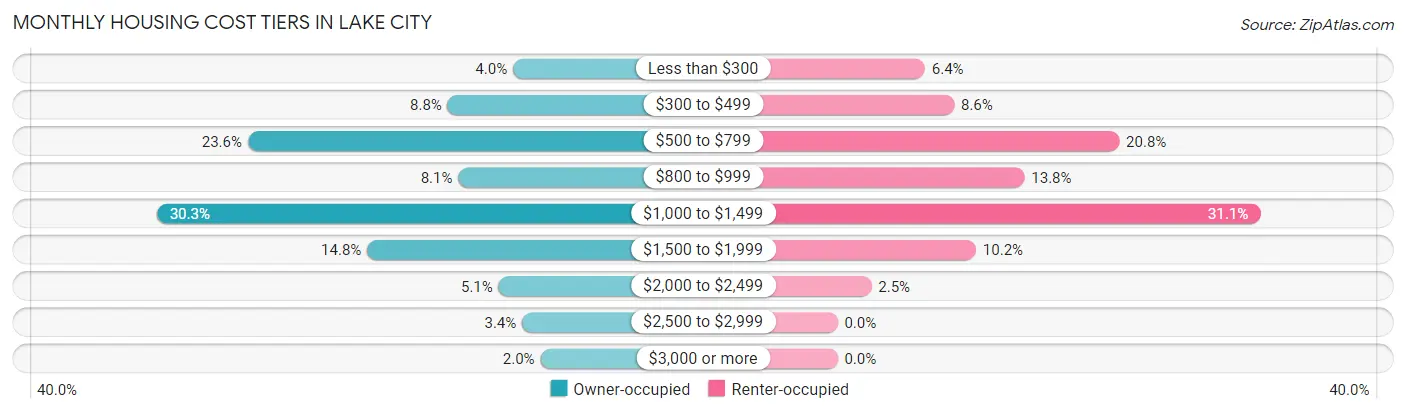
| Monthly Cost | Owner-occupied | Renter-occupied |
| Less than $300 | 72 (4.0%) | 36 (6.4%) |
| $300 to $499 | 158 (8.8%) | 48 (8.6%) |
| $500 to $799 | 421 (23.6%) | 116 (20.7%) |
| $800 to $999 | 144 (8.1%) | 77 (13.8%) |
| $1,000 to $1,499 | 541 (30.3%) | 174 (31.1%) |
| $1,500 to $1,999 | 264 (14.8%) | 57 (10.2%) |
| $2,000 to $2,499 | 91 (5.1%) | 14 (2.5%) |
| $2,500 to $2,999 | 60 (3.4%) | 0 (0.0%) |
| $3,000 or more | 36 (2.0%) | 0 (0.0%) |
| Total | 1,787 (100.0%) | 559 (100.0%) |
Physical Housing Characteristics in Lake City
Housing Structures in Lake City
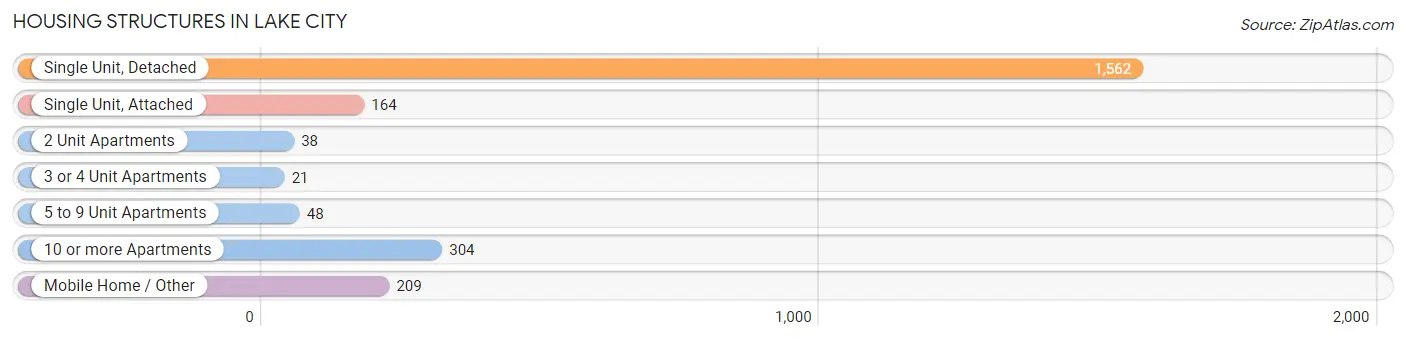
| Structure Type | # Housing Units | % Housing Units |
| Single Unit, Detached | 1,562 | 66.6% |
| Single Unit, Attached | 164 | 7.0% |
| 2 Unit Apartments | 38 | 1.6% |
| 3 or 4 Unit Apartments | 21 | 0.9% |
| 5 to 9 Unit Apartments | 48 | 2.1% |
| 10 or more Apartments | 304 | 13.0% |
| Mobile Home / Other | 209 | 8.9% |
| Total | 2,346 | 100.0% |
Housing Structures by Occupancy in Lake City
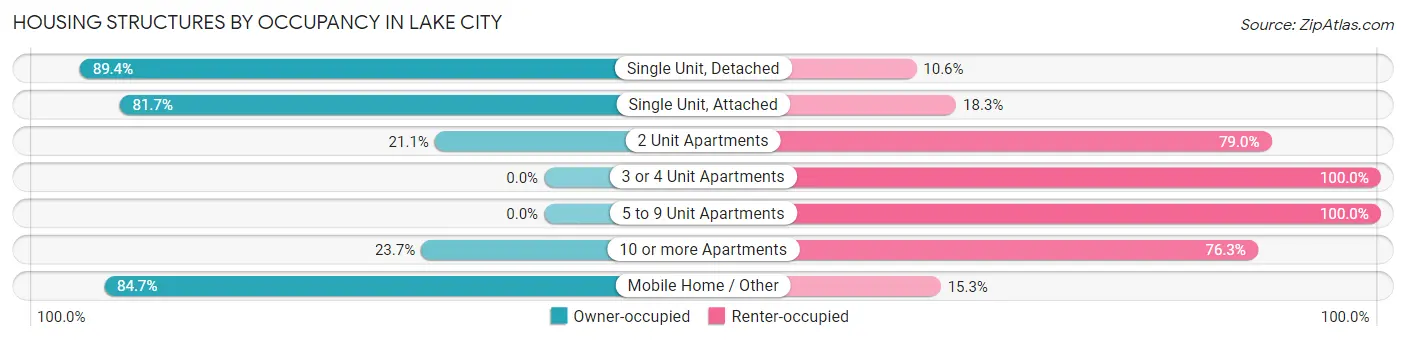
| Structure Type | Owner-occupied | Renter-occupied |
| Single Unit, Detached | 1,396 (89.4%) | 166 (10.6%) |
| Single Unit, Attached | 134 (81.7%) | 30 (18.3%) |
| 2 Unit Apartments | 8 (21.0%) | 30 (78.9%) |
| 3 or 4 Unit Apartments | 0 (0.0%) | 21 (100.0%) |
| 5 to 9 Unit Apartments | 0 (0.0%) | 48 (100.0%) |
| 10 or more Apartments | 72 (23.7%) | 232 (76.3%) |
| Mobile Home / Other | 177 (84.7%) | 32 (15.3%) |
| Total | 1,787 (76.2%) | 559 (23.8%) |
Housing Structures by Number of Rooms in Lake City
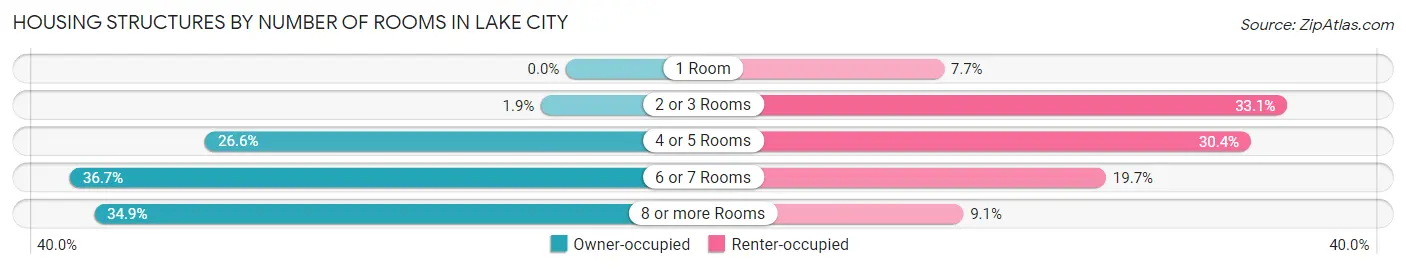
| Number of Rooms | Owner-occupied | Renter-occupied |
| 1 Room | 0 (0.0%) | 43 (7.7%) |
| 2 or 3 Rooms | 33 (1.8%) | 185 (33.1%) |
| 4 or 5 Rooms | 476 (26.6%) | 170 (30.4%) |
| 6 or 7 Rooms | 655 (36.6%) | 110 (19.7%) |
| 8 or more Rooms | 623 (34.9%) | 51 (9.1%) |
| Total | 1,787 (100.0%) | 559 (100.0%) |
Housing Structure by Heating Type in Lake City
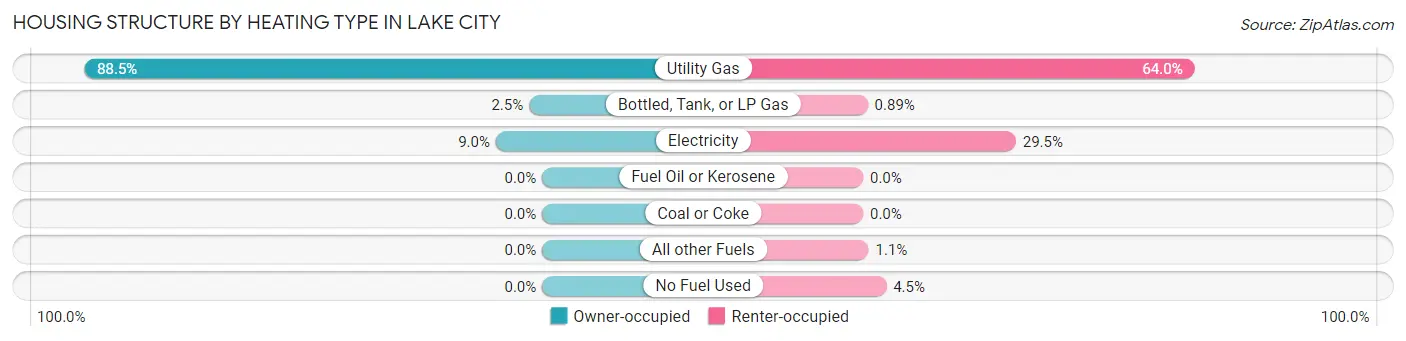
| Heating Type | Owner-occupied | Renter-occupied |
| Utility Gas | 1,582 (88.5%) | 358 (64.0%) |
| Bottled, Tank, or LP Gas | 45 (2.5%) | 5 (0.9%) |
| Electricity | 160 (8.9%) | 165 (29.5%) |
| Fuel Oil or Kerosene | 0 (0.0%) | 0 (0.0%) |
| Coal or Coke | 0 (0.0%) | 0 (0.0%) |
| All other Fuels | 0 (0.0%) | 6 (1.1%) |
| No Fuel Used | 0 (0.0%) | 25 (4.5%) |
| Total | 1,787 (100.0%) | 559 (100.0%) |
Household Vehicle Usage in Lake City
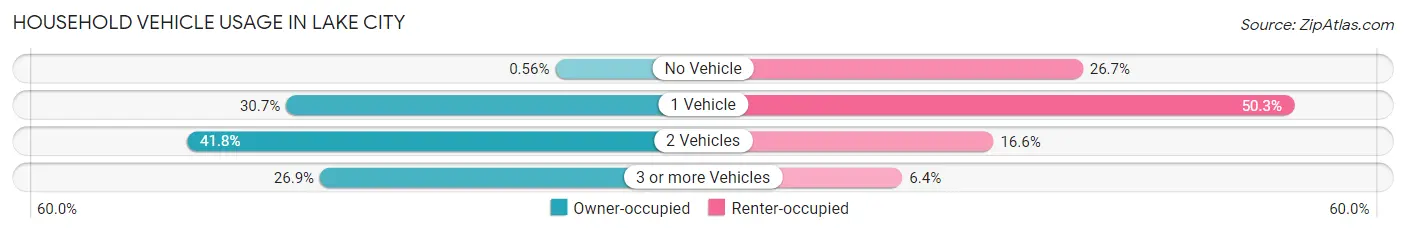
| Vehicles per Household | Owner-occupied | Renter-occupied |
| No Vehicle | 10 (0.6%) | 149 (26.7%) |
| 1 Vehicle | 549 (30.7%) | 281 (50.3%) |
| 2 Vehicles | 747 (41.8%) | 93 (16.6%) |
| 3 or more Vehicles | 481 (26.9%) | 36 (6.4%) |
| Total | 1,787 (100.0%) | 559 (100.0%) |
Real Estate & Mortgages in Lake City
Real Estate and Mortgage Overview in Lake City
| Characteristic | Without Mortgage | With Mortgage |
| Housing Units | 743 | 1,044 |
| Median Property Value | $230,800 | $223,800 |
| Median Household Income | $70,433 | $205 |
| Monthly Housing Costs | $573 | $36 |
| Real Estate Taxes | $2,772 | $14 |
Property Value by Mortgage Status in Lake City
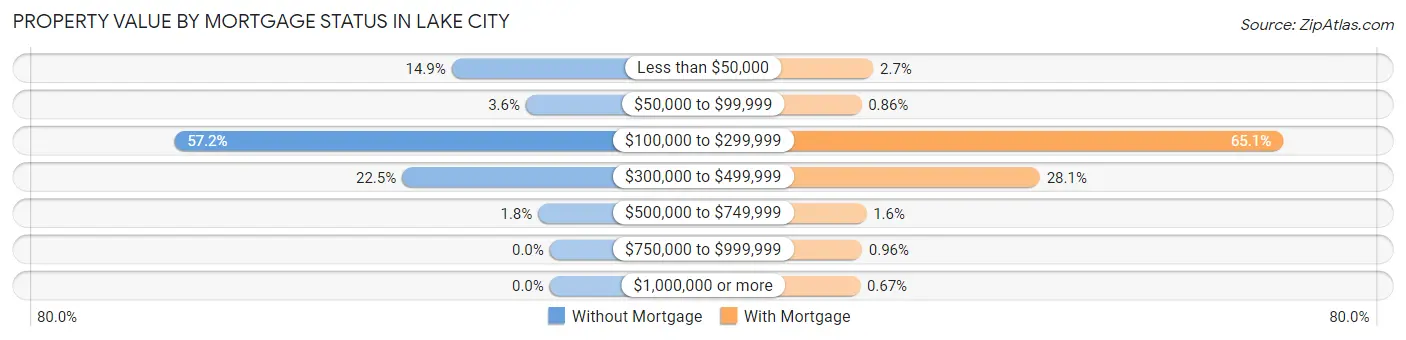
| Property Value | Without Mortgage | With Mortgage |
| Less than $50,000 | 111 (14.9%) | 28 (2.7%) |
| $50,000 to $99,999 | 27 (3.6%) | 9 (0.9%) |
| $100,000 to $299,999 | 425 (57.2%) | 680 (65.1%) |
| $300,000 to $499,999 | 167 (22.5%) | 293 (28.1%) |
| $500,000 to $749,999 | 13 (1.8%) | 17 (1.6%) |
| $750,000 to $999,999 | 0 (0.0%) | 10 (1.0%) |
| $1,000,000 or more | 0 (0.0%) | 7 (0.7%) |
| Total | 743 (100.0%) | 1,044 (100.0%) |
Household Income by Mortgage Status in Lake City
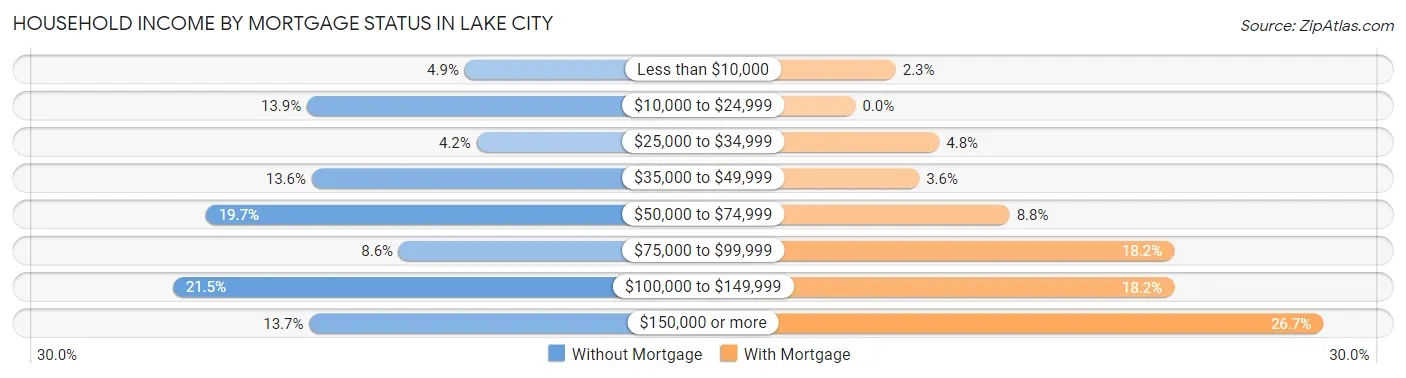
| Household Income | Without Mortgage | With Mortgage |
| Less than $10,000 | 36 (4.9%) | 24 (2.3%) |
| $10,000 to $24,999 | 103 (13.9%) | 0 (0.0%) |
| $25,000 to $34,999 | 31 (4.2%) | 50 (4.8%) |
| $35,000 to $49,999 | 101 (13.6%) | 38 (3.6%) |
| $50,000 to $74,999 | 146 (19.7%) | 92 (8.8%) |
| $75,000 to $99,999 | 64 (8.6%) | 190 (18.2%) |
| $100,000 to $149,999 | 160 (21.5%) | 190 (18.2%) |
| $150,000 or more | 102 (13.7%) | 279 (26.7%) |
| Total | 743 (100.0%) | 1,044 (100.0%) |
Property Value to Household Income Ratio in Lake City
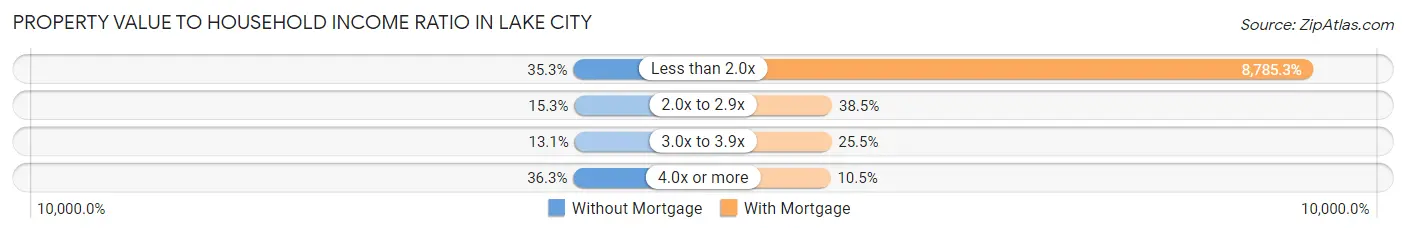
| Value-to-Income Ratio | Without Mortgage | With Mortgage |
| Less than 2.0x | 262 (35.3%) | 91,719 (8,785.3%) |
| 2.0x to 2.9x | 114 (15.3%) | 402 (38.5%) |
| 3.0x to 3.9x | 97 (13.1%) | 266 (25.5%) |
| 4.0x or more | 270 (36.3%) | 110 (10.5%) |
| Total | 743 (100.0%) | 1,044 (100.0%) |
Real Estate Taxes by Mortgage Status in Lake City
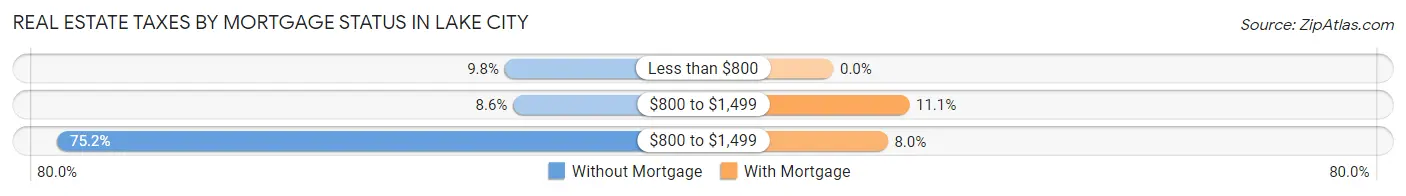
| Property Taxes | Without Mortgage | With Mortgage |
| Less than $800 | 73 (9.8%) | 0 (0.0%) |
| $800 to $1,499 | 64 (8.6%) | 116 (11.1%) |
| $800 to $1,499 | 559 (75.2%) | 83 (8.0%) |
| Total | 743 (100.0%) | 1,044 (100.0%) |
Health & Disability in Lake City
Health Insurance Coverage by Age in Lake City
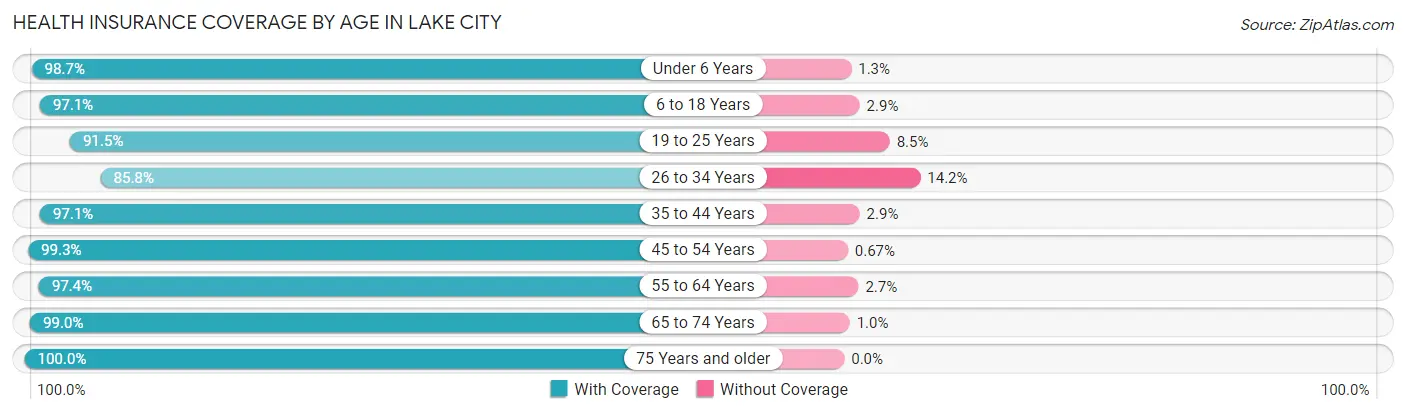
| Age Bracket | With Coverage | Without Coverage |
| Under 6 Years | 227 (98.7%) | 3 (1.3%) |
| 6 to 18 Years | 781 (97.1%) | 23 (2.9%) |
| 19 to 25 Years | 227 (91.5%) | 21 (8.5%) |
| 26 to 34 Years | 454 (85.8%) | 75 (14.2%) |
| 35 to 44 Years | 510 (97.1%) | 15 (2.9%) |
| 45 to 54 Years | 593 (99.3%) | 4 (0.7%) |
| 55 to 64 Years | 697 (97.4%) | 19 (2.6%) |
| 65 to 74 Years | 686 (99.0%) | 7 (1.0%) |
| 75 Years and older | 646 (100.0%) | 0 (0.0%) |
| Total | 4,821 (96.7%) | 167 (3.4%) |
Health Insurance Coverage by Citizenship Status in Lake City
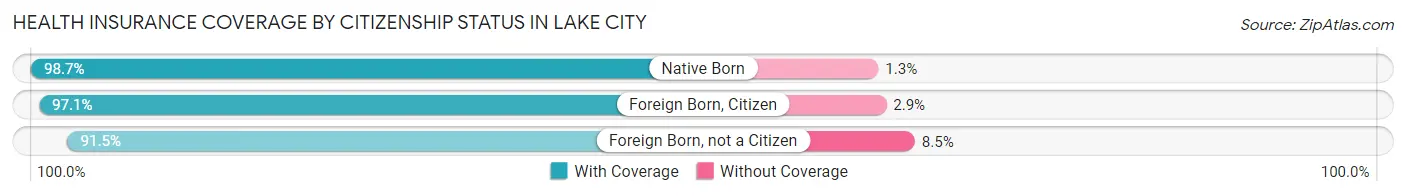
| Citizenship Status | With Coverage | Without Coverage |
| Native Born | 227 (98.7%) | 3 (1.3%) |
| Foreign Born, Citizen | 781 (97.1%) | 23 (2.9%) |
| Foreign Born, not a Citizen | 227 (91.5%) | 21 (8.5%) |
Health Insurance Coverage by Household Income in Lake City
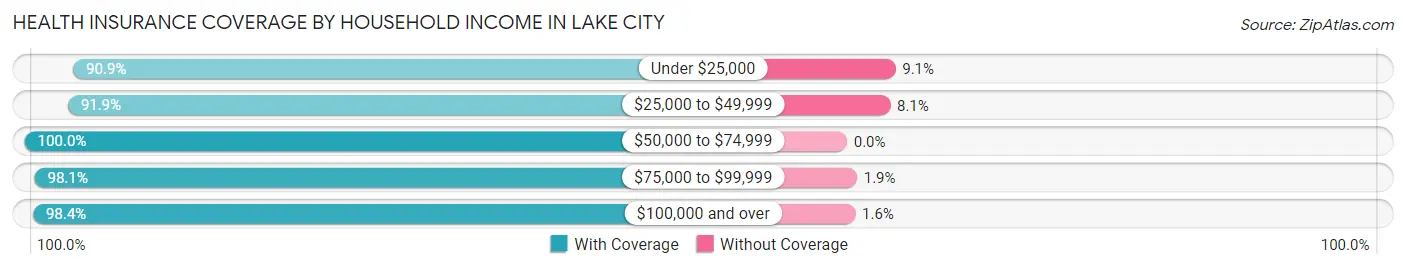
| Household Income | With Coverage | Without Coverage |
| Under $25,000 | 531 (90.9%) | 53 (9.1%) |
| $25,000 to $49,999 | 726 (91.9%) | 64 (8.1%) |
| $50,000 to $74,999 | 668 (100.0%) | 0 (0.0%) |
| $75,000 to $99,999 | 787 (98.1%) | 15 (1.9%) |
| $100,000 and over | 2,087 (98.4%) | 33 (1.6%) |
Public vs Private Health Insurance Coverage by Age in Lake City
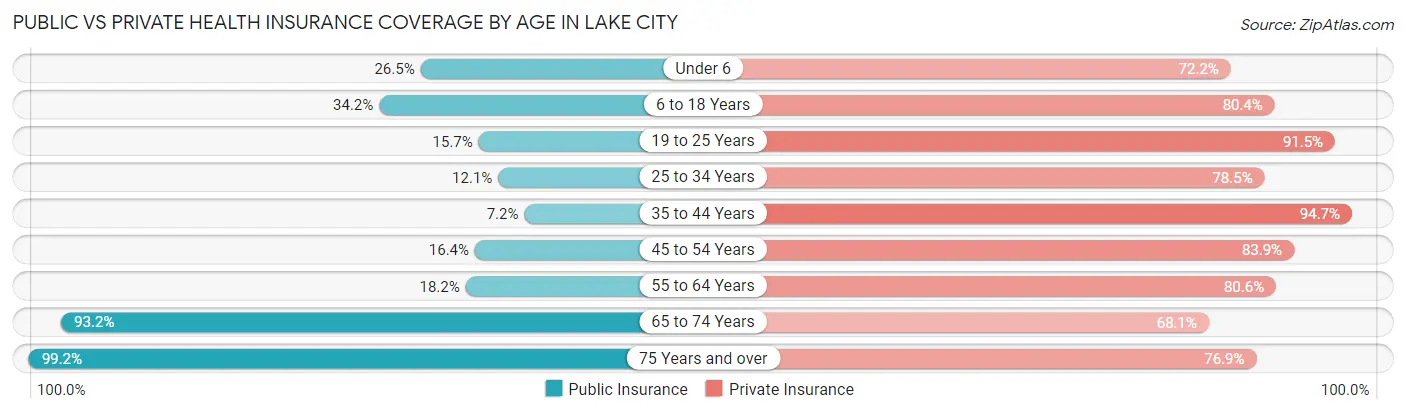
| Age Bracket | Public Insurance | Private Insurance |
| Under 6 | 61 (26.5%) | 166 (72.2%) |
| 6 to 18 Years | 275 (34.2%) | 646 (80.3%) |
| 19 to 25 Years | 39 (15.7%) | 227 (91.5%) |
| 25 to 34 Years | 64 (12.1%) | 415 (78.4%) |
| 35 to 44 Years | 38 (7.2%) | 497 (94.7%) |
| 45 to 54 Years | 98 (16.4%) | 501 (83.9%) |
| 55 to 64 Years | 130 (18.2%) | 577 (80.6%) |
| 65 to 74 Years | 646 (93.2%) | 472 (68.1%) |
| 75 Years and over | 641 (99.2%) | 497 (76.9%) |
| Total | 1,992 (39.9%) | 3,998 (80.1%) |
Disability Status by Sex by Age in Lake City
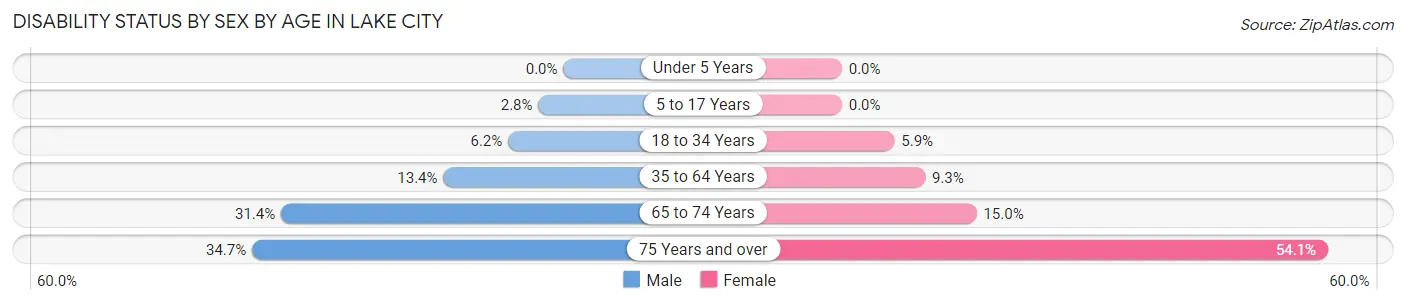
| Age Bracket | Male | Female |
| Under 5 Years | 0 (0.0%) | 0 (0.0%) |
| 5 to 17 Years | 11 (2.8%) | 0 (0.0%) |
| 18 to 34 Years | 24 (6.1%) | 25 (5.9%) |
| 35 to 64 Years | 123 (13.4%) | 85 (9.3%) |
| 65 to 74 Years | 111 (31.4%) | 51 (15.0%) |
| 75 Years and over | 69 (34.7%) | 242 (54.1%) |
Disability Class by Sex by Age in Lake City
Disability Class: Hearing Difficulty
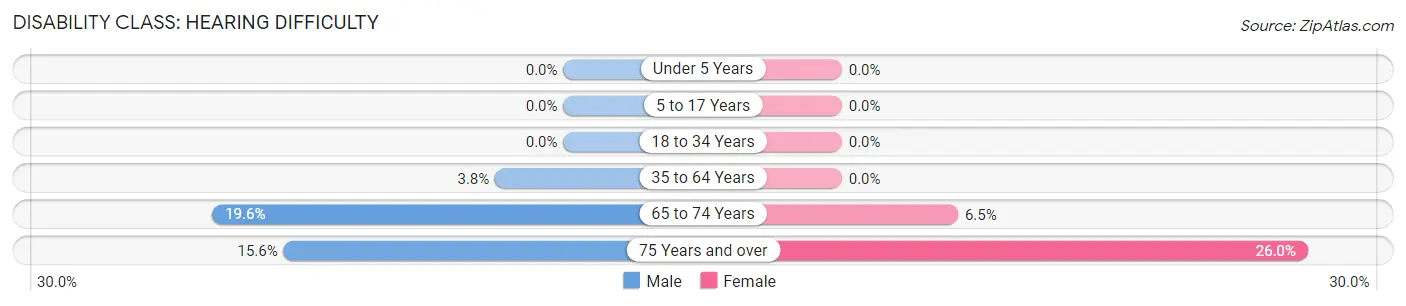
| Age Bracket | Male | Female |
| Under 5 Years | 0 (0.0%) | 0 (0.0%) |
| 5 to 17 Years | 0 (0.0%) | 0 (0.0%) |
| 18 to 34 Years | 0 (0.0%) | 0 (0.0%) |
| 35 to 64 Years | 35 (3.8%) | 0 (0.0%) |
| 65 to 74 Years | 69 (19.6%) | 22 (6.5%) |
| 75 Years and over | 31 (15.6%) | 116 (26.0%) |
Disability Class: Vision Difficulty
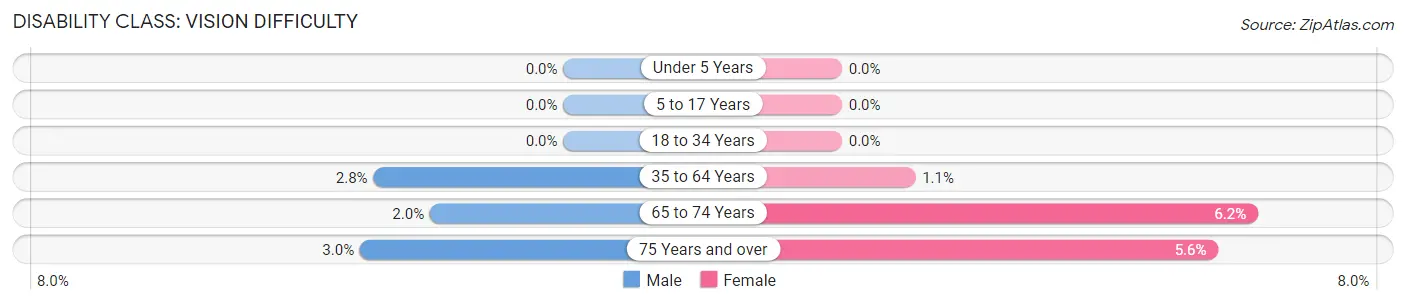
| Age Bracket | Male | Female |
| Under 5 Years | 0 (0.0%) | 0 (0.0%) |
| 5 to 17 Years | 0 (0.0%) | 0 (0.0%) |
| 18 to 34 Years | 0 (0.0%) | 0 (0.0%) |
| 35 to 64 Years | 26 (2.8%) | 10 (1.1%) |
| 65 to 74 Years | 7 (2.0%) | 21 (6.2%) |
| 75 Years and over | 6 (3.0%) | 25 (5.6%) |
Disability Class: Cognitive Difficulty
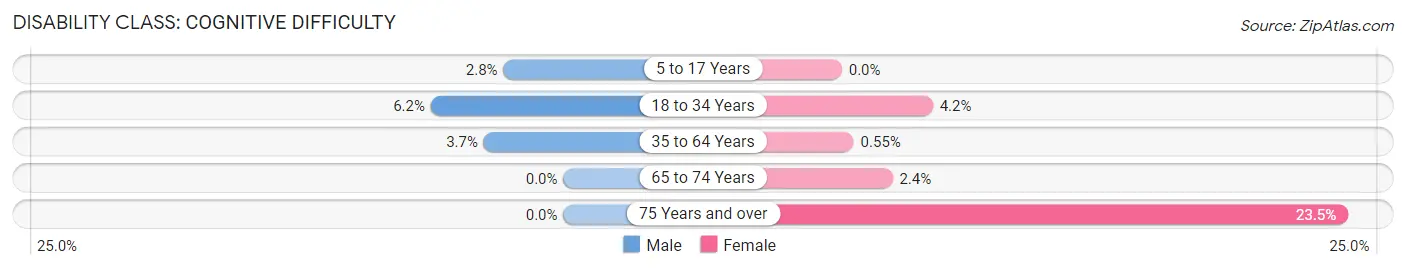
| Age Bracket | Male | Female |
| 5 to 17 Years | 11 (2.8%) | 0 (0.0%) |
| 18 to 34 Years | 24 (6.1%) | 18 (4.2%) |
| 35 to 64 Years | 34 (3.7%) | 5 (0.5%) |
| 65 to 74 Years | 0 (0.0%) | 8 (2.4%) |
| 75 Years and over | 0 (0.0%) | 105 (23.5%) |
Disability Class: Ambulatory Difficulty
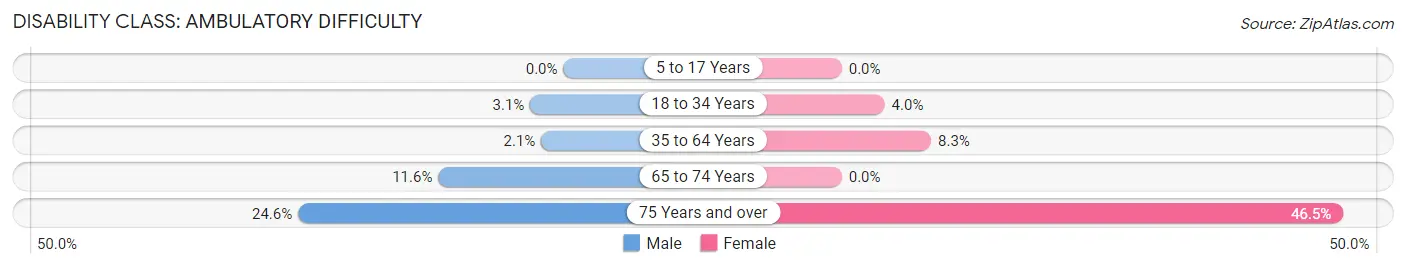
| Age Bracket | Male | Female |
| 5 to 17 Years | 0 (0.0%) | 0 (0.0%) |
| 18 to 34 Years | 12 (3.1%) | 17 (4.0%) |
| 35 to 64 Years | 19 (2.1%) | 76 (8.3%) |
| 65 to 74 Years | 41 (11.6%) | 0 (0.0%) |
| 75 Years and over | 49 (24.6%) | 208 (46.5%) |
Disability Class: Self-Care Difficulty
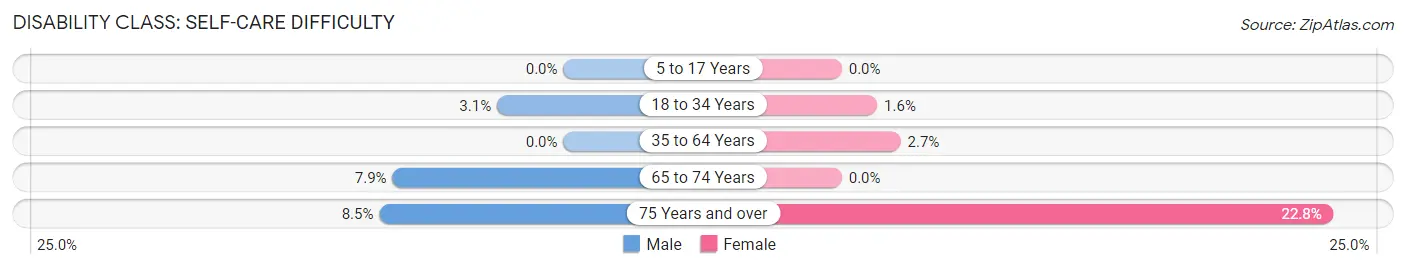
| Age Bracket | Male | Female |
| 5 to 17 Years | 0 (0.0%) | 0 (0.0%) |
| 18 to 34 Years | 12 (3.1%) | 7 (1.6%) |
| 35 to 64 Years | 0 (0.0%) | 25 (2.7%) |
| 65 to 74 Years | 28 (7.9%) | 0 (0.0%) |
| 75 Years and over | 17 (8.5%) | 102 (22.8%) |
Technology Access in Lake City
Computing Device Access in Lake City
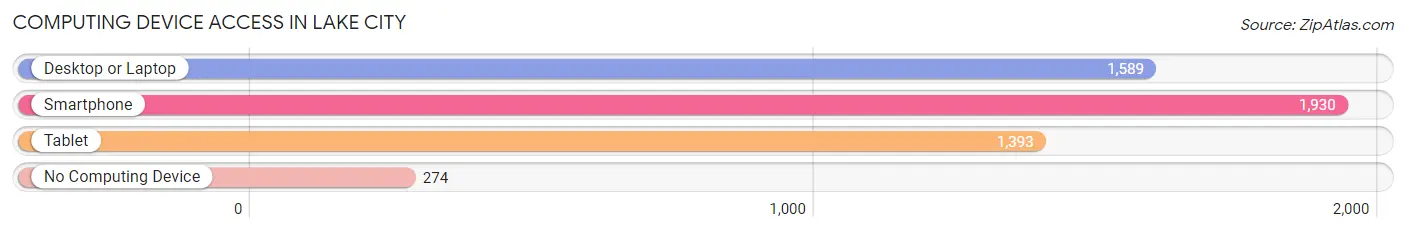
| Device Type | # Households | % Households |
| Desktop or Laptop | 1,589 | 67.7% |
| Smartphone | 1,930 | 82.3% |
| Tablet | 1,393 | 59.4% |
| No Computing Device | 274 | 11.7% |
| Total | 2,346 | 100.0% |
Internet Access in Lake City
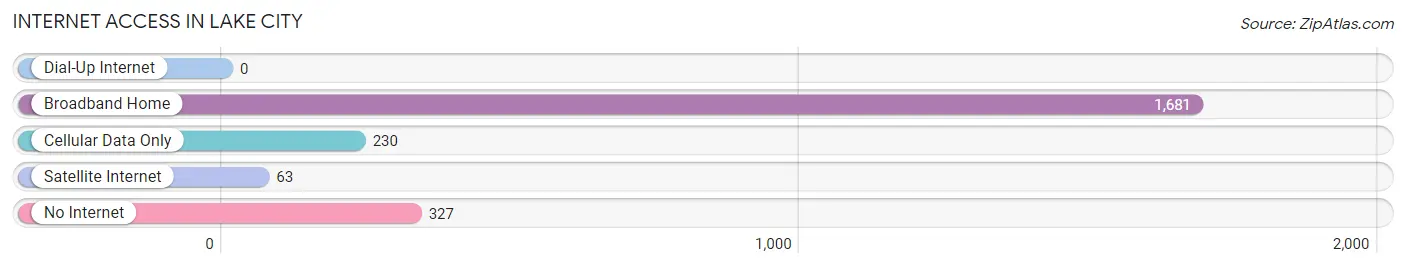
| Internet Type | # Households | % Households |
| Dial-Up Internet | 0 | 0.0% |
| Broadband Home | 1,681 | 71.7% |
| Cellular Data Only | 230 | 9.8% |
| Satellite Internet | 63 | 2.7% |
| No Internet | 327 | 13.9% |
| Total | 2,346 | 100.0% |
Lake City Summary
City of Lake City Minnesota
Lake City, Minnesota is a city located in Wabasha County, Minnesota, United States. The population was 4,845 at the 2010 census. It is the county seat of Wabasha County. The city is located along the shores of Lake Pepin, a naturally occurring lake on the Mississippi River.
History
The area that is now Lake City was first settled in 1854 by a group of settlers from New York. The settlers named the area Lake City because of its proximity to Lake Pepin. The city was officially incorporated in 1856.
In the late 19th century, Lake City was a popular tourist destination. The city was home to several resorts, including the Lake City Hotel, which was built in 1872. The hotel was a popular destination for wealthy tourists from the East Coast.
In the early 20th century, Lake City was a major port for the lumber industry. The city was home to several sawmills and lumber yards. The city also had a thriving fishing industry, with several commercial fishing boats operating out of the city.
Geography
Lake City is located in Wabasha County, Minnesota. The city is situated along the shores of Lake Pepin, a naturally occurring lake on the Mississippi River. The city is located approximately 50 miles southeast of Minneapolis.
The city has a total area of 4.2 square miles, all of which is land. The city is located at an elevation of 690 feet above sea level.
Economy
The economy of Lake City is largely based on tourism and recreation. The city is home to several resorts and hotels, as well as a variety of restaurants and shops. The city is also home to several marinas, which provide access to Lake Pepin.
The city is also home to several manufacturing companies, including a paper mill and a plastics factory. The city is also home to several agricultural businesses, including a dairy farm and a vegetable farm.
Demographics
As of the 2010 census, the population of Lake City was 4,845. The racial makeup of the city was 97.2% White, 0.7% African American, 0.3% Native American, 0.3% Asian, 0.1% Pacific Islander, 0.4% from other races, and 0.9% from two or more races. Hispanic or Latino of any race were 1.3% of the population.
The median income for a household in the city was $41,944, and the median income for a family was $50,917. The per capita income for the city was $20,945. About 8.2% of families and 10.3% of the population were below the poverty line, including 14.2% of those under age 18 and 8.2% of those age 65 or over.
Conclusion
Lake City, Minnesota is a city located in Wabasha County, Minnesota, United States. The city is situated along the shores of Lake Pepin, a naturally occurring lake on the Mississippi River. The city has a long history, dating back to its settlement in 1854. The economy of Lake City is largely based on tourism and recreation, as well as manufacturing and agriculture. The population of Lake City was 4,845 at the 2010 census. The city has a median household income of $41,944 and a per capita income of $20,945.
Common Questions
What is the Total Population of Lake City?
Total Population of Lake City is 5,108.
What is the Total Male Population of Lake City?
Total Male Population of Lake City is 2,363.
What is the Total Female Population of Lake City?
Total Female Population of Lake City is 2,745.
What is the Ratio of Males per 100 Females in Lake City?
There are 86.08 Males per 100 Females in Lake City.
What is the Ratio of Females per 100 Males in Lake City?
There are 116.17 Females per 100 Males in Lake City.
What is the Median Population Age in Lake City?
Median Population Age in Lake City is 49.4 Years.
What is the Average Family Size in Lake City
Average Family Size in Lake City is 2.8 People.
What is the Average Household Size in Lake City
Average Household Size in Lake City is 2.1 People.
What is Per Capita Income in Lake City?
Per Capita income in Lake City is $39,865.
What is the Median Family Income in Lake City?
Median Family Income in Lake City is $92,452.
What is the Median Household income in Lake City?
Median Household Income in Lake City is $71,324.
What is Income or Wage Gap in Lake City?
Income or Wage Gap in Lake City is 29.4%.
Women in Lake City earn 70.6 cents for every dollar earned by a man.
What is Inequality or Gini Index in Lake City?
Inequality or Gini Index in Lake City is 0.40.
How Large is the Labor Force in Lake City?
There are 2,563 People in the Labor Forcein in Lake City.
What is the Percentage of People in the Labor Force in Lake City?
60.8% of People are in the Labor Force in Lake City.
What is the Unemployment Rate in Lake City?
Unemployment Rate in Lake City is 0.5%.