Babbitt, MN
Babbitt Map
Babbitt Overview
1,377
TOTAL POPULATION
787
MALE POPULATION
590
FEMALE POPULATION
133.39
MALES / 100 FEMALES
74.97
FEMALES / 100 MALES
51.6
MEDIAN AGE
2.4
AVG FAMILY SIZE
2.0
AVG HOUSEHOLD SIZE
$32,922
PER CAPITA INCOME
$63,875
AVG FAMILY INCOME
$53,875
AVG HOUSEHOLD INCOME
16.2%
WAGE / INCOME GAP [ % ]
83.8¢/ $1
WAGE / INCOME GAP [ $ ]
0.39
INEQUALITY / GINI INDEX
649
LABOR FORCE [ PEOPLE ]
54.2%
PERCENT IN LABOR FORCE
4.2%
UNEMPLOYMENT RATE
Babbitt Zip Codes
Babbitt Area Codes
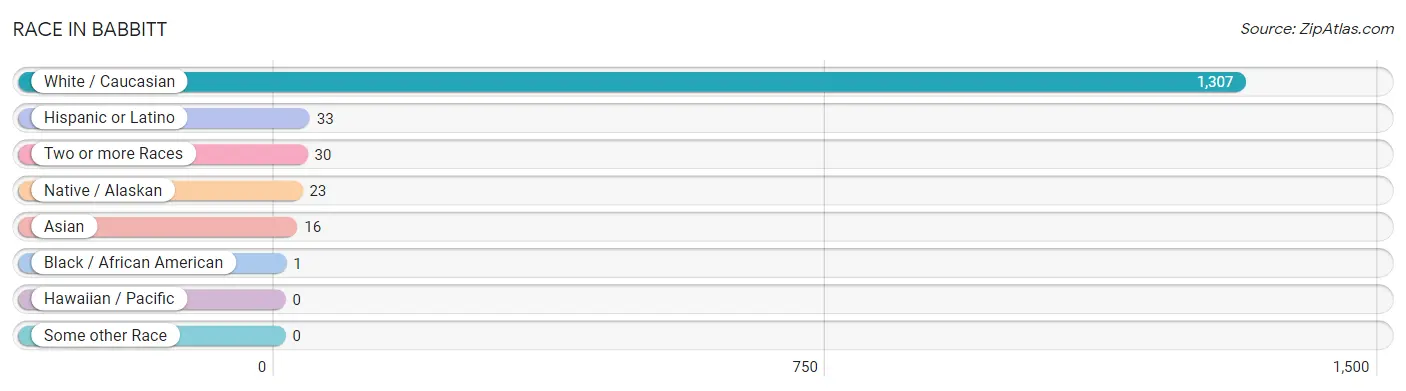
Race in Babbitt
The most populous races in Babbitt are White / Caucasian (1,307 | 94.9%), Hispanic or Latino (33 | 2.4%), and Two or more Races (30 | 2.2%).
| Race | # Population | % Population |
| Asian | 16 | 1.2% |
| Black / African American | 1 | 0.1% |
| Hawaiian / Pacific | 0 | 0.0% |
| Hispanic or Latino | 33 | 2.4% |
| Native / Alaskan | 23 | 1.7% |
| White / Caucasian | 1,307 | 94.9% |
| Two or more Races | 30 | 2.2% |
| Some other Race | 0 | 0.0% |
| Total | 1,377 | 100.0% |
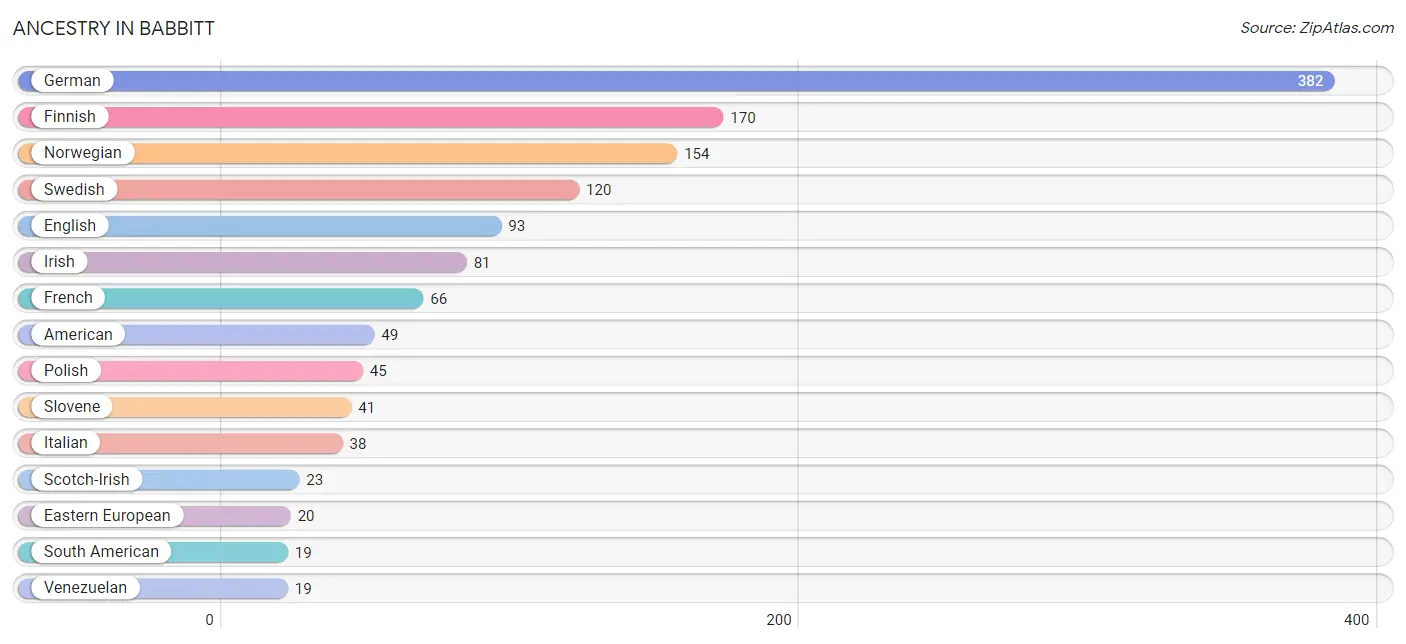
Ancestry in Babbitt
The most populous ancestries reported in Babbitt are German (382 | 27.7%), Finnish (170 | 12.3%), Norwegian (154 | 11.2%), Swedish (120 | 8.7%), and English (93 | 6.8%), together accounting for 66.7% of all Babbitt residents.
| Ancestry | # Population | % Population |
| American | 49 | 3.6% |
| Apache | 3 | 0.2% |
| Austrian | 15 | 1.1% |
| British | 5 | 0.4% |
| Chippewa | 17 | 1.2% |
| Croatian | 6 | 0.4% |
| Czech | 7 | 0.5% |
| Danish | 7 | 0.5% |
| Dutch | 9 | 0.6% |
| Eastern European | 20 | 1.5% |
| English | 93 | 6.8% |
| European | 9 | 0.6% |
| Finnish | 170 | 12.3% |
| French | 66 | 4.8% |
| French Canadian | 13 | 0.9% |
| German | 382 | 27.7% |
| Greek | 6 | 0.4% |
| Hungarian | 6 | 0.4% |
| Irish | 81 | 5.9% |
| Italian | 38 | 2.8% |
| Korean | 11 | 0.8% |
| Latvian | 3 | 0.2% |
| Malaysian | 5 | 0.4% |
| Mexican | 14 | 1.0% |
| Nigerian | 1 | 0.1% |
| Norwegian | 154 | 11.2% |
| Polish | 45 | 3.3% |
| Russian | 11 | 0.8% |
| Scandinavian | 3 | 0.2% |
| Scotch-Irish | 23 | 1.7% |
| Scottish | 10 | 0.7% |
| Serbian | 2 | 0.2% |
| Slavic | 5 | 0.4% |
| Slovene | 41 | 3.0% |
| South American | 19 | 1.4% |
| Subsaharan African | 1 | 0.1% |
| Swedish | 120 | 8.7% |
| Ukrainian | 7 | 0.5% |
| Venezuelan | 19 | 1.4% |
| Yugoslavian | 12 | 0.9% | View All 40 Rows |
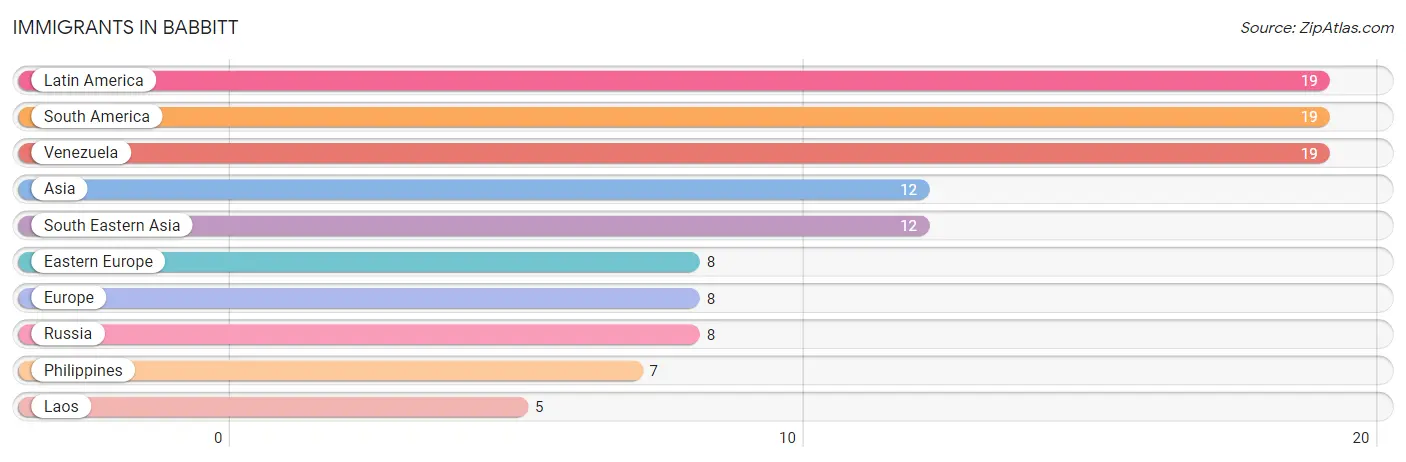
Immigrants in Babbitt
The most numerous immigrant groups reported in Babbitt came from Latin America (19 | 1.4%), South America (19 | 1.4%), Venezuela (19 | 1.4%), Asia (12 | 0.9%), and South Eastern Asia (12 | 0.9%), together accounting for 5.9% of all Babbitt residents.
| Immigration Origin | # Population | % Population |
| Asia | 12 | 0.9% |
| Eastern Europe | 8 | 0.6% |
| Europe | 8 | 0.6% |
| Laos | 5 | 0.4% |
| Latin America | 19 | 1.4% |
| Philippines | 7 | 0.5% |
| Russia | 8 | 0.6% |
| South America | 19 | 1.4% |
| South Eastern Asia | 12 | 0.9% |
| Venezuela | 19 | 1.4% | View All 10 Rows |
Sex and Age in Babbitt
Sex and Age in Babbitt
The most populous age groups in Babbitt are 60 to 64 Years (76 | 9.7%) for men and 85 Years and over (73 | 12.4%) for women.
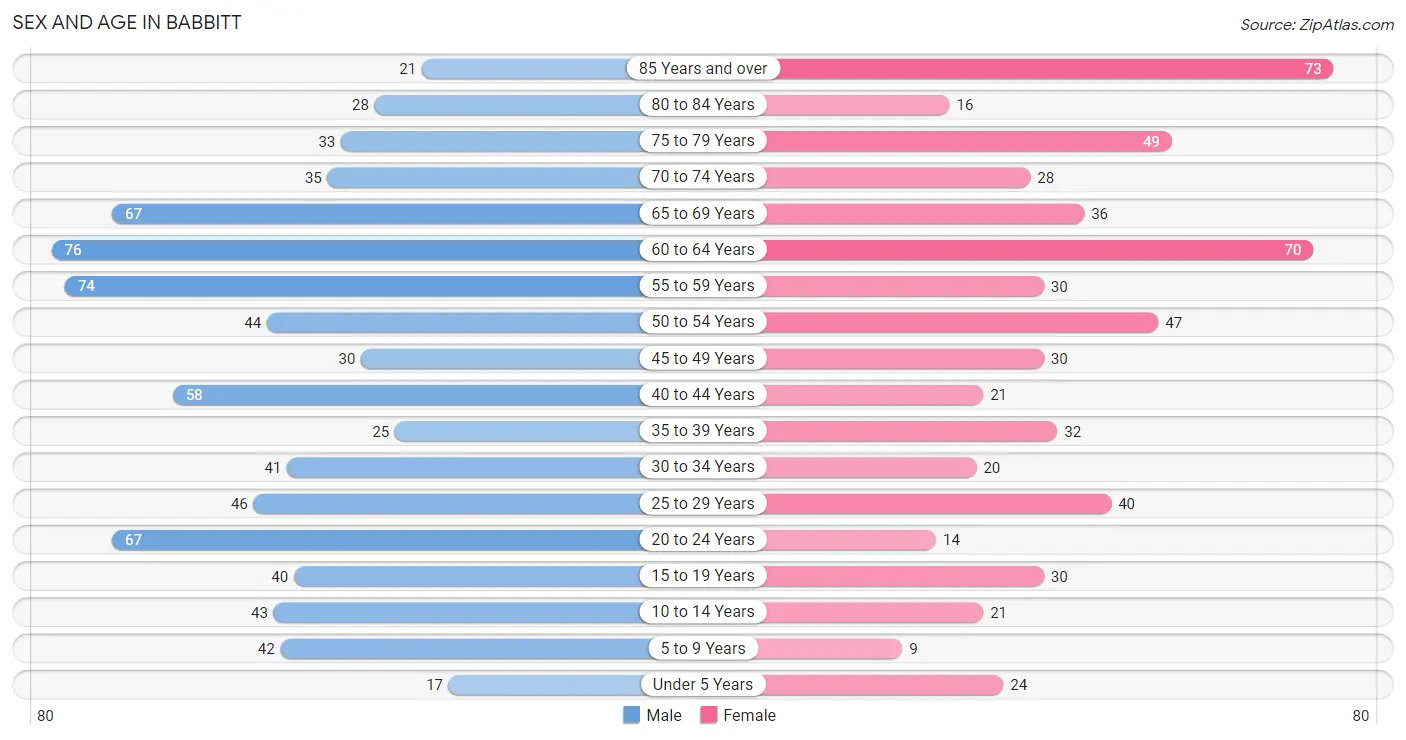
| Age Bracket | Male | Female |
| Under 5 Years | 17 (2.2%) | 24 (4.1%) |
| 5 to 9 Years | 42 (5.3%) | 9 (1.5%) |
| 10 to 14 Years | 43 (5.5%) | 21 (3.6%) |
| 15 to 19 Years | 40 (5.1%) | 30 (5.1%) |
| 20 to 24 Years | 67 (8.5%) | 14 (2.4%) |
| 25 to 29 Years | 46 (5.8%) | 40 (6.8%) |
| 30 to 34 Years | 41 (5.2%) | 20 (3.4%) |
| 35 to 39 Years | 25 (3.2%) | 32 (5.4%) |
| 40 to 44 Years | 58 (7.4%) | 21 (3.6%) |
| 45 to 49 Years | 30 (3.8%) | 30 (5.1%) |
| 50 to 54 Years | 44 (5.6%) | 47 (8.0%) |
| 55 to 59 Years | 74 (9.4%) | 30 (5.1%) |
| 60 to 64 Years | 76 (9.7%) | 70 (11.9%) |
| 65 to 69 Years | 67 (8.5%) | 36 (6.1%) |
| 70 to 74 Years | 35 (4.4%) | 28 (4.8%) |
| 75 to 79 Years | 33 (4.2%) | 49 (8.3%) |
| 80 to 84 Years | 28 (3.6%) | 16 (2.7%) |
| 85 Years and over | 21 (2.7%) | 73 (12.4%) |
| Total | 787 (100.0%) | 590 (100.0%) |
Families and Households in Babbitt
Median Family Size in Babbitt
The median family size in Babbitt is 2.42 persons per family, with married-couple families (316 | 76.9%) accounting for the largest median family size of 2.46 persons per family. On the other hand, single male/father families (65 | 15.8%) represent the smallest median family size with 2.25 persons per family.
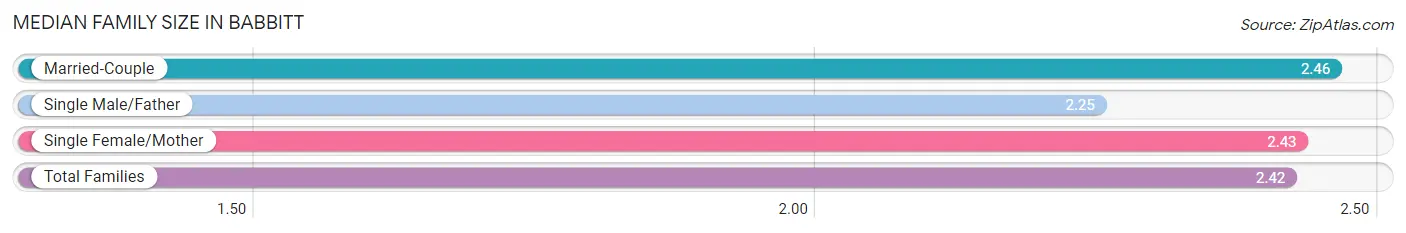
| Family Type | # Families | Family Size |
| Married-Couple | 316 (76.9%) | 2.46 |
| Single Male/Father | 65 (15.8%) | 2.25 |
| Single Female/Mother | 30 (7.3%) | 2.43 |
| Total Families | 411 (100.0%) | 2.42 |
Median Household Size in Babbitt
The median household size in Babbitt is 1.98 persons per household, with single female/mother households (30 | 4.5%) accounting for the largest median household size of 2.57 persons per household. non-family households (256 | 38.4%) represent the smallest median household size with 1.19 persons per household.
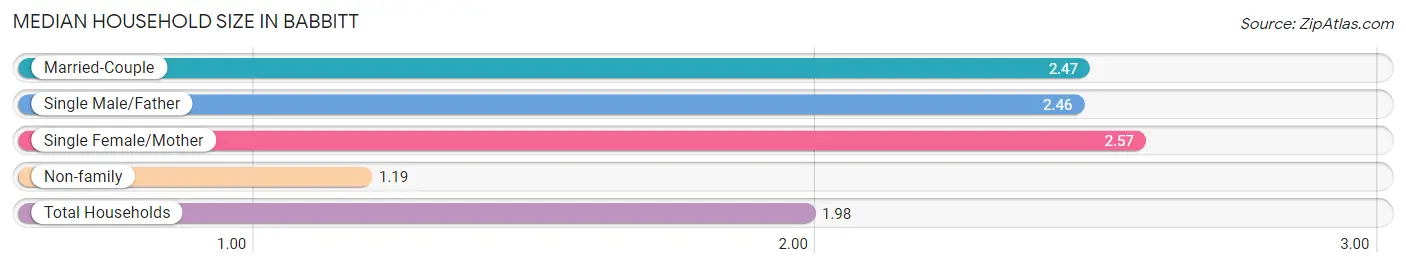
| Household Type | # Households | Household Size |
| Married-Couple | 316 (47.4%) | 2.47 |
| Single Male/Father | 65 (9.8%) | 2.46 |
| Single Female/Mother | 30 (4.5%) | 2.57 |
| Non-family | 256 (38.4%) | 1.19 |
| Total Households | 667 (100.0%) | 1.98 |
Household Size by Marriage Status in Babbitt
Out of a total of 667 households in Babbitt, 411 (61.6%) are family households, while 256 (38.4%) are nonfamily households. The most numerous type of family households are 2-person households, comprising 291, and the most common type of nonfamily households are 1-person households, comprising 227.
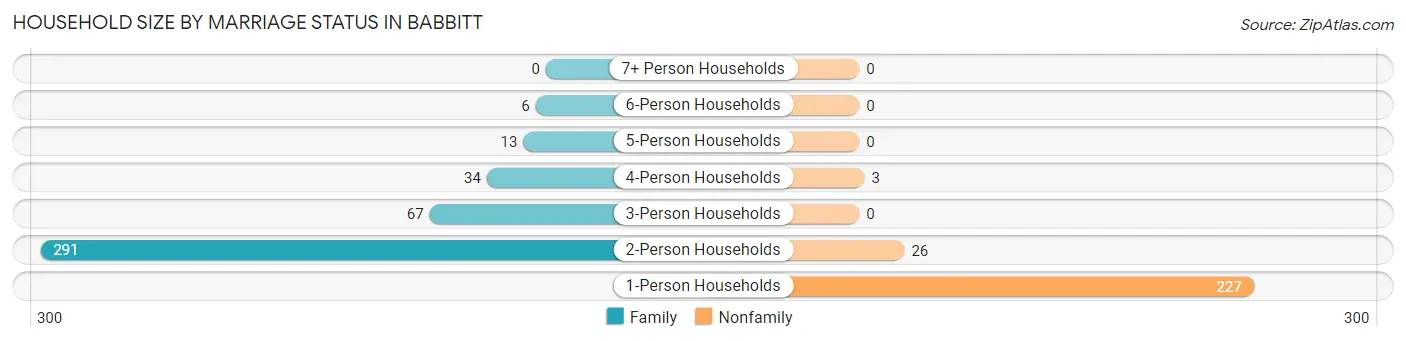
| Household Size | Family Households | Nonfamily Households |
| 1-Person Households | - | 227 (34.0%) |
| 2-Person Households | 291 (43.6%) | 26 (3.9%) |
| 3-Person Households | 67 (10.0%) | 0 (0.0%) |
| 4-Person Households | 34 (5.1%) | 3 (0.4%) |
| 5-Person Households | 13 (1.9%) | 0 (0.0%) |
| 6-Person Households | 6 (0.9%) | 0 (0.0%) |
| 7+ Person Households | 0 (0.0%) | 0 (0.0%) |
| Total | 411 (61.6%) | 256 (38.4%) |
Female Fertility in Babbitt
Fertility by Age in Babbitt
Average fertility rate in Babbitt is 35.0 births per 1,000 women. Women in the age bracket of 35 to 50 years have the highest fertility rate with 42.0 births per 1,000 women. Women in the age bracket of 35 to 50 years acount for 57.1% of all women with births.
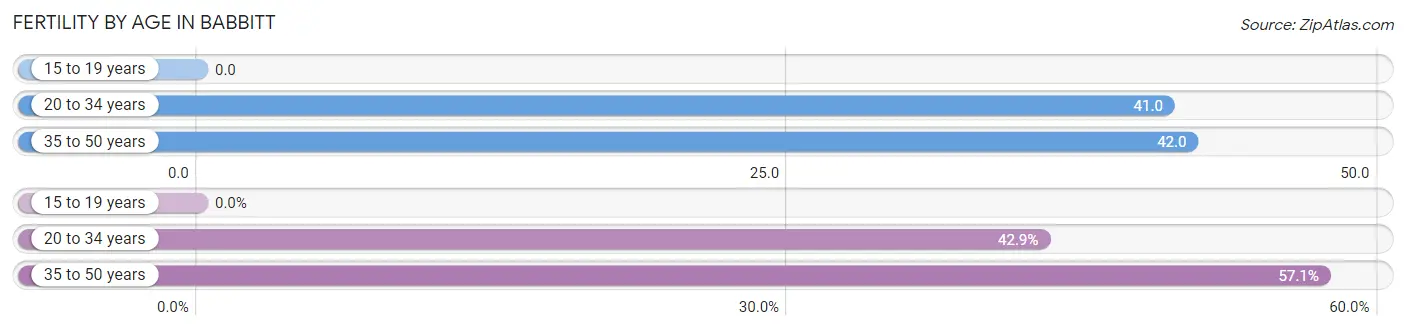
| Age Bracket | Women with Births | Births / 1,000 Women |
| 15 to 19 years | 0 (0.0%) | 0.0 |
| 20 to 34 years | 3 (42.9%) | 41.0 |
| 35 to 50 years | 4 (57.1%) | 42.0 |
| Total | 7 (100.0%) | 35.0 |
Fertility by Age by Marriage Status in Babbitt
42.9% of women with births (7) in Babbitt are married. The highest percentage of unmarried women with births falls into 35 to 50 years age bracket with 100.0% of them unmarried at the time of birth, while the lowest percentage of unmarried women with births belong to 20 to 34 years age bracket with 0.0% of them unmarried.
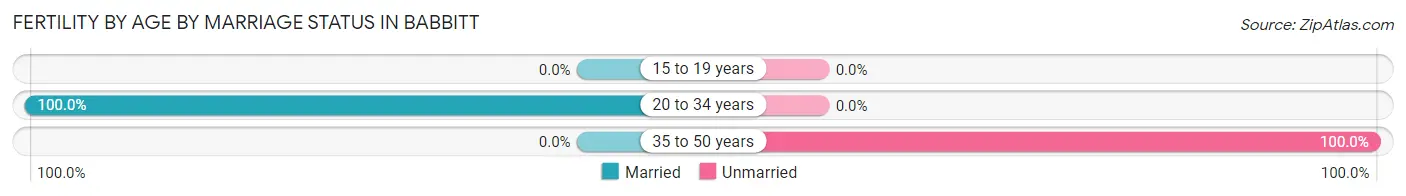
| Age Bracket | Married | Unmarried |
| 15 to 19 years | 0 (0.0%) | 0 (0.0%) |
| 20 to 34 years | 3 (100.0%) | 0 (0.0%) |
| 35 to 50 years | 0 (0.0%) | 4 (100.0%) |
| Total | 3 (42.9%) | 4 (57.1%) |
Fertility by Education in Babbitt
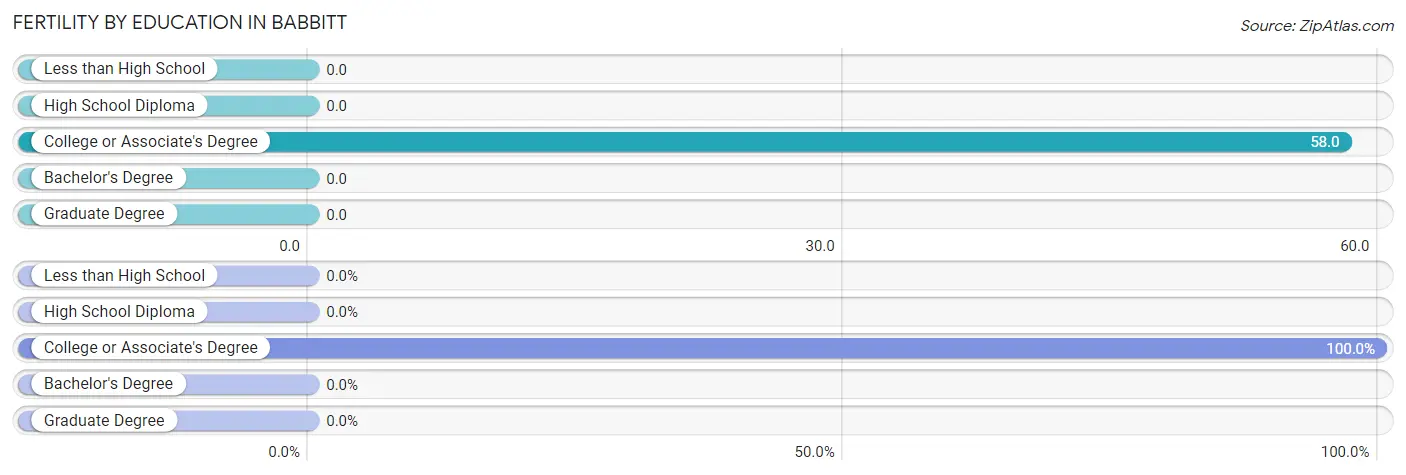
| Educational Attainment | Women with Births | Births / 1,000 Women |
| Less than High School | 0 (0.0%) | 0.0 |
| High School Diploma | 0 (0.0%) | 0.0 |
| College or Associate's Degree | 7 (100.0%) | 58.0 |
| Bachelor's Degree | 0 (0.0%) | 0.0 |
| Graduate Degree | 0 (0.0%) | 0.0 |
| Total | 7 (100.0%) | 35.0 |
Fertility by Education by Marriage Status in Babbitt
57.1% of women with births in Babbitt are unmarried. Women with the educational attainment of college or associate's degree are most likely to be married with 42.9% of them married at childbirth, while women with the educational attainment of college or associate's degree are least likely to be married with 57.1% of them unmarried at childbirth.
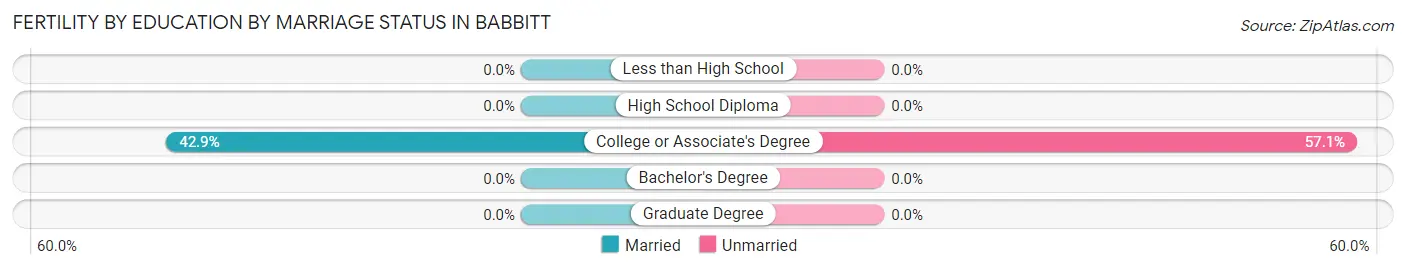
| Educational Attainment | Married | Unmarried |
| Less than High School | 0 (0.0%) | 0 (0.0%) |
| High School Diploma | 0 (0.0%) | 0 (0.0%) |
| College or Associate's Degree | 3 (42.9%) | 4 (57.1%) |
| Bachelor's Degree | 0 (0.0%) | 0 (0.0%) |
| Graduate Degree | 0 (0.0%) | 0 (0.0%) |
| Total | 3 (42.9%) | 4 (57.1%) |
Income in Babbitt
Income Overview in Babbitt
Per Capita Income in Babbitt is $32,922, while median incomes of families and households are $63,875 and $53,875 respectively.
| Characteristic | Number | Measure |
| Per Capita Income | 1,377 | $32,922 |
| Median Family Income | 411 | $63,875 |
| Mean Family Income | 411 | $75,542 |
| Median Household Income | 667 | $53,875 |
| Mean Household Income | 667 | $64,823 |
| Income Deficit | 411 | $0 |
| Wage / Income Gap (%) | 1,377 | 16.24% |
| Wage / Income Gap ($) | 1,377 | 83.76¢ per $1 |
| Gini / Inequality Index | 1,377 | 0.39 |
Earnings by Sex in Babbitt
Average Earnings in Babbitt are $38,412, $43,611 for men and $36,528 for women, a difference of 16.2%.
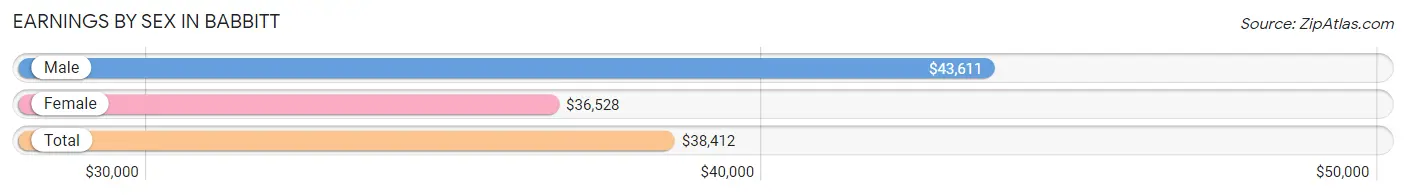
| Sex | Number | Average Earnings |
| Male | 424 (63.0%) | $43,611 |
| Female | 249 (37.0%) | $36,528 |
| Total | 673 (100.0%) | $38,412 |
Earnings by Sex by Income Bracket in Babbitt
The most common earnings brackets in Babbitt are $55,000 to $64,999 for men (52 | 12.3%) and $35,000 to $39,999 for women (42 | 16.9%).
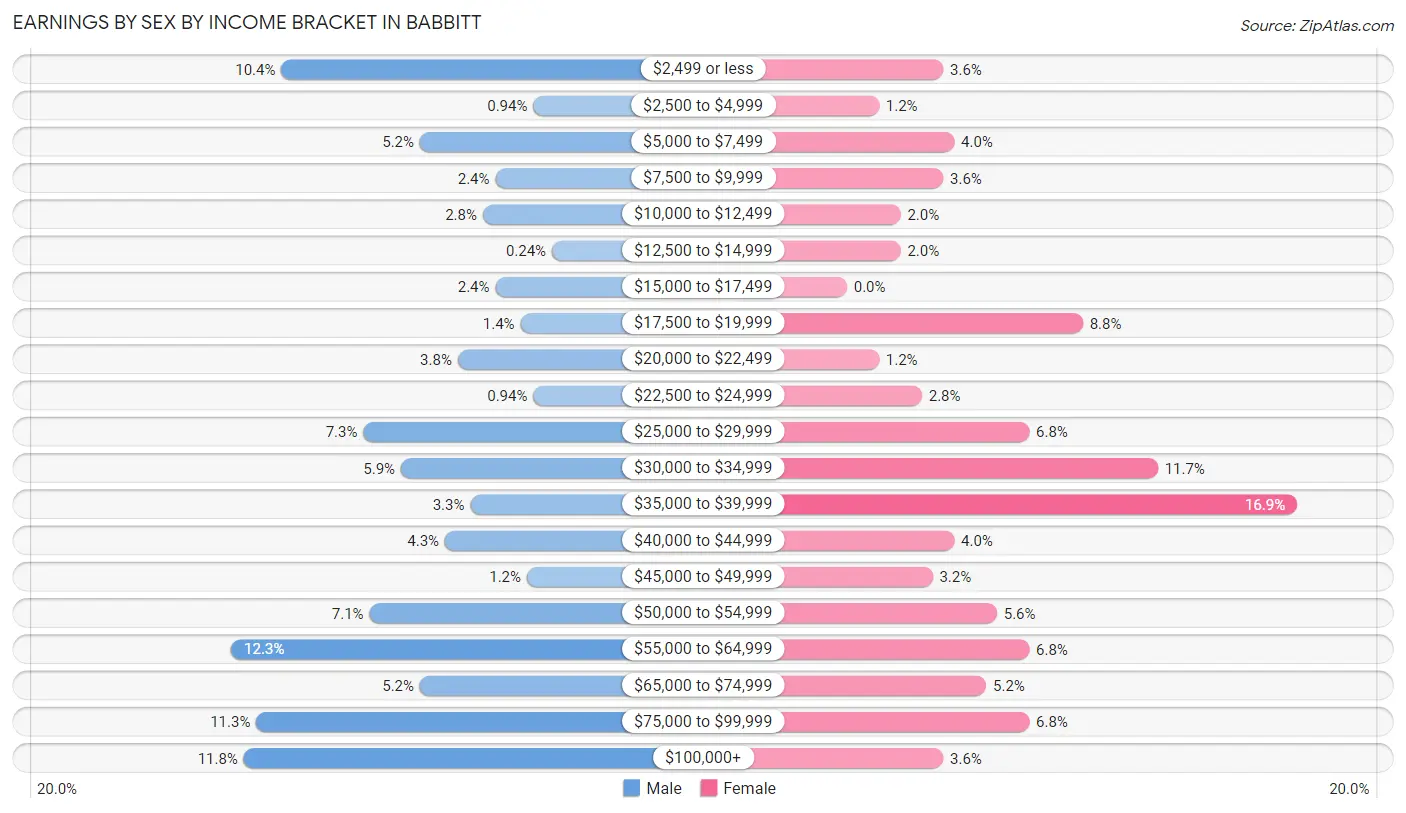
| Income | Male | Female |
| $2,499 or less | 44 (10.4%) | 9 (3.6%) |
| $2,500 to $4,999 | 4 (0.9%) | 3 (1.2%) |
| $5,000 to $7,499 | 22 (5.2%) | 10 (4.0%) |
| $7,500 to $9,999 | 10 (2.4%) | 9 (3.6%) |
| $10,000 to $12,499 | 12 (2.8%) | 5 (2.0%) |
| $12,500 to $14,999 | 1 (0.2%) | 5 (2.0%) |
| $15,000 to $17,499 | 10 (2.4%) | 0 (0.0%) |
| $17,500 to $19,999 | 6 (1.4%) | 22 (8.8%) |
| $20,000 to $22,499 | 16 (3.8%) | 3 (1.2%) |
| $22,500 to $24,999 | 4 (0.9%) | 7 (2.8%) |
| $25,000 to $29,999 | 31 (7.3%) | 17 (6.8%) |
| $30,000 to $34,999 | 25 (5.9%) | 29 (11.7%) |
| $35,000 to $39,999 | 14 (3.3%) | 42 (16.9%) |
| $40,000 to $44,999 | 18 (4.3%) | 10 (4.0%) |
| $45,000 to $49,999 | 5 (1.2%) | 8 (3.2%) |
| $50,000 to $54,999 | 30 (7.1%) | 14 (5.6%) |
| $55,000 to $64,999 | 52 (12.3%) | 17 (6.8%) |
| $65,000 to $74,999 | 22 (5.2%) | 13 (5.2%) |
| $75,000 to $99,999 | 48 (11.3%) | 17 (6.8%) |
| $100,000+ | 50 (11.8%) | 9 (3.6%) |
| Total | 424 (100.0%) | 249 (100.0%) |
Earnings by Sex by Educational Attainment in Babbitt
Average earnings in Babbitt are $50,208 for men and $37,992 for women, a difference of 24.3%. Men with an educational attainment of bachelor's degree enjoy the highest average annual earnings of $65,417, while those with less than high school education earn the least with $29,063. Women with an educational attainment of bachelor's degree earn the most with the average annual earnings of $45,625, while those with high school diploma education have the smallest earnings of $23,125.
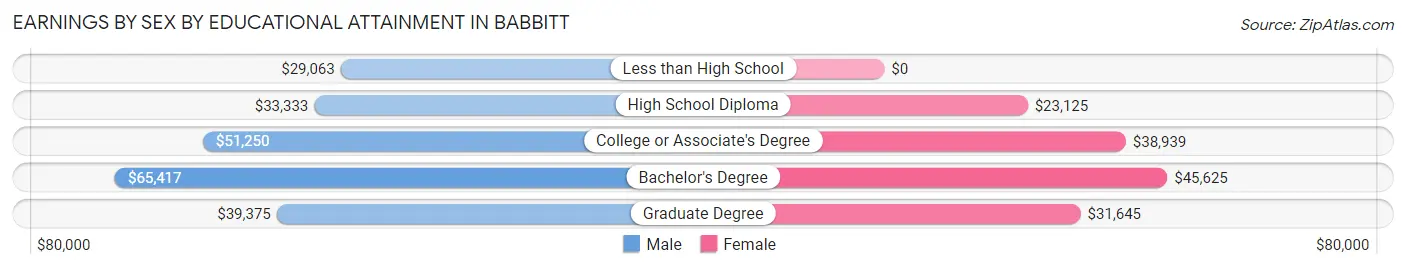
| Educational Attainment | Male Income | Female Income |
| Less than High School | $29,063 | $0 |
| High School Diploma | $33,333 | $23,125 |
| College or Associate's Degree | $51,250 | $38,939 |
| Bachelor's Degree | $65,417 | $45,625 |
| Graduate Degree | $39,375 | $31,645 |
| Total | $50,208 | $37,992 |
Family Income in Babbitt
Family Income Brackets in Babbitt
According to the Babbitt family income data, there are 136 families falling into the $50,000 to $74,999 income range, which is the most common income bracket and makes up 33.1% of all families.
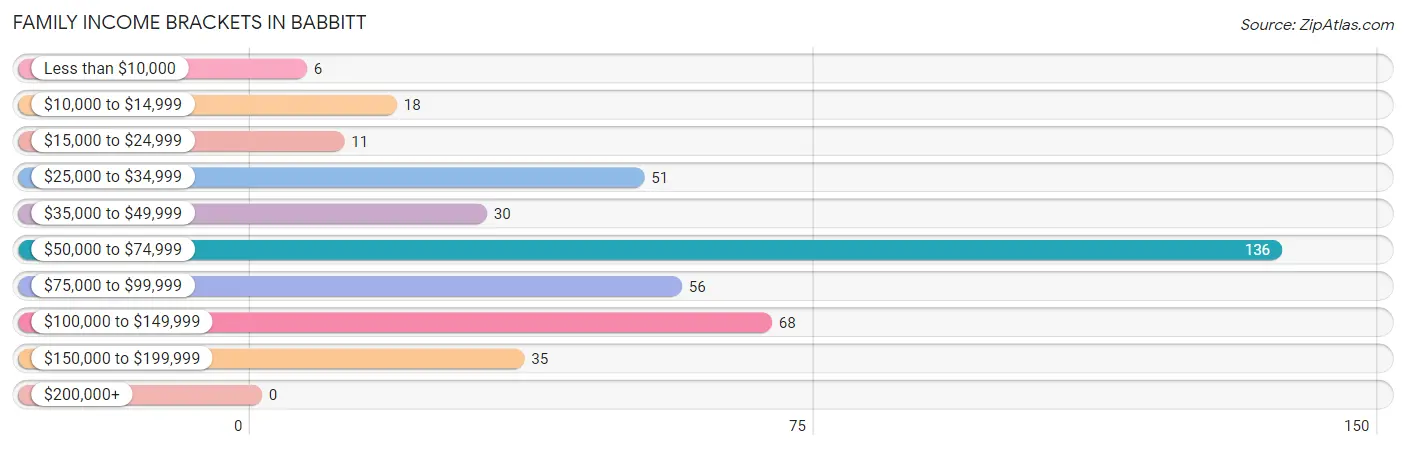
| Income Bracket | # Families | % Families |
| Less than $10,000 | 6 | 1.5% |
| $10,000 to $14,999 | 18 | 4.4% |
| $15,000 to $24,999 | 11 | 2.7% |
| $25,000 to $34,999 | 51 | 12.4% |
| $35,000 to $49,999 | 30 | 7.3% |
| $50,000 to $74,999 | 136 | 33.1% |
| $75,000 to $99,999 | 56 | 13.6% |
| $100,000 to $149,999 | 68 | 16.5% |
| $150,000 to $199,999 | 35 | 8.5% |
| $200,000+ | 0 | 0.0% |
Family Income by Famaliy Size in Babbitt
4-person families (27 | 6.6%) account for the highest median family income in Babbitt with $118,125 per family, while 3-person families (55 | 13.4%) have the highest median income of $39,219 per family member.
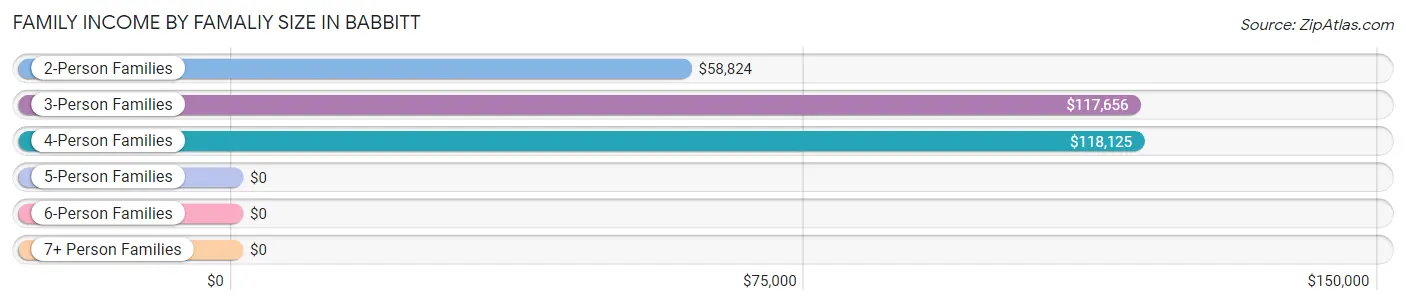
| Income Bracket | # Families | Median Income |
| 2-Person Families | 310 (75.4%) | $58,824 |
| 3-Person Families | 55 (13.4%) | $117,656 |
| 4-Person Families | 27 (6.6%) | $118,125 |
| 5-Person Families | 13 (3.2%) | $0 |
| 6-Person Families | 6 (1.5%) | $0 |
| 7+ Person Families | 0 (0.0%) | $0 |
| Total | 411 (100.0%) | $63,875 |
Family Income by Number of Earners in Babbitt
The median family income in Babbitt is $63,875, with families comprising 3+ earners (16) having the highest median family income of $148,214, while families with no earners (107) have the lowest median family income of $51,528, accounting for 3.9% and 26.0% of families, respectively.
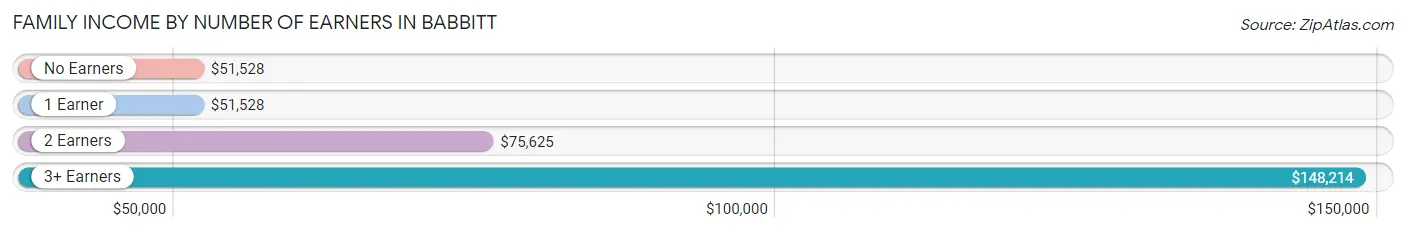
| Number of Earners | # Families | Median Income |
| No Earners | 107 (26.0%) | $51,528 |
| 1 Earner | 138 (33.6%) | $51,528 |
| 2 Earners | 150 (36.5%) | $75,625 |
| 3+ Earners | 16 (3.9%) | $148,214 |
| Total | 411 (100.0%) | $63,875 |
Household Income in Babbitt
Household Income Brackets in Babbitt
With 157 households falling in the category, the $50,000 to $74,999 income range is the most frequent in Babbitt, accounting for 23.5% of all households. In contrast, only 2 households (0.3%) fall into the $200,000+ income bracket, making it the least populous group.
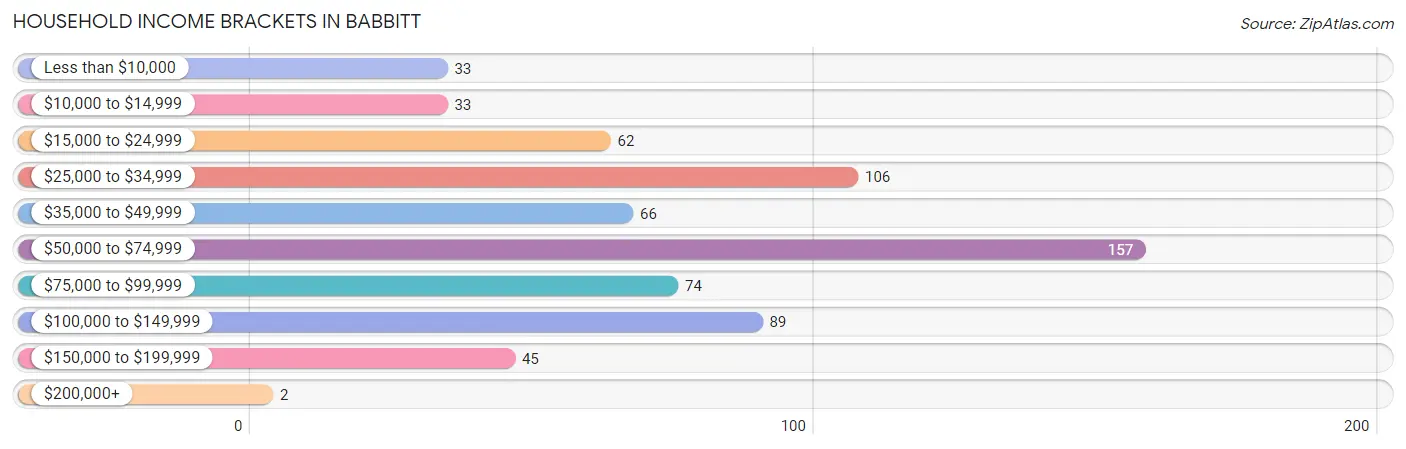
| Income Bracket | # Households | % Households |
| Less than $10,000 | 33 | 4.9% |
| $10,000 to $14,999 | 33 | 4.9% |
| $15,000 to $24,999 | 62 | 9.3% |
| $25,000 to $34,999 | 106 | 15.9% |
| $35,000 to $49,999 | 66 | 9.9% |
| $50,000 to $74,999 | 157 | 23.5% |
| $75,000 to $99,999 | 74 | 11.1% |
| $100,000 to $149,999 | 89 | 13.3% |
| $150,000 to $199,999 | 45 | 6.7% |
| $200,000+ | 2 | 0.3% |
Household Income by Householder Age in Babbitt
The median household income in Babbitt is $53,875, with the highest median household income of $79,375 found in the 25 to 44 years age bracket for the primary householder. A total of 143 households (21.4%) fall into this category. Meanwhile, the 15 to 24 years age bracket for the primary householder has the lowest median household income of $0, with 44 households (6.6%) in this group.
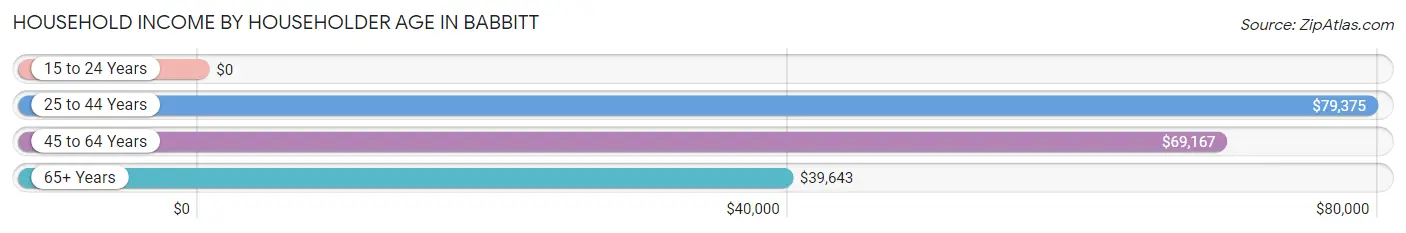
| Income Bracket | # Households | Median Income |
| 15 to 24 Years | 44 (6.6%) | $0 |
| 25 to 44 Years | 143 (21.4%) | $79,375 |
| 45 to 64 Years | 212 (31.8%) | $69,167 |
| 65+ Years | 268 (40.2%) | $39,643 |
| Total | 667 (100.0%) | $53,875 |
Poverty in Babbitt
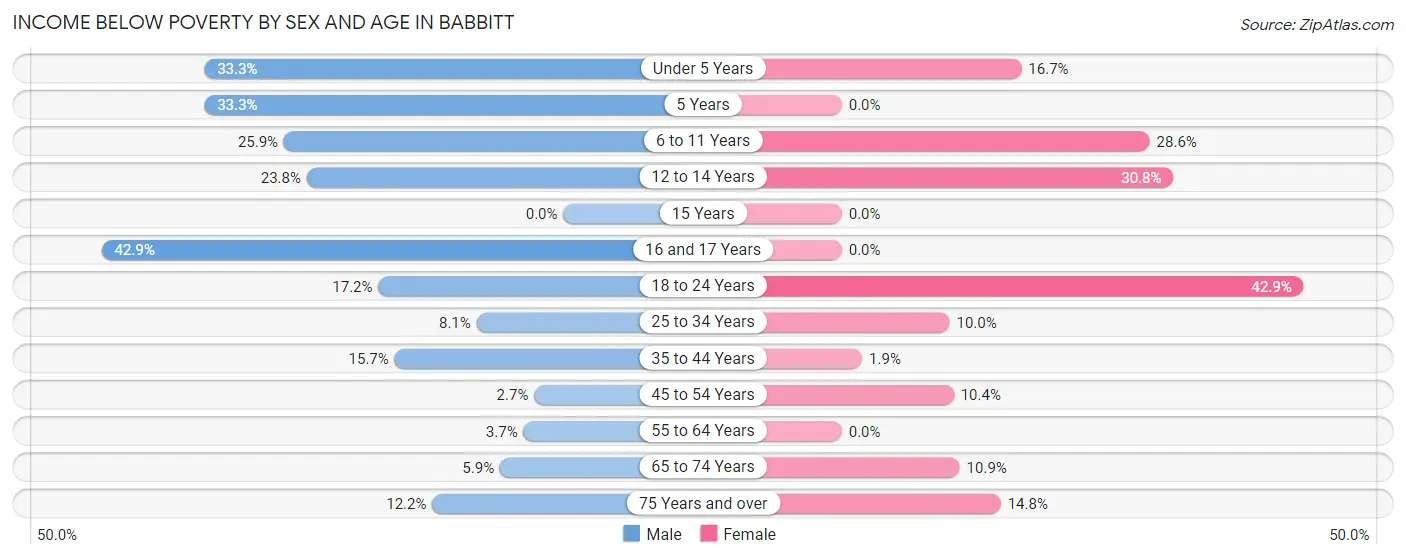
Income Below Poverty by Sex and Age in Babbitt
With 11.6% poverty level for males and 10.1% for females among the residents of Babbitt, 16 and 17 year old males and 18 to 24 year old females are the most vulnerable to poverty, with 3 males (42.9%) and 6 females (42.9%) in their respective age groups living below the poverty level.
| Age Bracket | Male | Female |
| Under 5 Years | 4 (33.3%) | 4 (16.7%) |
| 5 Years | 5 (33.3%) | 0 (0.0%) |
| 6 to 11 Years | 7 (25.9%) | 4 (28.6%) |
| 12 to 14 Years | 10 (23.8%) | 4 (30.8%) |
| 15 Years | 0 (0.0%) | 0 (0.0%) |
| 16 and 17 Years | 3 (42.9%) | 0 (0.0%) |
| 18 to 24 Years | 17 (17.2%) | 6 (42.9%) |
| 25 to 34 Years | 7 (8.1%) | 6 (10.0%) |
| 35 to 44 Years | 13 (15.7%) | 1 (1.9%) |
| 45 to 54 Years | 2 (2.7%) | 8 (10.4%) |
| 55 to 64 Years | 5 (3.7%) | 0 (0.0%) |
| 65 to 74 Years | 6 (5.9%) | 7 (10.9%) |
| 75 Years and over | 9 (12.2%) | 18 (14.7%) |
| Total | 88 (11.6%) | 58 (10.1%) |
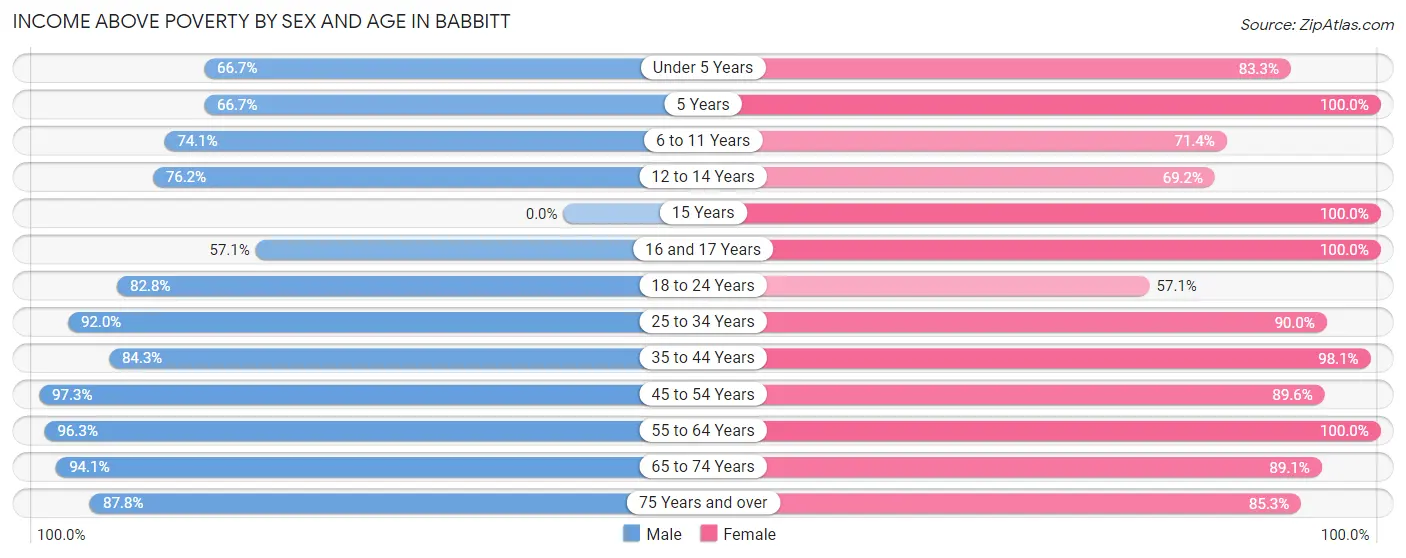
Income Above Poverty by Sex and Age in Babbitt
According to the poverty statistics in Babbitt, males aged 45 to 54 years and females aged 5 years are the age groups that are most secure financially, with 97.3% of males and 100.0% of females in these age groups living above the poverty line.
| Age Bracket | Male | Female |
| Under 5 Years | 8 (66.7%) | 20 (83.3%) |
| 5 Years | 10 (66.7%) | 2 (100.0%) |
| 6 to 11 Years | 20 (74.1%) | 10 (71.4%) |
| 12 to 14 Years | 32 (76.2%) | 9 (69.2%) |
| 15 Years | 0 (0.0%) | 24 (100.0%) |
| 16 and 17 Years | 4 (57.1%) | 6 (100.0%) |
| 18 to 24 Years | 82 (82.8%) | 8 (57.1%) |
| 25 to 34 Years | 80 (91.9%) | 54 (90.0%) |
| 35 to 44 Years | 70 (84.3%) | 52 (98.1%) |
| 45 to 54 Years | 72 (97.3%) | 69 (89.6%) |
| 55 to 64 Years | 130 (96.3%) | 100 (100.0%) |
| 65 to 74 Years | 96 (94.1%) | 57 (89.1%) |
| 75 Years and over | 65 (87.8%) | 104 (85.3%) |
| Total | 669 (88.4%) | 515 (89.9%) |
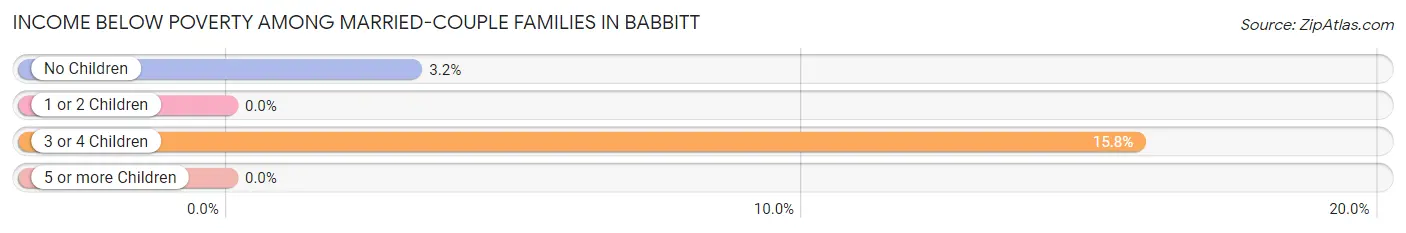
Income Below Poverty Among Married-Couple Families in Babbitt
The poverty statistics for married-couple families in Babbitt show that 3.5% or 11 of the total 316 families live below the poverty line. Families with 3 or 4 children have the highest poverty rate of 15.8%, comprising of 3 families. On the other hand, families with 1 or 2 children have the lowest poverty rate of 0.0%, which includes 0 families.
| Children | Above Poverty | Below Poverty |
| No Children | 241 (96.8%) | 8 (3.2%) |
| 1 or 2 Children | 48 (100.0%) | 0 (0.0%) |
| 3 or 4 Children | 16 (84.2%) | 3 (15.8%) |
| 5 or more Children | 0 (0.0%) | 0 (0.0%) |
| Total | 305 (96.5%) | 11 (3.5%) |
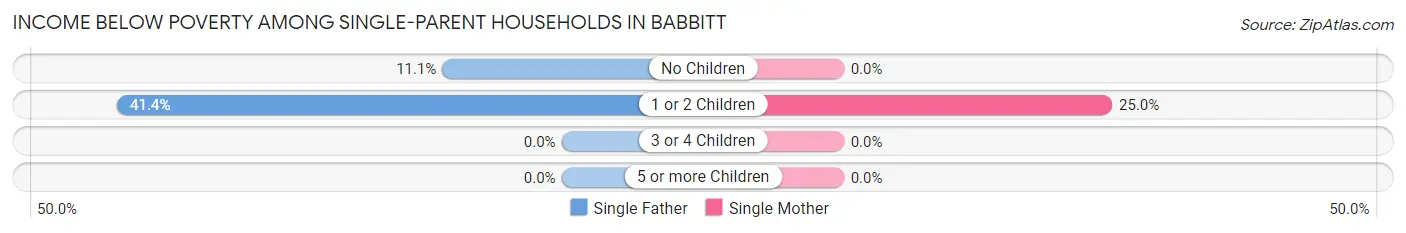
Income Below Poverty Among Single-Parent Households in Babbitt
According to the poverty data in Babbitt, 24.6% or 16 single-father households and 10.0% or 3 single-mother households are living below the poverty line. Among single-father households, those with 1 or 2 children have the highest poverty rate, with 12 households (41.4%) experiencing poverty. Likewise, among single-mother households, those with 1 or 2 children have the highest poverty rate, with 3 households (25.0%) falling below the poverty line.
| Children | Single Father | Single Mother |
| No Children | 4 (11.1%) | 0 (0.0%) |
| 1 or 2 Children | 12 (41.4%) | 3 (25.0%) |
| 3 or 4 Children | 0 (0.0%) | 0 (0.0%) |
| 5 or more Children | 0 (0.0%) | 0 (0.0%) |
| Total | 16 (24.6%) | 3 (10.0%) |
Income Below Poverty Among Married-Couple vs Single-Parent Households in Babbitt
The poverty data for Babbitt shows that 11 of the married-couple family households (3.5%) and 19 of the single-parent households (20.0%) are living below the poverty level. Within the married-couple family households, those with 3 or 4 children have the highest poverty rate, with 3 households (15.8%) falling below the poverty line. Among the single-parent households, those with 1 or 2 children have the highest poverty rate, with 15 household (36.6%) living below poverty.
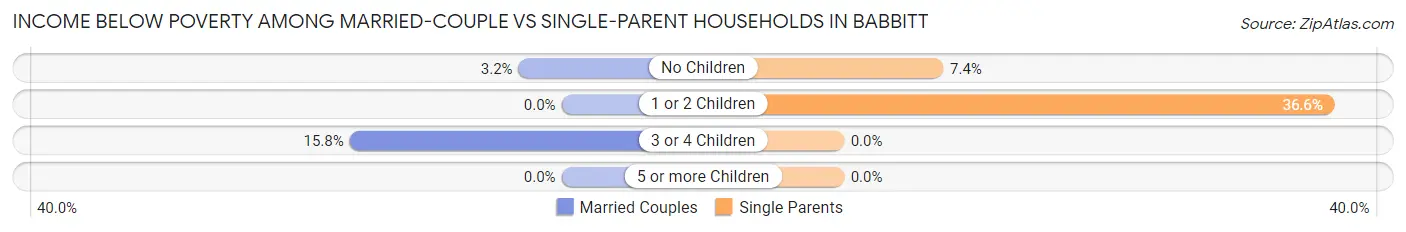
| Children | Married-Couple Families | Single-Parent Households |
| No Children | 8 (3.2%) | 4 (7.4%) |
| 1 or 2 Children | 0 (0.0%) | 15 (36.6%) |
| 3 or 4 Children | 3 (15.8%) | 0 (0.0%) |
| 5 or more Children | 0 (0.0%) | 0 (0.0%) |
| Total | 11 (3.5%) | 19 (20.0%) |
Employment Characteristics in Babbitt
Employment by Class of Employer in Babbitt
Among the 604 employed individuals in Babbitt, private company employees (428 | 70.9%), local government employees (60 | 9.9%), and not-for-profit organizations (48 | 8.0%) make up the most common classes of employment.
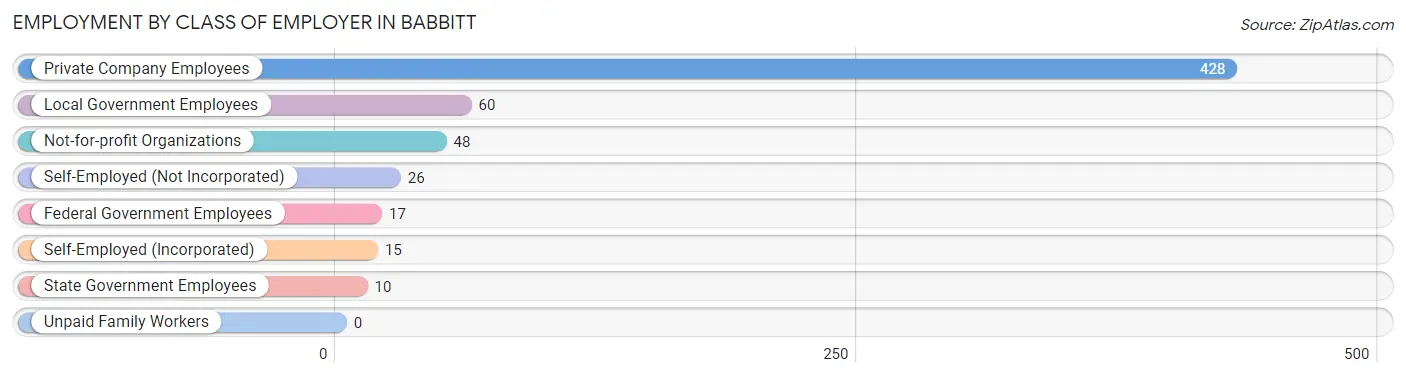
| Employer Class | # Employees | % Employees |
| Private Company Employees | 428 | 70.9% |
| Self-Employed (Incorporated) | 15 | 2.5% |
| Self-Employed (Not Incorporated) | 26 | 4.3% |
| Not-for-profit Organizations | 48 | 8.0% |
| Local Government Employees | 60 | 9.9% |
| State Government Employees | 10 | 1.7% |
| Federal Government Employees | 17 | 2.8% |
| Unpaid Family Workers | 0 | 0.0% |
| Total | 604 | 100.0% |
Employment Status by Age in Babbitt
According to the labor force statistics for Babbitt, out of the total population over 16 years of age (1,197), 54.2% or 649 individuals are in the labor force, with 4.2% or 27 of them unemployed. The age group with the highest labor force participation rate is 20 to 24 years, with 100.0% or 81 individuals in the labor force. Within the labor force, the 65 to 74 years age range has the highest percentage of unemployed individuals, with 13.6% or 3 of them being unemployed.
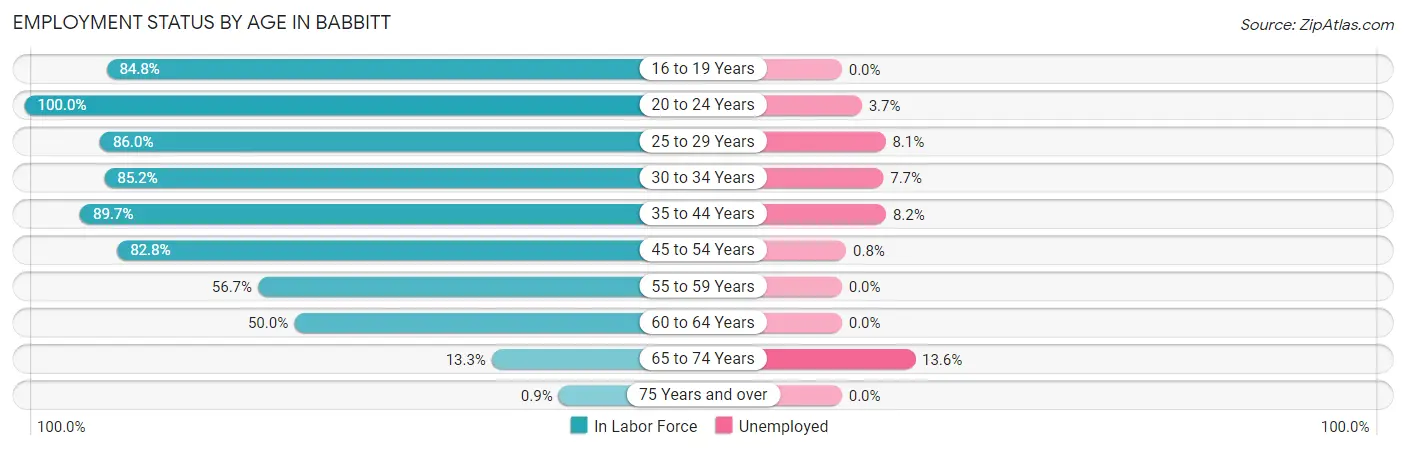
| Age Bracket | In Labor Force | Unemployed |
| 16 to 19 Years | 39 (84.8%) | 0 (0.0%) |
| 20 to 24 Years | 81 (100.0%) | 3 (3.7%) |
| 25 to 29 Years | 74 (86.0%) | 6 (8.1%) |
| 30 to 34 Years | 52 (85.2%) | 4 (7.7%) |
| 35 to 44 Years | 122 (89.7%) | 10 (8.2%) |
| 45 to 54 Years | 125 (82.8%) | 1 (0.8%) |
| 55 to 59 Years | 59 (56.7%) | 0 (0.0%) |
| 60 to 64 Years | 73 (50.0%) | 0 (0.0%) |
| 65 to 74 Years | 22 (13.3%) | 3 (13.6%) |
| 75 Years and over | 2 (0.9%) | 0 (0.0%) |
| Total | 649 (54.2%) | 27 (4.2%) |
Employment Status by Educational Attainment in Babbitt
According to labor force statistics for Babbitt, 73.8% of individuals (505) out of the total population between 25 and 64 years of age (684) are in the labor force, with 4.2% or 21 of them being unemployed. The group with the highest labor force participation rate are those with the educational attainment of bachelor's degree or higher, with 87.7% or 135 individuals in the labor force. Within the labor force, individuals with college / associate degree education have the highest percentage of unemployment, with 5.6% or 16 of them being unemployed.
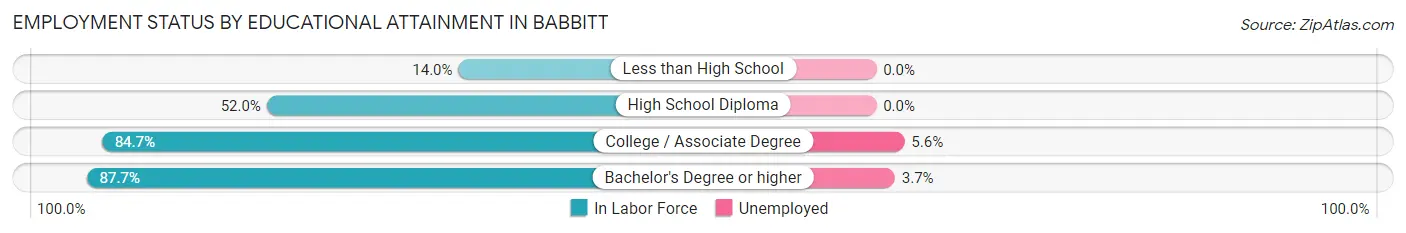
| Educational Attainment | In Labor Force | Unemployed |
| Less than High School | 6 (14.0%) | 0 (0.0%) |
| High School Diploma | 77 (52.0%) | 0 (0.0%) |
| College / Associate Degree | 287 (84.7%) | 19 (5.6%) |
| Bachelor's Degree or higher | 135 (87.7%) | 6 (3.7%) |
| Total | 505 (73.8%) | 29 (4.2%) |
Employment Occupations by Sex in Babbitt
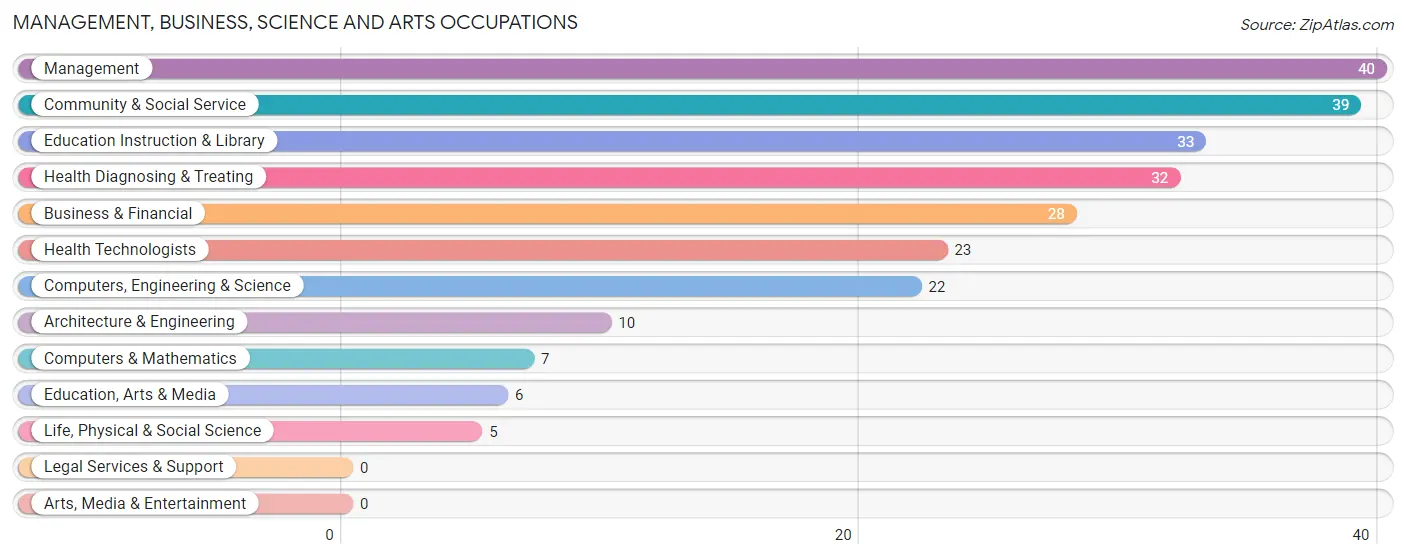
Management, Business, Science and Arts Occupations
The most common Management, Business, Science and Arts occupations in Babbitt are Management (40 | 6.4%), Community & Social Service (39 | 6.3%), Education Instruction & Library (33 | 5.3%), Health Diagnosing & Treating (32 | 5.1%), and Business & Financial (28 | 4.5%).
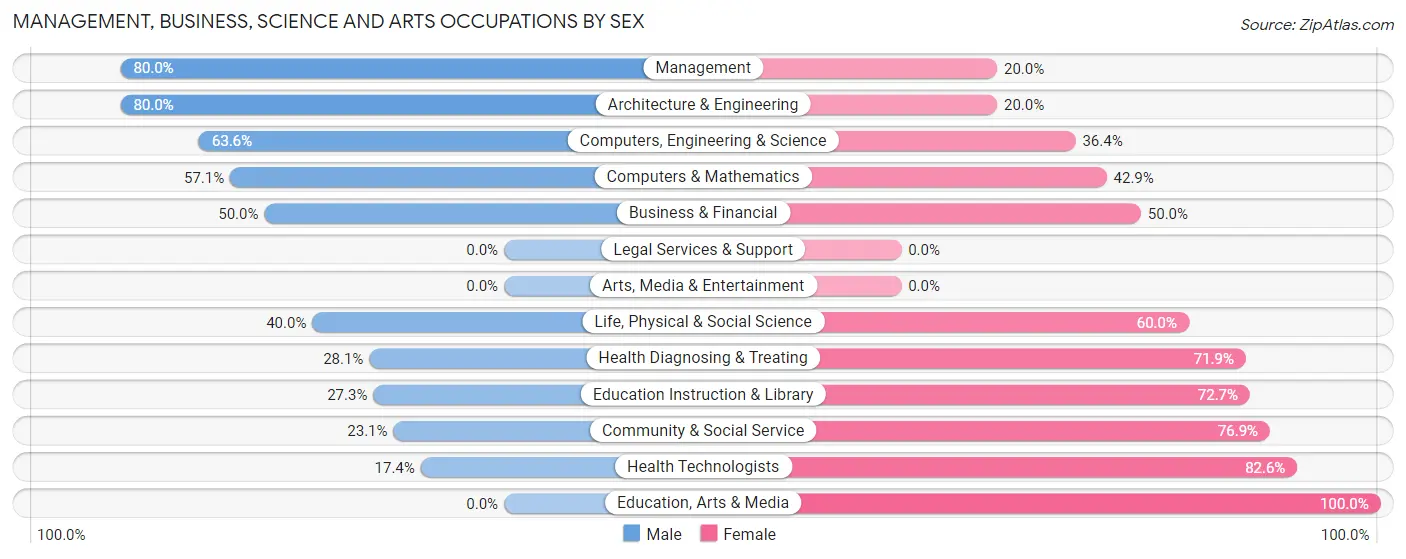
Management, Business, Science and Arts Occupations by Sex
Within the Management, Business, Science and Arts occupations in Babbitt, the most male-oriented occupations are Management (80.0%), Architecture & Engineering (80.0%), and Computers, Engineering & Science (63.6%), while the most female-oriented occupations are Education, Arts & Media (100.0%), Health Technologists (82.6%), and Community & Social Service (76.9%).
| Occupation | Male | Female |
| Management | 32 (80.0%) | 8 (20.0%) |
| Business & Financial | 14 (50.0%) | 14 (50.0%) |
| Computers, Engineering & Science | 14 (63.6%) | 8 (36.4%) |
| Computers & Mathematics | 4 (57.1%) | 3 (42.9%) |
| Architecture & Engineering | 8 (80.0%) | 2 (20.0%) |
| Life, Physical & Social Science | 2 (40.0%) | 3 (60.0%) |
| Community & Social Service | 9 (23.1%) | 30 (76.9%) |
| Education, Arts & Media | 0 (0.0%) | 6 (100.0%) |
| Legal Services & Support | 0 (0.0%) | 0 (0.0%) |
| Education Instruction & Library | 9 (27.3%) | 24 (72.7%) |
| Arts, Media & Entertainment | 0 (0.0%) | 0 (0.0%) |
| Health Diagnosing & Treating | 9 (28.1%) | 23 (71.9%) |
| Health Technologists | 4 (17.4%) | 19 (82.6%) |
| Total (Category) | 78 (48.4%) | 83 (51.5%) |
| Total (Overall) | 386 (62.1%) | 236 (37.9%) |
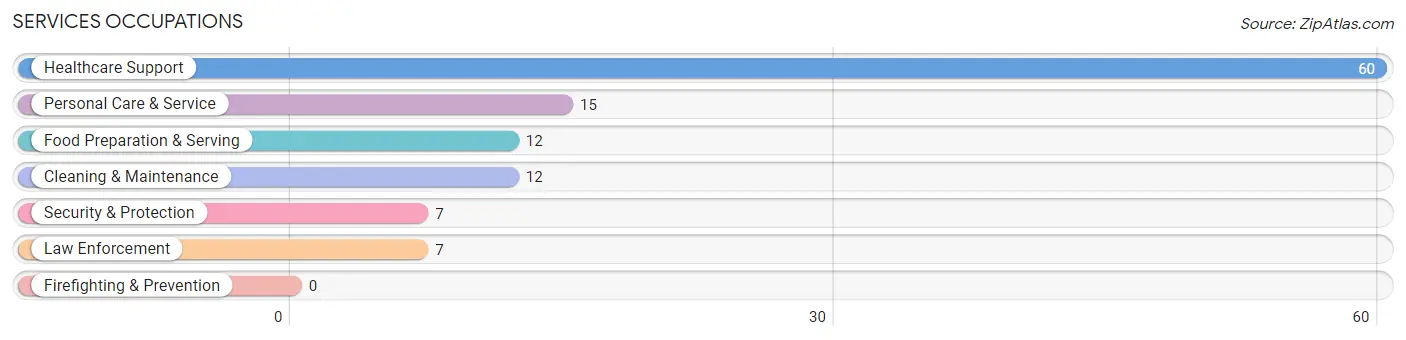
Services Occupations
The most common Services occupations in Babbitt are Healthcare Support (60 | 9.7%), Personal Care & Service (15 | 2.4%), Food Preparation & Serving (12 | 1.9%), Cleaning & Maintenance (12 | 1.9%), and Security & Protection (7 | 1.1%).
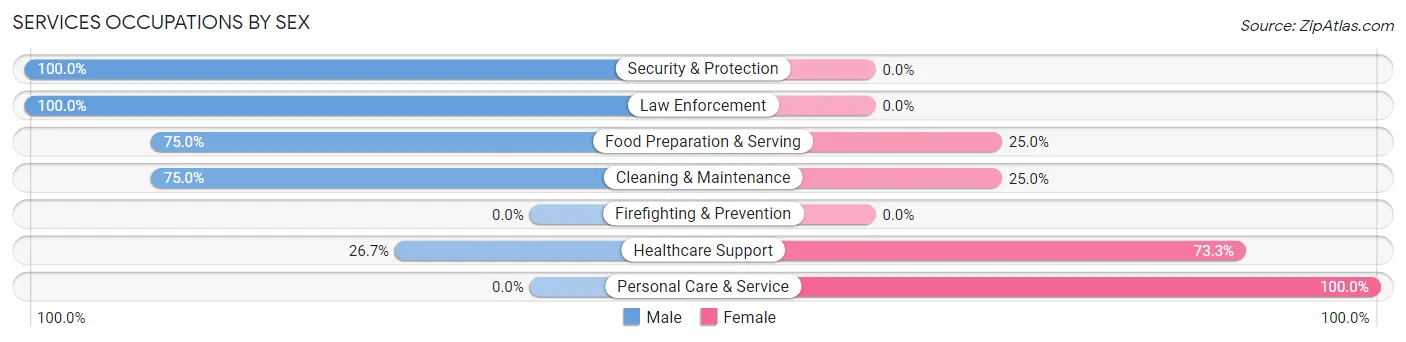
Services Occupations by Sex
Within the Services occupations in Babbitt, the most male-oriented occupations are Security & Protection (100.0%), Law Enforcement (100.0%), and Food Preparation & Serving (75.0%), while the most female-oriented occupations are Personal Care & Service (100.0%), Healthcare Support (73.3%), and Food Preparation & Serving (25.0%).
| Occupation | Male | Female |
| Healthcare Support | 16 (26.7%) | 44 (73.3%) |
| Security & Protection | 7 (100.0%) | 0 (0.0%) |
| Firefighting & Prevention | 0 (0.0%) | 0 (0.0%) |
| Law Enforcement | 7 (100.0%) | 0 (0.0%) |
| Food Preparation & Serving | 9 (75.0%) | 3 (25.0%) |
| Cleaning & Maintenance | 9 (75.0%) | 3 (25.0%) |
| Personal Care & Service | 0 (0.0%) | 15 (100.0%) |
| Total (Category) | 41 (38.7%) | 65 (61.3%) |
| Total (Overall) | 386 (62.1%) | 236 (37.9%) |
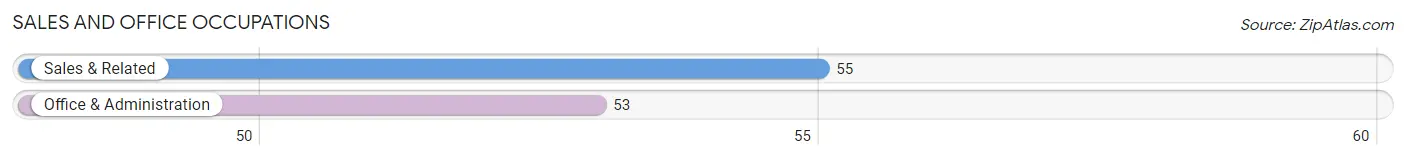
Sales and Office Occupations
The most common Sales and Office occupations in Babbitt are Sales & Related (55 | 8.8%), and Office & Administration (53 | 8.5%).
Sales and Office Occupations by Sex
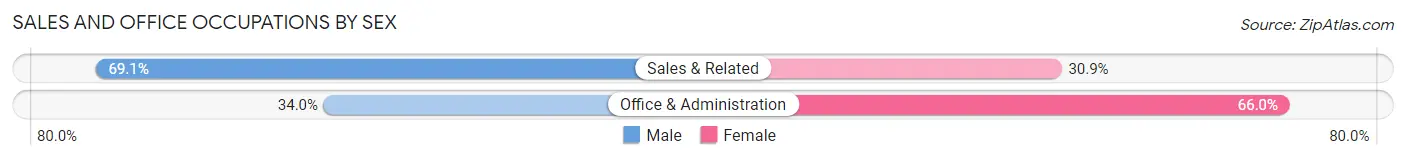
| Occupation | Male | Female |
| Sales & Related | 38 (69.1%) | 17 (30.9%) |
| Office & Administration | 18 (34.0%) | 35 (66.0%) |
| Total (Category) | 56 (51.8%) | 52 (48.1%) |
| Total (Overall) | 386 (62.1%) | 236 (37.9%) |
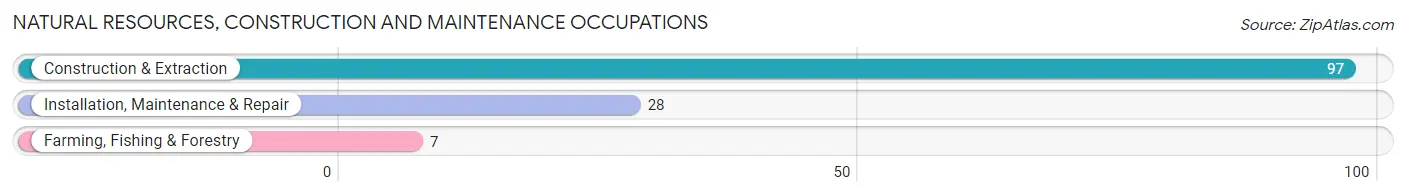
Natural Resources, Construction and Maintenance Occupations
The most common Natural Resources, Construction and Maintenance occupations in Babbitt are Construction & Extraction (97 | 15.6%), Installation, Maintenance & Repair (28 | 4.5%), and Farming, Fishing & Forestry (7 | 1.1%).
Natural Resources, Construction and Maintenance Occupations by Sex
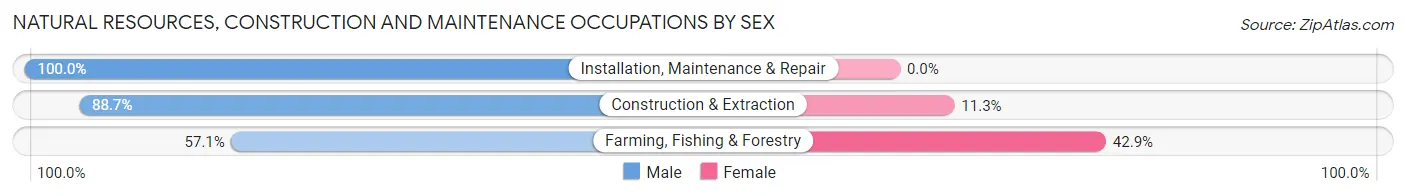
| Occupation | Male | Female |
| Farming, Fishing & Forestry | 4 (57.1%) | 3 (42.9%) |
| Construction & Extraction | 86 (88.7%) | 11 (11.3%) |
| Installation, Maintenance & Repair | 28 (100.0%) | 0 (0.0%) |
| Total (Category) | 118 (89.4%) | 14 (10.6%) |
| Total (Overall) | 386 (62.1%) | 236 (37.9%) |
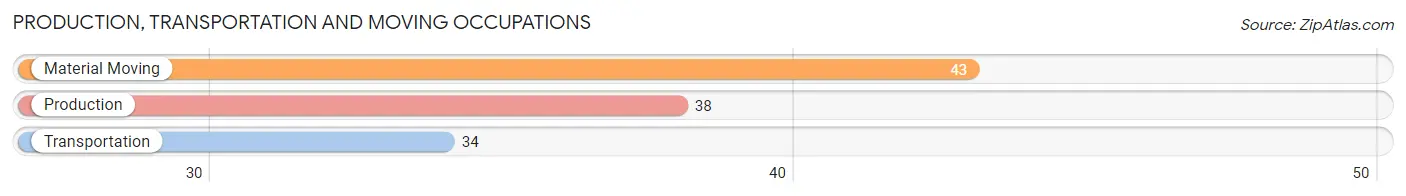
Production, Transportation and Moving Occupations
The most common Production, Transportation and Moving occupations in Babbitt are Material Moving (43 | 6.9%), Production (38 | 6.1%), and Transportation (34 | 5.5%).
Production, Transportation and Moving Occupations by Sex
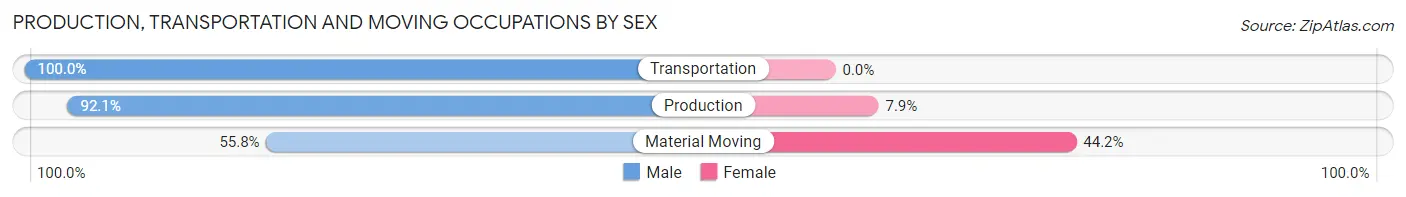
| Occupation | Male | Female |
| Production | 35 (92.1%) | 3 (7.9%) |
| Transportation | 34 (100.0%) | 0 (0.0%) |
| Material Moving | 24 (55.8%) | 19 (44.2%) |
| Total (Category) | 93 (80.9%) | 22 (19.1%) |
| Total (Overall) | 386 (62.1%) | 236 (37.9%) |
Employment Industries by Sex in Babbitt
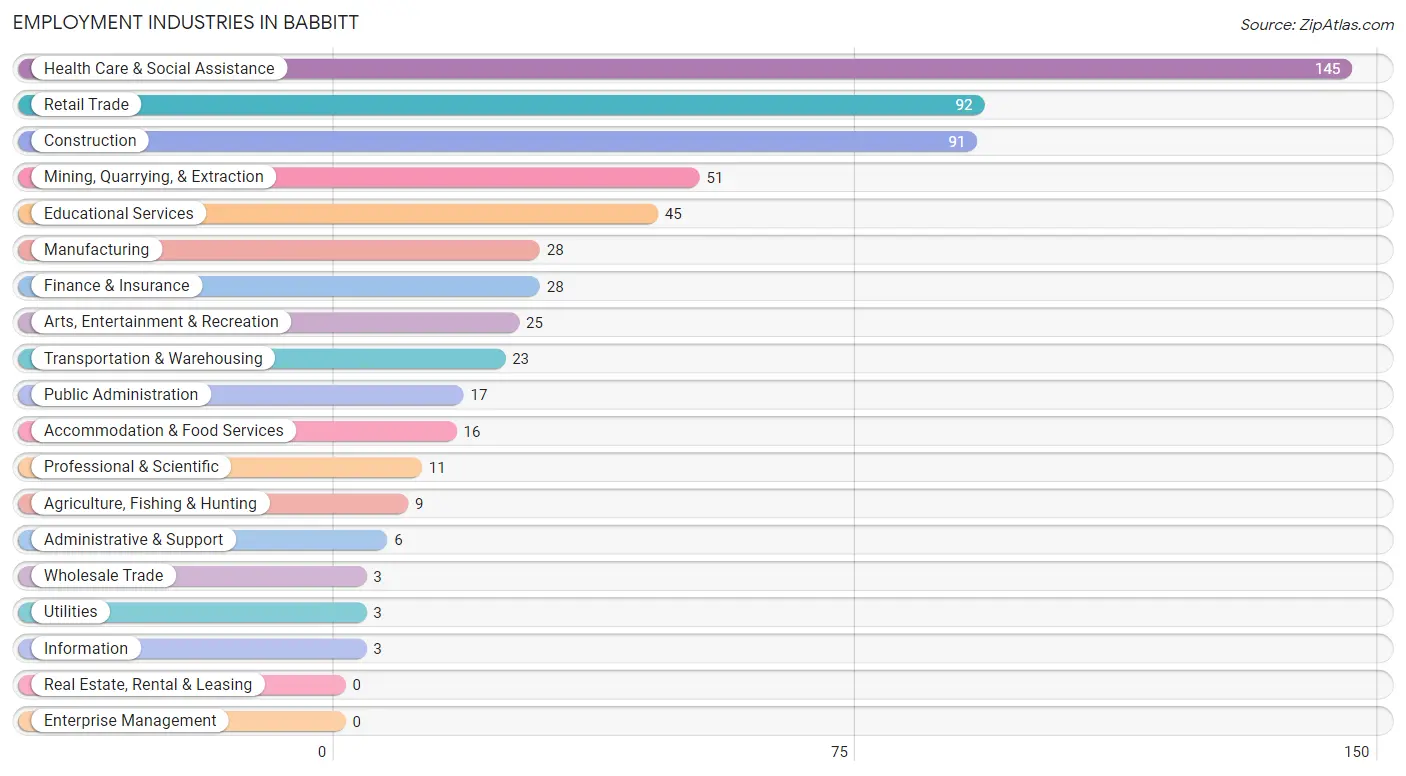
Employment Industries in Babbitt
The major employment industries in Babbitt include Health Care & Social Assistance (145 | 23.3%), Retail Trade (92 | 14.8%), Construction (91 | 14.6%), Mining, Quarrying, & Extraction (51 | 8.2%), and Educational Services (45 | 7.2%).
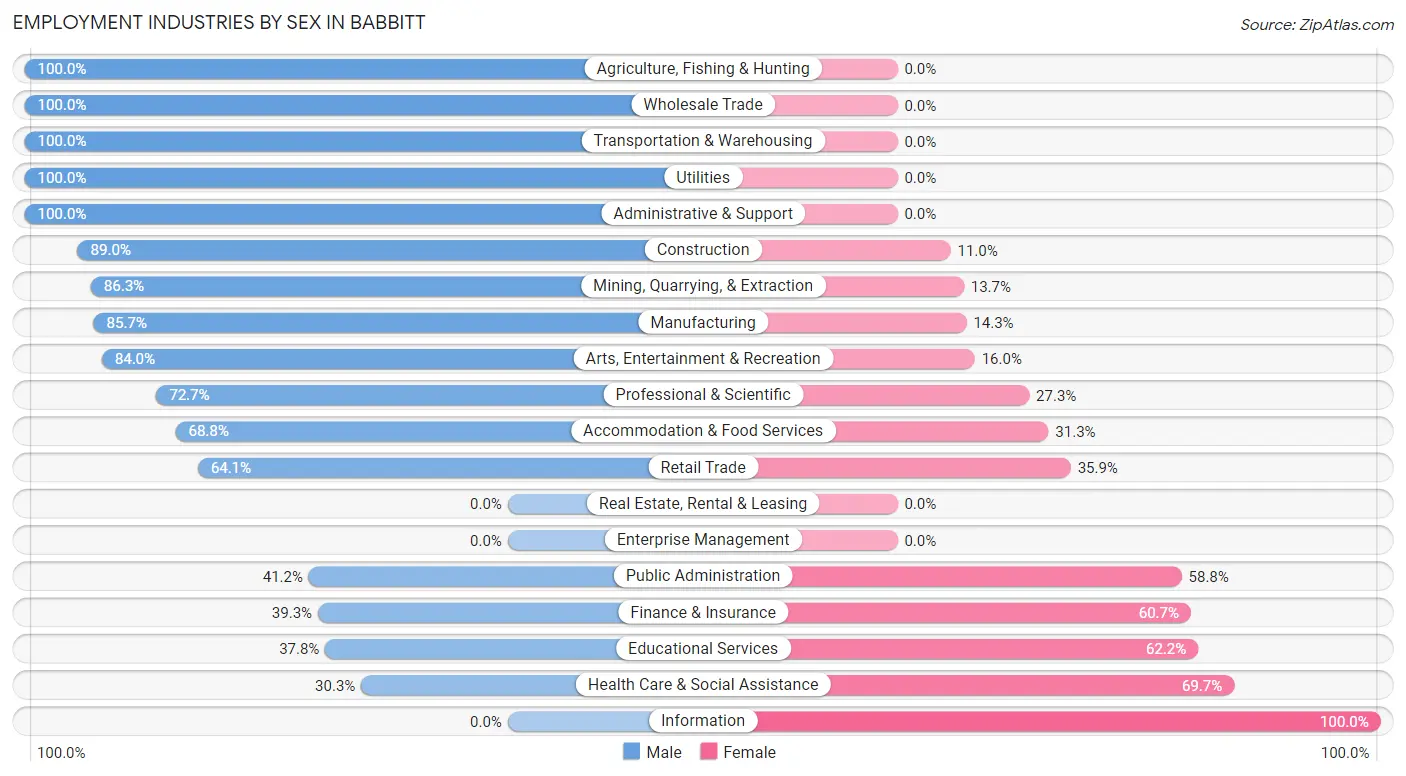
Employment Industries by Sex in Babbitt
The Babbitt industries that see more men than women are Agriculture, Fishing & Hunting (100.0%), Wholesale Trade (100.0%), and Transportation & Warehousing (100.0%), whereas the industries that tend to have a higher number of women are Information (100.0%), Health Care & Social Assistance (69.7%), and Educational Services (62.2%).
| Industry | Male | Female |
| Agriculture, Fishing & Hunting | 9 (100.0%) | 0 (0.0%) |
| Mining, Quarrying, & Extraction | 44 (86.3%) | 7 (13.7%) |
| Construction | 81 (89.0%) | 10 (11.0%) |
| Manufacturing | 24 (85.7%) | 4 (14.3%) |
| Wholesale Trade | 3 (100.0%) | 0 (0.0%) |
| Retail Trade | 59 (64.1%) | 33 (35.9%) |
| Transportation & Warehousing | 23 (100.0%) | 0 (0.0%) |
| Utilities | 3 (100.0%) | 0 (0.0%) |
| Information | 0 (0.0%) | 3 (100.0%) |
| Finance & Insurance | 11 (39.3%) | 17 (60.7%) |
| Real Estate, Rental & Leasing | 0 (0.0%) | 0 (0.0%) |
| Professional & Scientific | 8 (72.7%) | 3 (27.3%) |
| Enterprise Management | 0 (0.0%) | 0 (0.0%) |
| Administrative & Support | 6 (100.0%) | 0 (0.0%) |
| Educational Services | 17 (37.8%) | 28 (62.2%) |
| Health Care & Social Assistance | 44 (30.3%) | 101 (69.7%) |
| Arts, Entertainment & Recreation | 21 (84.0%) | 4 (16.0%) |
| Accommodation & Food Services | 11 (68.8%) | 5 (31.2%) |
| Public Administration | 7 (41.2%) | 10 (58.8%) |
| Total | 386 (62.1%) | 236 (37.9%) |
Education in Babbitt
School Enrollment in Babbitt
The most common levels of schooling among the 203 students in Babbitt are high school (64 | 31.5%), middle school (61 | 30.0%), and elementary school (34 | 16.8%).
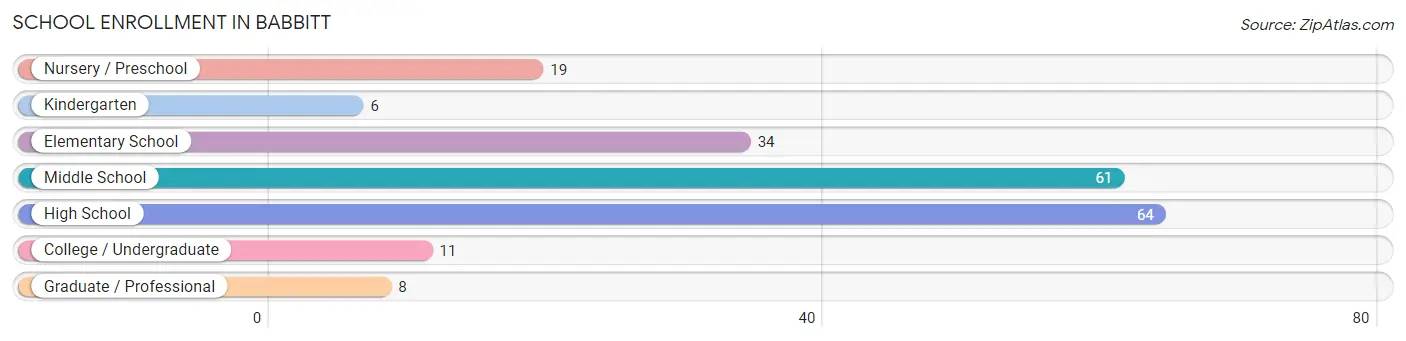
| School Level | # Students | % Students |
| Nursery / Preschool | 19 | 9.4% |
| Kindergarten | 6 | 3.0% |
| Elementary School | 34 | 16.8% |
| Middle School | 61 | 30.0% |
| High School | 64 | 31.5% |
| College / Undergraduate | 11 | 5.4% |
| Graduate / Professional | 8 | 3.9% |
| Total | 203 | 100.0% |
School Enrollment by Age by Funding Source in Babbitt
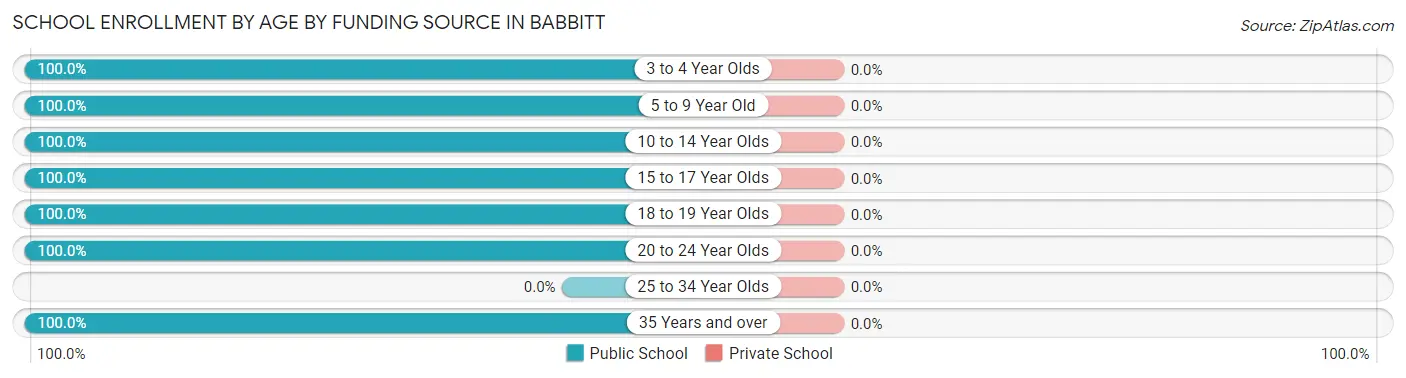
| Age Bracket | Public School | Private School |
| 3 to 4 Year Olds | 5 (100.0%) | 0 (0.0%) |
| 5 to 9 Year Old | 51 (100.0%) | 0 (0.0%) |
| 10 to 14 Year Olds | 64 (100.0%) | 0 (0.0%) |
| 15 to 17 Year Olds | 38 (100.0%) | 0 (0.0%) |
| 18 to 19 Year Olds | 32 (100.0%) | 0 (0.0%) |
| 20 to 24 Year Olds | 7 (100.0%) | 0 (0.0%) |
| 25 to 34 Year Olds | 0 (0.0%) | 0 (0.0%) |
| 35 Years and over | 6 (100.0%) | 0 (0.0%) |
| Total | 203 (100.0%) | 0 (0.0%) |
Educational Attainment by Field of Study in Babbitt
Education (48 | 20.8%), business (42 | 18.2%), social sciences (24 | 10.4%), arts & humanities (21 | 9.1%), and communications (19 | 8.2%) are the most common fields of study among 231 individuals in Babbitt who have obtained a bachelor's degree or higher.
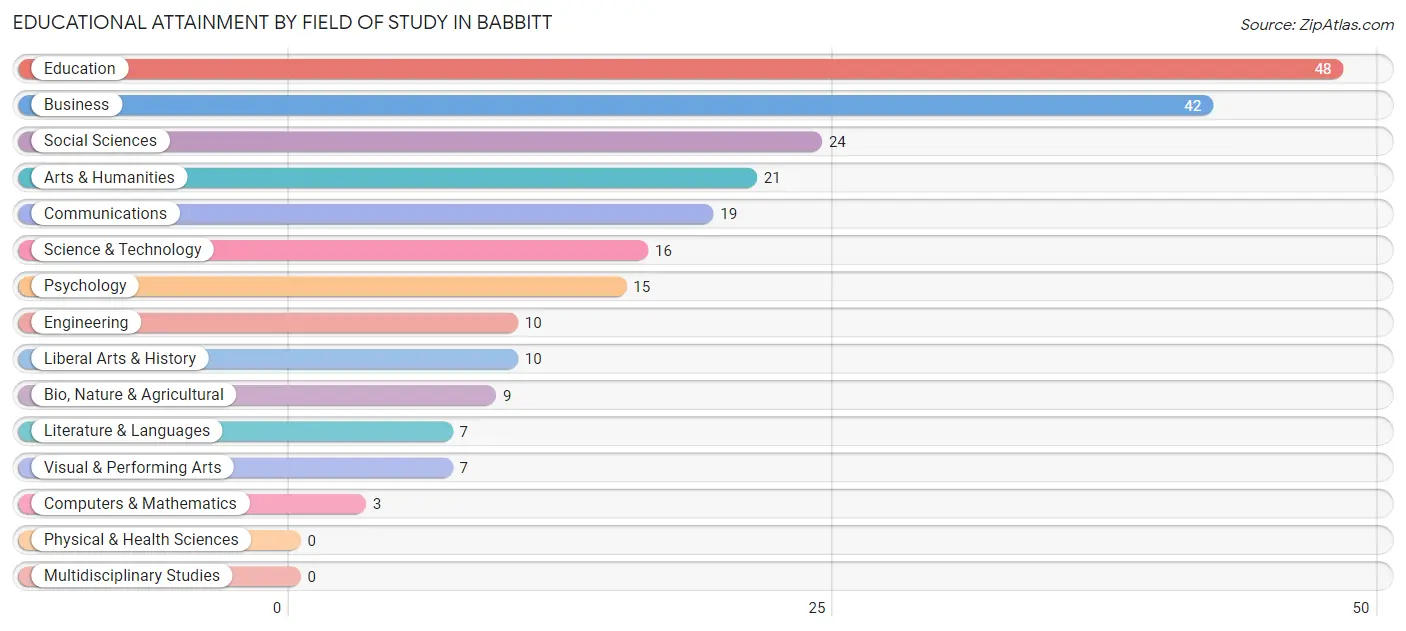
| Field of Study | # Graduates | % Graduates |
| Computers & Mathematics | 3 | 1.3% |
| Bio, Nature & Agricultural | 9 | 3.9% |
| Physical & Health Sciences | 0 | 0.0% |
| Psychology | 15 | 6.5% |
| Social Sciences | 24 | 10.4% |
| Engineering | 10 | 4.3% |
| Multidisciplinary Studies | 0 | 0.0% |
| Science & Technology | 16 | 6.9% |
| Business | 42 | 18.2% |
| Education | 48 | 20.8% |
| Literature & Languages | 7 | 3.0% |
| Liberal Arts & History | 10 | 4.3% |
| Visual & Performing Arts | 7 | 3.0% |
| Communications | 19 | 8.2% |
| Arts & Humanities | 21 | 9.1% |
| Total | 231 | 100.0% |
Transportation & Commute in Babbitt
Vehicle Availability by Sex in Babbitt
The most prevalent vehicle ownership categories in Babbitt are males with 2 vehicles (192, accounting for 52.5%) and females with 2 vehicles (99, making up 81.4%).
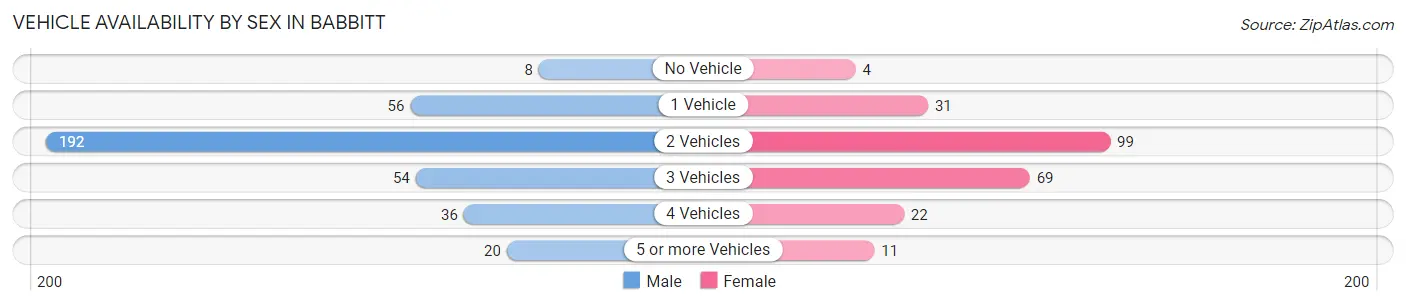
| Vehicles Available | Male | Female |
| No Vehicle | 8 (2.2%) | 4 (1.7%) |
| 1 Vehicle | 56 (15.3%) | 31 (13.1%) |
| 2 Vehicles | 192 (52.5%) | 99 (41.9%) |
| 3 Vehicles | 54 (14.7%) | 69 (29.2%) |
| 4 Vehicles | 36 (9.8%) | 22 (9.3%) |
| 5 or more Vehicles | 20 (5.5%) | 11 (4.7%) |
| Total | 366 (100.0%) | 236 (100.0%) |
Commute Time in Babbitt
The most frequently occuring commute durations in Babbitt are 45 to 59 minutes (80 commuters, 14.5%), 60 to 89 minutes (62 commuters, 11.3%), and 10 to 14 minutes (61 commuters, 11.1%).
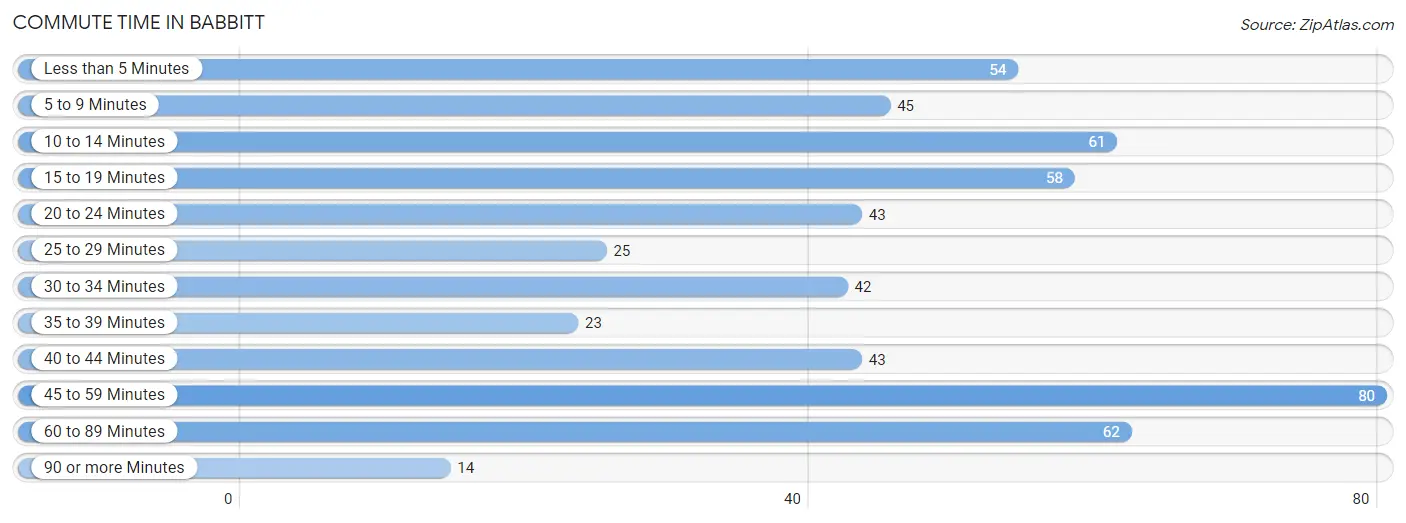
| Commute Time | # Commuters | % Commuters |
| Less than 5 Minutes | 54 | 9.8% |
| 5 to 9 Minutes | 45 | 8.2% |
| 10 to 14 Minutes | 61 | 11.1% |
| 15 to 19 Minutes | 58 | 10.5% |
| 20 to 24 Minutes | 43 | 7.8% |
| 25 to 29 Minutes | 25 | 4.5% |
| 30 to 34 Minutes | 42 | 7.6% |
| 35 to 39 Minutes | 23 | 4.2% |
| 40 to 44 Minutes | 43 | 7.8% |
| 45 to 59 Minutes | 80 | 14.5% |
| 60 to 89 Minutes | 62 | 11.3% |
| 90 or more Minutes | 14 | 2.5% |
Commute Time by Sex in Babbitt
The most common commute times in Babbitt are 15 to 19 minutes (55 commuters, 16.0%) for males and 45 to 59 minutes (46 commuters, 22.3%) for females.
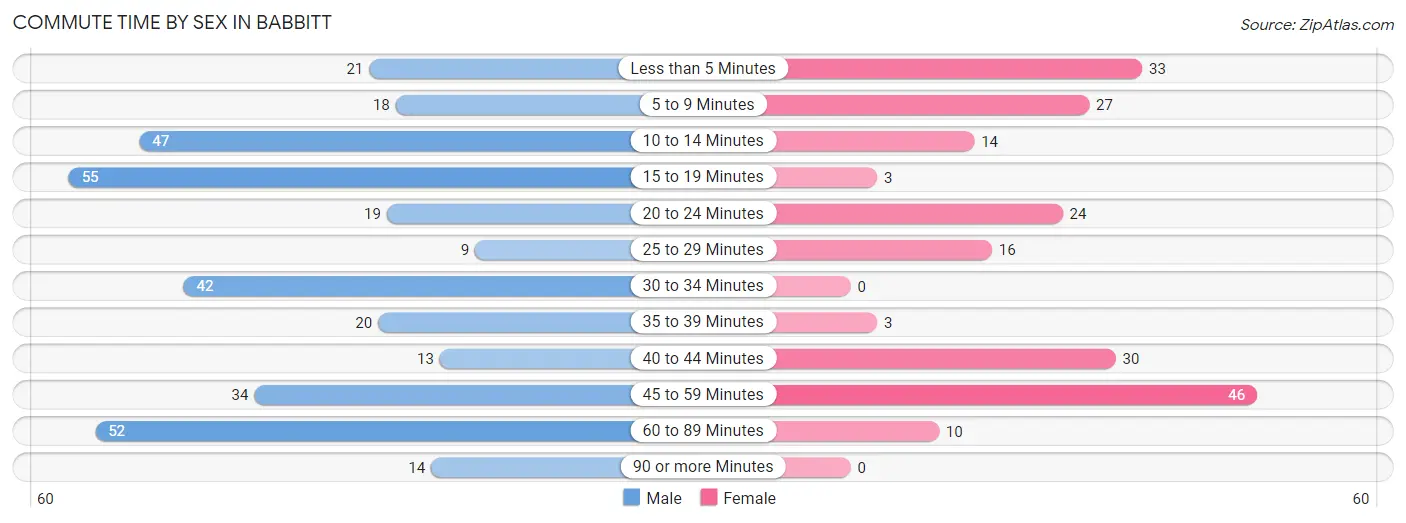
| Commute Time | Male | Female |
| Less than 5 Minutes | 21 (6.1%) | 33 (16.0%) |
| 5 to 9 Minutes | 18 (5.2%) | 27 (13.1%) |
| 10 to 14 Minutes | 47 (13.7%) | 14 (6.8%) |
| 15 to 19 Minutes | 55 (16.0%) | 3 (1.5%) |
| 20 to 24 Minutes | 19 (5.5%) | 24 (11.7%) |
| 25 to 29 Minutes | 9 (2.6%) | 16 (7.8%) |
| 30 to 34 Minutes | 42 (12.2%) | 0 (0.0%) |
| 35 to 39 Minutes | 20 (5.8%) | 3 (1.5%) |
| 40 to 44 Minutes | 13 (3.8%) | 30 (14.6%) |
| 45 to 59 Minutes | 34 (9.9%) | 46 (22.3%) |
| 60 to 89 Minutes | 52 (15.1%) | 10 (4.9%) |
| 90 or more Minutes | 14 (4.1%) | 0 (0.0%) |
Time of Departure to Work by Sex in Babbitt
The most frequent times of departure to work in Babbitt are 5:00 AM to 5:29 AM (71, 20.6%) for males and 6:30 AM to 6:59 AM (55, 26.7%) for females.
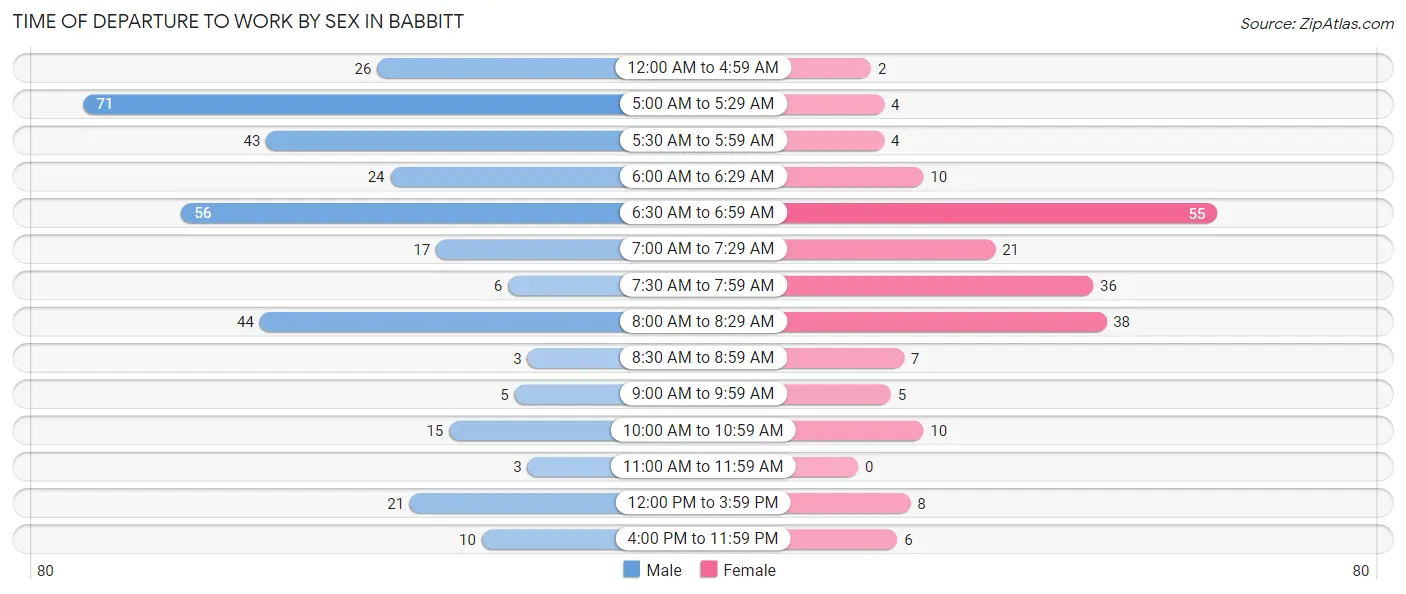
| Time of Departure | Male | Female |
| 12:00 AM to 4:59 AM | 26 (7.6%) | 2 (1.0%) |
| 5:00 AM to 5:29 AM | 71 (20.6%) | 4 (1.9%) |
| 5:30 AM to 5:59 AM | 43 (12.5%) | 4 (1.9%) |
| 6:00 AM to 6:29 AM | 24 (7.0%) | 10 (4.9%) |
| 6:30 AM to 6:59 AM | 56 (16.3%) | 55 (26.7%) |
| 7:00 AM to 7:29 AM | 17 (4.9%) | 21 (10.2%) |
| 7:30 AM to 7:59 AM | 6 (1.7%) | 36 (17.5%) |
| 8:00 AM to 8:29 AM | 44 (12.8%) | 38 (18.4%) |
| 8:30 AM to 8:59 AM | 3 (0.9%) | 7 (3.4%) |
| 9:00 AM to 9:59 AM | 5 (1.5%) | 5 (2.4%) |
| 10:00 AM to 10:59 AM | 15 (4.4%) | 10 (4.9%) |
| 11:00 AM to 11:59 AM | 3 (0.9%) | 0 (0.0%) |
| 12:00 PM to 3:59 PM | 21 (6.1%) | 8 (3.9%) |
| 4:00 PM to 11:59 PM | 10 (2.9%) | 6 (2.9%) |
| Total | 344 (100.0%) | 206 (100.0%) |
Housing Occupancy in Babbitt
Occupancy by Ownership in Babbitt
Of the total 667 dwellings in Babbitt, owner-occupied units account for 546 (81.9%), while renter-occupied units make up 121 (18.1%).
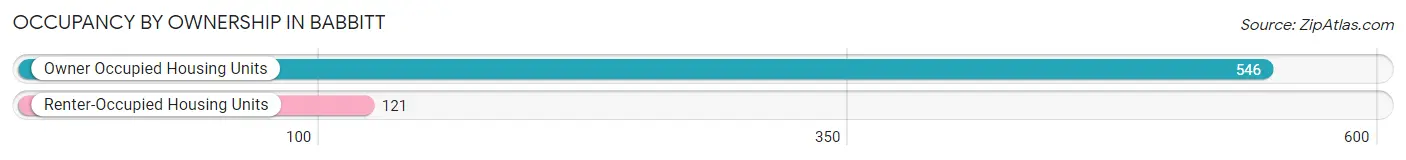
| Occupancy | # Housing Units | % Housing Units |
| Owner Occupied Housing Units | 546 | 81.9% |
| Renter-Occupied Housing Units | 121 | 18.1% |
| Total Occupied Housing Units | 667 | 100.0% |
Occupancy by Household Size in Babbitt
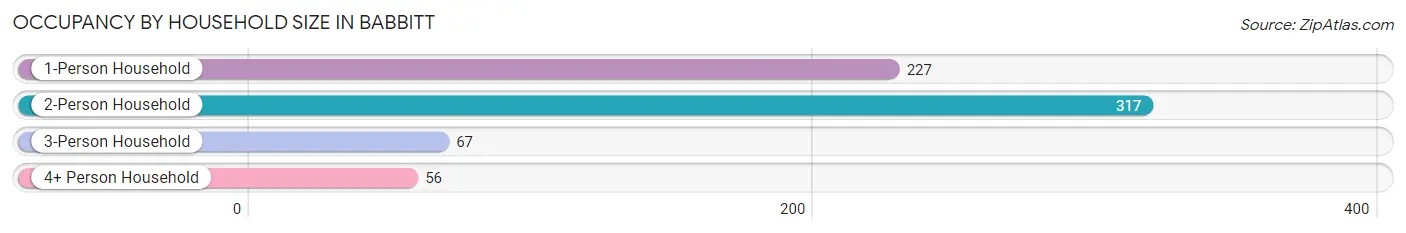
| Household Size | # Housing Units | % Housing Units |
| 1-Person Household | 227 | 34.0% |
| 2-Person Household | 317 | 47.5% |
| 3-Person Household | 67 | 10.0% |
| 4+ Person Household | 56 | 8.4% |
| Total Housing Units | 667 | 100.0% |
Occupancy by Ownership by Household Size in Babbitt
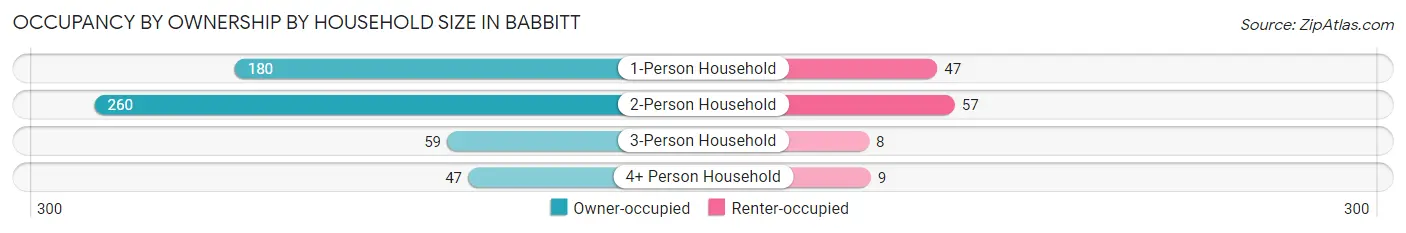
| Household Size | Owner-occupied | Renter-occupied |
| 1-Person Household | 180 (79.3%) | 47 (20.7%) |
| 2-Person Household | 260 (82.0%) | 57 (18.0%) |
| 3-Person Household | 59 (88.1%) | 8 (11.9%) |
| 4+ Person Household | 47 (83.9%) | 9 (16.1%) |
| Total Housing Units | 546 (81.9%) | 121 (18.1%) |
Occupancy by Educational Attainment in Babbitt
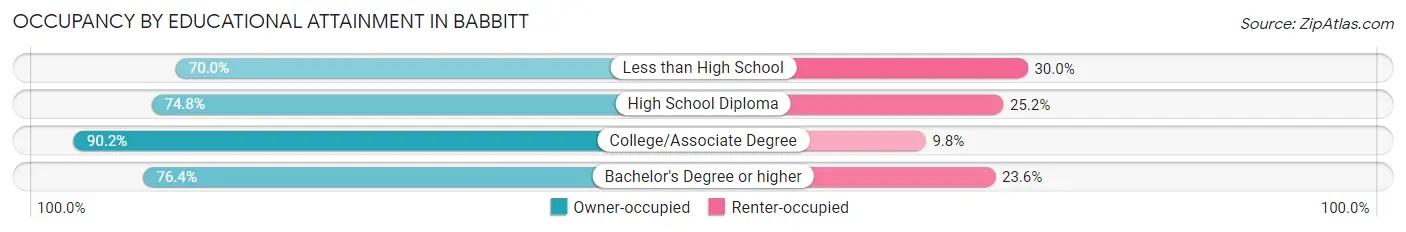
| Household Size | Owner-occupied | Renter-occupied |
| Less than High School | 56 (70.0%) | 24 (30.0%) |
| High School Diploma | 110 (74.8%) | 37 (25.2%) |
| College/Associate Degree | 286 (90.2%) | 31 (9.8%) |
| Bachelor's Degree or higher | 94 (76.4%) | 29 (23.6%) |
Occupancy by Age of Householder in Babbitt
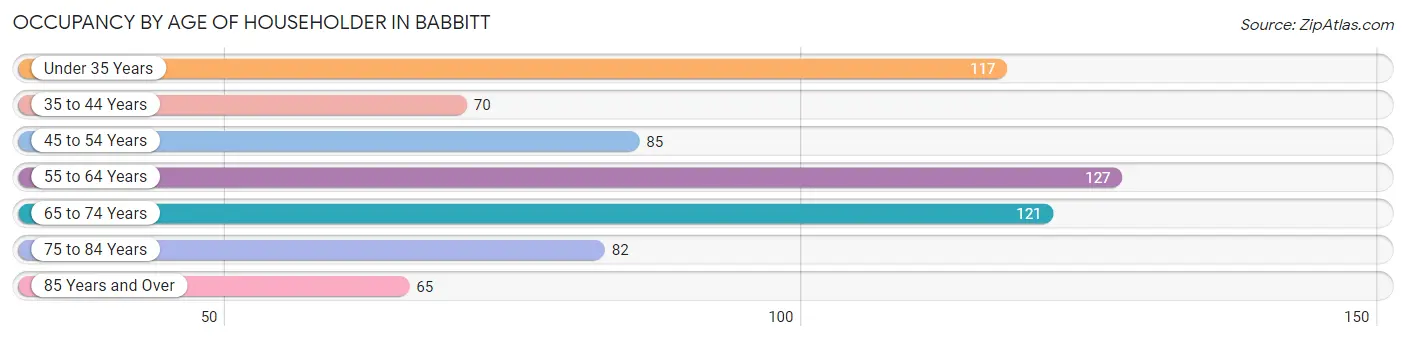
| Age Bracket | # Households | % Households |
| Under 35 Years | 117 | 17.5% |
| 35 to 44 Years | 70 | 10.5% |
| 45 to 54 Years | 85 | 12.7% |
| 55 to 64 Years | 127 | 19.0% |
| 65 to 74 Years | 121 | 18.1% |
| 75 to 84 Years | 82 | 12.3% |
| 85 Years and Over | 65 | 9.8% |
| Total | 667 | 100.0% |
Housing Finances in Babbitt
Median Income by Occupancy in Babbitt
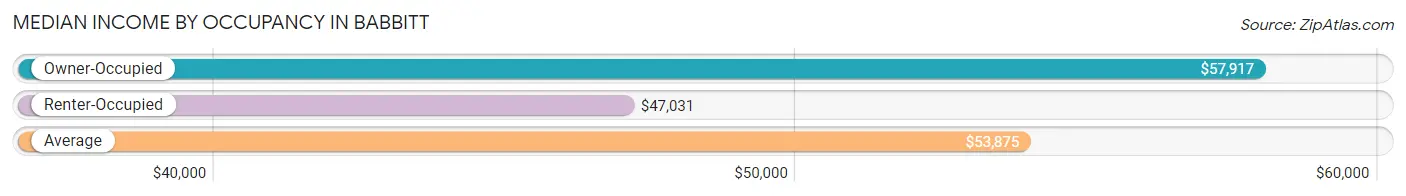
| Occupancy Type | # Households | Median Income |
| Owner-Occupied | 546 (81.9%) | $57,917 |
| Renter-Occupied | 121 (18.1%) | $47,031 |
| Average | 667 (100.0%) | $53,875 |
Occupancy by Householder Income Bracket in Babbitt
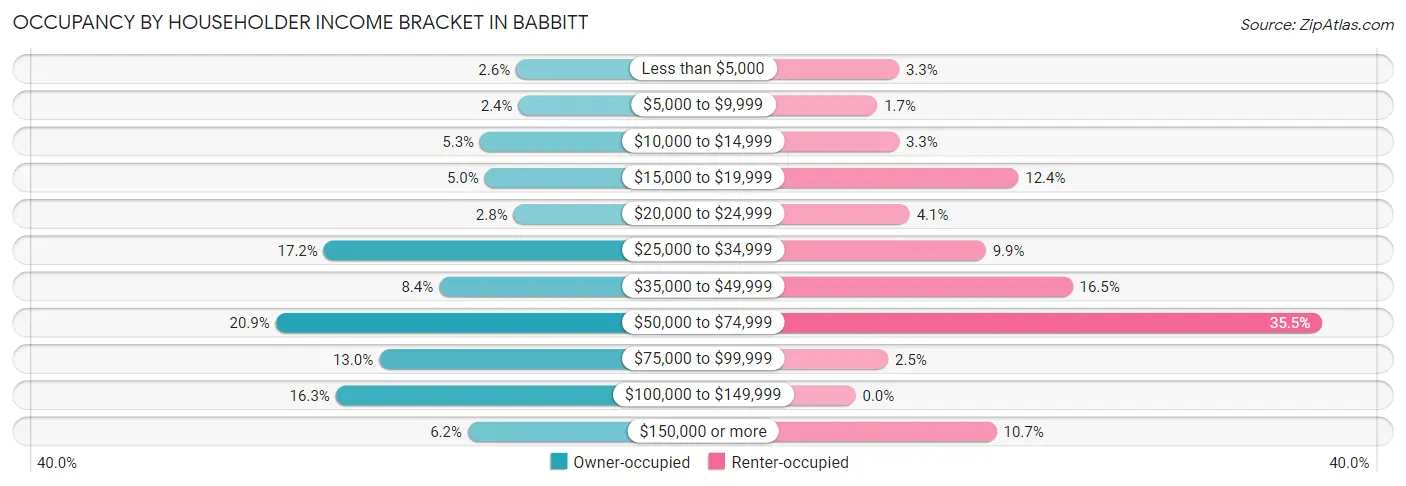
| Income Bracket | Owner-occupied | Renter-occupied |
| Less than $5,000 | 14 (2.6%) | 4 (3.3%) |
| $5,000 to $9,999 | 13 (2.4%) | 2 (1.7%) |
| $10,000 to $14,999 | 29 (5.3%) | 4 (3.3%) |
| $15,000 to $19,999 | 27 (5.0%) | 15 (12.4%) |
| $20,000 to $24,999 | 15 (2.8%) | 5 (4.1%) |
| $25,000 to $34,999 | 94 (17.2%) | 12 (9.9%) |
| $35,000 to $49,999 | 46 (8.4%) | 20 (16.5%) |
| $50,000 to $74,999 | 114 (20.9%) | 43 (35.5%) |
| $75,000 to $99,999 | 71 (13.0%) | 3 (2.5%) |
| $100,000 to $149,999 | 89 (16.3%) | 0 (0.0%) |
| $150,000 or more | 34 (6.2%) | 13 (10.7%) |
| Total | 546 (100.0%) | 121 (100.0%) |
Monthly Housing Cost Tiers in Babbitt
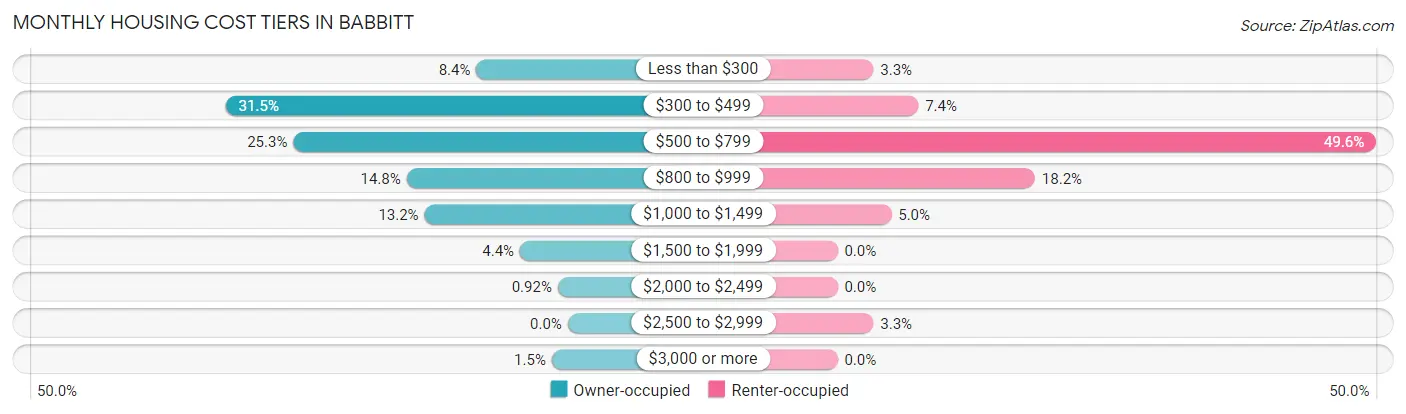
| Monthly Cost | Owner-occupied | Renter-occupied |
| Less than $300 | 46 (8.4%) | 4 (3.3%) |
| $300 to $499 | 172 (31.5%) | 9 (7.4%) |
| $500 to $799 | 138 (25.3%) | 60 (49.6%) |
| $800 to $999 | 81 (14.8%) | 22 (18.2%) |
| $1,000 to $1,499 | 72 (13.2%) | 6 (5.0%) |
| $1,500 to $1,999 | 24 (4.4%) | 0 (0.0%) |
| $2,000 to $2,499 | 5 (0.9%) | 0 (0.0%) |
| $2,500 to $2,999 | 0 (0.0%) | 4 (3.3%) |
| $3,000 or more | 8 (1.5%) | 0 (0.0%) |
| Total | 546 (100.0%) | 121 (100.0%) |
Physical Housing Characteristics in Babbitt
Housing Structures in Babbitt
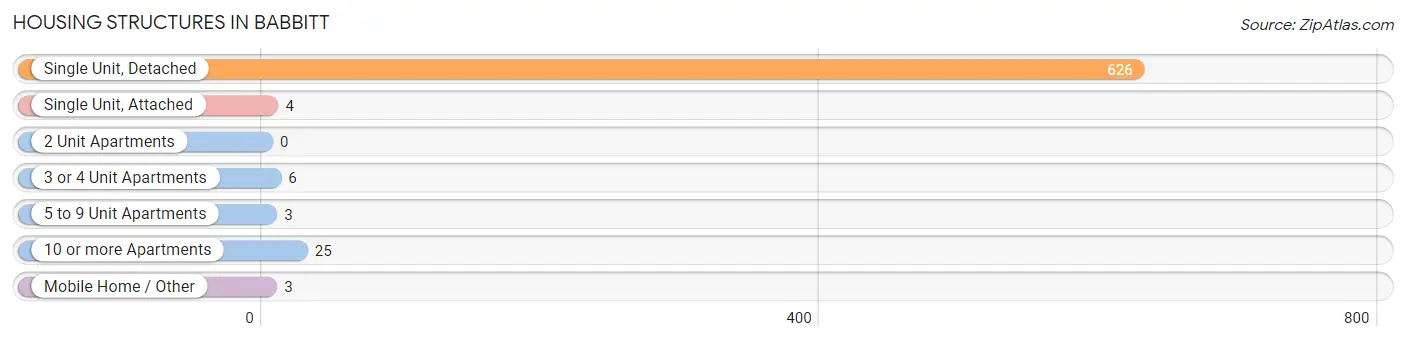
| Structure Type | # Housing Units | % Housing Units |
| Single Unit, Detached | 626 | 93.9% |
| Single Unit, Attached | 4 | 0.6% |
| 2 Unit Apartments | 0 | 0.0% |
| 3 or 4 Unit Apartments | 6 | 0.9% |
| 5 to 9 Unit Apartments | 3 | 0.4% |
| 10 or more Apartments | 25 | 3.7% |
| Mobile Home / Other | 3 | 0.4% |
| Total | 667 | 100.0% |
Housing Structures by Occupancy in Babbitt
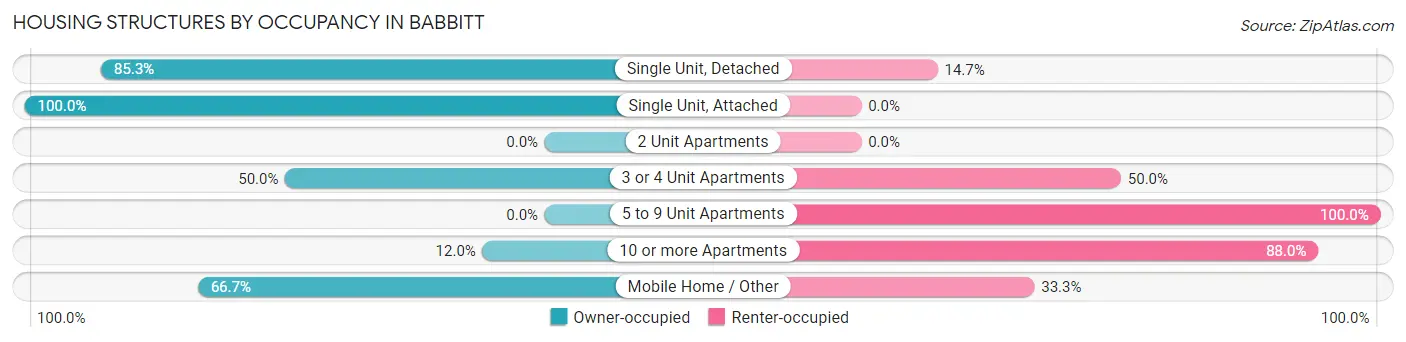
| Structure Type | Owner-occupied | Renter-occupied |
| Single Unit, Detached | 534 (85.3%) | 92 (14.7%) |
| Single Unit, Attached | 4 (100.0%) | 0 (0.0%) |
| 2 Unit Apartments | 0 (0.0%) | 0 (0.0%) |
| 3 or 4 Unit Apartments | 3 (50.0%) | 3 (50.0%) |
| 5 to 9 Unit Apartments | 0 (0.0%) | 3 (100.0%) |
| 10 or more Apartments | 3 (12.0%) | 22 (88.0%) |
| Mobile Home / Other | 2 (66.7%) | 1 (33.3%) |
| Total | 546 (81.9%) | 121 (18.1%) |
Housing Structures by Number of Rooms in Babbitt
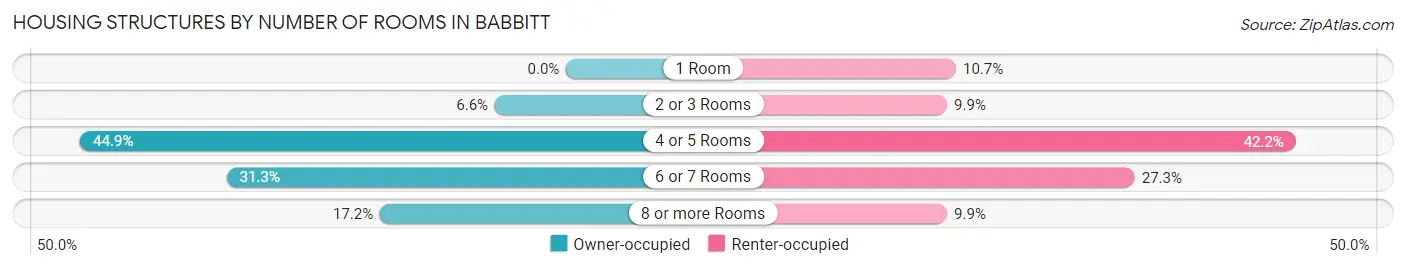
| Number of Rooms | Owner-occupied | Renter-occupied |
| 1 Room | 0 (0.0%) | 13 (10.7%) |
| 2 or 3 Rooms | 36 (6.6%) | 12 (9.9%) |
| 4 or 5 Rooms | 245 (44.9%) | 51 (42.1%) |
| 6 or 7 Rooms | 171 (31.3%) | 33 (27.3%) |
| 8 or more Rooms | 94 (17.2%) | 12 (9.9%) |
| Total | 546 (100.0%) | 121 (100.0%) |
Housing Structure by Heating Type in Babbitt
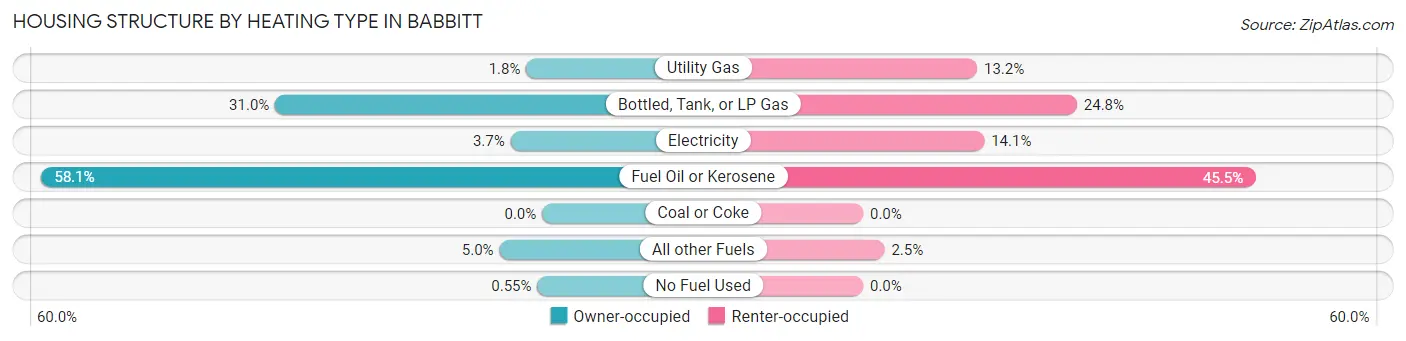
| Heating Type | Owner-occupied | Renter-occupied |
| Utility Gas | 10 (1.8%) | 16 (13.2%) |
| Bottled, Tank, or LP Gas | 169 (30.9%) | 30 (24.8%) |
| Electricity | 20 (3.7%) | 17 (14.1%) |
| Fuel Oil or Kerosene | 317 (58.1%) | 55 (45.5%) |
| Coal or Coke | 0 (0.0%) | 0 (0.0%) |
| All other Fuels | 27 (5.0%) | 3 (2.5%) |
| No Fuel Used | 3 (0.5%) | 0 (0.0%) |
| Total | 546 (100.0%) | 121 (100.0%) |
Household Vehicle Usage in Babbitt
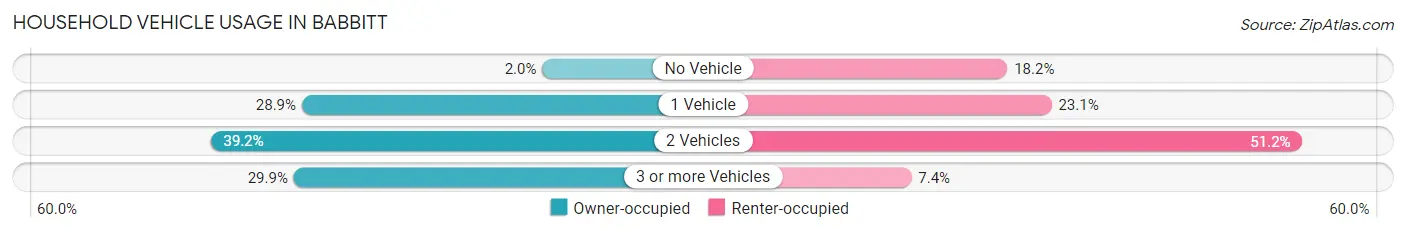
| Vehicles per Household | Owner-occupied | Renter-occupied |
| No Vehicle | 11 (2.0%) | 22 (18.2%) |
| 1 Vehicle | 158 (28.9%) | 28 (23.1%) |
| 2 Vehicles | 214 (39.2%) | 62 (51.2%) |
| 3 or more Vehicles | 163 (29.8%) | 9 (7.4%) |
| Total | 546 (100.0%) | 121 (100.0%) |
Real Estate & Mortgages in Babbitt
Real Estate and Mortgage Overview in Babbitt
| Characteristic | Without Mortgage | With Mortgage |
| Housing Units | 296 | 250 |
| Median Property Value | $84,900 | $94,700 |
| Median Household Income | $37,273 | $31 |
| Monthly Housing Costs | $429 | $4 |
| Real Estate Taxes | $742 | $0 |
Property Value by Mortgage Status in Babbitt
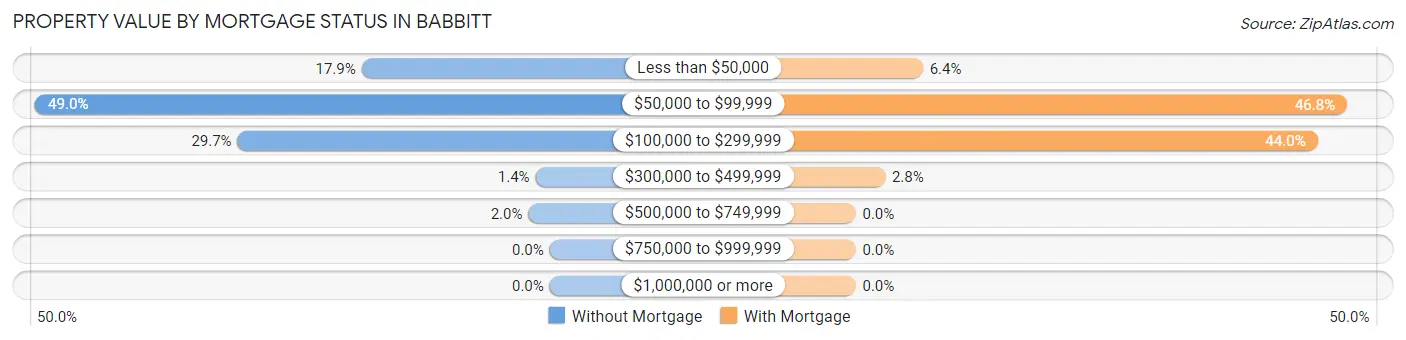
| Property Value | Without Mortgage | With Mortgage |
| Less than $50,000 | 53 (17.9%) | 16 (6.4%) |
| $50,000 to $99,999 | 145 (49.0%) | 117 (46.8%) |
| $100,000 to $299,999 | 88 (29.7%) | 110 (44.0%) |
| $300,000 to $499,999 | 4 (1.3%) | 7 (2.8%) |
| $500,000 to $749,999 | 6 (2.0%) | 0 (0.0%) |
| $750,000 to $999,999 | 0 (0.0%) | 0 (0.0%) |
| $1,000,000 or more | 0 (0.0%) | 0 (0.0%) |
| Total | 296 (100.0%) | 250 (100.0%) |
Household Income by Mortgage Status in Babbitt
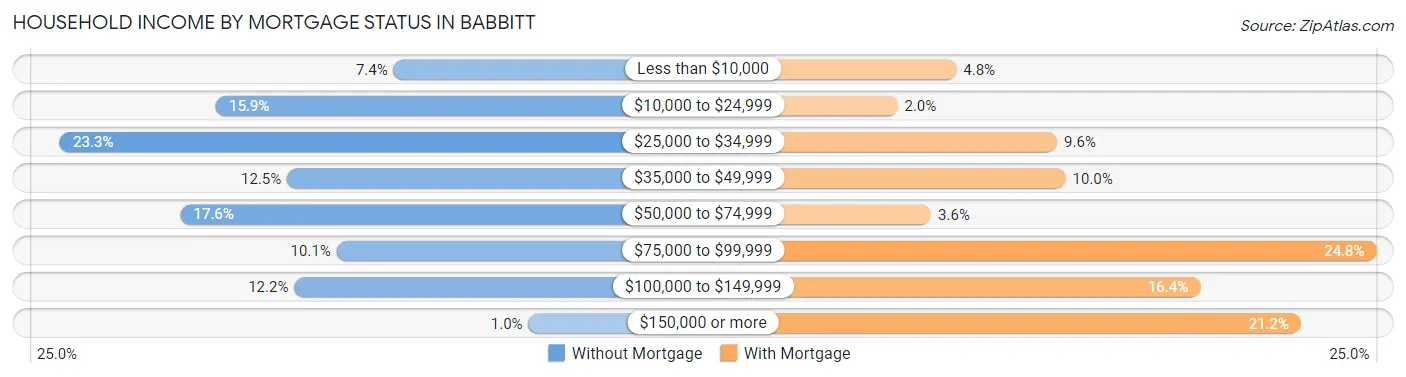
| Household Income | Without Mortgage | With Mortgage |
| Less than $10,000 | 22 (7.4%) | 12 (4.8%) |
| $10,000 to $24,999 | 47 (15.9%) | 5 (2.0%) |
| $25,000 to $34,999 | 69 (23.3%) | 24 (9.6%) |
| $35,000 to $49,999 | 37 (12.5%) | 25 (10.0%) |
| $50,000 to $74,999 | 52 (17.6%) | 9 (3.6%) |
| $75,000 to $99,999 | 30 (10.1%) | 62 (24.8%) |
| $100,000 to $149,999 | 36 (12.2%) | 41 (16.4%) |
| $150,000 or more | 3 (1.0%) | 53 (21.2%) |
| Total | 296 (100.0%) | 250 (100.0%) |
Property Value to Household Income Ratio in Babbitt
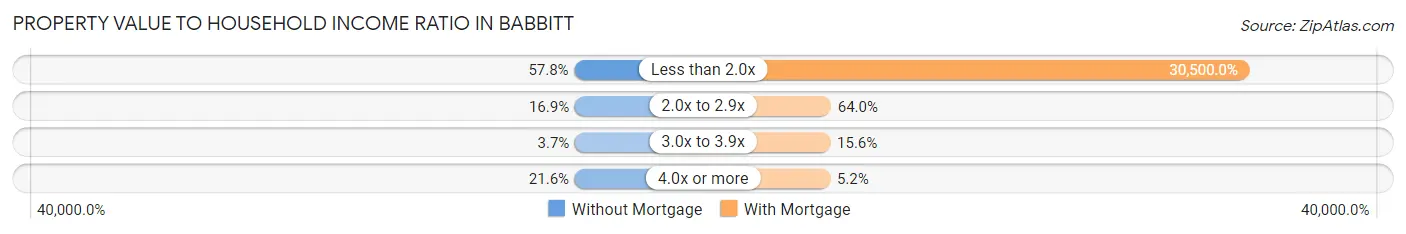
| Value-to-Income Ratio | Without Mortgage | With Mortgage |
| Less than 2.0x | 171 (57.8%) | 76,250 (30,500.0%) |
| 2.0x to 2.9x | 50 (16.9%) | 160 (64.0%) |
| 3.0x to 3.9x | 11 (3.7%) | 39 (15.6%) |
| 4.0x or more | 64 (21.6%) | 13 (5.2%) |
| Total | 296 (100.0%) | 250 (100.0%) |
Real Estate Taxes by Mortgage Status in Babbitt
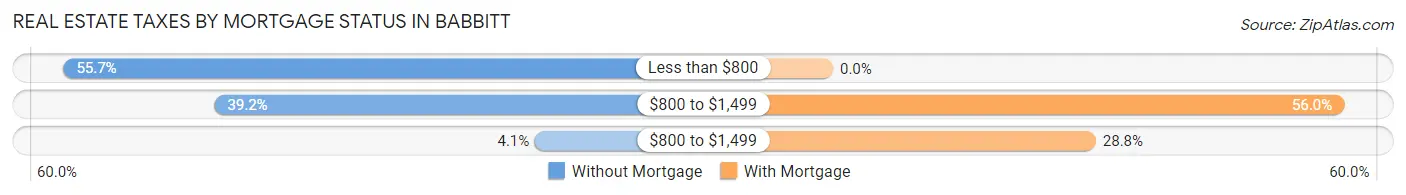
| Property Taxes | Without Mortgage | With Mortgage |
| Less than $800 | 165 (55.7%) | 0 (0.0%) |
| $800 to $1,499 | 116 (39.2%) | 140 (56.0%) |
| $800 to $1,499 | 12 (4.1%) | 72 (28.8%) |
| Total | 296 (100.0%) | 250 (100.0%) |
Health & Disability in Babbitt
Health Insurance Coverage by Age in Babbitt
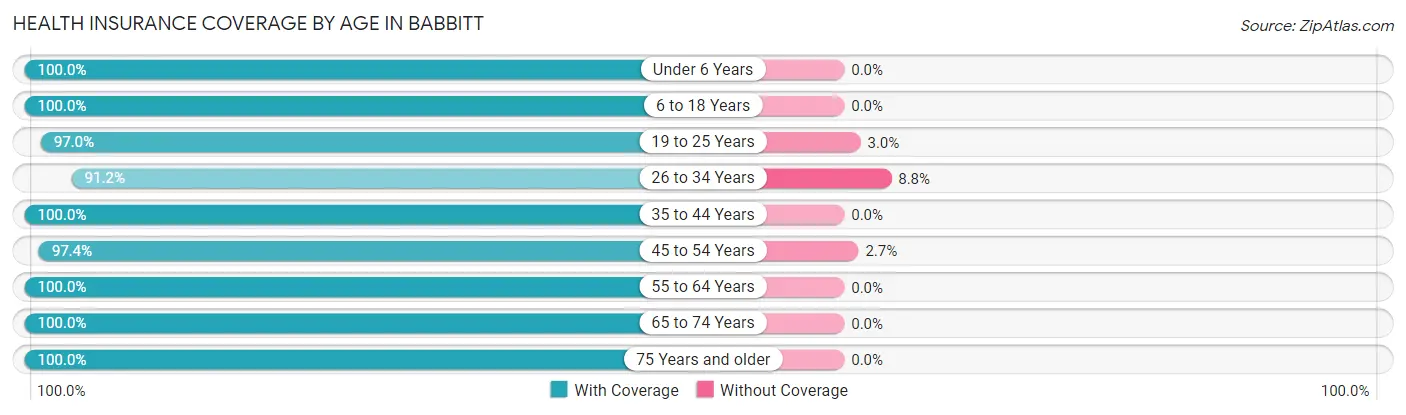
| Age Bracket | With Coverage | Without Coverage |
| Under 6 Years | 58 (100.0%) | 0 (0.0%) |
| 6 to 18 Years | 157 (100.0%) | 0 (0.0%) |
| 19 to 25 Years | 96 (97.0%) | 3 (3.0%) |
| 26 to 34 Years | 125 (91.2%) | 12 (8.8%) |
| 35 to 44 Years | 136 (100.0%) | 0 (0.0%) |
| 45 to 54 Years | 147 (97.4%) | 4 (2.6%) |
| 55 to 64 Years | 235 (100.0%) | 0 (0.0%) |
| 65 to 74 Years | 166 (100.0%) | 0 (0.0%) |
| 75 Years and older | 196 (100.0%) | 0 (0.0%) |
| Total | 1,316 (98.6%) | 19 (1.4%) |
Health Insurance Coverage by Citizenship Status in Babbitt
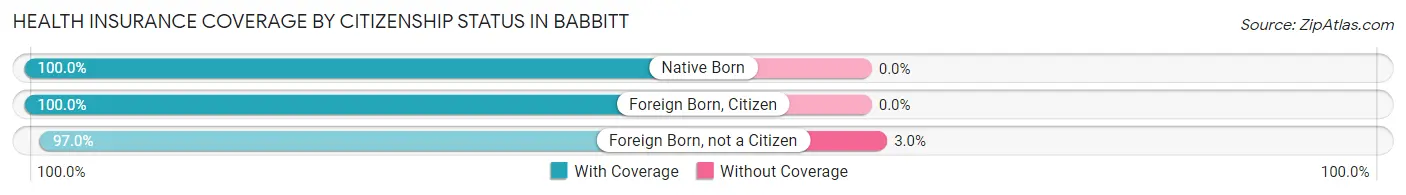
| Citizenship Status | With Coverage | Without Coverage |
| Native Born | 58 (100.0%) | 0 (0.0%) |
| Foreign Born, Citizen | 157 (100.0%) | 0 (0.0%) |
| Foreign Born, not a Citizen | 96 (97.0%) | 3 (3.0%) |
Health Insurance Coverage by Household Income in Babbitt
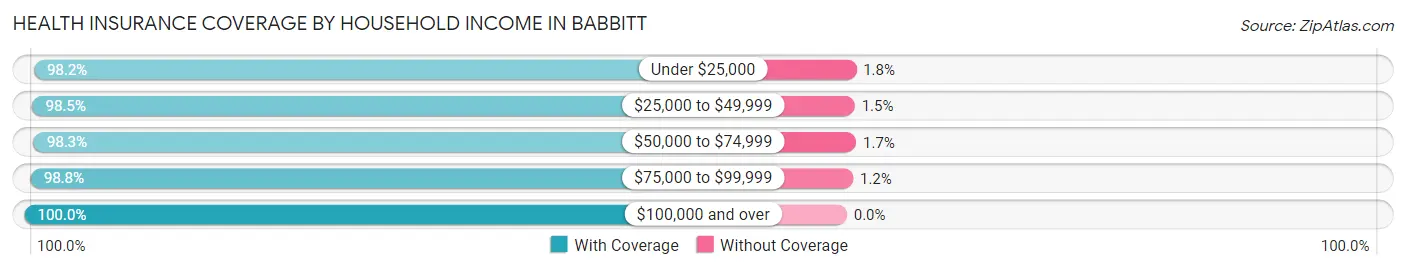
| Household Income | With Coverage | Without Coverage |
| Under $25,000 | 167 (98.2%) | 3 (1.8%) |
| $25,000 to $49,999 | 264 (98.5%) | 4 (1.5%) |
| $50,000 to $74,999 | 339 (98.3%) | 6 (1.7%) |
| $75,000 to $99,999 | 169 (98.8%) | 2 (1.2%) |
| $100,000 and over | 369 (100.0%) | 0 (0.0%) |
Public vs Private Health Insurance Coverage by Age in Babbitt
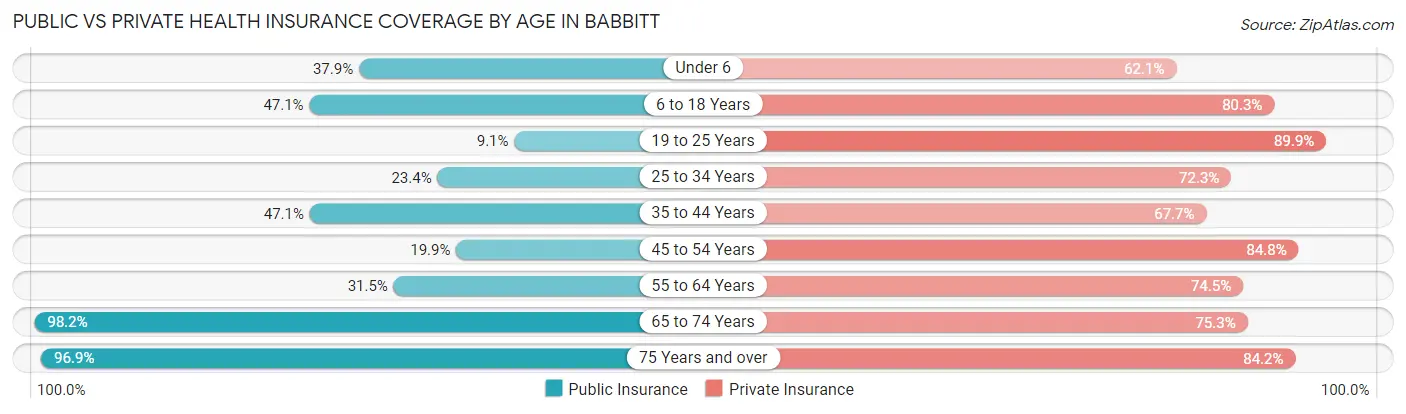
| Age Bracket | Public Insurance | Private Insurance |
| Under 6 | 22 (37.9%) | 36 (62.1%) |
| 6 to 18 Years | 74 (47.1%) | 126 (80.2%) |
| 19 to 25 Years | 9 (9.1%) | 89 (89.9%) |
| 25 to 34 Years | 32 (23.4%) | 99 (72.3%) |
| 35 to 44 Years | 64 (47.1%) | 92 (67.6%) |
| 45 to 54 Years | 30 (19.9%) | 128 (84.8%) |
| 55 to 64 Years | 74 (31.5%) | 175 (74.5%) |
| 65 to 74 Years | 163 (98.2%) | 125 (75.3%) |
| 75 Years and over | 190 (96.9%) | 165 (84.2%) |
| Total | 658 (49.3%) | 1,035 (77.5%) |
Disability Status by Sex by Age in Babbitt
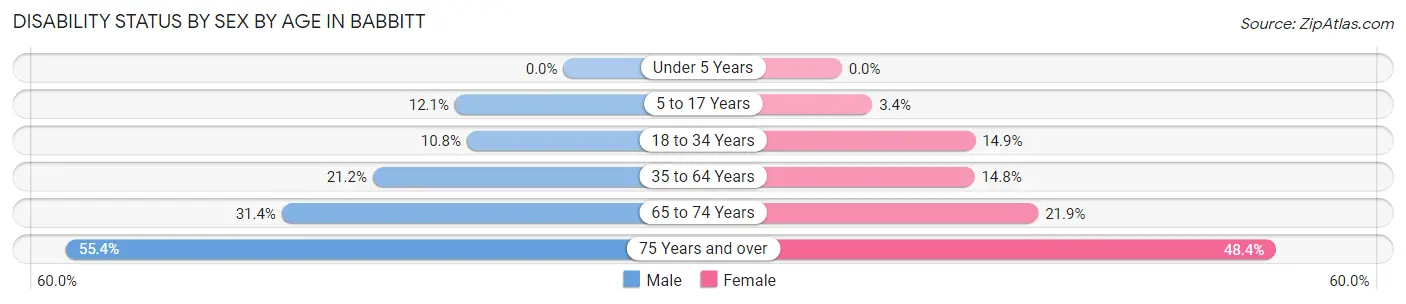
| Age Bracket | Male | Female |
| Under 5 Years | 0 (0.0%) | 0 (0.0%) |
| 5 to 17 Years | 11 (12.1%) | 2 (3.4%) |
| 18 to 34 Years | 20 (10.7%) | 11 (14.9%) |
| 35 to 64 Years | 62 (21.2%) | 34 (14.8%) |
| 65 to 74 Years | 32 (31.4%) | 14 (21.9%) |
| 75 Years and over | 41 (55.4%) | 59 (48.4%) |
Disability Class by Sex by Age in Babbitt
Disability Class: Hearing Difficulty
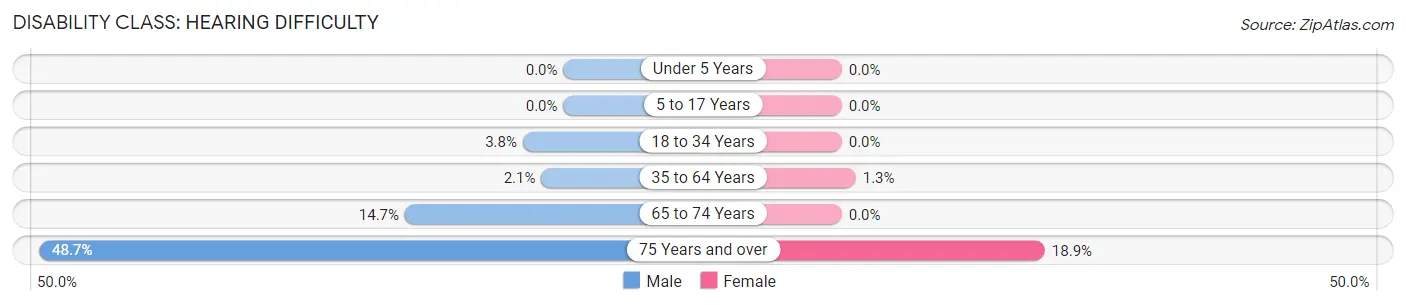
| Age Bracket | Male | Female |
| Under 5 Years | 0 (0.0%) | 0 (0.0%) |
| 5 to 17 Years | 0 (0.0%) | 0 (0.0%) |
| 18 to 34 Years | 7 (3.8%) | 0 (0.0%) |
| 35 to 64 Years | 6 (2.1%) | 3 (1.3%) |
| 65 to 74 Years | 15 (14.7%) | 0 (0.0%) |
| 75 Years and over | 36 (48.6%) | 23 (18.9%) |
Disability Class: Vision Difficulty
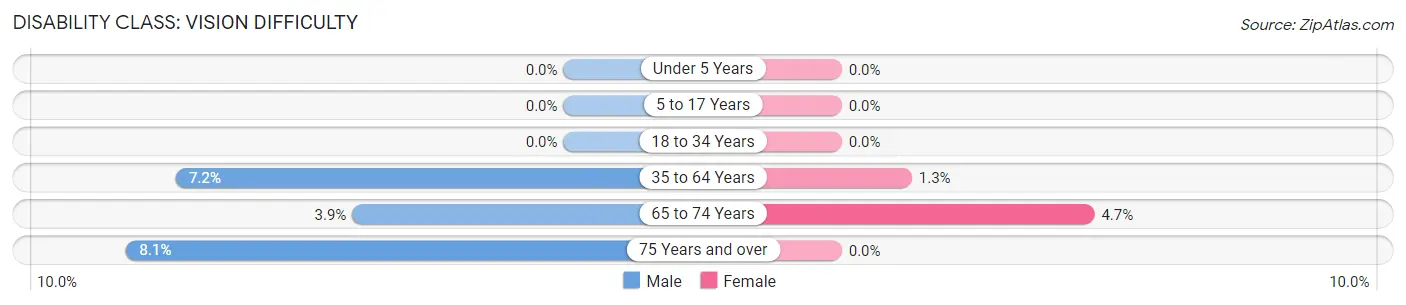
| Age Bracket | Male | Female |
| Under 5 Years | 0 (0.0%) | 0 (0.0%) |
| 5 to 17 Years | 0 (0.0%) | 0 (0.0%) |
| 18 to 34 Years | 0 (0.0%) | 0 (0.0%) |
| 35 to 64 Years | 21 (7.2%) | 3 (1.3%) |
| 65 to 74 Years | 4 (3.9%) | 3 (4.7%) |
| 75 Years and over | 6 (8.1%) | 0 (0.0%) |
Disability Class: Cognitive Difficulty
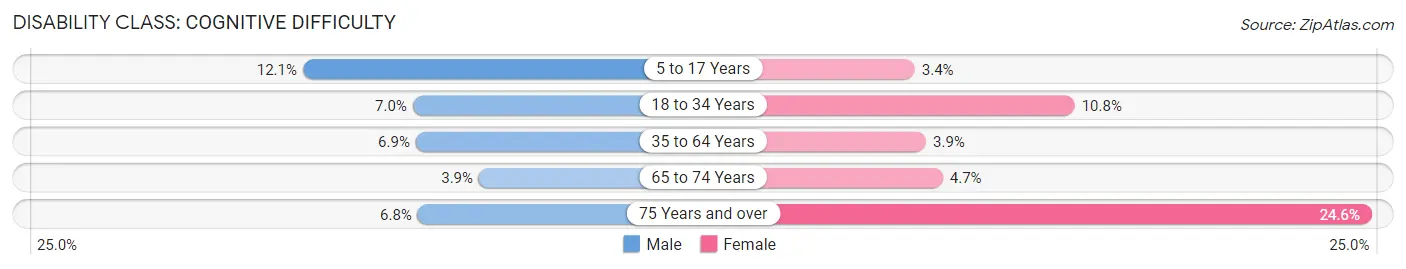
| Age Bracket | Male | Female |
| 5 to 17 Years | 11 (12.1%) | 2 (3.4%) |
| 18 to 34 Years | 13 (7.0%) | 8 (10.8%) |
| 35 to 64 Years | 20 (6.9%) | 9 (3.9%) |
| 65 to 74 Years | 4 (3.9%) | 3 (4.7%) |
| 75 Years and over | 5 (6.8%) | 30 (24.6%) |
Disability Class: Ambulatory Difficulty
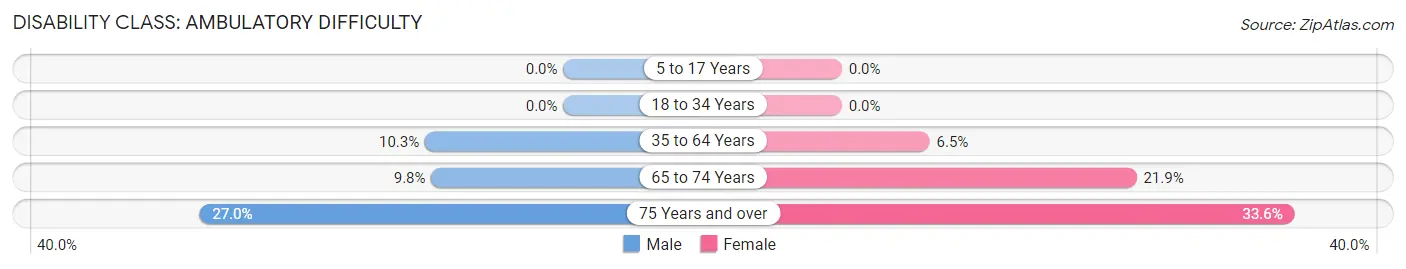
| Age Bracket | Male | Female |
| 5 to 17 Years | 0 (0.0%) | 0 (0.0%) |
| 18 to 34 Years | 0 (0.0%) | 0 (0.0%) |
| 35 to 64 Years | 30 (10.3%) | 15 (6.5%) |
| 65 to 74 Years | 10 (9.8%) | 14 (21.9%) |
| 75 Years and over | 20 (27.0%) | 41 (33.6%) |
Disability Class: Self-Care Difficulty
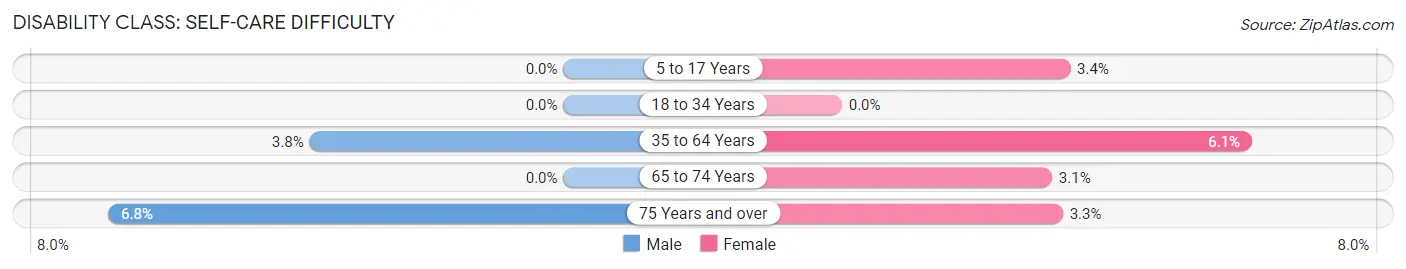
| Age Bracket | Male | Female |
| 5 to 17 Years | 0 (0.0%) | 2 (3.4%) |
| 18 to 34 Years | 0 (0.0%) | 0 (0.0%) |
| 35 to 64 Years | 11 (3.8%) | 14 (6.1%) |
| 65 to 74 Years | 0 (0.0%) | 2 (3.1%) |
| 75 Years and over | 5 (6.8%) | 4 (3.3%) |
Technology Access in Babbitt
Computing Device Access in Babbitt
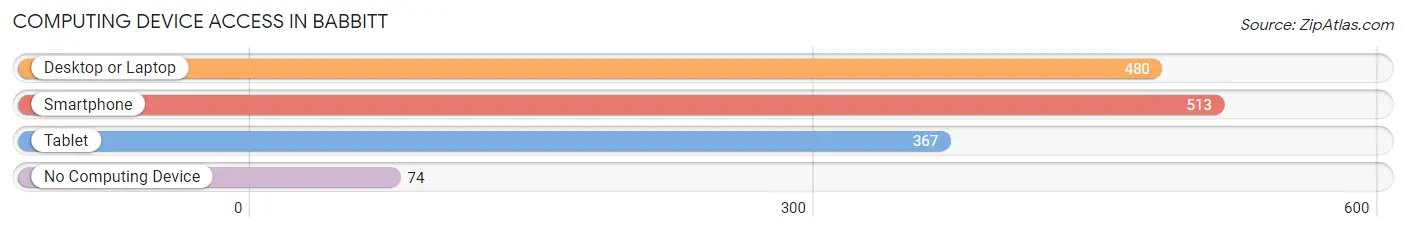
| Device Type | # Households | % Households |
| Desktop or Laptop | 480 | 72.0% |
| Smartphone | 513 | 76.9% |
| Tablet | 367 | 55.0% |
| No Computing Device | 74 | 11.1% |
| Total | 667 | 100.0% |
Internet Access in Babbitt
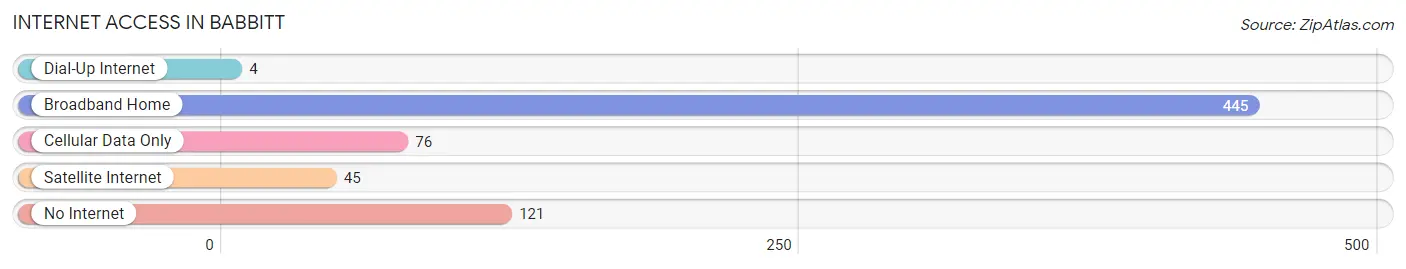
| Internet Type | # Households | % Households |
| Dial-Up Internet | 4 | 0.6% |
| Broadband Home | 445 | 66.7% |
| Cellular Data Only | 76 | 11.4% |
| Satellite Internet | 45 | 6.8% |
| No Internet | 121 | 18.1% |
| Total | 667 | 100.0% |
Babbitt Summary
Babbitt, Minnesota is a small city located in the northeastern part of the state, in St. Louis County. It is situated on the western shore of Lake Superior, and is part of the Iron Range region. The city has a population of 1,717 people, according to the 2010 census.
Geography
Babbitt is located in the Arrowhead region of Minnesota, which is known for its rugged terrain and dense forests. The city is situated on the western shore of Lake Superior, and is surrounded by the Superior National Forest. The city is located at the intersection of Minnesota State Highway 1 and Minnesota State Highway 169. The city is located approximately 25 miles south of the Canadian border.
The city has a total area of 1.2 square miles, all of which is land. The terrain is mostly flat, with some rolling hills. The city is located in a temperate climate zone, with cold winters and warm summers.
Economy
Babbitt is a small city, and its economy is largely based on tourism and the mining industry. The city is home to several tourist attractions, including the Babbitt Mine, the Babbitt Historical Museum, and the Babbitt Nature Center. The city is also home to several small businesses, including restaurants, retail stores, and service providers.
The city is also home to several mining operations, including the Babbitt Mine, which is the largest iron ore mine in the United States. The mine is owned by the Cleveland-Cliffs Iron Company, and is the largest employer in the city. The mine produces iron ore, which is used in the production of steel.
Demographics
According to the 2010 census, the population of Babbitt was 1,717 people. The population is predominantly white, with a small percentage of African Americans, Native Americans, and other races. The median age of the population is 44.7 years, and the median household income is $41,944.
The city has a high rate of poverty, with 24.3% of the population living below the poverty line. The unemployment rate is also high, at 8.2%. The city has a high rate of educational attainment, with 92.3% of the population having a high school diploma or higher.
Conclusion
Babbitt, Minnesota is a small city located in the northeastern part of the state, in St. Louis County. It is situated on the western shore of Lake Superior, and is part of the Iron Range region. The city has a population of 1,717 people, according to the 2010 census. The city's economy is largely based on tourism and the mining industry, and the city is home to several tourist attractions and small businesses. The city has a high rate of poverty, with 24.3% of the population living below the poverty line. The city also has a high rate of educational attainment, with 92.3% of the population having a high school diploma or higher.
Common Questions
What is the Total Population of Babbitt?
Total Population of Babbitt is 1,377.
What is the Total Male Population of Babbitt?
Total Male Population of Babbitt is 787.
What is the Total Female Population of Babbitt?
Total Female Population of Babbitt is 590.
What is the Ratio of Males per 100 Females in Babbitt?
There are 133.39 Males per 100 Females in Babbitt.
What is the Ratio of Females per 100 Males in Babbitt?
There are 74.97 Females per 100 Males in Babbitt.
What is the Median Population Age in Babbitt?
Median Population Age in Babbitt is 51.6 Years.
What is the Average Family Size in Babbitt
Average Family Size in Babbitt is 2.4 People.
What is the Average Household Size in Babbitt
Average Household Size in Babbitt is 2.0 People.
What is Per Capita Income in Babbitt?
Per Capita income in Babbitt is $32,922.
What is the Median Family Income in Babbitt?
Median Family Income in Babbitt is $63,875.
What is the Median Household income in Babbitt?
Median Household Income in Babbitt is $53,875.
What is Income or Wage Gap in Babbitt?
Income or Wage Gap in Babbitt is 16.2%.
Women in Babbitt earn 83.8 cents for every dollar earned by a man.
What is Inequality or Gini Index in Babbitt?
Inequality or Gini Index in Babbitt is 0.39.
How Large is the Labor Force in Babbitt?
There are 649 People in the Labor Forcein in Babbitt.
What is the Percentage of People in the Labor Force in Babbitt?
54.2% of People are in the Labor Force in Babbitt.
What is the Unemployment Rate in Babbitt?
Unemployment Rate in Babbitt is 4.2%.