Amo, IN
Amo Map
Amo Overview
422
TOTAL POPULATION
218
MALE POPULATION
204
FEMALE POPULATION
106.86
MALES / 100 FEMALES
93.58
FEMALES / 100 MALES
31.7
MEDIAN AGE
3.6
AVG FAMILY SIZE
3.2
AVG HOUSEHOLD SIZE
$28,283
PER CAPITA INCOME
$81,563
AVG FAMILY INCOME
$71,932
AVG HOUSEHOLD INCOME
13.8%
WAGE / INCOME GAP [ % ]
86.2¢/ $1
WAGE / INCOME GAP [ $ ]
0.35
INEQUALITY / GINI INDEX
197
LABOR FORCE [ PEOPLE ]
61.4%
PERCENT IN LABOR FORCE
2.5%
UNEMPLOYMENT RATE
Amo Zip Codes
Race in Amo
The most populous races in Amo are White / Caucasian (415 | 98.3%), Hispanic or Latino (3 | 0.7%), and Two or more Races (3 | 0.7%).
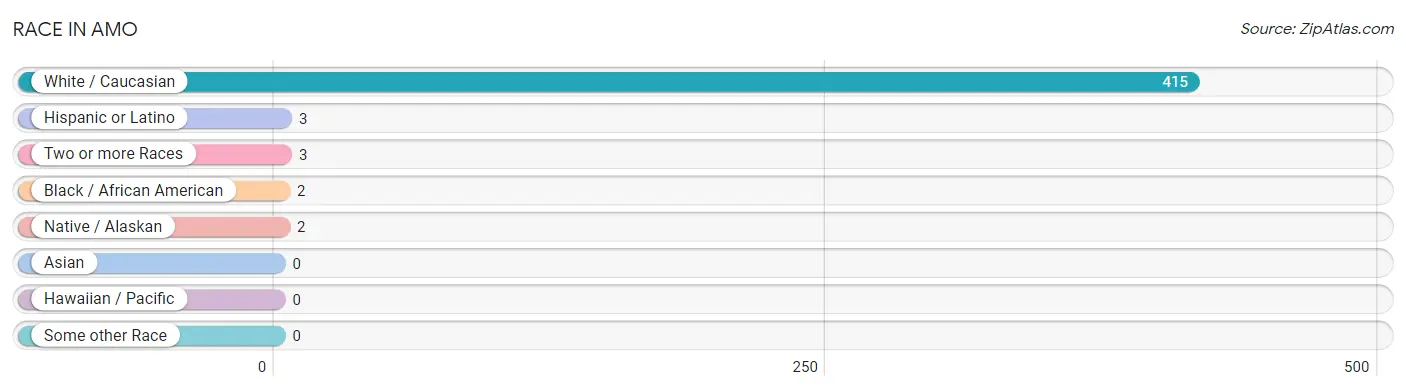
| Race | # Population | % Population |
| Asian | 0 | 0.0% |
| Black / African American | 2 | 0.5% |
| Hawaiian / Pacific | 0 | 0.0% |
| Hispanic or Latino | 3 | 0.7% |
| Native / Alaskan | 2 | 0.5% |
| White / Caucasian | 415 | 98.3% |
| Two or more Races | 3 | 0.7% |
| Some other Race | 0 | 0.0% |
| Total | 422 | 100.0% |
Ancestry in Amo
The most populous ancestries reported in Amo are American (63 | 14.9%), English (61 | 14.4%), German (33 | 7.8%), Irish (13 | 3.1%), and British (12 | 2.8%), together accounting for 43.1% of all Amo residents.
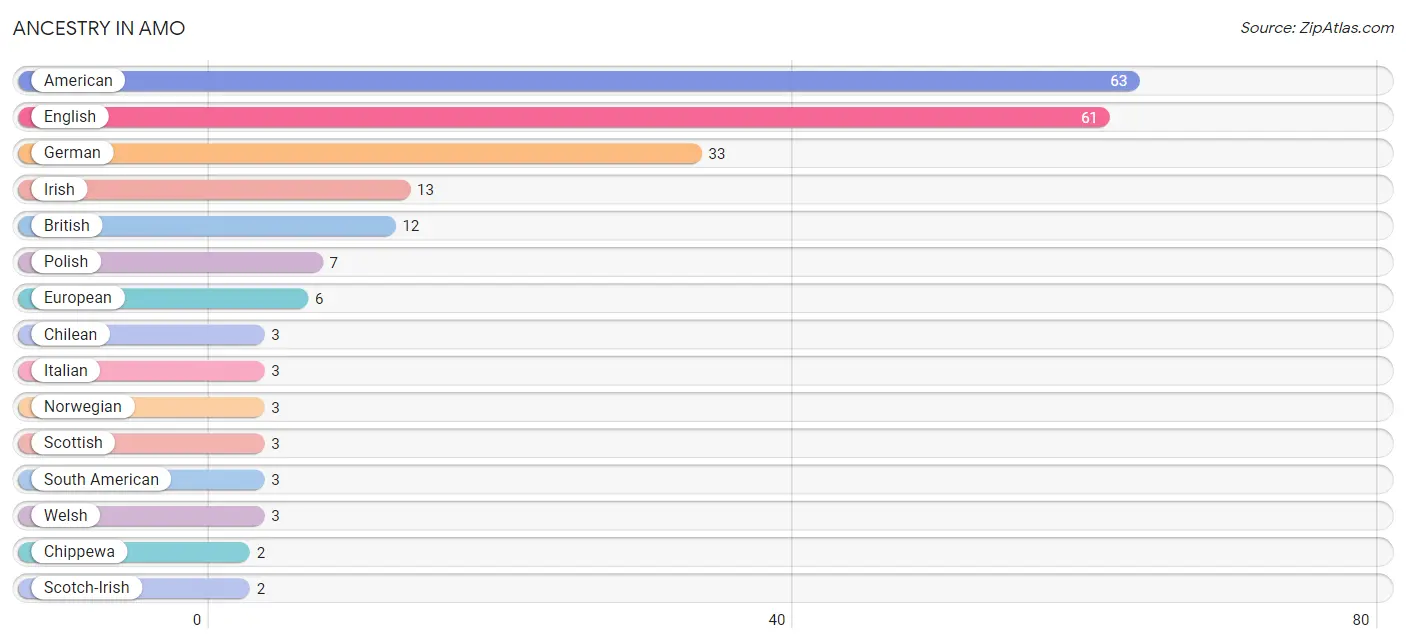
| Ancestry | # Population | % Population |
| American | 63 | 14.9% |
| British | 12 | 2.8% |
| Chilean | 3 | 0.7% |
| Chippewa | 2 | 0.5% |
| Czech | 1 | 0.2% |
| English | 61 | 14.4% |
| European | 6 | 1.4% |
| German | 33 | 7.8% |
| Irish | 13 | 3.1% |
| Italian | 3 | 0.7% |
| Norwegian | 3 | 0.7% |
| Polish | 7 | 1.7% |
| Scotch-Irish | 2 | 0.5% |
| Scottish | 3 | 0.7% |
| South American | 3 | 0.7% |
| Welsh | 3 | 0.7% | View All 16 Rows |
Immigrants in Amo

| Immigration Origin | # Population | % Population | View All 0 Rows |
Sex and Age in Amo
Sex and Age in Amo
The most populous age groups in Amo are 25 to 29 Years (41 | 18.8%) for men and 10 to 14 Years (32 | 15.7%) for women.
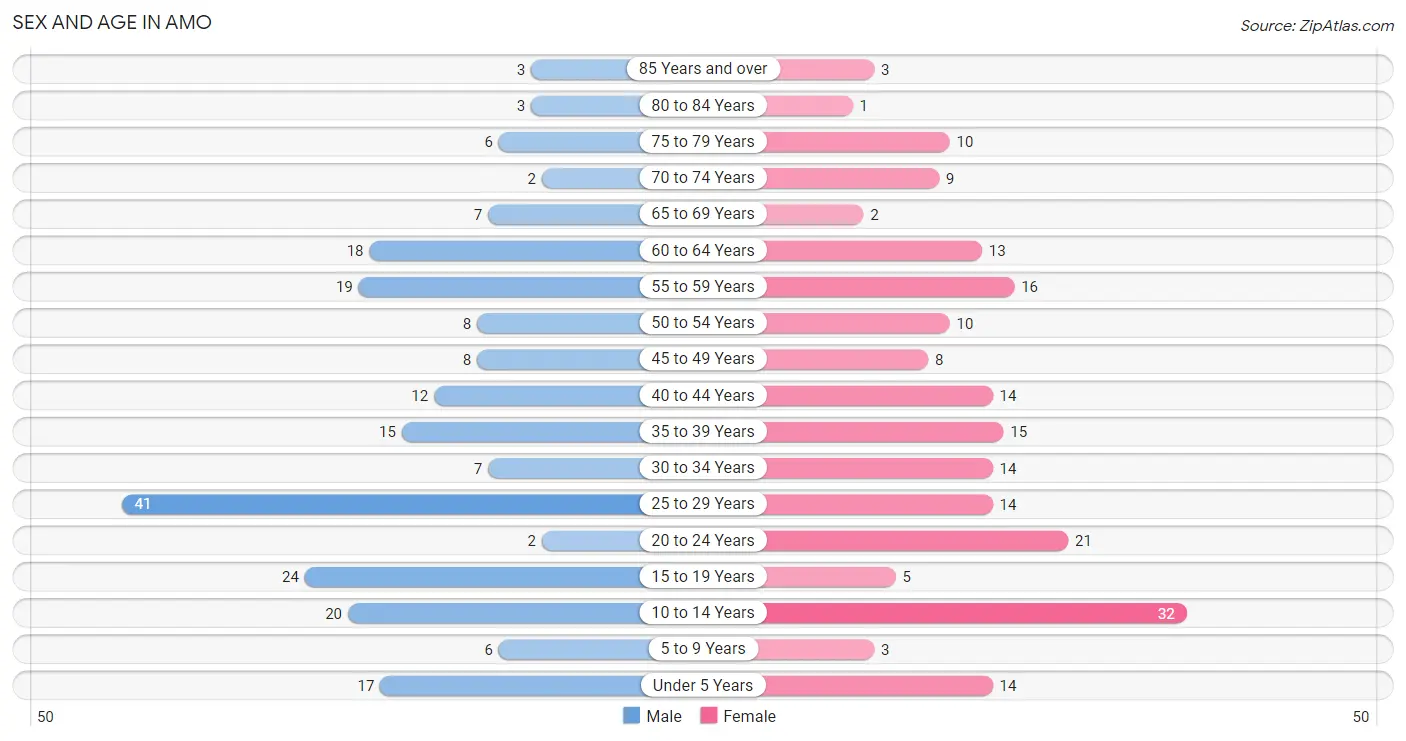
| Age Bracket | Male | Female |
| Under 5 Years | 17 (7.8%) | 14 (6.9%) |
| 5 to 9 Years | 6 (2.8%) | 3 (1.5%) |
| 10 to 14 Years | 20 (9.2%) | 32 (15.7%) |
| 15 to 19 Years | 24 (11.0%) | 5 (2.5%) |
| 20 to 24 Years | 2 (0.9%) | 21 (10.3%) |
| 25 to 29 Years | 41 (18.8%) | 14 (6.9%) |
| 30 to 34 Years | 7 (3.2%) | 14 (6.9%) |
| 35 to 39 Years | 15 (6.9%) | 15 (7.3%) |
| 40 to 44 Years | 12 (5.5%) | 14 (6.9%) |
| 45 to 49 Years | 8 (3.7%) | 8 (3.9%) |
| 50 to 54 Years | 8 (3.7%) | 10 (4.9%) |
| 55 to 59 Years | 19 (8.7%) | 16 (7.8%) |
| 60 to 64 Years | 18 (8.3%) | 13 (6.4%) |
| 65 to 69 Years | 7 (3.2%) | 2 (1.0%) |
| 70 to 74 Years | 2 (0.9%) | 9 (4.4%) |
| 75 to 79 Years | 6 (2.8%) | 10 (4.9%) |
| 80 to 84 Years | 3 (1.4%) | 1 (0.5%) |
| 85 Years and over | 3 (1.4%) | 3 (1.5%) |
| Total | 218 (100.0%) | 204 (100.0%) |
Families and Households in Amo
Median Family Size in Amo
The median family size in Amo is 3.61 persons per family, with single male/father families (10 | 9.2%) accounting for the largest median family size of 3.9 persons per family. On the other hand, single female/mother families (13 | 11.9%) represent the smallest median family size with 2.69 persons per family.
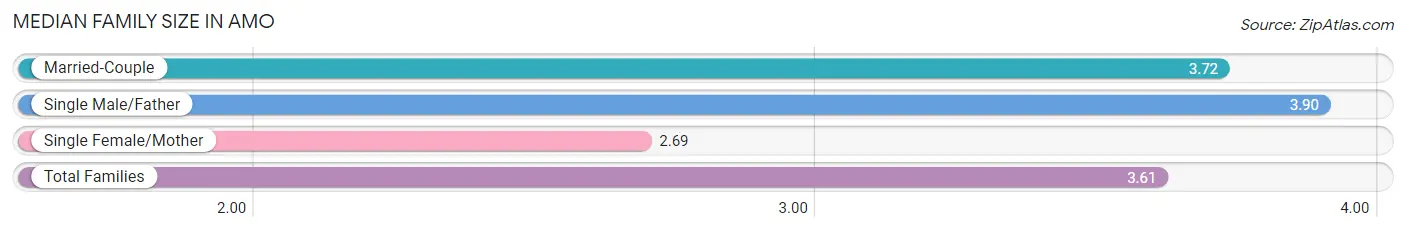
| Family Type | # Families | Family Size |
| Married-Couple | 86 (78.9%) | 3.72 |
| Single Male/Father | 10 (9.2%) | 3.90 |
| Single Female/Mother | 13 (11.9%) | 2.69 |
| Total Families | 109 (100.0%) | 3.61 |
Median Household Size in Amo
The median household size in Amo is 3.22 persons per household, with single male/father households (10 | 7.6%) accounting for the largest median household size of 3.9 persons per household. non-family households (22 | 16.8%) represent the smallest median household size with 1.09 persons per household.
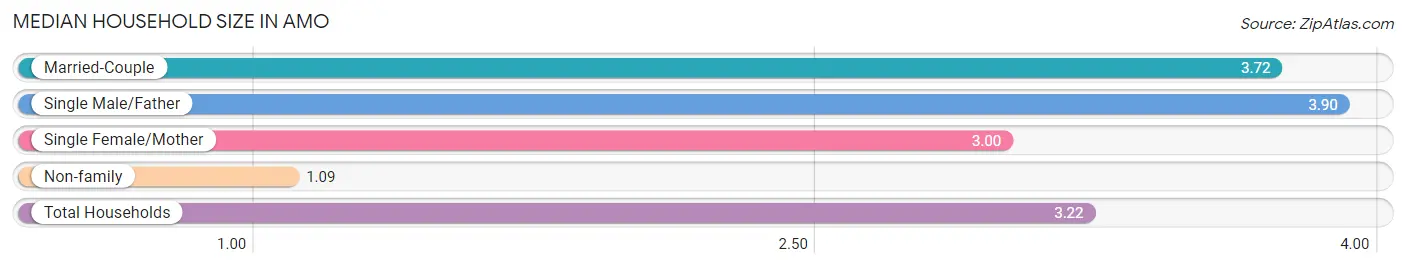
| Household Type | # Households | Household Size |
| Married-Couple | 86 (65.6%) | 3.72 |
| Single Male/Father | 10 (7.6%) | 3.90 |
| Single Female/Mother | 13 (9.9%) | 3.00 |
| Non-family | 22 (16.8%) | 1.09 |
| Total Households | 131 (100.0%) | 3.22 |
Household Size by Marriage Status in Amo
Out of a total of 131 households in Amo, 109 (83.2%) are family households, while 22 (16.8%) are nonfamily households. The most numerous type of family households are 2-person households, comprising 55, and the most common type of nonfamily households are 1-person households, comprising 20.
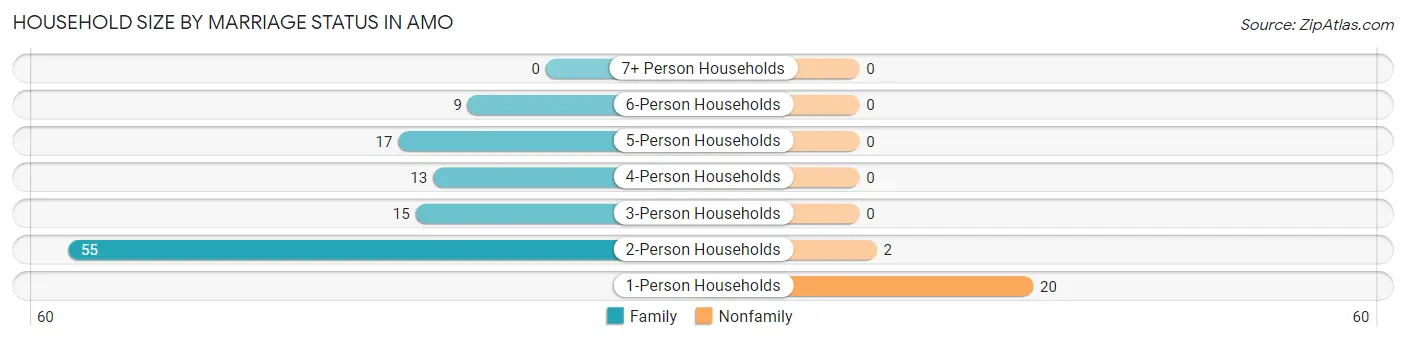
| Household Size | Family Households | Nonfamily Households |
| 1-Person Households | - | 20 (15.3%) |
| 2-Person Households | 55 (42.0%) | 2 (1.5%) |
| 3-Person Households | 15 (11.5%) | 0 (0.0%) |
| 4-Person Households | 13 (9.9%) | 0 (0.0%) |
| 5-Person Households | 17 (13.0%) | 0 (0.0%) |
| 6-Person Households | 9 (6.9%) | 0 (0.0%) |
| 7+ Person Households | 0 (0.0%) | 0 (0.0%) |
| Total | 109 (83.2%) | 22 (16.8%) |
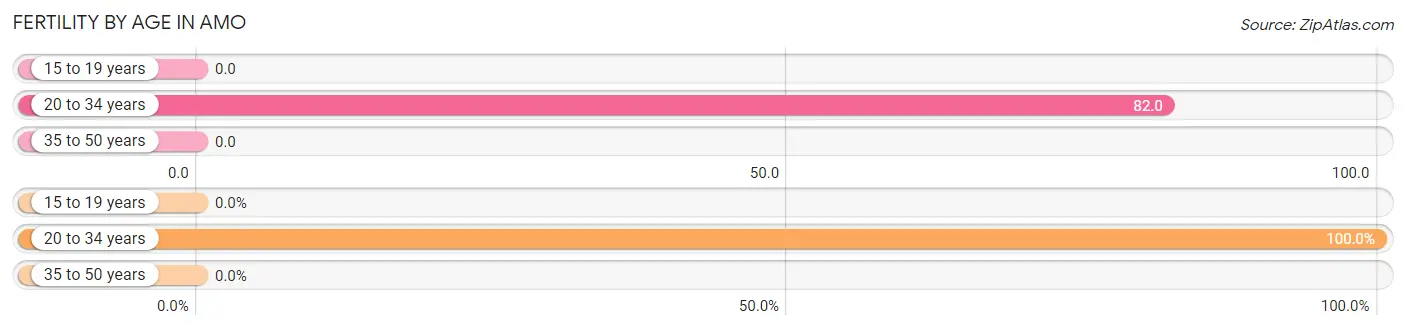
Female Fertility in Amo
Fertility by Age in Amo
Average fertility rate in Amo is 43.0 births per 1,000 women. Women in the age bracket of 20 to 34 years have the highest fertility rate with 82.0 births per 1,000 women. Women in the age bracket of 20 to 34 years acount for 100.0% of all women with births.
| Age Bracket | Women with Births | Births / 1,000 Women |
| 15 to 19 years | 0 (0.0%) | 0.0 |
| 20 to 34 years | 4 (100.0%) | 82.0 |
| 35 to 50 years | 0 (0.0%) | 0.0 |
| Total | 4 (100.0%) | 43.0 |
Fertility by Age by Marriage Status in Amo
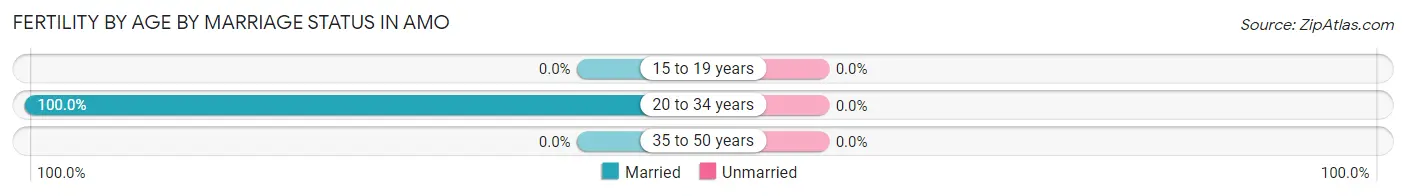
| Age Bracket | Married | Unmarried |
| 15 to 19 years | 0 (0.0%) | 0 (0.0%) |
| 20 to 34 years | 4 (100.0%) | 0 (0.0%) |
| 35 to 50 years | 0 (0.0%) | 0 (0.0%) |
| Total | 4 (100.0%) | 0 (0.0%) |
Fertility by Education in Amo
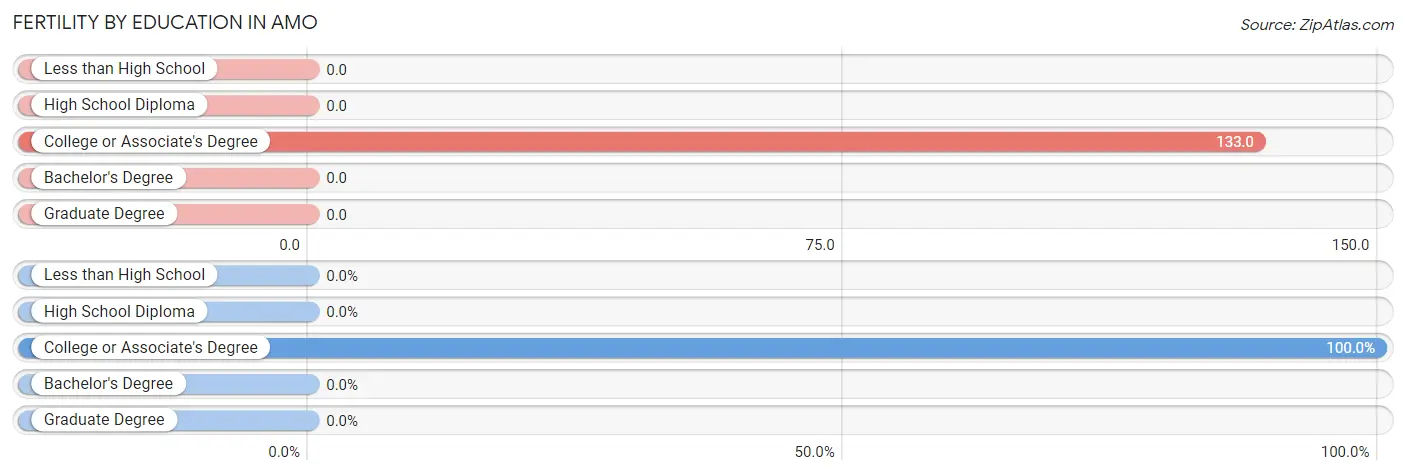
| Educational Attainment | Women with Births | Births / 1,000 Women |
| Less than High School | 0 (0.0%) | 0.0 |
| High School Diploma | 0 (0.0%) | 0.0 |
| College or Associate's Degree | 4 (100.0%) | 133.0 |
| Bachelor's Degree | 0 (0.0%) | 0.0 |
| Graduate Degree | 0 (0.0%) | 0.0 |
| Total | 4 (100.0%) | 43.0 |
Fertility by Education by Marriage Status in Amo
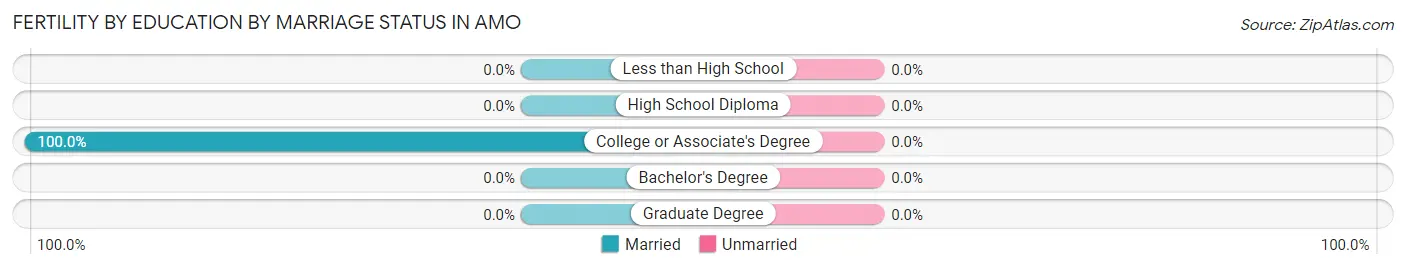
| Educational Attainment | Married | Unmarried |
| Less than High School | 0 (0.0%) | 0 (0.0%) |
| High School Diploma | 0 (0.0%) | 0 (0.0%) |
| College or Associate's Degree | 4 (100.0%) | 0 (0.0%) |
| Bachelor's Degree | 0 (0.0%) | 0 (0.0%) |
| Graduate Degree | 0 (0.0%) | 0 (0.0%) |
| Total | 4 (100.0%) | 0 (0.0%) |
Income in Amo
Income Overview in Amo
Per Capita Income in Amo is $28,283, while median incomes of families and households are $81,563 and $71,932 respectively.
| Characteristic | Number | Measure |
| Per Capita Income | 422 | $28,283 |
| Median Family Income | 109 | $81,563 |
| Mean Family Income | 109 | $91,367 |
| Median Household Income | 131 | $71,932 |
| Mean Household Income | 131 | $85,096 |
| Income Deficit | 109 | $0 |
| Wage / Income Gap (%) | 422 | 13.85% |
| Wage / Income Gap ($) | 422 | 86.15¢ per $1 |
| Gini / Inequality Index | 422 | 0.35 |
Earnings by Sex in Amo
Average Earnings in Amo are $37,639, $39,306 for men and $33,864 for women, a difference of 13.9%.
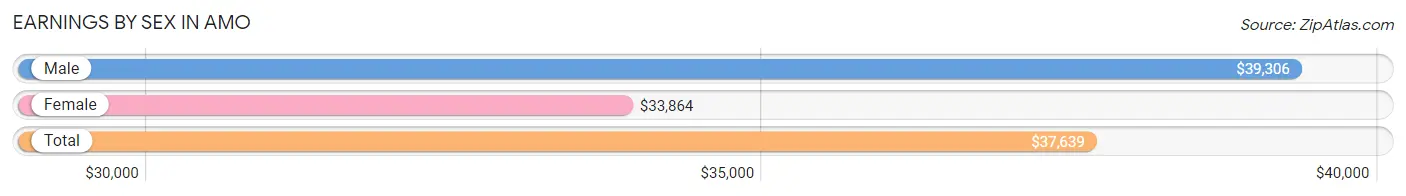
| Sex | Number | Average Earnings |
| Male | 131 (63.3%) | $39,306 |
| Female | 76 (36.7%) | $33,864 |
| Total | 207 (100.0%) | $37,639 |
Earnings by Sex by Income Bracket in Amo
The most common earnings brackets in Amo are $25,000 to $29,999 for men (33 | 25.2%) and $30,000 to $34,999 for women (15 | 19.7%).
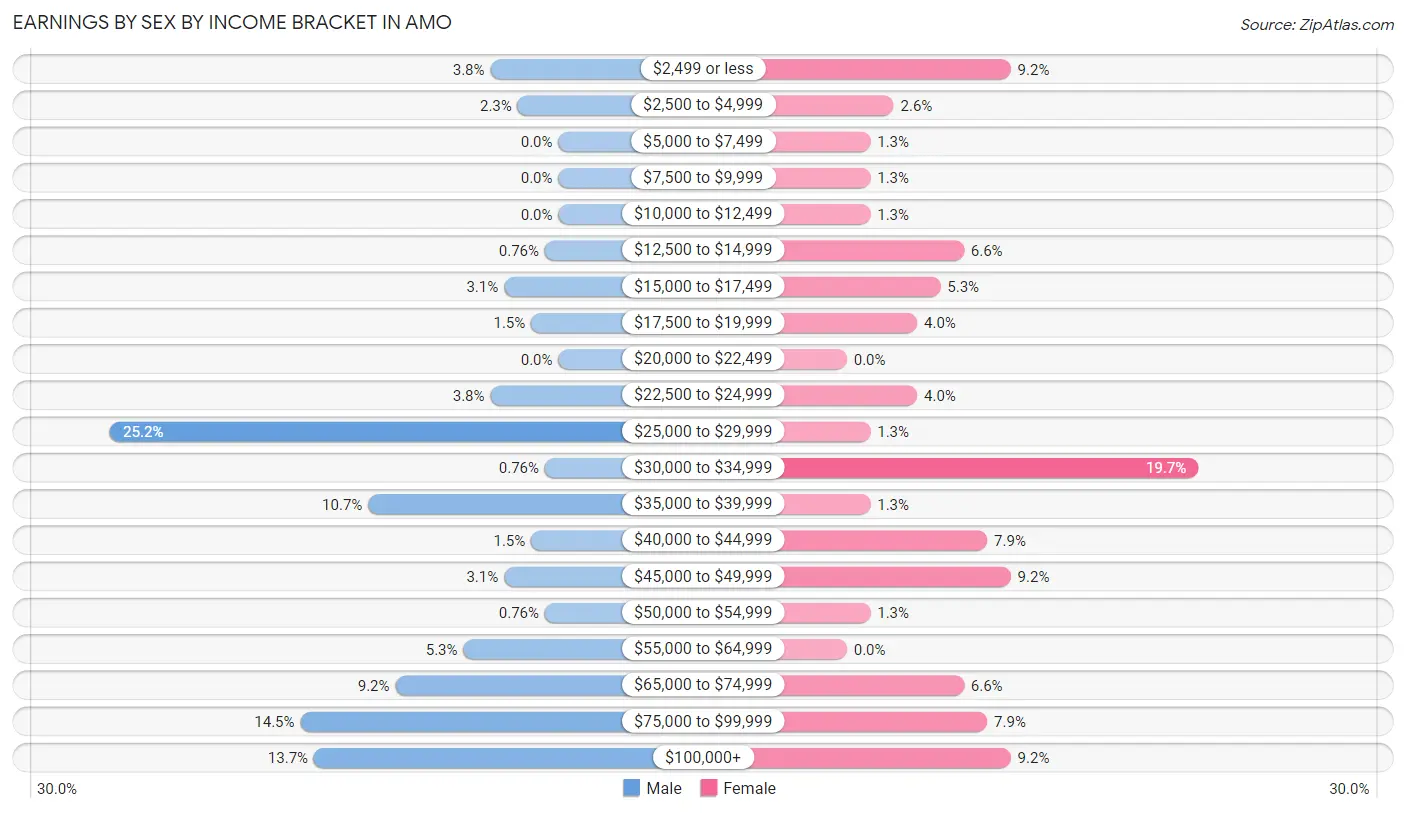
| Income | Male | Female |
| $2,499 or less | 5 (3.8%) | 7 (9.2%) |
| $2,500 to $4,999 | 3 (2.3%) | 2 (2.6%) |
| $5,000 to $7,499 | 0 (0.0%) | 1 (1.3%) |
| $7,500 to $9,999 | 0 (0.0%) | 1 (1.3%) |
| $10,000 to $12,499 | 0 (0.0%) | 1 (1.3%) |
| $12,500 to $14,999 | 1 (0.8%) | 5 (6.6%) |
| $15,000 to $17,499 | 4 (3.0%) | 4 (5.3%) |
| $17,500 to $19,999 | 2 (1.5%) | 3 (4.0%) |
| $20,000 to $22,499 | 0 (0.0%) | 0 (0.0%) |
| $22,500 to $24,999 | 5 (3.8%) | 3 (4.0%) |
| $25,000 to $29,999 | 33 (25.2%) | 1 (1.3%) |
| $30,000 to $34,999 | 1 (0.8%) | 15 (19.7%) |
| $35,000 to $39,999 | 14 (10.7%) | 1 (1.3%) |
| $40,000 to $44,999 | 2 (1.5%) | 6 (7.9%) |
| $45,000 to $49,999 | 4 (3.0%) | 7 (9.2%) |
| $50,000 to $54,999 | 1 (0.8%) | 1 (1.3%) |
| $55,000 to $64,999 | 7 (5.3%) | 0 (0.0%) |
| $65,000 to $74,999 | 12 (9.2%) | 5 (6.6%) |
| $75,000 to $99,999 | 19 (14.5%) | 6 (7.9%) |
| $100,000+ | 18 (13.7%) | 7 (9.2%) |
| Total | 131 (100.0%) | 76 (100.0%) |
Earnings by Sex by Educational Attainment in Amo
Average earnings in Amo are $47,500 for men and $33,750 for women, a difference of 28.9%. Men with an educational attainment of high school diploma enjoy the highest average annual earnings of $55,417, while those with high school diploma education earn the least with $55,417. Women with an educational attainment of bachelor's degree earn the most with the average annual earnings of $91,250, while those with high school diploma education have the smallest earnings of $24,167.
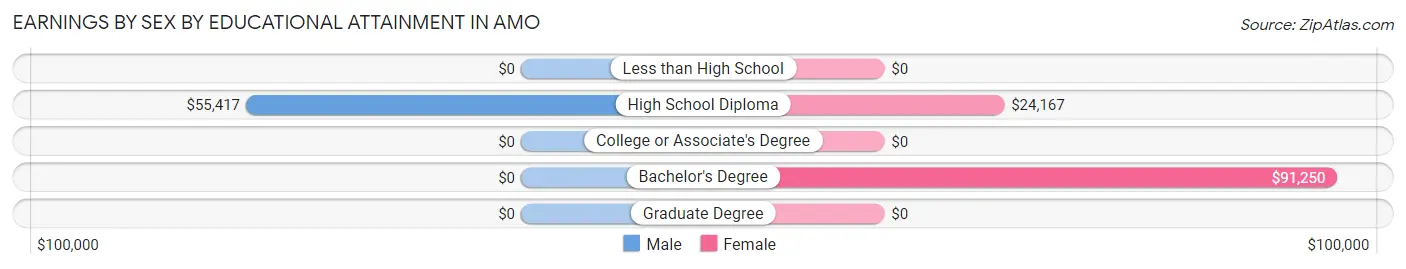
| Educational Attainment | Male Income | Female Income |
| Less than High School | - | - |
| High School Diploma | $55,417 | $24,167 |
| College or Associate's Degree | - | - |
| Bachelor's Degree | - | - |
| Graduate Degree | - | - |
| Total | $47,500 | $33,750 |
Family Income in Amo
Family Income Brackets in Amo
According to the Amo family income data, there are 34 families falling into the $100,000 to $149,999 income range, which is the most common income bracket and makes up 31.2% of all families. Conversely, the $10,000 to $14,999 income bracket is the least frequent group with only 1 families (0.9%) belonging to this category.
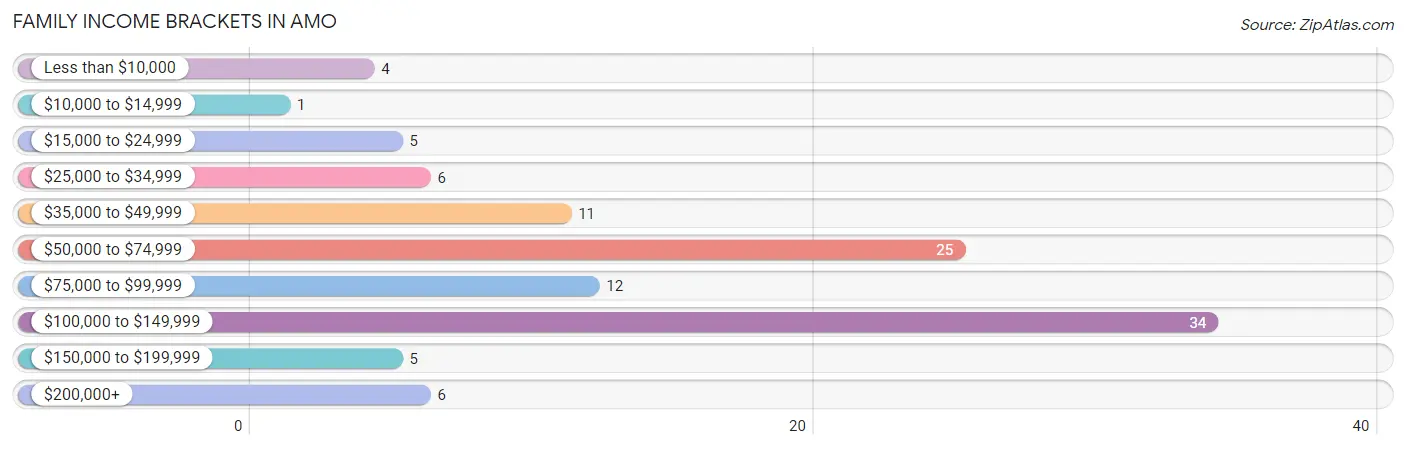
| Income Bracket | # Families | % Families |
| Less than $10,000 | 4 | 3.7% |
| $10,000 to $14,999 | 1 | 0.9% |
| $15,000 to $24,999 | 5 | 4.6% |
| $25,000 to $34,999 | 6 | 5.5% |
| $35,000 to $49,999 | 11 | 10.1% |
| $50,000 to $74,999 | 25 | 22.9% |
| $75,000 to $99,999 | 12 | 11.0% |
| $100,000 to $149,999 | 34 | 31.2% |
| $150,000 to $199,999 | 5 | 4.6% |
| $200,000+ | 6 | 5.5% |
Family Income by Famaliy Size in Amo
2-person families (55 | 50.5%) account for the highest median family income in Amo with $87,750 per family, while 2-person families (55 | 50.5%) have the highest median income of $43,875 per family member.
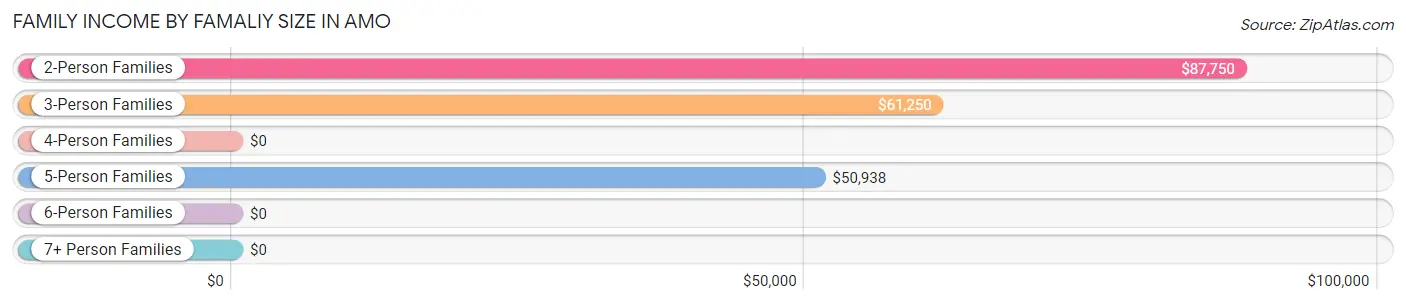
| Income Bracket | # Families | Median Income |
| 2-Person Families | 55 (50.5%) | $87,750 |
| 3-Person Families | 16 (14.7%) | $61,250 |
| 4-Person Families | 13 (11.9%) | $0 |
| 5-Person Families | 17 (15.6%) | $50,938 |
| 6-Person Families | 8 (7.3%) | $0 |
| 7+ Person Families | 0 (0.0%) | $0 |
| Total | 109 (100.0%) | $81,563 |
Family Income by Number of Earners in Amo
The median family income in Amo is $81,563, with families comprising 3+ earners (8) having the highest median family income of $250,001, while families with 1 earner (43) have the lowest median family income of $44,583, accounting for 7.3% and 39.5% of families, respectively.
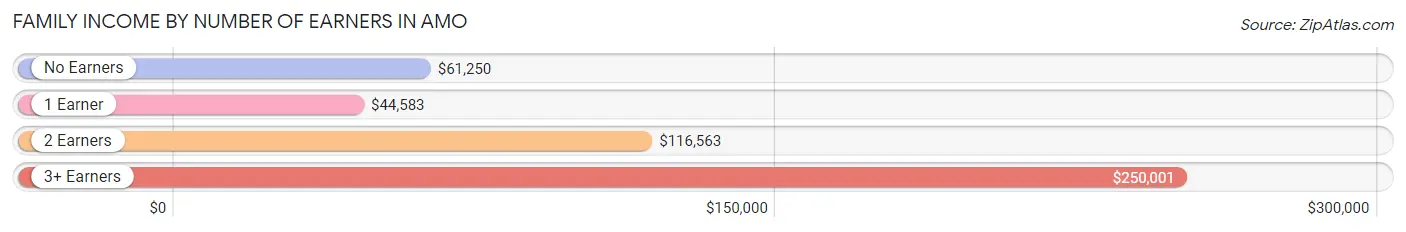
| Number of Earners | # Families | Median Income |
| No Earners | 13 (11.9%) | $61,250 |
| 1 Earner | 43 (39.5%) | $44,583 |
| 2 Earners | 45 (41.3%) | $116,563 |
| 3+ Earners | 8 (7.3%) | $250,001 |
| Total | 109 (100.0%) | $81,563 |
Household Income in Amo
Household Income Brackets in Amo
With 34 households falling in the category, the $100,000 to $149,999 income range is the most frequent in Amo, accounting for 26.0% of all households. In contrast, only 2 households (1.5%) fall into the $10,000 to $14,999 income bracket, making it the least populous group.
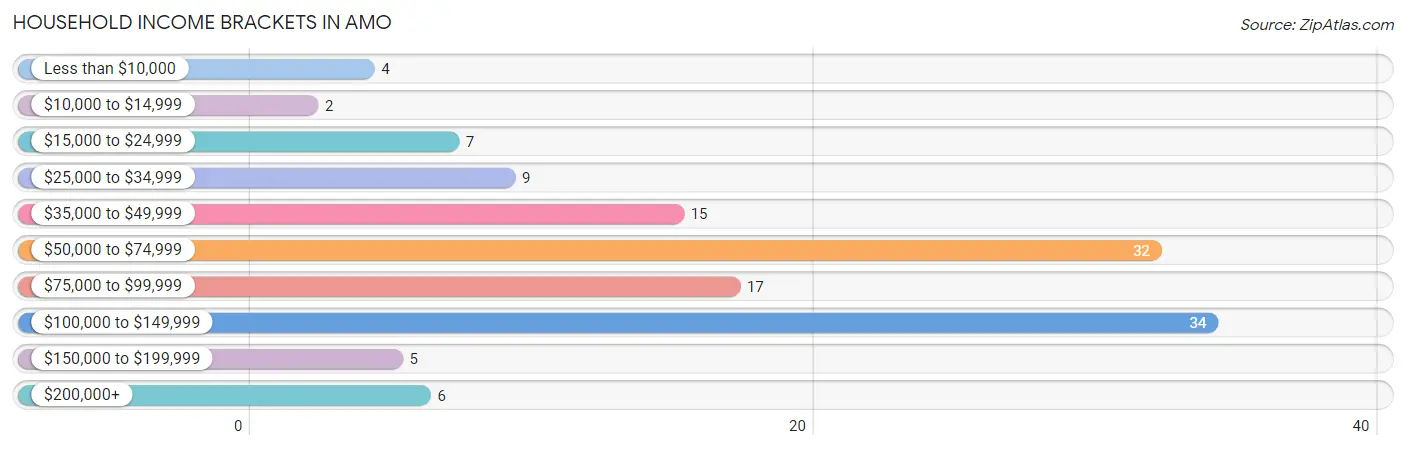
| Income Bracket | # Households | % Households |
| Less than $10,000 | 4 | 3.1% |
| $10,000 to $14,999 | 2 | 1.5% |
| $15,000 to $24,999 | 7 | 5.3% |
| $25,000 to $34,999 | 9 | 6.9% |
| $35,000 to $49,999 | 15 | 11.5% |
| $50,000 to $74,999 | 32 | 24.4% |
| $75,000 to $99,999 | 17 | 13.0% |
| $100,000 to $149,999 | 34 | 26.0% |
| $150,000 to $199,999 | 5 | 3.8% |
| $200,000+ | 6 | 4.6% |
Household Income by Householder Age in Amo
The median household income in Amo is $71,932, with the highest median household income of $88,000 found in the 45 to 64 years age bracket for the primary householder. A total of 38 households (29.0%) fall into this category.
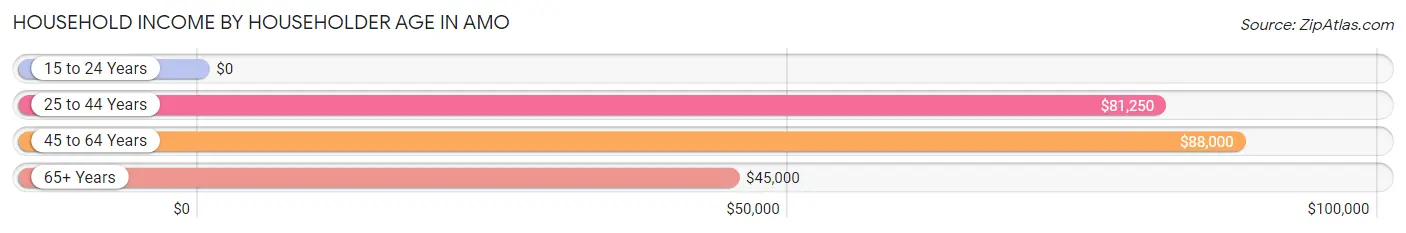
| Income Bracket | # Households | Median Income |
| 15 to 24 Years | 0 (0.0%) | $0 |
| 25 to 44 Years | 59 (45.0%) | $81,250 |
| 45 to 64 Years | 38 (29.0%) | $88,000 |
| 65+ Years | 34 (26.0%) | $45,000 |
| Total | 131 (100.0%) | $71,932 |
Poverty in Amo
Income Below Poverty by Sex and Age in Amo
With 10.5% poverty level for males and 12.8% for females among the residents of Amo, 15 year old males and 12 to 14 year old females are the most vulnerable to poverty, with 9 males (100.0%) and 11 females (44.0%) in their respective age groups living below the poverty level.
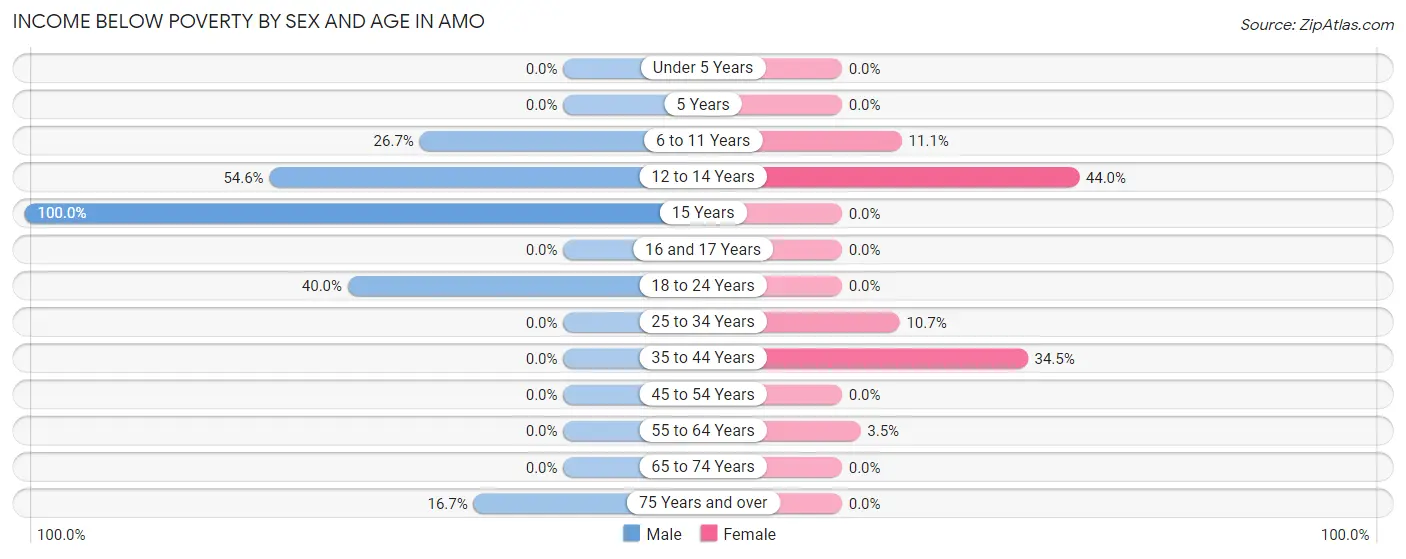
| Age Bracket | Male | Female |
| Under 5 Years | 0 (0.0%) | 0 (0.0%) |
| 5 Years | 0 (0.0%) | 0 (0.0%) |
| 6 to 11 Years | 4 (26.7%) | 1 (11.1%) |
| 12 to 14 Years | 6 (54.5%) | 11 (44.0%) |
| 15 Years | 9 (100.0%) | 0 (0.0%) |
| 16 and 17 Years | 0 (0.0%) | 0 (0.0%) |
| 18 to 24 Years | 2 (40.0%) | 0 (0.0%) |
| 25 to 34 Years | 0 (0.0%) | 3 (10.7%) |
| 35 to 44 Years | 0 (0.0%) | 10 (34.5%) |
| 45 to 54 Years | 0 (0.0%) | 0 (0.0%) |
| 55 to 64 Years | 0 (0.0%) | 1 (3.5%) |
| 65 to 74 Years | 0 (0.0%) | 0 (0.0%) |
| 75 Years and over | 2 (16.7%) | 0 (0.0%) |
| Total | 23 (10.5%) | 26 (12.8%) |
Income Above Poverty by Sex and Age in Amo
According to the poverty statistics in Amo, males aged under 5 years and females aged under 5 years are the age groups that are most secure financially, with 100.0% of males and 100.0% of females in these age groups living above the poverty line.
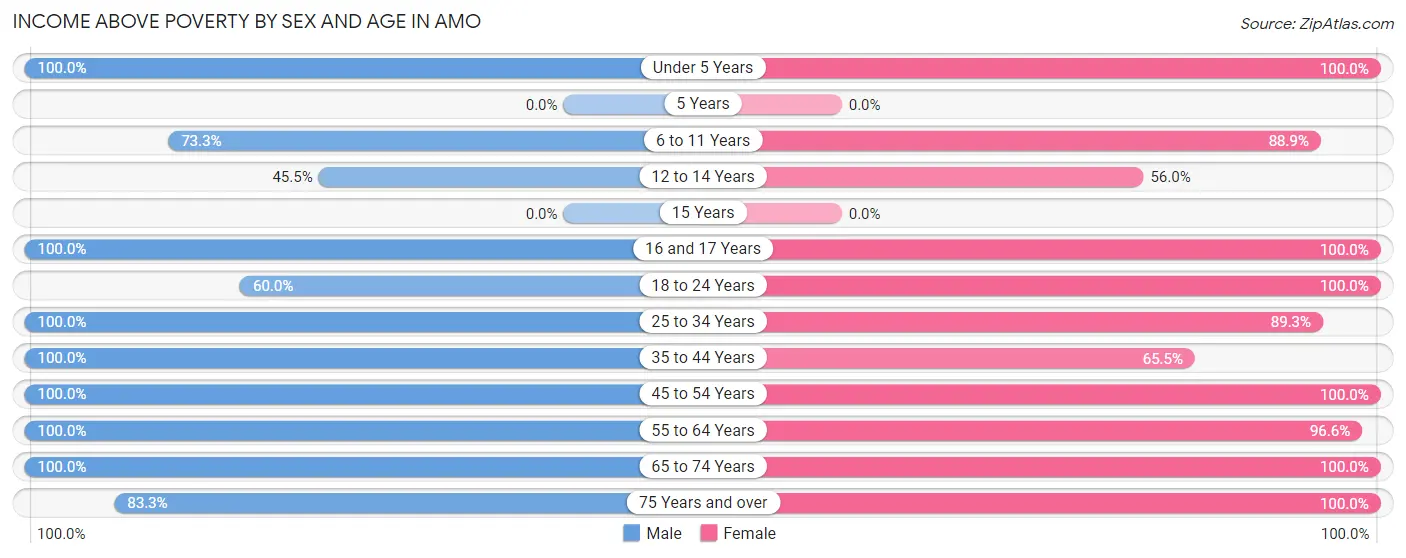
| Age Bracket | Male | Female |
| Under 5 Years | 17 (100.0%) | 14 (100.0%) |
| 5 Years | 0 (0.0%) | 0 (0.0%) |
| 6 to 11 Years | 11 (73.3%) | 8 (88.9%) |
| 12 to 14 Years | 5 (45.5%) | 14 (56.0%) |
| 15 Years | 0 (0.0%) | 0 (0.0%) |
| 16 and 17 Years | 12 (100.0%) | 1 (100.0%) |
| 18 to 24 Years | 3 (60.0%) | 25 (100.0%) |
| 25 to 34 Years | 48 (100.0%) | 25 (89.3%) |
| 35 to 44 Years | 27 (100.0%) | 19 (65.5%) |
| 45 to 54 Years | 16 (100.0%) | 18 (100.0%) |
| 55 to 64 Years | 37 (100.0%) | 28 (96.6%) |
| 65 to 74 Years | 9 (100.0%) | 11 (100.0%) |
| 75 Years and over | 10 (83.3%) | 14 (100.0%) |
| Total | 195 (89.4%) | 177 (87.2%) |
Income Below Poverty Among Married-Couple Families in Amo
The poverty statistics for married-couple families in Amo show that 1.2% or 1 of the total 86 families live below the poverty line. Families with 3 or 4 children have the highest poverty rate of 6.7%, comprising of 1 families. On the other hand, families with no children have the lowest poverty rate of 0.0%, which includes 0 families.
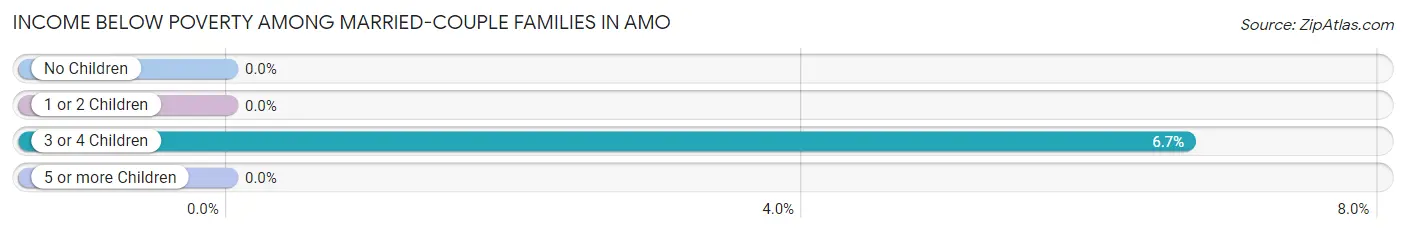
| Children | Above Poverty | Below Poverty |
| No Children | 50 (100.0%) | 0 (0.0%) |
| 1 or 2 Children | 21 (100.0%) | 0 (0.0%) |
| 3 or 4 Children | 14 (93.3%) | 1 (6.7%) |
| 5 or more Children | 0 (0.0%) | 0 (0.0%) |
| Total | 85 (98.8%) | 1 (1.2%) |
Income Below Poverty Among Single-Parent Households in Amo
According to the poverty data in Amo, 20.0% or 2 single-father households and 53.8% or 7 single-mother households are living below the poverty line. Among single-father households, those with 3 or 4 children have the highest poverty rate, with 2 households (100.0%) experiencing poverty. Likewise, among single-mother households, those with 1 or 2 children have the highest poverty rate, with 7 households (87.5%) falling below the poverty line.
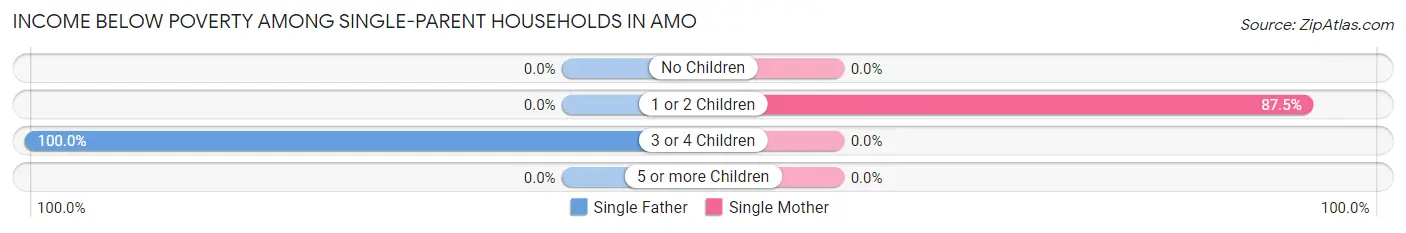
| Children | Single Father | Single Mother |
| No Children | 0 (0.0%) | 0 (0.0%) |
| 1 or 2 Children | 0 (0.0%) | 7 (87.5%) |
| 3 or 4 Children | 2 (100.0%) | 0 (0.0%) |
| 5 or more Children | 0 (0.0%) | 0 (0.0%) |
| Total | 2 (20.0%) | 7 (53.8%) |
Income Below Poverty Among Married-Couple vs Single-Parent Households in Amo
The poverty data for Amo shows that 1 of the married-couple family households (1.2%) and 9 of the single-parent households (39.1%) are living below the poverty level. Within the married-couple family households, those with 3 or 4 children have the highest poverty rate, with 1 households (6.7%) falling below the poverty line. Among the single-parent households, those with 3 or 4 children have the highest poverty rate, with 2 household (66.7%) living below poverty.
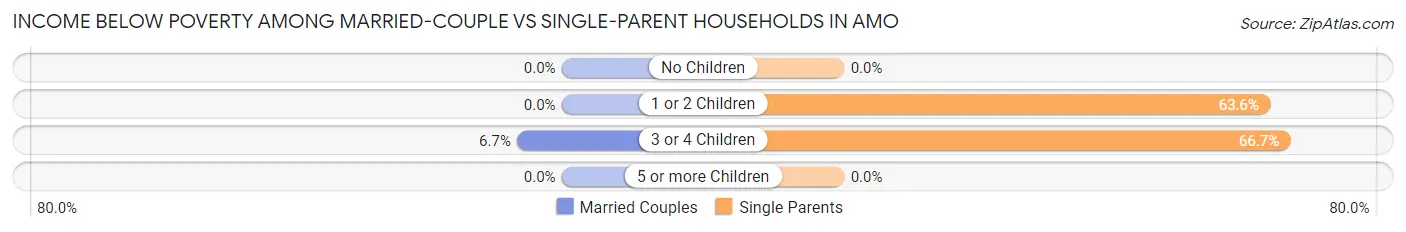
| Children | Married-Couple Families | Single-Parent Households |
| No Children | 0 (0.0%) | 0 (0.0%) |
| 1 or 2 Children | 0 (0.0%) | 7 (63.6%) |
| 3 or 4 Children | 1 (6.7%) | 2 (66.7%) |
| 5 or more Children | 0 (0.0%) | 0 (0.0%) |
| Total | 1 (1.2%) | 9 (39.1%) |
Employment Characteristics in Amo
Employment by Class of Employer in Amo
Among the 192 employed individuals in Amo, private company employees (149 | 77.6%), local government employees (16 | 8.3%), and self-employed (not incorporated) (13 | 6.8%) make up the most common classes of employment.
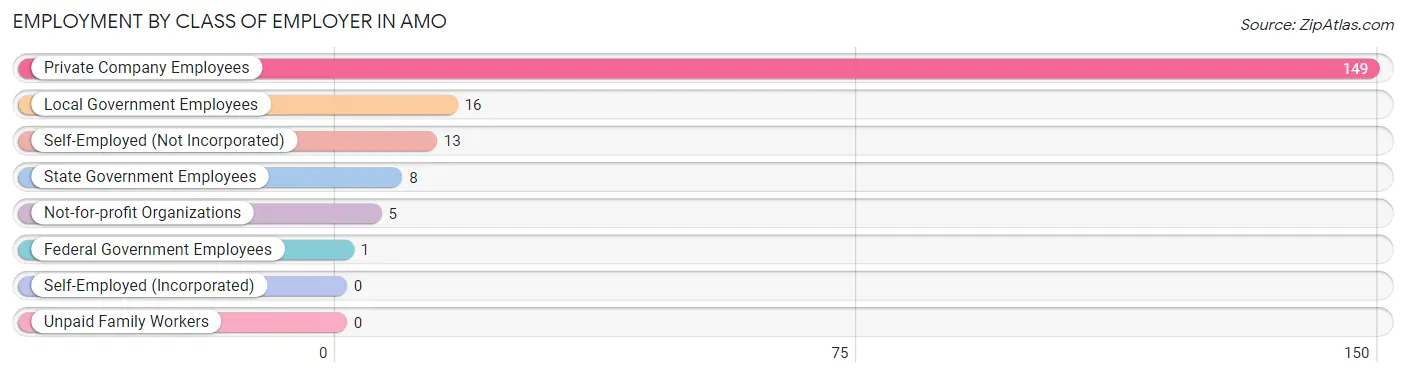
| Employer Class | # Employees | % Employees |
| Private Company Employees | 149 | 77.6% |
| Self-Employed (Incorporated) | 0 | 0.0% |
| Self-Employed (Not Incorporated) | 13 | 6.8% |
| Not-for-profit Organizations | 5 | 2.6% |
| Local Government Employees | 16 | 8.3% |
| State Government Employees | 8 | 4.2% |
| Federal Government Employees | 1 | 0.5% |
| Unpaid Family Workers | 0 | 0.0% |
| Total | 192 | 100.0% |
Employment Status by Age in Amo
According to the labor force statistics for Amo, out of the total population over 16 years of age (321), 61.4% or 197 individuals are in the labor force, with 2.5% or 5 of them unemployed. The age group with the highest labor force participation rate is 45 to 54 years, with 82.4% or 28 individuals in the labor force. Within the labor force, the 16 to 19 years age range has the highest percentage of unemployed individuals, with 15.4% or 2 of them being unemployed.
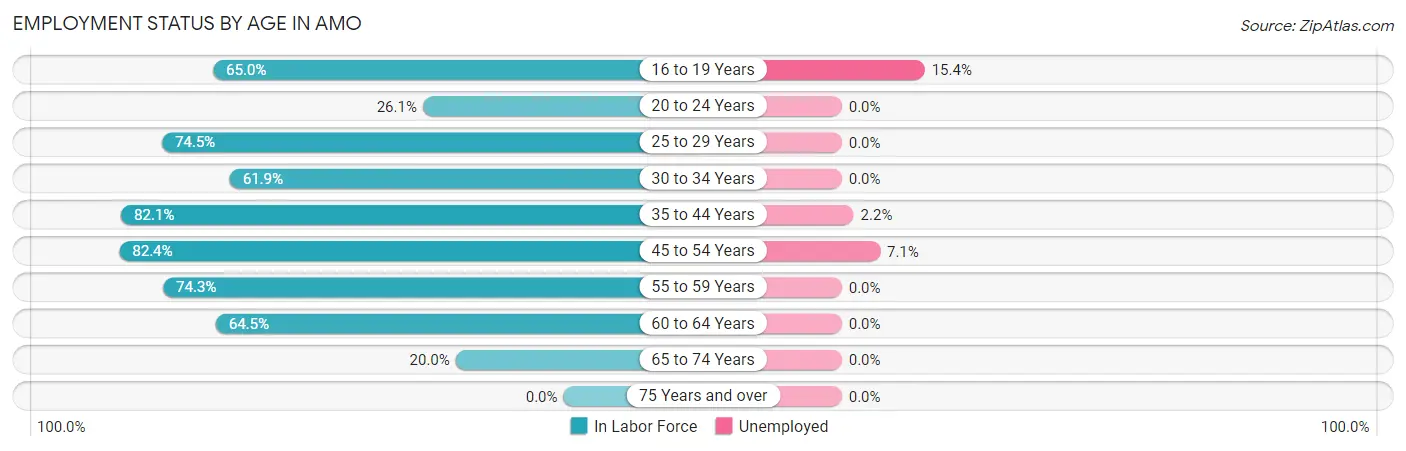
| Age Bracket | In Labor Force | Unemployed |
| 16 to 19 Years | 13 (65.0%) | 2 (15.4%) |
| 20 to 24 Years | 6 (26.1%) | 0 (0.0%) |
| 25 to 29 Years | 41 (74.5%) | 0 (0.0%) |
| 30 to 34 Years | 13 (61.9%) | 0 (0.0%) |
| 35 to 44 Years | 46 (82.1%) | 1 (2.2%) |
| 45 to 54 Years | 28 (82.4%) | 2 (7.1%) |
| 55 to 59 Years | 26 (74.3%) | 0 (0.0%) |
| 60 to 64 Years | 20 (64.5%) | 0 (0.0%) |
| 65 to 74 Years | 4 (20.0%) | 0 (0.0%) |
| 75 Years and over | 0 (0.0%) | 0 (0.0%) |
| Total | 197 (61.4%) | 5 (2.5%) |
Employment Status by Educational Attainment in Amo
According to labor force statistics for Amo, 75.0% of individuals (174) out of the total population between 25 and 64 years of age (232) are in the labor force, with 1.7% or 3 of them being unemployed. The group with the highest labor force participation rate are those with the educational attainment of bachelor's degree or higher, with 85.3% or 29 individuals in the labor force. Within the labor force, individuals with college / associate degree education have the highest percentage of unemployment, with 7.0% or 3 of them being unemployed.
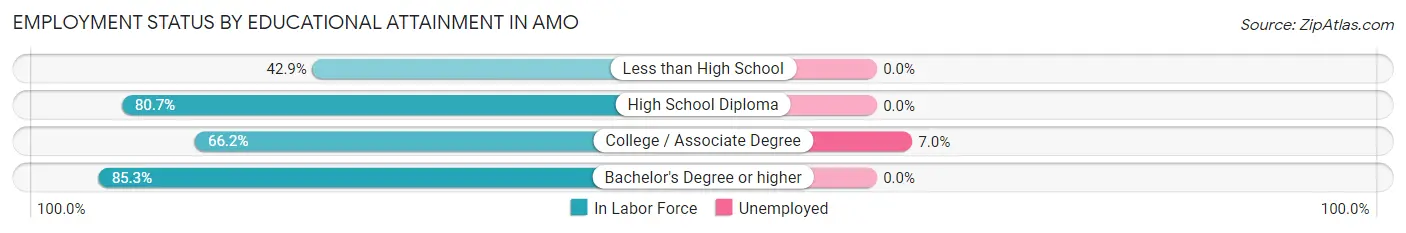
| Educational Attainment | In Labor Force | Unemployed |
| Less than High School | 6 (42.9%) | 0 (0.0%) |
| High School Diploma | 96 (80.7%) | 0 (0.0%) |
| College / Associate Degree | 43 (66.2%) | 5 (7.0%) |
| Bachelor's Degree or higher | 29 (85.3%) | 0 (0.0%) |
| Total | 174 (75.0%) | 4 (1.7%) |
Employment Occupations by Sex in Amo
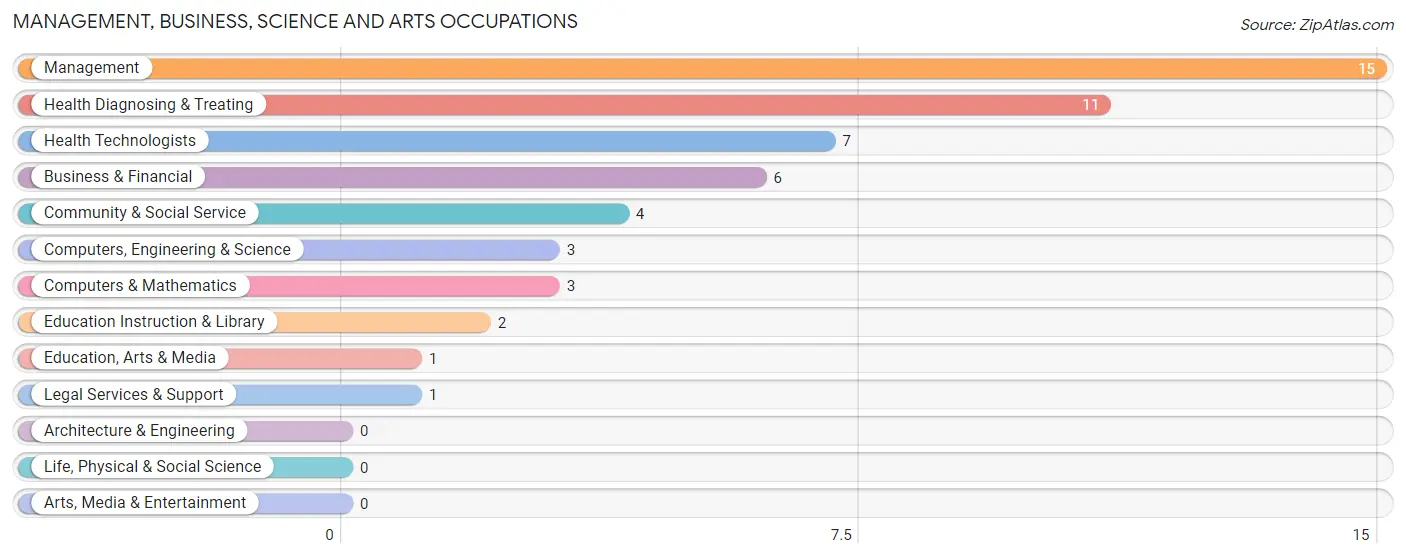
Management, Business, Science and Arts Occupations
The most common Management, Business, Science and Arts occupations in Amo are Management (15 | 7.8%), Health Diagnosing & Treating (11 | 5.7%), Health Technologists (7 | 3.6%), Business & Financial (6 | 3.1%), and Community & Social Service (4 | 2.1%).
Management, Business, Science and Arts Occupations by Sex
Within the Management, Business, Science and Arts occupations in Amo, the most male-oriented occupations are Computers, Engineering & Science (100.0%), Computers & Mathematics (100.0%), and Management (66.7%), while the most female-oriented occupations are Business & Financial (100.0%), Community & Social Service (100.0%), and Education, Arts & Media (100.0%).
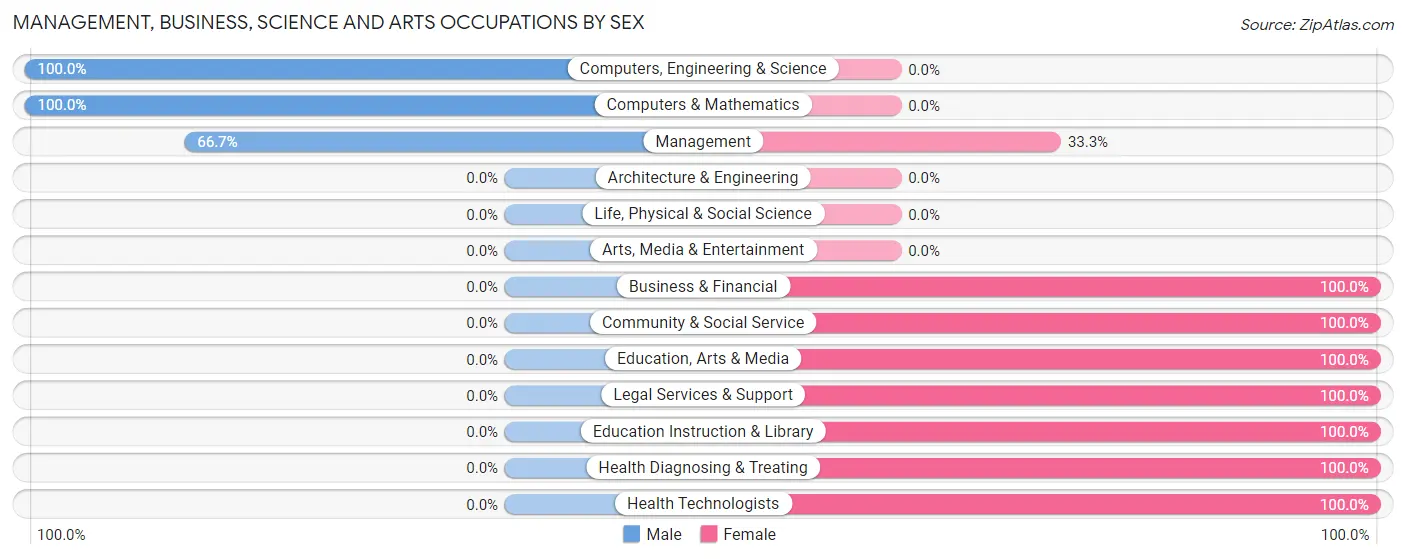
| Occupation | Male | Female |
| Management | 10 (66.7%) | 5 (33.3%) |
| Business & Financial | 0 (0.0%) | 6 (100.0%) |
| Computers, Engineering & Science | 3 (100.0%) | 0 (0.0%) |
| Computers & Mathematics | 3 (100.0%) | 0 (0.0%) |
| Architecture & Engineering | 0 (0.0%) | 0 (0.0%) |
| Life, Physical & Social Science | 0 (0.0%) | 0 (0.0%) |
| Community & Social Service | 0 (0.0%) | 4 (100.0%) |
| Education, Arts & Media | 0 (0.0%) | 1 (100.0%) |
| Legal Services & Support | 0 (0.0%) | 1 (100.0%) |
| Education Instruction & Library | 0 (0.0%) | 2 (100.0%) |
| Arts, Media & Entertainment | 0 (0.0%) | 0 (0.0%) |
| Health Diagnosing & Treating | 0 (0.0%) | 11 (100.0%) |
| Health Technologists | 0 (0.0%) | 7 (100.0%) |
| Total (Category) | 13 (33.3%) | 26 (66.7%) |
| Total (Overall) | 126 (65.6%) | 66 (34.4%) |
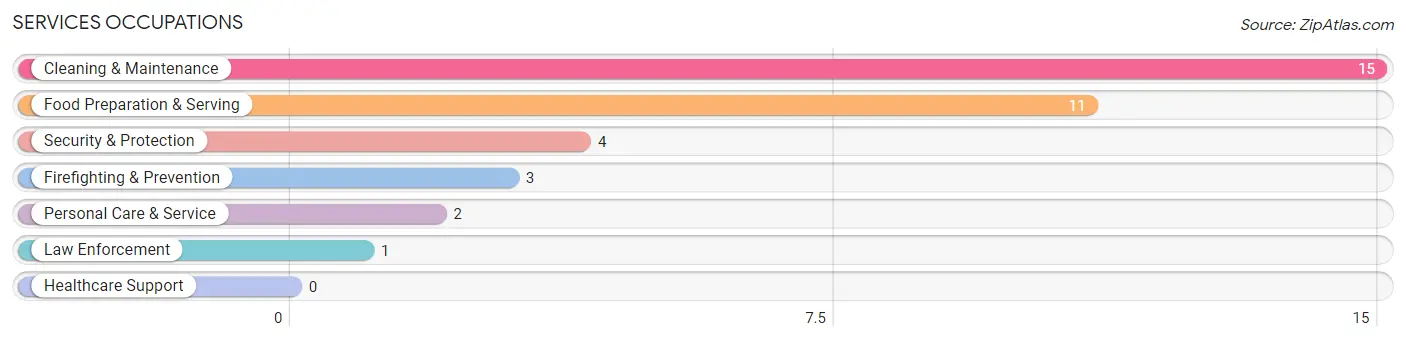
Services Occupations
The most common Services occupations in Amo are Cleaning & Maintenance (15 | 7.8%), Food Preparation & Serving (11 | 5.7%), Security & Protection (4 | 2.1%), Firefighting & Prevention (3 | 1.6%), and Personal Care & Service (2 | 1.0%).
Services Occupations by Sex
Within the Services occupations in Amo, the most male-oriented occupations are Security & Protection (100.0%), Firefighting & Prevention (100.0%), and Law Enforcement (100.0%), while the most female-oriented occupations are Food Preparation & Serving (63.6%), Personal Care & Service (50.0%), and Cleaning & Maintenance (20.0%).
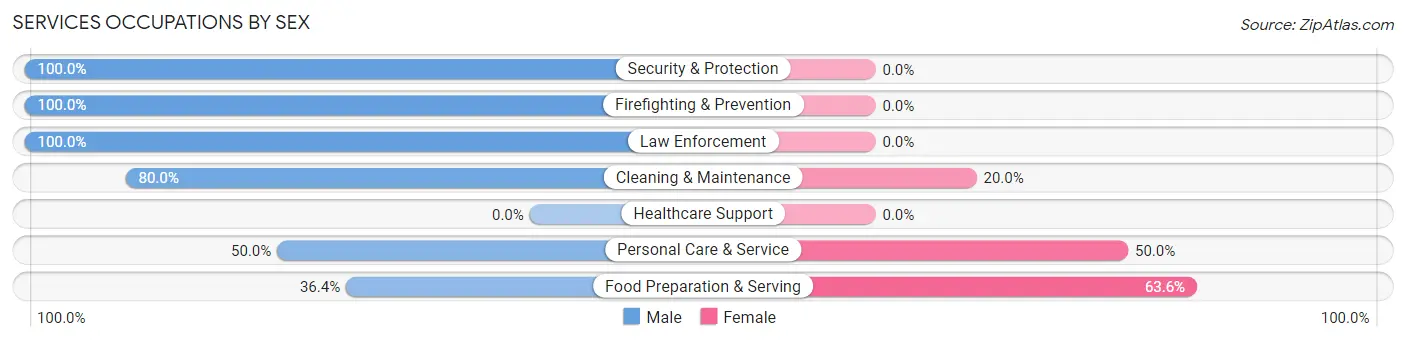
| Occupation | Male | Female |
| Healthcare Support | 0 (0.0%) | 0 (0.0%) |
| Security & Protection | 4 (100.0%) | 0 (0.0%) |
| Firefighting & Prevention | 3 (100.0%) | 0 (0.0%) |
| Law Enforcement | 1 (100.0%) | 0 (0.0%) |
| Food Preparation & Serving | 4 (36.4%) | 7 (63.6%) |
| Cleaning & Maintenance | 12 (80.0%) | 3 (20.0%) |
| Personal Care & Service | 1 (50.0%) | 1 (50.0%) |
| Total (Category) | 21 (65.6%) | 11 (34.4%) |
| Total (Overall) | 126 (65.6%) | 66 (34.4%) |
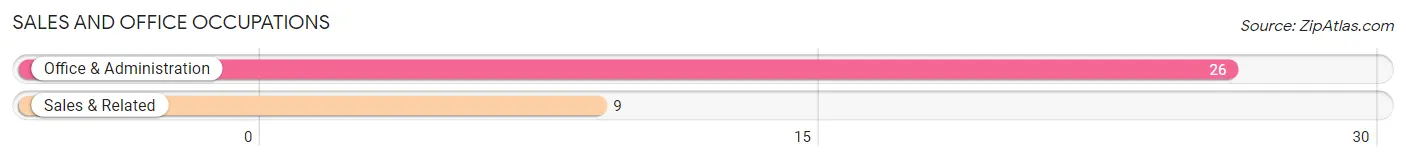
Sales and Office Occupations
The most common Sales and Office occupations in Amo are Office & Administration (26 | 13.5%), and Sales & Related (9 | 4.7%).
Sales and Office Occupations by Sex
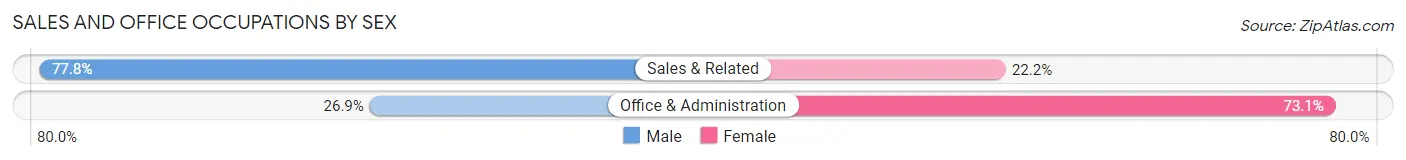
| Occupation | Male | Female |
| Sales & Related | 7 (77.8%) | 2 (22.2%) |
| Office & Administration | 7 (26.9%) | 19 (73.1%) |
| Total (Category) | 14 (40.0%) | 21 (60.0%) |
| Total (Overall) | 126 (65.6%) | 66 (34.4%) |
Natural Resources, Construction and Maintenance Occupations
The most common Natural Resources, Construction and Maintenance occupations in Amo are Installation, Maintenance & Repair (27 | 14.1%), and Construction & Extraction (8 | 4.2%).
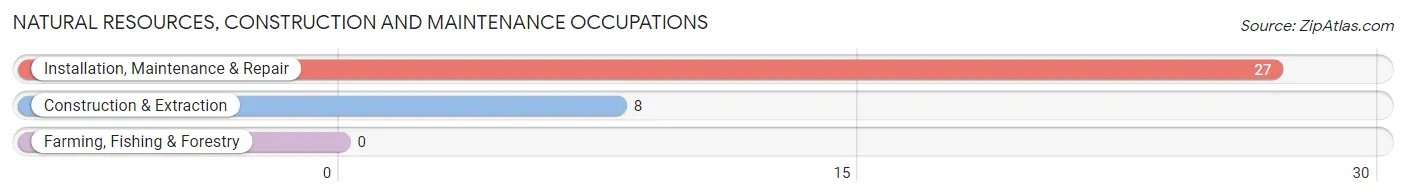
Natural Resources, Construction and Maintenance Occupations by Sex

| Occupation | Male | Female |
| Farming, Fishing & Forestry | 0 (0.0%) | 0 (0.0%) |
| Construction & Extraction | 8 (100.0%) | 0 (0.0%) |
| Installation, Maintenance & Repair | 27 (100.0%) | 0 (0.0%) |
| Total (Category) | 35 (100.0%) | 0 (0.0%) |
| Total (Overall) | 126 (65.6%) | 66 (34.4%) |
Production, Transportation and Moving Occupations
The most common Production, Transportation and Moving occupations in Amo are Production (35 | 18.2%), Material Moving (9 | 4.7%), and Transportation (7 | 3.6%).
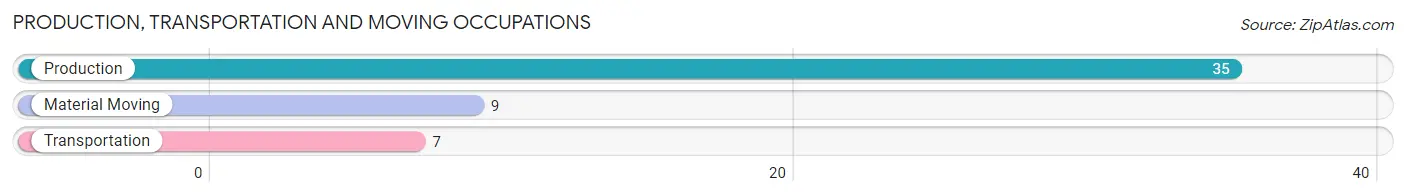
Production, Transportation and Moving Occupations by Sex
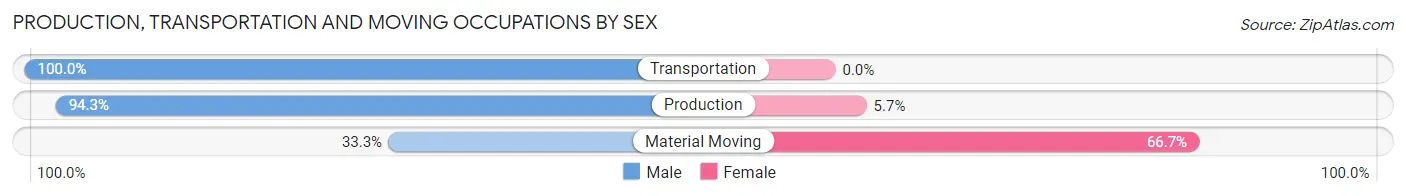
| Occupation | Male | Female |
| Production | 33 (94.3%) | 2 (5.7%) |
| Transportation | 7 (100.0%) | 0 (0.0%) |
| Material Moving | 3 (33.3%) | 6 (66.7%) |
| Total (Category) | 43 (84.3%) | 8 (15.7%) |
| Total (Overall) | 126 (65.6%) | 66 (34.4%) |
Employment Industries by Sex in Amo
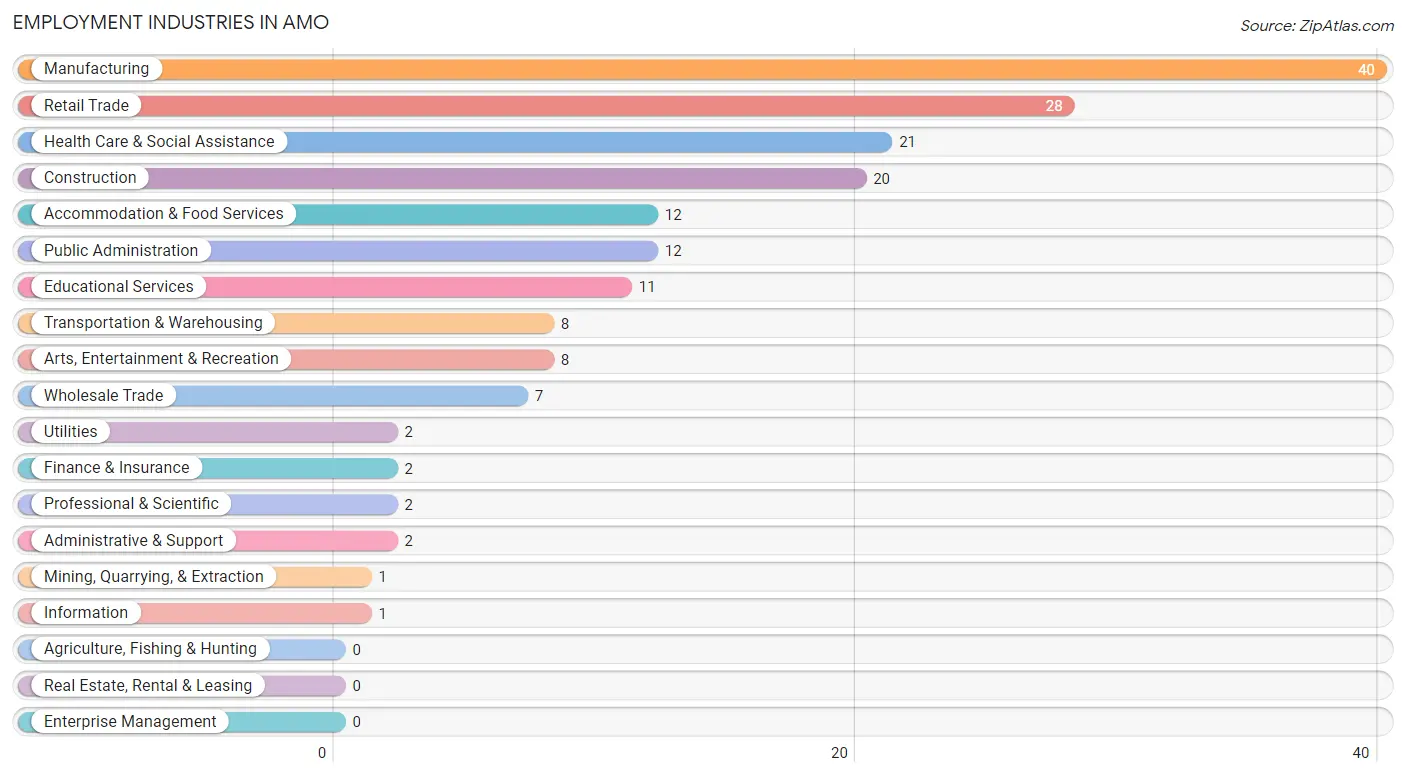
Employment Industries in Amo
The major employment industries in Amo include Manufacturing (40 | 20.8%), Retail Trade (28 | 14.6%), Health Care & Social Assistance (21 | 10.9%), Construction (20 | 10.4%), and Accommodation & Food Services (12 | 6.2%).
Employment Industries by Sex in Amo
The Amo industries that see more men than women are Mining, Quarrying, & Extraction (100.0%), Utilities (100.0%), and Information (100.0%), whereas the industries that tend to have a higher number of women are Professional & Scientific (100.0%), Health Care & Social Assistance (100.0%), and Public Administration (83.3%).
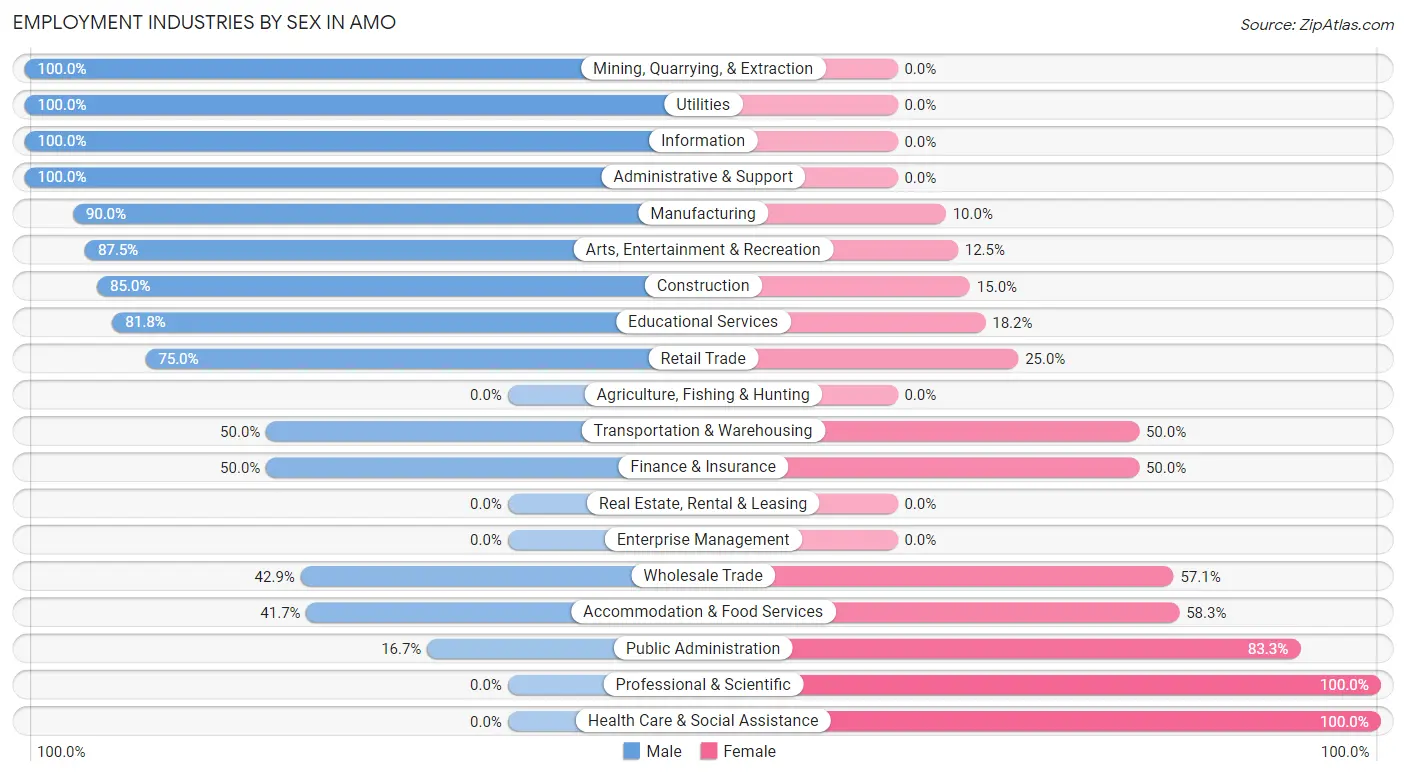
| Industry | Male | Female |
| Agriculture, Fishing & Hunting | 0 (0.0%) | 0 (0.0%) |
| Mining, Quarrying, & Extraction | 1 (100.0%) | 0 (0.0%) |
| Construction | 17 (85.0%) | 3 (15.0%) |
| Manufacturing | 36 (90.0%) | 4 (10.0%) |
| Wholesale Trade | 3 (42.9%) | 4 (57.1%) |
| Retail Trade | 21 (75.0%) | 7 (25.0%) |
| Transportation & Warehousing | 4 (50.0%) | 4 (50.0%) |
| Utilities | 2 (100.0%) | 0 (0.0%) |
| Information | 1 (100.0%) | 0 (0.0%) |
| Finance & Insurance | 1 (50.0%) | 1 (50.0%) |
| Real Estate, Rental & Leasing | 0 (0.0%) | 0 (0.0%) |
| Professional & Scientific | 0 (0.0%) | 2 (100.0%) |
| Enterprise Management | 0 (0.0%) | 0 (0.0%) |
| Administrative & Support | 2 (100.0%) | 0 (0.0%) |
| Educational Services | 9 (81.8%) | 2 (18.2%) |
| Health Care & Social Assistance | 0 (0.0%) | 21 (100.0%) |
| Arts, Entertainment & Recreation | 7 (87.5%) | 1 (12.5%) |
| Accommodation & Food Services | 5 (41.7%) | 7 (58.3%) |
| Public Administration | 2 (16.7%) | 10 (83.3%) |
| Total | 126 (65.6%) | 66 (34.4%) |
Education in Amo
School Enrollment in Amo
The most common levels of schooling among the 106 students in Amo are middle school (45 | 42.4%), high school (34 | 32.1%), and nursery / preschool (12 | 11.3%).
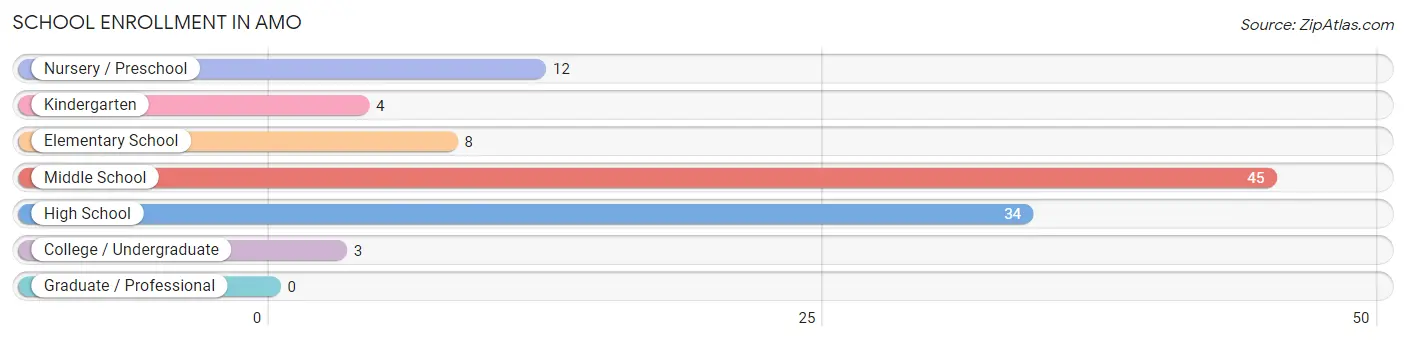
| School Level | # Students | % Students |
| Nursery / Preschool | 12 | 11.3% |
| Kindergarten | 4 | 3.8% |
| Elementary School | 8 | 7.5% |
| Middle School | 45 | 42.4% |
| High School | 34 | 32.1% |
| College / Undergraduate | 3 | 2.8% |
| Graduate / Professional | 0 | 0.0% |
| Total | 106 | 100.0% |
School Enrollment by Age by Funding Source in Amo
Out of a total of 106 students who are enrolled in schools in Amo, 7 (6.6%) attend a private institution, while the remaining 99 (93.4%) are enrolled in public schools. The age group of 35 years and over has the highest likelihood of being enrolled in private schools, with 1 (50.0% in the age bracket) enrolled. Conversely, the age group of 3 to 4 year olds has the lowest likelihood of being enrolled in a private school, with 12 (100.0% in the age bracket) attending a public institution.
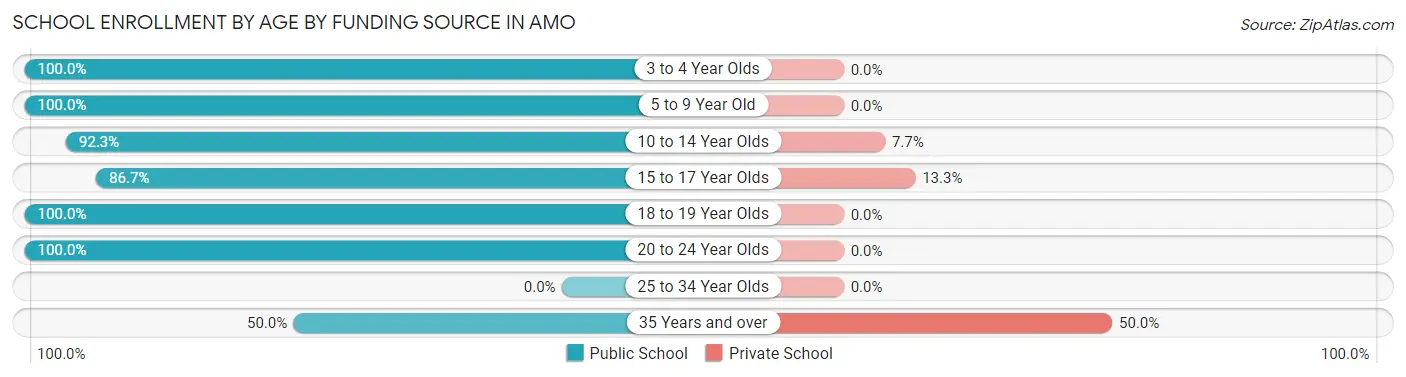
| Age Bracket | Public School | Private School |
| 3 to 4 Year Olds | 12 (100.0%) | 0 (0.0%) |
| 5 to 9 Year Old | 9 (100.0%) | 0 (0.0%) |
| 10 to 14 Year Olds | 48 (92.3%) | 4 (7.7%) |
| 15 to 17 Year Olds | 13 (86.7%) | 2 (13.3%) |
| 18 to 19 Year Olds | 1 (100.0%) | 0 (0.0%) |
| 20 to 24 Year Olds | 15 (100.0%) | 0 (0.0%) |
| 25 to 34 Year Olds | 0 (0.0%) | 0 (0.0%) |
| 35 Years and over | 1 (50.0%) | 1 (50.0%) |
| Total | 99 (93.4%) | 7 (6.6%) |
Educational Attainment by Field of Study in Amo
Business (18 | 43.9%), science & technology (12 | 29.3%), education (6 | 14.6%), liberal arts & history (3 | 7.3%), and literature & languages (1 | 2.4%) are the most common fields of study among 41 individuals in Amo who have obtained a bachelor's degree or higher.
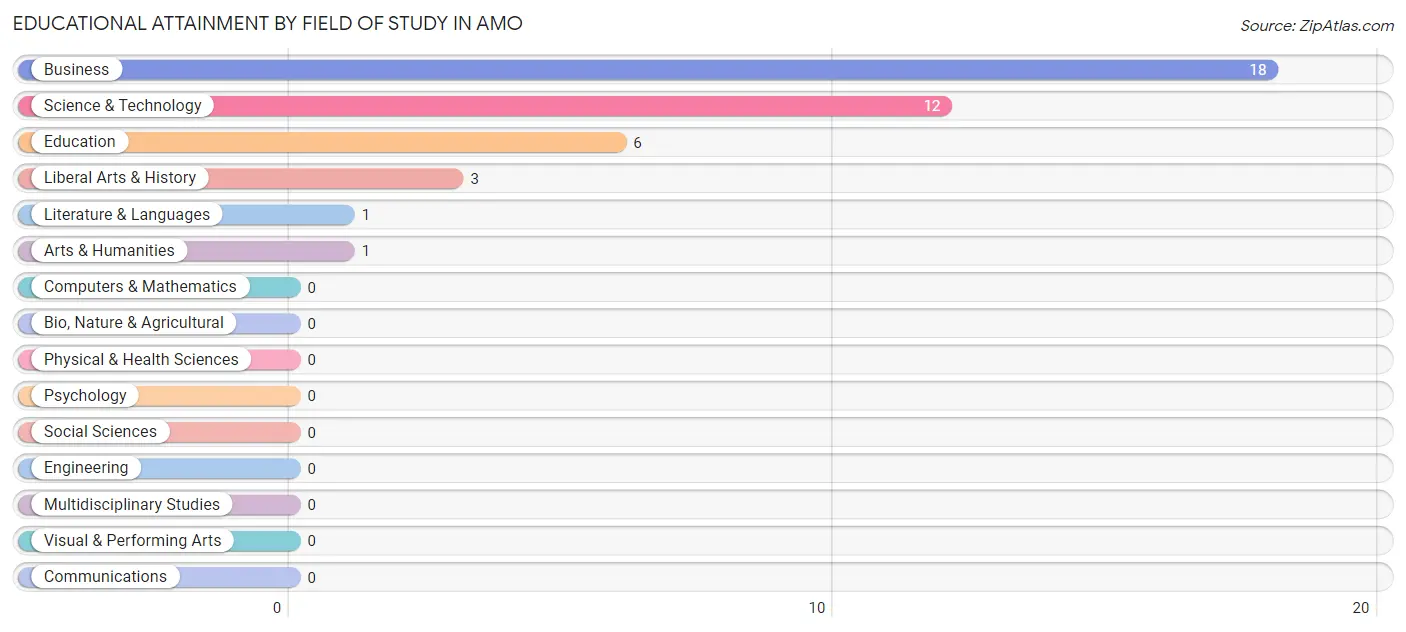
| Field of Study | # Graduates | % Graduates |
| Computers & Mathematics | 0 | 0.0% |
| Bio, Nature & Agricultural | 0 | 0.0% |
| Physical & Health Sciences | 0 | 0.0% |
| Psychology | 0 | 0.0% |
| Social Sciences | 0 | 0.0% |
| Engineering | 0 | 0.0% |
| Multidisciplinary Studies | 0 | 0.0% |
| Science & Technology | 12 | 29.3% |
| Business | 18 | 43.9% |
| Education | 6 | 14.6% |
| Literature & Languages | 1 | 2.4% |
| Liberal Arts & History | 3 | 7.3% |
| Visual & Performing Arts | 0 | 0.0% |
| Communications | 0 | 0.0% |
| Arts & Humanities | 1 | 2.4% |
| Total | 41 | 100.0% |
Transportation & Commute in Amo
Vehicle Availability by Sex in Amo
The most prevalent vehicle ownership categories in Amo are males with 5 or more vehicles (44, accounting for 34.9%) and females with 5 or more vehicles (10, making up 66.7%).
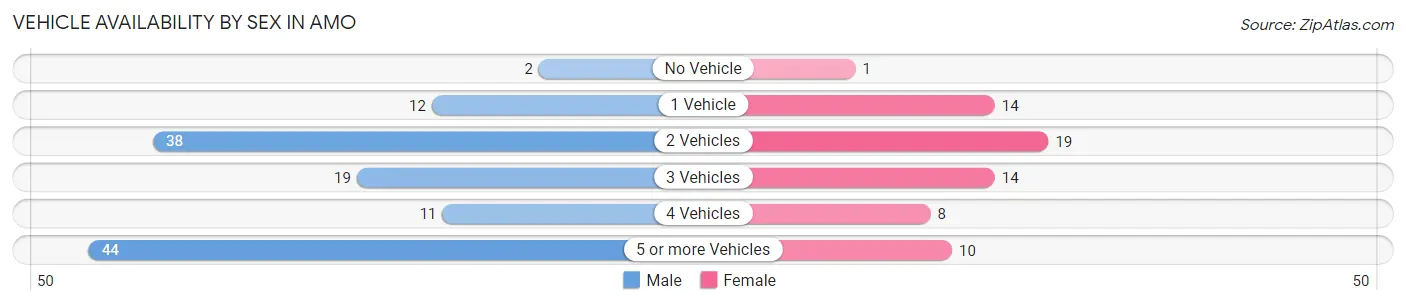
| Vehicles Available | Male | Female |
| No Vehicle | 2 (1.6%) | 1 (1.5%) |
| 1 Vehicle | 12 (9.5%) | 14 (21.2%) |
| 2 Vehicles | 38 (30.2%) | 19 (28.8%) |
| 3 Vehicles | 19 (15.1%) | 14 (21.2%) |
| 4 Vehicles | 11 (8.7%) | 8 (12.1%) |
| 5 or more Vehicles | 44 (34.9%) | 10 (15.1%) |
| Total | 126 (100.0%) | 66 (100.0%) |
Commute Time in Amo
The most frequently occuring commute durations in Amo are 45 to 59 minutes (71 commuters, 38.0%), 20 to 24 minutes (30 commuters, 16.0%), and 30 to 34 minutes (21 commuters, 11.2%).
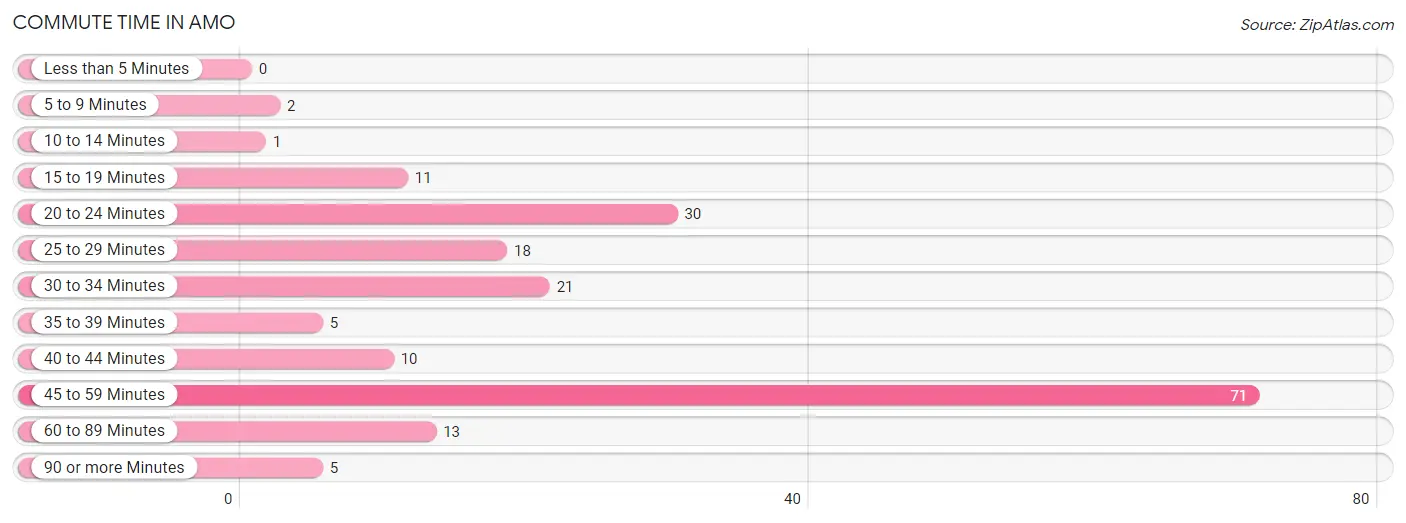
| Commute Time | # Commuters | % Commuters |
| Less than 5 Minutes | 0 | 0.0% |
| 5 to 9 Minutes | 2 | 1.1% |
| 10 to 14 Minutes | 1 | 0.5% |
| 15 to 19 Minutes | 11 | 5.9% |
| 20 to 24 Minutes | 30 | 16.0% |
| 25 to 29 Minutes | 18 | 9.6% |
| 30 to 34 Minutes | 21 | 11.2% |
| 35 to 39 Minutes | 5 | 2.7% |
| 40 to 44 Minutes | 10 | 5.3% |
| 45 to 59 Minutes | 71 | 38.0% |
| 60 to 89 Minutes | 13 | 7.0% |
| 90 or more Minutes | 5 | 2.7% |
Commute Time by Sex in Amo
The most common commute times in Amo are 45 to 59 minutes (57 commuters, 45.2%) for males and 45 to 59 minutes (14 commuters, 23.0%) for females.
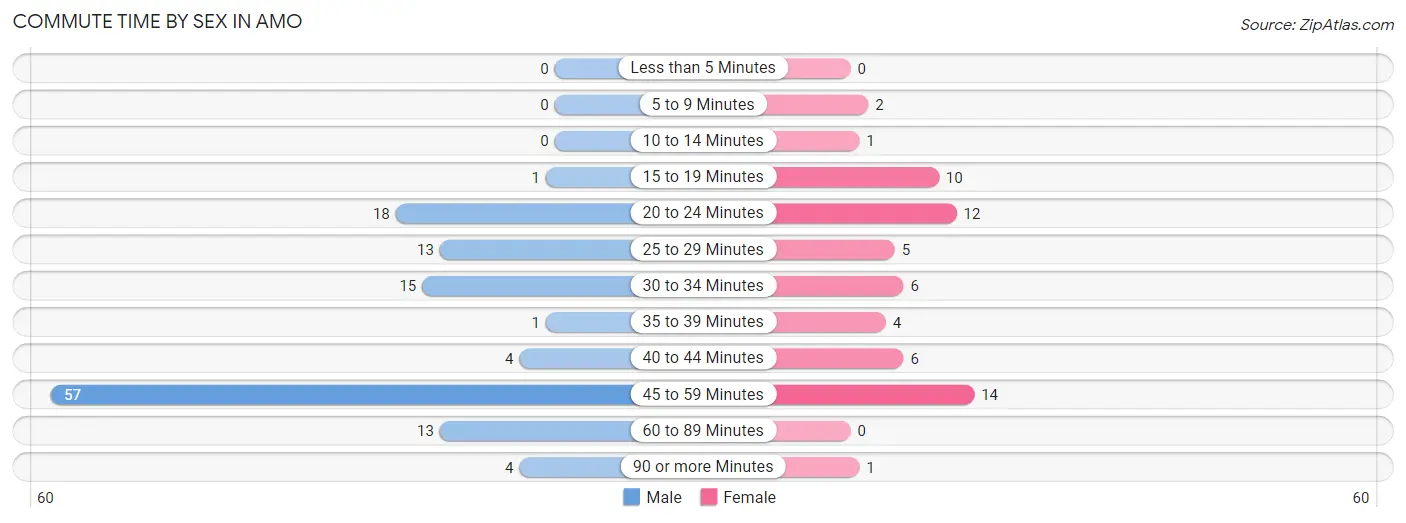
| Commute Time | Male | Female |
| Less than 5 Minutes | 0 (0.0%) | 0 (0.0%) |
| 5 to 9 Minutes | 0 (0.0%) | 2 (3.3%) |
| 10 to 14 Minutes | 0 (0.0%) | 1 (1.6%) |
| 15 to 19 Minutes | 1 (0.8%) | 10 (16.4%) |
| 20 to 24 Minutes | 18 (14.3%) | 12 (19.7%) |
| 25 to 29 Minutes | 13 (10.3%) | 5 (8.2%) |
| 30 to 34 Minutes | 15 (11.9%) | 6 (9.8%) |
| 35 to 39 Minutes | 1 (0.8%) | 4 (6.6%) |
| 40 to 44 Minutes | 4 (3.2%) | 6 (9.8%) |
| 45 to 59 Minutes | 57 (45.2%) | 14 (23.0%) |
| 60 to 89 Minutes | 13 (10.3%) | 0 (0.0%) |
| 90 or more Minutes | 4 (3.2%) | 1 (1.6%) |
Time of Departure to Work by Sex in Amo
The most frequent times of departure to work in Amo are 6:00 AM to 6:29 AM (64, 50.8%) for males and 6:30 AM to 6:59 AM (11, 18.0%) for females.
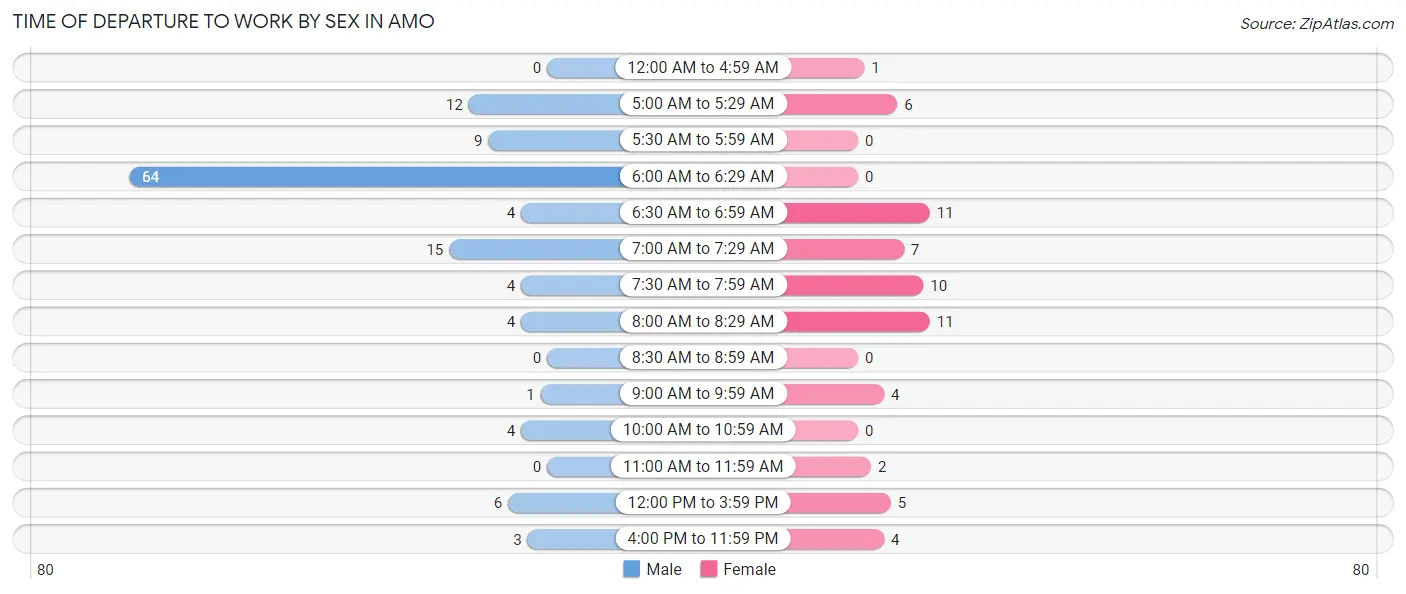
| Time of Departure | Male | Female |
| 12:00 AM to 4:59 AM | 0 (0.0%) | 1 (1.6%) |
| 5:00 AM to 5:29 AM | 12 (9.5%) | 6 (9.8%) |
| 5:30 AM to 5:59 AM | 9 (7.1%) | 0 (0.0%) |
| 6:00 AM to 6:29 AM | 64 (50.8%) | 0 (0.0%) |
| 6:30 AM to 6:59 AM | 4 (3.2%) | 11 (18.0%) |
| 7:00 AM to 7:29 AM | 15 (11.9%) | 7 (11.5%) |
| 7:30 AM to 7:59 AM | 4 (3.2%) | 10 (16.4%) |
| 8:00 AM to 8:29 AM | 4 (3.2%) | 11 (18.0%) |
| 8:30 AM to 8:59 AM | 0 (0.0%) | 0 (0.0%) |
| 9:00 AM to 9:59 AM | 1 (0.8%) | 4 (6.6%) |
| 10:00 AM to 10:59 AM | 4 (3.2%) | 0 (0.0%) |
| 11:00 AM to 11:59 AM | 0 (0.0%) | 2 (3.3%) |
| 12:00 PM to 3:59 PM | 6 (4.8%) | 5 (8.2%) |
| 4:00 PM to 11:59 PM | 3 (2.4%) | 4 (6.6%) |
| Total | 126 (100.0%) | 61 (100.0%) |
Housing Occupancy in Amo
Occupancy by Ownership in Amo
Of the total 131 dwellings in Amo, owner-occupied units account for 106 (80.9%), while renter-occupied units make up 25 (19.1%).
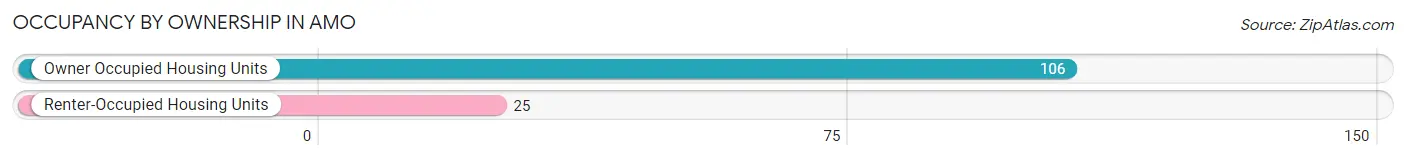
| Occupancy | # Housing Units | % Housing Units |
| Owner Occupied Housing Units | 106 | 80.9% |
| Renter-Occupied Housing Units | 25 | 19.1% |
| Total Occupied Housing Units | 131 | 100.0% |
Occupancy by Household Size in Amo
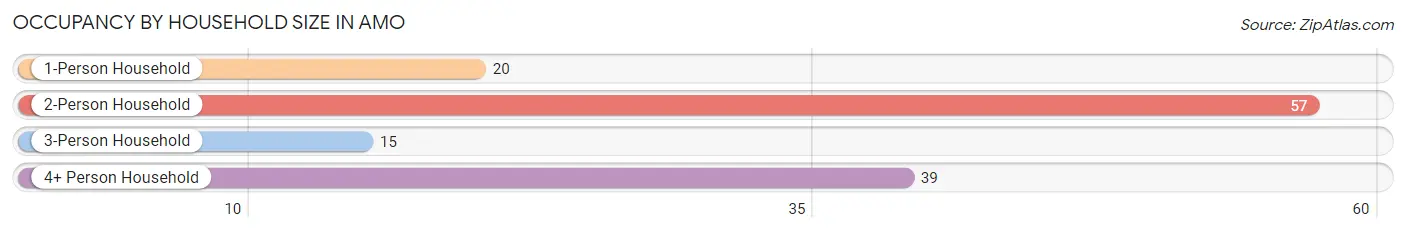
| Household Size | # Housing Units | % Housing Units |
| 1-Person Household | 20 | 15.3% |
| 2-Person Household | 57 | 43.5% |
| 3-Person Household | 15 | 11.5% |
| 4+ Person Household | 39 | 29.8% |
| Total Housing Units | 131 | 100.0% |
Occupancy by Ownership by Household Size in Amo
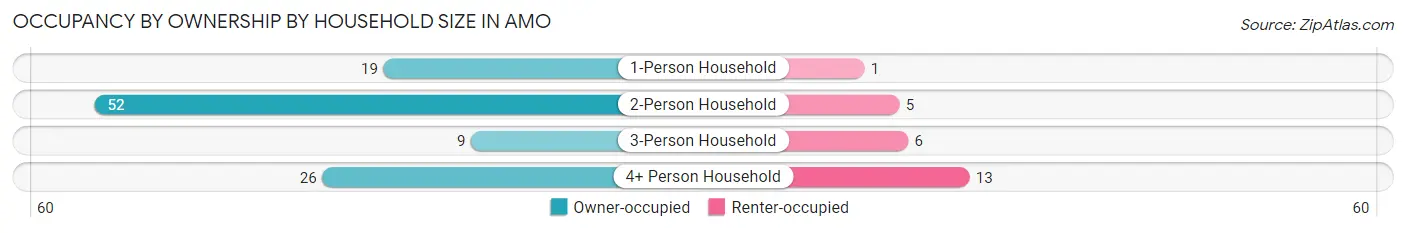
| Household Size | Owner-occupied | Renter-occupied |
| 1-Person Household | 19 (95.0%) | 1 (5.0%) |
| 2-Person Household | 52 (91.2%) | 5 (8.8%) |
| 3-Person Household | 9 (60.0%) | 6 (40.0%) |
| 4+ Person Household | 26 (66.7%) | 13 (33.3%) |
| Total Housing Units | 106 (80.9%) | 25 (19.1%) |
Occupancy by Educational Attainment in Amo
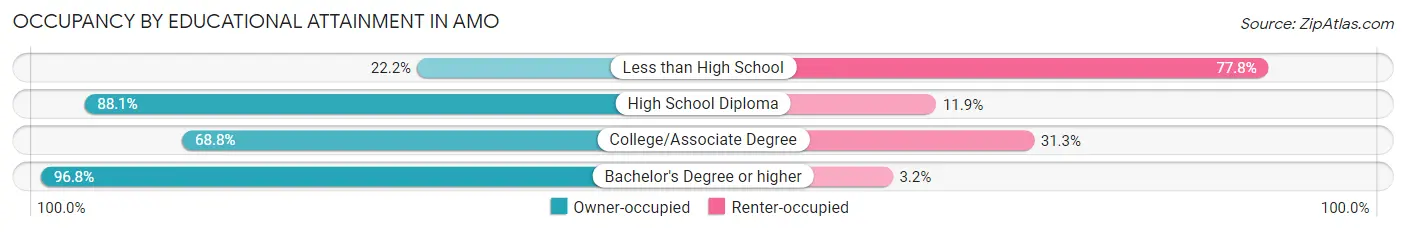
| Household Size | Owner-occupied | Renter-occupied |
| Less than High School | 2 (22.2%) | 7 (77.8%) |
| High School Diploma | 52 (88.1%) | 7 (11.9%) |
| College/Associate Degree | 22 (68.8%) | 10 (31.2%) |
| Bachelor's Degree or higher | 30 (96.8%) | 1 (3.2%) |
Occupancy by Age of Householder in Amo
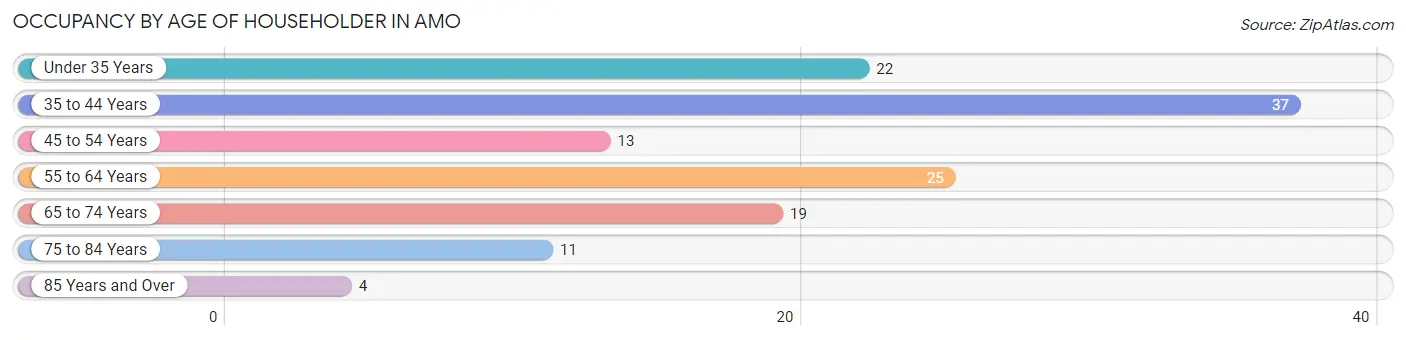
| Age Bracket | # Households | % Households |
| Under 35 Years | 22 | 16.8% |
| 35 to 44 Years | 37 | 28.2% |
| 45 to 54 Years | 13 | 9.9% |
| 55 to 64 Years | 25 | 19.1% |
| 65 to 74 Years | 19 | 14.5% |
| 75 to 84 Years | 11 | 8.4% |
| 85 Years and Over | 4 | 3.0% |
| Total | 131 | 100.0% |
Housing Finances in Amo
Median Income by Occupancy in Amo
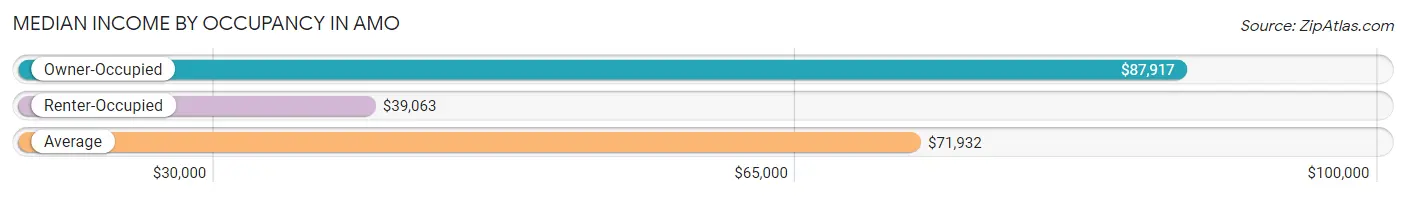
| Occupancy Type | # Households | Median Income |
| Owner-Occupied | 106 (80.9%) | $87,917 |
| Renter-Occupied | 25 (19.1%) | $39,063 |
| Average | 131 (100.0%) | $71,932 |
Occupancy by Householder Income Bracket in Amo
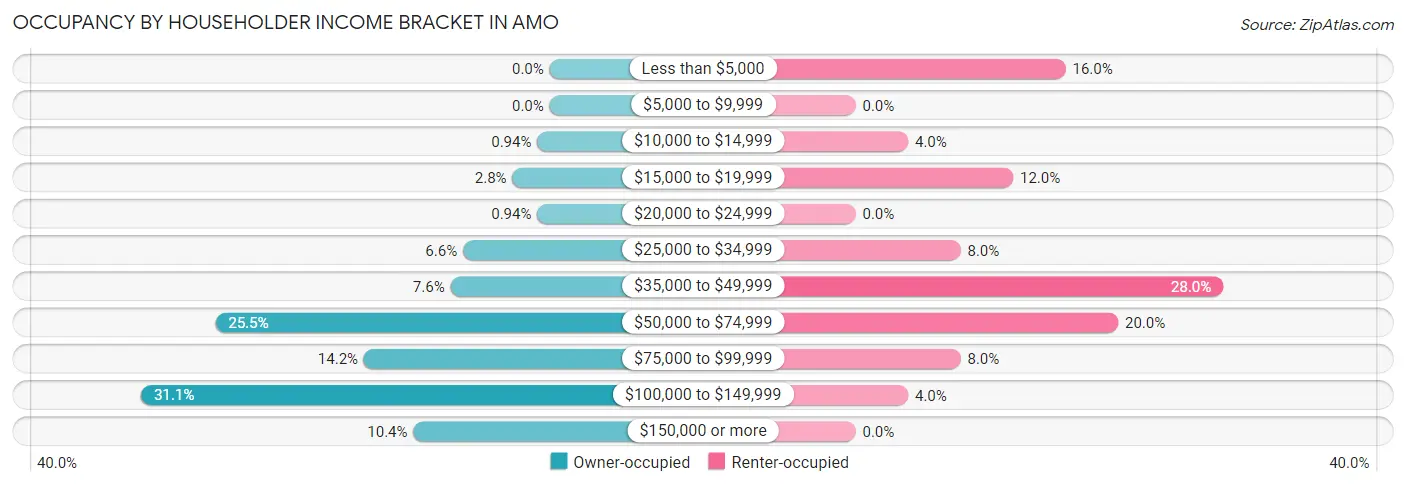
| Income Bracket | Owner-occupied | Renter-occupied |
| Less than $5,000 | 0 (0.0%) | 4 (16.0%) |
| $5,000 to $9,999 | 0 (0.0%) | 0 (0.0%) |
| $10,000 to $14,999 | 1 (0.9%) | 1 (4.0%) |
| $15,000 to $19,999 | 3 (2.8%) | 3 (12.0%) |
| $20,000 to $24,999 | 1 (0.9%) | 0 (0.0%) |
| $25,000 to $34,999 | 7 (6.6%) | 2 (8.0%) |
| $35,000 to $49,999 | 8 (7.5%) | 7 (28.0%) |
| $50,000 to $74,999 | 27 (25.5%) | 5 (20.0%) |
| $75,000 to $99,999 | 15 (14.1%) | 2 (8.0%) |
| $100,000 to $149,999 | 33 (31.1%) | 1 (4.0%) |
| $150,000 or more | 11 (10.4%) | 0 (0.0%) |
| Total | 106 (100.0%) | 25 (100.0%) |
Monthly Housing Cost Tiers in Amo
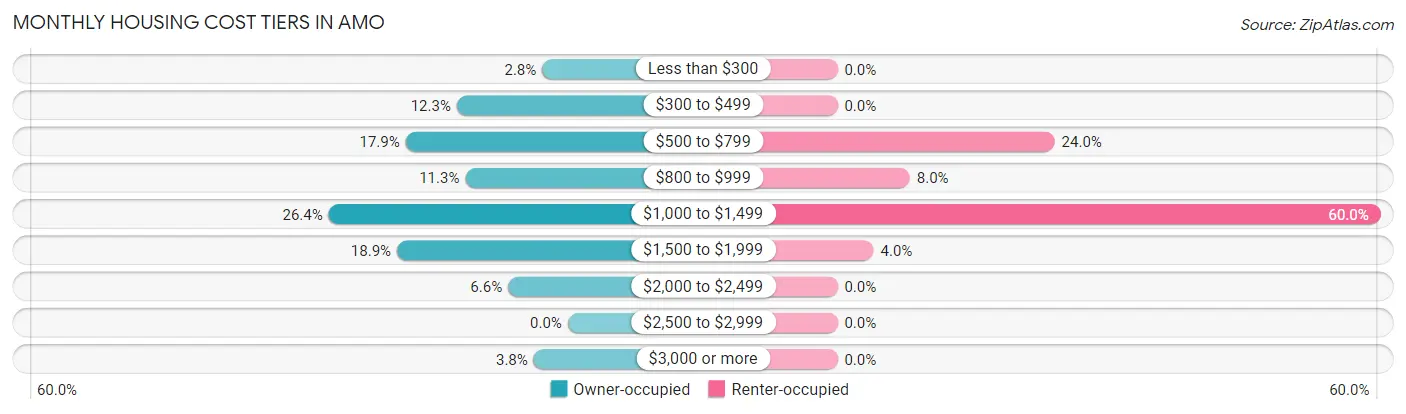
| Monthly Cost | Owner-occupied | Renter-occupied |
| Less than $300 | 3 (2.8%) | 0 (0.0%) |
| $300 to $499 | 13 (12.3%) | 0 (0.0%) |
| $500 to $799 | 19 (17.9%) | 6 (24.0%) |
| $800 to $999 | 12 (11.3%) | 2 (8.0%) |
| $1,000 to $1,499 | 28 (26.4%) | 15 (60.0%) |
| $1,500 to $1,999 | 20 (18.9%) | 1 (4.0%) |
| $2,000 to $2,499 | 7 (6.6%) | 0 (0.0%) |
| $2,500 to $2,999 | 0 (0.0%) | 0 (0.0%) |
| $3,000 or more | 4 (3.8%) | 0 (0.0%) |
| Total | 106 (100.0%) | 25 (100.0%) |
Physical Housing Characteristics in Amo
Housing Structures in Amo
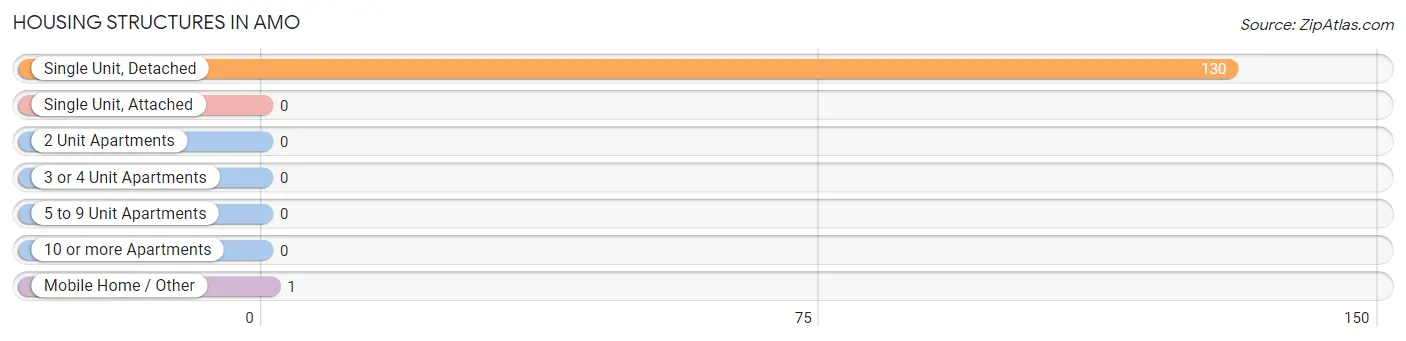
| Structure Type | # Housing Units | % Housing Units |
| Single Unit, Detached | 130 | 99.2% |
| Single Unit, Attached | 0 | 0.0% |
| 2 Unit Apartments | 0 | 0.0% |
| 3 or 4 Unit Apartments | 0 | 0.0% |
| 5 to 9 Unit Apartments | 0 | 0.0% |
| 10 or more Apartments | 0 | 0.0% |
| Mobile Home / Other | 1 | 0.8% |
| Total | 131 | 100.0% |
Housing Structures by Occupancy in Amo
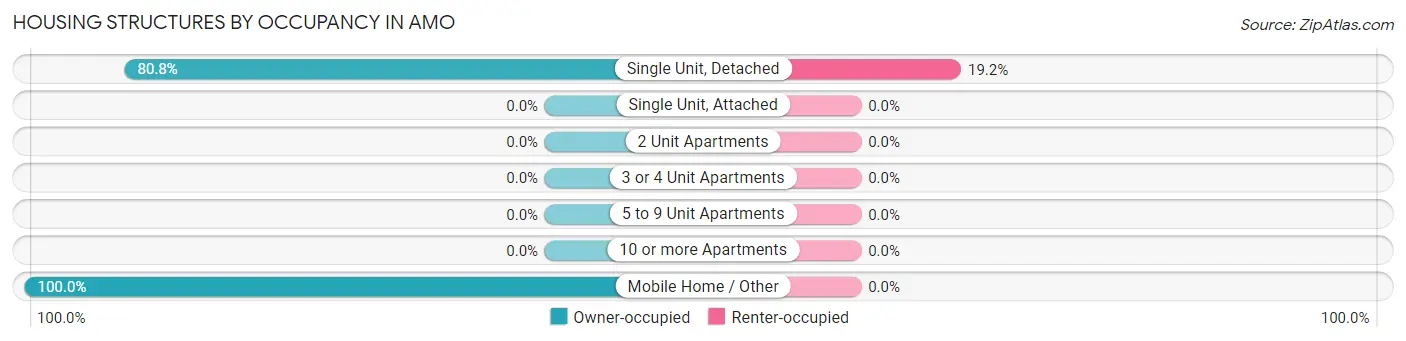
| Structure Type | Owner-occupied | Renter-occupied |
| Single Unit, Detached | 105 (80.8%) | 25 (19.2%) |
| Single Unit, Attached | 0 (0.0%) | 0 (0.0%) |
| 2 Unit Apartments | 0 (0.0%) | 0 (0.0%) |
| 3 or 4 Unit Apartments | 0 (0.0%) | 0 (0.0%) |
| 5 to 9 Unit Apartments | 0 (0.0%) | 0 (0.0%) |
| 10 or more Apartments | 0 (0.0%) | 0 (0.0%) |
| Mobile Home / Other | 1 (100.0%) | 0 (0.0%) |
| Total | 106 (80.9%) | 25 (19.1%) |
Housing Structures by Number of Rooms in Amo
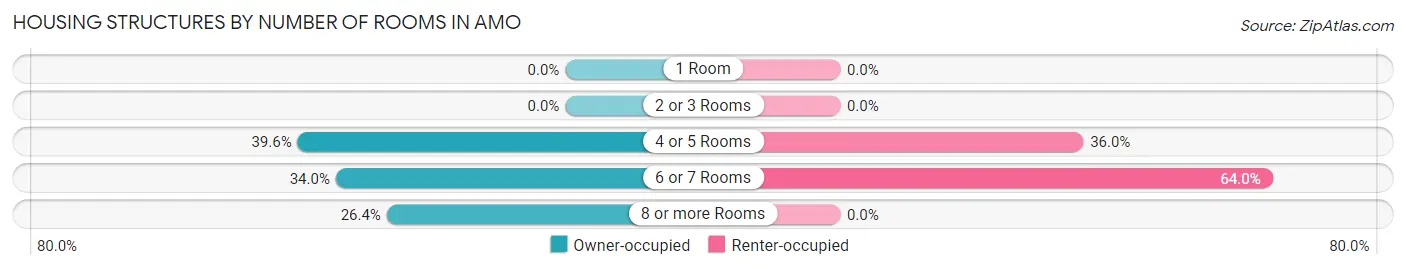
| Number of Rooms | Owner-occupied | Renter-occupied |
| 1 Room | 0 (0.0%) | 0 (0.0%) |
| 2 or 3 Rooms | 0 (0.0%) | 0 (0.0%) |
| 4 or 5 Rooms | 42 (39.6%) | 9 (36.0%) |
| 6 or 7 Rooms | 36 (34.0%) | 16 (64.0%) |
| 8 or more Rooms | 28 (26.4%) | 0 (0.0%) |
| Total | 106 (100.0%) | 25 (100.0%) |
Housing Structure by Heating Type in Amo
| Heating Type | Owner-occupied | Renter-occupied |
| Utility Gas | 1 (0.9%) | 2 (8.0%) |
| Bottled, Tank, or LP Gas | 55 (51.9%) | 10 (40.0%) |
| Electricity | 39 (36.8%) | 13 (52.0%) |
| Fuel Oil or Kerosene | 8 (7.5%) | 0 (0.0%) |
| Coal or Coke | 0 (0.0%) | 0 (0.0%) |
| All other Fuels | 3 (2.8%) | 0 (0.0%) |
| No Fuel Used | 0 (0.0%) | 0 (0.0%) |
| Total | 106 (100.0%) | 25 (100.0%) |
Household Vehicle Usage in Amo
| Vehicles per Household | Owner-occupied | Renter-occupied |
| No Vehicle | 5 (4.7%) | 0 (0.0%) |
| 1 Vehicle | 15 (14.1%) | 11 (44.0%) |
| 2 Vehicles | 41 (38.7%) | 11 (44.0%) |
| 3 or more Vehicles | 45 (42.4%) | 3 (12.0%) |
| Total | 106 (100.0%) | 25 (100.0%) |
Real Estate & Mortgages in Amo
Real Estate and Mortgage Overview in Amo
| Characteristic | Without Mortgage | With Mortgage |
| Housing Units | 27 | 79 |
| Median Property Value | $122,900 | $146,900 |
| Median Household Income | $61,250 | $8 |
| Monthly Housing Costs | $488 | $4 |
| Real Estate Taxes | $950 | $2 |
Property Value by Mortgage Status in Amo
| Property Value | Without Mortgage | With Mortgage |
| Less than $50,000 | 0 (0.0%) | 0 (0.0%) |
| $50,000 to $99,999 | 8 (29.6%) | 13 (16.5%) |
| $100,000 to $299,999 | 16 (59.3%) | 62 (78.5%) |
| $300,000 to $499,999 | 3 (11.1%) | 0 (0.0%) |
| $500,000 to $749,999 | 0 (0.0%) | 4 (5.1%) |
| $750,000 to $999,999 | 0 (0.0%) | 0 (0.0%) |
| $1,000,000 or more | 0 (0.0%) | 0 (0.0%) |
| Total | 27 (100.0%) | 79 (100.0%) |
Household Income by Mortgage Status in Amo
| Household Income | Without Mortgage | With Mortgage |
| Less than $10,000 | 0 (0.0%) | 5 (6.3%) |
| $10,000 to $24,999 | 1 (3.7%) | 0 (0.0%) |
| $25,000 to $34,999 | 7 (25.9%) | 4 (5.1%) |
| $35,000 to $49,999 | 3 (11.1%) | 0 (0.0%) |
| $50,000 to $74,999 | 9 (33.3%) | 5 (6.3%) |
| $75,000 to $99,999 | 0 (0.0%) | 18 (22.8%) |
| $100,000 to $149,999 | 4 (14.8%) | 15 (19.0%) |
| $150,000 or more | 3 (11.1%) | 29 (36.7%) |
| Total | 27 (100.0%) | 79 (100.0%) |
Property Value to Household Income Ratio in Amo
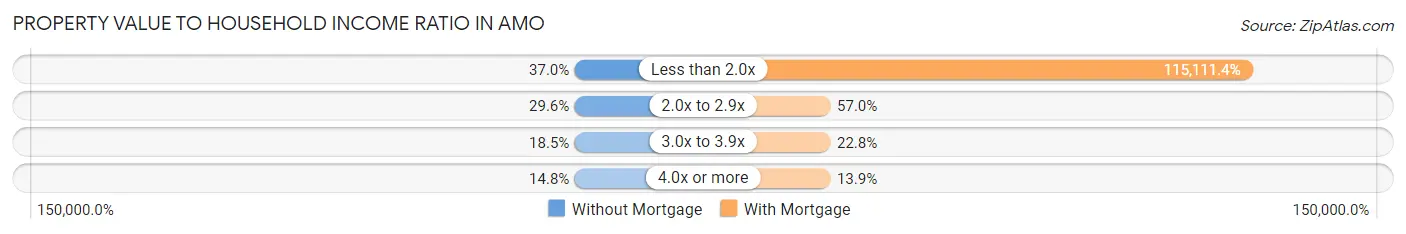
| Value-to-Income Ratio | Without Mortgage | With Mortgage |
| Less than 2.0x | 10 (37.0%) | 90,938 (115,111.4%) |
| 2.0x to 2.9x | 8 (29.6%) | 45 (57.0%) |
| 3.0x to 3.9x | 5 (18.5%) | 18 (22.8%) |
| 4.0x or more | 4 (14.8%) | 11 (13.9%) |
| Total | 27 (100.0%) | 79 (100.0%) |
Real Estate Taxes by Mortgage Status in Amo
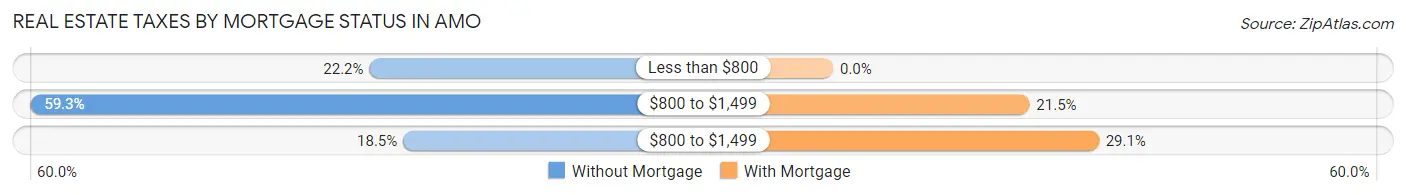
| Property Taxes | Without Mortgage | With Mortgage |
| Less than $800 | 6 (22.2%) | 0 (0.0%) |
| $800 to $1,499 | 16 (59.3%) | 17 (21.5%) |
| $800 to $1,499 | 5 (18.5%) | 23 (29.1%) |
| Total | 27 (100.0%) | 79 (100.0%) |
Health & Disability in Amo
Health Insurance Coverage by Age in Amo
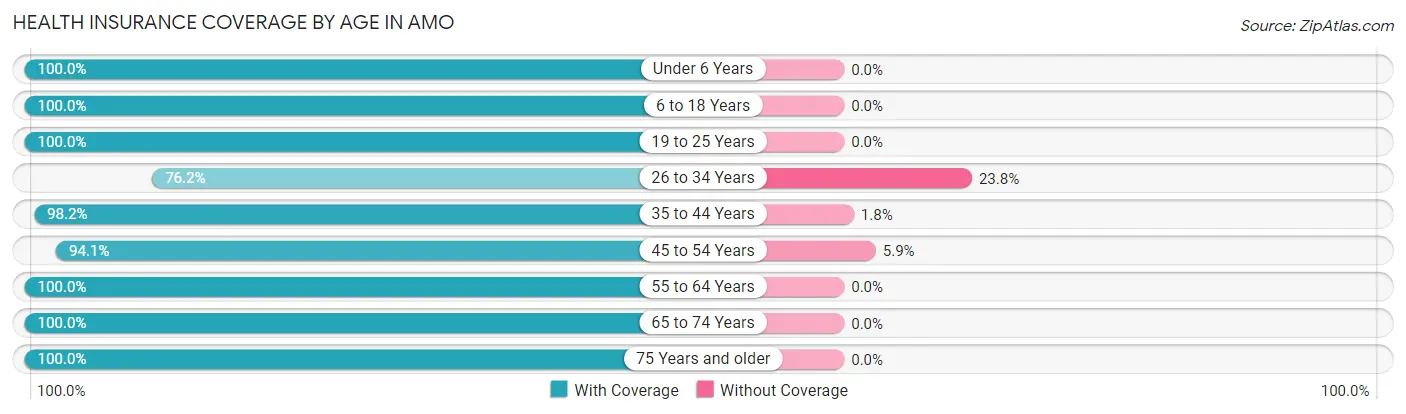
| Age Bracket | With Coverage | Without Coverage |
| Under 6 Years | 31 (100.0%) | 0 (0.0%) |
| 6 to 18 Years | 87 (100.0%) | 0 (0.0%) |
| 19 to 25 Years | 60 (100.0%) | 0 (0.0%) |
| 26 to 34 Years | 32 (76.2%) | 10 (23.8%) |
| 35 to 44 Years | 55 (98.2%) | 1 (1.8%) |
| 45 to 54 Years | 32 (94.1%) | 2 (5.9%) |
| 55 to 64 Years | 66 (100.0%) | 0 (0.0%) |
| 65 to 74 Years | 20 (100.0%) | 0 (0.0%) |
| 75 Years and older | 26 (100.0%) | 0 (0.0%) |
| Total | 409 (96.9%) | 13 (3.1%) |
Health Insurance Coverage by Citizenship Status in Amo
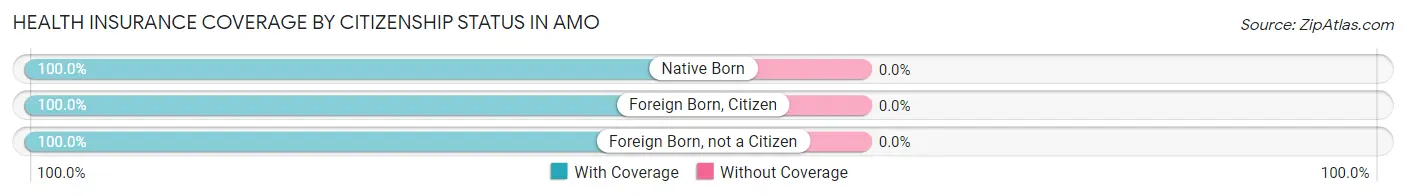
| Citizenship Status | With Coverage | Without Coverage |
| Native Born | 31 (100.0%) | 0 (0.0%) |
| Foreign Born, Citizen | 87 (100.0%) | 0 (0.0%) |
| Foreign Born, not a Citizen | 60 (100.0%) | 0 (0.0%) |
Health Insurance Coverage by Household Income in Amo
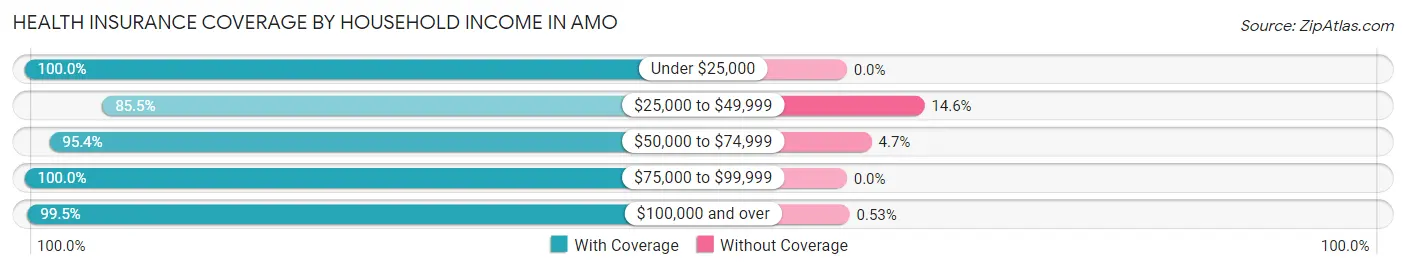
| Household Income | With Coverage | Without Coverage |
| Under $25,000 | 51 (100.0%) | 0 (0.0%) |
| $25,000 to $49,999 | 47 (85.5%) | 8 (14.5%) |
| $50,000 to $74,999 | 82 (95.4%) | 4 (4.6%) |
| $75,000 to $99,999 | 43 (100.0%) | 0 (0.0%) |
| $100,000 and over | 186 (99.5%) | 1 (0.5%) |
Public vs Private Health Insurance Coverage by Age in Amo
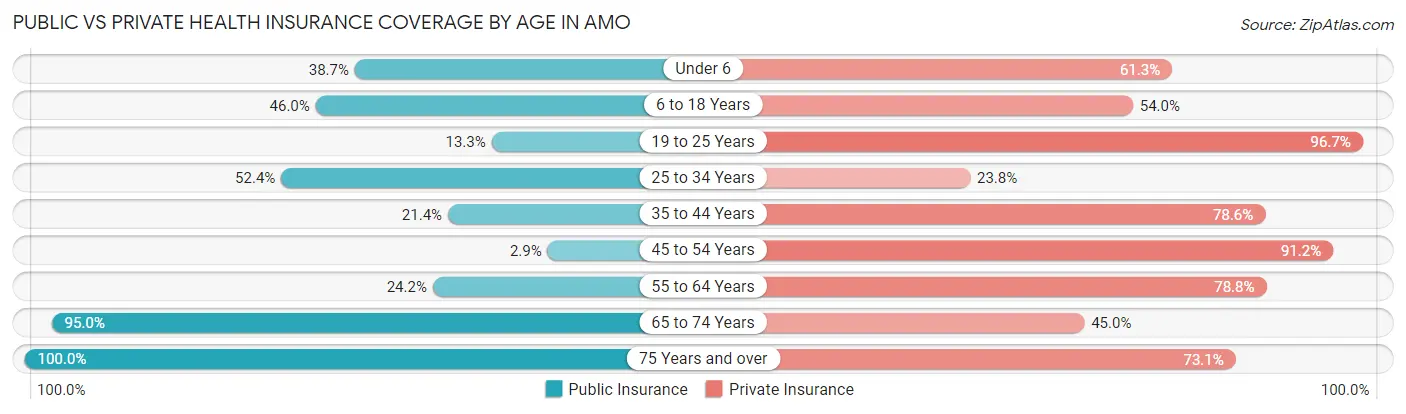
| Age Bracket | Public Insurance | Private Insurance |
| Under 6 | 12 (38.7%) | 19 (61.3%) |
| 6 to 18 Years | 40 (46.0%) | 47 (54.0%) |
| 19 to 25 Years | 8 (13.3%) | 58 (96.7%) |
| 25 to 34 Years | 22 (52.4%) | 10 (23.8%) |
| 35 to 44 Years | 12 (21.4%) | 44 (78.6%) |
| 45 to 54 Years | 1 (2.9%) | 31 (91.2%) |
| 55 to 64 Years | 16 (24.2%) | 52 (78.8%) |
| 65 to 74 Years | 19 (95.0%) | 9 (45.0%) |
| 75 Years and over | 26 (100.0%) | 19 (73.1%) |
| Total | 156 (37.0%) | 289 (68.5%) |
Disability Status by Sex by Age in Amo
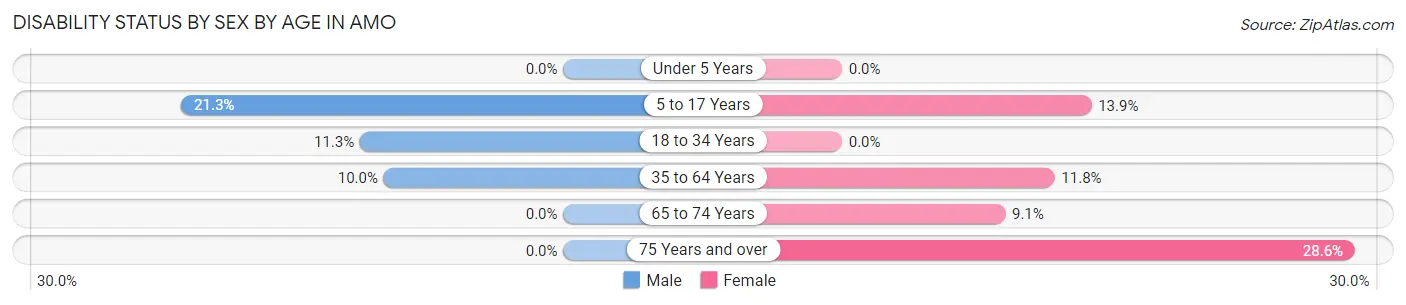
| Age Bracket | Male | Female |
| Under 5 Years | 0 (0.0%) | 0 (0.0%) |
| 5 to 17 Years | 10 (21.3%) | 5 (13.9%) |
| 18 to 34 Years | 6 (11.3%) | 0 (0.0%) |
| 35 to 64 Years | 8 (10.0%) | 9 (11.8%) |
| 65 to 74 Years | 0 (0.0%) | 1 (9.1%) |
| 75 Years and over | 0 (0.0%) | 4 (28.6%) |
Disability Class by Sex by Age in Amo
Disability Class: Hearing Difficulty
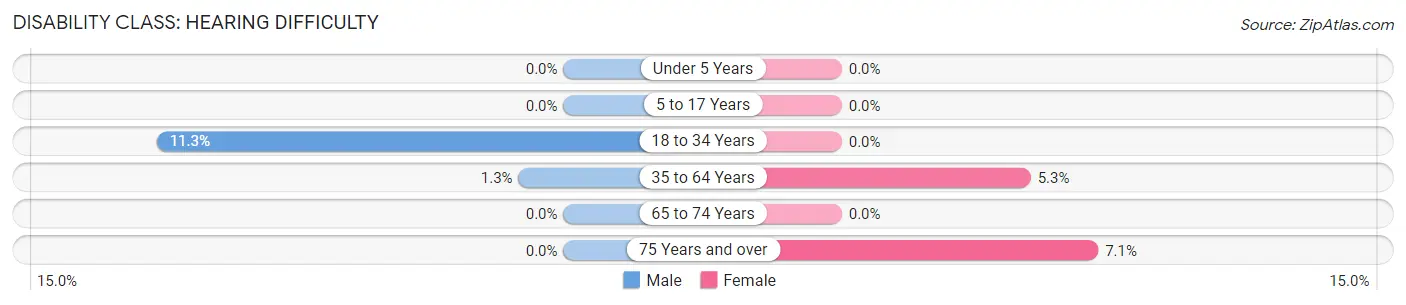
| Age Bracket | Male | Female |
| Under 5 Years | 0 (0.0%) | 0 (0.0%) |
| 5 to 17 Years | 0 (0.0%) | 0 (0.0%) |
| 18 to 34 Years | 6 (11.3%) | 0 (0.0%) |
| 35 to 64 Years | 1 (1.3%) | 4 (5.3%) |
| 65 to 74 Years | 0 (0.0%) | 0 (0.0%) |
| 75 Years and over | 0 (0.0%) | 1 (7.1%) |
Disability Class: Vision Difficulty
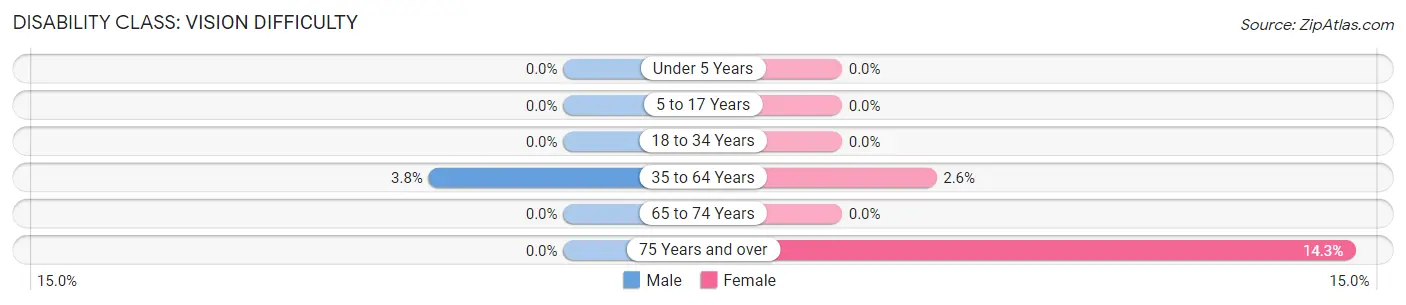
| Age Bracket | Male | Female |
| Under 5 Years | 0 (0.0%) | 0 (0.0%) |
| 5 to 17 Years | 0 (0.0%) | 0 (0.0%) |
| 18 to 34 Years | 0 (0.0%) | 0 (0.0%) |
| 35 to 64 Years | 3 (3.7%) | 2 (2.6%) |
| 65 to 74 Years | 0 (0.0%) | 0 (0.0%) |
| 75 Years and over | 0 (0.0%) | 2 (14.3%) |
Disability Class: Cognitive Difficulty
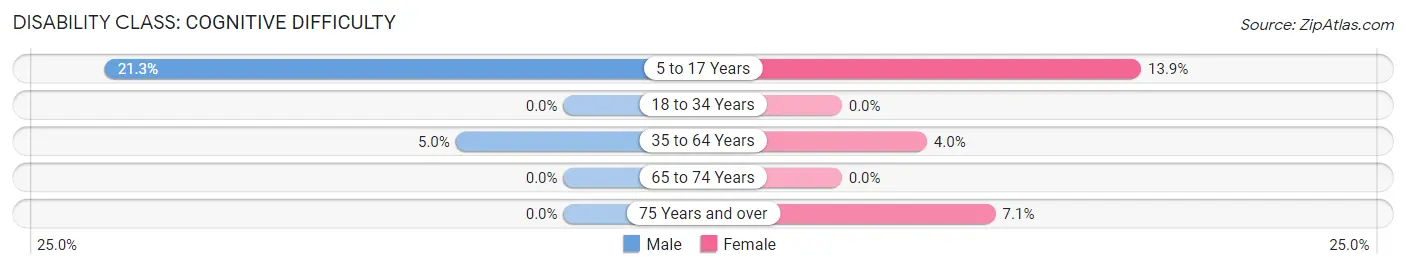
| Age Bracket | Male | Female |
| 5 to 17 Years | 10 (21.3%) | 5 (13.9%) |
| 18 to 34 Years | 0 (0.0%) | 0 (0.0%) |
| 35 to 64 Years | 4 (5.0%) | 3 (4.0%) |
| 65 to 74 Years | 0 (0.0%) | 0 (0.0%) |
| 75 Years and over | 0 (0.0%) | 1 (7.1%) |
Disability Class: Ambulatory Difficulty
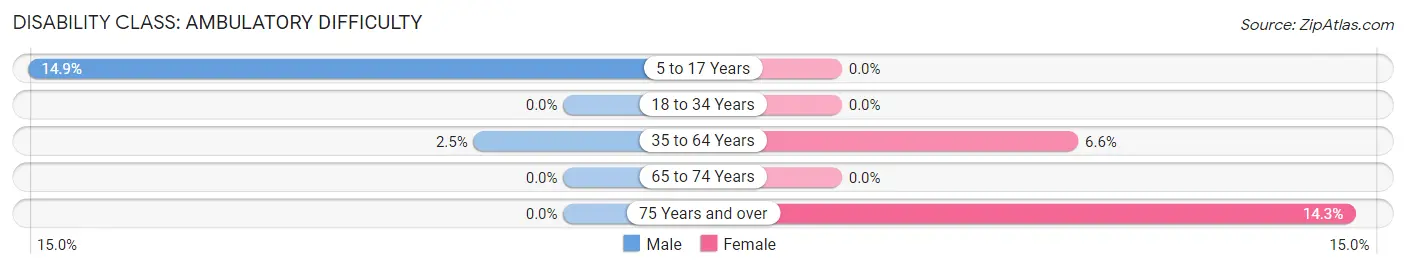
| Age Bracket | Male | Female |
| 5 to 17 Years | 7 (14.9%) | 0 (0.0%) |
| 18 to 34 Years | 0 (0.0%) | 0 (0.0%) |
| 35 to 64 Years | 2 (2.5%) | 5 (6.6%) |
| 65 to 74 Years | 0 (0.0%) | 0 (0.0%) |
| 75 Years and over | 0 (0.0%) | 2 (14.3%) |
Disability Class: Self-Care Difficulty
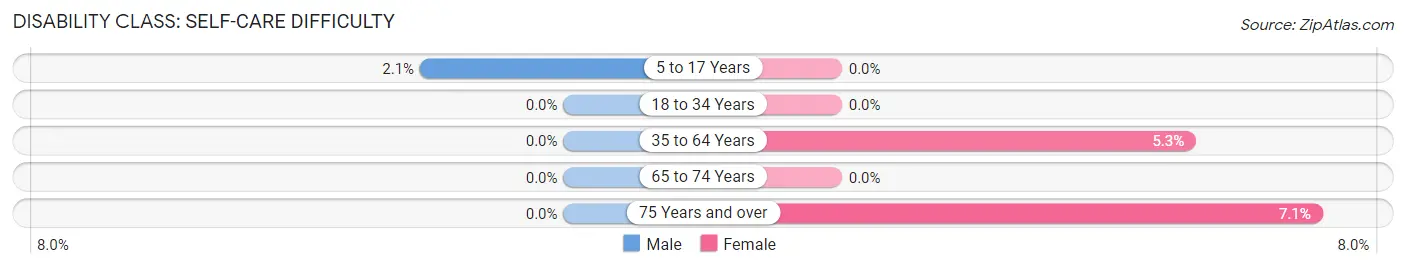
| Age Bracket | Male | Female |
| 5 to 17 Years | 1 (2.1%) | 0 (0.0%) |
| 18 to 34 Years | 0 (0.0%) | 0 (0.0%) |
| 35 to 64 Years | 0 (0.0%) | 4 (5.3%) |
| 65 to 74 Years | 0 (0.0%) | 0 (0.0%) |
| 75 Years and over | 0 (0.0%) | 1 (7.1%) |
Technology Access in Amo
Computing Device Access in Amo
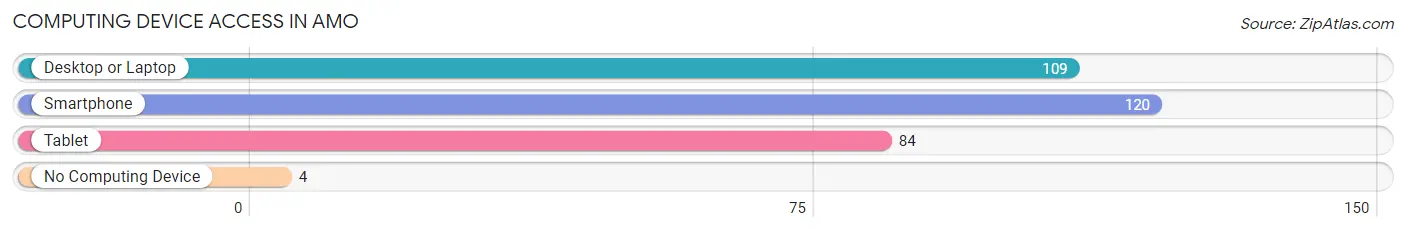
| Device Type | # Households | % Households |
| Desktop or Laptop | 109 | 83.2% |
| Smartphone | 120 | 91.6% |
| Tablet | 84 | 64.1% |
| No Computing Device | 4 | 3.0% |
| Total | 131 | 100.0% |
Internet Access in Amo
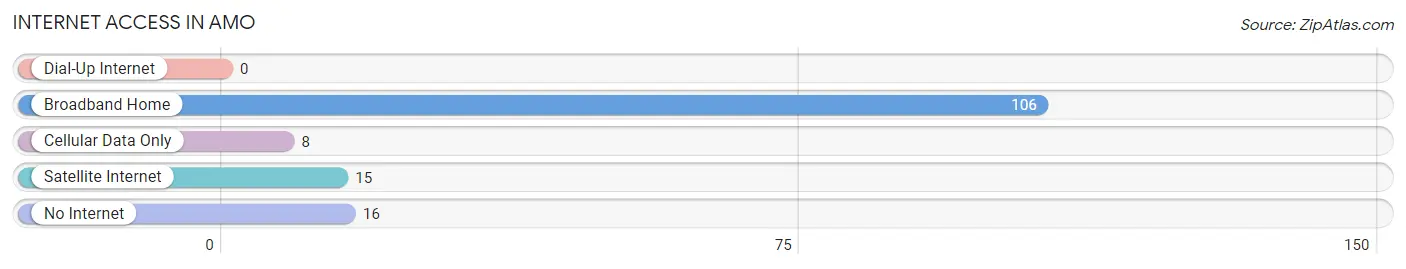
| Internet Type | # Households | % Households |
| Dial-Up Internet | 0 | 0.0% |
| Broadband Home | 106 | 80.9% |
| Cellular Data Only | 8 | 6.1% |
| Satellite Internet | 15 | 11.5% |
| No Internet | 16 | 12.2% |
| Total | 131 | 100.0% |
Amo Summary
History
Amo is a small town located in Hendricks County, Indiana. It was founded in 1837 by a group of settlers from North Carolina. The town was named after the Amo River, which runs through the area. The town was originally a farming community, but it has since grown to include a variety of businesses and industries.
The first settlers in Amo were Quakers from North Carolina. They were attracted to the area because of its fertile soil and abundant natural resources. The Quakers established a church and a school, and the town quickly grew. By the late 1800s, Amo had become a thriving community with a variety of businesses, including a sawmill, a gristmill, a blacksmith shop, and a general store.
In the early 1900s, Amo experienced a period of growth and prosperity. The town was home to several factories, including a brickyard, a canning factory, and a furniture factory. The town also had a railroad station, which allowed for easy transportation of goods and people.
By the mid-1900s, Amo had become a popular tourist destination. The town was home to several resorts, including the Amo Hotel and the Amo Country Club. The town also had a movie theater, a bowling alley, and a golf course.
Geography
Amo is located in the central part of Hendricks County, Indiana. It is situated on the banks of the Amo River, which runs through the town. The town is surrounded by rolling hills and farmland. The town is located about 25 miles west of Indianapolis and about 50 miles east of Terre Haute.
The climate in Amo is typical of the Midwest. Summers are hot and humid, while winters are cold and snowy. The average annual temperature is around 50 degrees Fahrenheit.
Economy
Amo’s economy is largely based on agriculture and manufacturing. The town is home to several factories, including a furniture factory, a canning factory, and a brickyard. The town also has a variety of small businesses, including restaurants, shops, and service providers.
The town is also home to several tourist attractions, including the Amo Hotel and the Amo Country Club. The town also has a movie theater, a bowling alley, and a golf course.
Demographics
As of the 2010 census, the population of Amo was 1,845. The racial makeup of the town was 97.3% White, 0.7% African American, 0.2% Native American, 0.2% Asian, 0.1% Pacific Islander, and 1.5% from other races. The median household income was $45,000, and the median family income was $50,000.
Amo is a small town with a close-knit community. The town is home to several churches, including the Amo United Methodist Church and the Amo Presbyterian Church. The town also has a library, a post office, and a fire station.
Common Questions
What is the Total Population of Amo?
Total Population of Amo is 422.
What is the Total Male Population of Amo?
Total Male Population of Amo is 218.
What is the Total Female Population of Amo?
Total Female Population of Amo is 204.
What is the Ratio of Males per 100 Females in Amo?
There are 106.86 Males per 100 Females in Amo.
What is the Ratio of Females per 100 Males in Amo?
There are 93.58 Females per 100 Males in Amo.
What is the Median Population Age in Amo?
Median Population Age in Amo is 31.7 Years.
What is the Average Family Size in Amo
Average Family Size in Amo is 3.6 People.
What is the Average Household Size in Amo
Average Household Size in Amo is 3.2 People.
What is Per Capita Income in Amo?
Per Capita income in Amo is $28,283.
What is the Median Family Income in Amo?
Median Family Income in Amo is $81,563.
What is the Median Household income in Amo?
Median Household Income in Amo is $71,932.
What is Income or Wage Gap in Amo?
Income or Wage Gap in Amo is 13.8%.
Women in Amo earn 86.2 cents for every dollar earned by a man.
What is Inequality or Gini Index in Amo?
Inequality or Gini Index in Amo is 0.35.
How Large is the Labor Force in Amo?
There are 197 People in the Labor Forcein in Amo.
What is the Percentage of People in the Labor Force in Amo?
61.4% of People are in the Labor Force in Amo.
What is the Unemployment Rate in Amo?
Unemployment Rate in Amo is 2.5%.