Zip Codes with the Highest Percentage of Population with a Degree in Science and Engineering in Mishawaka, IN
RELATED REPORTS & OPTIONS
Science and Engineering
Mishawaka
Compare Zip Codes
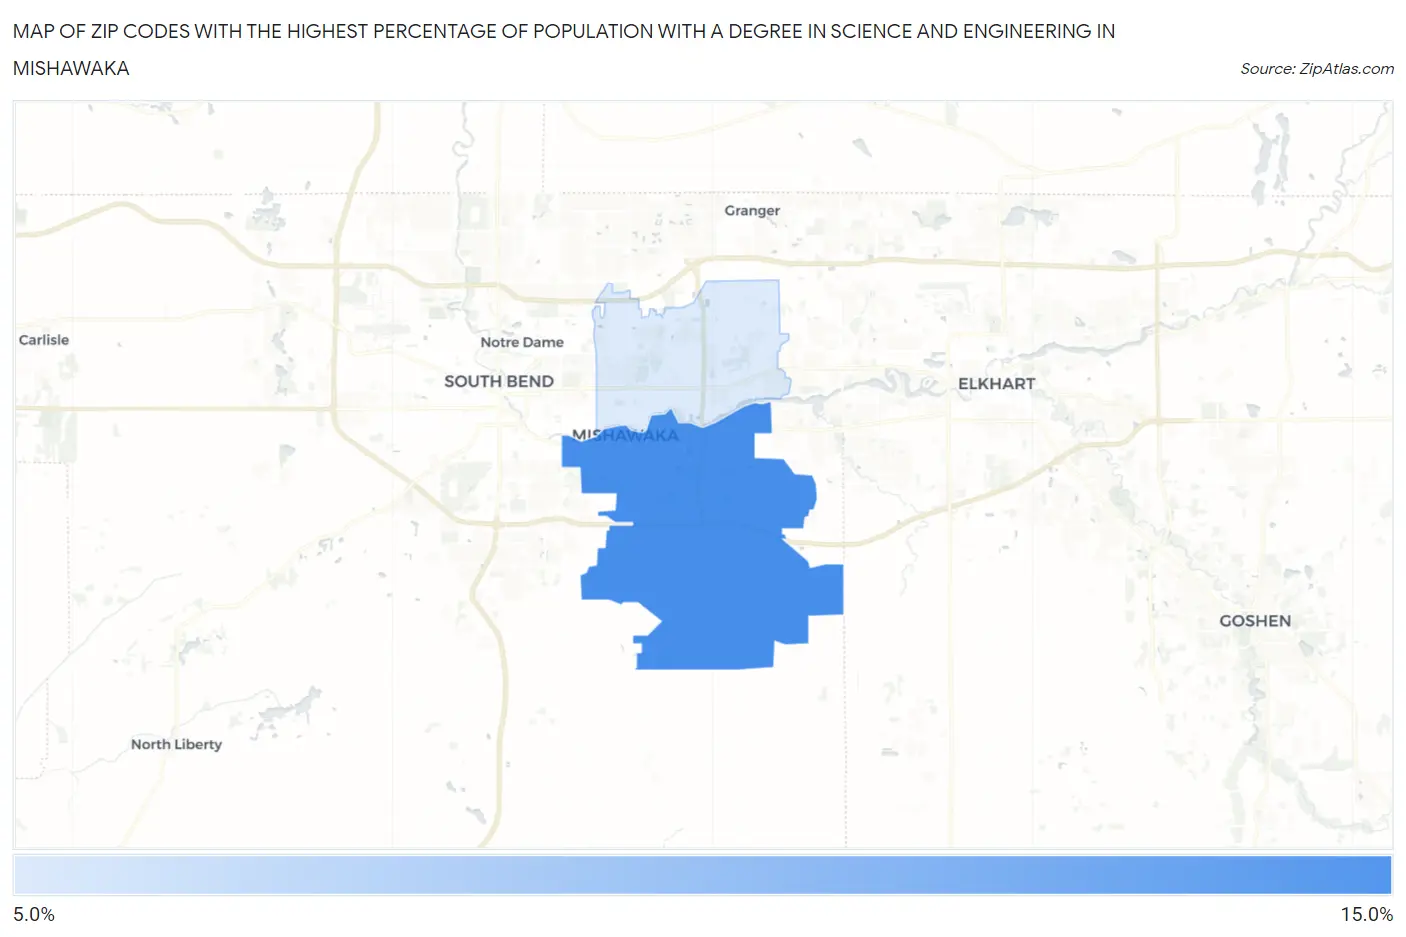
Map of Zip Codes with the Highest Percentage of Population with a Degree in Science and Engineering in Mishawaka
0.0%
15.0%
Zip Codes with the Highest Percentage of Population with a Degree in Science and Engineering in Mishawaka, IN
| Zip Code | % Graduates | vs State | vs National | |
| 1. | 46544 | 11.7% | 12.7%(-0.921)#398 | 9.8%(+1.97)#11,383 |
| 2. | 46545 | 11.4% | 12.7%(-1.23)#410 | 9.8%(+1.65)#11,956 |
1
Common Questions
What are the Top Zip Codes with the Highest Percentage of Population with a Degree in Science and Engineering in Mishawaka, IN?
Top Zip Codes with the Highest Percentage of Population with a Degree in Science and Engineering in Mishawaka, IN are:
What zip code has the Highest Percentage of Population with a Degree in Science and Engineering in Mishawaka, IN?
46544 has the Highest Percentage of Population with a Degree in Science and Engineering in Mishawaka, IN with 11.7%.
What is the Percentage of Population with a Degree in Science and Engineering in Mishawaka, IN?
Percentage of Population with a Degree in Science and Engineering in Mishawaka is 11.2%.
What is the Percentage of Population with a Degree in Science and Engineering in Indiana?
Percentage of Population with a Degree in Science and Engineering in Indiana is 12.7%.
What is the Percentage of Population with a Degree in Science and Engineering in the United States?
Percentage of Population with a Degree in Science and Engineering in the United States is 9.8%.