Greendale, IN
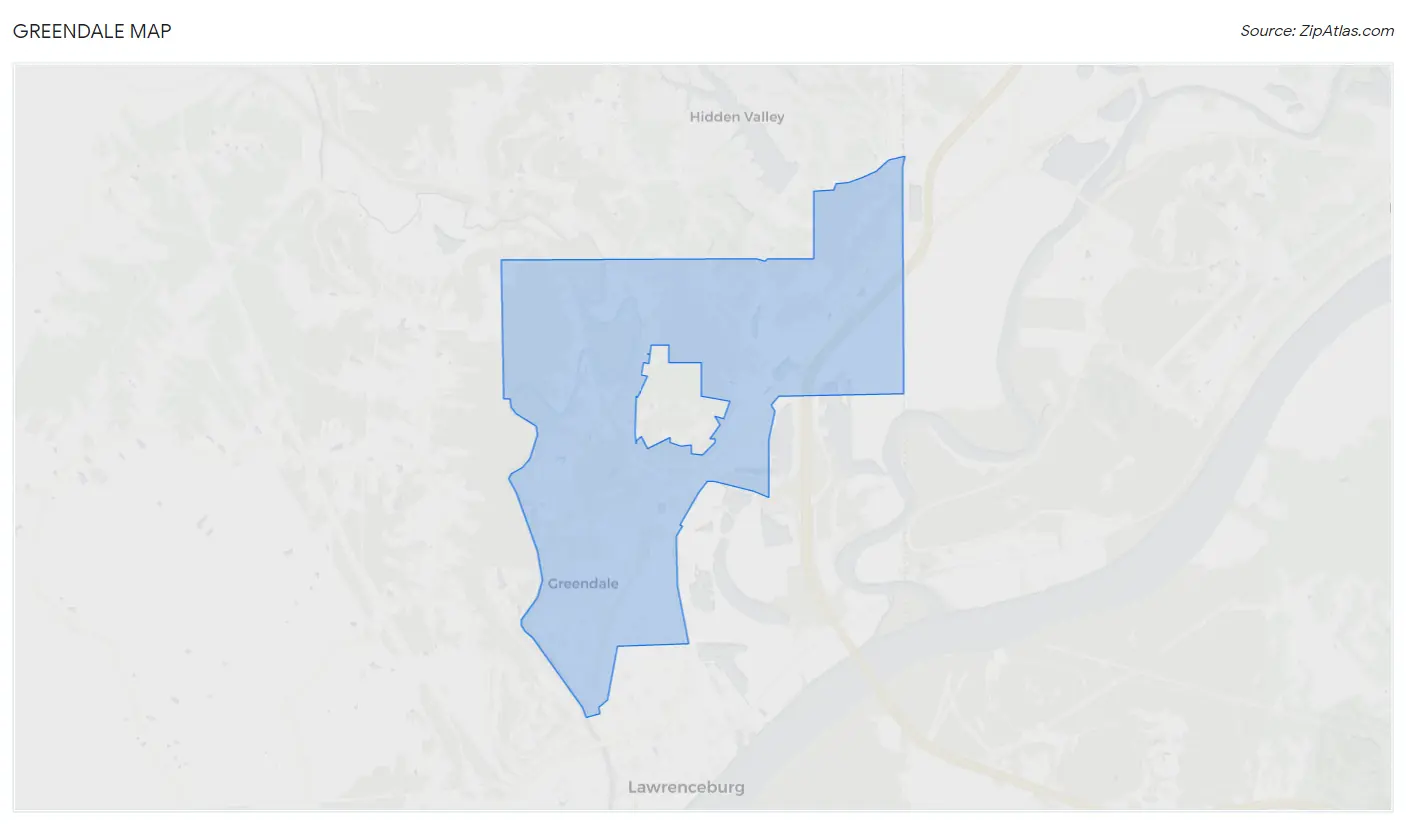
Greendale Map
Greendale Overview
3,967
TOTAL POPULATION
1,882
MALE POPULATION
2,085
FEMALE POPULATION
90.26
MALES / 100 FEMALES
110.79
FEMALES / 100 MALES
42.9
MEDIAN AGE
3.0
AVG FAMILY SIZE
2.3
AVG HOUSEHOLD SIZE
$28,162
PER CAPITA INCOME
$94,816
AVG FAMILY INCOME
$70,668
AVG HOUSEHOLD INCOME
56.7%
WAGE / INCOME GAP [ % ]
43.3¢/ $1
WAGE / INCOME GAP [ $ ]
0.40
INEQUALITY / GINI INDEX
1,960
LABOR FORCE [ PEOPLE ]
60.0%
PERCENT IN LABOR FORCE
Greendale Area Codes
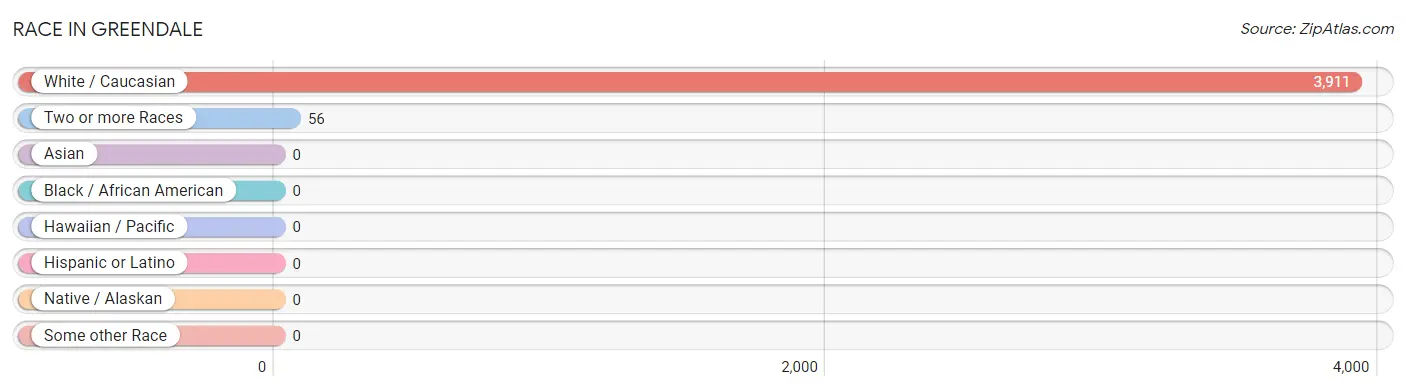
Race in Greendale
The most populous races in Greendale are White / Caucasian (3,911 | 98.6%), and Two or more Races (56 | 1.4%).
| Race | # Population | % Population |
| Asian | 0 | 0.0% |
| Black / African American | 0 | 0.0% |
| Hawaiian / Pacific | 0 | 0.0% |
| Hispanic or Latino | 0 | 0.0% |
| Native / Alaskan | 0 | 0.0% |
| White / Caucasian | 3,911 | 98.6% |
| Two or more Races | 56 | 1.4% |
| Some other Race | 0 | 0.0% |
| Total | 3,967 | 100.0% |
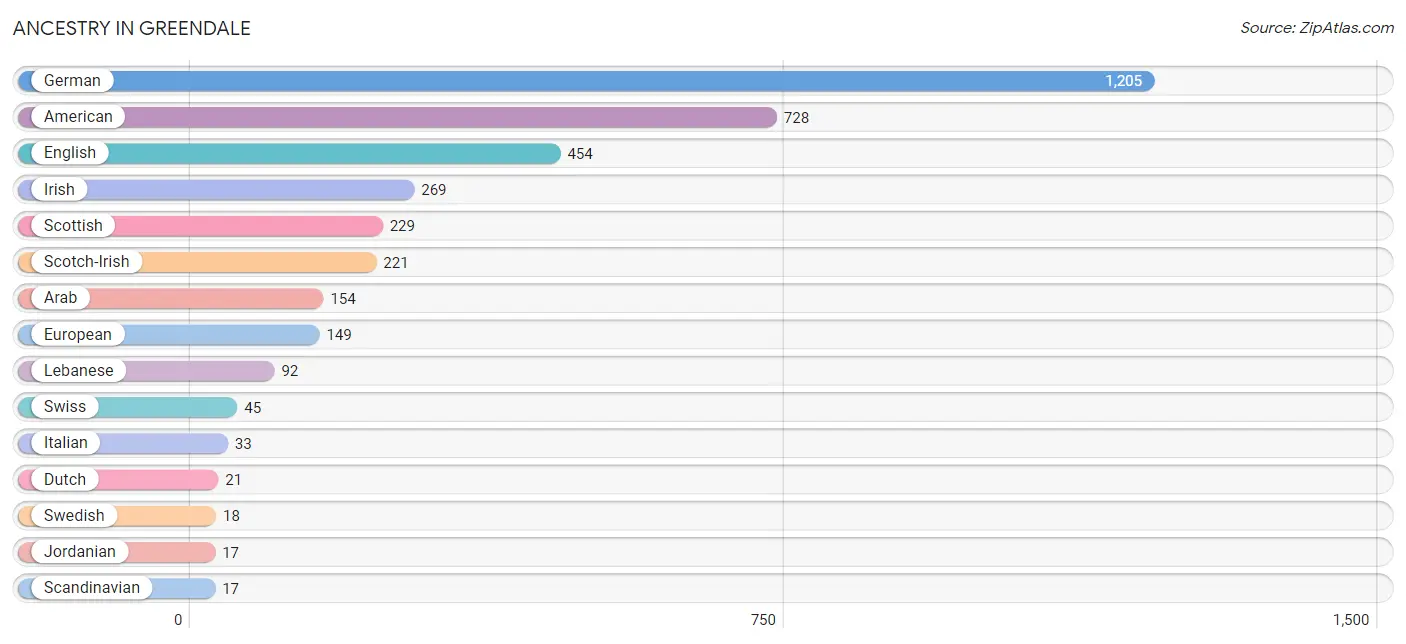
Ancestry in Greendale
The most populous ancestries reported in Greendale are German (1,205 | 30.4%), American (728 | 18.3%), English (454 | 11.4%), Irish (269 | 6.8%), and Scottish (229 | 5.8%), together accounting for 72.7% of all Greendale residents.
| Ancestry | # Population | % Population |
| American | 728 | 18.3% |
| Arab | 154 | 3.9% |
| British | 12 | 0.3% |
| Dutch | 21 | 0.5% |
| English | 454 | 11.4% |
| European | 149 | 3.8% |
| French | 12 | 0.3% |
| German | 1,205 | 30.4% |
| Irish | 269 | 6.8% |
| Italian | 33 | 0.8% |
| Jordanian | 17 | 0.4% |
| Lebanese | 92 | 2.3% |
| Scandinavian | 17 | 0.4% |
| Scotch-Irish | 221 | 5.6% |
| Scottish | 229 | 5.8% |
| Swedish | 18 | 0.4% |
| Swiss | 45 | 1.1% | View All 17 Rows |
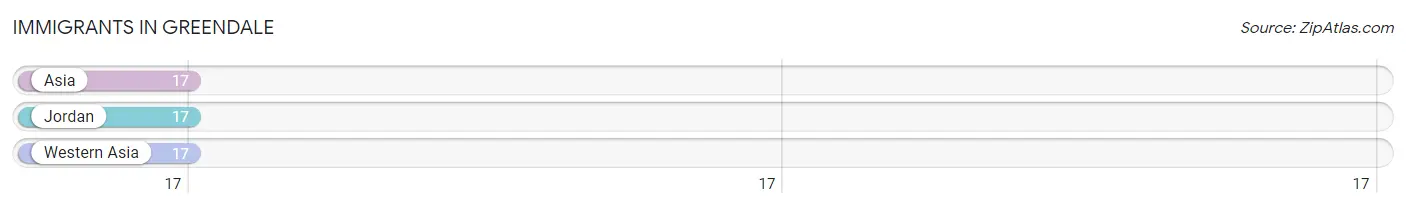
Immigrants in Greendale
The most numerous immigrant groups reported in Greendale came from Asia (17 | 0.4%), Jordan (17 | 0.4%), and Western Asia (17 | 0.4%), together accounting for 1.3% of all Greendale residents.
| Immigration Origin | # Population | % Population |
| Asia | 17 | 0.4% |
| Jordan | 17 | 0.4% |
| Western Asia | 17 | 0.4% | View All 3 Rows |
Sex and Age in Greendale
Sex and Age in Greendale
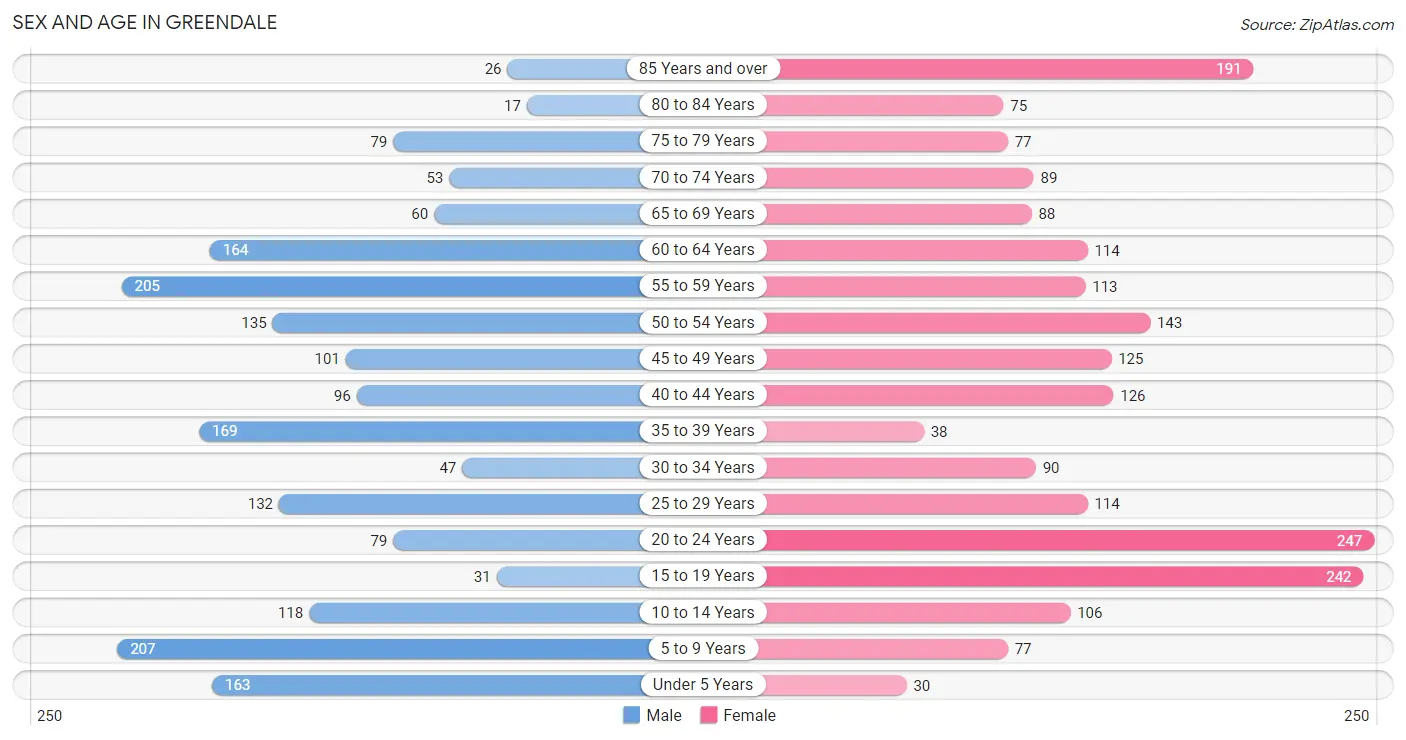
The most populous age groups in Greendale are 5 to 9 Years (207 | 11.0%) for men and 20 to 24 Years (247 | 11.8%) for women.
| Age Bracket | Male | Female |
| Under 5 Years | 163 (8.7%) | 30 (1.4%) |
| 5 to 9 Years | 207 (11.0%) | 77 (3.7%) |
| 10 to 14 Years | 118 (6.3%) | 106 (5.1%) |
| 15 to 19 Years | 31 (1.7%) | 242 (11.6%) |
| 20 to 24 Years | 79 (4.2%) | 247 (11.8%) |
| 25 to 29 Years | 132 (7.0%) | 114 (5.5%) |
| 30 to 34 Years | 47 (2.5%) | 90 (4.3%) |
| 35 to 39 Years | 169 (9.0%) | 38 (1.8%) |
| 40 to 44 Years | 96 (5.1%) | 126 (6.0%) |
| 45 to 49 Years | 101 (5.4%) | 125 (6.0%) |
| 50 to 54 Years | 135 (7.2%) | 143 (6.9%) |
| 55 to 59 Years | 205 (10.9%) | 113 (5.4%) |
| 60 to 64 Years | 164 (8.7%) | 114 (5.5%) |
| 65 to 69 Years | 60 (3.2%) | 88 (4.2%) |
| 70 to 74 Years | 53 (2.8%) | 89 (4.3%) |
| 75 to 79 Years | 79 (4.2%) | 77 (3.7%) |
| 80 to 84 Years | 17 (0.9%) | 75 (3.6%) |
| 85 Years and over | 26 (1.4%) | 191 (9.2%) |
| Total | 1,882 (100.0%) | 2,085 (100.0%) |
Families and Households in Greendale
Median Family Size in Greendale
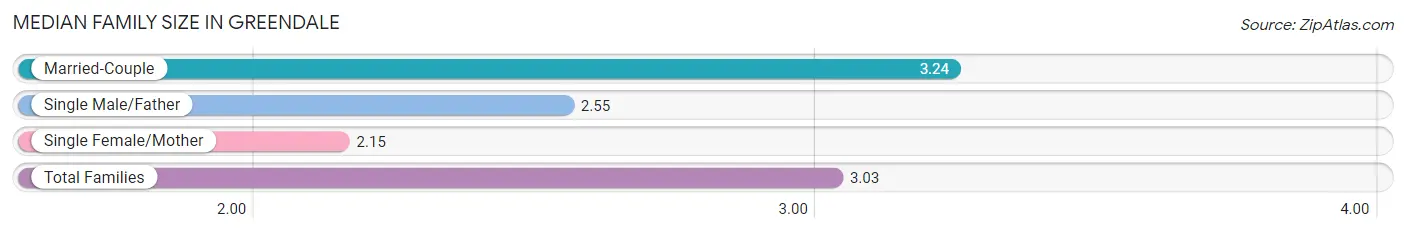
The median family size in Greendale is 3.03 persons per family, with married-couple families (804 | 78.4%) accounting for the largest median family size of 3.24 persons per family. On the other hand, single female/mother families (162 | 15.8%) represent the smallest median family size with 2.15 persons per family.
| Family Type | # Families | Family Size |
| Married-Couple | 804 (78.4%) | 3.24 |
| Single Male/Father | 60 (5.9%) | 2.55 |
| Single Female/Mother | 162 (15.8%) | 2.15 |
| Total Families | 1,026 (100.0%) | 3.03 |
Median Household Size in Greendale
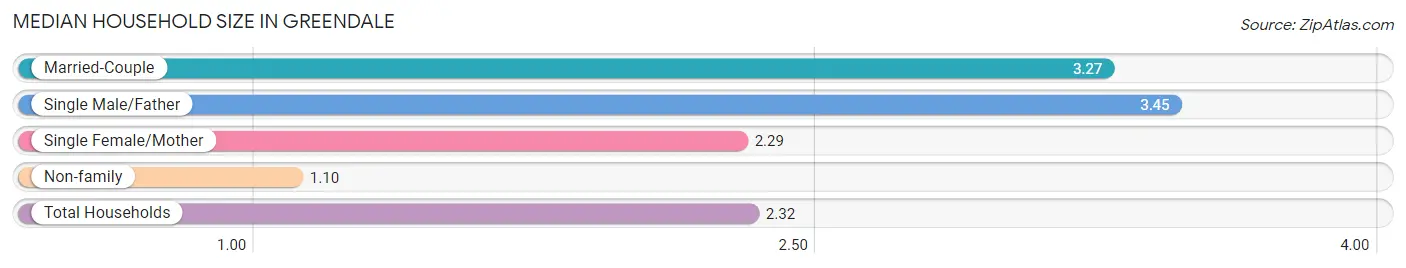
The median household size in Greendale is 2.32 persons per household, with single male/father households (60 | 3.5%) accounting for the largest median household size of 3.45 persons per household. non-family households (685 | 40.0%) represent the smallest median household size with 1.10 persons per household.
| Household Type | # Households | Household Size |
| Married-Couple | 804 (47.0%) | 3.27 |
| Single Male/Father | 60 (3.5%) | 3.45 |
| Single Female/Mother | 162 (9.5%) | 2.29 |
| Non-family | 685 (40.0%) | 1.10 |
| Total Households | 1,711 (100.0%) | 2.32 |
Household Size by Marriage Status in Greendale
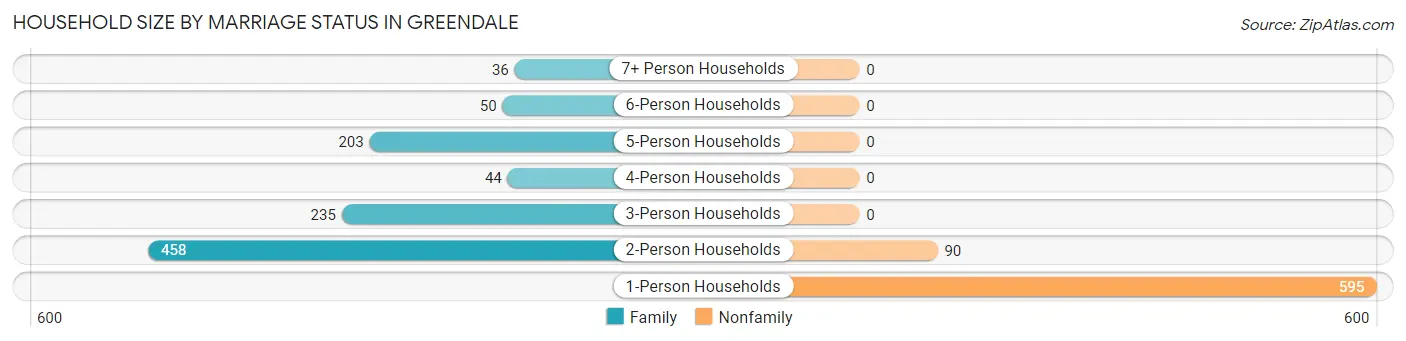
Out of a total of 1,711 households in Greendale, 1,026 (60.0%) are family households, while 685 (40.0%) are nonfamily households. The most numerous type of family households are 2-person households, comprising 458, and the most common type of nonfamily households are 1-person households, comprising 595.
| Household Size | Family Households | Nonfamily Households |
| 1-Person Households | - | 595 (34.8%) |
| 2-Person Households | 458 (26.8%) | 90 (5.3%) |
| 3-Person Households | 235 (13.7%) | 0 (0.0%) |
| 4-Person Households | 44 (2.6%) | 0 (0.0%) |
| 5-Person Households | 203 (11.9%) | 0 (0.0%) |
| 6-Person Households | 50 (2.9%) | 0 (0.0%) |
| 7+ Person Households | 36 (2.1%) | 0 (0.0%) |
| Total | 1,026 (60.0%) | 685 (40.0%) |
Female Fertility in Greendale
Fertility by Age in Greendale
Average fertility rate in Greendale is 137.0 births per 1,000 women. Women in the age bracket of 20 to 34 years have the highest fertility rate with 239.0 births per 1,000 women. Women in the age bracket of 20 to 34 years acount for 80.0% of all women with births.
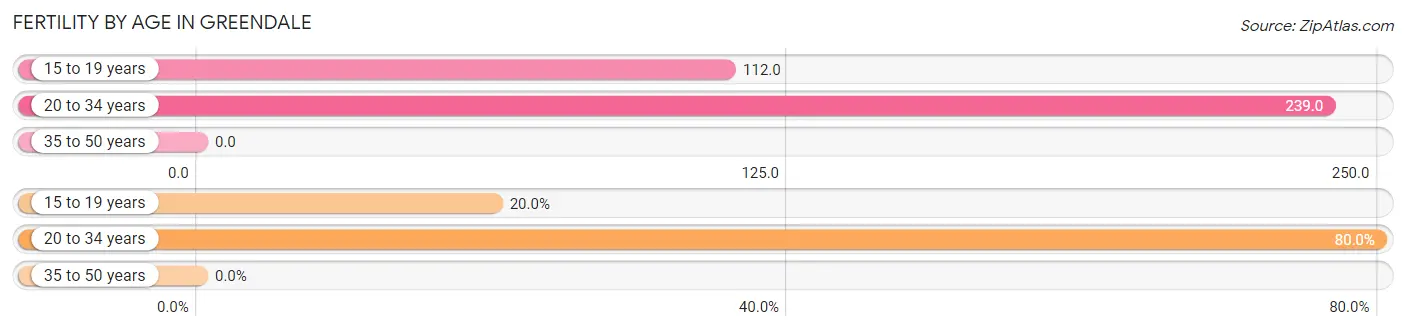
| Age Bracket | Women with Births | Births / 1,000 Women |
| 15 to 19 years | 27 (20.0%) | 112.0 |
| 20 to 34 years | 108 (80.0%) | 239.0 |
| 35 to 50 years | 0 (0.0%) | 0.0 |
| Total | 135 (100.0%) | 137.0 |
Fertility by Age by Marriage Status in Greendale
66.7% of women with births (135) in Greendale are married. The highest percentage of unmarried women with births falls into 15 to 19 years age bracket with 100.0% of them unmarried at the time of birth, while the lowest percentage of unmarried women with births belong to 20 to 34 years age bracket with 16.7% of them unmarried.
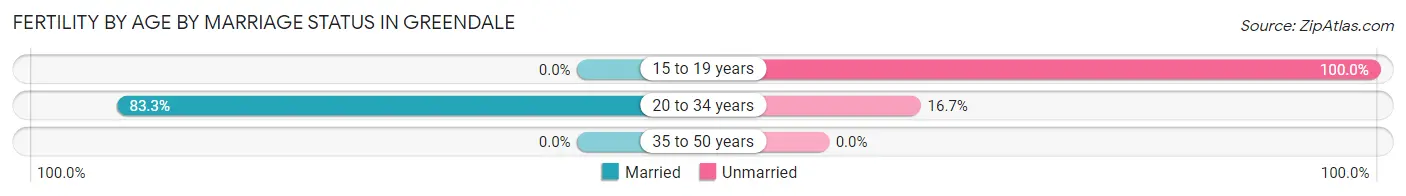
| Age Bracket | Married | Unmarried |
| 15 to 19 years | 0 (0.0%) | 27 (100.0%) |
| 20 to 34 years | 90 (83.3%) | 18 (16.7%) |
| 35 to 50 years | 0 (0.0%) | 0 (0.0%) |
| Total | 90 (66.7%) | 45 (33.3%) |
Fertility by Education in Greendale
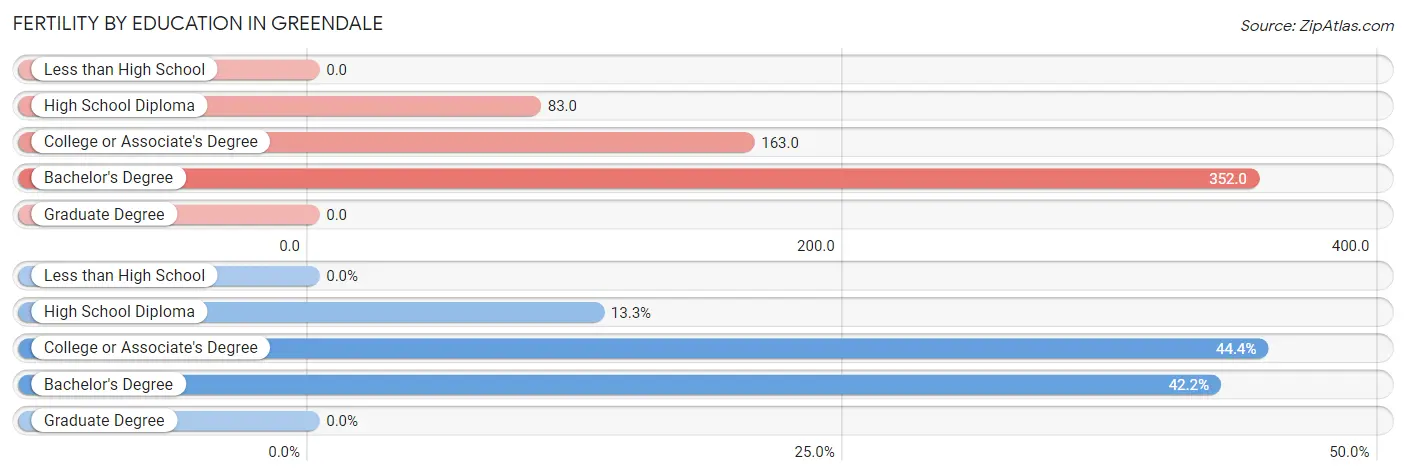
| Educational Attainment | Women with Births | Births / 1,000 Women |
| Less than High School | 0 (0.0%) | 0.0 |
| High School Diploma | 18 (13.3%) | 83.0 |
| College or Associate's Degree | 60 (44.4%) | 163.0 |
| Bachelor's Degree | 57 (42.2%) | 352.0 |
| Graduate Degree | 0 (0.0%) | 0.0 |
| Total | 135 (100.0%) | 137.0 |
Fertility by Education by Marriage Status in Greendale
33.3% of women with births in Greendale are unmarried. Women with the educational attainment of bachelor's degree are most likely to be married with 100.0% of them married at childbirth, while women with the educational attainment of high school diploma are least likely to be married with 100.0% of them unmarried at childbirth.
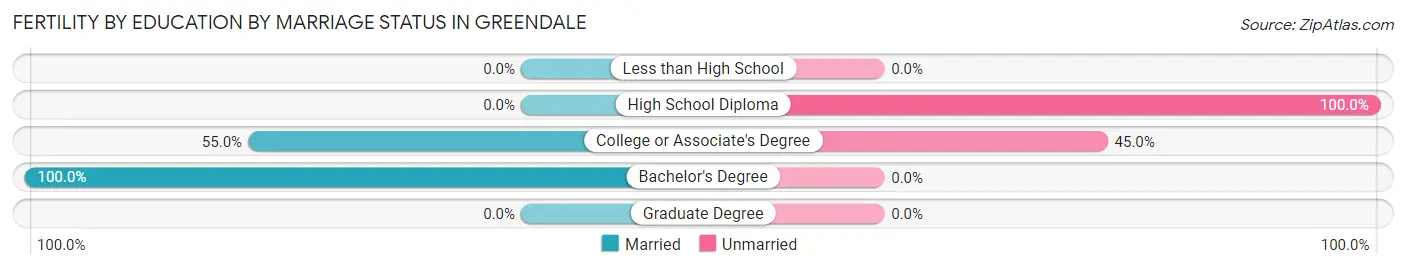
| Educational Attainment | Married | Unmarried |
| Less than High School | 0 (0.0%) | 0 (0.0%) |
| High School Diploma | 0 (0.0%) | 18 (100.0%) |
| College or Associate's Degree | 33 (55.0%) | 27 (45.0%) |
| Bachelor's Degree | 57 (100.0%) | 0 (0.0%) |
| Graduate Degree | 0 (0.0%) | 0 (0.0%) |
| Total | 90 (66.7%) | 45 (33.3%) |
Income in Greendale
Income Overview in Greendale
Per Capita Income in Greendale is $28,162, while median incomes of families and households are $94,816 and $70,668 respectively.
| Characteristic | Number | Measure |
| Per Capita Income | 3,967 | $28,162 |
| Median Family Income | 1,026 | $94,816 |
| Mean Family Income | 1,026 | $93,101 |
| Median Household Income | 1,711 | $70,668 |
| Mean Household Income | 1,711 | $67,385 |
| Income Deficit | 1,026 | $0 |
| Wage / Income Gap (%) | 3,967 | 56.72% |
| Wage / Income Gap ($) | 3,967 | 43.28¢ per $1 |
| Gini / Inequality Index | 3,967 | 0.40 |
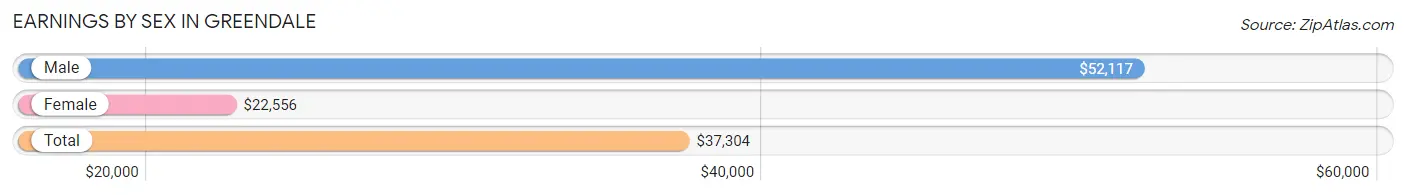
Earnings by Sex in Greendale
Average Earnings in Greendale are $37,304, $52,117 for men and $22,556 for women, a difference of 56.7%.
| Sex | Number | Average Earnings |
| Male | 966 (45.5%) | $52,117 |
| Female | 1,158 (54.5%) | $22,556 |
| Total | 2,124 (100.0%) | $37,304 |
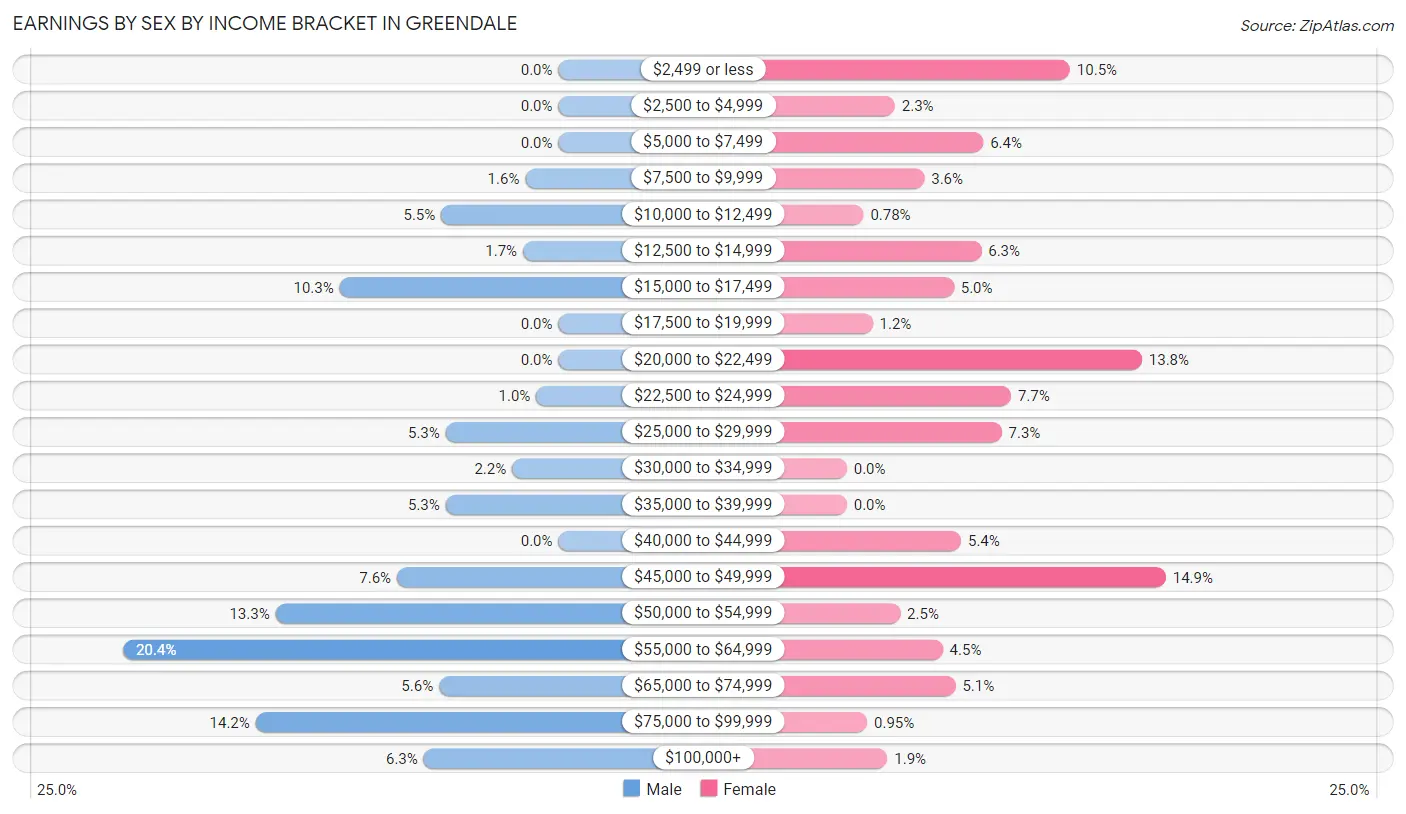
Earnings by Sex by Income Bracket in Greendale
The most common earnings brackets in Greendale are $55,000 to $64,999 for men (197 | 20.4%) and $45,000 to $49,999 for women (173 | 14.9%).
| Income | Male | Female |
| $2,499 or less | 0 (0.0%) | 121 (10.4%) |
| $2,500 to $4,999 | 0 (0.0%) | 26 (2.2%) |
| $5,000 to $7,499 | 0 (0.0%) | 74 (6.4%) |
| $7,500 to $9,999 | 15 (1.5%) | 42 (3.6%) |
| $10,000 to $12,499 | 53 (5.5%) | 9 (0.8%) |
| $12,500 to $14,999 | 16 (1.7%) | 73 (6.3%) |
| $15,000 to $17,499 | 99 (10.2%) | 58 (5.0%) |
| $17,500 to $19,999 | 0 (0.0%) | 14 (1.2%) |
| $20,000 to $22,499 | 0 (0.0%) | 160 (13.8%) |
| $22,500 to $24,999 | 10 (1.0%) | 89 (7.7%) |
| $25,000 to $29,999 | 51 (5.3%) | 84 (7.2%) |
| $30,000 to $34,999 | 21 (2.2%) | 0 (0.0%) |
| $35,000 to $39,999 | 51 (5.3%) | 0 (0.0%) |
| $40,000 to $44,999 | 0 (0.0%) | 62 (5.3%) |
| $45,000 to $49,999 | 73 (7.6%) | 173 (14.9%) |
| $50,000 to $54,999 | 128 (13.3%) | 29 (2.5%) |
| $55,000 to $64,999 | 197 (20.4%) | 52 (4.5%) |
| $65,000 to $74,999 | 54 (5.6%) | 59 (5.1%) |
| $75,000 to $99,999 | 137 (14.2%) | 11 (0.9%) |
| $100,000+ | 61 (6.3%) | 22 (1.9%) |
| Total | 966 (100.0%) | 1,158 (100.0%) |
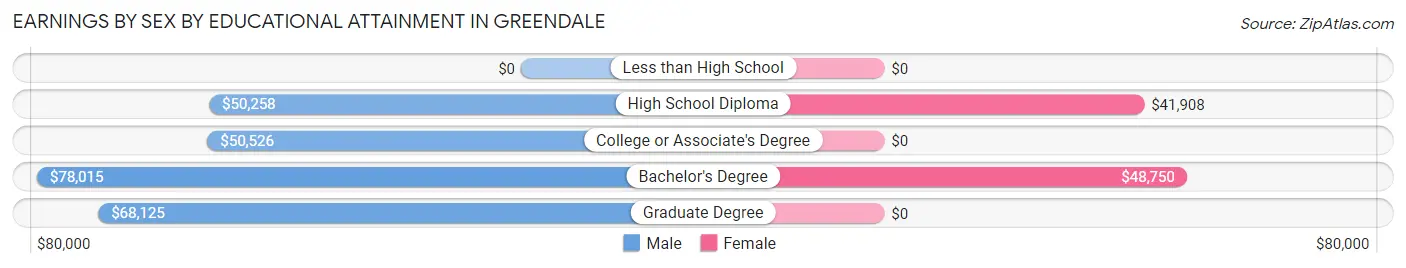
Earnings by Sex by Educational Attainment in Greendale
Average earnings in Greendale are $55,105 for men and $29,844 for women, a difference of 45.8%. Men with an educational attainment of bachelor's degree enjoy the highest average annual earnings of $78,015, while those with high school diploma education earn the least with $50,258. Women with an educational attainment of bachelor's degree earn the most with the average annual earnings of $48,750, while those with high school diploma education have the smallest earnings of $41,908.
| Educational Attainment | Male Income | Female Income |
| Less than High School | - | - |
| High School Diploma | $50,258 | $41,908 |
| College or Associate's Degree | $50,526 | $0 |
| Bachelor's Degree | $78,015 | $48,750 |
| Graduate Degree | $68,125 | $0 |
| Total | $55,105 | $29,844 |
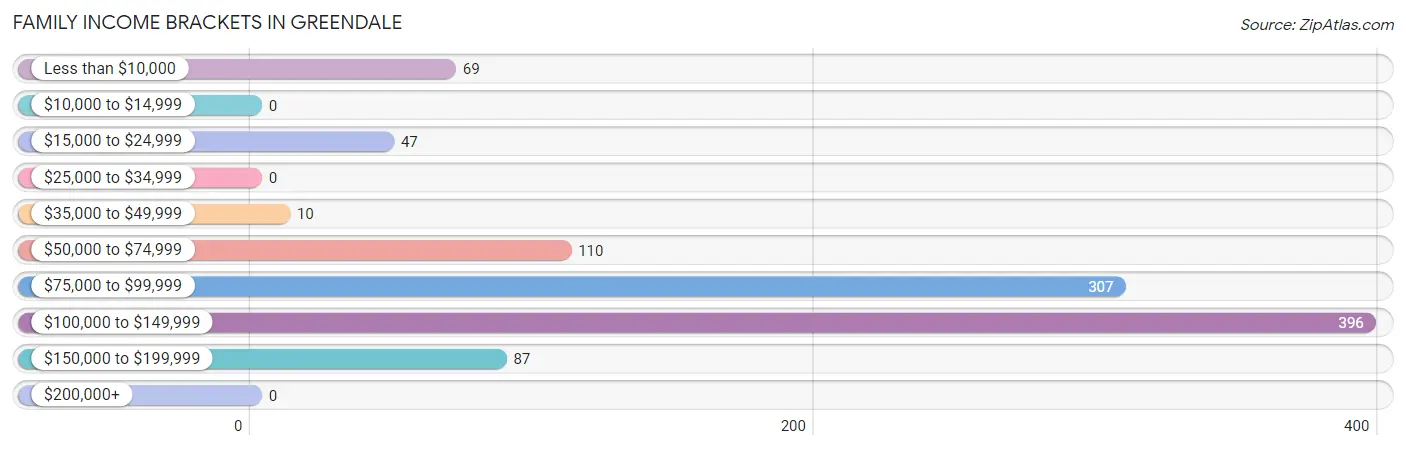
Family Income in Greendale
Family Income Brackets in Greendale
According to the Greendale family income data, there are 396 families falling into the $100,000 to $149,999 income range, which is the most common income bracket and makes up 38.6% of all families.
| Income Bracket | # Families | % Families |
| Less than $10,000 | 69 | 6.7% |
| $10,000 to $14,999 | 0 | 0.0% |
| $15,000 to $24,999 | 47 | 4.6% |
| $25,000 to $34,999 | 0 | 0.0% |
| $35,000 to $49,999 | 10 | 1.0% |
| $50,000 to $74,999 | 110 | 10.7% |
| $75,000 to $99,999 | 307 | 29.9% |
| $100,000 to $149,999 | 396 | 38.6% |
| $150,000 to $199,999 | 87 | 8.5% |
| $200,000+ | 0 | 0.0% |
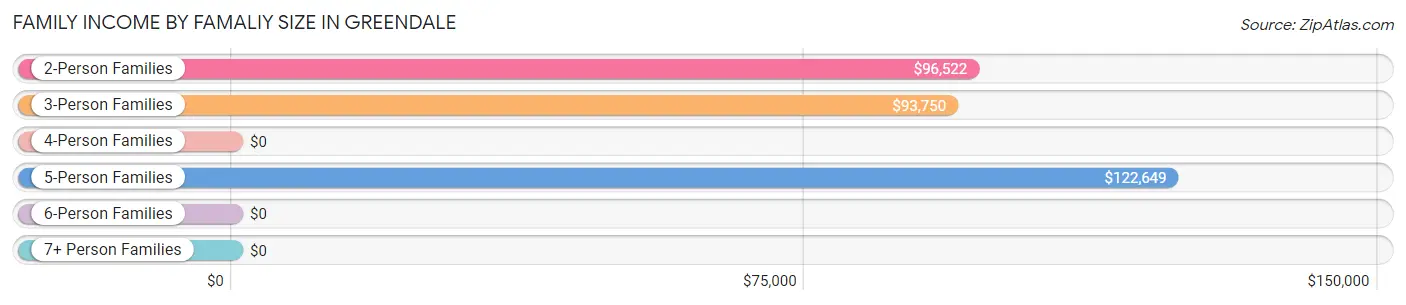
Family Income by Famaliy Size in Greendale
5-person families (173 | 16.9%) account for the highest median family income in Greendale with $122,649 per family, while 2-person families (526 | 51.3%) have the highest median income of $48,261 per family member.
| Income Bracket | # Families | Median Income |
| 2-Person Families | 526 (51.3%) | $96,522 |
| 3-Person Families | 167 (16.3%) | $93,750 |
| 4-Person Families | 74 (7.2%) | $0 |
| 5-Person Families | 173 (16.9%) | $122,649 |
| 6-Person Families | 50 (4.9%) | $0 |
| 7+ Person Families | 36 (3.5%) | $0 |
| Total | 1,026 (100.0%) | $94,816 |
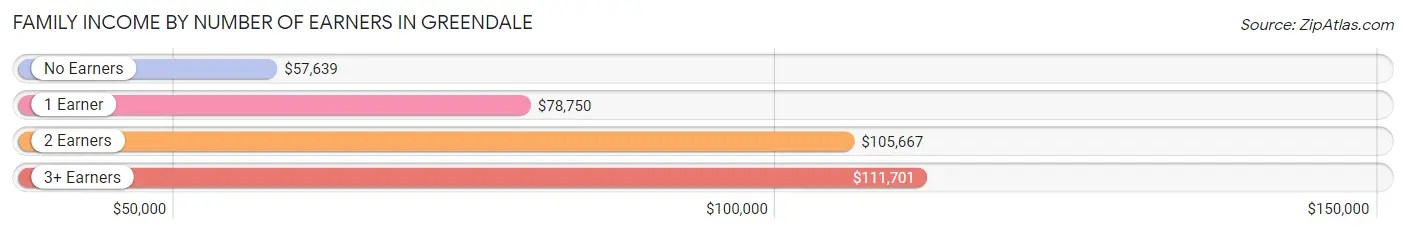
Family Income by Number of Earners in Greendale
The median family income in Greendale is $94,816, with families comprising 3+ earners (241) having the highest median family income of $111,701, while families with no earners (177) have the lowest median family income of $57,639, accounting for 23.5% and 17.2% of families, respectively.
| Number of Earners | # Families | Median Income |
| No Earners | 177 (17.2%) | $57,639 |
| 1 Earner | 172 (16.8%) | $78,750 |
| 2 Earners | 436 (42.5%) | $105,667 |
| 3+ Earners | 241 (23.5%) | $111,701 |
| Total | 1,026 (100.0%) | $94,816 |
Household Income in Greendale
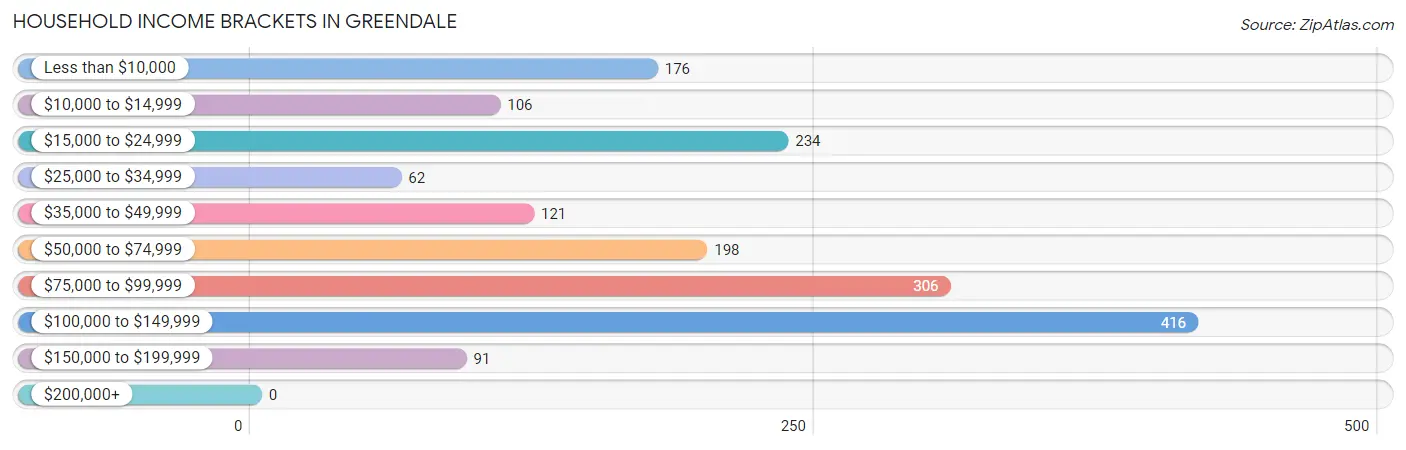
Household Income Brackets in Greendale
With 416 households falling in the category, the $100,000 to $149,999 income range is the most frequent in Greendale, accounting for 24.3% of all households.
| Income Bracket | # Households | % Households |
| Less than $10,000 | 176 | 10.3% |
| $10,000 to $14,999 | 106 | 6.2% |
| $15,000 to $24,999 | 234 | 13.7% |
| $25,000 to $34,999 | 62 | 3.6% |
| $35,000 to $49,999 | 121 | 7.1% |
| $50,000 to $74,999 | 198 | 11.6% |
| $75,000 to $99,999 | 306 | 17.9% |
| $100,000 to $149,999 | 416 | 24.3% |
| $150,000 to $199,999 | 91 | 5.3% |
| $200,000+ | 0 | 0.0% |
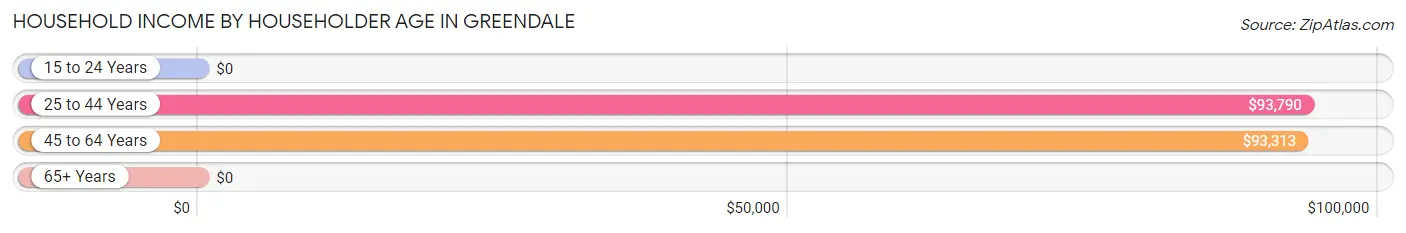
Household Income by Householder Age in Greendale
The median household income in Greendale is $70,668, with the highest median household income of $93,790 found in the 25 to 44 years age bracket for the primary householder. A total of 358 households (20.9%) fall into this category. Meanwhile, the 15 to 24 years age bracket for the primary householder has the lowest median household income of $0, with 105 households (6.1%) in this group.
| Income Bracket | # Households | Median Income |
| 15 to 24 Years | 105 (6.1%) | $0 |
| 25 to 44 Years | 358 (20.9%) | $93,790 |
| 45 to 64 Years | 697 (40.7%) | $93,313 |
| 65+ Years | 551 (32.2%) | $0 |
| Total | 1,711 (100.0%) | $70,668 |
Poverty in Greendale
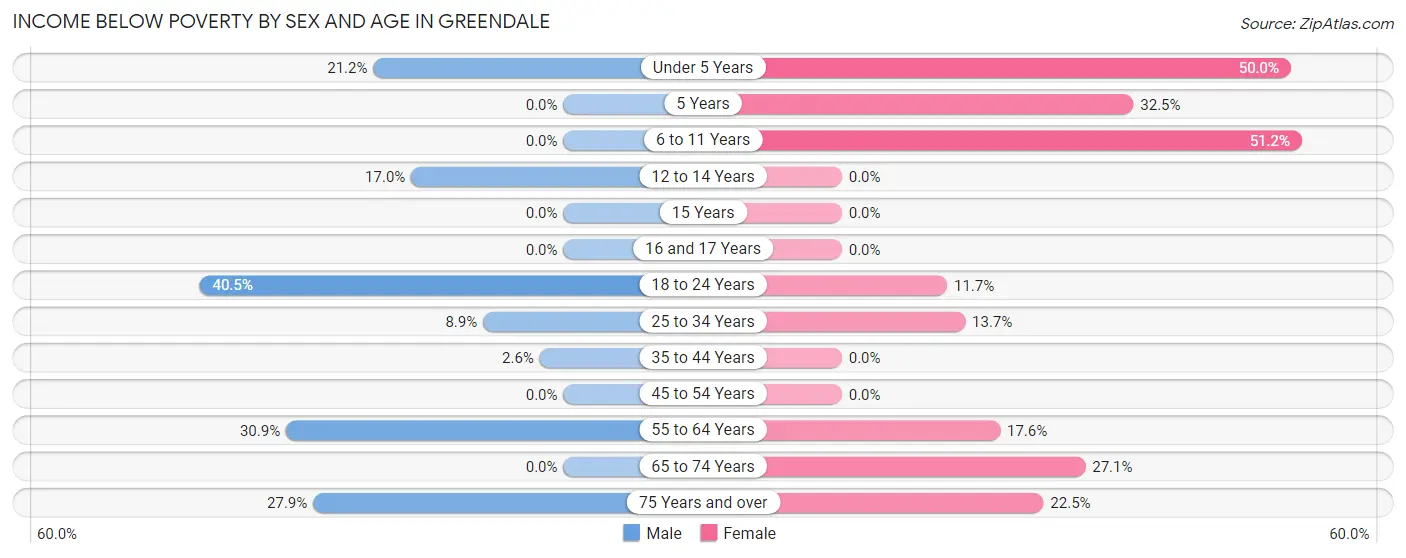
Income Below Poverty by Sex and Age in Greendale
With 13.6% poverty level for males and 14.3% for females among the residents of Greendale, 18 to 24 year old males and 6 to 11 year old females are the most vulnerable to poverty, with 32 males (40.5%) and 21 females (51.2%) in their respective age groups living below the poverty level.
| Age Bracket | Male | Female |
| Under 5 Years | 29 (21.2%) | 15 (50.0%) |
| 5 Years | 0 (0.0%) | 25 (32.5%) |
| 6 to 11 Years | 0 (0.0%) | 21 (51.2%) |
| 12 to 14 Years | 20 (17.0%) | 0 (0.0%) |
| 15 Years | 0 (0.0%) | 0 (0.0%) |
| 16 and 17 Years | 0 (0.0%) | 0 (0.0%) |
| 18 to 24 Years | 32 (40.5%) | 45 (11.7%) |
| 25 to 34 Years | 16 (8.9%) | 28 (13.7%) |
| 35 to 44 Years | 7 (2.6%) | 0 (0.0%) |
| 45 to 54 Years | 0 (0.0%) | 0 (0.0%) |
| 55 to 64 Years | 114 (30.9%) | 40 (17.6%) |
| 65 to 74 Years | 0 (0.0%) | 48 (27.1%) |
| 75 Years and over | 34 (27.9%) | 77 (22.5%) |
| Total | 252 (13.6%) | 299 (14.3%) |
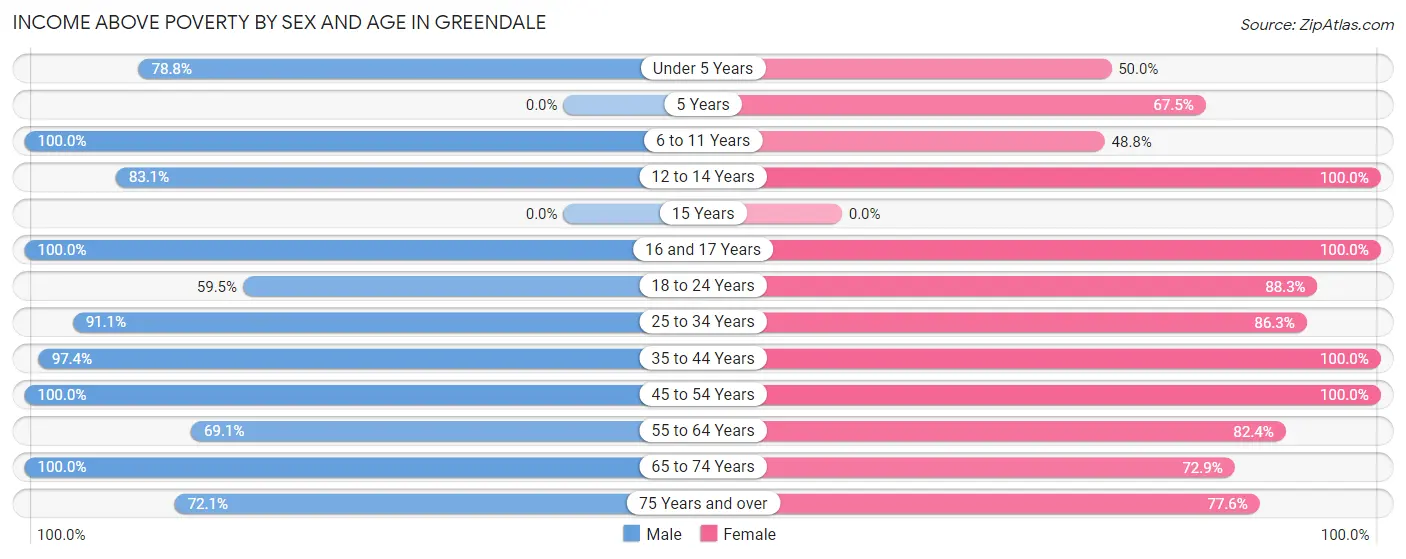
Income Above Poverty by Sex and Age in Greendale
According to the poverty statistics in Greendale, males aged 6 to 11 years and females aged 12 to 14 years are the age groups that are most secure financially, with 100.0% of males and 100.0% of females in these age groups living above the poverty line.
| Age Bracket | Male | Female |
| Under 5 Years | 108 (78.8%) | 15 (50.0%) |
| 5 Years | 0 (0.0%) | 52 (67.5%) |
| 6 to 11 Years | 207 (100.0%) | 20 (48.8%) |
| 12 to 14 Years | 98 (83.1%) | 65 (100.0%) |
| 15 Years | 0 (0.0%) | 0 (0.0%) |
| 16 and 17 Years | 31 (100.0%) | 105 (100.0%) |
| 18 to 24 Years | 47 (59.5%) | 339 (88.3%) |
| 25 to 34 Years | 163 (91.1%) | 176 (86.3%) |
| 35 to 44 Years | 258 (97.4%) | 164 (100.0%) |
| 45 to 54 Years | 236 (100.0%) | 268 (100.0%) |
| 55 to 64 Years | 255 (69.1%) | 187 (82.4%) |
| 65 to 74 Years | 113 (100.0%) | 129 (72.9%) |
| 75 Years and over | 88 (72.1%) | 266 (77.5%) |
| Total | 1,604 (86.4%) | 1,786 (85.7%) |
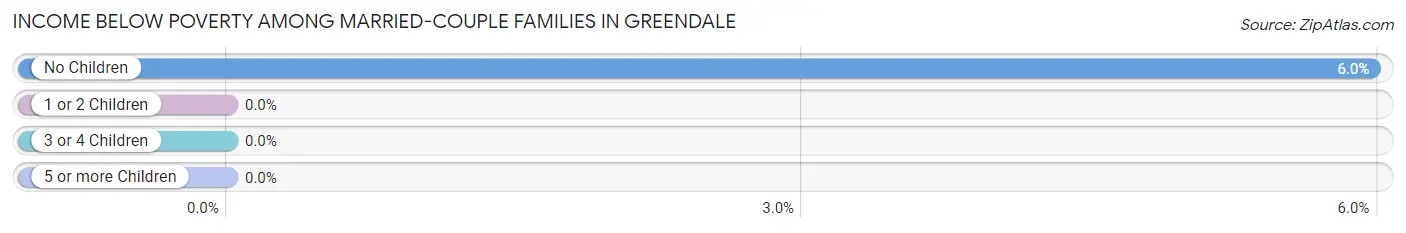
Income Below Poverty Among Married-Couple Families in Greendale
The poverty statistics for married-couple families in Greendale show that 3.1% or 25 of the total 804 families live below the poverty line. Families with no children have the highest poverty rate of 6.0%, comprising of 25 families. On the other hand, families with 1 or 2 children have the lowest poverty rate of 0.0%, which includes 0 families.
| Children | Above Poverty | Below Poverty |
| No Children | 394 (94.0%) | 25 (6.0%) |
| 1 or 2 Children | 316 (100.0%) | 0 (0.0%) |
| 3 or 4 Children | 69 (100.0%) | 0 (0.0%) |
| 5 or more Children | 0 (0.0%) | 0 (0.0%) |
| Total | 779 (96.9%) | 25 (3.1%) |
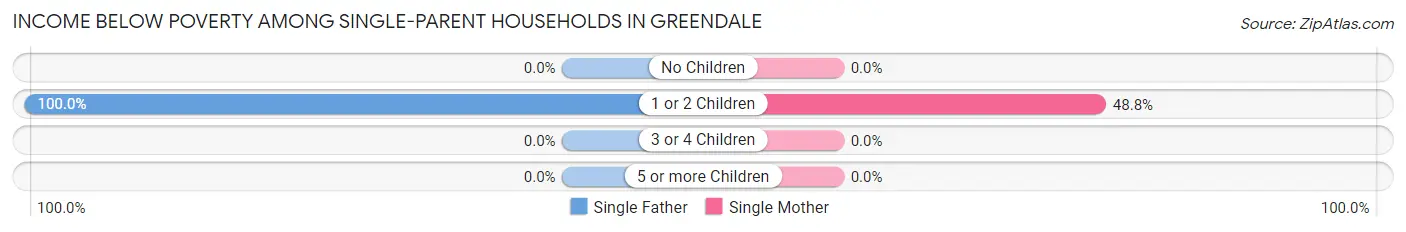
Income Below Poverty Among Single-Parent Households in Greendale
According to the poverty data in Greendale, 91.7% or 55 single-father households and 13.0% or 21 single-mother households are living below the poverty line. Among single-father households, those with 1 or 2 children have the highest poverty rate, with 55 households (100.0%) experiencing poverty. Likewise, among single-mother households, those with 1 or 2 children have the highest poverty rate, with 21 households (48.8%) falling below the poverty line.
| Children | Single Father | Single Mother |
| No Children | 0 (0.0%) | 0 (0.0%) |
| 1 or 2 Children | 55 (100.0%) | 21 (48.8%) |
| 3 or 4 Children | 0 (0.0%) | 0 (0.0%) |
| 5 or more Children | 0 (0.0%) | 0 (0.0%) |
| Total | 55 (91.7%) | 21 (13.0%) |
Income Below Poverty Among Married-Couple vs Single-Parent Households in Greendale
The poverty data for Greendale shows that 25 of the married-couple family households (3.1%) and 76 of the single-parent households (34.2%) are living below the poverty level. Within the married-couple family households, those with no children have the highest poverty rate, with 25 households (6.0%) falling below the poverty line. Among the single-parent households, those with 1 or 2 children have the highest poverty rate, with 76 household (77.5%) living below poverty.
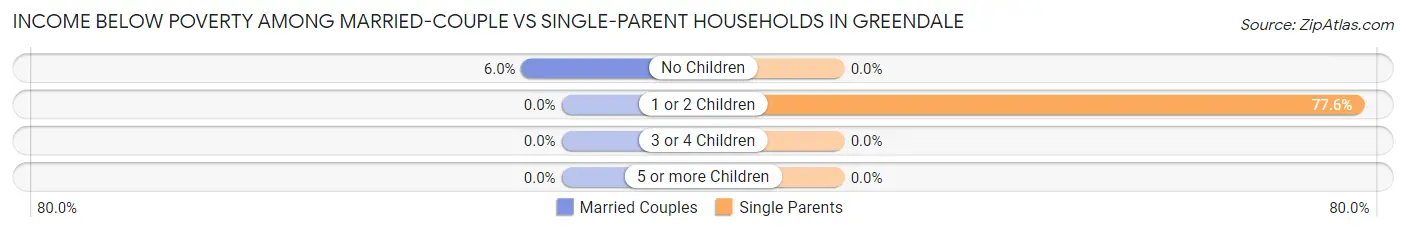
| Children | Married-Couple Families | Single-Parent Households |
| No Children | 25 (6.0%) | 0 (0.0%) |
| 1 or 2 Children | 0 (0.0%) | 76 (77.5%) |
| 3 or 4 Children | 0 (0.0%) | 0 (0.0%) |
| 5 or more Children | 0 (0.0%) | 0 (0.0%) |
| Total | 25 (3.1%) | 76 (34.2%) |
Employment Characteristics in Greendale
Employment by Class of Employer in Greendale
Among the 1,866 employed individuals in Greendale, private company employees (1,313 | 70.4%), local government employees (286 | 15.3%), and not-for-profit organizations (150 | 8.0%) make up the most common classes of employment.

| Employer Class | # Employees | % Employees |
| Private Company Employees | 1,313 | 70.4% |
| Self-Employed (Incorporated) | 8 | 0.4% |
| Self-Employed (Not Incorporated) | 68 | 3.6% |
| Not-for-profit Organizations | 150 | 8.0% |
| Local Government Employees | 286 | 15.3% |
| State Government Employees | 24 | 1.3% |
| Federal Government Employees | 17 | 0.9% |
| Unpaid Family Workers | 0 | 0.0% |
| Total | 1,866 | 100.0% |
Employment Status by Age in Greendale
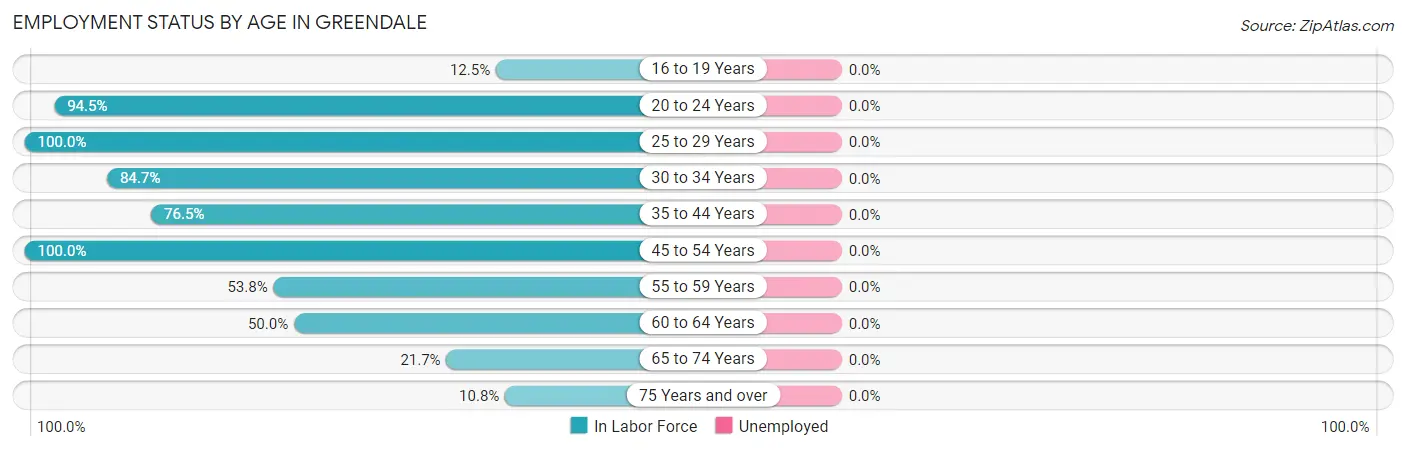
| Age Bracket | In Labor Force | Unemployed |
| 16 to 19 Years | 34 (12.5%) | 0 (0.0%) |
| 20 to 24 Years | 308 (94.5%) | 0 (0.0%) |
| 25 to 29 Years | 246 (100.0%) | 0 (0.0%) |
| 30 to 34 Years | 116 (84.7%) | 0 (0.0%) |
| 35 to 44 Years | 328 (76.5%) | 0 (0.0%) |
| 45 to 54 Years | 504 (100.0%) | 0 (0.0%) |
| 55 to 59 Years | 171 (53.8%) | 0 (0.0%) |
| 60 to 64 Years | 139 (50.0%) | 0 (0.0%) |
| 65 to 74 Years | 63 (21.7%) | 0 (0.0%) |
| 75 Years and over | 50 (10.8%) | 0 (0.0%) |
| Total | 1,960 (60.0%) | 0 (0.0%) |
Employment Status by Educational Attainment in Greendale
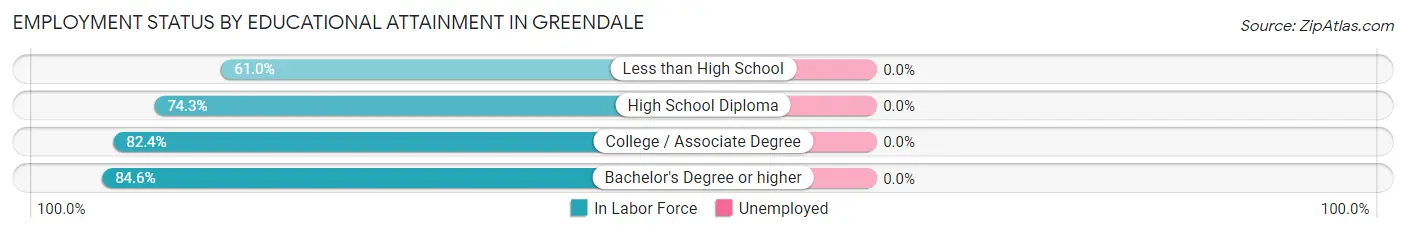
| Educational Attainment | In Labor Force | Unemployed |
| Less than High School | 75 (61.0%) | 0 (0.0%) |
| High School Diploma | 530 (74.3%) | 0 (0.0%) |
| College / Associate Degree | 406 (82.4%) | 0 (0.0%) |
| Bachelor's Degree or higher | 493 (84.6%) | 0 (0.0%) |
| Total | 1,505 (78.7%) | 0 (0.0%) |
Employment Occupations by Sex in Greendale
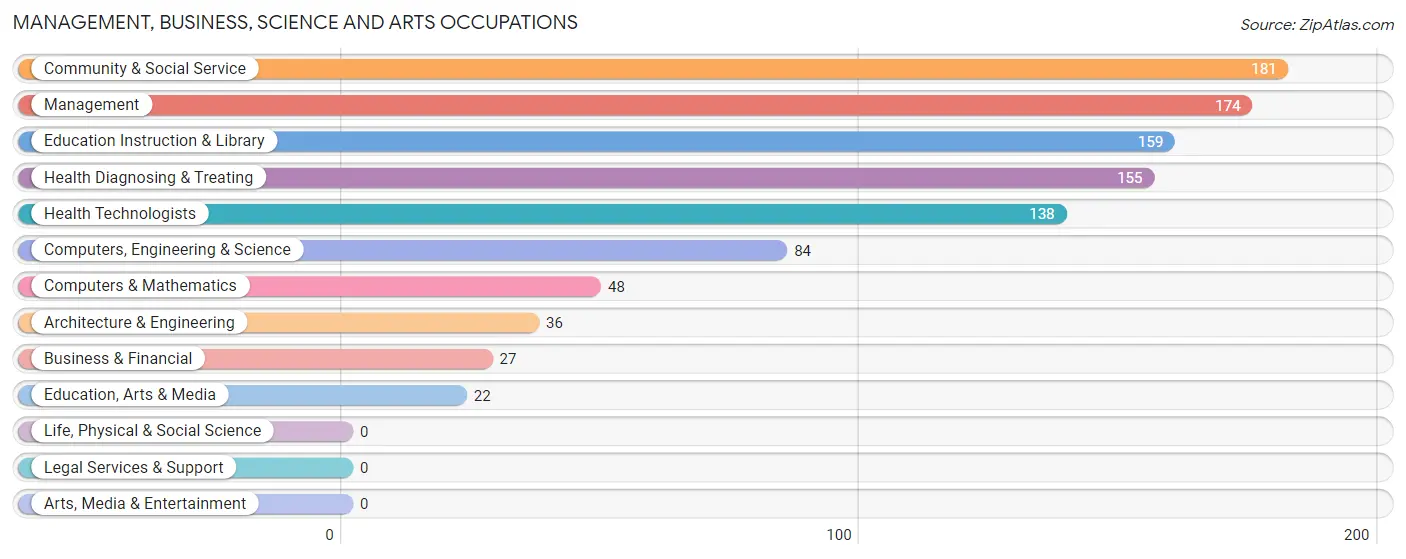
Management, Business, Science and Arts Occupations
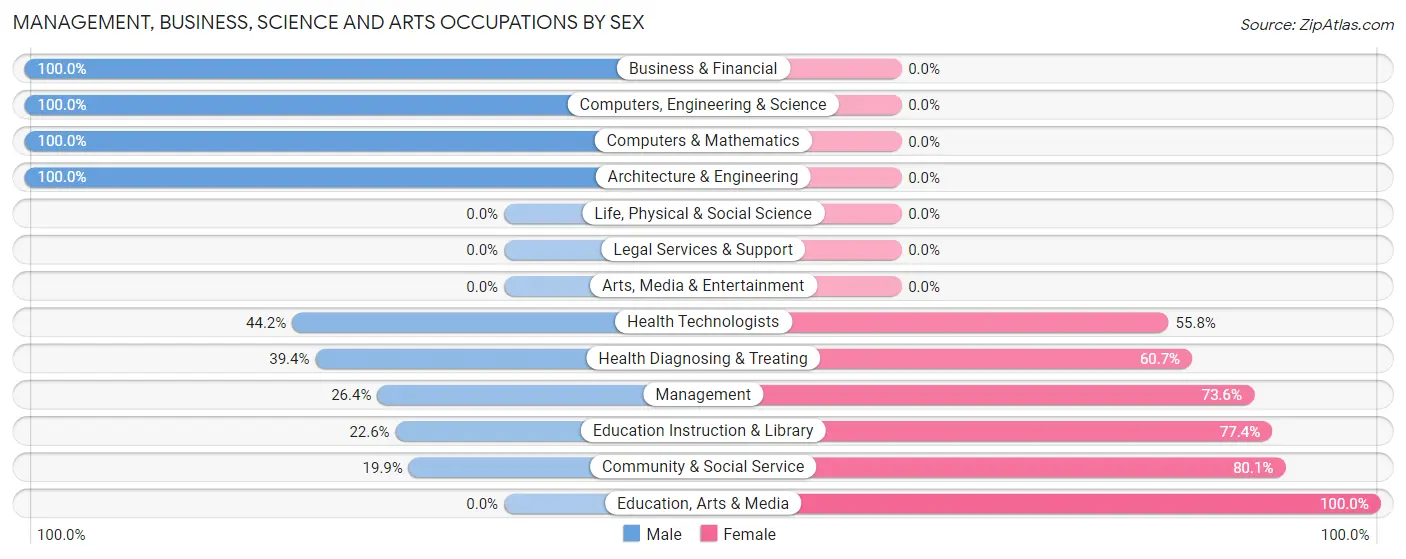
The most common Management, Business, Science and Arts occupations in Greendale are Community & Social Service (181 | 9.2%), Management (174 | 8.9%), Education Instruction & Library (159 | 8.1%), Health Diagnosing & Treating (155 | 7.9%), and Health Technologists (138 | 7.0%).
Management, Business, Science and Arts Occupations by Sex
Within the Management, Business, Science and Arts occupations in Greendale, the most male-oriented occupations are Business & Financial (100.0%), Computers, Engineering & Science (100.0%), and Computers & Mathematics (100.0%), while the most female-oriented occupations are Education, Arts & Media (100.0%), Community & Social Service (80.1%), and Education Instruction & Library (77.4%).
| Occupation | Male | Female |
| Management | 46 (26.4%) | 128 (73.6%) |
| Business & Financial | 27 (100.0%) | 0 (0.0%) |
| Computers, Engineering & Science | 84 (100.0%) | 0 (0.0%) |
| Computers & Mathematics | 48 (100.0%) | 0 (0.0%) |
| Architecture & Engineering | 36 (100.0%) | 0 (0.0%) |
| Life, Physical & Social Science | 0 (0.0%) | 0 (0.0%) |
| Community & Social Service | 36 (19.9%) | 145 (80.1%) |
| Education, Arts & Media | 0 (0.0%) | 22 (100.0%) |
| Legal Services & Support | 0 (0.0%) | 0 (0.0%) |
| Education Instruction & Library | 36 (22.6%) | 123 (77.4%) |
| Arts, Media & Entertainment | 0 (0.0%) | 0 (0.0%) |
| Health Diagnosing & Treating | 61 (39.4%) | 94 (60.7%) |
| Health Technologists | 61 (44.2%) | 77 (55.8%) |
| Total (Category) | 254 (40.9%) | 367 (59.1%) |
| Total (Overall) | 896 (45.7%) | 1,063 (54.3%) |
Services Occupations
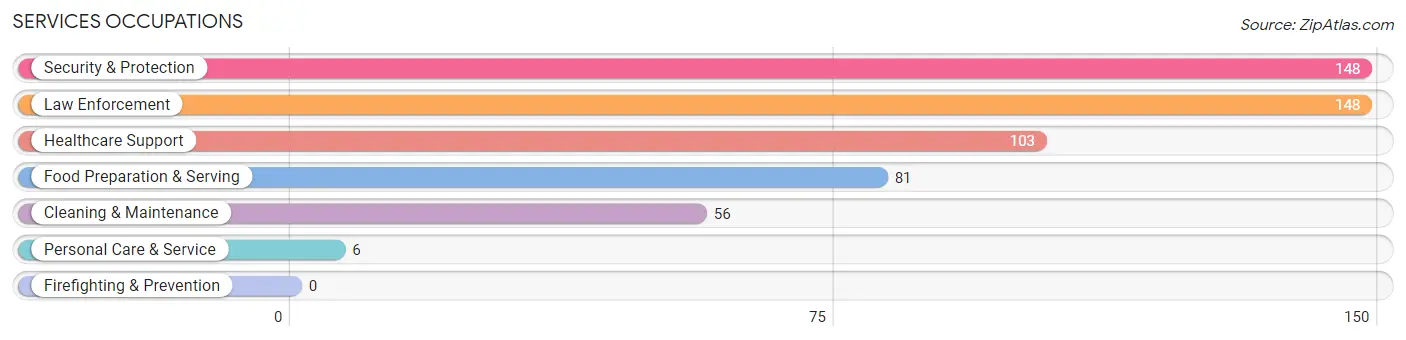
The most common Services occupations in Greendale are Security & Protection (148 | 7.5%), Law Enforcement (148 | 7.5%), Healthcare Support (103 | 5.3%), Food Preparation & Serving (81 | 4.1%), and Cleaning & Maintenance (56 | 2.9%).
Services Occupations by Sex
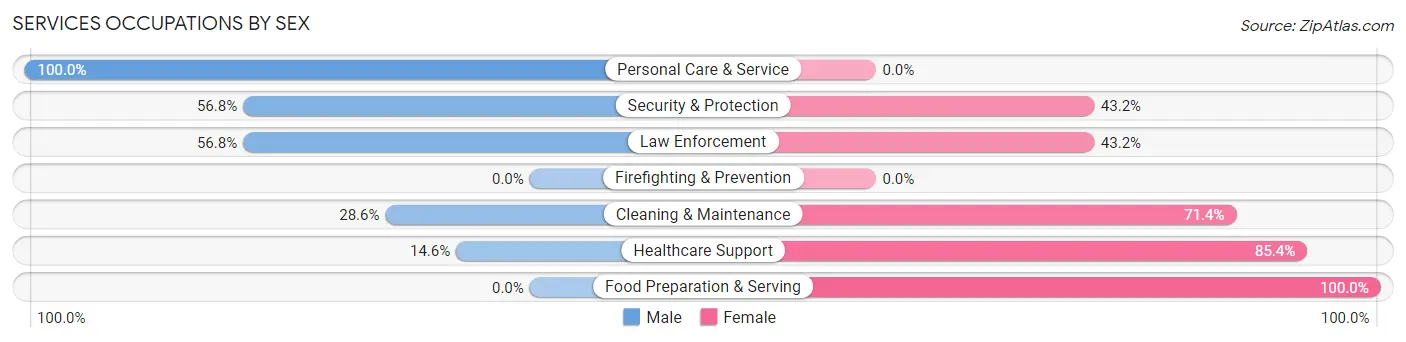
Within the Services occupations in Greendale, the most male-oriented occupations are Personal Care & Service (100.0%), Security & Protection (56.8%), and Law Enforcement (56.8%), while the most female-oriented occupations are Food Preparation & Serving (100.0%), Healthcare Support (85.4%), and Cleaning & Maintenance (71.4%).
| Occupation | Male | Female |
| Healthcare Support | 15 (14.6%) | 88 (85.4%) |
| Security & Protection | 84 (56.8%) | 64 (43.2%) |
| Firefighting & Prevention | 0 (0.0%) | 0 (0.0%) |
| Law Enforcement | 84 (56.8%) | 64 (43.2%) |
| Food Preparation & Serving | 0 (0.0%) | 81 (100.0%) |
| Cleaning & Maintenance | 16 (28.6%) | 40 (71.4%) |
| Personal Care & Service | 6 (100.0%) | 0 (0.0%) |
| Total (Category) | 121 (30.7%) | 273 (69.3%) |
| Total (Overall) | 896 (45.7%) | 1,063 (54.3%) |
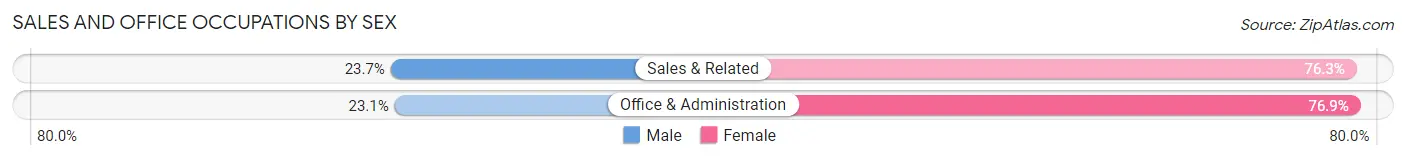
Sales and Office Occupations
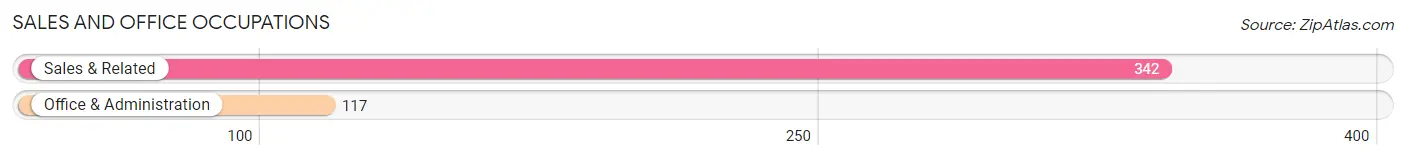
The most common Sales and Office occupations in Greendale are Sales & Related (342 | 17.5%), and Office & Administration (117 | 6.0%).
Sales and Office Occupations by Sex
| Occupation | Male | Female |
| Sales & Related | 81 (23.7%) | 261 (76.3%) |
| Office & Administration | 27 (23.1%) | 90 (76.9%) |
| Total (Category) | 108 (23.5%) | 351 (76.5%) |
| Total (Overall) | 896 (45.7%) | 1,063 (54.3%) |
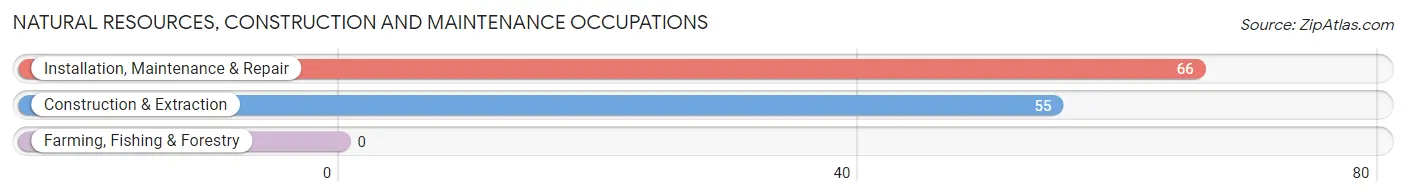
Natural Resources, Construction and Maintenance Occupations
The most common Natural Resources, Construction and Maintenance occupations in Greendale are Installation, Maintenance & Repair (66 | 3.4%), and Construction & Extraction (55 | 2.8%).
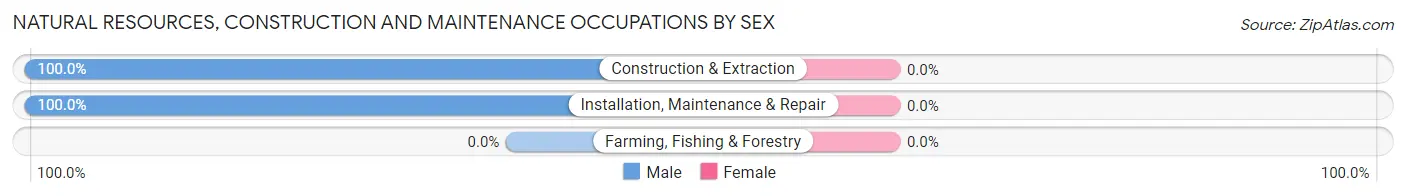
Natural Resources, Construction and Maintenance Occupations by Sex
| Occupation | Male | Female |
| Farming, Fishing & Forestry | 0 (0.0%) | 0 (0.0%) |
| Construction & Extraction | 55 (100.0%) | 0 (0.0%) |
| Installation, Maintenance & Repair | 66 (100.0%) | 0 (0.0%) |
| Total (Category) | 121 (100.0%) | 0 (0.0%) |
| Total (Overall) | 896 (45.7%) | 1,063 (54.3%) |
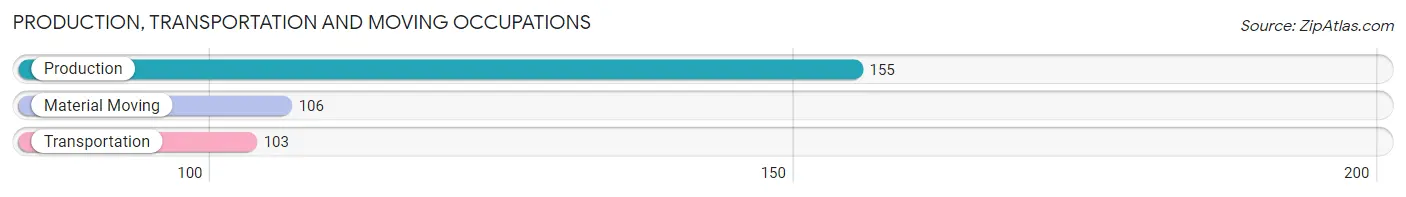
Production, Transportation and Moving Occupations
The most common Production, Transportation and Moving occupations in Greendale are Production (155 | 7.9%), Material Moving (106 | 5.4%), and Transportation (103 | 5.3%).
Production, Transportation and Moving Occupations by Sex
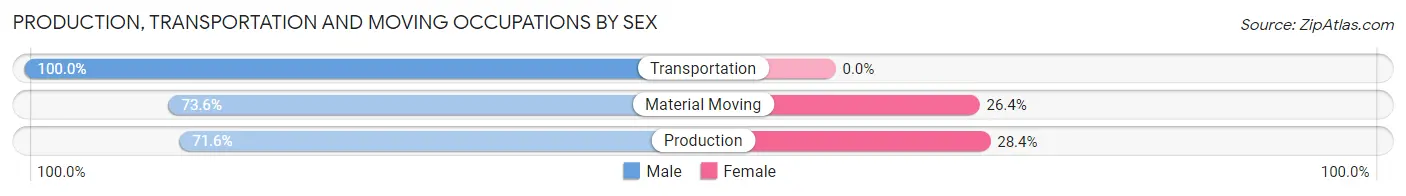
| Occupation | Male | Female |
| Production | 111 (71.6%) | 44 (28.4%) |
| Transportation | 103 (100.0%) | 0 (0.0%) |
| Material Moving | 78 (73.6%) | 28 (26.4%) |
| Total (Category) | 292 (80.2%) | 72 (19.8%) |
| Total (Overall) | 896 (45.7%) | 1,063 (54.3%) |
Employment Industries by Sex in Greendale
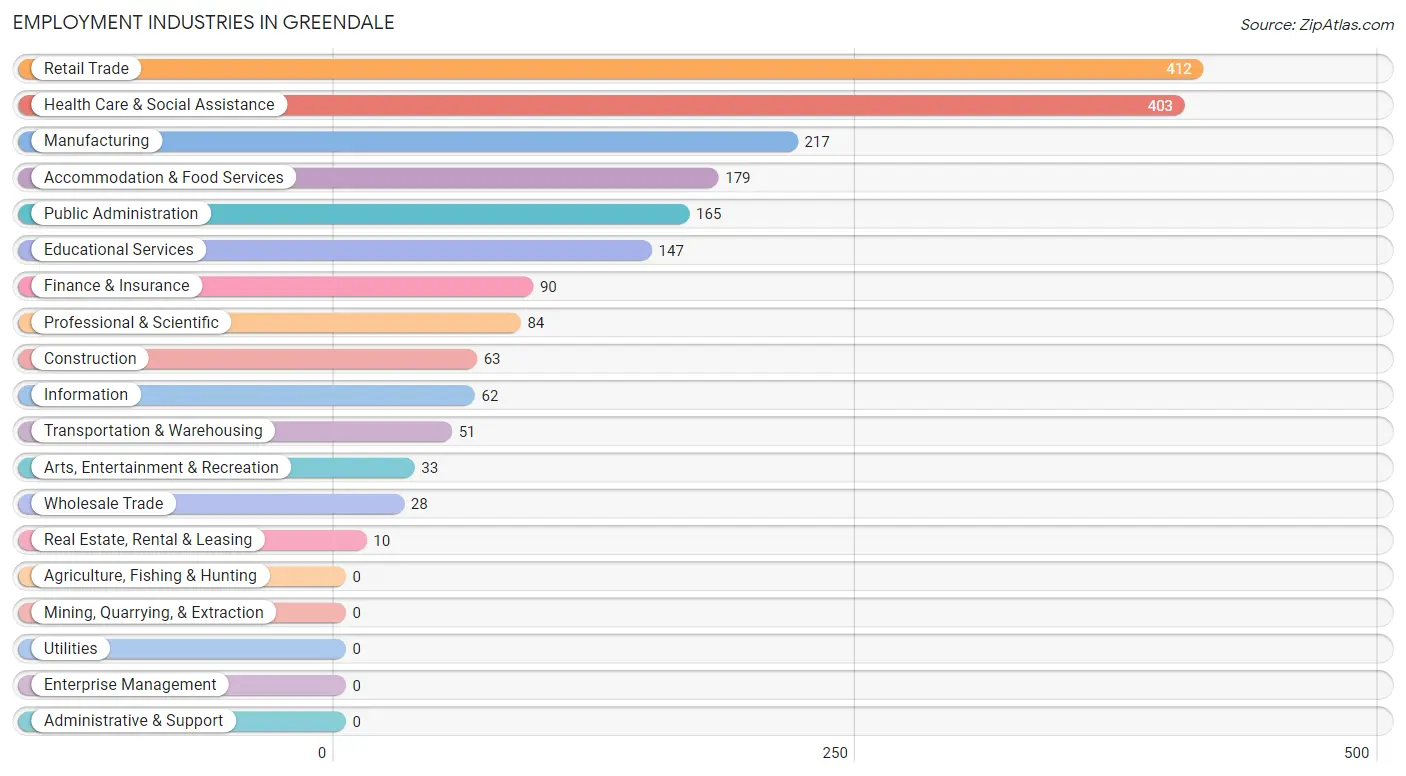
Employment Industries in Greendale
The major employment industries in Greendale include Retail Trade (412 | 21.0%), Health Care & Social Assistance (403 | 20.6%), Manufacturing (217 | 11.1%), Accommodation & Food Services (179 | 9.1%), and Public Administration (165 | 8.4%).
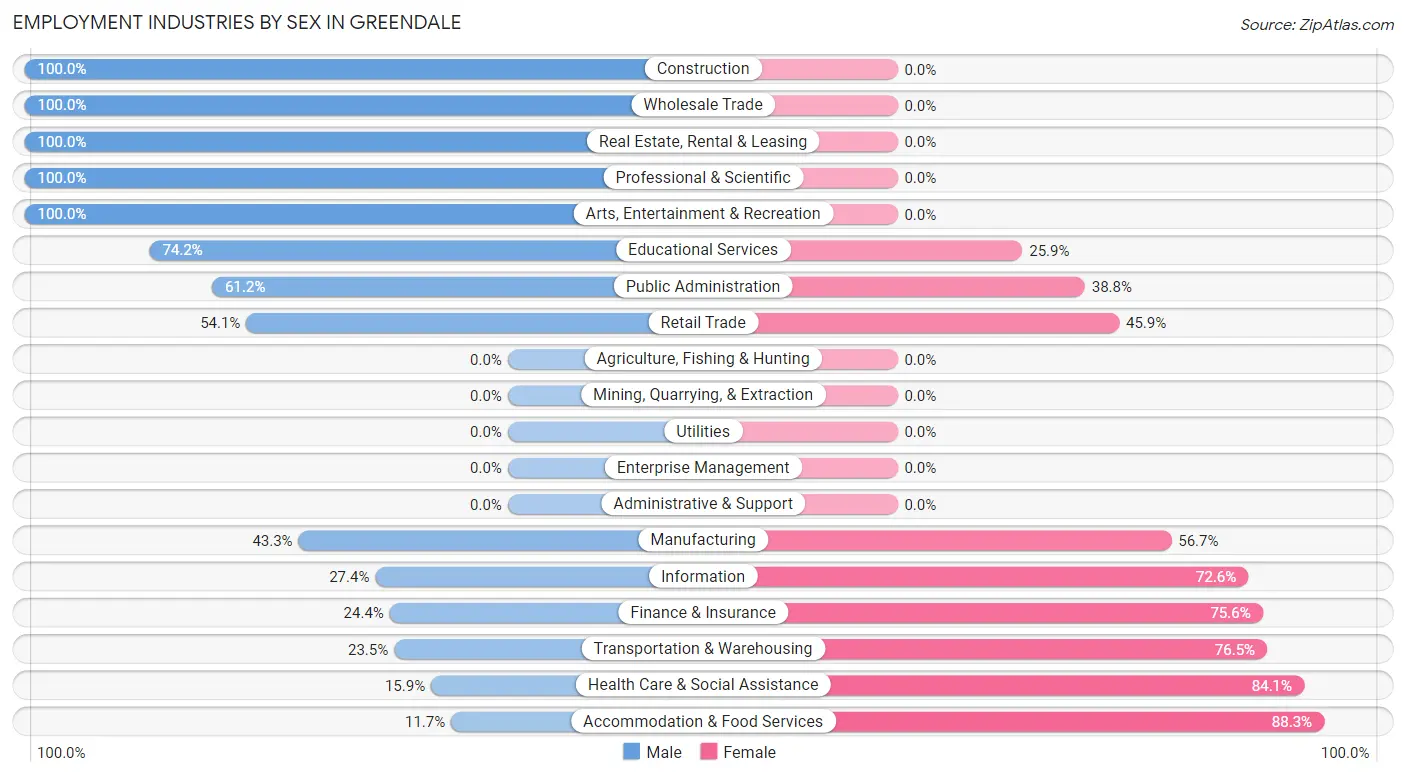
Employment Industries by Sex in Greendale
The Greendale industries that see more men than women are Construction (100.0%), Wholesale Trade (100.0%), and Real Estate, Rental & Leasing (100.0%), whereas the industries that tend to have a higher number of women are Accommodation & Food Services (88.3%), Health Care & Social Assistance (84.1%), and Transportation & Warehousing (76.5%).
| Industry | Male | Female |
| Agriculture, Fishing & Hunting | 0 (0.0%) | 0 (0.0%) |
| Mining, Quarrying, & Extraction | 0 (0.0%) | 0 (0.0%) |
| Construction | 63 (100.0%) | 0 (0.0%) |
| Manufacturing | 94 (43.3%) | 123 (56.7%) |
| Wholesale Trade | 28 (100.0%) | 0 (0.0%) |
| Retail Trade | 223 (54.1%) | 189 (45.9%) |
| Transportation & Warehousing | 12 (23.5%) | 39 (76.5%) |
| Utilities | 0 (0.0%) | 0 (0.0%) |
| Information | 17 (27.4%) | 45 (72.6%) |
| Finance & Insurance | 22 (24.4%) | 68 (75.6%) |
| Real Estate, Rental & Leasing | 10 (100.0%) | 0 (0.0%) |
| Professional & Scientific | 84 (100.0%) | 0 (0.0%) |
| Enterprise Management | 0 (0.0%) | 0 (0.0%) |
| Administrative & Support | 0 (0.0%) | 0 (0.0%) |
| Educational Services | 109 (74.2%) | 38 (25.9%) |
| Health Care & Social Assistance | 64 (15.9%) | 339 (84.1%) |
| Arts, Entertainment & Recreation | 33 (100.0%) | 0 (0.0%) |
| Accommodation & Food Services | 21 (11.7%) | 158 (88.3%) |
| Public Administration | 101 (61.2%) | 64 (38.8%) |
| Total | 896 (45.7%) | 1,063 (54.3%) |
Education in Greendale
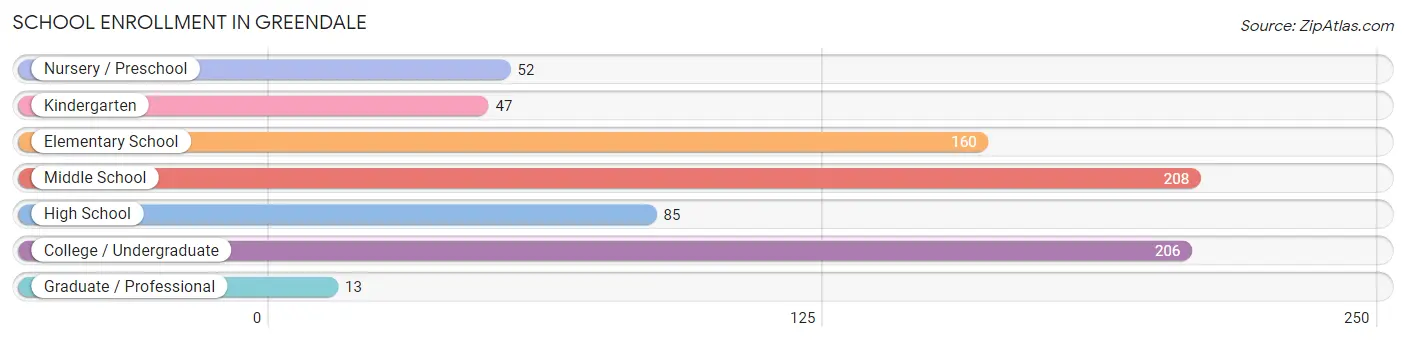
School Enrollment in Greendale
The most common levels of schooling among the 771 students in Greendale are middle school (208 | 27.0%), college / undergraduate (206 | 26.7%), and elementary school (160 | 20.7%).
| School Level | # Students | % Students |
| Nursery / Preschool | 52 | 6.7% |
| Kindergarten | 47 | 6.1% |
| Elementary School | 160 | 20.7% |
| Middle School | 208 | 27.0% |
| High School | 85 | 11.0% |
| College / Undergraduate | 206 | 26.7% |
| Graduate / Professional | 13 | 1.7% |
| Total | 771 | 100.0% |
School Enrollment by Age by Funding Source in Greendale
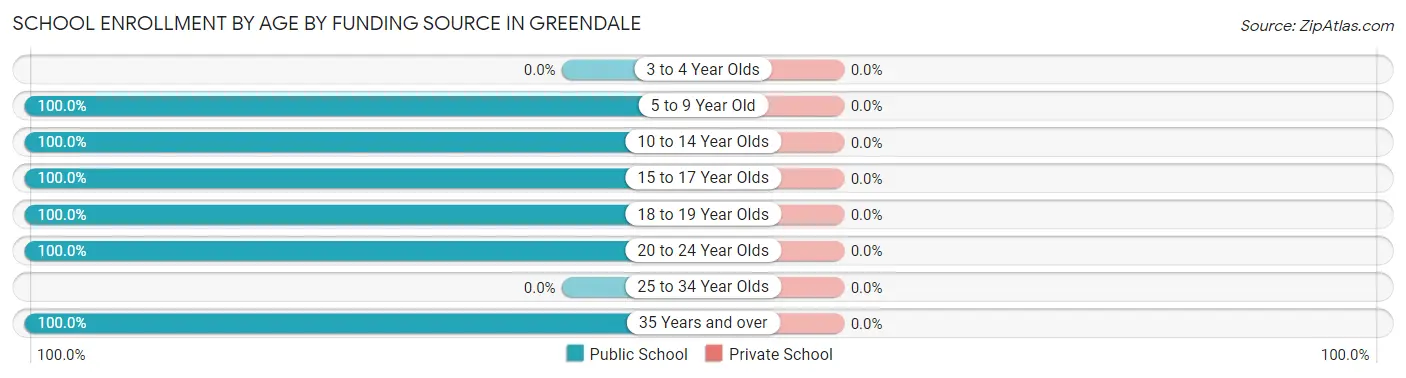
| Age Bracket | Public School | Private School |
| 3 to 4 Year Olds | 0 (0.0%) | 0 (0.0%) |
| 5 to 9 Year Old | 259 (100.0%) | 0 (0.0%) |
| 10 to 14 Year Olds | 224 (100.0%) | 0 (0.0%) |
| 15 to 17 Year Olds | 31 (100.0%) | 0 (0.0%) |
| 18 to 19 Year Olds | 137 (100.0%) | 0 (0.0%) |
| 20 to 24 Year Olds | 47 (100.0%) | 0 (0.0%) |
| 25 to 34 Year Olds | 0 (0.0%) | 0 (0.0%) |
| 35 Years and over | 73 (100.0%) | 0 (0.0%) |
| Total | 771 (100.0%) | 0 (0.0%) |
Educational Attainment by Field of Study in Greendale
Science & technology (192 | 29.5%), business (93 | 14.3%), liberal arts & history (68 | 10.5%), computers & mathematics (63 | 9.7%), and psychology (45 | 6.9%) are the most common fields of study among 650 individuals in Greendale who have obtained a bachelor's degree or higher.
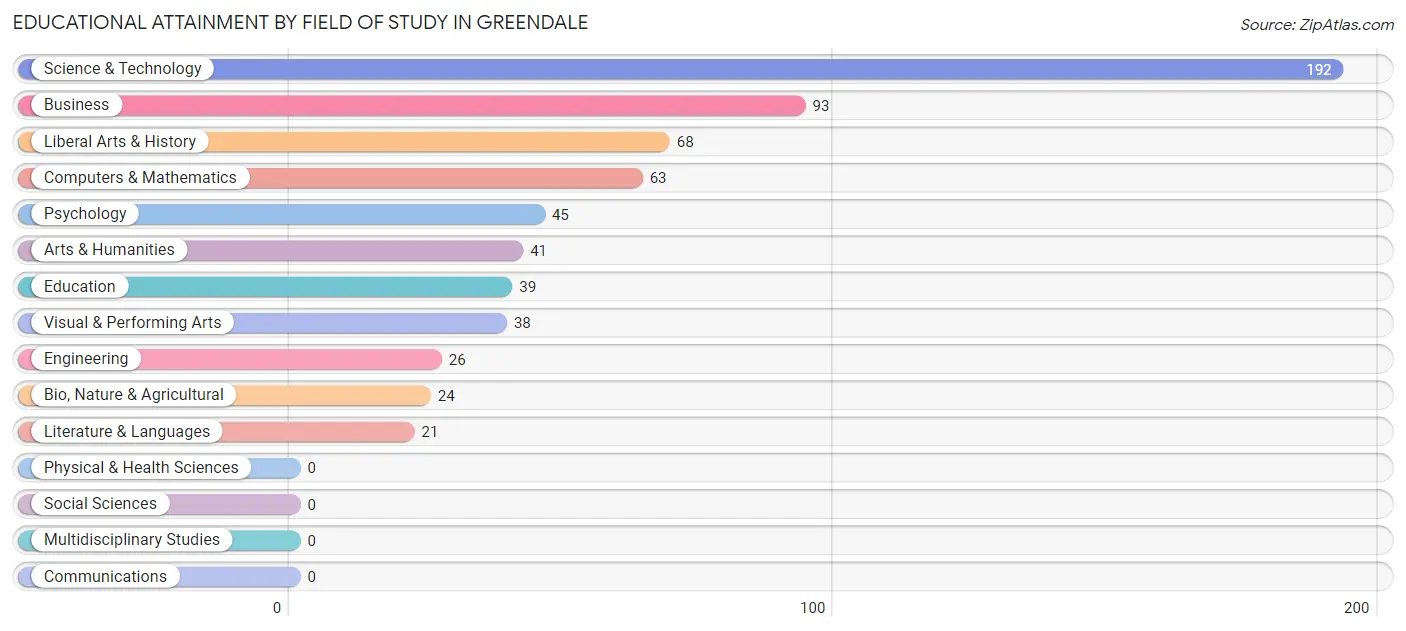
| Field of Study | # Graduates | % Graduates |
| Computers & Mathematics | 63 | 9.7% |
| Bio, Nature & Agricultural | 24 | 3.7% |
| Physical & Health Sciences | 0 | 0.0% |
| Psychology | 45 | 6.9% |
| Social Sciences | 0 | 0.0% |
| Engineering | 26 | 4.0% |
| Multidisciplinary Studies | 0 | 0.0% |
| Science & Technology | 192 | 29.5% |
| Business | 93 | 14.3% |
| Education | 39 | 6.0% |
| Literature & Languages | 21 | 3.2% |
| Liberal Arts & History | 68 | 10.5% |
| Visual & Performing Arts | 38 | 5.9% |
| Communications | 0 | 0.0% |
| Arts & Humanities | 41 | 6.3% |
| Total | 650 | 100.0% |
Transportation & Commute in Greendale
Vehicle Availability by Sex in Greendale
The most prevalent vehicle ownership categories in Greendale are males with 2 vehicles (381, accounting for 46.6%) and females with 2 vehicles (513, making up 36.3%).
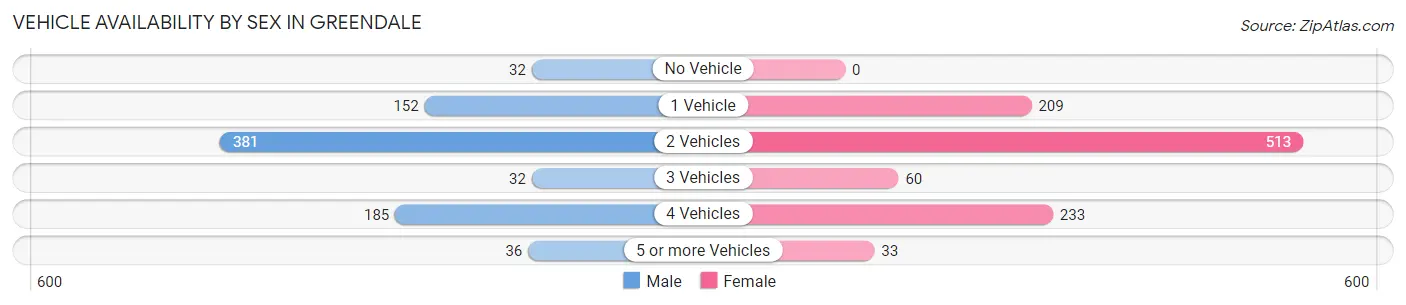
| Vehicles Available | Male | Female |
| No Vehicle | 32 (3.9%) | 0 (0.0%) |
| 1 Vehicle | 152 (18.6%) | 209 (19.9%) |
| 2 Vehicles | 381 (46.6%) | 513 (48.9%) |
| 3 Vehicles | 32 (3.9%) | 60 (5.7%) |
| 4 Vehicles | 185 (22.6%) | 233 (22.2%) |
| 5 or more Vehicles | 36 (4.4%) | 33 (3.2%) |
| Total | 818 (100.0%) | 1,048 (100.0%) |
Commute Time in Greendale
The most frequently occuring commute durations in Greendale are 5 to 9 minutes (276 commuters, 15.2%), 10 to 14 minutes (269 commuters, 14.8%), and 20 to 24 minutes (263 commuters, 14.5%).
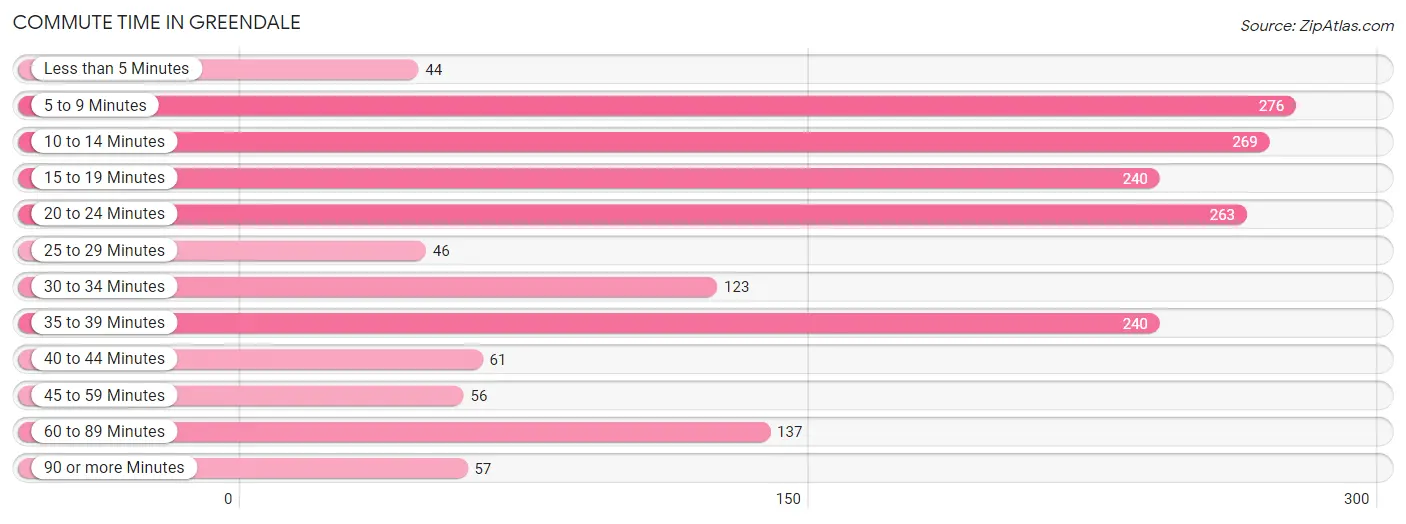
| Commute Time | # Commuters | % Commuters |
| Less than 5 Minutes | 44 | 2.4% |
| 5 to 9 Minutes | 276 | 15.2% |
| 10 to 14 Minutes | 269 | 14.8% |
| 15 to 19 Minutes | 240 | 13.3% |
| 20 to 24 Minutes | 263 | 14.5% |
| 25 to 29 Minutes | 46 | 2.5% |
| 30 to 34 Minutes | 123 | 6.8% |
| 35 to 39 Minutes | 240 | 13.3% |
| 40 to 44 Minutes | 61 | 3.4% |
| 45 to 59 Minutes | 56 | 3.1% |
| 60 to 89 Minutes | 137 | 7.6% |
| 90 or more Minutes | 57 | 3.2% |
Commute Time by Sex in Greendale
The most common commute times in Greendale are 35 to 39 minutes (142 commuters, 17.7%) for males and 10 to 14 minutes (181 commuters, 17.9%) for females.
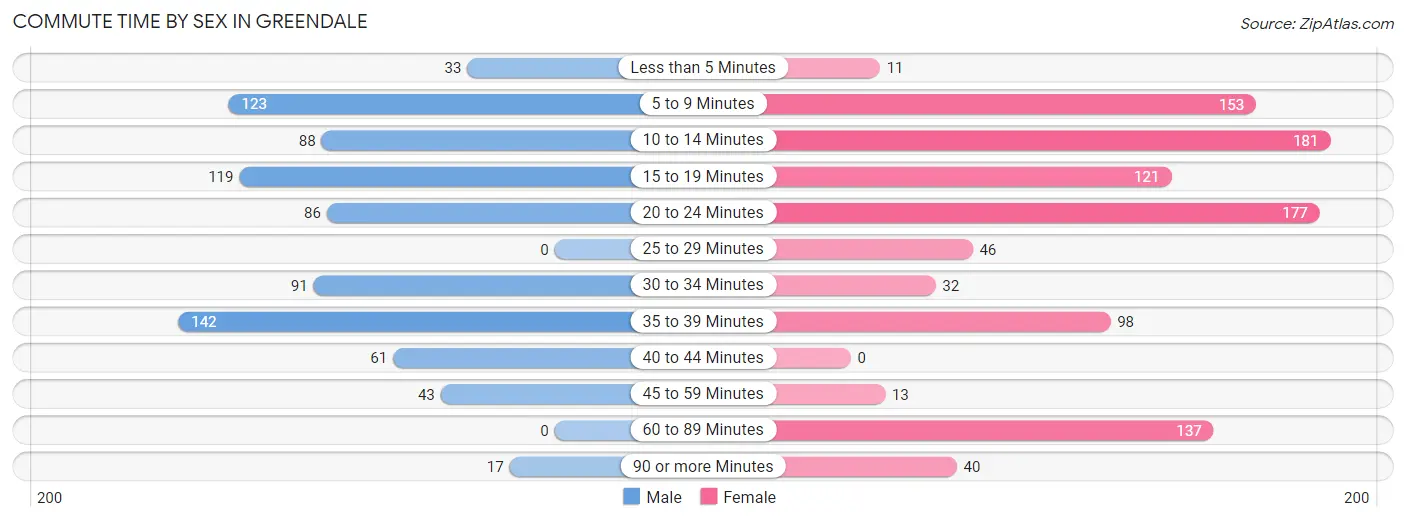
| Commute Time | Male | Female |
| Less than 5 Minutes | 33 (4.1%) | 11 (1.1%) |
| 5 to 9 Minutes | 123 (15.3%) | 153 (15.2%) |
| 10 to 14 Minutes | 88 (11.0%) | 181 (17.9%) |
| 15 to 19 Minutes | 119 (14.8%) | 121 (12.0%) |
| 20 to 24 Minutes | 86 (10.7%) | 177 (17.5%) |
| 25 to 29 Minutes | 0 (0.0%) | 46 (4.6%) |
| 30 to 34 Minutes | 91 (11.3%) | 32 (3.2%) |
| 35 to 39 Minutes | 142 (17.7%) | 98 (9.7%) |
| 40 to 44 Minutes | 61 (7.6%) | 0 (0.0%) |
| 45 to 59 Minutes | 43 (5.3%) | 13 (1.3%) |
| 60 to 89 Minutes | 0 (0.0%) | 137 (13.6%) |
| 90 or more Minutes | 17 (2.1%) | 40 (4.0%) |
Time of Departure to Work by Sex in Greendale
The most frequent times of departure to work in Greendale are 6:00 AM to 6:29 AM (244, 30.4%) for males and 6:30 AM to 6:59 AM (201, 19.9%) for females.
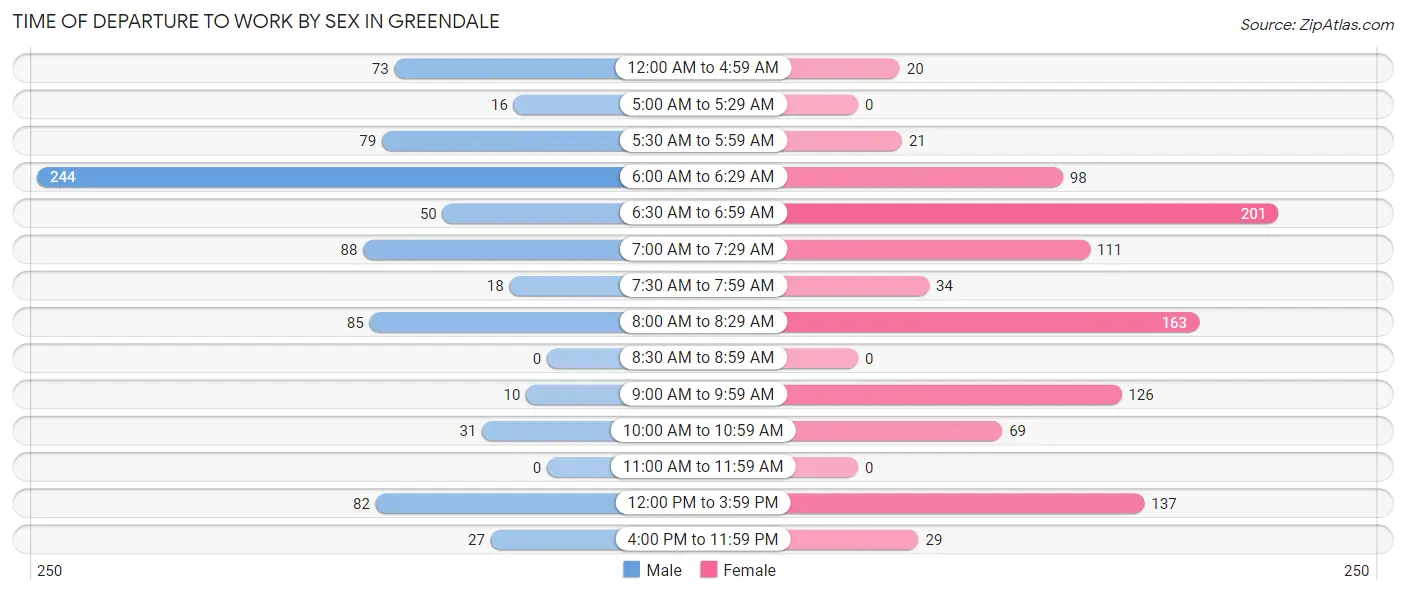
| Time of Departure | Male | Female |
| 12:00 AM to 4:59 AM | 73 (9.1%) | 20 (2.0%) |
| 5:00 AM to 5:29 AM | 16 (2.0%) | 0 (0.0%) |
| 5:30 AM to 5:59 AM | 79 (9.8%) | 21 (2.1%) |
| 6:00 AM to 6:29 AM | 244 (30.4%) | 98 (9.7%) |
| 6:30 AM to 6:59 AM | 50 (6.2%) | 201 (19.9%) |
| 7:00 AM to 7:29 AM | 88 (11.0%) | 111 (11.0%) |
| 7:30 AM to 7:59 AM | 18 (2.2%) | 34 (3.4%) |
| 8:00 AM to 8:29 AM | 85 (10.6%) | 163 (16.2%) |
| 8:30 AM to 8:59 AM | 0 (0.0%) | 0 (0.0%) |
| 9:00 AM to 9:59 AM | 10 (1.3%) | 126 (12.5%) |
| 10:00 AM to 10:59 AM | 31 (3.9%) | 69 (6.8%) |
| 11:00 AM to 11:59 AM | 0 (0.0%) | 0 (0.0%) |
| 12:00 PM to 3:59 PM | 82 (10.2%) | 137 (13.6%) |
| 4:00 PM to 11:59 PM | 27 (3.4%) | 29 (2.9%) |
| Total | 803 (100.0%) | 1,009 (100.0%) |
Housing Occupancy in Greendale
Occupancy by Ownership in Greendale
Of the total 1,711 dwellings in Greendale, owner-occupied units account for 1,333 (77.9%), while renter-occupied units make up 378 (22.1%).
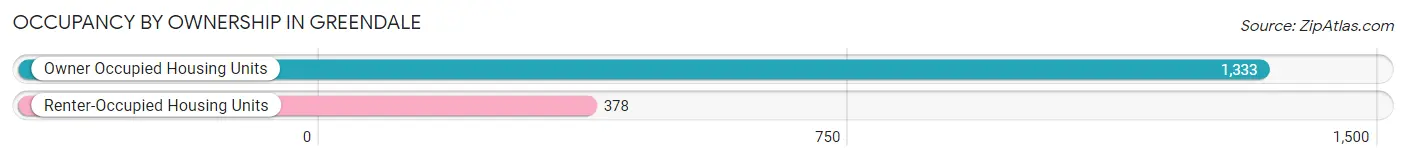
| Occupancy | # Housing Units | % Housing Units |
| Owner Occupied Housing Units | 1,333 | 77.9% |
| Renter-Occupied Housing Units | 378 | 22.1% |
| Total Occupied Housing Units | 1,711 | 100.0% |
Occupancy by Household Size in Greendale
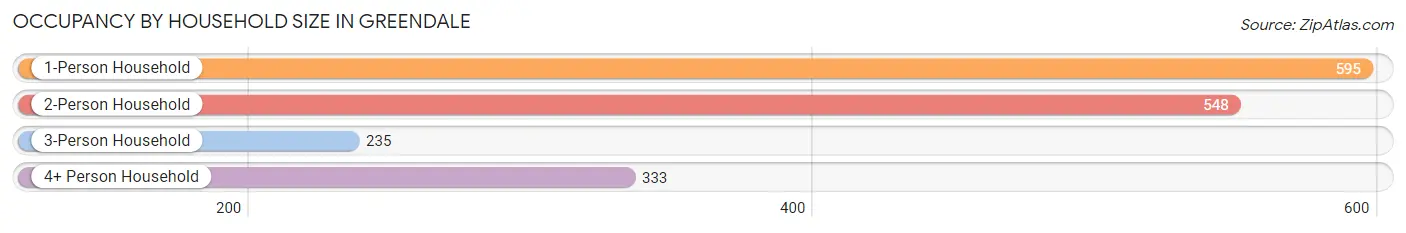
| Household Size | # Housing Units | % Housing Units |
| 1-Person Household | 595 | 34.8% |
| 2-Person Household | 548 | 32.0% |
| 3-Person Household | 235 | 13.7% |
| 4+ Person Household | 333 | 19.5% |
| Total Housing Units | 1,711 | 100.0% |
Occupancy by Ownership by Household Size in Greendale
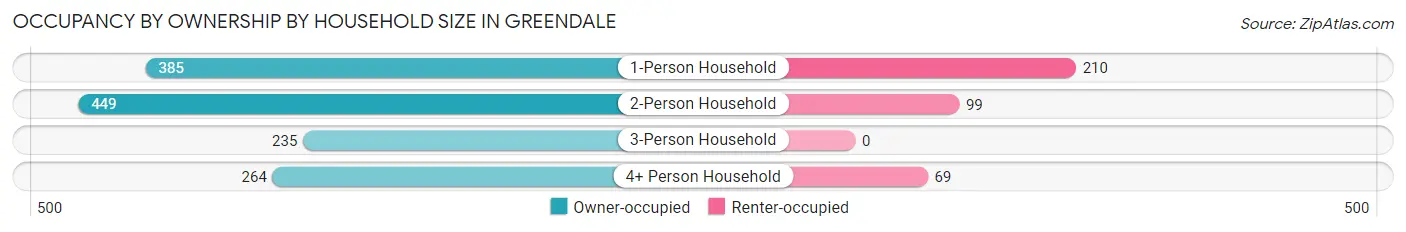
| Household Size | Owner-occupied | Renter-occupied |
| 1-Person Household | 385 (64.7%) | 210 (35.3%) |
| 2-Person Household | 449 (81.9%) | 99 (18.1%) |
| 3-Person Household | 235 (100.0%) | 0 (0.0%) |
| 4+ Person Household | 264 (79.3%) | 69 (20.7%) |
| Total Housing Units | 1,333 (77.9%) | 378 (22.1%) |
Occupancy by Educational Attainment in Greendale
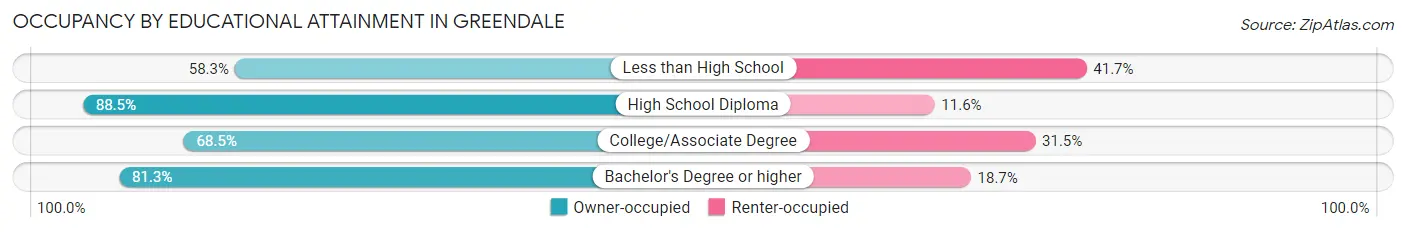
| Household Size | Owner-occupied | Renter-occupied |
| Less than High School | 77 (58.3%) | 55 (41.7%) |
| High School Diploma | 559 (88.4%) | 73 (11.6%) |
| College/Associate Degree | 389 (68.5%) | 179 (31.5%) |
| Bachelor's Degree or higher | 308 (81.3%) | 71 (18.7%) |
Occupancy by Age of Householder in Greendale
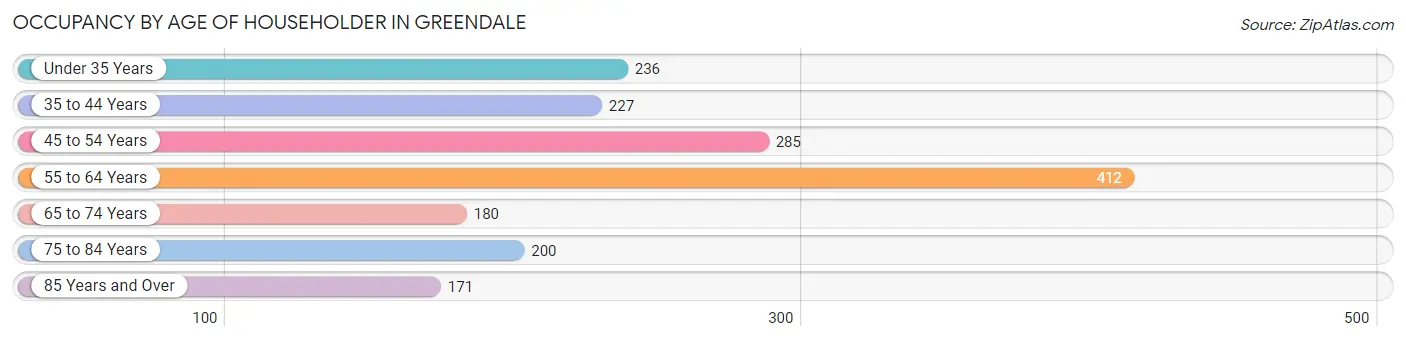
| Age Bracket | # Households | % Households |
| Under 35 Years | 236 | 13.8% |
| 35 to 44 Years | 227 | 13.3% |
| 45 to 54 Years | 285 | 16.7% |
| 55 to 64 Years | 412 | 24.1% |
| 65 to 74 Years | 180 | 10.5% |
| 75 to 84 Years | 200 | 11.7% |
| 85 Years and Over | 171 | 10.0% |
| Total | 1,711 | 100.0% |
Housing Finances in Greendale
Median Income by Occupancy in Greendale
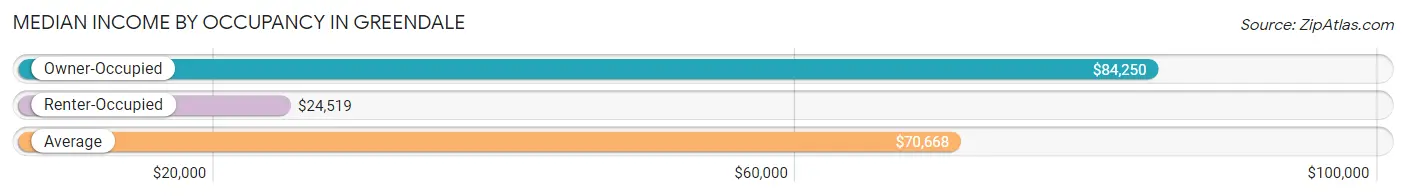
| Occupancy Type | # Households | Median Income |
| Owner-Occupied | 1,333 (77.9%) | $84,250 |
| Renter-Occupied | 378 (22.1%) | $24,519 |
| Average | 1,711 (100.0%) | $70,668 |
Occupancy by Householder Income Bracket in Greendale
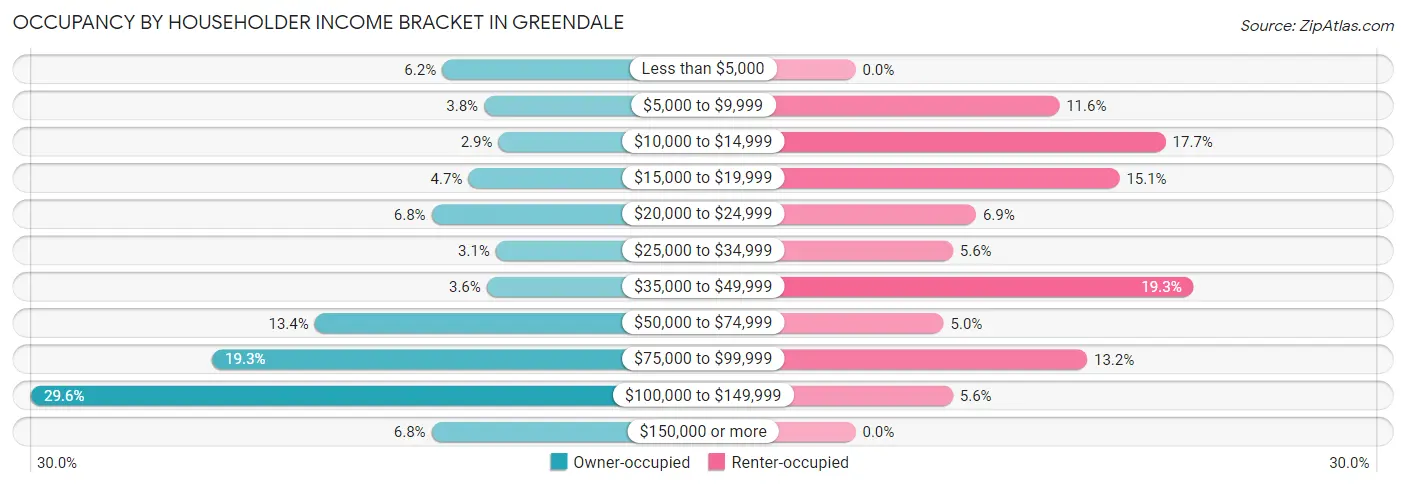
| Income Bracket | Owner-occupied | Renter-occupied |
| Less than $5,000 | 82 (6.1%) | 0 (0.0%) |
| $5,000 to $9,999 | 50 (3.7%) | 44 (11.6%) |
| $10,000 to $14,999 | 39 (2.9%) | 67 (17.7%) |
| $15,000 to $19,999 | 62 (4.6%) | 57 (15.1%) |
| $20,000 to $24,999 | 90 (6.8%) | 26 (6.9%) |
| $25,000 to $34,999 | 41 (3.1%) | 21 (5.6%) |
| $35,000 to $49,999 | 48 (3.6%) | 73 (19.3%) |
| $50,000 to $74,999 | 179 (13.4%) | 19 (5.0%) |
| $75,000 to $99,999 | 257 (19.3%) | 50 (13.2%) |
| $100,000 to $149,999 | 395 (29.6%) | 21 (5.6%) |
| $150,000 or more | 90 (6.8%) | 0 (0.0%) |
| Total | 1,333 (100.0%) | 378 (100.0%) |
Monthly Housing Cost Tiers in Greendale
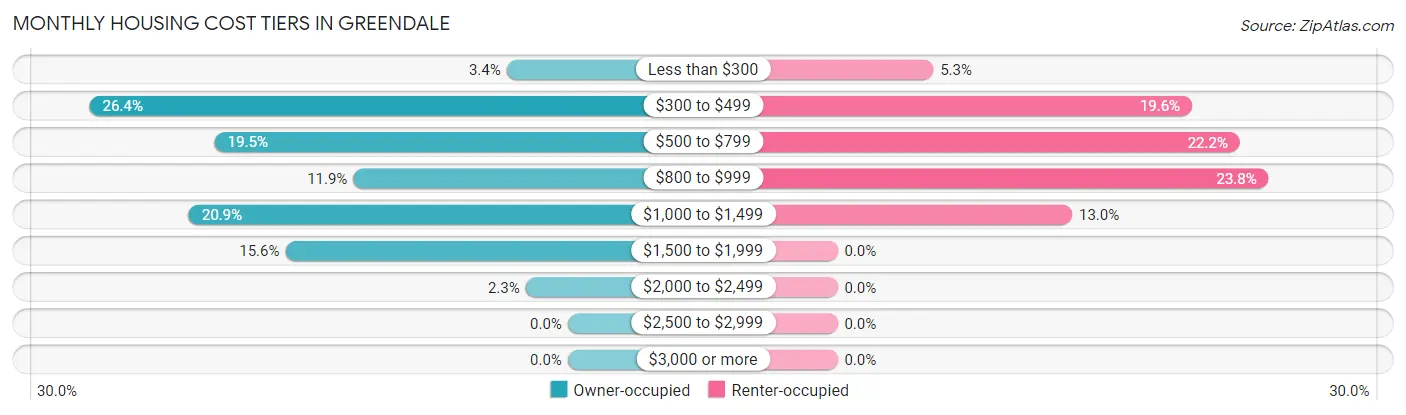
| Monthly Cost | Owner-occupied | Renter-occupied |
| Less than $300 | 45 (3.4%) | 20 (5.3%) |
| $300 to $499 | 352 (26.4%) | 74 (19.6%) |
| $500 to $799 | 260 (19.5%) | 84 (22.2%) |
| $800 to $999 | 158 (11.8%) | 90 (23.8%) |
| $1,000 to $1,499 | 279 (20.9%) | 49 (13.0%) |
| $1,500 to $1,999 | 208 (15.6%) | 0 (0.0%) |
| $2,000 to $2,499 | 31 (2.3%) | 0 (0.0%) |
| $2,500 to $2,999 | 0 (0.0%) | 0 (0.0%) |
| $3,000 or more | 0 (0.0%) | 0 (0.0%) |
| Total | 1,333 (100.0%) | 378 (100.0%) |
Physical Housing Characteristics in Greendale
Housing Structures in Greendale
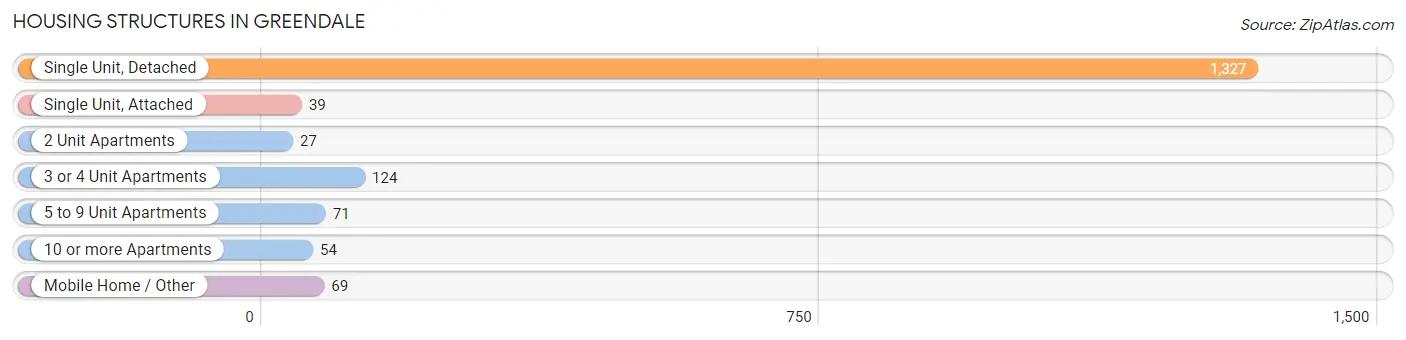
| Structure Type | # Housing Units | % Housing Units |
| Single Unit, Detached | 1,327 | 77.6% |
| Single Unit, Attached | 39 | 2.3% |
| 2 Unit Apartments | 27 | 1.6% |
| 3 or 4 Unit Apartments | 124 | 7.2% |
| 5 to 9 Unit Apartments | 71 | 4.2% |
| 10 or more Apartments | 54 | 3.2% |
| Mobile Home / Other | 69 | 4.0% |
| Total | 1,711 | 100.0% |
Housing Structures by Occupancy in Greendale
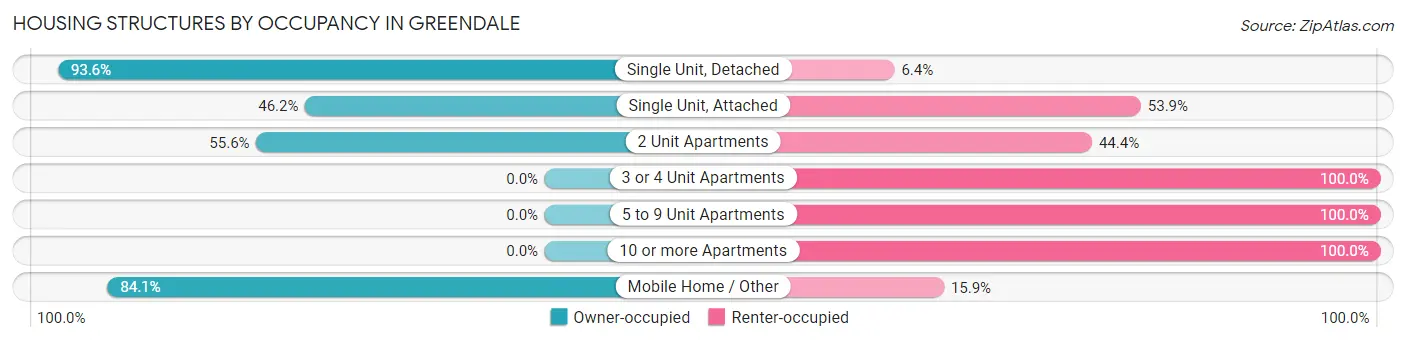
| Structure Type | Owner-occupied | Renter-occupied |
| Single Unit, Detached | 1,242 (93.6%) | 85 (6.4%) |
| Single Unit, Attached | 18 (46.2%) | 21 (53.8%) |
| 2 Unit Apartments | 15 (55.6%) | 12 (44.4%) |
| 3 or 4 Unit Apartments | 0 (0.0%) | 124 (100.0%) |
| 5 to 9 Unit Apartments | 0 (0.0%) | 71 (100.0%) |
| 10 or more Apartments | 0 (0.0%) | 54 (100.0%) |
| Mobile Home / Other | 58 (84.1%) | 11 (15.9%) |
| Total | 1,333 (77.9%) | 378 (22.1%) |
Housing Structures by Number of Rooms in Greendale
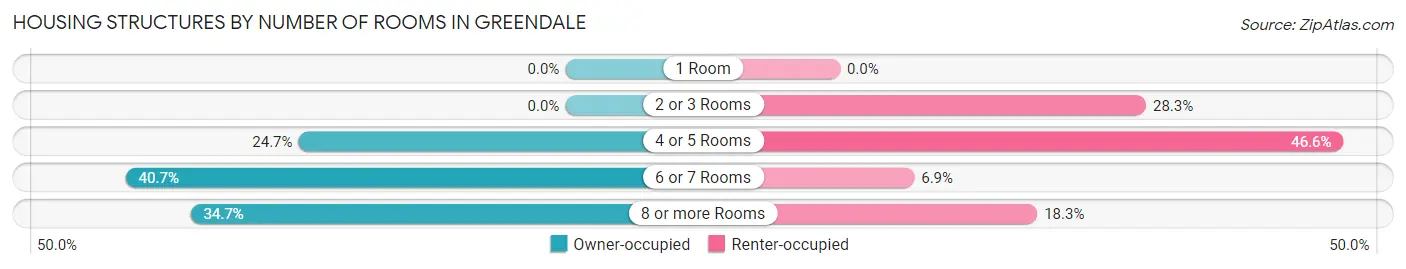
| Number of Rooms | Owner-occupied | Renter-occupied |
| 1 Room | 0 (0.0%) | 0 (0.0%) |
| 2 or 3 Rooms | 0 (0.0%) | 107 (28.3%) |
| 4 or 5 Rooms | 329 (24.7%) | 176 (46.6%) |
| 6 or 7 Rooms | 542 (40.7%) | 26 (6.9%) |
| 8 or more Rooms | 462 (34.7%) | 69 (18.2%) |
| Total | 1,333 (100.0%) | 378 (100.0%) |
Housing Structure by Heating Type in Greendale
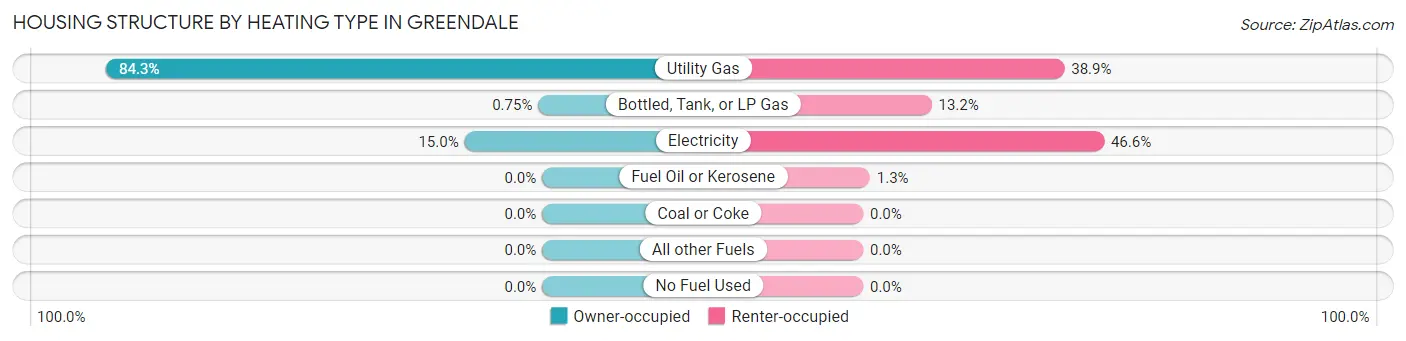
| Heating Type | Owner-occupied | Renter-occupied |
| Utility Gas | 1,123 (84.3%) | 147 (38.9%) |
| Bottled, Tank, or LP Gas | 10 (0.7%) | 50 (13.2%) |
| Electricity | 200 (15.0%) | 176 (46.6%) |
| Fuel Oil or Kerosene | 0 (0.0%) | 5 (1.3%) |
| Coal or Coke | 0 (0.0%) | 0 (0.0%) |
| All other Fuels | 0 (0.0%) | 0 (0.0%) |
| No Fuel Used | 0 (0.0%) | 0 (0.0%) |
| Total | 1,333 (100.0%) | 378 (100.0%) |
Household Vehicle Usage in Greendale
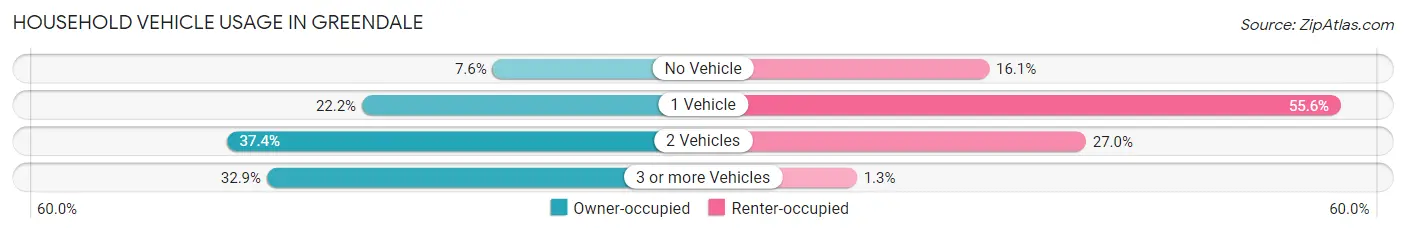
| Vehicles per Household | Owner-occupied | Renter-occupied |
| No Vehicle | 101 (7.6%) | 61 (16.1%) |
| 1 Vehicle | 296 (22.2%) | 210 (55.6%) |
| 2 Vehicles | 498 (37.4%) | 102 (27.0%) |
| 3 or more Vehicles | 438 (32.9%) | 5 (1.3%) |
| Total | 1,333 (100.0%) | 378 (100.0%) |
Real Estate & Mortgages in Greendale
Real Estate and Mortgage Overview in Greendale
| Characteristic | Without Mortgage | With Mortgage |
| Housing Units | 632 | 701 |
| Median Property Value | $153,600 | $196,700 |
| Median Household Income | $59,000 | $61 |
| Monthly Housing Costs | $462 | $0 |
| Real Estate Taxes | $1,247 | $15 |
Property Value by Mortgage Status in Greendale
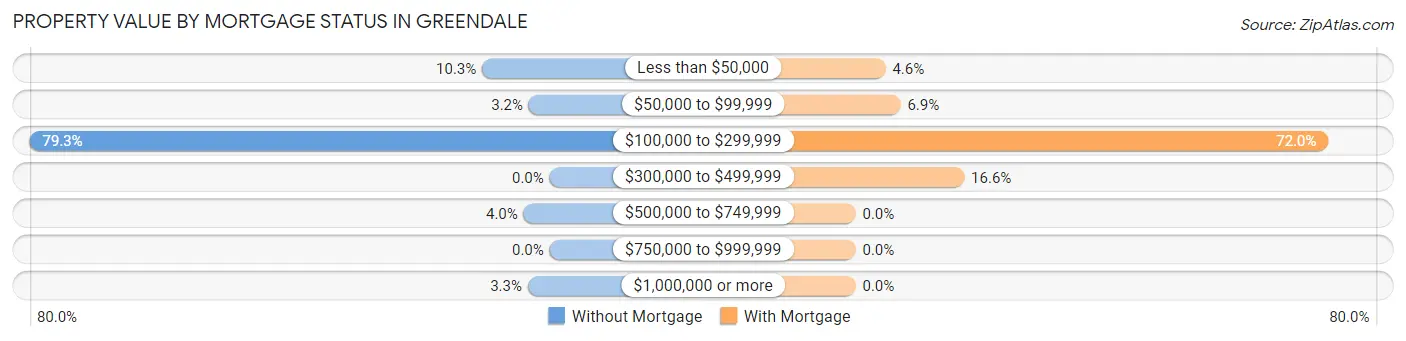
| Property Value | Without Mortgage | With Mortgage |
| Less than $50,000 | 65 (10.3%) | 32 (4.6%) |
| $50,000 to $99,999 | 20 (3.2%) | 48 (6.9%) |
| $100,000 to $299,999 | 501 (79.3%) | 505 (72.0%) |
| $300,000 to $499,999 | 0 (0.0%) | 116 (16.6%) |
| $500,000 to $749,999 | 25 (4.0%) | 0 (0.0%) |
| $750,000 to $999,999 | 0 (0.0%) | 0 (0.0%) |
| $1,000,000 or more | 21 (3.3%) | 0 (0.0%) |
| Total | 632 (100.0%) | 701 (100.0%) |
Household Income by Mortgage Status in Greendale
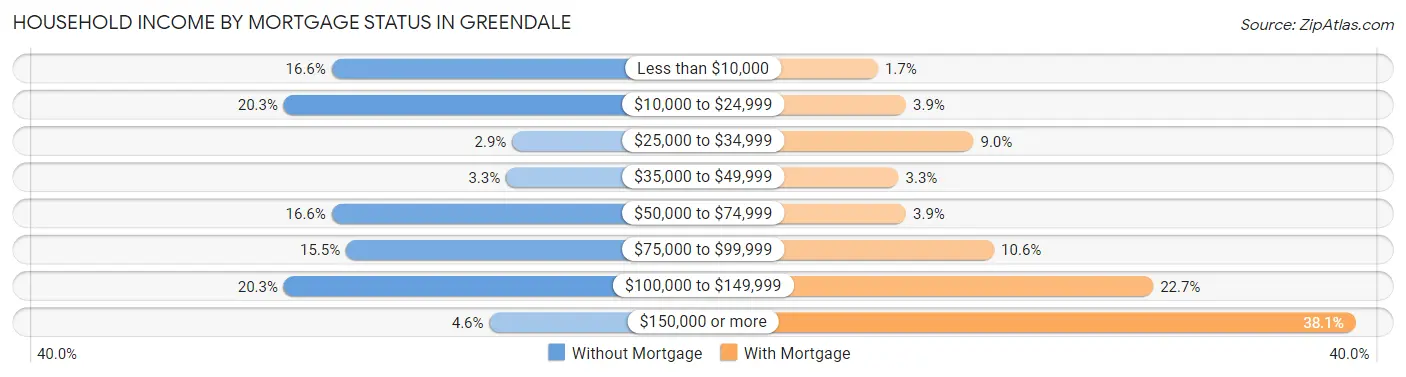
| Household Income | Without Mortgage | With Mortgage |
| Less than $10,000 | 105 (16.6%) | 12 (1.7%) |
| $10,000 to $24,999 | 128 (20.3%) | 27 (3.8%) |
| $25,000 to $34,999 | 18 (2.9%) | 63 (9.0%) |
| $35,000 to $49,999 | 21 (3.3%) | 23 (3.3%) |
| $50,000 to $74,999 | 105 (16.6%) | 27 (3.8%) |
| $75,000 to $99,999 | 98 (15.5%) | 74 (10.6%) |
| $100,000 to $149,999 | 128 (20.3%) | 159 (22.7%) |
| $150,000 or more | 29 (4.6%) | 267 (38.1%) |
| Total | 632 (100.0%) | 701 (100.0%) |
Property Value to Household Income Ratio in Greendale
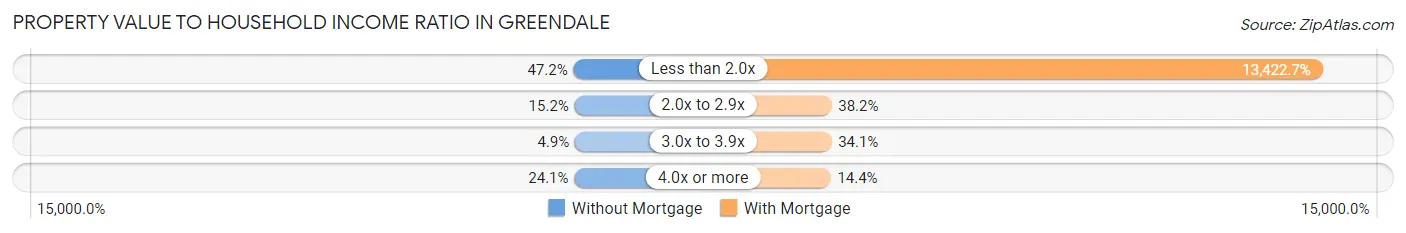
| Value-to-Income Ratio | Without Mortgage | With Mortgage |
| Less than 2.0x | 298 (47.1%) | 94,093 (13,422.7%) |
| 2.0x to 2.9x | 96 (15.2%) | 268 (38.2%) |
| 3.0x to 3.9x | 31 (4.9%) | 239 (34.1%) |
| 4.0x or more | 152 (24.0%) | 101 (14.4%) |
| Total | 632 (100.0%) | 701 (100.0%) |
Real Estate Taxes by Mortgage Status in Greendale
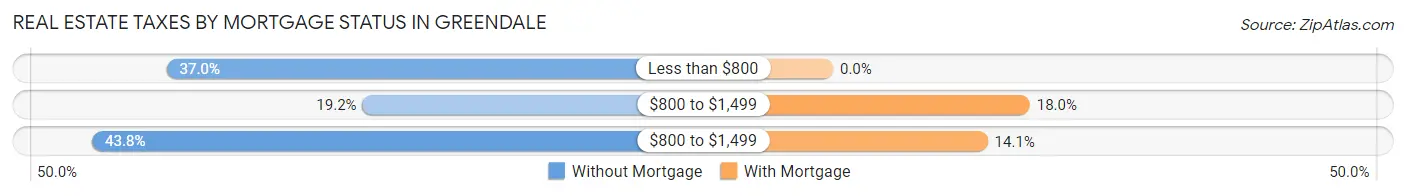
| Property Taxes | Without Mortgage | With Mortgage |
| Less than $800 | 234 (37.0%) | 0 (0.0%) |
| $800 to $1,499 | 121 (19.2%) | 126 (18.0%) |
| $800 to $1,499 | 277 (43.8%) | 99 (14.1%) |
| Total | 632 (100.0%) | 701 (100.0%) |
Health & Disability in Greendale
Health Insurance Coverage by Age in Greendale
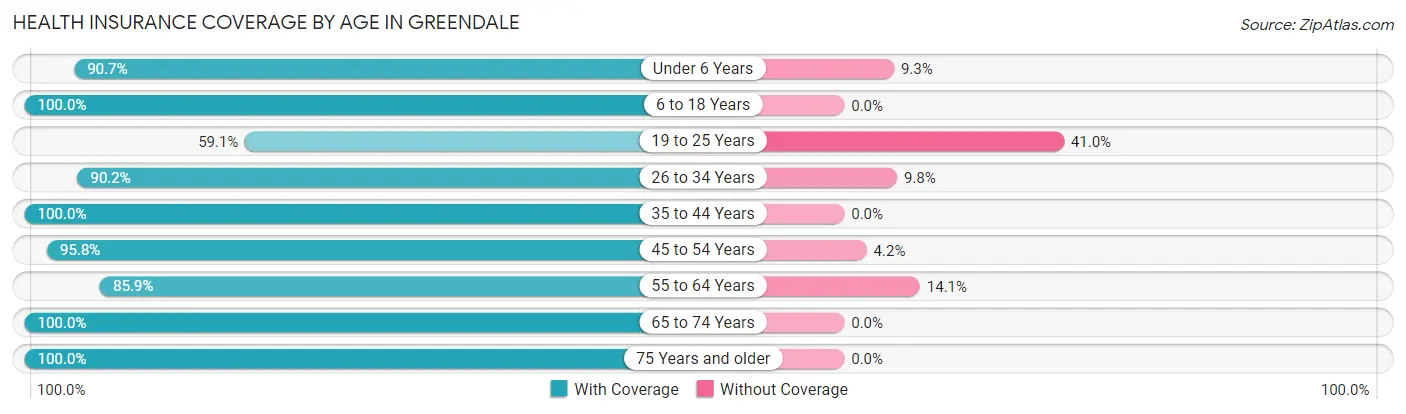
| Age Bracket | With Coverage | Without Coverage |
| Under 6 Years | 245 (90.7%) | 25 (9.3%) |
| 6 to 18 Years | 605 (100.0%) | 0 (0.0%) |
| 19 to 25 Years | 261 (59.1%) | 181 (40.9%) |
| 26 to 34 Years | 330 (90.2%) | 36 (9.8%) |
| 35 to 44 Years | 429 (100.0%) | 0 (0.0%) |
| 45 to 54 Years | 483 (95.8%) | 21 (4.2%) |
| 55 to 64 Years | 512 (85.9%) | 84 (14.1%) |
| 65 to 74 Years | 290 (100.0%) | 0 (0.0%) |
| 75 Years and older | 465 (100.0%) | 0 (0.0%) |
| Total | 3,620 (91.2%) | 347 (8.7%) |
Health Insurance Coverage by Citizenship Status in Greendale
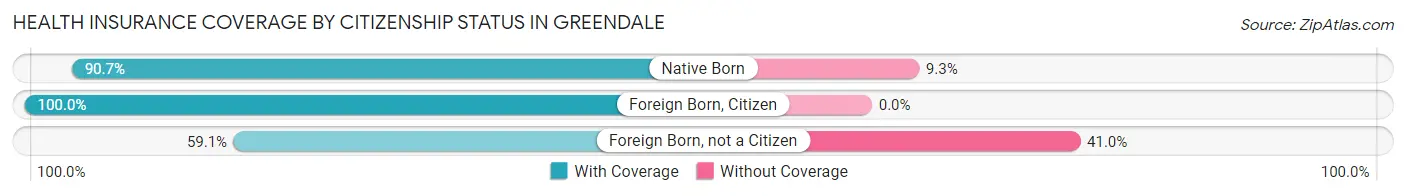
| Citizenship Status | With Coverage | Without Coverage |
| Native Born | 245 (90.7%) | 25 (9.3%) |
| Foreign Born, Citizen | 605 (100.0%) | 0 (0.0%) |
| Foreign Born, not a Citizen | 261 (59.1%) | 181 (40.9%) |
Health Insurance Coverage by Household Income in Greendale
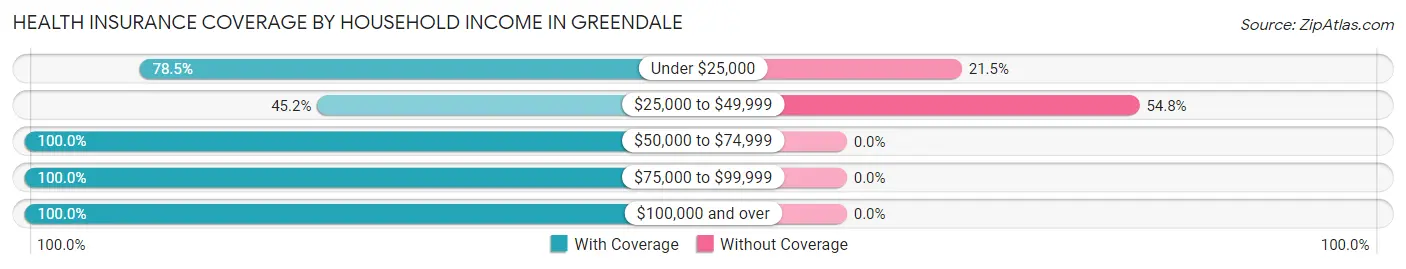
| Household Income | With Coverage | Without Coverage |
| Under $25,000 | 499 (78.5%) | 137 (21.5%) |
| $25,000 to $49,999 | 173 (45.2%) | 210 (54.8%) |
| $50,000 to $74,999 | 374 (100.0%) | 0 (0.0%) |
| $75,000 to $99,999 | 1,122 (100.0%) | 0 (0.0%) |
| $100,000 and over | 1,452 (100.0%) | 0 (0.0%) |
Public vs Private Health Insurance Coverage by Age in Greendale
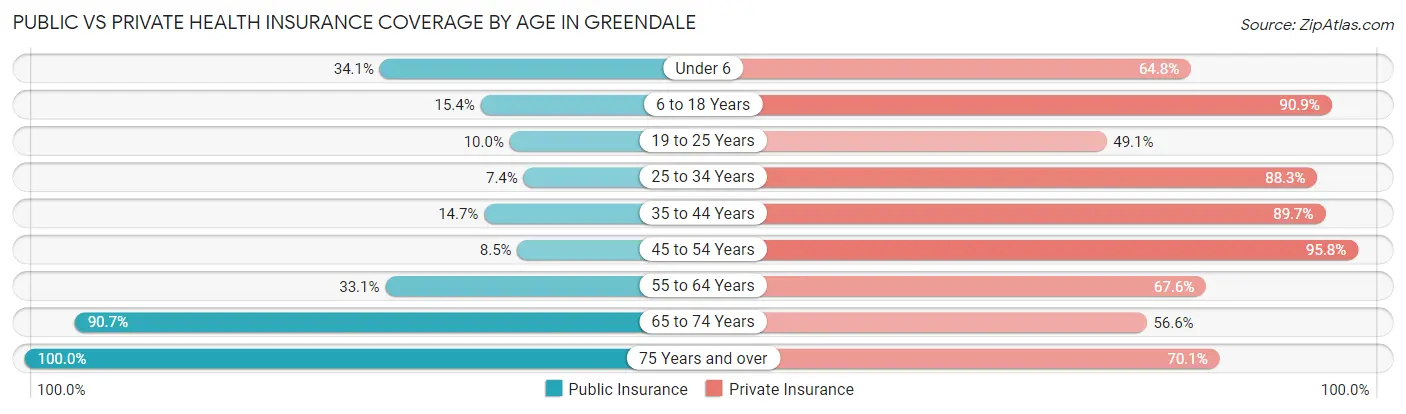
| Age Bracket | Public Insurance | Private Insurance |
| Under 6 | 92 (34.1%) | 175 (64.8%) |
| 6 to 18 Years | 93 (15.4%) | 550 (90.9%) |
| 19 to 25 Years | 44 (10.0%) | 217 (49.1%) |
| 25 to 34 Years | 27 (7.4%) | 323 (88.2%) |
| 35 to 44 Years | 63 (14.7%) | 385 (89.7%) |
| 45 to 54 Years | 43 (8.5%) | 483 (95.8%) |
| 55 to 64 Years | 197 (33.1%) | 403 (67.6%) |
| 65 to 74 Years | 263 (90.7%) | 164 (56.6%) |
| 75 Years and over | 465 (100.0%) | 326 (70.1%) |
| Total | 1,287 (32.4%) | 3,026 (76.3%) |
Disability Status by Sex by Age in Greendale
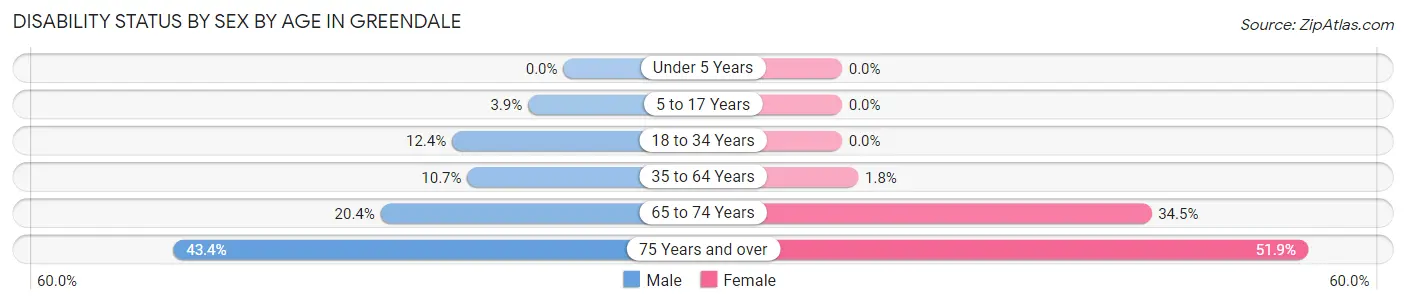
| Age Bracket | Male | Female |
| Under 5 Years | 0 (0.0%) | 0 (0.0%) |
| 5 to 17 Years | 14 (3.9%) | 0 (0.0%) |
| 18 to 34 Years | 32 (12.4%) | 0 (0.0%) |
| 35 to 64 Years | 93 (10.7%) | 12 (1.8%) |
| 65 to 74 Years | 23 (20.3%) | 61 (34.5%) |
| 75 Years and over | 53 (43.4%) | 178 (51.9%) |
Disability Class by Sex by Age in Greendale
Disability Class: Hearing Difficulty
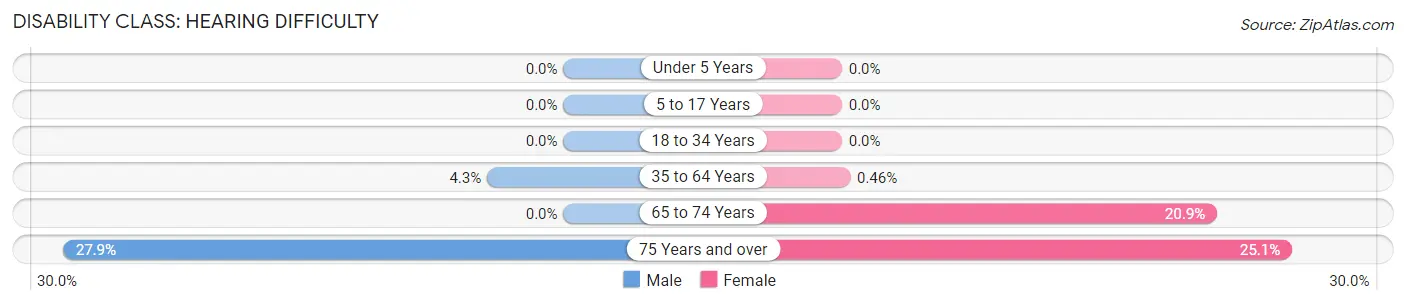
| Age Bracket | Male | Female |
| Under 5 Years | 0 (0.0%) | 0 (0.0%) |
| 5 to 17 Years | 0 (0.0%) | 0 (0.0%) |
| 18 to 34 Years | 0 (0.0%) | 0 (0.0%) |
| 35 to 64 Years | 37 (4.3%) | 3 (0.5%) |
| 65 to 74 Years | 0 (0.0%) | 37 (20.9%) |
| 75 Years and over | 34 (27.9%) | 86 (25.1%) |
Disability Class: Vision Difficulty
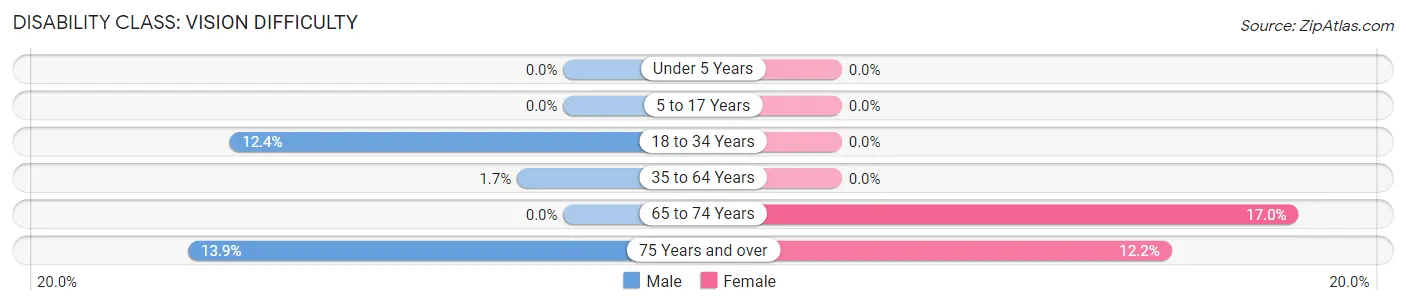
| Age Bracket | Male | Female |
| Under 5 Years | 0 (0.0%) | 0 (0.0%) |
| 5 to 17 Years | 0 (0.0%) | 0 (0.0%) |
| 18 to 34 Years | 32 (12.4%) | 0 (0.0%) |
| 35 to 64 Years | 15 (1.7%) | 0 (0.0%) |
| 65 to 74 Years | 0 (0.0%) | 30 (17.0%) |
| 75 Years and over | 17 (13.9%) | 42 (12.2%) |
Disability Class: Cognitive Difficulty
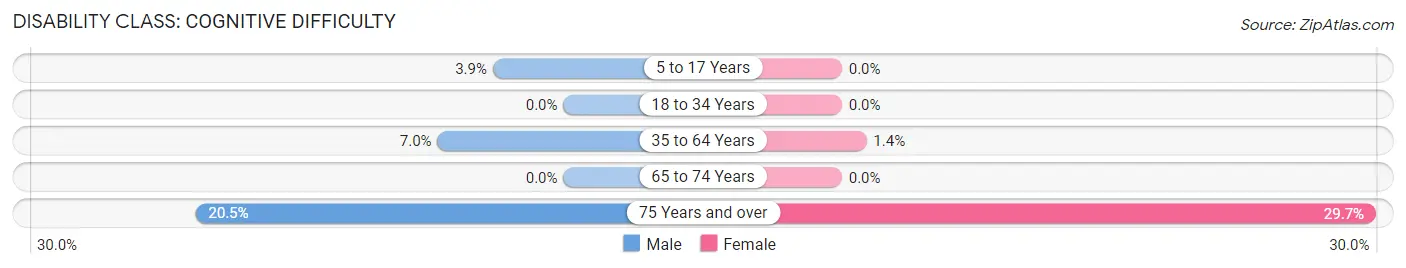
| Age Bracket | Male | Female |
| 5 to 17 Years | 14 (3.9%) | 0 (0.0%) |
| 18 to 34 Years | 0 (0.0%) | 0 (0.0%) |
| 35 to 64 Years | 61 (7.0%) | 9 (1.4%) |
| 65 to 74 Years | 0 (0.0%) | 0 (0.0%) |
| 75 Years and over | 25 (20.5%) | 102 (29.7%) |
Disability Class: Ambulatory Difficulty
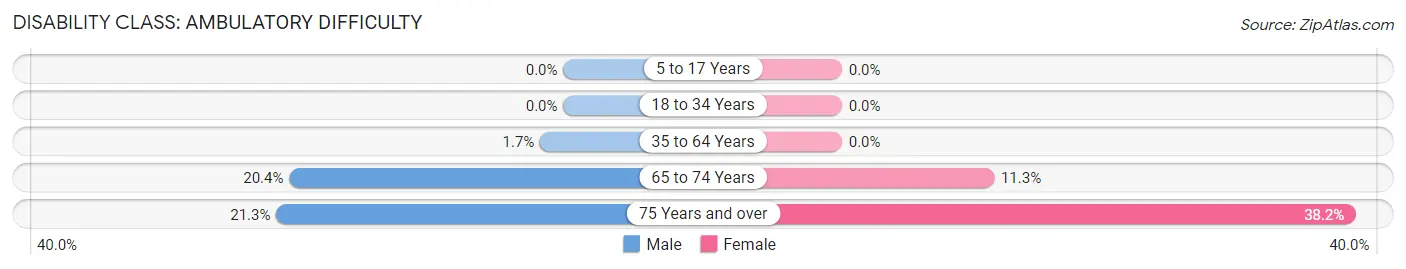
| Age Bracket | Male | Female |
| 5 to 17 Years | 0 (0.0%) | 0 (0.0%) |
| 18 to 34 Years | 0 (0.0%) | 0 (0.0%) |
| 35 to 64 Years | 15 (1.7%) | 0 (0.0%) |
| 65 to 74 Years | 23 (20.3%) | 20 (11.3%) |
| 75 Years and over | 26 (21.3%) | 131 (38.2%) |
Disability Class: Self-Care Difficulty
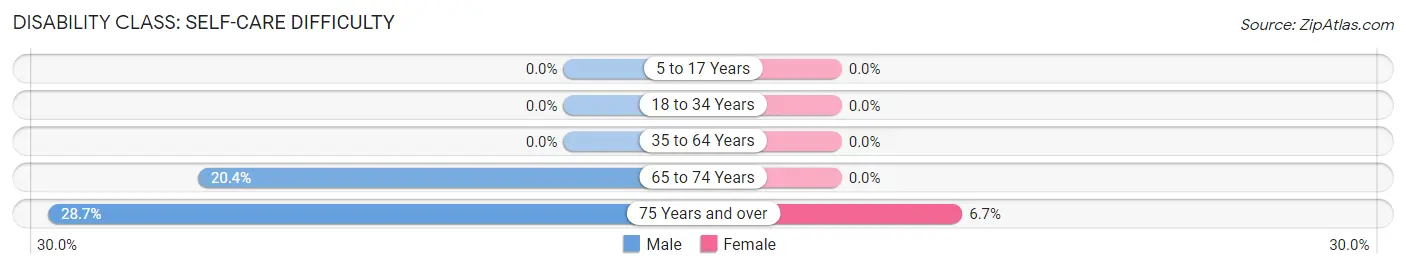
| Age Bracket | Male | Female |
| 5 to 17 Years | 0 (0.0%) | 0 (0.0%) |
| 18 to 34 Years | 0 (0.0%) | 0 (0.0%) |
| 35 to 64 Years | 0 (0.0%) | 0 (0.0%) |
| 65 to 74 Years | 23 (20.3%) | 0 (0.0%) |
| 75 Years and over | 35 (28.7%) | 23 (6.7%) |
Technology Access in Greendale
Computing Device Access in Greendale
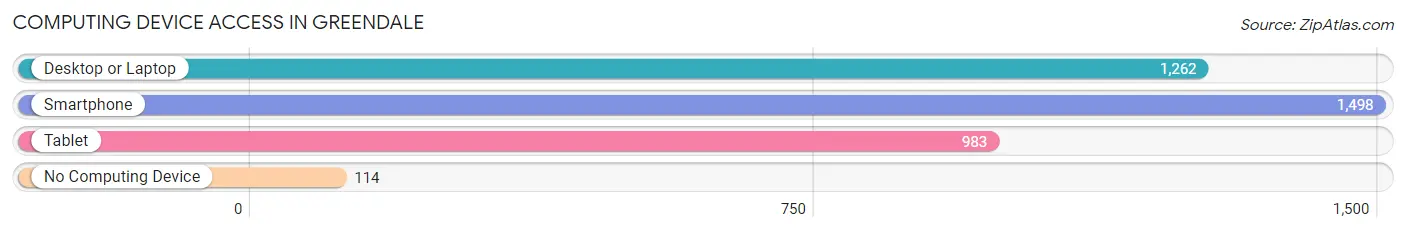
| Device Type | # Households | % Households |
| Desktop or Laptop | 1,262 | 73.8% |
| Smartphone | 1,498 | 87.5% |
| Tablet | 983 | 57.5% |
| No Computing Device | 114 | 6.7% |
| Total | 1,711 | 100.0% |
Internet Access in Greendale
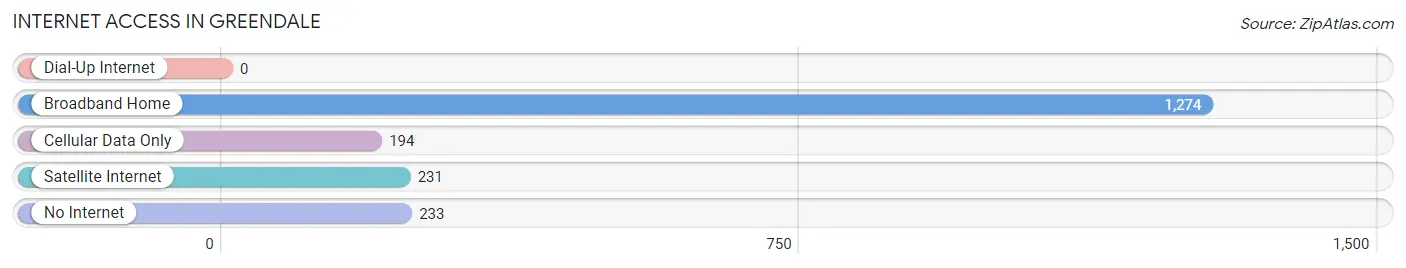
| Internet Type | # Households | % Households |
| Dial-Up Internet | 0 | 0.0% |
| Broadband Home | 1,274 | 74.5% |
| Cellular Data Only | 194 | 11.3% |
| Satellite Internet | 231 | 13.5% |
| No Internet | 233 | 13.6% |
| Total | 1,711 | 100.0% |
Greendale Summary
Greendale, Indiana is a small town located in Dearborn County, Indiana, United States. It is situated along the Ohio River, just north of Cincinnati, Ohio. The town was founded in 1818 and has a population of approximately 5,000 people.
History
Greendale was founded in 1818 by a group of settlers from Kentucky. The town was named after the nearby Greendale Creek, which was named after a local family. The town was originally a farming community, but it soon became a center for industry. In the late 19th century, the town was home to several factories, including a paper mill, a flour mill, and a sawmill.
In the early 20th century, Greendale experienced a period of growth and prosperity. The town was home to several businesses, including a bank, a hotel, and a movie theater. The town also had a thriving music scene, with several local bands playing in the area.
In the 1950s, the town began to decline as industry moved away. The town's population decreased and many of the businesses closed. In the late 1970s, the town began to experience a resurgence as new businesses moved in and the population began to grow again.
Geography
Greendale is located in Dearborn County, Indiana, United States. It is situated along the Ohio River, just north of Cincinnati, Ohio. The town is located in a rural area, with rolling hills and farmland. The town is surrounded by several small towns and villages, including Aurora, Lawrenceburg, and Dillsboro.
Economy
The economy of Greendale is largely based on agriculture and manufacturing. The town is home to several small businesses, including a grocery store, a hardware store, and a restaurant. The town also has several small manufacturing companies, including a plastics factory and a metal fabrication plant.
The town is also home to several tourist attractions, including the Greendale Historical Museum and the Greendale Railroad Museum. The town also hosts several annual festivals, including the Greendale Music Festival and the Greendale Arts Festival.
Demographics
As of the 2010 census, the population of Greendale was 5,000. The town is predominantly white, with a small African American population. The median household income is $45,000 and the median home value is $150,000. The town has a low unemployment rate and a high rate of homeownership.
Greendale is a small town with a rich history and a bright future. The town is home to a diverse population and a thriving economy. The town is a great place to live, work, and raise a family.
Common Questions
What is the Total Population of Greendale?
Total Population of Greendale is 3,967.
What is the Total Male Population of Greendale?
Total Male Population of Greendale is 1,882.
What is the Total Female Population of Greendale?
Total Female Population of Greendale is 2,085.
What is the Ratio of Males per 100 Females in Greendale?
There are 90.26 Males per 100 Females in Greendale.
What is the Ratio of Females per 100 Males in Greendale?
There are 110.79 Females per 100 Males in Greendale.
What is the Median Population Age in Greendale?
Median Population Age in Greendale is 42.9 Years.
What is the Average Family Size in Greendale
Average Family Size in Greendale is 3.0 People.
What is the Average Household Size in Greendale
Average Household Size in Greendale is 2.3 People.
What is Per Capita Income in Greendale?
Per Capita income in Greendale is $28,162.
What is the Median Family Income in Greendale?
Median Family Income in Greendale is $94,816.
What is the Median Household income in Greendale?
Median Household Income in Greendale is $70,668.
What is Income or Wage Gap in Greendale?
Income or Wage Gap in Greendale is 56.7%.
Women in Greendale earn 43.3 cents for every dollar earned by a man.
What is Inequality or Gini Index in Greendale?
Inequality or Gini Index in Greendale is 0.40.
How Large is the Labor Force in Greendale?
There are 1,960 People in the Labor Forcein in Greendale.
What is the Percentage of People in the Labor Force in Greendale?
60.0% of People are in the Labor Force in Greendale.