Zip Codes with the Highest Percentage of Population with a Degree in Science and Engineering in Evansville, IN
RELATED REPORTS & OPTIONS
Science and Engineering
Evansville
Compare Zip Codes
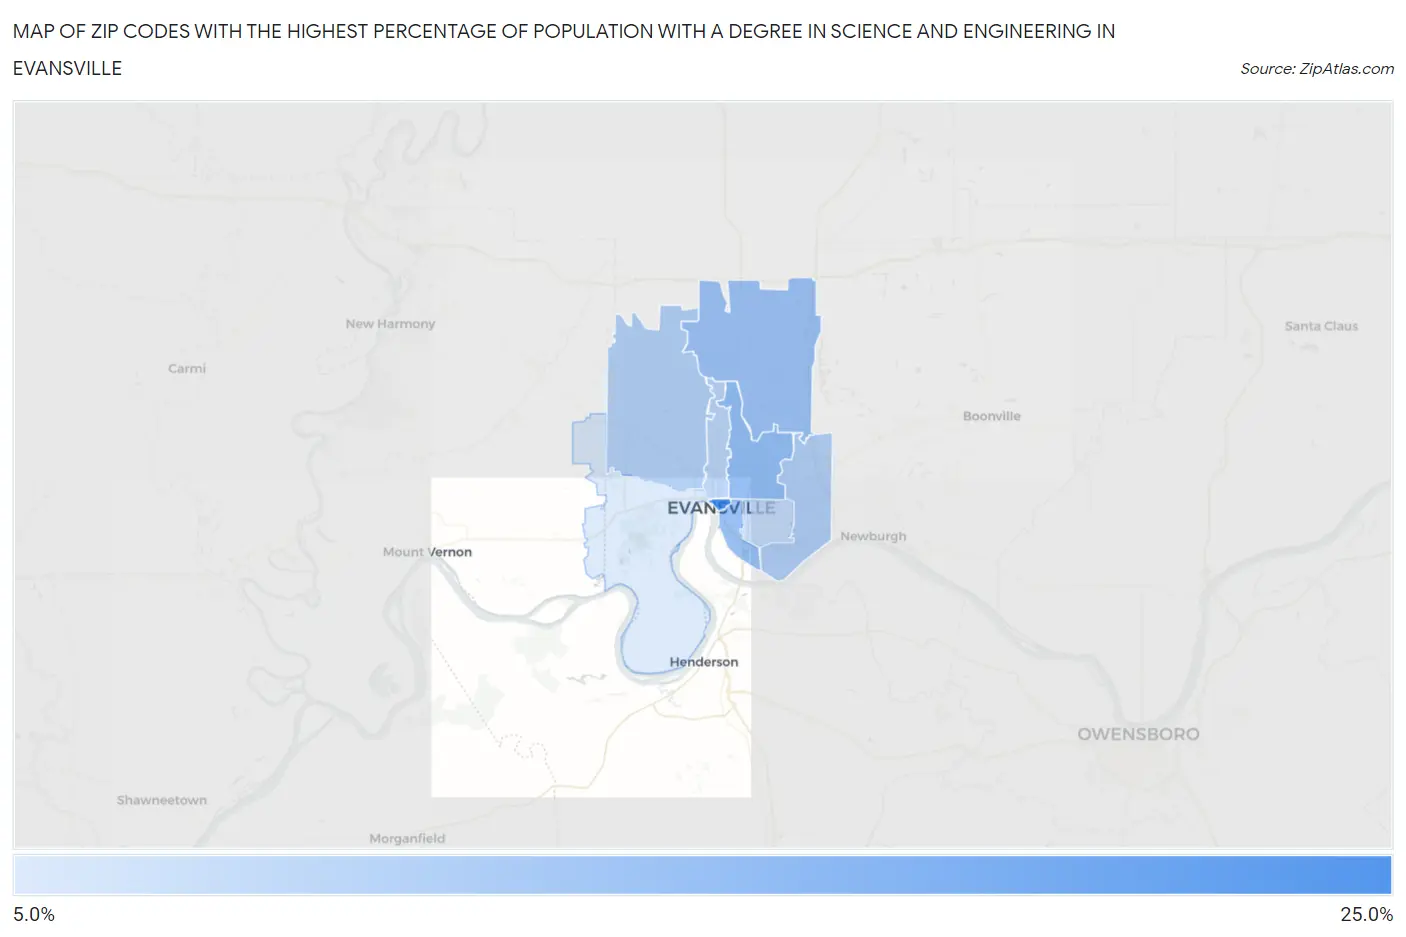
Map of Zip Codes with the Highest Percentage of Population with a Degree in Science and Engineering in Evansville
0.0%
25.0%
Zip Codes with the Highest Percentage of Population with a Degree in Science and Engineering in Evansville, IN
| Zip Code | % Graduates | vs State | vs National | |
| 1. | 47708 | 23.4% | 12.7%(+10.8)#85 | 9.8%(+13.6)#2,281 |
| 2. | 47711 | 15.6% | 12.7%(+2.90)#235 | 9.8%(+5.78)#6,116 |
| 3. | 47713 | 15.0% | 12.7%(+2.37)#259 | 9.8%(+5.25)#6,678 |
| 4. | 47725 | 14.7% | 12.7%(+2.00)#272 | 9.8%(+4.88)#7,043 |
| 5. | 47720 | 12.9% | 12.7%(+0.207)#340 | 9.8%(+3.09)#9,434 |
| 6. | 47715 | 12.7% | 12.7%(+0.050)#349 | 9.8%(+2.94)#9,677 |
| 7. | 47710 | 11.8% | 12.7%(-0.831)#395 | 9.8%(+2.06)#11,202 |
| 8. | 47714 | 10.8% | 12.7%(-1.87)#439 | 9.8%(+1.02)#13,315 |
| 9. | 47712 | 9.2% | 12.7%(-3.43)#503 | 9.8%(-0.543)#16,781 |
1
Common Questions
What are the Top 5 Zip Codes with the Highest Percentage of Population with a Degree in Science and Engineering in Evansville, IN?
Top 5 Zip Codes with the Highest Percentage of Population with a Degree in Science and Engineering in Evansville, IN are:
What zip code has the Highest Percentage of Population with a Degree in Science and Engineering in Evansville, IN?
47708 has the Highest Percentage of Population with a Degree in Science and Engineering in Evansville, IN with 23.4%.
What is the Percentage of Population with a Degree in Science and Engineering in Evansville, IN?
Percentage of Population with a Degree in Science and Engineering in Evansville is 12.3%.
What is the Percentage of Population with a Degree in Science and Engineering in Indiana?
Percentage of Population with a Degree in Science and Engineering in Indiana is 12.7%.
What is the Percentage of Population with a Degree in Science and Engineering in the United States?
Percentage of Population with a Degree in Science and Engineering in the United States is 9.8%.