Fort Branch, IN
Fort Branch Map
Fort Branch Overview
3,561
TOTAL POPULATION
1,835
MALE POPULATION
1,726
FEMALE POPULATION
106.32
MALES / 100 FEMALES
94.06
FEMALES / 100 MALES
37.5
MEDIAN AGE
2.7
AVG FAMILY SIZE
2.2
AVG HOUSEHOLD SIZE
$31,314
PER CAPITA INCOME
$72,303
AVG FAMILY INCOME
$64,034
AVG HOUSEHOLD INCOME
43.7%
WAGE / INCOME GAP [ % ]
56.3¢/ $1
WAGE / INCOME GAP [ $ ]
0.37
INEQUALITY / GINI INDEX
2,097
LABOR FORCE [ PEOPLE ]
72.3%
PERCENT IN LABOR FORCE
2.5%
UNEMPLOYMENT RATE
Fort Branch Zip Codes
Fort Branch Area Codes
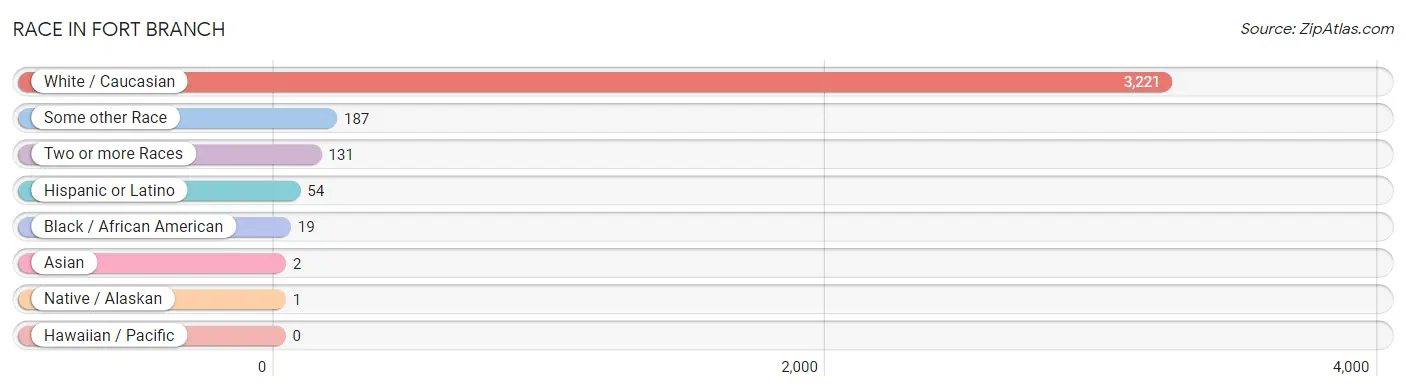
Race in Fort Branch
The most populous races in Fort Branch are White / Caucasian (3,221 | 90.4%), Some other Race (187 | 5.2%), and Two or more Races (131 | 3.7%).
| Race | # Population | % Population |
| Asian | 2 | 0.1% |
| Black / African American | 19 | 0.5% |
| Hawaiian / Pacific | 0 | 0.0% |
| Hispanic or Latino | 54 | 1.5% |
| Native / Alaskan | 1 | 0.0% |
| White / Caucasian | 3,221 | 90.4% |
| Two or more Races | 131 | 3.7% |
| Some other Race | 187 | 5.2% |
| Total | 3,561 | 100.0% |
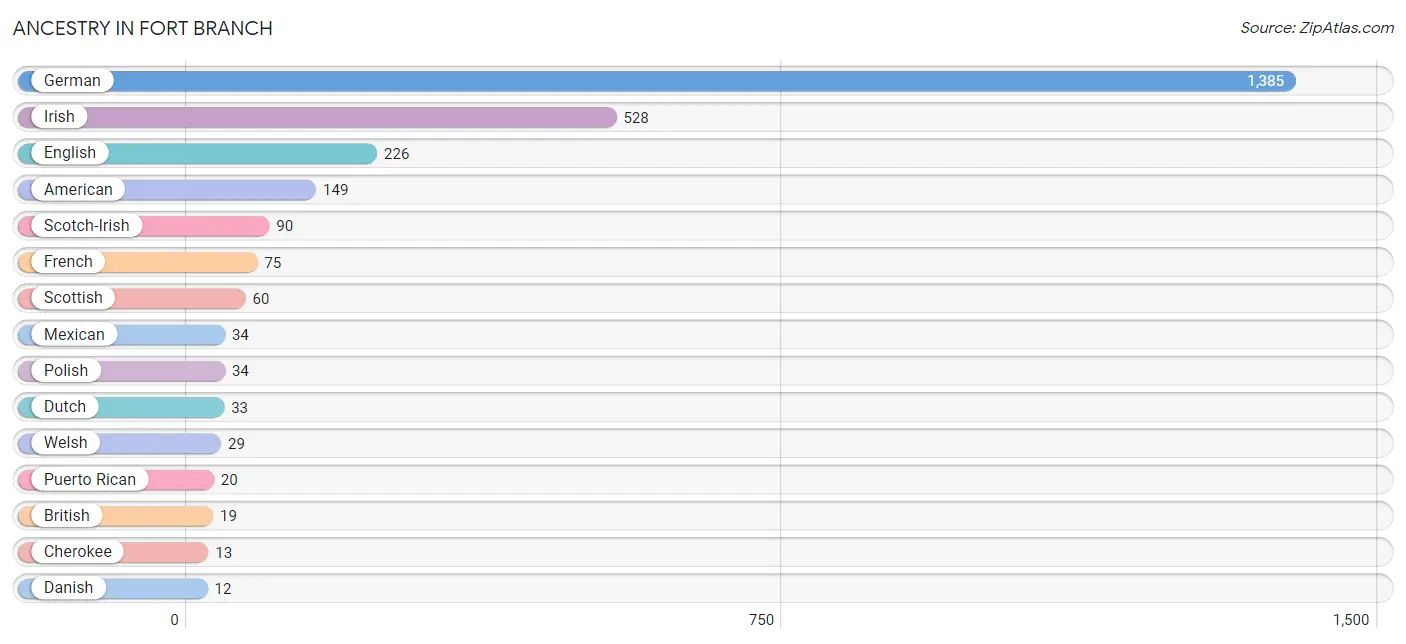
Ancestry in Fort Branch
The most populous ancestries reported in Fort Branch are German (1,385 | 38.9%), Irish (528 | 14.8%), English (226 | 6.4%), American (149 | 4.2%), and Scotch-Irish (90 | 2.5%), together accounting for 66.8% of all Fort Branch residents.
| Ancestry | # Population | % Population |
| American | 149 | 4.2% |
| British | 19 | 0.5% |
| Cherokee | 13 | 0.4% |
| Danish | 12 | 0.3% |
| Dutch | 33 | 0.9% |
| English | 226 | 6.4% |
| European | 6 | 0.2% |
| French | 75 | 2.1% |
| French Canadian | 8 | 0.2% |
| German | 1,385 | 38.9% |
| Greek | 11 | 0.3% |
| Hungarian | 1 | 0.0% |
| Irish | 528 | 14.8% |
| Italian | 5 | 0.1% |
| Korean | 2 | 0.1% |
| Mexican | 34 | 0.9% |
| Polish | 34 | 0.9% |
| Puerto Rican | 20 | 0.6% |
| Scotch-Irish | 90 | 2.5% |
| Scottish | 60 | 1.7% |
| Welsh | 29 | 0.8% | View All 21 Rows |
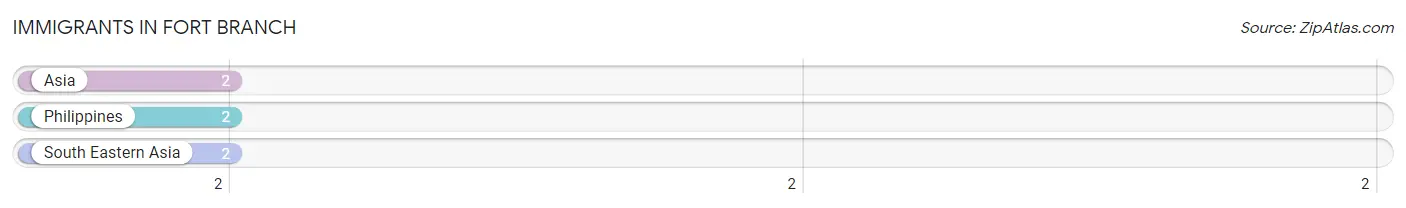
Immigrants in Fort Branch
The most numerous immigrant groups reported in Fort Branch came from Asia (2 | 0.1%), Philippines (2 | 0.1%), and South Eastern Asia (2 | 0.1%), together accounting for 0.2% of all Fort Branch residents.
| Immigration Origin | # Population | % Population |
| Asia | 2 | 0.1% |
| Philippines | 2 | 0.1% |
| South Eastern Asia | 2 | 0.1% | View All 3 Rows |
Sex and Age in Fort Branch
Sex and Age in Fort Branch
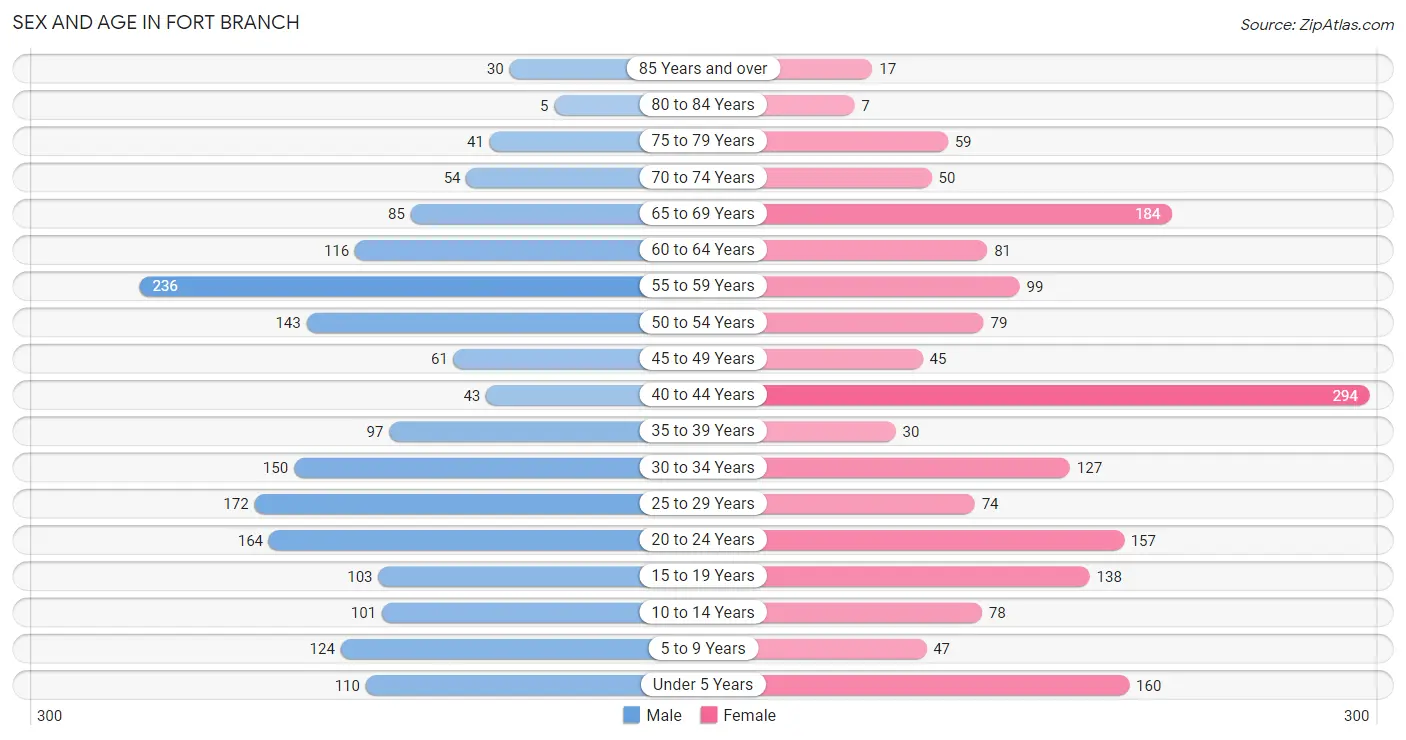
The most populous age groups in Fort Branch are 55 to 59 Years (236 | 12.9%) for men and 40 to 44 Years (294 | 17.0%) for women.
| Age Bracket | Male | Female |
| Under 5 Years | 110 (6.0%) | 160 (9.3%) |
| 5 to 9 Years | 124 (6.8%) | 47 (2.7%) |
| 10 to 14 Years | 101 (5.5%) | 78 (4.5%) |
| 15 to 19 Years | 103 (5.6%) | 138 (8.0%) |
| 20 to 24 Years | 164 (8.9%) | 157 (9.1%) |
| 25 to 29 Years | 172 (9.4%) | 74 (4.3%) |
| 30 to 34 Years | 150 (8.2%) | 127 (7.4%) |
| 35 to 39 Years | 97 (5.3%) | 30 (1.7%) |
| 40 to 44 Years | 43 (2.3%) | 294 (17.0%) |
| 45 to 49 Years | 61 (3.3%) | 45 (2.6%) |
| 50 to 54 Years | 143 (7.8%) | 79 (4.6%) |
| 55 to 59 Years | 236 (12.9%) | 99 (5.7%) |
| 60 to 64 Years | 116 (6.3%) | 81 (4.7%) |
| 65 to 69 Years | 85 (4.6%) | 184 (10.7%) |
| 70 to 74 Years | 54 (2.9%) | 50 (2.9%) |
| 75 to 79 Years | 41 (2.2%) | 59 (3.4%) |
| 80 to 84 Years | 5 (0.3%) | 7 (0.4%) |
| 85 Years and over | 30 (1.6%) | 17 (1.0%) |
| Total | 1,835 (100.0%) | 1,726 (100.0%) |
Families and Households in Fort Branch
Median Family Size in Fort Branch
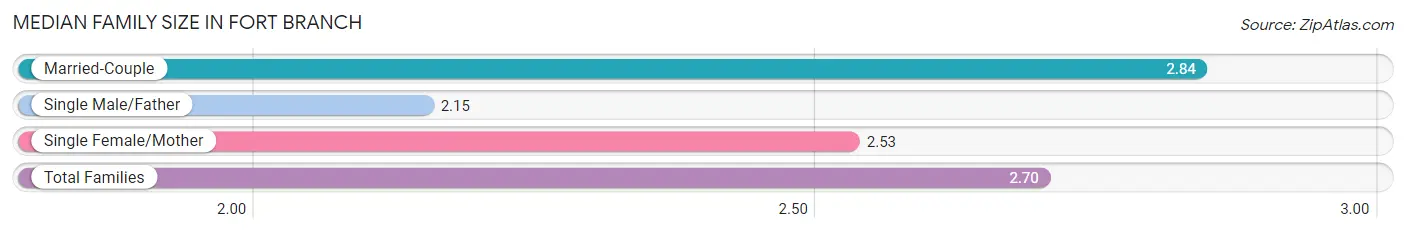
The median family size in Fort Branch is 2.70 persons per family, with married-couple families (637 | 66.2%) accounting for the largest median family size of 2.84 persons per family. On the other hand, single male/father families (74 | 7.7%) represent the smallest median family size with 2.15 persons per family.
| Family Type | # Families | Family Size |
| Married-Couple | 637 (66.2%) | 2.84 |
| Single Male/Father | 74 (7.7%) | 2.15 |
| Single Female/Mother | 251 (26.1%) | 2.53 |
| Total Families | 962 (100.0%) | 2.70 |
Median Household Size in Fort Branch
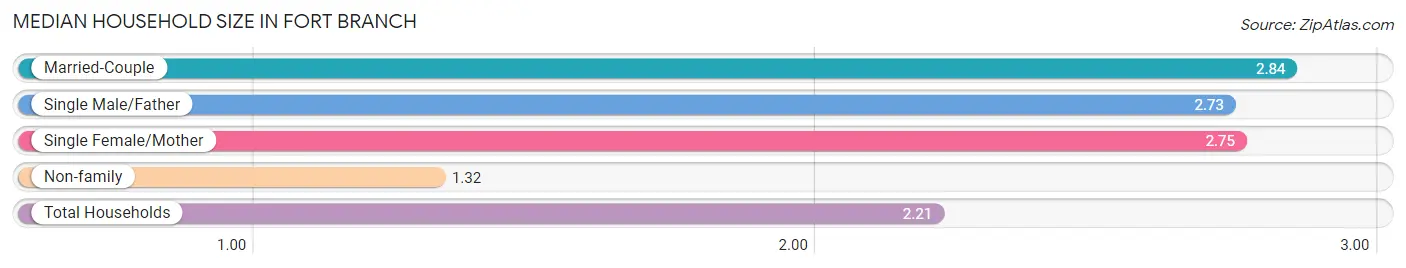
The median household size in Fort Branch is 2.21 persons per household, with married-couple households (637 | 39.5%) accounting for the largest median household size of 2.84 persons per household. non-family households (649 | 40.3%) represent the smallest median household size with 1.32 persons per household.
| Household Type | # Households | Household Size |
| Married-Couple | 637 (39.5%) | 2.84 |
| Single Male/Father | 74 (4.6%) | 2.73 |
| Single Female/Mother | 251 (15.6%) | 2.75 |
| Non-family | 649 (40.3%) | 1.32 |
| Total Households | 1,611 (100.0%) | 2.21 |
Household Size by Marriage Status in Fort Branch
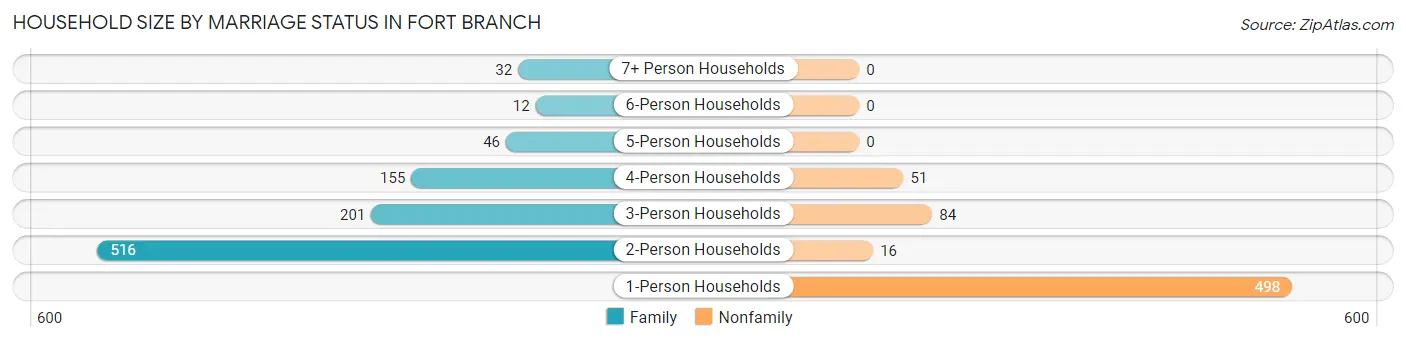
Out of a total of 1,611 households in Fort Branch, 962 (59.7%) are family households, while 649 (40.3%) are nonfamily households. The most numerous type of family households are 2-person households, comprising 516, and the most common type of nonfamily households are 1-person households, comprising 498.
| Household Size | Family Households | Nonfamily Households |
| 1-Person Households | - | 498 (30.9%) |
| 2-Person Households | 516 (32.0%) | 16 (1.0%) |
| 3-Person Households | 201 (12.5%) | 84 (5.2%) |
| 4-Person Households | 155 (9.6%) | 51 (3.2%) |
| 5-Person Households | 46 (2.9%) | 0 (0.0%) |
| 6-Person Households | 12 (0.7%) | 0 (0.0%) |
| 7+ Person Households | 32 (2.0%) | 0 (0.0%) |
| Total | 962 (59.7%) | 649 (40.3%) |
Female Fertility in Fort Branch
Fertility by Age in Fort Branch
Average fertility rate in Fort Branch is 63.0 births per 1,000 women. Women in the age bracket of 20 to 34 years have the highest fertility rate with 154.0 births per 1,000 women. Women in the age bracket of 20 to 34 years acount for 100.0% of all women with births.
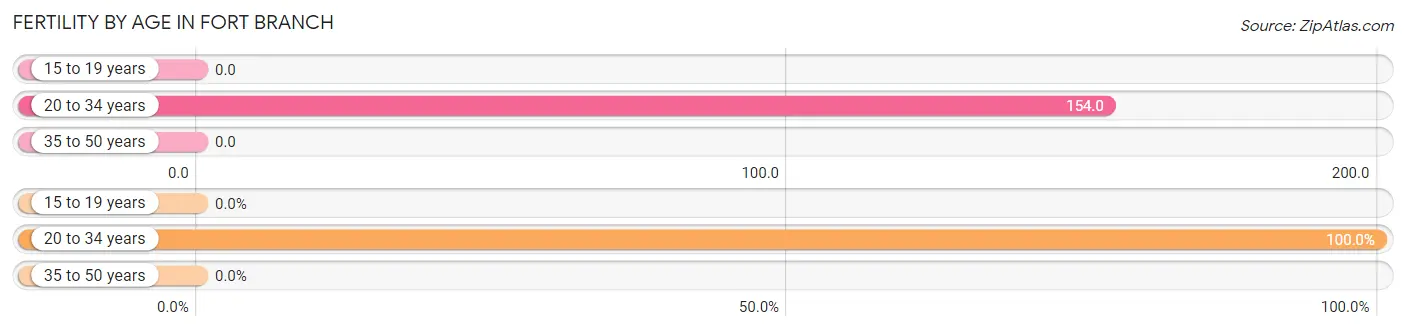
| Age Bracket | Women with Births | Births / 1,000 Women |
| 15 to 19 years | 0 (0.0%) | 0.0 |
| 20 to 34 years | 55 (100.0%) | 154.0 |
| 35 to 50 years | 0 (0.0%) | 0.0 |
| Total | 55 (100.0%) | 63.0 |
Fertility by Age by Marriage Status in Fort Branch
29.1% of women with births (55) in Fort Branch are married. The highest percentage of unmarried women with births falls into 20 to 34 years age bracket with 70.9% of them unmarried at the time of birth, while the lowest percentage of unmarried women with births belong to 20 to 34 years age bracket with 70.9% of them unmarried.
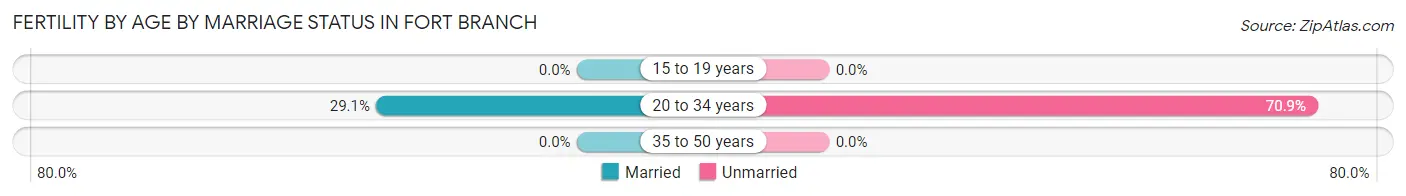
| Age Bracket | Married | Unmarried |
| 15 to 19 years | 0 (0.0%) | 0 (0.0%) |
| 20 to 34 years | 16 (29.1%) | 39 (70.9%) |
| 35 to 50 years | 0 (0.0%) | 0 (0.0%) |
| Total | 16 (29.1%) | 39 (70.9%) |
Fertility by Education in Fort Branch
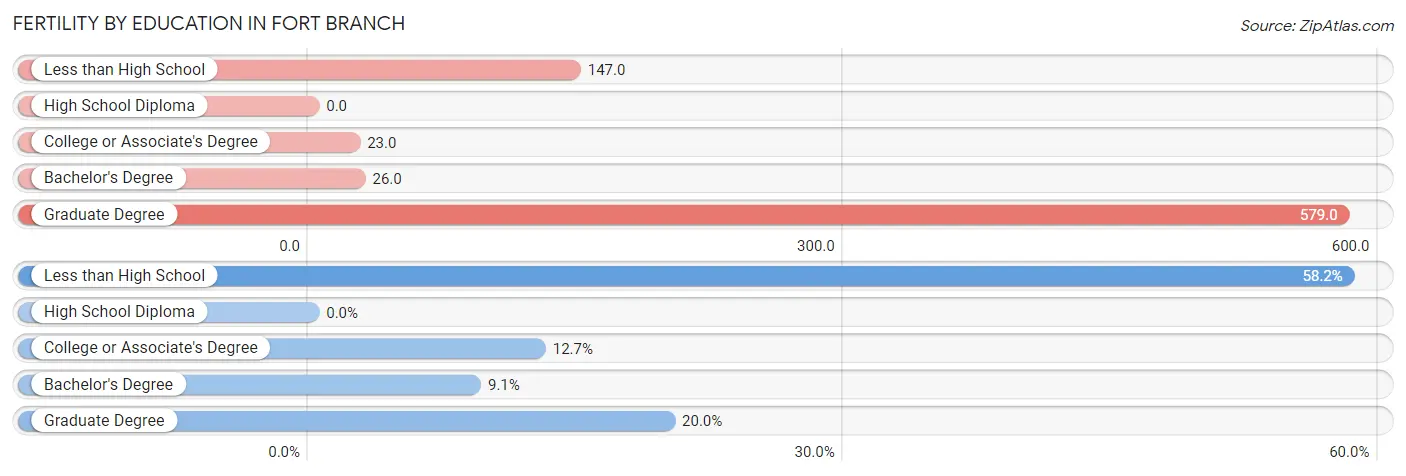
| Educational Attainment | Women with Births | Births / 1,000 Women |
| Less than High School | 32 (58.2%) | 147.0 |
| High School Diploma | 0 (0.0%) | 0.0 |
| College or Associate's Degree | 7 (12.7%) | 23.0 |
| Bachelor's Degree | 5 (9.1%) | 26.0 |
| Graduate Degree | 11 (20.0%) | 579.0 |
| Total | 55 (100.0%) | 63.0 |
Fertility by Education by Marriage Status in Fort Branch
70.9% of women with births in Fort Branch are unmarried. Women with the educational attainment of bachelor's degree are most likely to be married with 100.0% of them married at childbirth, while women with the educational attainment of less than high school are least likely to be married with 100.0% of them unmarried at childbirth.
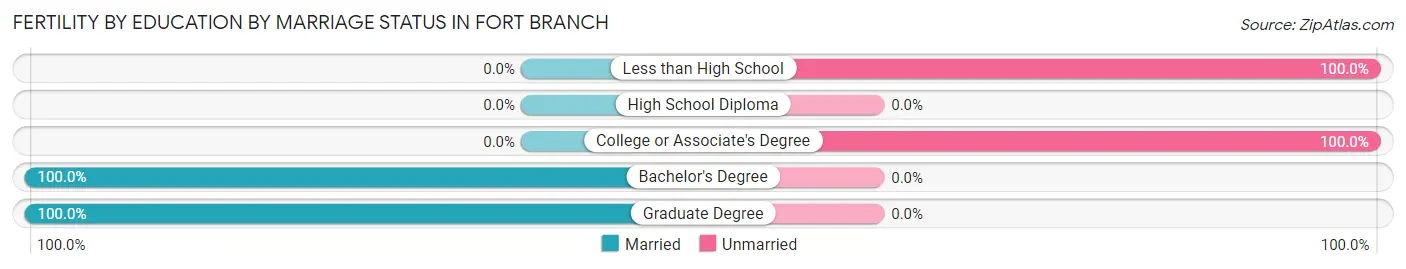
| Educational Attainment | Married | Unmarried |
| Less than High School | 0 (0.0%) | 32 (100.0%) |
| High School Diploma | 0 (0.0%) | 0 (0.0%) |
| College or Associate's Degree | 0 (0.0%) | 7 (100.0%) |
| Bachelor's Degree | 5 (100.0%) | 0 (0.0%) |
| Graduate Degree | 11 (100.0%) | 0 (0.0%) |
| Total | 16 (29.1%) | 39 (70.9%) |
Income in Fort Branch
Income Overview in Fort Branch
Per Capita Income in Fort Branch is $31,314, while median incomes of families and households are $72,303 and $64,034 respectively.
| Characteristic | Number | Measure |
| Per Capita Income | 3,561 | $31,314 |
| Median Family Income | 962 | $72,303 |
| Mean Family Income | 962 | $79,309 |
| Median Household Income | 1,611 | $64,034 |
| Mean Household Income | 1,611 | $69,714 |
| Income Deficit | 962 | $0 |
| Wage / Income Gap (%) | 3,561 | 43.66% |
| Wage / Income Gap ($) | 3,561 | 56.34¢ per $1 |
| Gini / Inequality Index | 3,561 | 0.37 |
Earnings by Sex in Fort Branch
Average Earnings in Fort Branch are $43,520, $55,769 for men and $31,419 for women, a difference of 43.7%.
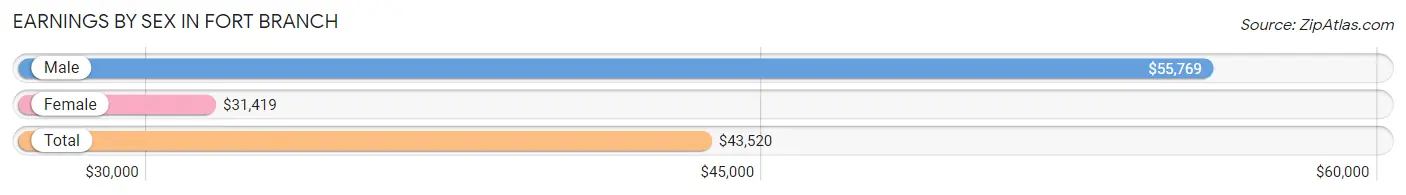
| Sex | Number | Average Earnings |
| Male | 1,230 (57.5%) | $55,769 |
| Female | 909 (42.5%) | $31,419 |
| Total | 2,139 (100.0%) | $43,520 |
Earnings by Sex by Income Bracket in Fort Branch
The most common earnings brackets in Fort Branch are $55,000 to $64,999 for men (306 | 24.9%) and $35,000 to $39,999 for women (153 | 16.8%).
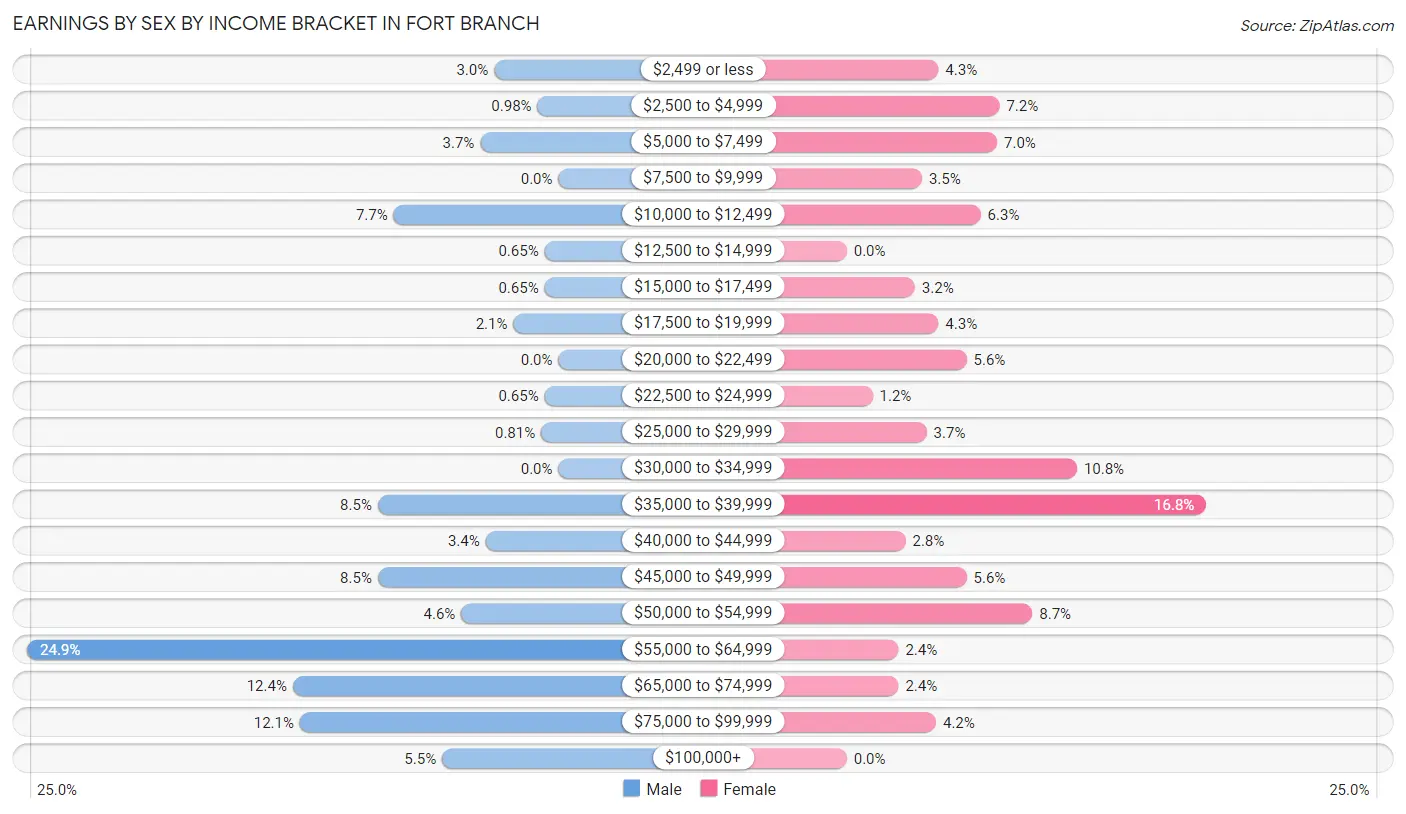
| Income | Male | Female |
| $2,499 or less | 37 (3.0%) | 39 (4.3%) |
| $2,500 to $4,999 | 12 (1.0%) | 65 (7.1%) |
| $5,000 to $7,499 | 45 (3.7%) | 64 (7.0%) |
| $7,500 to $9,999 | 0 (0.0%) | 32 (3.5%) |
| $10,000 to $12,499 | 95 (7.7%) | 57 (6.3%) |
| $12,500 to $14,999 | 8 (0.6%) | 0 (0.0%) |
| $15,000 to $17,499 | 8 (0.6%) | 29 (3.2%) |
| $17,500 to $19,999 | 26 (2.1%) | 39 (4.3%) |
| $20,000 to $22,499 | 0 (0.0%) | 51 (5.6%) |
| $22,500 to $24,999 | 8 (0.6%) | 11 (1.2%) |
| $25,000 to $29,999 | 10 (0.8%) | 34 (3.7%) |
| $30,000 to $34,999 | 0 (0.0%) | 98 (10.8%) |
| $35,000 to $39,999 | 104 (8.5%) | 153 (16.8%) |
| $40,000 to $44,999 | 42 (3.4%) | 25 (2.8%) |
| $45,000 to $49,999 | 104 (8.5%) | 51 (5.6%) |
| $50,000 to $54,999 | 56 (4.5%) | 79 (8.7%) |
| $55,000 to $64,999 | 306 (24.9%) | 22 (2.4%) |
| $65,000 to $74,999 | 153 (12.4%) | 22 (2.4%) |
| $75,000 to $99,999 | 149 (12.1%) | 38 (4.2%) |
| $100,000+ | 67 (5.4%) | 0 (0.0%) |
| Total | 1,230 (100.0%) | 909 (100.0%) |
Earnings by Sex by Educational Attainment in Fort Branch
Average earnings in Fort Branch are $56,922 for men and $35,417 for women, a difference of 37.8%. Men with an educational attainment of graduate degree enjoy the highest average annual earnings of $77,292, while those with bachelor's degree education earn the least with $55,357. Women with an educational attainment of graduate degree earn the most with the average annual earnings of $64,219, while those with college or associate's degree education have the smallest earnings of $30,231.
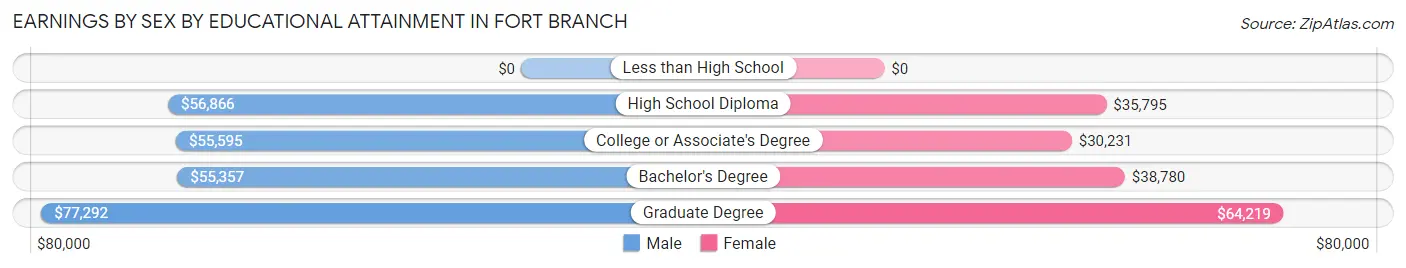
| Educational Attainment | Male Income | Female Income |
| Less than High School | - | - |
| High School Diploma | $56,866 | $35,795 |
| College or Associate's Degree | $55,595 | $30,231 |
| Bachelor's Degree | $55,357 | $38,780 |
| Graduate Degree | $77,292 | $64,219 |
| Total | $56,922 | $35,417 |
Family Income in Fort Branch
Family Income Brackets in Fort Branch
According to the Fort Branch family income data, there are 243 families falling into the $100,000 to $149,999 income range, which is the most common income bracket and makes up 25.3% of all families. Conversely, the $25,000 to $34,999 income bracket is the least frequent group with only 9 families (0.9%) belonging to this category.
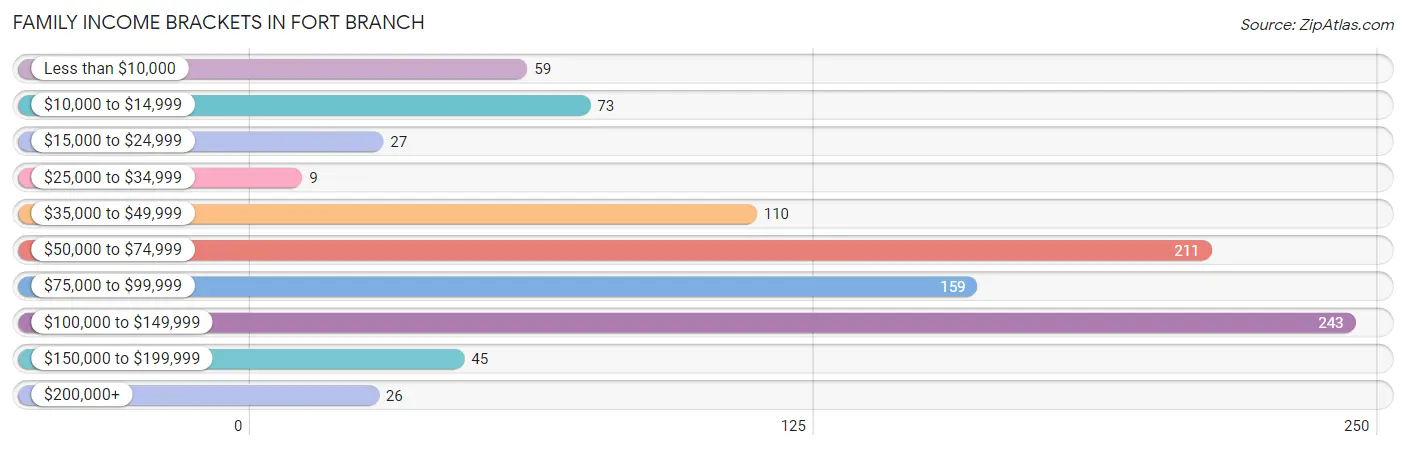
| Income Bracket | # Families | % Families |
| Less than $10,000 | 59 | 6.1% |
| $10,000 to $14,999 | 73 | 7.6% |
| $15,000 to $24,999 | 27 | 2.8% |
| $25,000 to $34,999 | 9 | 0.9% |
| $35,000 to $49,999 | 110 | 11.4% |
| $50,000 to $74,999 | 211 | 21.9% |
| $75,000 to $99,999 | 159 | 16.5% |
| $100,000 to $149,999 | 243 | 25.3% |
| $150,000 to $199,999 | 45 | 4.7% |
| $200,000+ | 26 | 2.7% |
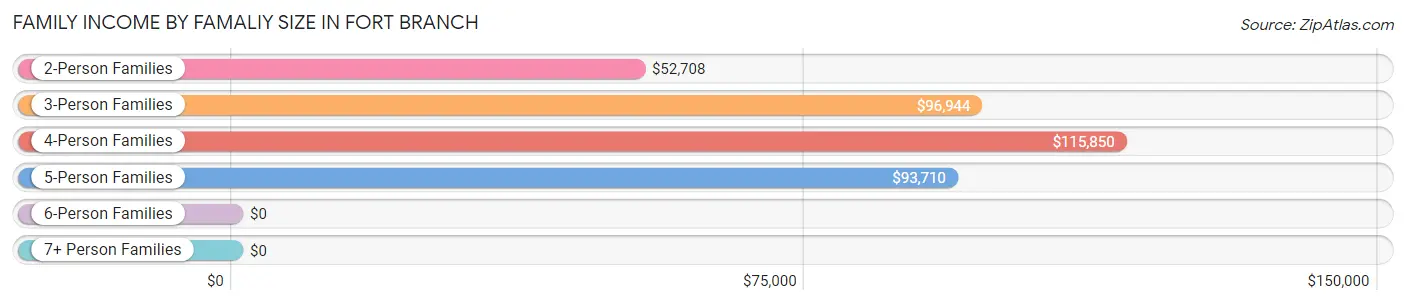
Family Income by Famaliy Size in Fort Branch
4-person families (129 | 13.4%) account for the highest median family income in Fort Branch with $115,850 per family, while 3-person families (152 | 15.8%) have the highest median income of $32,315 per family member.
| Income Bracket | # Families | Median Income |
| 2-Person Families | 591 (61.4%) | $52,708 |
| 3-Person Families | 152 (15.8%) | $96,944 |
| 4-Person Families | 129 (13.4%) | $115,850 |
| 5-Person Families | 46 (4.8%) | $93,710 |
| 6-Person Families | 12 (1.3%) | $0 |
| 7+ Person Families | 32 (3.3%) | $0 |
| Total | 962 (100.0%) | $72,303 |
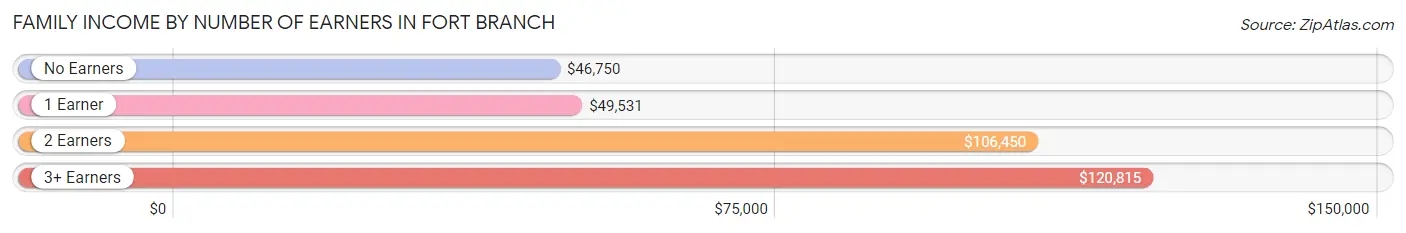
Family Income by Number of Earners in Fort Branch
The median family income in Fort Branch is $72,303, with families comprising 3+ earners (125) having the highest median family income of $120,815, while families with no earners (154) have the lowest median family income of $46,750, accounting for 13.0% and 16.0% of families, respectively.
| Number of Earners | # Families | Median Income |
| No Earners | 154 (16.0%) | $46,750 |
| 1 Earner | 352 (36.6%) | $49,531 |
| 2 Earners | 331 (34.4%) | $106,450 |
| 3+ Earners | 125 (13.0%) | $120,815 |
| Total | 962 (100.0%) | $72,303 |
Household Income in Fort Branch
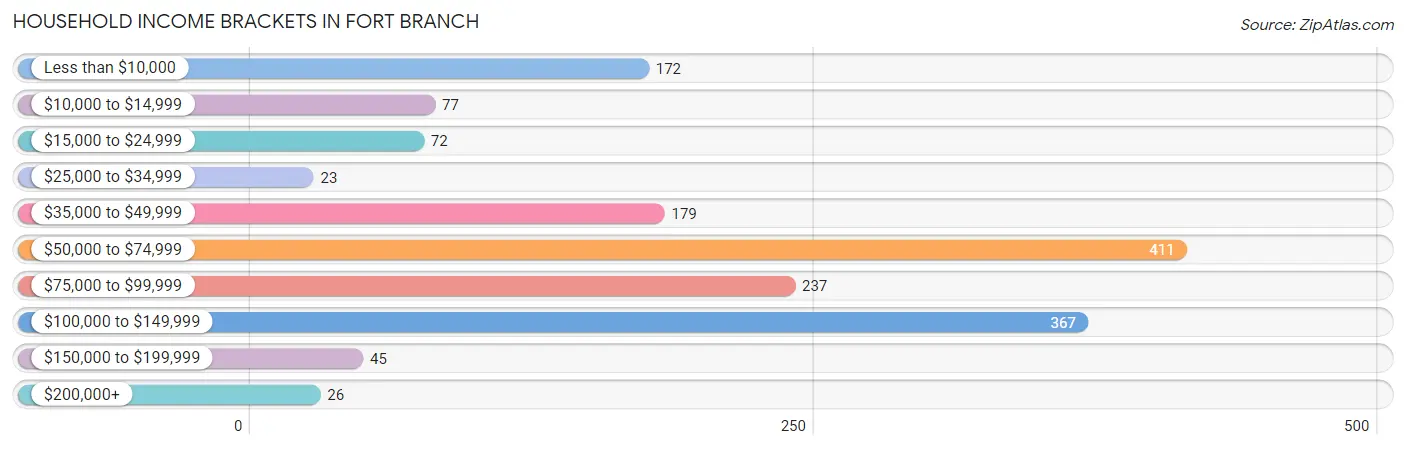
Household Income Brackets in Fort Branch
With 411 households falling in the category, the $50,000 to $74,999 income range is the most frequent in Fort Branch, accounting for 25.5% of all households. In contrast, only 23 households (1.4%) fall into the $25,000 to $34,999 income bracket, making it the least populous group.
| Income Bracket | # Households | % Households |
| Less than $10,000 | 172 | 10.7% |
| $10,000 to $14,999 | 77 | 4.8% |
| $15,000 to $24,999 | 72 | 4.5% |
| $25,000 to $34,999 | 23 | 1.4% |
| $35,000 to $49,999 | 179 | 11.1% |
| $50,000 to $74,999 | 411 | 25.5% |
| $75,000 to $99,999 | 237 | 14.7% |
| $100,000 to $149,999 | 367 | 22.8% |
| $150,000 to $199,999 | 45 | 2.8% |
| $200,000+ | 26 | 1.6% |
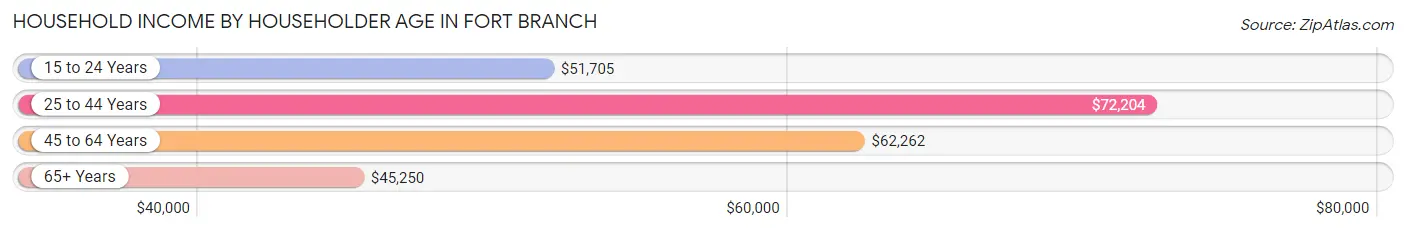
Household Income by Householder Age in Fort Branch
The median household income in Fort Branch is $64,034, with the highest median household income of $72,204 found in the 25 to 44 years age bracket for the primary householder. A total of 697 households (43.3%) fall into this category. Meanwhile, the 65+ years age bracket for the primary householder has the lowest median household income of $45,250, with 300 households (18.6%) in this group.
| Income Bracket | # Households | Median Income |
| 15 to 24 Years | 72 (4.5%) | $51,705 |
| 25 to 44 Years | 697 (43.3%) | $72,204 |
| 45 to 64 Years | 542 (33.6%) | $62,262 |
| 65+ Years | 300 (18.6%) | $45,250 |
| Total | 1,611 (100.0%) | $64,034 |
Poverty in Fort Branch
Income Below Poverty by Sex and Age in Fort Branch
With 11.4% poverty level for males and 17.9% for females among the residents of Fort Branch, 18 to 24 year old males and 18 to 24 year old females are the most vulnerable to poverty, with 77 males (46.9%) and 85 females (39.5%) in their respective age groups living below the poverty level.
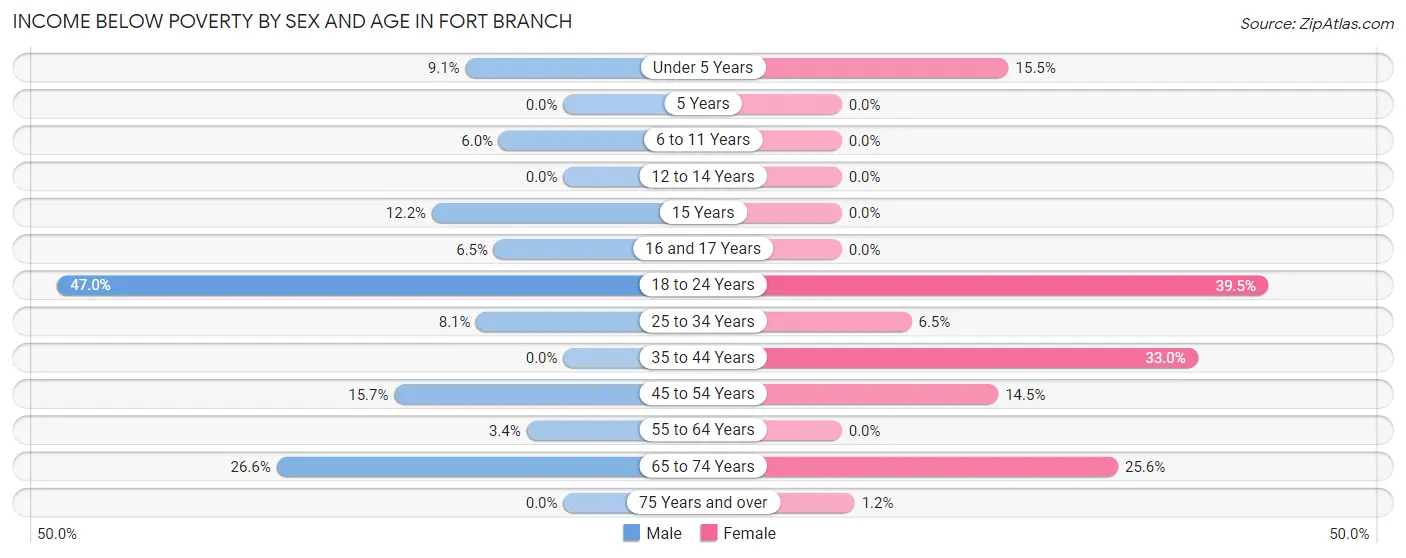
| Age Bracket | Male | Female |
| Under 5 Years | 10 (9.1%) | 24 (15.5%) |
| 5 Years | 0 (0.0%) | 0 (0.0%) |
| 6 to 11 Years | 7 (6.0%) | 0 (0.0%) |
| 12 to 14 Years | 0 (0.0%) | 0 (0.0%) |
| 15 Years | 5 (12.2%) | 0 (0.0%) |
| 16 and 17 Years | 4 (6.5%) | 0 (0.0%) |
| 18 to 24 Years | 77 (46.9%) | 85 (39.5%) |
| 25 to 34 Years | 26 (8.1%) | 13 (6.5%) |
| 35 to 44 Years | 0 (0.0%) | 107 (33.0%) |
| 45 to 54 Years | 32 (15.7%) | 18 (14.5%) |
| 55 to 64 Years | 12 (3.4%) | 0 (0.0%) |
| 65 to 74 Years | 37 (26.6%) | 60 (25.6%) |
| 75 Years and over | 0 (0.0%) | 1 (1.2%) |
| Total | 210 (11.4%) | 308 (17.9%) |
Income Above Poverty by Sex and Age in Fort Branch
According to the poverty statistics in Fort Branch, males aged 5 years and females aged 5 years are the age groups that are most secure financially, with 100.0% of males and 100.0% of females in these age groups living above the poverty line.
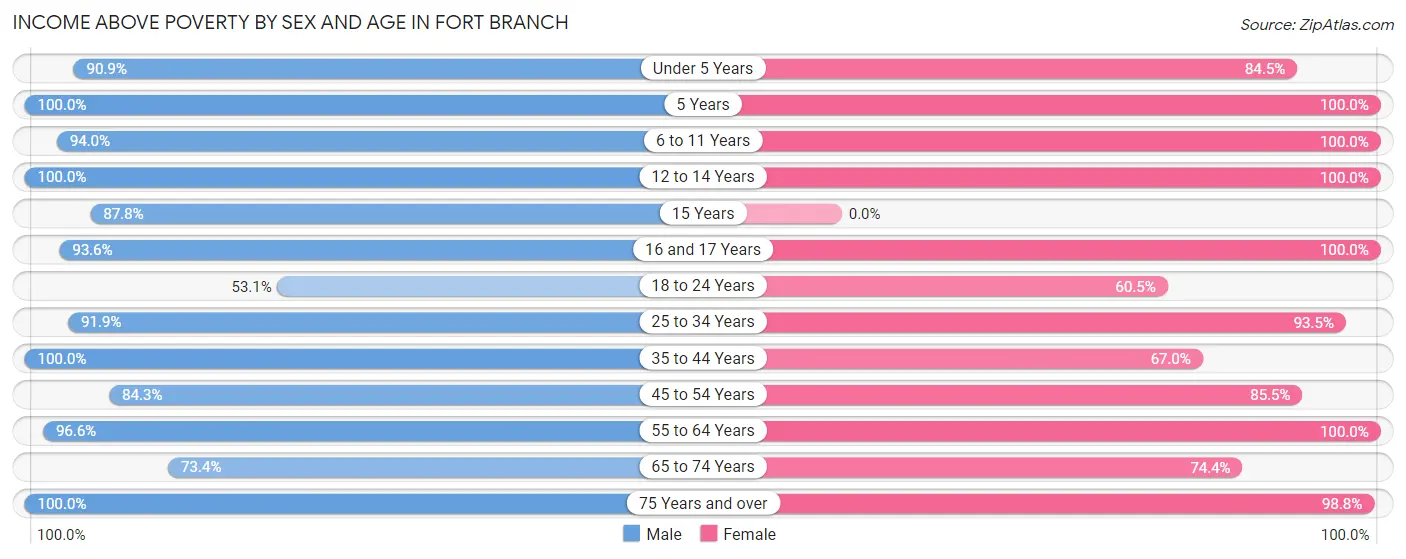
| Age Bracket | Male | Female |
| Under 5 Years | 100 (90.9%) | 131 (84.5%) |
| 5 Years | 28 (100.0%) | 23 (100.0%) |
| 6 to 11 Years | 110 (94.0%) | 88 (100.0%) |
| 12 to 14 Years | 80 (100.0%) | 14 (100.0%) |
| 15 Years | 36 (87.8%) | 0 (0.0%) |
| 16 and 17 Years | 58 (93.5%) | 80 (100.0%) |
| 18 to 24 Years | 87 (53.0%) | 130 (60.5%) |
| 25 to 34 Years | 296 (91.9%) | 188 (93.5%) |
| 35 to 44 Years | 140 (100.0%) | 217 (67.0%) |
| 45 to 54 Years | 172 (84.3%) | 106 (85.5%) |
| 55 to 64 Years | 340 (96.6%) | 180 (100.0%) |
| 65 to 74 Years | 102 (73.4%) | 174 (74.4%) |
| 75 Years and over | 76 (100.0%) | 82 (98.8%) |
| Total | 1,625 (88.6%) | 1,413 (82.1%) |
Income Below Poverty Among Married-Couple Families in Fort Branch
The poverty statistics for married-couple families in Fort Branch show that 7.1% or 45 of the total 637 families live below the poverty line. Families with 3 or 4 children have the highest poverty rate of 15.7%, comprising of 8 families. On the other hand, families with 1 or 2 children have the lowest poverty rate of 0.0%, which includes 0 families.
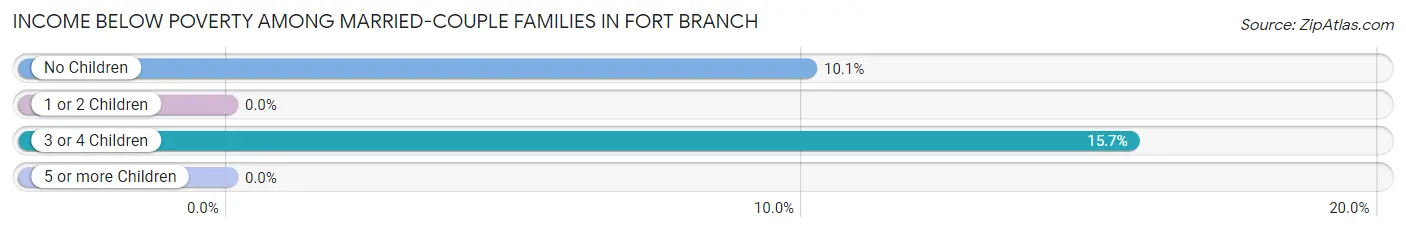
| Children | Above Poverty | Below Poverty |
| No Children | 330 (89.9%) | 37 (10.1%) |
| 1 or 2 Children | 219 (100.0%) | 0 (0.0%) |
| 3 or 4 Children | 43 (84.3%) | 8 (15.7%) |
| 5 or more Children | 0 (0.0%) | 0 (0.0%) |
| Total | 592 (92.9%) | 45 (7.1%) |
Income Below Poverty Among Single-Parent Households in Fort Branch
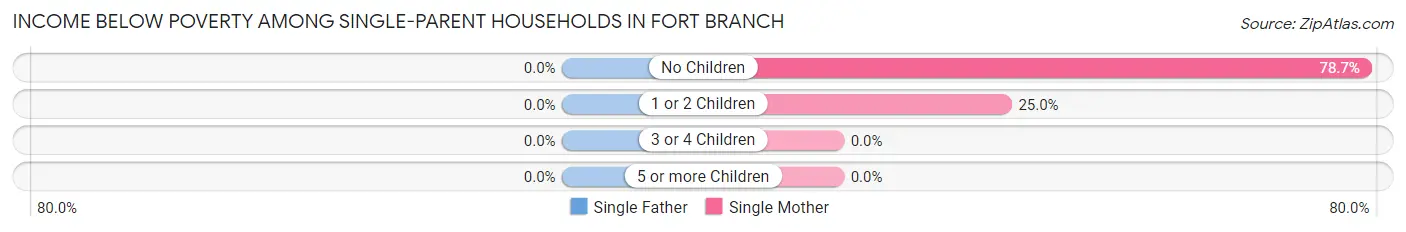
| Children | Single Father | Single Mother |
| No Children | 0 (0.0%) | 59 (78.7%) |
| 1 or 2 Children | 0 (0.0%) | 36 (25.0%) |
| 3 or 4 Children | 0 (0.0%) | 0 (0.0%) |
| 5 or more Children | 0 (0.0%) | 0 (0.0%) |
| Total | 0 (0.0%) | 95 (37.9%) |
Income Below Poverty Among Married-Couple vs Single-Parent Households in Fort Branch
The poverty data for Fort Branch shows that 45 of the married-couple family households (7.1%) and 95 of the single-parent households (29.2%) are living below the poverty level. Within the married-couple family households, those with 3 or 4 children have the highest poverty rate, with 8 households (15.7%) falling below the poverty line. Among the single-parent households, those with no children have the highest poverty rate, with 59 household (57.8%) living below poverty.
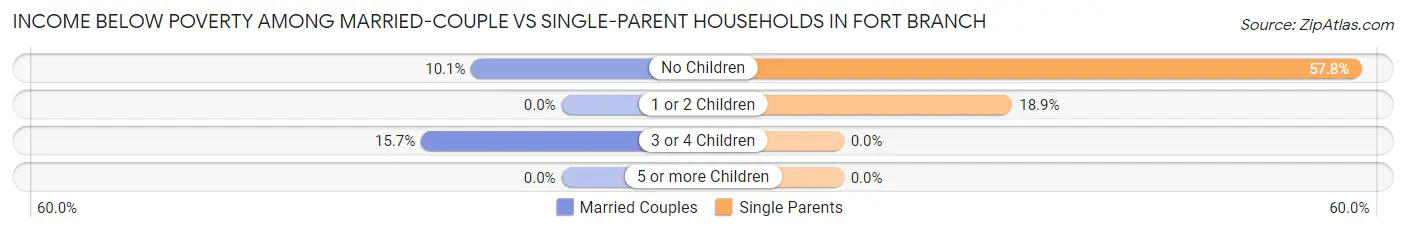
| Children | Married-Couple Families | Single-Parent Households |
| No Children | 37 (10.1%) | 59 (57.8%) |
| 1 or 2 Children | 0 (0.0%) | 36 (18.9%) |
| 3 or 4 Children | 8 (15.7%) | 0 (0.0%) |
| 5 or more Children | 0 (0.0%) | 0 (0.0%) |
| Total | 45 (7.1%) | 95 (29.2%) |
Employment Characteristics in Fort Branch
Employment by Class of Employer in Fort Branch
Among the 2,046 employed individuals in Fort Branch, private company employees (1,656 | 80.9%), self-employed (not incorporated) (120 | 5.9%), and not-for-profit organizations (120 | 5.9%) make up the most common classes of employment.
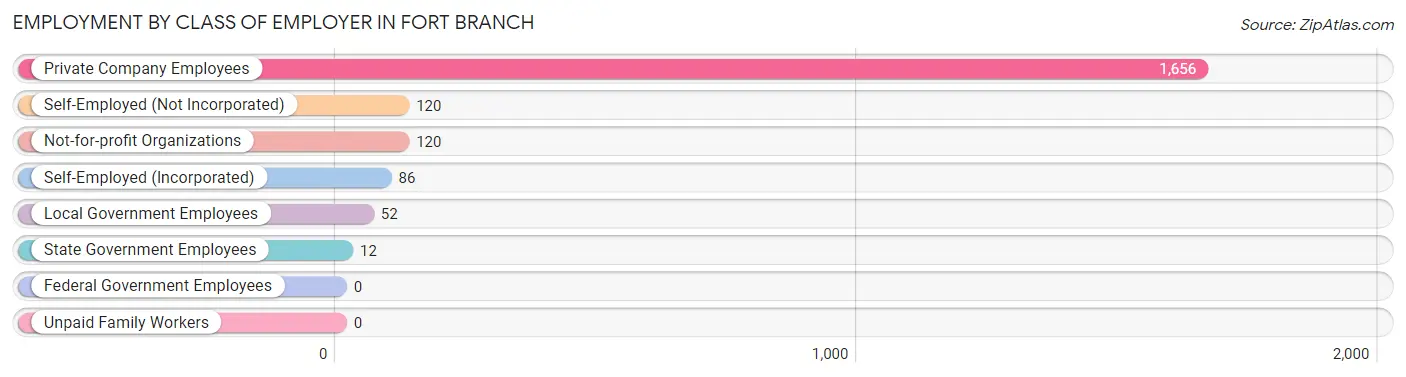
| Employer Class | # Employees | % Employees |
| Private Company Employees | 1,656 | 80.9% |
| Self-Employed (Incorporated) | 86 | 4.2% |
| Self-Employed (Not Incorporated) | 120 | 5.9% |
| Not-for-profit Organizations | 120 | 5.9% |
| Local Government Employees | 52 | 2.5% |
| State Government Employees | 12 | 0.6% |
| Federal Government Employees | 0 | 0.0% |
| Unpaid Family Workers | 0 | 0.0% |
| Total | 2,046 | 100.0% |
Employment Status by Age in Fort Branch
According to the labor force statistics for Fort Branch, out of the total population over 16 years of age (2,900), 72.3% or 2,097 individuals are in the labor force, with 2.5% or 52 of them unemployed. The age group with the highest labor force participation rate is 30 to 34 years, with 100.0% or 277 individuals in the labor force. Within the labor force, the 45 to 54 years age range has the highest percentage of unemployed individuals, with 15.5% or 47 of them being unemployed.
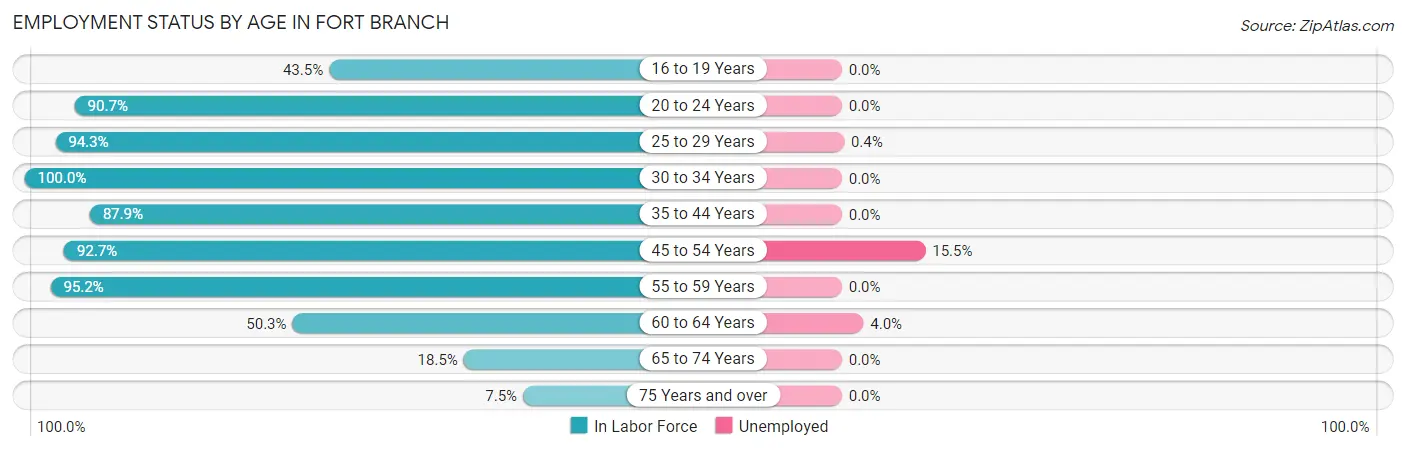
| Age Bracket | In Labor Force | Unemployed |
| 16 to 19 Years | 87 (43.5%) | 0 (0.0%) |
| 20 to 24 Years | 291 (90.7%) | 0 (0.0%) |
| 25 to 29 Years | 232 (94.3%) | 1 (0.4%) |
| 30 to 34 Years | 277 (100.0%) | 0 (0.0%) |
| 35 to 44 Years | 408 (87.9%) | 0 (0.0%) |
| 45 to 54 Years | 304 (92.7%) | 47 (15.5%) |
| 55 to 59 Years | 319 (95.2%) | 0 (0.0%) |
| 60 to 64 Years | 99 (50.3%) | 4 (4.0%) |
| 65 to 74 Years | 69 (18.5%) | 0 (0.0%) |
| 75 Years and over | 12 (7.5%) | 0 (0.0%) |
| Total | 2,097 (72.3%) | 52 (2.5%) |
Employment Status by Educational Attainment in Fort Branch
According to labor force statistics for Fort Branch, 88.7% of individuals (1,638) out of the total population between 25 and 64 years of age (1,847) are in the labor force, with 3.2% or 52 of them being unemployed. The group with the highest labor force participation rate are those with the educational attainment of less than high school, with 100.0% or 52 individuals in the labor force. Within the labor force, individuals with bachelor's degree or higher education have the highest percentage of unemployment, with 8.8% or 32 of them being unemployed.
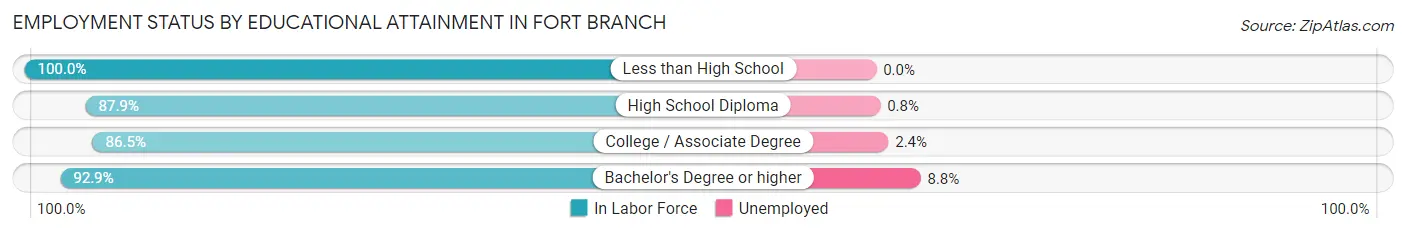
| Educational Attainment | In Labor Force | Unemployed |
| Less than High School | 52 (100.0%) | 0 (0.0%) |
| High School Diploma | 595 (87.9%) | 5 (0.8%) |
| College / Associate Degree | 627 (86.5%) | 17 (2.4%) |
| Bachelor's Degree or higher | 365 (92.9%) | 35 (8.8%) |
| Total | 1,638 (88.7%) | 59 (3.2%) |
Employment Occupations by Sex in Fort Branch
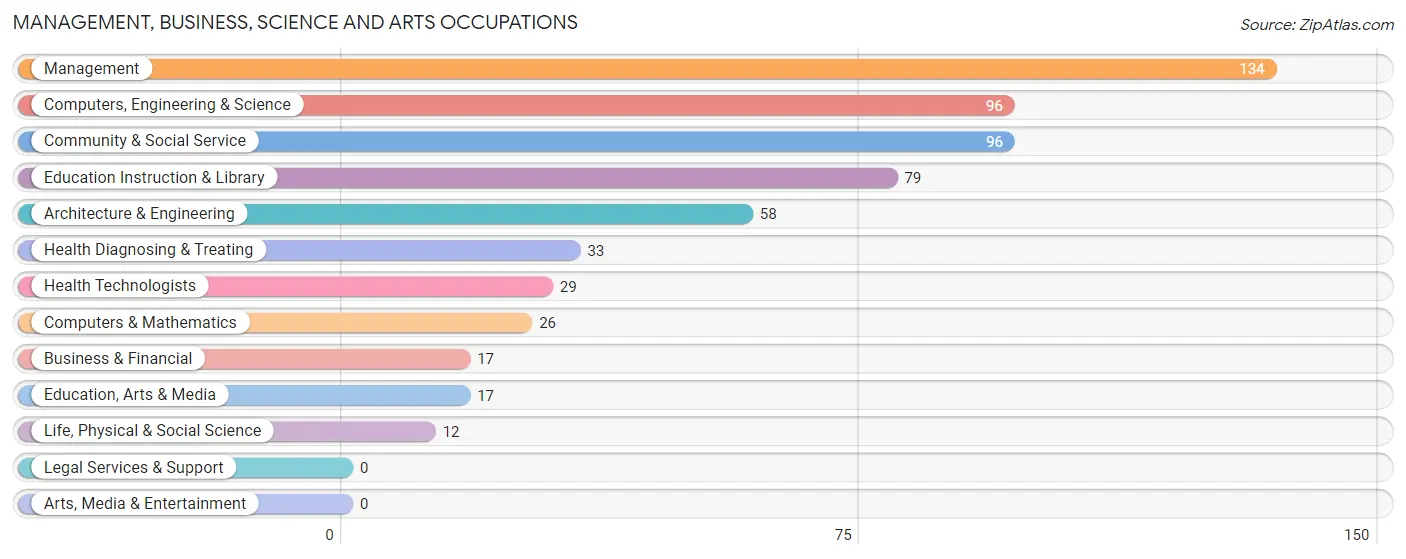
Management, Business, Science and Arts Occupations
The most common Management, Business, Science and Arts occupations in Fort Branch are Management (134 | 6.6%), Computers, Engineering & Science (96 | 4.7%), Community & Social Service (96 | 4.7%), Education Instruction & Library (79 | 3.9%), and Architecture & Engineering (58 | 2.8%).
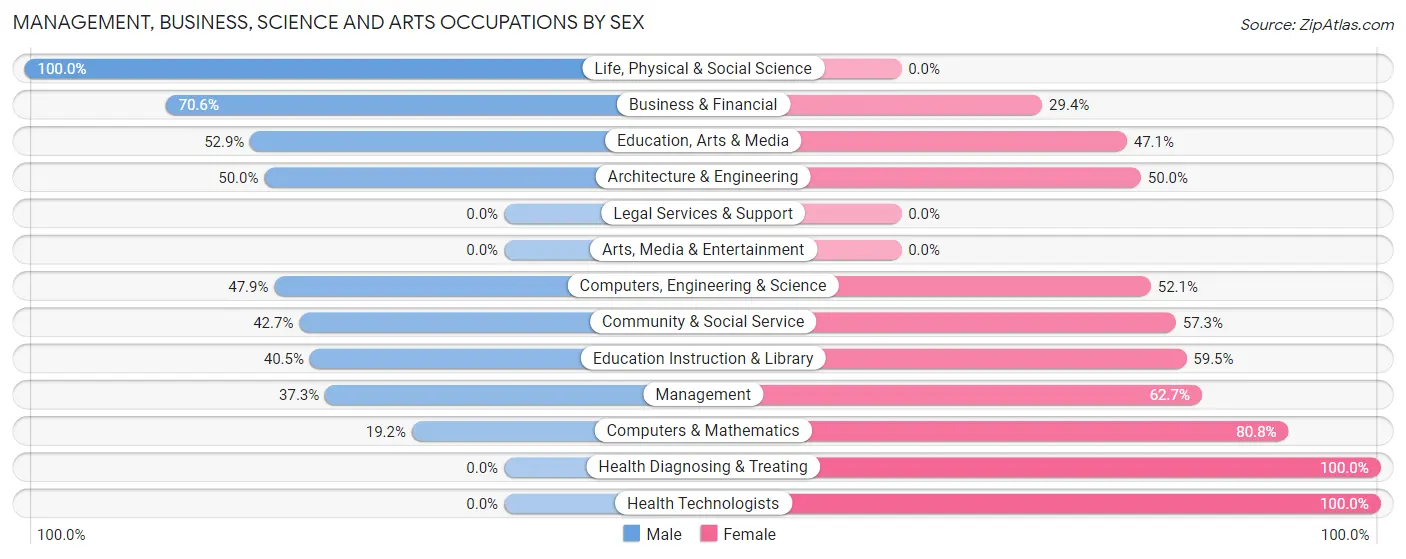
Management, Business, Science and Arts Occupations by Sex
Within the Management, Business, Science and Arts occupations in Fort Branch, the most male-oriented occupations are Life, Physical & Social Science (100.0%), Business & Financial (70.6%), and Education, Arts & Media (52.9%), while the most female-oriented occupations are Health Diagnosing & Treating (100.0%), Health Technologists (100.0%), and Computers & Mathematics (80.8%).
| Occupation | Male | Female |
| Management | 50 (37.3%) | 84 (62.7%) |
| Business & Financial | 12 (70.6%) | 5 (29.4%) |
| Computers, Engineering & Science | 46 (47.9%) | 50 (52.1%) |
| Computers & Mathematics | 5 (19.2%) | 21 (80.8%) |
| Architecture & Engineering | 29 (50.0%) | 29 (50.0%) |
| Life, Physical & Social Science | 12 (100.0%) | 0 (0.0%) |
| Community & Social Service | 41 (42.7%) | 55 (57.3%) |
| Education, Arts & Media | 9 (52.9%) | 8 (47.1%) |
| Legal Services & Support | 0 (0.0%) | 0 (0.0%) |
| Education Instruction & Library | 32 (40.5%) | 47 (59.5%) |
| Arts, Media & Entertainment | 0 (0.0%) | 0 (0.0%) |
| Health Diagnosing & Treating | 0 (0.0%) | 33 (100.0%) |
| Health Technologists | 0 (0.0%) | 29 (100.0%) |
| Total (Category) | 149 (39.6%) | 227 (60.4%) |
| Total (Overall) | 1,164 (56.9%) | 882 (43.1%) |
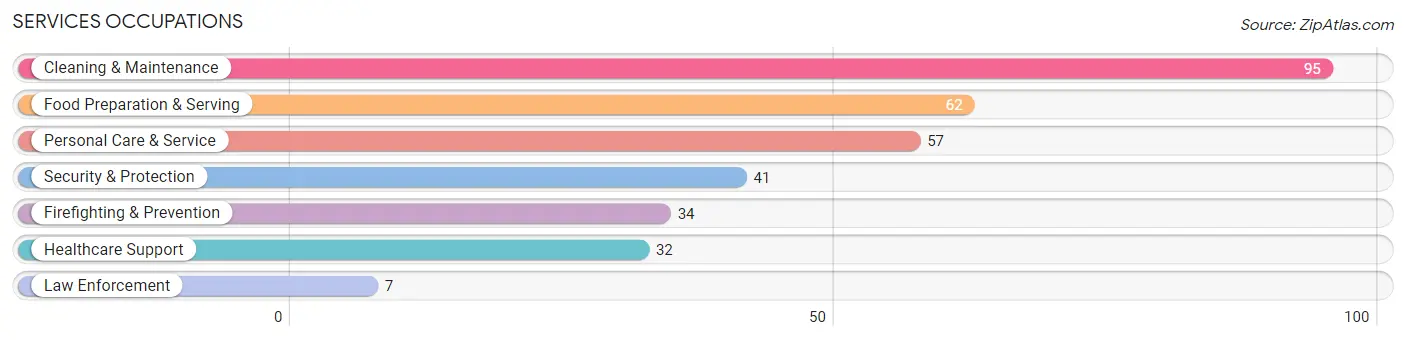
Services Occupations
The most common Services occupations in Fort Branch are Cleaning & Maintenance (95 | 4.6%), Food Preparation & Serving (62 | 3.0%), Personal Care & Service (57 | 2.8%), Security & Protection (41 | 2.0%), and Firefighting & Prevention (34 | 1.7%).
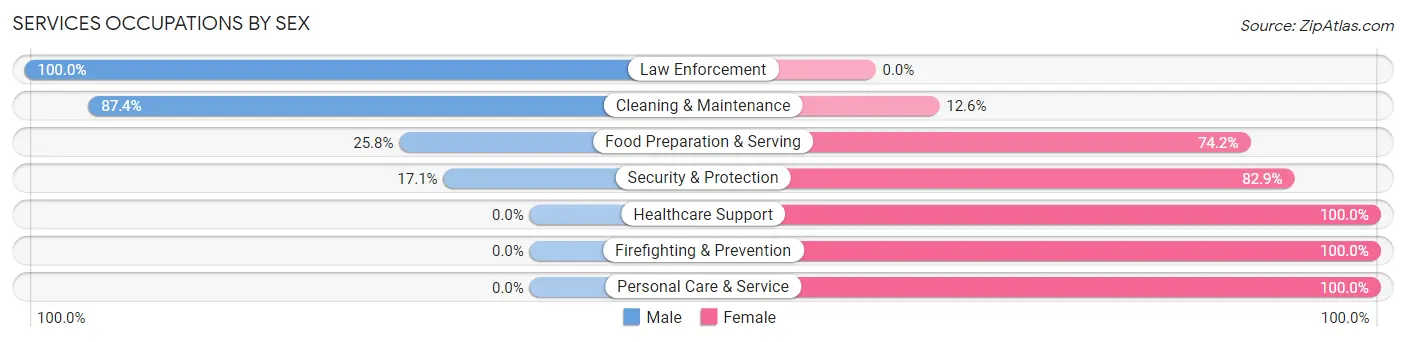
Services Occupations by Sex
Within the Services occupations in Fort Branch, the most male-oriented occupations are Law Enforcement (100.0%), Cleaning & Maintenance (87.4%), and Food Preparation & Serving (25.8%), while the most female-oriented occupations are Healthcare Support (100.0%), Firefighting & Prevention (100.0%), and Personal Care & Service (100.0%).
| Occupation | Male | Female |
| Healthcare Support | 0 (0.0%) | 32 (100.0%) |
| Security & Protection | 7 (17.1%) | 34 (82.9%) |
| Firefighting & Prevention | 0 (0.0%) | 34 (100.0%) |
| Law Enforcement | 7 (100.0%) | 0 (0.0%) |
| Food Preparation & Serving | 16 (25.8%) | 46 (74.2%) |
| Cleaning & Maintenance | 83 (87.4%) | 12 (12.6%) |
| Personal Care & Service | 0 (0.0%) | 57 (100.0%) |
| Total (Category) | 106 (36.9%) | 181 (63.1%) |
| Total (Overall) | 1,164 (56.9%) | 882 (43.1%) |
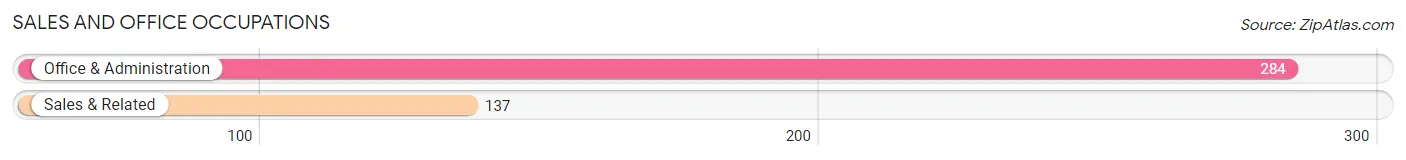
Sales and Office Occupations
The most common Sales and Office occupations in Fort Branch are Office & Administration (284 | 13.9%), and Sales & Related (137 | 6.7%).
Sales and Office Occupations by Sex
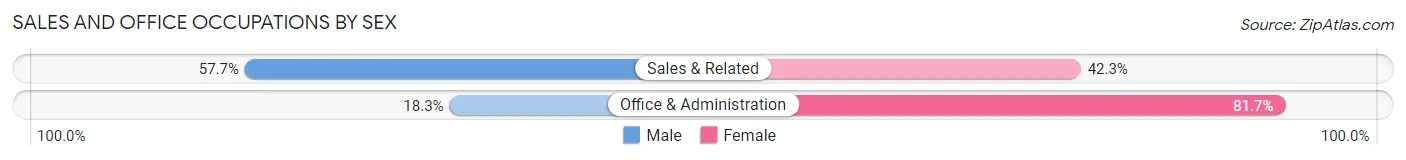
| Occupation | Male | Female |
| Sales & Related | 79 (57.7%) | 58 (42.3%) |
| Office & Administration | 52 (18.3%) | 232 (81.7%) |
| Total (Category) | 131 (31.1%) | 290 (68.9%) |
| Total (Overall) | 1,164 (56.9%) | 882 (43.1%) |
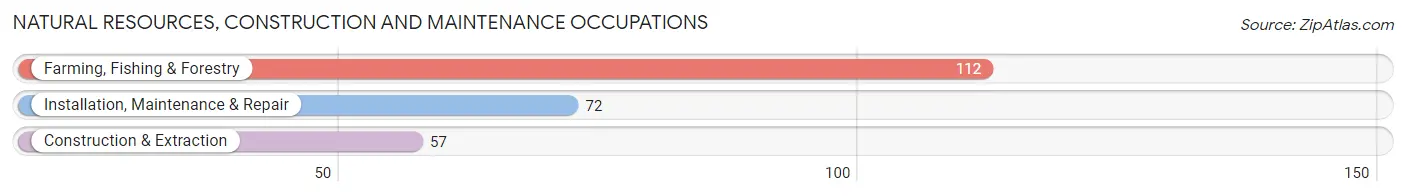
Natural Resources, Construction and Maintenance Occupations
The most common Natural Resources, Construction and Maintenance occupations in Fort Branch are Farming, Fishing & Forestry (112 | 5.5%), Installation, Maintenance & Repair (72 | 3.5%), and Construction & Extraction (57 | 2.8%).
Natural Resources, Construction and Maintenance Occupations by Sex
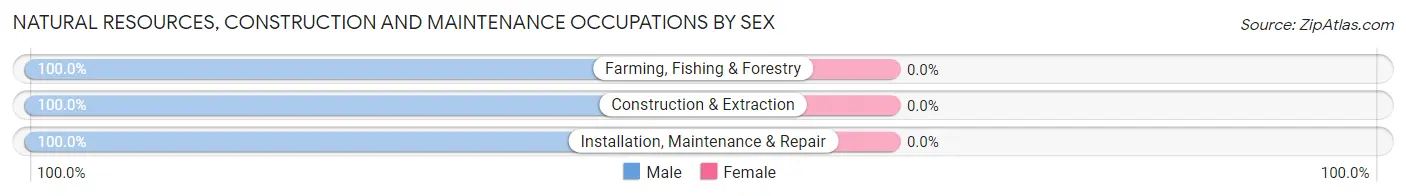
| Occupation | Male | Female |
| Farming, Fishing & Forestry | 112 (100.0%) | 0 (0.0%) |
| Construction & Extraction | 57 (100.0%) | 0 (0.0%) |
| Installation, Maintenance & Repair | 72 (100.0%) | 0 (0.0%) |
| Total (Category) | 241 (100.0%) | 0 (0.0%) |
| Total (Overall) | 1,164 (56.9%) | 882 (43.1%) |
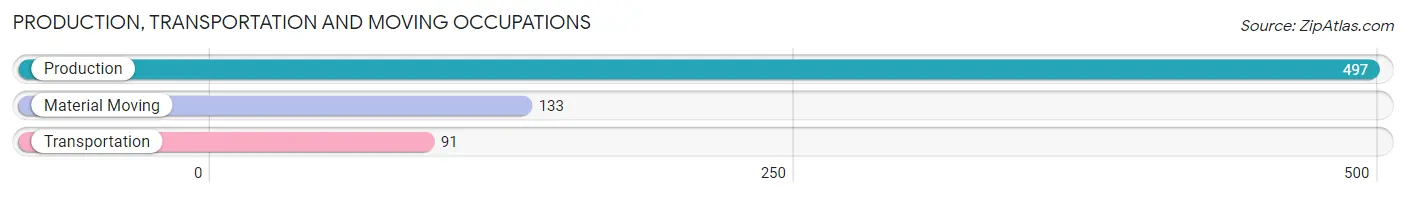
Production, Transportation and Moving Occupations
The most common Production, Transportation and Moving occupations in Fort Branch are Production (497 | 24.3%), Material Moving (133 | 6.5%), and Transportation (91 | 4.4%).
Production, Transportation and Moving Occupations by Sex
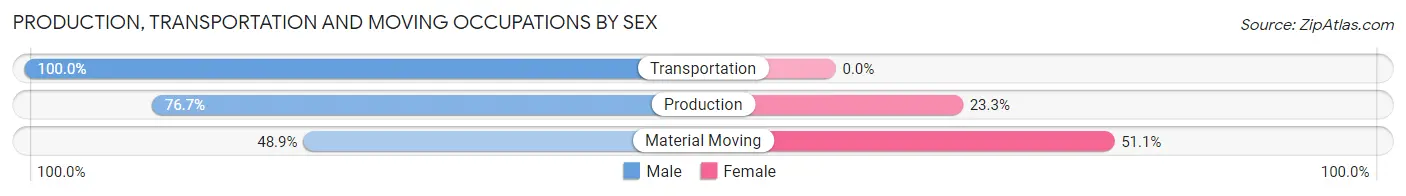
| Occupation | Male | Female |
| Production | 381 (76.7%) | 116 (23.3%) |
| Transportation | 91 (100.0%) | 0 (0.0%) |
| Material Moving | 65 (48.9%) | 68 (51.1%) |
| Total (Category) | 537 (74.5%) | 184 (25.5%) |
| Total (Overall) | 1,164 (56.9%) | 882 (43.1%) |
Employment Industries by Sex in Fort Branch
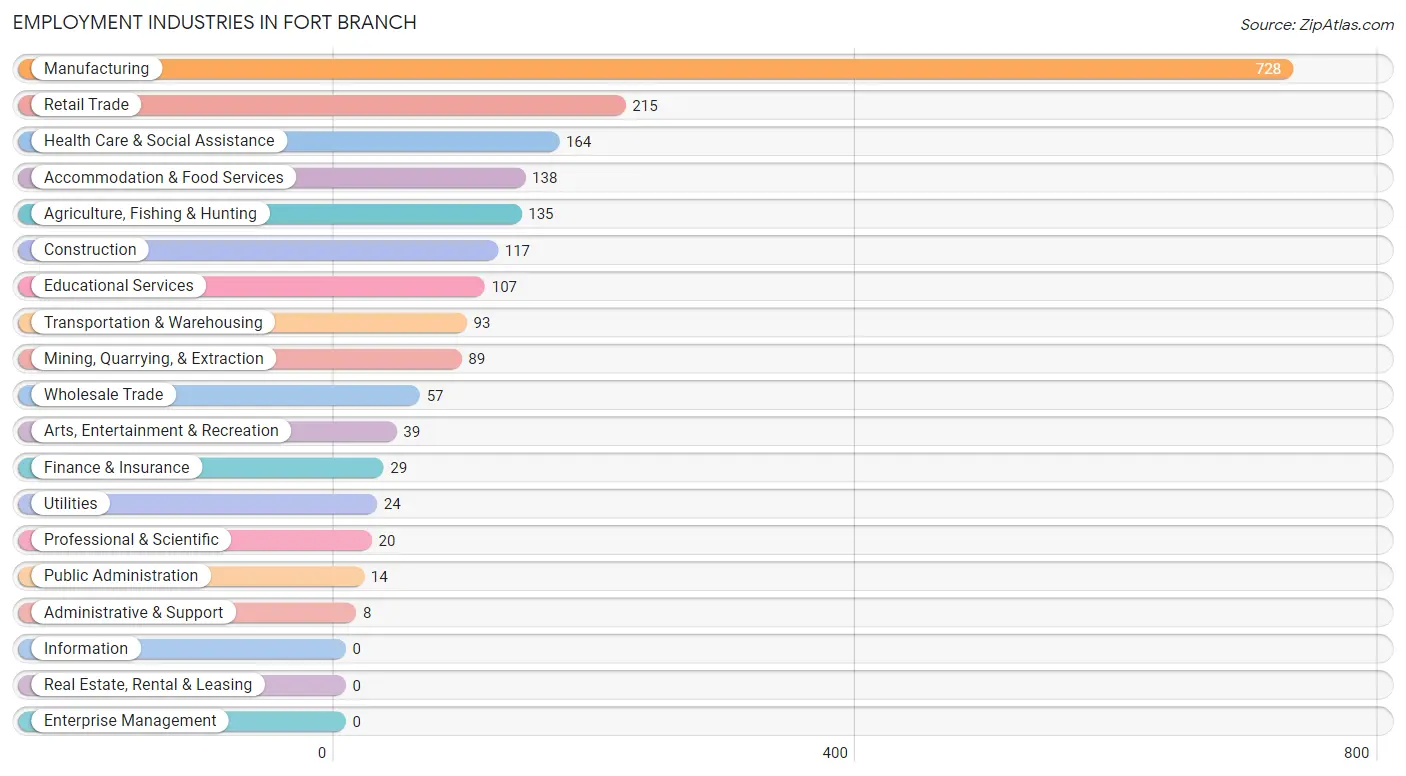
Employment Industries in Fort Branch
The major employment industries in Fort Branch include Manufacturing (728 | 35.6%), Retail Trade (215 | 10.5%), Health Care & Social Assistance (164 | 8.0%), Accommodation & Food Services (138 | 6.7%), and Agriculture, Fishing & Hunting (135 | 6.6%).
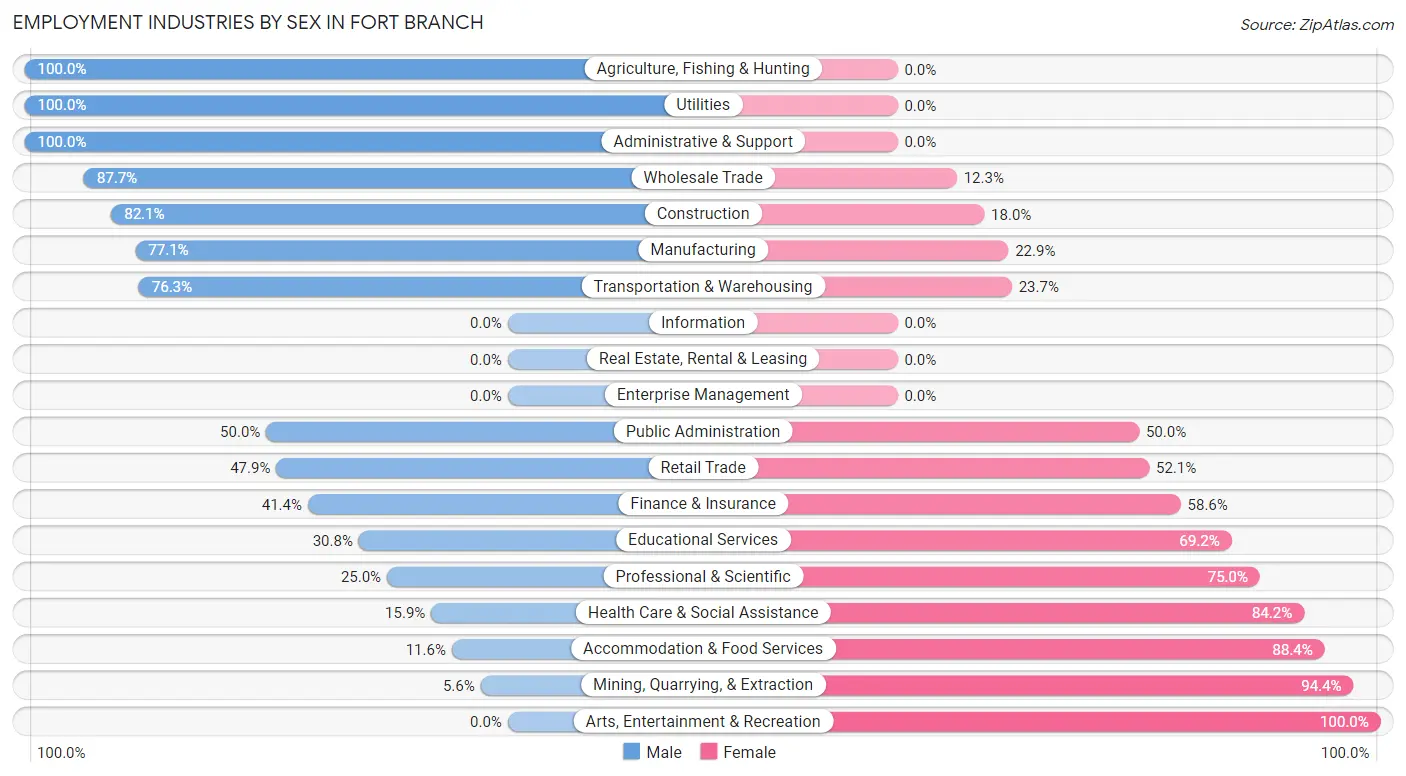
Employment Industries by Sex in Fort Branch
The Fort Branch industries that see more men than women are Agriculture, Fishing & Hunting (100.0%), Utilities (100.0%), and Administrative & Support (100.0%), whereas the industries that tend to have a higher number of women are Arts, Entertainment & Recreation (100.0%), Mining, Quarrying, & Extraction (94.4%), and Accommodation & Food Services (88.4%).
| Industry | Male | Female |
| Agriculture, Fishing & Hunting | 135 (100.0%) | 0 (0.0%) |
| Mining, Quarrying, & Extraction | 5 (5.6%) | 84 (94.4%) |
| Construction | 96 (82.1%) | 21 (17.9%) |
| Manufacturing | 561 (77.1%) | 167 (22.9%) |
| Wholesale Trade | 50 (87.7%) | 7 (12.3%) |
| Retail Trade | 103 (47.9%) | 112 (52.1%) |
| Transportation & Warehousing | 71 (76.3%) | 22 (23.7%) |
| Utilities | 24 (100.0%) | 0 (0.0%) |
| Information | 0 (0.0%) | 0 (0.0%) |
| Finance & Insurance | 12 (41.4%) | 17 (58.6%) |
| Real Estate, Rental & Leasing | 0 (0.0%) | 0 (0.0%) |
| Professional & Scientific | 5 (25.0%) | 15 (75.0%) |
| Enterprise Management | 0 (0.0%) | 0 (0.0%) |
| Administrative & Support | 8 (100.0%) | 0 (0.0%) |
| Educational Services | 33 (30.8%) | 74 (69.2%) |
| Health Care & Social Assistance | 26 (15.9%) | 138 (84.2%) |
| Arts, Entertainment & Recreation | 0 (0.0%) | 39 (100.0%) |
| Accommodation & Food Services | 16 (11.6%) | 122 (88.4%) |
| Public Administration | 7 (50.0%) | 7 (50.0%) |
| Total | 1,164 (56.9%) | 882 (43.1%) |
Education in Fort Branch
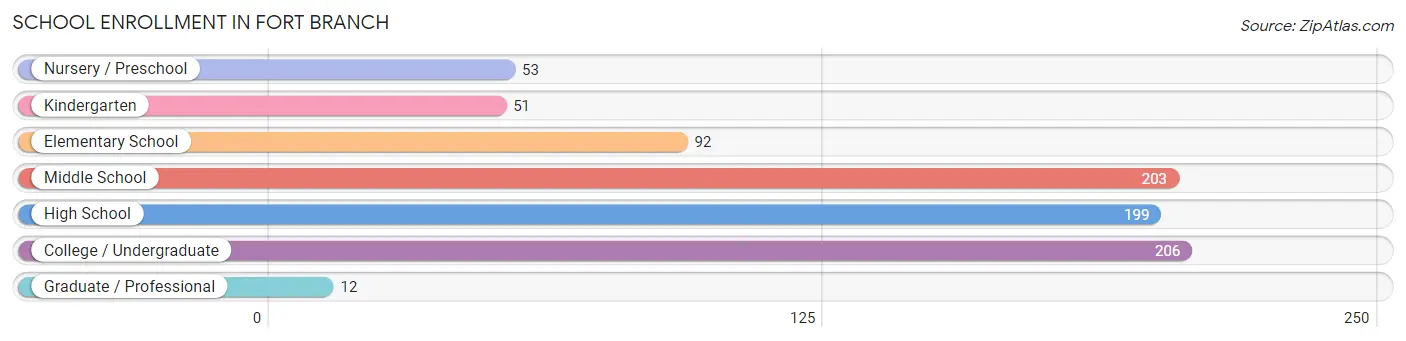
School Enrollment in Fort Branch
The most common levels of schooling among the 816 students in Fort Branch are college / undergraduate (206 | 25.3%), middle school (203 | 24.9%), and high school (199 | 24.4%).
| School Level | # Students | % Students |
| Nursery / Preschool | 53 | 6.5% |
| Kindergarten | 51 | 6.2% |
| Elementary School | 92 | 11.3% |
| Middle School | 203 | 24.9% |
| High School | 199 | 24.4% |
| College / Undergraduate | 206 | 25.3% |
| Graduate / Professional | 12 | 1.5% |
| Total | 816 | 100.0% |
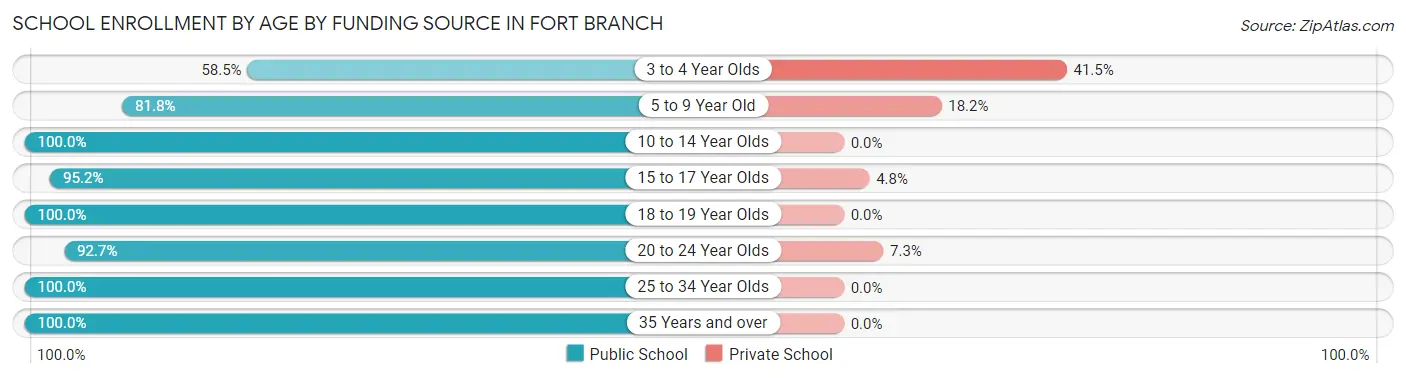
School Enrollment by Age by Funding Source in Fort Branch
Out of a total of 816 students who are enrolled in schools in Fort Branch, 64 (7.8%) attend a private institution, while the remaining 752 (92.2%) are enrolled in public schools. The age group of 3 to 4 year olds has the highest likelihood of being enrolled in private schools, with 22 (41.5% in the age bracket) enrolled. Conversely, the age group of 10 to 14 year olds has the lowest likelihood of being enrolled in a private school, with 172 (100.0% in the age bracket) attending a public institution.
| Age Bracket | Public School | Private School |
| 3 to 4 Year Olds | 31 (58.5%) | 22 (41.5%) |
| 5 to 9 Year Old | 117 (81.8%) | 26 (18.2%) |
| 10 to 14 Year Olds | 172 (100.0%) | 0 (0.0%) |
| 15 to 17 Year Olds | 160 (95.2%) | 8 (4.8%) |
| 18 to 19 Year Olds | 54 (100.0%) | 0 (0.0%) |
| 20 to 24 Year Olds | 101 (92.7%) | 8 (7.3%) |
| 25 to 34 Year Olds | 17 (100.0%) | 0 (0.0%) |
| 35 Years and over | 100 (100.0%) | 0 (0.0%) |
| Total | 752 (92.2%) | 64 (7.8%) |
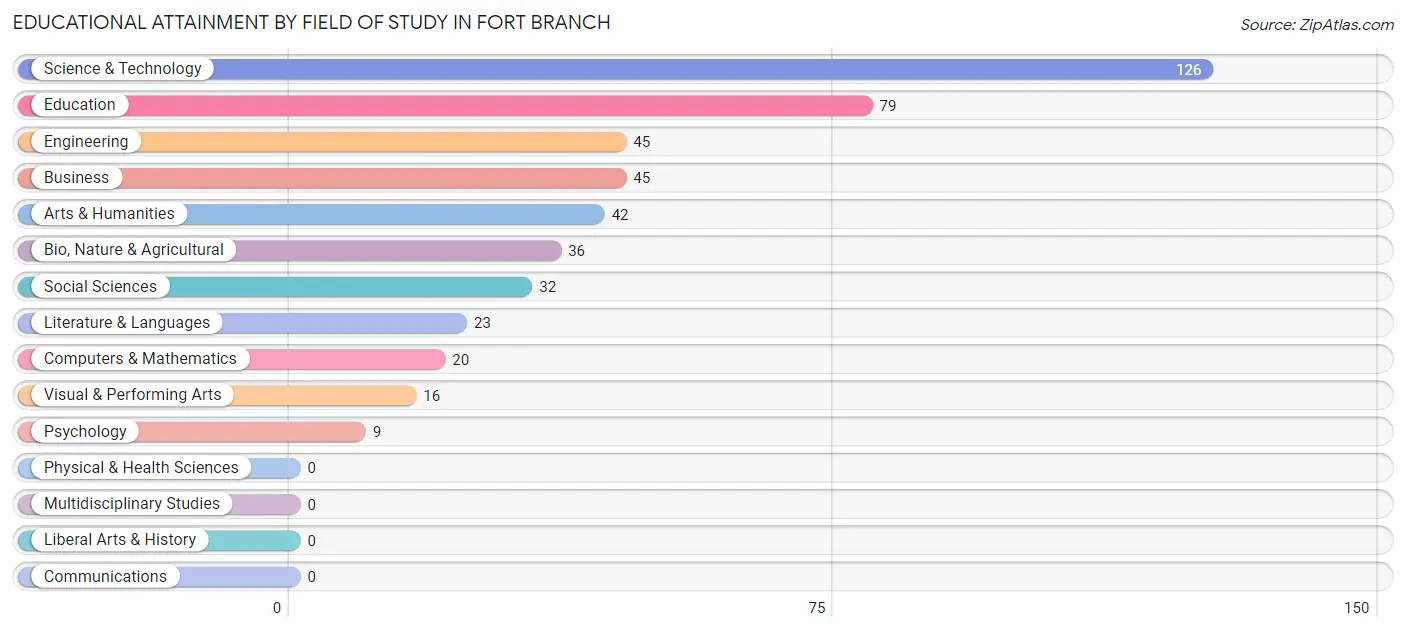
Educational Attainment by Field of Study in Fort Branch
Science & technology (126 | 26.6%), education (79 | 16.7%), engineering (45 | 9.5%), business (45 | 9.5%), and arts & humanities (42 | 8.9%) are the most common fields of study among 473 individuals in Fort Branch who have obtained a bachelor's degree or higher.
| Field of Study | # Graduates | % Graduates |
| Computers & Mathematics | 20 | 4.2% |
| Bio, Nature & Agricultural | 36 | 7.6% |
| Physical & Health Sciences | 0 | 0.0% |
| Psychology | 9 | 1.9% |
| Social Sciences | 32 | 6.8% |
| Engineering | 45 | 9.5% |
| Multidisciplinary Studies | 0 | 0.0% |
| Science & Technology | 126 | 26.6% |
| Business | 45 | 9.5% |
| Education | 79 | 16.7% |
| Literature & Languages | 23 | 4.9% |
| Liberal Arts & History | 0 | 0.0% |
| Visual & Performing Arts | 16 | 3.4% |
| Communications | 0 | 0.0% |
| Arts & Humanities | 42 | 8.9% |
| Total | 473 | 100.0% |
Transportation & Commute in Fort Branch
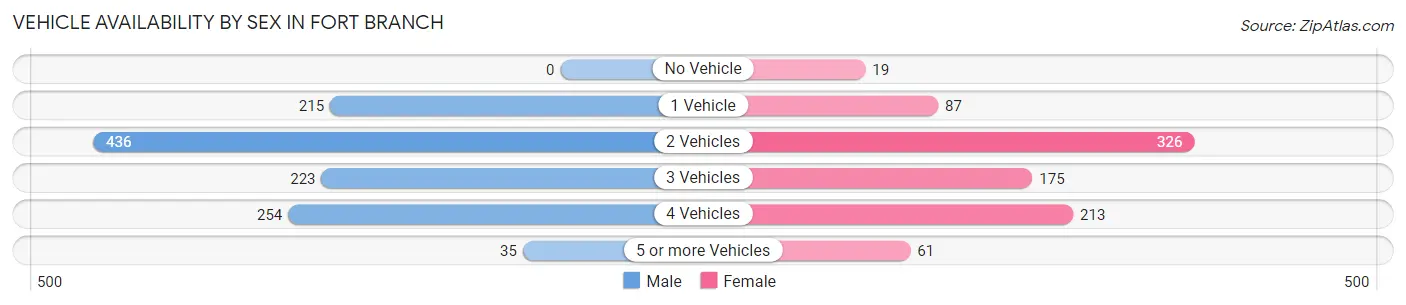
Vehicle Availability by Sex in Fort Branch
The most prevalent vehicle ownership categories in Fort Branch are males with 2 vehicles (436, accounting for 37.5%) and females with 2 vehicles (326, making up 49.5%).
| Vehicles Available | Male | Female |
| No Vehicle | 0 (0.0%) | 19 (2.2%) |
| 1 Vehicle | 215 (18.5%) | 87 (9.9%) |
| 2 Vehicles | 436 (37.5%) | 326 (37.0%) |
| 3 Vehicles | 223 (19.2%) | 175 (19.9%) |
| 4 Vehicles | 254 (21.8%) | 213 (24.2%) |
| 5 or more Vehicles | 35 (3.0%) | 61 (6.9%) |
| Total | 1,163 (100.0%) | 881 (100.0%) |
Commute Time in Fort Branch
The most frequently occuring commute durations in Fort Branch are 10 to 14 minutes (566 commuters, 29.6%), 5 to 9 minutes (438 commuters, 22.9%), and 15 to 19 minutes (248 commuters, 13.0%).
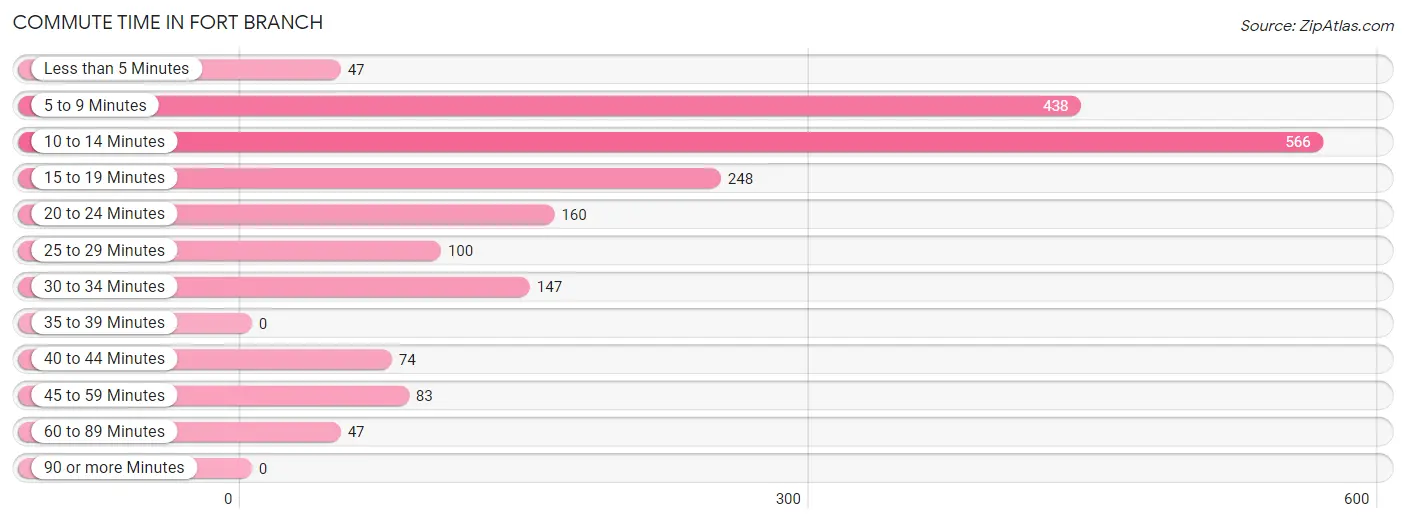
| Commute Time | # Commuters | % Commuters |
| Less than 5 Minutes | 47 | 2.5% |
| 5 to 9 Minutes | 438 | 22.9% |
| 10 to 14 Minutes | 566 | 29.6% |
| 15 to 19 Minutes | 248 | 13.0% |
| 20 to 24 Minutes | 160 | 8.4% |
| 25 to 29 Minutes | 100 | 5.2% |
| 30 to 34 Minutes | 147 | 7.7% |
| 35 to 39 Minutes | 0 | 0.0% |
| 40 to 44 Minutes | 74 | 3.9% |
| 45 to 59 Minutes | 83 | 4.3% |
| 60 to 89 Minutes | 47 | 2.5% |
| 90 or more Minutes | 0 | 0.0% |
Commute Time by Sex in Fort Branch
The most common commute times in Fort Branch are 10 to 14 minutes (475 commuters, 43.9%) for males and 5 to 9 minutes (257 commuters, 31.0%) for females.
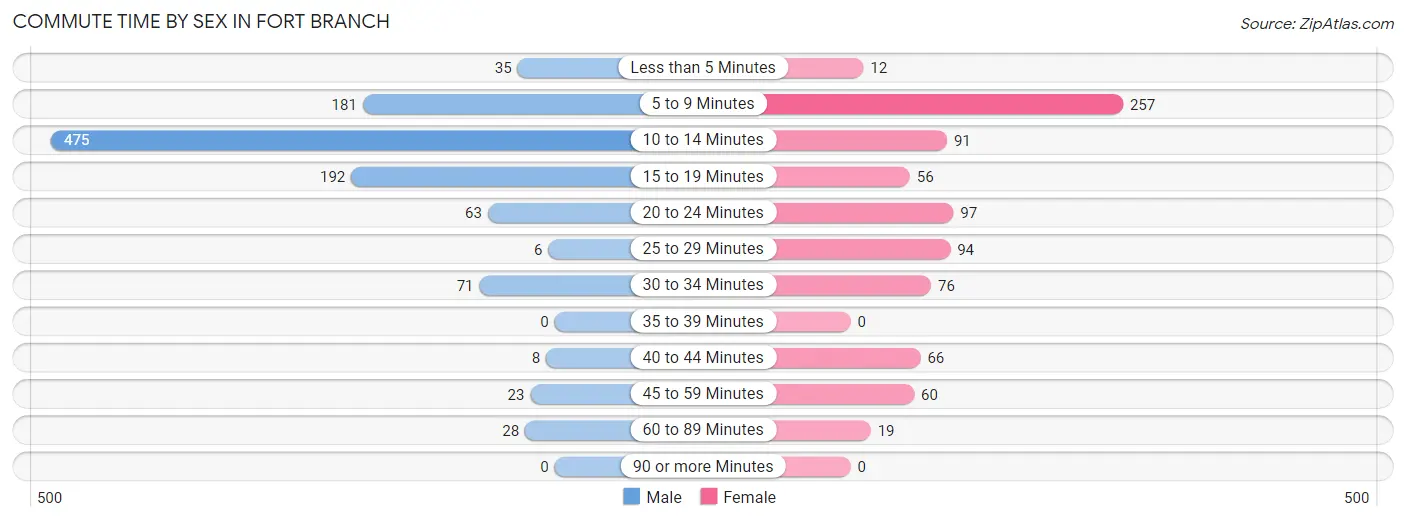
| Commute Time | Male | Female |
| Less than 5 Minutes | 35 (3.2%) | 12 (1.5%) |
| 5 to 9 Minutes | 181 (16.7%) | 257 (31.0%) |
| 10 to 14 Minutes | 475 (43.9%) | 91 (11.0%) |
| 15 to 19 Minutes | 192 (17.7%) | 56 (6.8%) |
| 20 to 24 Minutes | 63 (5.8%) | 97 (11.7%) |
| 25 to 29 Minutes | 6 (0.5%) | 94 (11.4%) |
| 30 to 34 Minutes | 71 (6.6%) | 76 (9.2%) |
| 35 to 39 Minutes | 0 (0.0%) | 0 (0.0%) |
| 40 to 44 Minutes | 8 (0.7%) | 66 (8.0%) |
| 45 to 59 Minutes | 23 (2.1%) | 60 (7.2%) |
| 60 to 89 Minutes | 28 (2.6%) | 19 (2.3%) |
| 90 or more Minutes | 0 (0.0%) | 0 (0.0%) |
Time of Departure to Work by Sex in Fort Branch
The most frequent times of departure to work in Fort Branch are 4:00 PM to 11:59 PM (311, 28.7%) for males and 12:00 PM to 3:59 PM (201, 24.3%) for females.
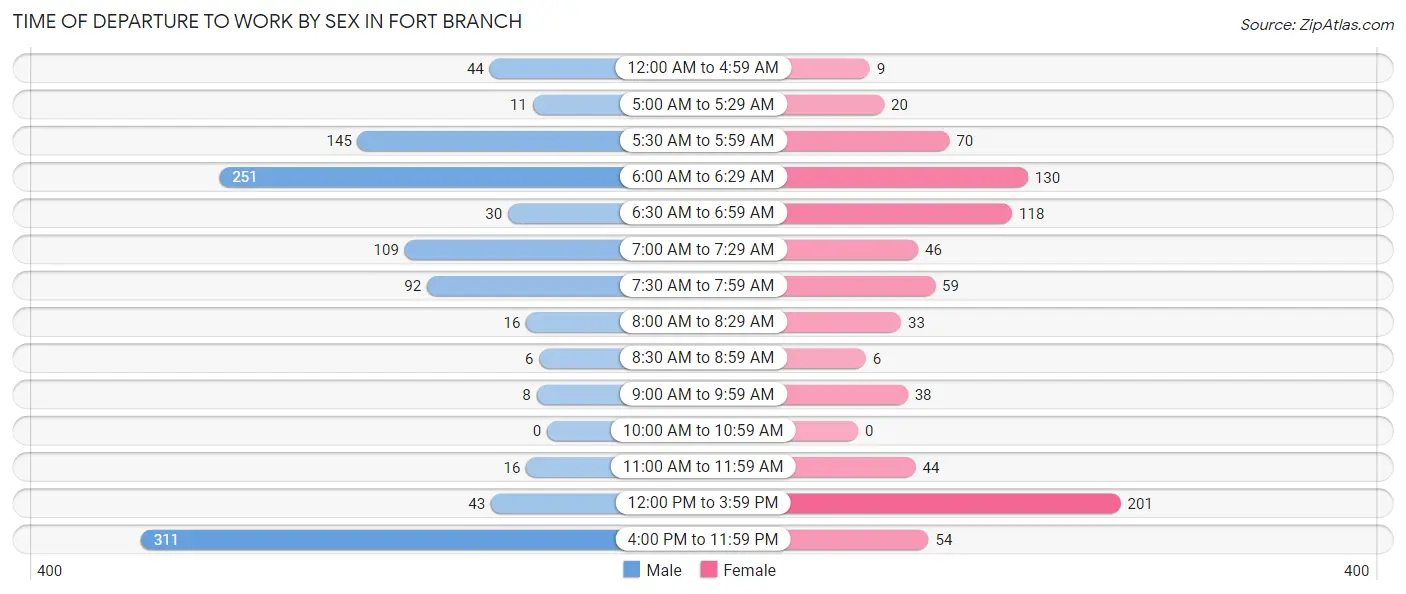
| Time of Departure | Male | Female |
| 12:00 AM to 4:59 AM | 44 (4.1%) | 9 (1.1%) |
| 5:00 AM to 5:29 AM | 11 (1.0%) | 20 (2.4%) |
| 5:30 AM to 5:59 AM | 145 (13.4%) | 70 (8.5%) |
| 6:00 AM to 6:29 AM | 251 (23.2%) | 130 (15.7%) |
| 6:30 AM to 6:59 AM | 30 (2.8%) | 118 (14.2%) |
| 7:00 AM to 7:29 AM | 109 (10.1%) | 46 (5.6%) |
| 7:30 AM to 7:59 AM | 92 (8.5%) | 59 (7.1%) |
| 8:00 AM to 8:29 AM | 16 (1.5%) | 33 (4.0%) |
| 8:30 AM to 8:59 AM | 6 (0.5%) | 6 (0.7%) |
| 9:00 AM to 9:59 AM | 8 (0.7%) | 38 (4.6%) |
| 10:00 AM to 10:59 AM | 0 (0.0%) | 0 (0.0%) |
| 11:00 AM to 11:59 AM | 16 (1.5%) | 44 (5.3%) |
| 12:00 PM to 3:59 PM | 43 (4.0%) | 201 (24.3%) |
| 4:00 PM to 11:59 PM | 311 (28.7%) | 54 (6.5%) |
| Total | 1,082 (100.0%) | 828 (100.0%) |
Housing Occupancy in Fort Branch
Occupancy by Ownership in Fort Branch
Of the total 1,611 dwellings in Fort Branch, owner-occupied units account for 1,247 (77.4%), while renter-occupied units make up 364 (22.6%).
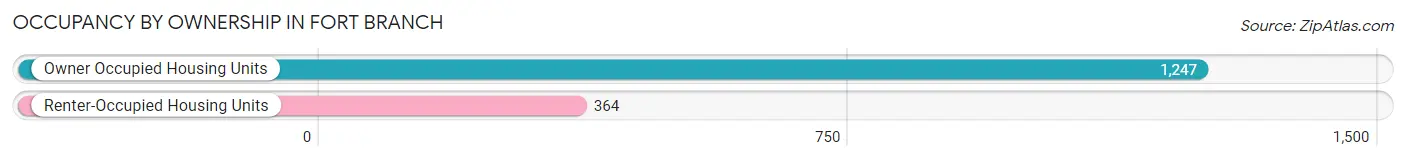
| Occupancy | # Housing Units | % Housing Units |
| Owner Occupied Housing Units | 1,247 | 77.4% |
| Renter-Occupied Housing Units | 364 | 22.6% |
| Total Occupied Housing Units | 1,611 | 100.0% |
Occupancy by Household Size in Fort Branch
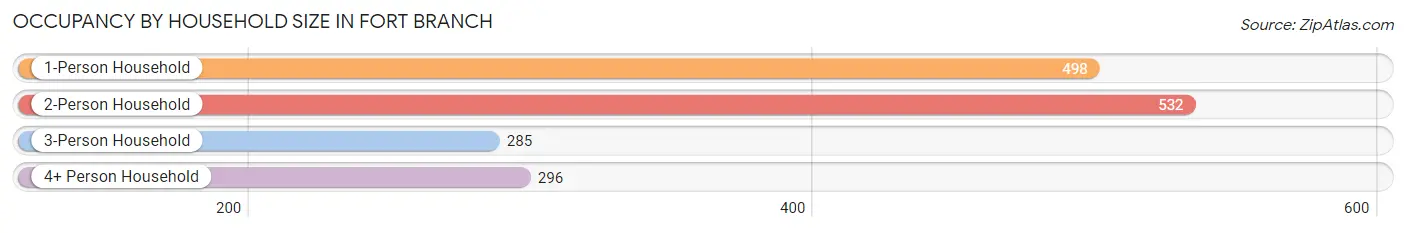
| Household Size | # Housing Units | % Housing Units |
| 1-Person Household | 498 | 30.9% |
| 2-Person Household | 532 | 33.0% |
| 3-Person Household | 285 | 17.7% |
| 4+ Person Household | 296 | 18.4% |
| Total Housing Units | 1,611 | 100.0% |
Occupancy by Ownership by Household Size in Fort Branch
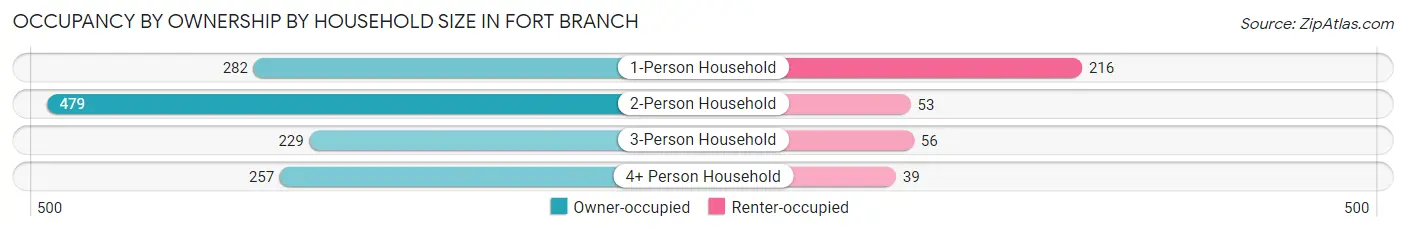
| Household Size | Owner-occupied | Renter-occupied |
| 1-Person Household | 282 (56.6%) | 216 (43.4%) |
| 2-Person Household | 479 (90.0%) | 53 (10.0%) |
| 3-Person Household | 229 (80.3%) | 56 (19.7%) |
| 4+ Person Household | 257 (86.8%) | 39 (13.2%) |
| Total Housing Units | 1,247 (77.4%) | 364 (22.6%) |
Occupancy by Educational Attainment in Fort Branch
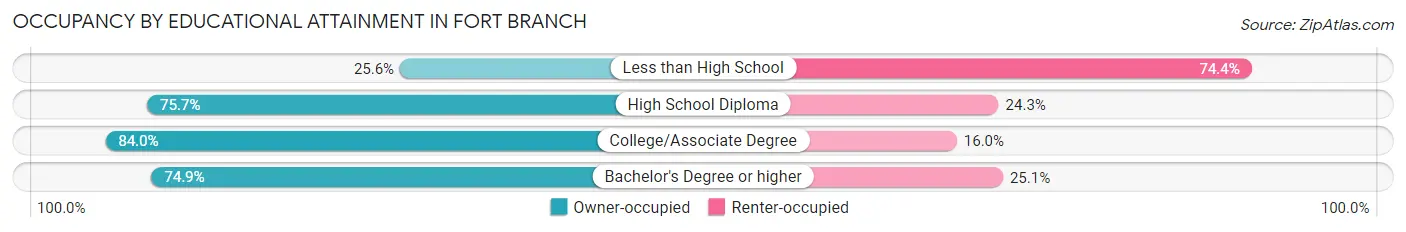
| Household Size | Owner-occupied | Renter-occupied |
| Less than High School | 11 (25.6%) | 32 (74.4%) |
| High School Diploma | 449 (75.7%) | 144 (24.3%) |
| College/Associate Degree | 525 (84.0%) | 100 (16.0%) |
| Bachelor's Degree or higher | 262 (74.9%) | 88 (25.1%) |
Occupancy by Age of Householder in Fort Branch
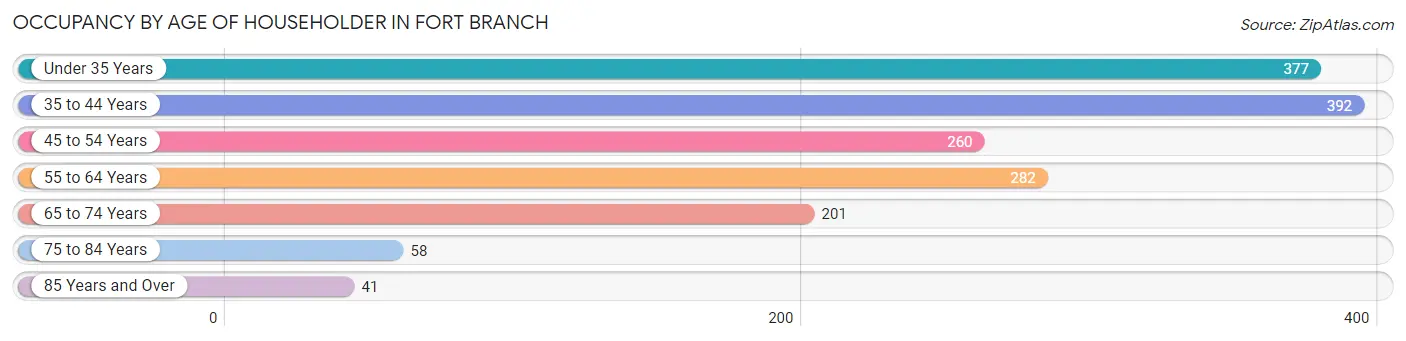
| Age Bracket | # Households | % Households |
| Under 35 Years | 377 | 23.4% |
| 35 to 44 Years | 392 | 24.3% |
| 45 to 54 Years | 260 | 16.1% |
| 55 to 64 Years | 282 | 17.5% |
| 65 to 74 Years | 201 | 12.5% |
| 75 to 84 Years | 58 | 3.6% |
| 85 Years and Over | 41 | 2.5% |
| Total | 1,611 | 100.0% |
Housing Finances in Fort Branch
Median Income by Occupancy in Fort Branch
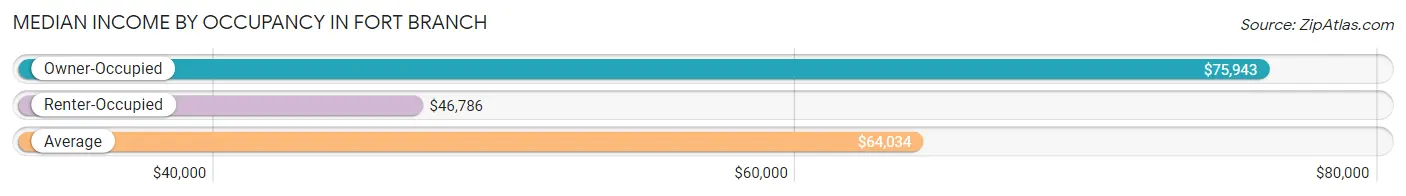
| Occupancy Type | # Households | Median Income |
| Owner-Occupied | 1,247 (77.4%) | $75,943 |
| Renter-Occupied | 364 (22.6%) | $46,786 |
| Average | 1,611 (100.0%) | $64,034 |
Occupancy by Householder Income Bracket in Fort Branch
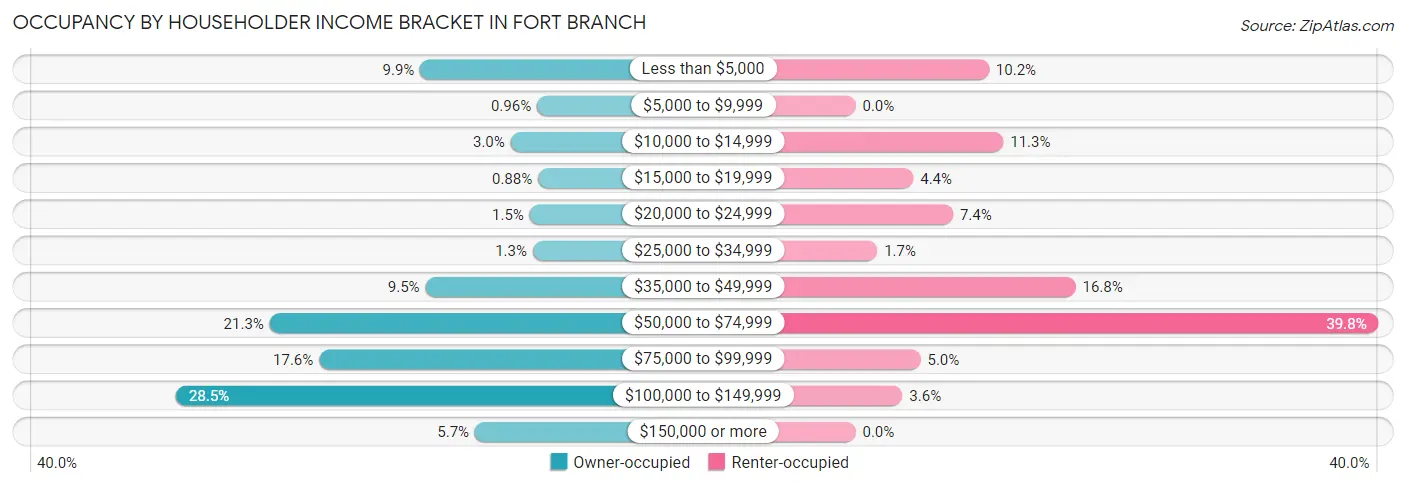
| Income Bracket | Owner-occupied | Renter-occupied |
| Less than $5,000 | 123 (9.9%) | 37 (10.2%) |
| $5,000 to $9,999 | 12 (1.0%) | 0 (0.0%) |
| $10,000 to $14,999 | 37 (3.0%) | 41 (11.3%) |
| $15,000 to $19,999 | 11 (0.9%) | 16 (4.4%) |
| $20,000 to $24,999 | 19 (1.5%) | 27 (7.4%) |
| $25,000 to $34,999 | 16 (1.3%) | 6 (1.7%) |
| $35,000 to $49,999 | 118 (9.5%) | 61 (16.8%) |
| $50,000 to $74,999 | 266 (21.3%) | 145 (39.8%) |
| $75,000 to $99,999 | 219 (17.6%) | 18 (5.0%) |
| $100,000 to $149,999 | 355 (28.5%) | 13 (3.6%) |
| $150,000 or more | 71 (5.7%) | 0 (0.0%) |
| Total | 1,247 (100.0%) | 364 (100.0%) |
Monthly Housing Cost Tiers in Fort Branch
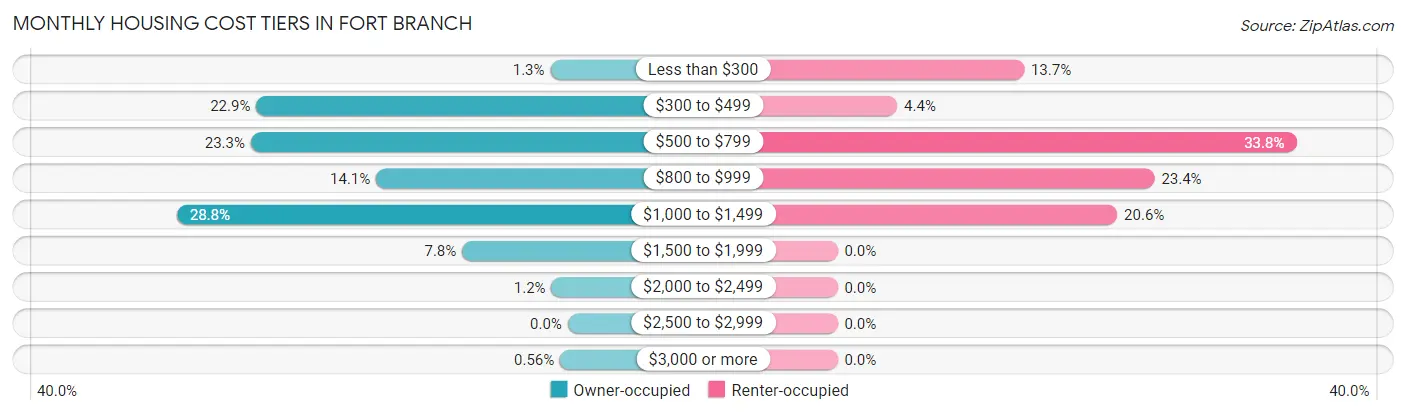
| Monthly Cost | Owner-occupied | Renter-occupied |
| Less than $300 | 16 (1.3%) | 50 (13.7%) |
| $300 to $499 | 286 (22.9%) | 16 (4.4%) |
| $500 to $799 | 291 (23.3%) | 123 (33.8%) |
| $800 to $999 | 176 (14.1%) | 85 (23.4%) |
| $1,000 to $1,499 | 359 (28.8%) | 75 (20.6%) |
| $1,500 to $1,999 | 97 (7.8%) | 0 (0.0%) |
| $2,000 to $2,499 | 15 (1.2%) | 0 (0.0%) |
| $2,500 to $2,999 | 0 (0.0%) | 0 (0.0%) |
| $3,000 or more | 7 (0.6%) | 0 (0.0%) |
| Total | 1,247 (100.0%) | 364 (100.0%) |
Physical Housing Characteristics in Fort Branch
Housing Structures in Fort Branch
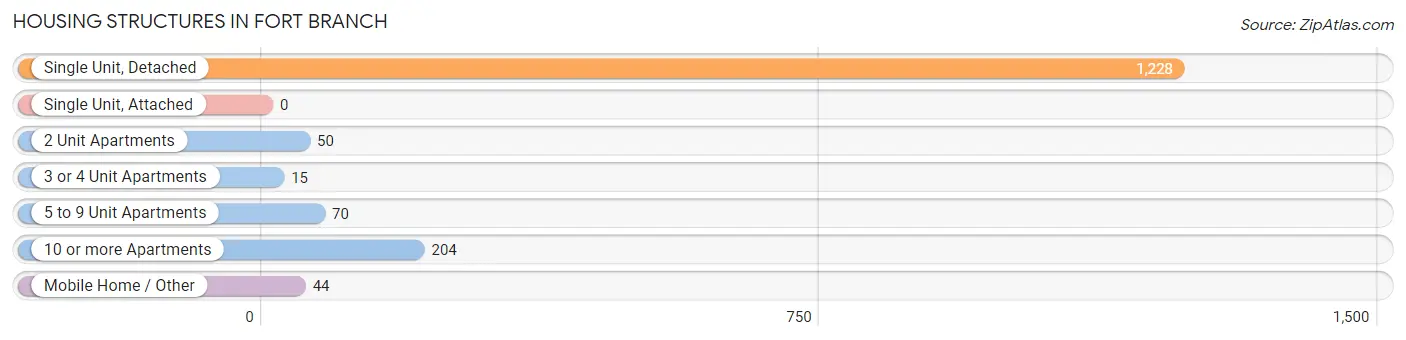
| Structure Type | # Housing Units | % Housing Units |
| Single Unit, Detached | 1,228 | 76.2% |
| Single Unit, Attached | 0 | 0.0% |
| 2 Unit Apartments | 50 | 3.1% |
| 3 or 4 Unit Apartments | 15 | 0.9% |
| 5 to 9 Unit Apartments | 70 | 4.3% |
| 10 or more Apartments | 204 | 12.7% |
| Mobile Home / Other | 44 | 2.7% |
| Total | 1,611 | 100.0% |
Housing Structures by Occupancy in Fort Branch
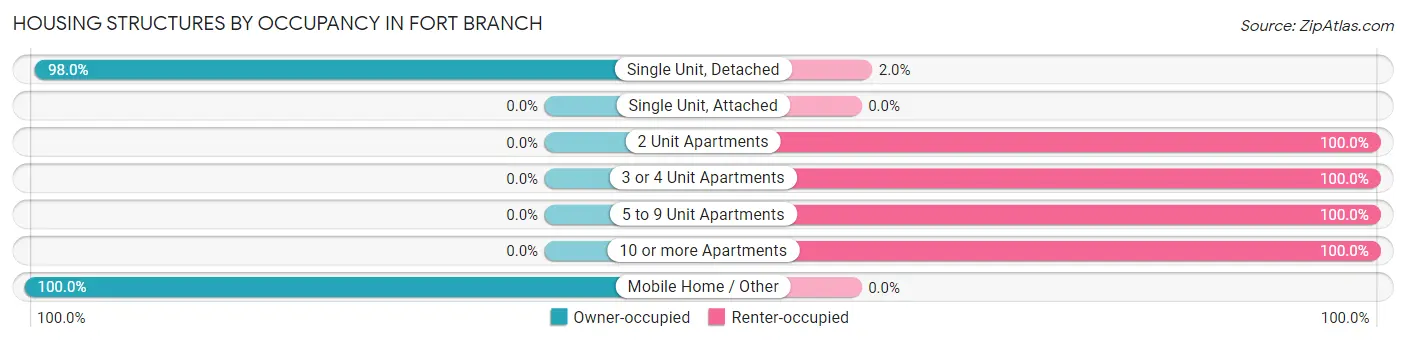
| Structure Type | Owner-occupied | Renter-occupied |
| Single Unit, Detached | 1,203 (98.0%) | 25 (2.0%) |
| Single Unit, Attached | 0 (0.0%) | 0 (0.0%) |
| 2 Unit Apartments | 0 (0.0%) | 50 (100.0%) |
| 3 or 4 Unit Apartments | 0 (0.0%) | 15 (100.0%) |
| 5 to 9 Unit Apartments | 0 (0.0%) | 70 (100.0%) |
| 10 or more Apartments | 0 (0.0%) | 204 (100.0%) |
| Mobile Home / Other | 44 (100.0%) | 0 (0.0%) |
| Total | 1,247 (77.4%) | 364 (22.6%) |
Housing Structures by Number of Rooms in Fort Branch
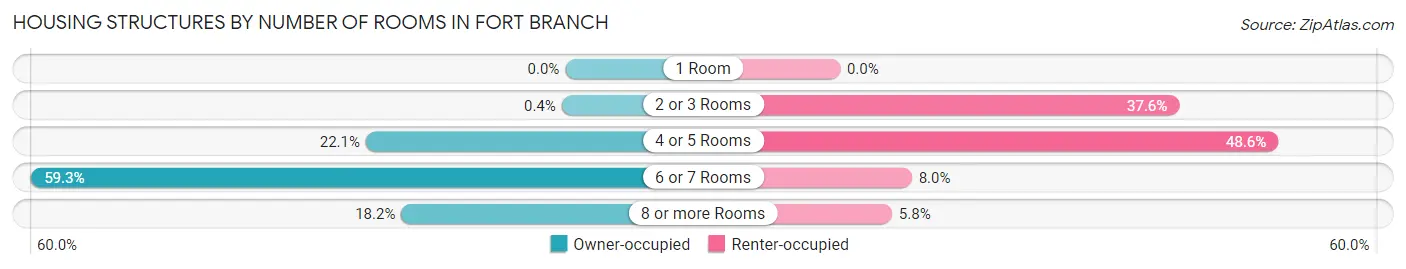
| Number of Rooms | Owner-occupied | Renter-occupied |
| 1 Room | 0 (0.0%) | 0 (0.0%) |
| 2 or 3 Rooms | 5 (0.4%) | 137 (37.6%) |
| 4 or 5 Rooms | 276 (22.1%) | 177 (48.6%) |
| 6 or 7 Rooms | 739 (59.3%) | 29 (8.0%) |
| 8 or more Rooms | 227 (18.2%) | 21 (5.8%) |
| Total | 1,247 (100.0%) | 364 (100.0%) |
Housing Structure by Heating Type in Fort Branch
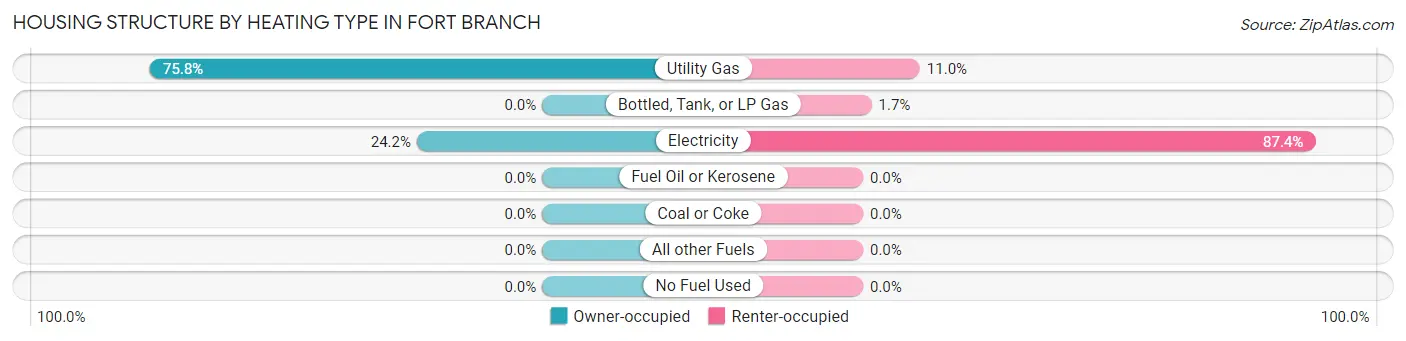
| Heating Type | Owner-occupied | Renter-occupied |
| Utility Gas | 945 (75.8%) | 40 (11.0%) |
| Bottled, Tank, or LP Gas | 0 (0.0%) | 6 (1.7%) |
| Electricity | 302 (24.2%) | 318 (87.4%) |
| Fuel Oil or Kerosene | 0 (0.0%) | 0 (0.0%) |
| Coal or Coke | 0 (0.0%) | 0 (0.0%) |
| All other Fuels | 0 (0.0%) | 0 (0.0%) |
| No Fuel Used | 0 (0.0%) | 0 (0.0%) |
| Total | 1,247 (100.0%) | 364 (100.0%) |
Household Vehicle Usage in Fort Branch
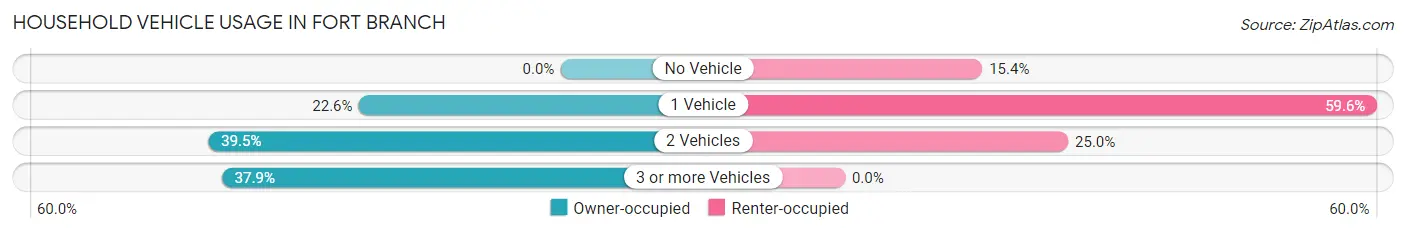
| Vehicles per Household | Owner-occupied | Renter-occupied |
| No Vehicle | 0 (0.0%) | 56 (15.4%) |
| 1 Vehicle | 282 (22.6%) | 217 (59.6%) |
| 2 Vehicles | 492 (39.5%) | 91 (25.0%) |
| 3 or more Vehicles | 473 (37.9%) | 0 (0.0%) |
| Total | 1,247 (100.0%) | 364 (100.0%) |
Real Estate & Mortgages in Fort Branch
Real Estate and Mortgage Overview in Fort Branch
| Characteristic | Without Mortgage | With Mortgage |
| Housing Units | 572 | 675 |
| Median Property Value | $171,700 | $165,600 |
| Median Household Income | $53,500 | $43 |
| Monthly Housing Costs | $490 | $7 |
| Real Estate Taxes | $1,216 | $31 |
Property Value by Mortgage Status in Fort Branch
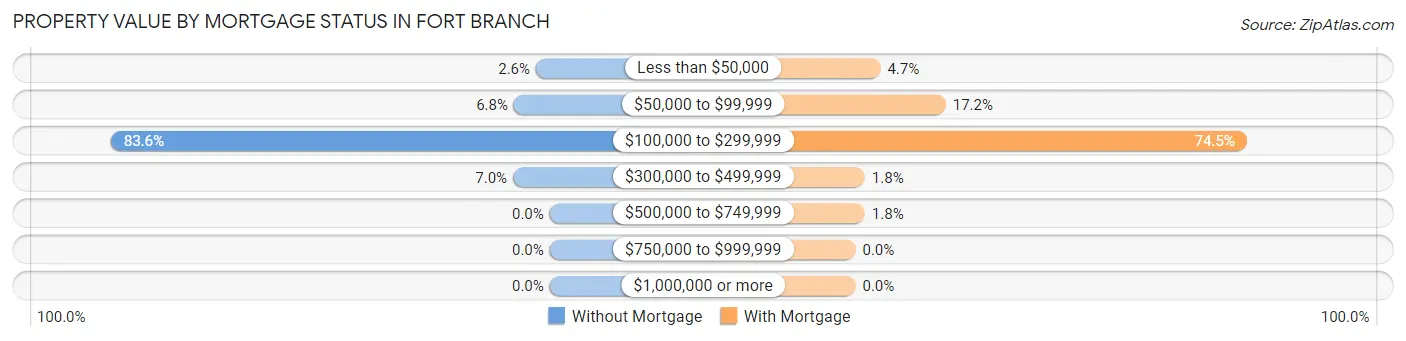
| Property Value | Without Mortgage | With Mortgage |
| Less than $50,000 | 15 (2.6%) | 32 (4.7%) |
| $50,000 to $99,999 | 39 (6.8%) | 116 (17.2%) |
| $100,000 to $299,999 | 478 (83.6%) | 503 (74.5%) |
| $300,000 to $499,999 | 40 (7.0%) | 12 (1.8%) |
| $500,000 to $749,999 | 0 (0.0%) | 12 (1.8%) |
| $750,000 to $999,999 | 0 (0.0%) | 0 (0.0%) |
| $1,000,000 or more | 0 (0.0%) | 0 (0.0%) |
| Total | 572 (100.0%) | 675 (100.0%) |
Household Income by Mortgage Status in Fort Branch
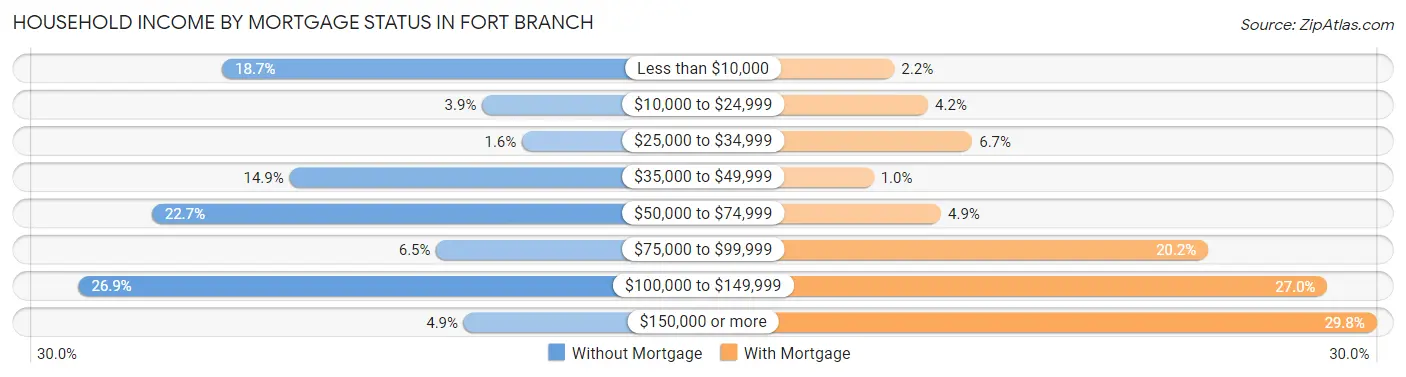
| Household Income | Without Mortgage | With Mortgage |
| Less than $10,000 | 107 (18.7%) | 15 (2.2%) |
| $10,000 to $24,999 | 22 (3.8%) | 28 (4.2%) |
| $25,000 to $34,999 | 9 (1.6%) | 45 (6.7%) |
| $35,000 to $49,999 | 85 (14.9%) | 7 (1.0%) |
| $50,000 to $74,999 | 130 (22.7%) | 33 (4.9%) |
| $75,000 to $99,999 | 37 (6.5%) | 136 (20.2%) |
| $100,000 to $149,999 | 154 (26.9%) | 182 (27.0%) |
| $150,000 or more | 28 (4.9%) | 201 (29.8%) |
| Total | 572 (100.0%) | 675 (100.0%) |
Property Value to Household Income Ratio in Fort Branch
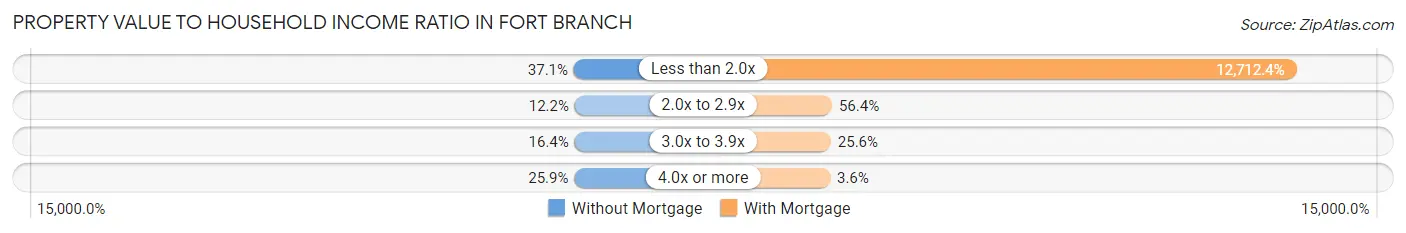
| Value-to-Income Ratio | Without Mortgage | With Mortgage |
| Less than 2.0x | 212 (37.1%) | 85,809 (12,712.4%) |
| 2.0x to 2.9x | 70 (12.2%) | 381 (56.4%) |
| 3.0x to 3.9x | 94 (16.4%) | 173 (25.6%) |
| 4.0x or more | 148 (25.9%) | 24 (3.6%) |
| Total | 572 (100.0%) | 675 (100.0%) |
Real Estate Taxes by Mortgage Status in Fort Branch
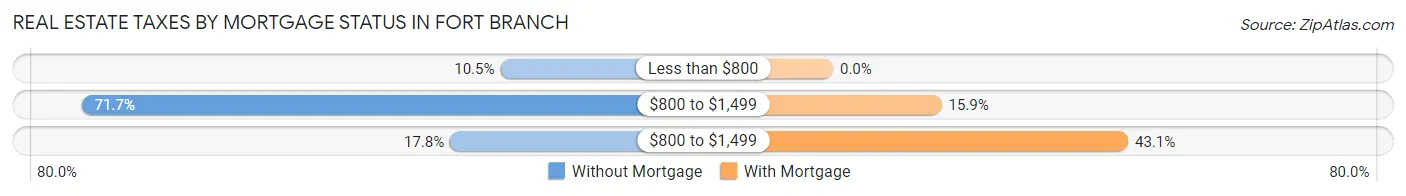
| Property Taxes | Without Mortgage | With Mortgage |
| Less than $800 | 60 (10.5%) | 0 (0.0%) |
| $800 to $1,499 | 410 (71.7%) | 107 (15.9%) |
| $800 to $1,499 | 102 (17.8%) | 291 (43.1%) |
| Total | 572 (100.0%) | 675 (100.0%) |
Health & Disability in Fort Branch
Health Insurance Coverage by Age in Fort Branch
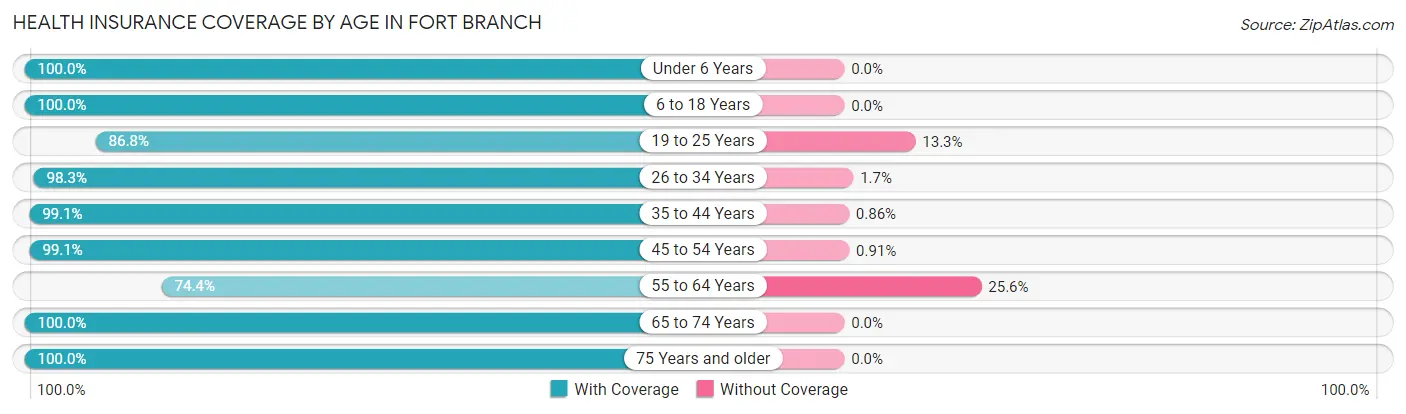
| Age Bracket | With Coverage | Without Coverage |
| Under 6 Years | 321 (100.0%) | 0 (0.0%) |
| 6 to 18 Years | 519 (100.0%) | 0 (0.0%) |
| 19 to 25 Years | 334 (86.8%) | 51 (13.3%) |
| 26 to 34 Years | 472 (98.3%) | 8 (1.7%) |
| 35 to 44 Years | 460 (99.1%) | 4 (0.9%) |
| 45 to 54 Years | 325 (99.1%) | 3 (0.9%) |
| 55 to 64 Years | 396 (74.4%) | 136 (25.6%) |
| 65 to 74 Years | 373 (100.0%) | 0 (0.0%) |
| 75 Years and older | 159 (100.0%) | 0 (0.0%) |
| Total | 3,359 (94.3%) | 202 (5.7%) |
Health Insurance Coverage by Citizenship Status in Fort Branch
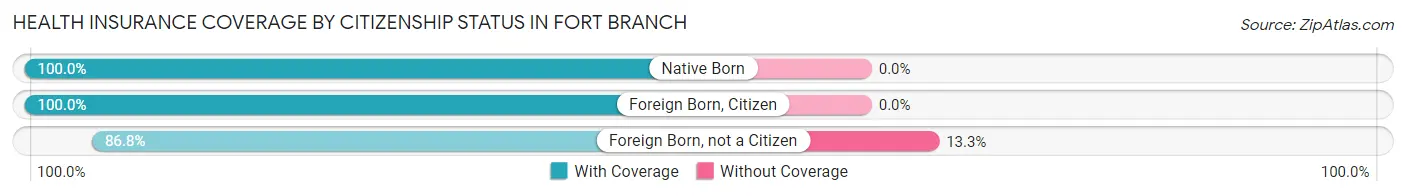
| Citizenship Status | With Coverage | Without Coverage |
| Native Born | 321 (100.0%) | 0 (0.0%) |
| Foreign Born, Citizen | 519 (100.0%) | 0 (0.0%) |
| Foreign Born, not a Citizen | 334 (86.8%) | 51 (13.3%) |
Health Insurance Coverage by Household Income in Fort Branch
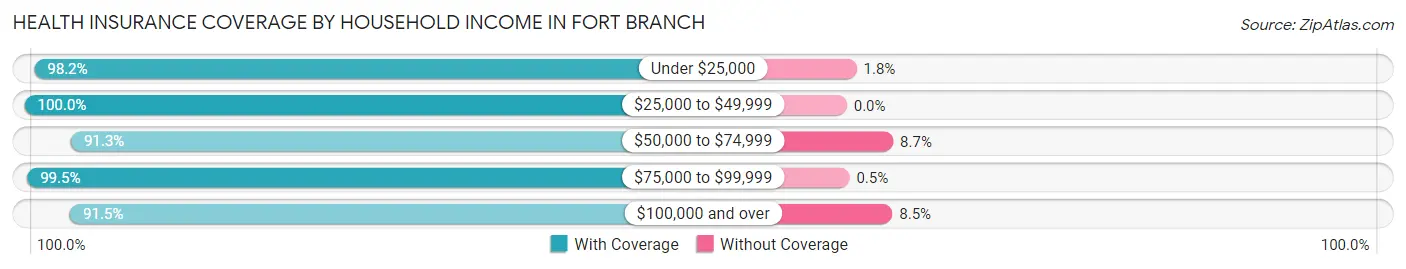
| Household Income | With Coverage | Without Coverage |
| Under $25,000 | 426 (98.2%) | 8 (1.8%) |
| $25,000 to $49,999 | 303 (100.0%) | 0 (0.0%) |
| $50,000 to $74,999 | 799 (91.3%) | 76 (8.7%) |
| $75,000 to $99,999 | 595 (99.5%) | 3 (0.5%) |
| $100,000 and over | 1,233 (91.5%) | 115 (8.5%) |
Public vs Private Health Insurance Coverage by Age in Fort Branch
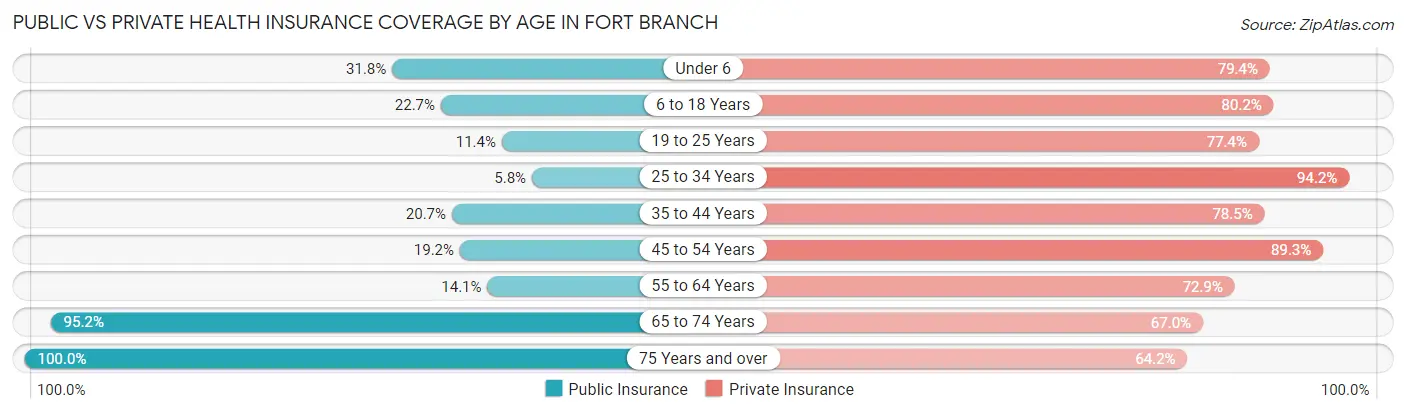
| Age Bracket | Public Insurance | Private Insurance |
| Under 6 | 102 (31.8%) | 255 (79.4%) |
| 6 to 18 Years | 118 (22.7%) | 416 (80.1%) |
| 19 to 25 Years | 44 (11.4%) | 298 (77.4%) |
| 25 to 34 Years | 28 (5.8%) | 452 (94.2%) |
| 35 to 44 Years | 96 (20.7%) | 364 (78.4%) |
| 45 to 54 Years | 63 (19.2%) | 293 (89.3%) |
| 55 to 64 Years | 75 (14.1%) | 388 (72.9%) |
| 65 to 74 Years | 355 (95.2%) | 250 (67.0%) |
| 75 Years and over | 159 (100.0%) | 102 (64.1%) |
| Total | 1,040 (29.2%) | 2,818 (79.1%) |
Disability Status by Sex by Age in Fort Branch
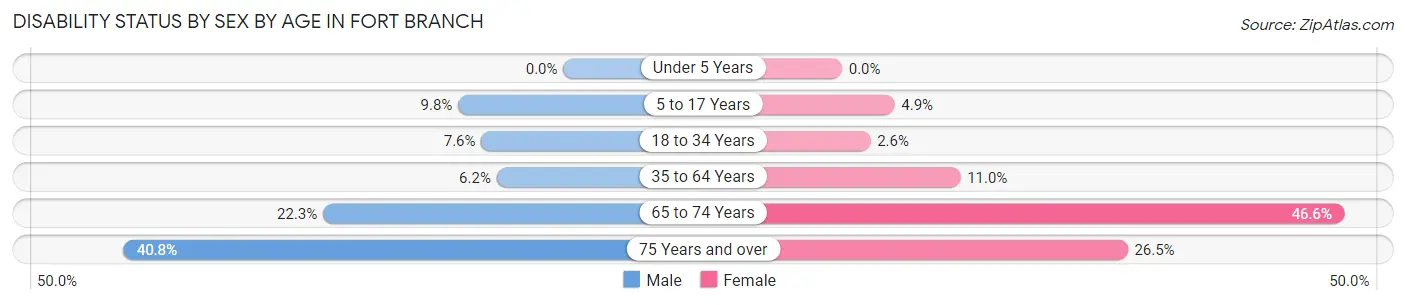
| Age Bracket | Male | Female |
| Under 5 Years | 0 (0.0%) | 0 (0.0%) |
| 5 to 17 Years | 32 (9.8%) | 10 (4.9%) |
| 18 to 34 Years | 37 (7.6%) | 11 (2.6%) |
| 35 to 64 Years | 43 (6.2%) | 69 (11.0%) |
| 65 to 74 Years | 31 (22.3%) | 109 (46.6%) |
| 75 Years and over | 31 (40.8%) | 22 (26.5%) |
Disability Class by Sex by Age in Fort Branch
Disability Class: Hearing Difficulty
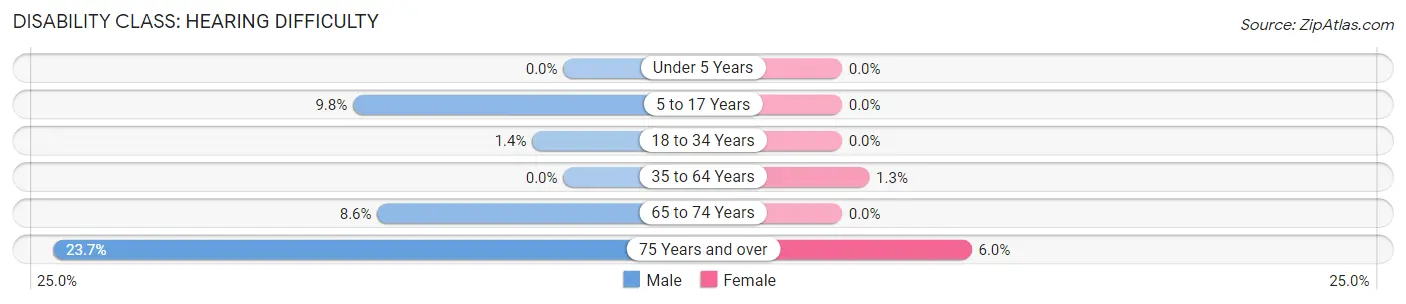
| Age Bracket | Male | Female |
| Under 5 Years | 0 (0.0%) | 0 (0.0%) |
| 5 to 17 Years | 32 (9.8%) | 0 (0.0%) |
| 18 to 34 Years | 7 (1.4%) | 0 (0.0%) |
| 35 to 64 Years | 0 (0.0%) | 8 (1.3%) |
| 65 to 74 Years | 12 (8.6%) | 0 (0.0%) |
| 75 Years and over | 18 (23.7%) | 5 (6.0%) |
Disability Class: Vision Difficulty
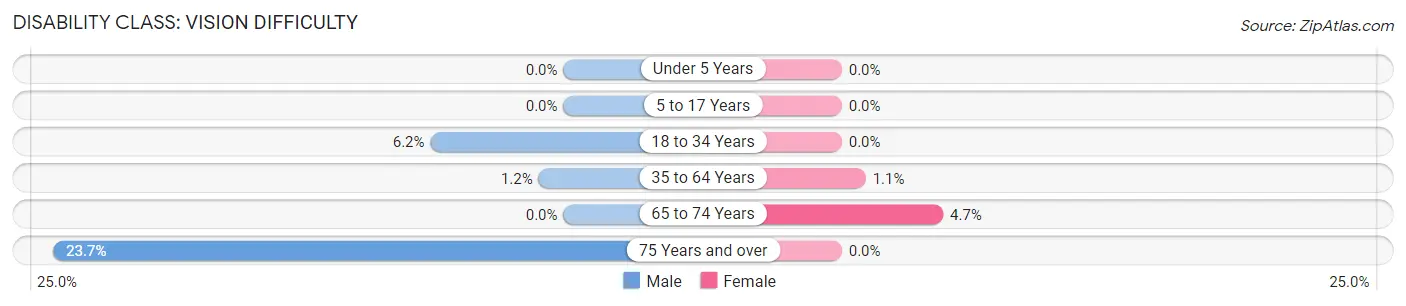
| Age Bracket | Male | Female |
| Under 5 Years | 0 (0.0%) | 0 (0.0%) |
| 5 to 17 Years | 0 (0.0%) | 0 (0.0%) |
| 18 to 34 Years | 30 (6.2%) | 0 (0.0%) |
| 35 to 64 Years | 8 (1.1%) | 7 (1.1%) |
| 65 to 74 Years | 0 (0.0%) | 11 (4.7%) |
| 75 Years and over | 18 (23.7%) | 0 (0.0%) |
Disability Class: Cognitive Difficulty
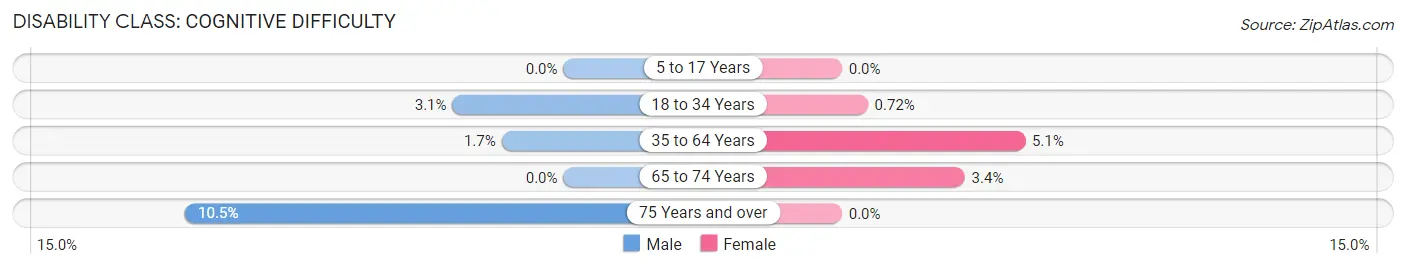
| Age Bracket | Male | Female |
| 5 to 17 Years | 0 (0.0%) | 0 (0.0%) |
| 18 to 34 Years | 15 (3.1%) | 3 (0.7%) |
| 35 to 64 Years | 12 (1.7%) | 32 (5.1%) |
| 65 to 74 Years | 0 (0.0%) | 8 (3.4%) |
| 75 Years and over | 8 (10.5%) | 0 (0.0%) |
Disability Class: Ambulatory Difficulty
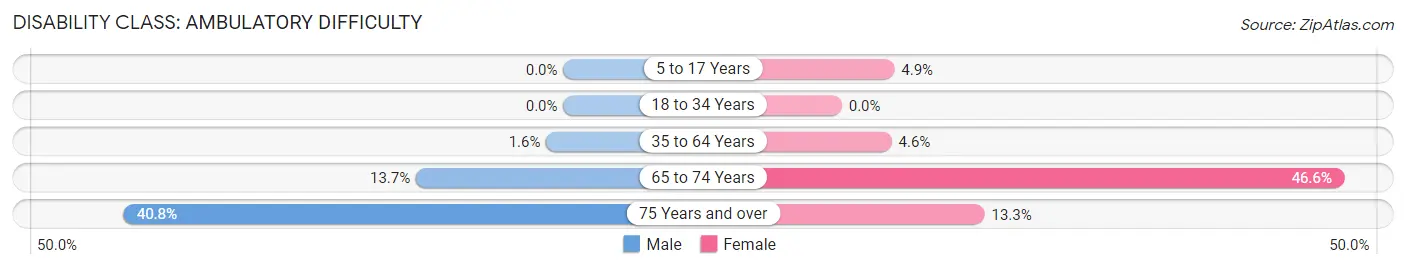
| Age Bracket | Male | Female |
| 5 to 17 Years | 0 (0.0%) | 10 (4.9%) |
| 18 to 34 Years | 0 (0.0%) | 0 (0.0%) |
| 35 to 64 Years | 11 (1.6%) | 29 (4.6%) |
| 65 to 74 Years | 19 (13.7%) | 109 (46.6%) |
| 75 Years and over | 31 (40.8%) | 11 (13.3%) |
Disability Class: Self-Care Difficulty
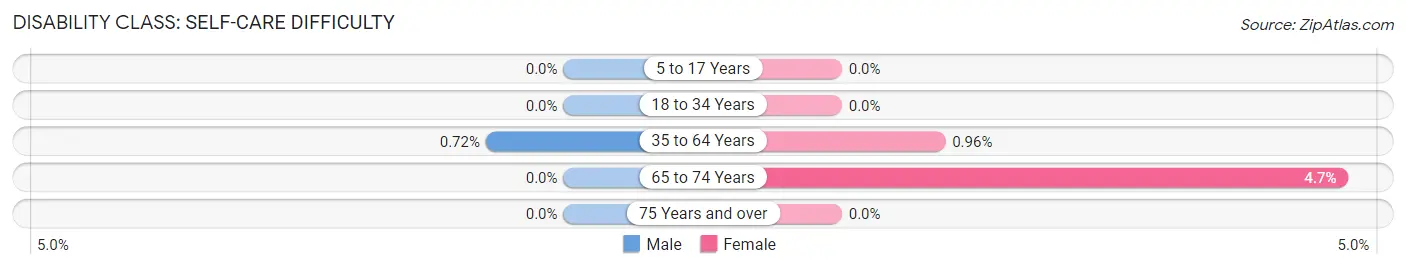
| Age Bracket | Male | Female |
| 5 to 17 Years | 0 (0.0%) | 0 (0.0%) |
| 18 to 34 Years | 0 (0.0%) | 0 (0.0%) |
| 35 to 64 Years | 5 (0.7%) | 6 (1.0%) |
| 65 to 74 Years | 0 (0.0%) | 11 (4.7%) |
| 75 Years and over | 0 (0.0%) | 0 (0.0%) |
Technology Access in Fort Branch
Computing Device Access in Fort Branch
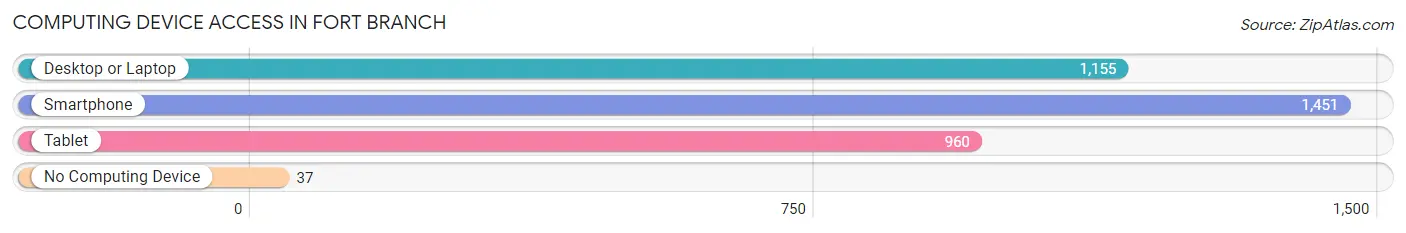
| Device Type | # Households | % Households |
| Desktop or Laptop | 1,155 | 71.7% |
| Smartphone | 1,451 | 90.1% |
| Tablet | 960 | 59.6% |
| No Computing Device | 37 | 2.3% |
| Total | 1,611 | 100.0% |
Internet Access in Fort Branch
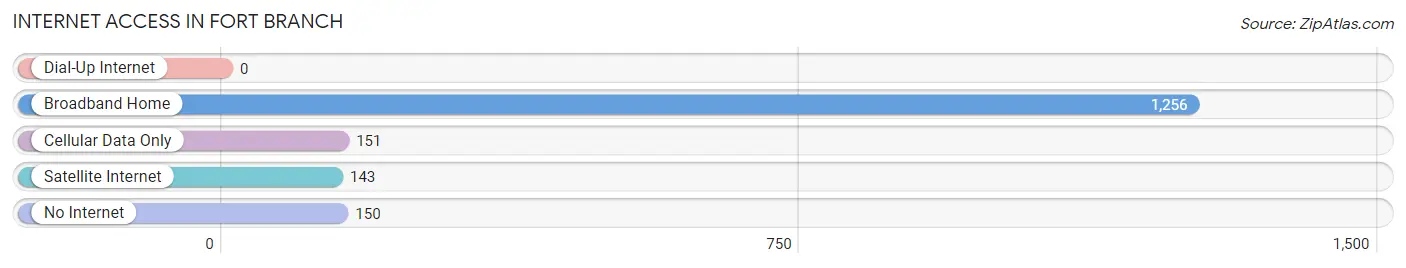
| Internet Type | # Households | % Households |
| Dial-Up Internet | 0 | 0.0% |
| Broadband Home | 1,256 | 78.0% |
| Cellular Data Only | 151 | 9.4% |
| Satellite Internet | 143 | 8.9% |
| No Internet | 150 | 9.3% |
| Total | 1,611 | 100.0% |
Fort Branch Summary
History
Fort Branch is a small town located in Gibson County, Indiana. It is situated on the banks of the Wabash River, about 25 miles east of Evansville. The town was founded in 1817 by a group of settlers from Kentucky and Tennessee, who were looking for a place to settle and build a fort. The fort was built to protect the settlers from Native American attacks, and it was named Fort Branch after the nearby creek.
The town grew slowly over the years, and by the mid-1800s, it had become a thriving community. The town was home to several businesses, including a sawmill, a gristmill, a blacksmith shop, and a general store. The town also had a school, a post office, and a church.
In the late 1800s, the railroad came to town, bringing with it new opportunities for growth. The town was incorporated in 1891, and the population began to grow rapidly. By the early 1900s, the town had become a major agricultural center, with several large farms in the area.
The town continued to grow throughout the 20th century, and today it is home to a population of around 2,500 people. The town is still a major agricultural center, and it is also home to several businesses, including a grocery store, a hardware store, and a bank.
Geography
Fort Branch is located in the southwestern corner of Gibson County, Indiana. It is situated on the banks of the Wabash River, about 25 miles east of Evansville. The town is surrounded by rolling hills and farmland, and it is located in a region known as the Wabash Valley.
The town has a total area of 1.3 square miles, all of which is land. The town is located at an elevation of 590 feet above sea level. The climate in the area is humid continental, with hot summers and cold winters.
Economy
The economy of Fort Branch is largely based on agriculture. The town is home to several large farms, and the surrounding area is known for its production of corn, soybeans, and wheat. The town is also home to several businesses, including a grocery store, a hardware store, and a bank.
The town is also home to a number of manufacturing companies, including a plastics manufacturer and a metal fabrication company. The town is also home to a number of small businesses, including restaurants, retail stores, and service providers.
Demographics
As of the 2010 census, the population of Fort Branch was 2,521. The racial makeup of the town was 97.3% White, 0.7% African American, 0.2% Native American, 0.3% Asian, 0.1% Pacific Islander, 0.4% from other races, and 1.0% from two or more races. Hispanic or Latino of any race were 1.3% of the population.
The median household income in Fort Branch was $41,250, and the median family income was $48,750. The per capita income for the town was $19,945. About 11.2% of families and 13.3% of the population were below the poverty line, including 17.2% of those under age 18 and 8.2% of those age 65 or over.
Common Questions
What is the Total Population of Fort Branch?
Total Population of Fort Branch is 3,561.
What is the Total Male Population of Fort Branch?
Total Male Population of Fort Branch is 1,835.
What is the Total Female Population of Fort Branch?
Total Female Population of Fort Branch is 1,726.
What is the Ratio of Males per 100 Females in Fort Branch?
There are 106.32 Males per 100 Females in Fort Branch.
What is the Ratio of Females per 100 Males in Fort Branch?
There are 94.06 Females per 100 Males in Fort Branch.
What is the Median Population Age in Fort Branch?
Median Population Age in Fort Branch is 37.5 Years.
What is the Average Family Size in Fort Branch
Average Family Size in Fort Branch is 2.7 People.
What is the Average Household Size in Fort Branch
Average Household Size in Fort Branch is 2.2 People.
What is Per Capita Income in Fort Branch?
Per Capita income in Fort Branch is $31,314.
What is the Median Family Income in Fort Branch?
Median Family Income in Fort Branch is $72,303.
What is the Median Household income in Fort Branch?
Median Household Income in Fort Branch is $64,034.
What is Income or Wage Gap in Fort Branch?
Income or Wage Gap in Fort Branch is 43.7%.
Women in Fort Branch earn 56.3 cents for every dollar earned by a man.
What is Inequality or Gini Index in Fort Branch?
Inequality or Gini Index in Fort Branch is 0.37.
How Large is the Labor Force in Fort Branch?
There are 2,097 People in the Labor Forcein in Fort Branch.
What is the Percentage of People in the Labor Force in Fort Branch?
72.3% of People are in the Labor Force in Fort Branch.
What is the Unemployment Rate in Fort Branch?
Unemployment Rate in Fort Branch is 2.5%.