West Baden Springs, IN
West Baden Springs Map
West Baden Springs Overview
479
TOTAL POPULATION
194
MALE POPULATION
285
FEMALE POPULATION
68.07
MALES / 100 FEMALES
146.91
FEMALES / 100 MALES
35.6
MEDIAN AGE
2.7
AVG FAMILY SIZE
2.2
AVG HOUSEHOLD SIZE
$26,448
PER CAPITA INCOME
$56,719
AVG FAMILY INCOME
$38,542
AVG HOUSEHOLD INCOME
23.4%
WAGE / INCOME GAP [ % ]
76.6¢/ $1
WAGE / INCOME GAP [ $ ]
0.46
INEQUALITY / GINI INDEX
222
LABOR FORCE [ PEOPLE ]
59.2%
PERCENT IN LABOR FORCE
7.7%
UNEMPLOYMENT RATE
West Baden Springs Zip Codes
West Baden Springs Area Codes
Race in West Baden Springs
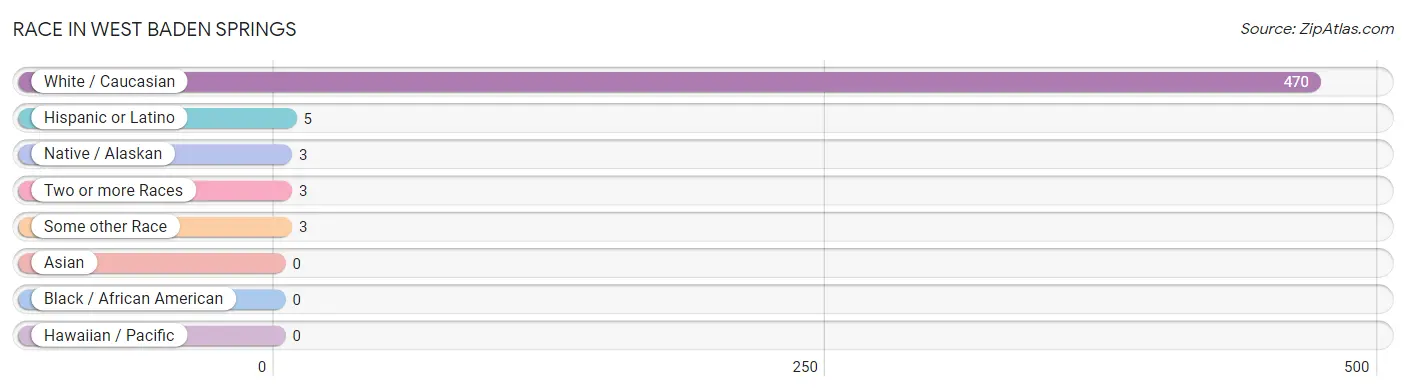
The most populous races in West Baden Springs are White / Caucasian (470 | 98.1%), Hispanic or Latino (5 | 1.0%), and Native / Alaskan (3 | 0.6%).
| Race | # Population | % Population |
| Asian | 0 | 0.0% |
| Black / African American | 0 | 0.0% |
| Hawaiian / Pacific | 0 | 0.0% |
| Hispanic or Latino | 5 | 1.0% |
| Native / Alaskan | 3 | 0.6% |
| White / Caucasian | 470 | 98.1% |
| Two or more Races | 3 | 0.6% |
| Some other Race | 3 | 0.6% |
| Total | 479 | 100.0% |
Ancestry in West Baden Springs
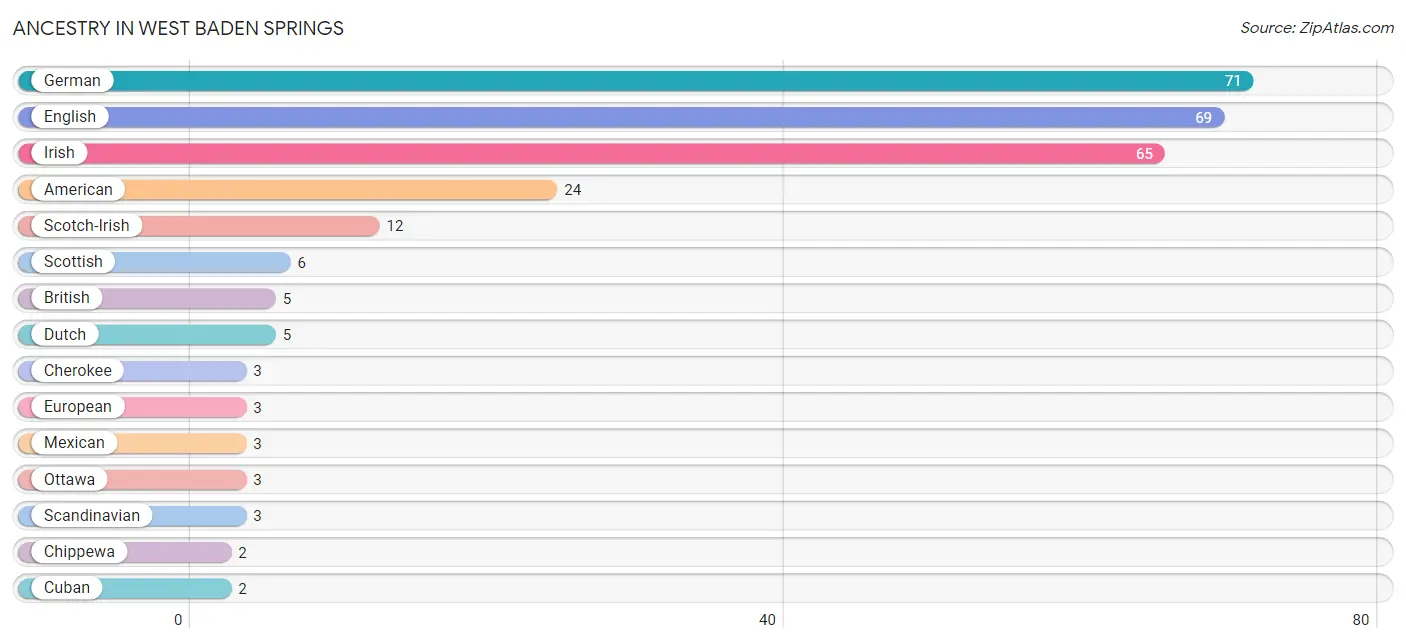
The most populous ancestries reported in West Baden Springs are German (71 | 14.8%), English (69 | 14.4%), Irish (65 | 13.6%), American (24 | 5.0%), and Scotch-Irish (12 | 2.5%), together accounting for 50.3% of all West Baden Springs residents.
| Ancestry | # Population | % Population |
| American | 24 | 5.0% |
| British | 5 | 1.0% |
| Cherokee | 3 | 0.6% |
| Chippewa | 2 | 0.4% |
| Cuban | 2 | 0.4% |
| Dutch | 5 | 1.0% |
| English | 69 | 14.4% |
| European | 3 | 0.6% |
| French | 2 | 0.4% |
| French Canadian | 2 | 0.4% |
| German | 71 | 14.8% |
| Irish | 65 | 13.6% |
| Italian | 2 | 0.4% |
| Lithuanian | 2 | 0.4% |
| Mexican | 3 | 0.6% |
| Ottawa | 3 | 0.6% |
| Polish | 1 | 0.2% |
| Russian | 1 | 0.2% |
| Scandinavian | 3 | 0.6% |
| Scotch-Irish | 12 | 2.5% |
| Scottish | 6 | 1.3% |
| Swiss | 2 | 0.4% | View All 22 Rows |
Immigrants in West Baden Springs

| Immigration Origin | # Population | % Population | View All 0 Rows |
Sex and Age in West Baden Springs
Sex and Age in West Baden Springs
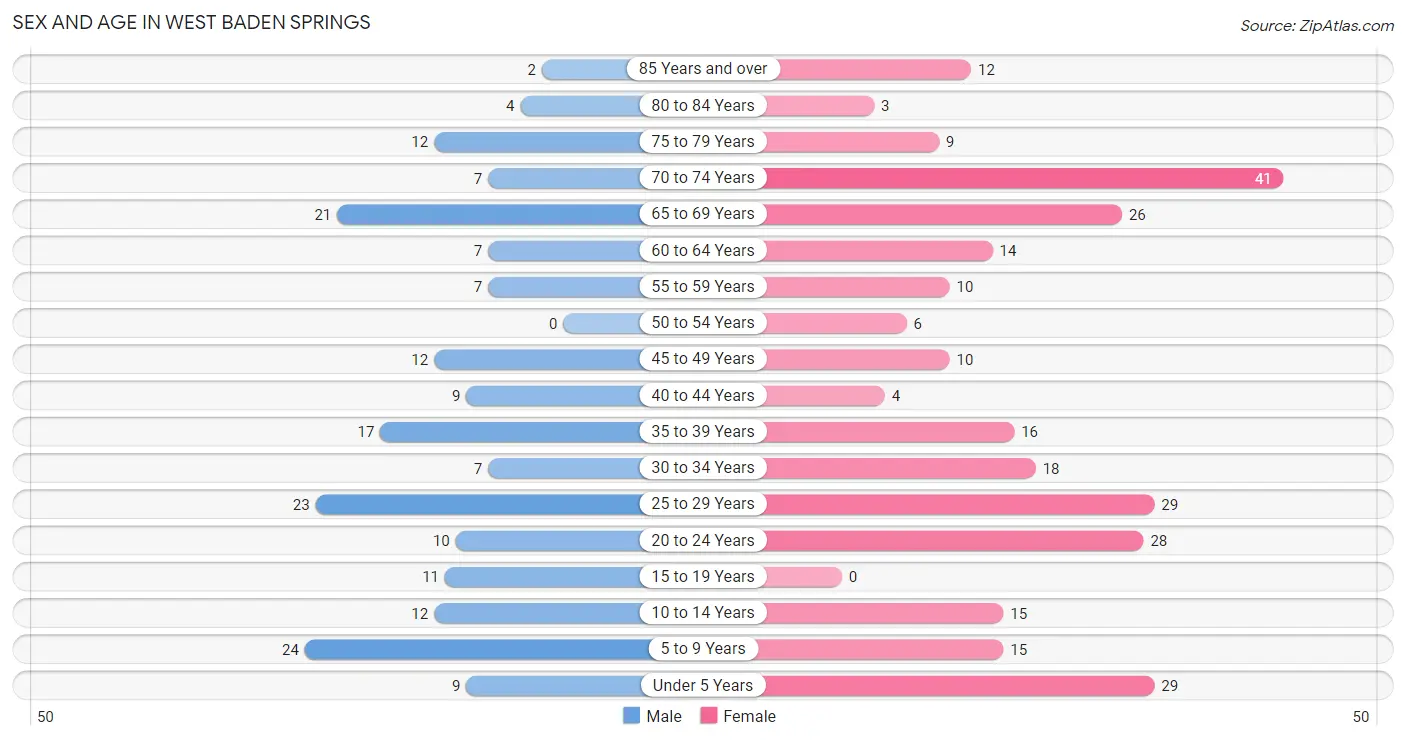
The most populous age groups in West Baden Springs are 5 to 9 Years (24 | 12.4%) for men and 70 to 74 Years (41 | 14.4%) for women.
| Age Bracket | Male | Female |
| Under 5 Years | 9 (4.6%) | 29 (10.2%) |
| 5 to 9 Years | 24 (12.4%) | 15 (5.3%) |
| 10 to 14 Years | 12 (6.2%) | 15 (5.3%) |
| 15 to 19 Years | 11 (5.7%) | 0 (0.0%) |
| 20 to 24 Years | 10 (5.1%) | 28 (9.8%) |
| 25 to 29 Years | 23 (11.9%) | 29 (10.2%) |
| 30 to 34 Years | 7 (3.6%) | 18 (6.3%) |
| 35 to 39 Years | 17 (8.8%) | 16 (5.6%) |
| 40 to 44 Years | 9 (4.6%) | 4 (1.4%) |
| 45 to 49 Years | 12 (6.2%) | 10 (3.5%) |
| 50 to 54 Years | 0 (0.0%) | 6 (2.1%) |
| 55 to 59 Years | 7 (3.6%) | 10 (3.5%) |
| 60 to 64 Years | 7 (3.6%) | 14 (4.9%) |
| 65 to 69 Years | 21 (10.8%) | 26 (9.1%) |
| 70 to 74 Years | 7 (3.6%) | 41 (14.4%) |
| 75 to 79 Years | 12 (6.2%) | 9 (3.2%) |
| 80 to 84 Years | 4 (2.1%) | 3 (1.1%) |
| 85 Years and over | 2 (1.0%) | 12 (4.2%) |
| Total | 194 (100.0%) | 285 (100.0%) |
Families and Households in West Baden Springs
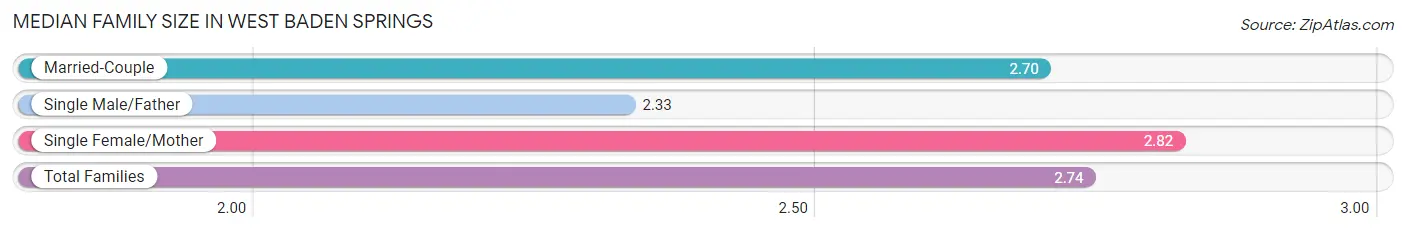
Median Family Size in West Baden Springs
The median family size in West Baden Springs is 2.74 persons per family, with single female/mother families (44 | 36.4%) accounting for the largest median family size of 2.82 persons per family. On the other hand, single male/father families (3 | 2.5%) represent the smallest median family size with 2.33 persons per family.
| Family Type | # Families | Family Size |
| Married-Couple | 74 (61.2%) | 2.70 |
| Single Male/Father | 3 (2.5%) | 2.33 |
| Single Female/Mother | 44 (36.4%) | 2.82 |
| Total Families | 121 (100.0%) | 2.74 |
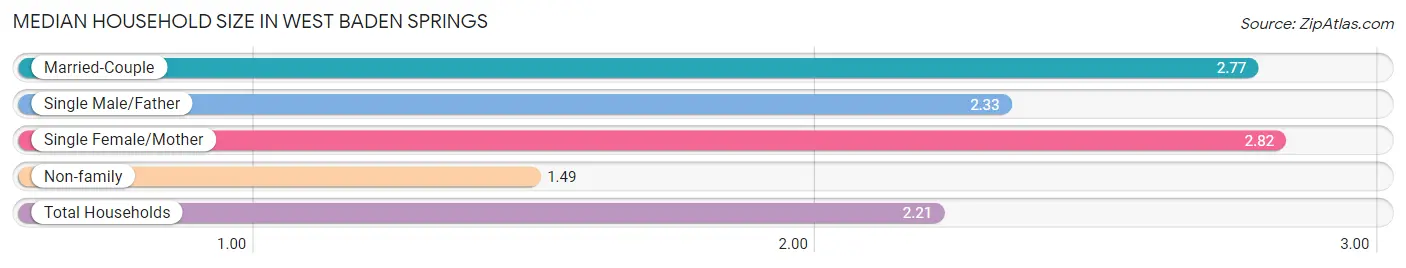
Median Household Size in West Baden Springs
The median household size in West Baden Springs is 2.21 persons per household, with single female/mother households (44 | 20.3%) accounting for the largest median household size of 2.82 persons per household. non-family households (96 | 44.2%) represent the smallest median household size with 1.49 persons per household.
| Household Type | # Households | Household Size |
| Married-Couple | 74 (34.1%) | 2.77 |
| Single Male/Father | 3 (1.4%) | 2.33 |
| Single Female/Mother | 44 (20.3%) | 2.82 |
| Non-family | 96 (44.2%) | 1.49 |
| Total Households | 217 (100.0%) | 2.21 |
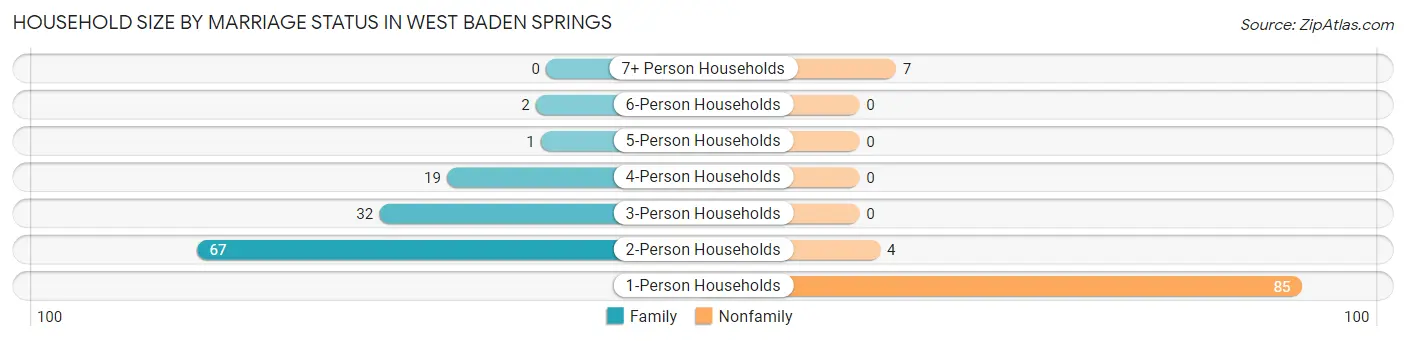
Household Size by Marriage Status in West Baden Springs
Out of a total of 217 households in West Baden Springs, 121 (55.8%) are family households, while 96 (44.2%) are nonfamily households. The most numerous type of family households are 2-person households, comprising 67, and the most common type of nonfamily households are 1-person households, comprising 85.
| Household Size | Family Households | Nonfamily Households |
| 1-Person Households | - | 85 (39.2%) |
| 2-Person Households | 67 (30.9%) | 4 (1.8%) |
| 3-Person Households | 32 (14.7%) | 0 (0.0%) |
| 4-Person Households | 19 (8.8%) | 0 (0.0%) |
| 5-Person Households | 1 (0.5%) | 0 (0.0%) |
| 6-Person Households | 2 (0.9%) | 0 (0.0%) |
| 7+ Person Households | 0 (0.0%) | 7 (3.2%) |
| Total | 121 (55.8%) | 96 (44.2%) |
Female Fertility in West Baden Springs
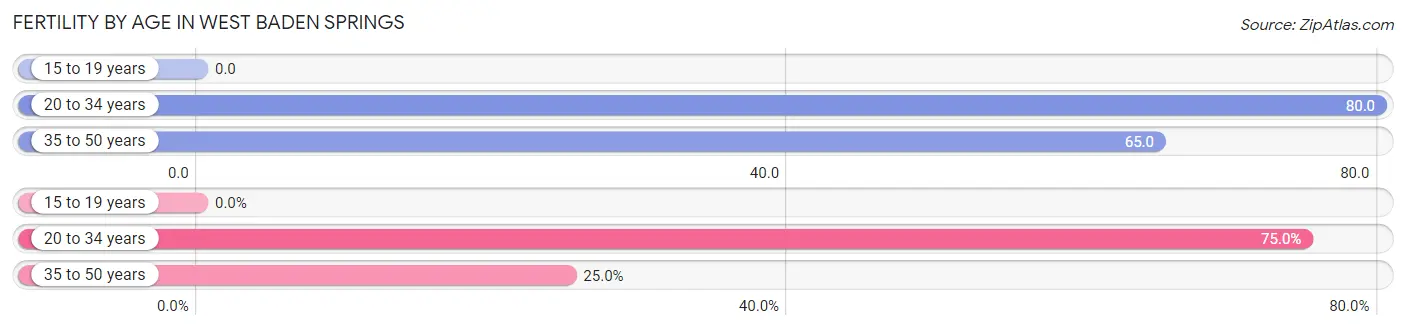
Fertility by Age in West Baden Springs
Average fertility rate in West Baden Springs is 75.0 births per 1,000 women. Women in the age bracket of 20 to 34 years have the highest fertility rate with 80.0 births per 1,000 women. Women in the age bracket of 20 to 34 years acount for 75.0% of all women with births.
| Age Bracket | Women with Births | Births / 1,000 Women |
| 15 to 19 years | 0 (0.0%) | 0.0 |
| 20 to 34 years | 6 (75.0%) | 80.0 |
| 35 to 50 years | 2 (25.0%) | 65.0 |
| Total | 8 (100.0%) | 75.0 |
Fertility by Age by Marriage Status in West Baden Springs
62.5% of women with births (8) in West Baden Springs are married. The highest percentage of unmarried women with births falls into 20 to 34 years age bracket with 50.0% of them unmarried at the time of birth, while the lowest percentage of unmarried women with births belong to 35 to 50 years age bracket with 0.0% of them unmarried.
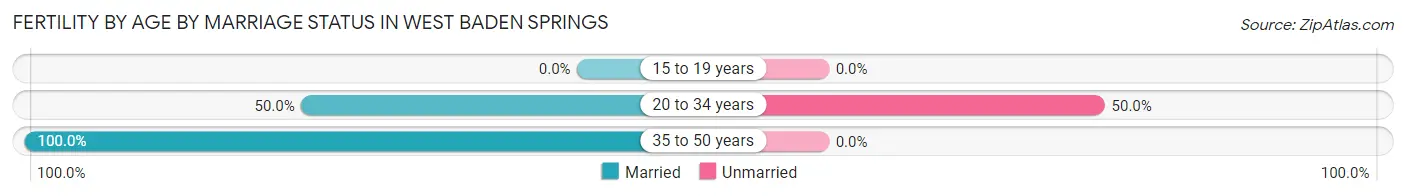
| Age Bracket | Married | Unmarried |
| 15 to 19 years | 0 (0.0%) | 0 (0.0%) |
| 20 to 34 years | 3 (50.0%) | 3 (50.0%) |
| 35 to 50 years | 2 (100.0%) | 0 (0.0%) |
| Total | 5 (62.5%) | 3 (37.5%) |
Fertility by Education in West Baden Springs
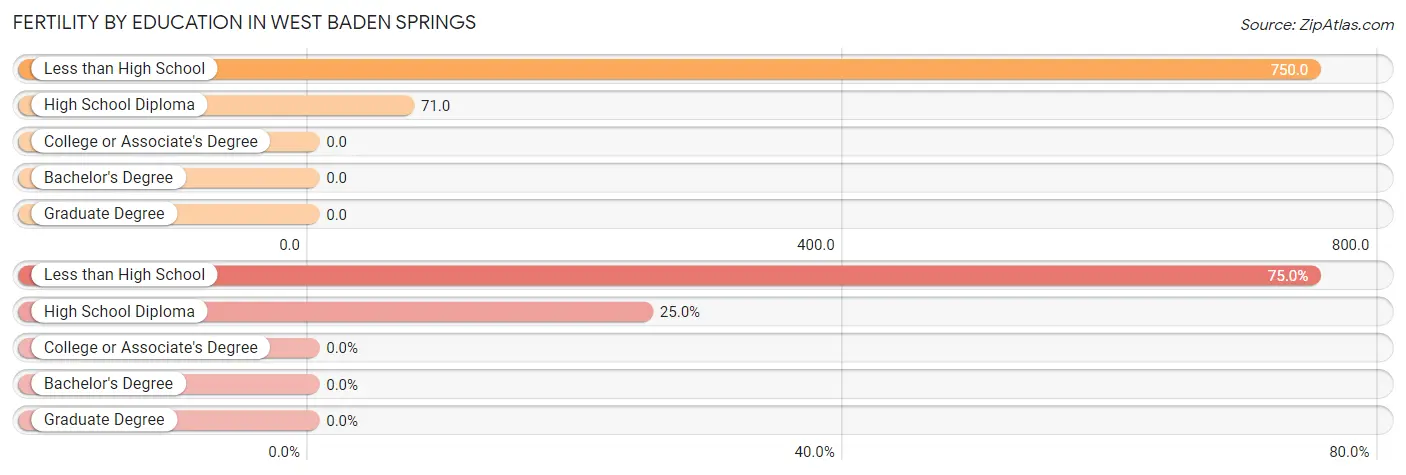
| Educational Attainment | Women with Births | Births / 1,000 Women |
| Less than High School | 6 (75.0%) | 750.0 |
| High School Diploma | 2 (25.0%) | 71.0 |
| College or Associate's Degree | 0 (0.0%) | 0.0 |
| Bachelor's Degree | 0 (0.0%) | 0.0 |
| Graduate Degree | 0 (0.0%) | 0.0 |
| Total | 8 (100.0%) | 75.0 |
Fertility by Education by Marriage Status in West Baden Springs
37.5% of women with births in West Baden Springs are unmarried. Women with the educational attainment of high school diploma are most likely to be married with 100.0% of them married at childbirth, while women with the educational attainment of less than high school are least likely to be married with 50.0% of them unmarried at childbirth.
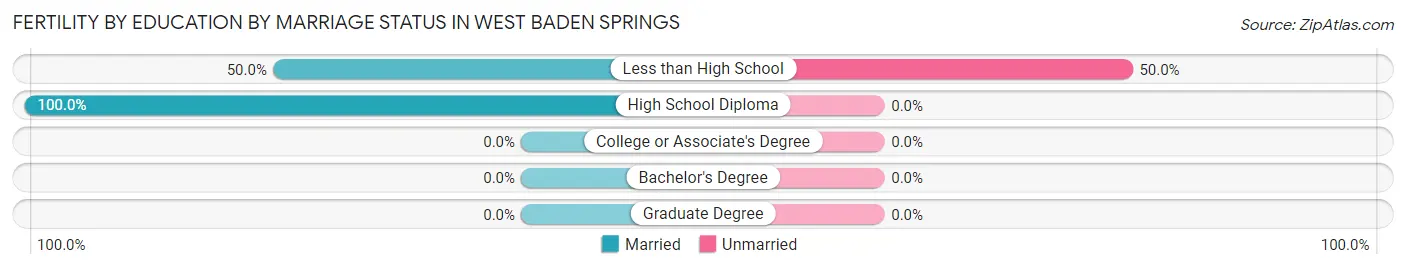
| Educational Attainment | Married | Unmarried |
| Less than High School | 3 (50.0%) | 3 (50.0%) |
| High School Diploma | 2 (100.0%) | 0 (0.0%) |
| College or Associate's Degree | 0 (0.0%) | 0 (0.0%) |
| Bachelor's Degree | 0 (0.0%) | 0 (0.0%) |
| Graduate Degree | 0 (0.0%) | 0 (0.0%) |
| Total | 5 (62.5%) | 3 (37.5%) |
Income in West Baden Springs
Income Overview in West Baden Springs
Per Capita Income in West Baden Springs is $26,448, while median incomes of families and households are $56,719 and $38,542 respectively.
| Characteristic | Number | Measure |
| Per Capita Income | 479 | $26,448 |
| Median Family Income | 121 | $56,719 |
| Mean Family Income | 121 | $78,675 |
| Median Household Income | 217 | $38,542 |
| Mean Household Income | 217 | $56,930 |
| Income Deficit | 121 | $0 |
| Wage / Income Gap (%) | 479 | 23.39% |
| Wage / Income Gap ($) | 479 | 76.61¢ per $1 |
| Gini / Inequality Index | 479 | 0.46 |
Earnings by Sex in West Baden Springs
Average Earnings in West Baden Springs are $31,313, $38,750 for men and $29,688 for women, a difference of 23.4%.
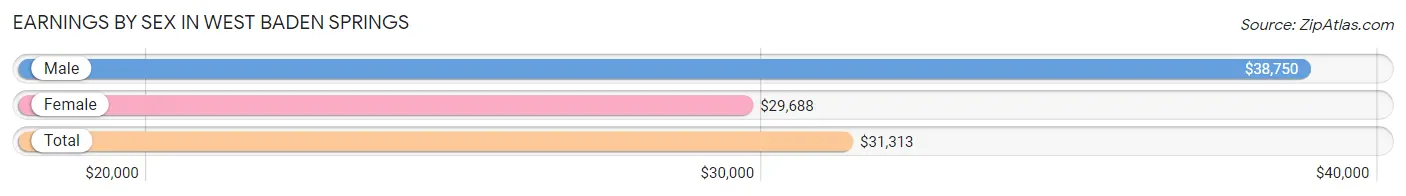
| Sex | Number | Average Earnings |
| Male | 96 (42.7%) | $38,750 |
| Female | 129 (57.3%) | $29,688 |
| Total | 225 (100.0%) | $31,313 |
Earnings by Sex by Income Bracket in West Baden Springs
The most common earnings brackets in West Baden Springs are $15,000 to $17,499 for men (11 | 11.5%) and $30,000 to $34,999 for women (24 | 18.6%).
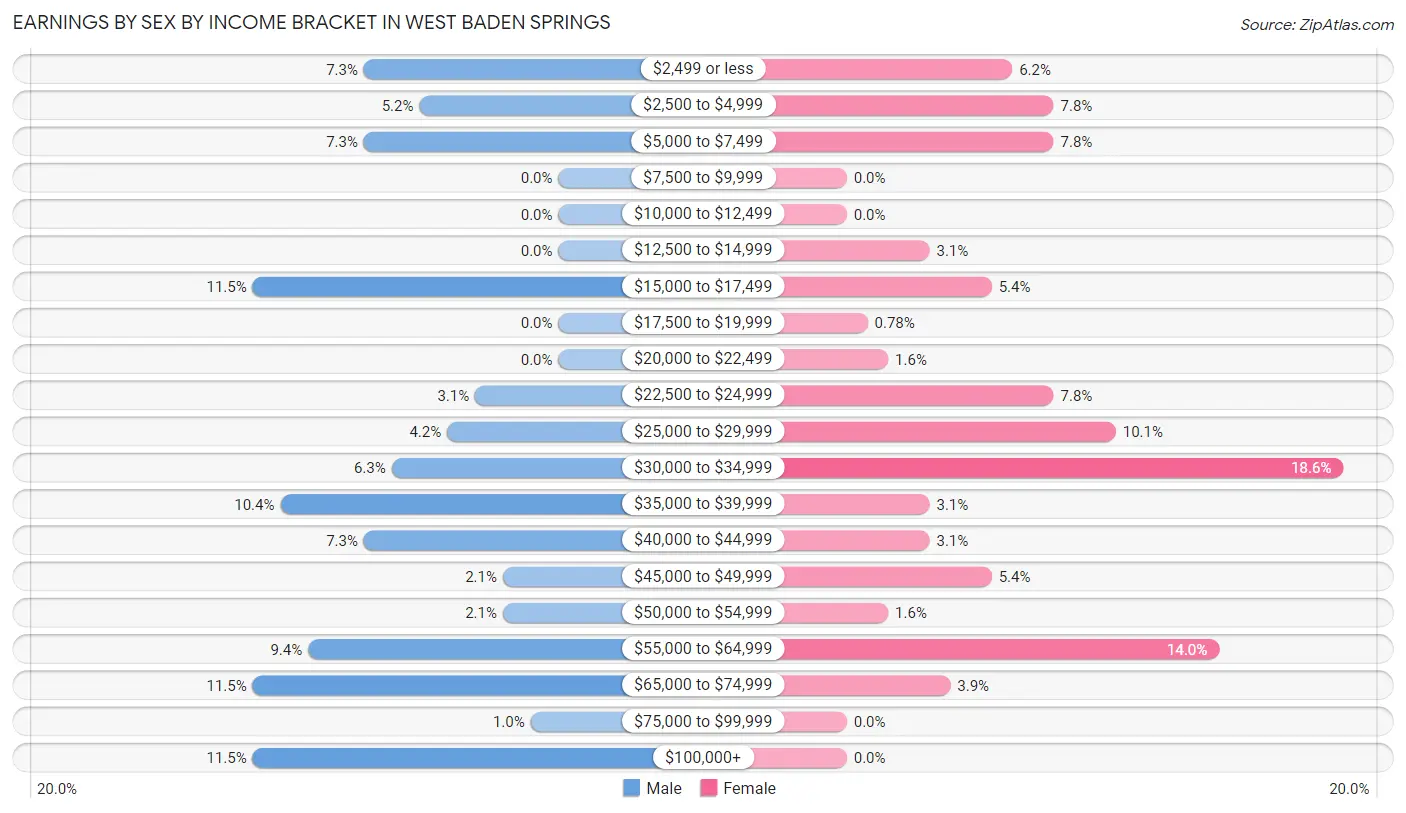
| Income | Male | Female |
| $2,499 or less | 7 (7.3%) | 8 (6.2%) |
| $2,500 to $4,999 | 5 (5.2%) | 10 (7.7%) |
| $5,000 to $7,499 | 7 (7.3%) | 10 (7.7%) |
| $7,500 to $9,999 | 0 (0.0%) | 0 (0.0%) |
| $10,000 to $12,499 | 0 (0.0%) | 0 (0.0%) |
| $12,500 to $14,999 | 0 (0.0%) | 4 (3.1%) |
| $15,000 to $17,499 | 11 (11.5%) | 7 (5.4%) |
| $17,500 to $19,999 | 0 (0.0%) | 1 (0.8%) |
| $20,000 to $22,499 | 0 (0.0%) | 2 (1.5%) |
| $22,500 to $24,999 | 3 (3.1%) | 10 (7.7%) |
| $25,000 to $29,999 | 4 (4.2%) | 13 (10.1%) |
| $30,000 to $34,999 | 6 (6.2%) | 24 (18.6%) |
| $35,000 to $39,999 | 10 (10.4%) | 4 (3.1%) |
| $40,000 to $44,999 | 7 (7.3%) | 4 (3.1%) |
| $45,000 to $49,999 | 2 (2.1%) | 7 (5.4%) |
| $50,000 to $54,999 | 2 (2.1%) | 2 (1.5%) |
| $55,000 to $64,999 | 9 (9.4%) | 18 (14.0%) |
| $65,000 to $74,999 | 11 (11.5%) | 5 (3.9%) |
| $75,000 to $99,999 | 1 (1.0%) | 0 (0.0%) |
| $100,000+ | 11 (11.5%) | 0 (0.0%) |
| Total | 96 (100.0%) | 129 (100.0%) |
Earnings by Sex by Educational Attainment in West Baden Springs
Average earnings in West Baden Springs are $38,375 for men and $31,042 for women, a difference of 19.1%. Men with an educational attainment of college or associate's degree enjoy the highest average annual earnings of $56,667, while those with less than high school education earn the least with $15,795. Women with an educational attainment of bachelor's degree earn the most with the average annual earnings of $58,125, while those with high school diploma education have the smallest earnings of $26,250.
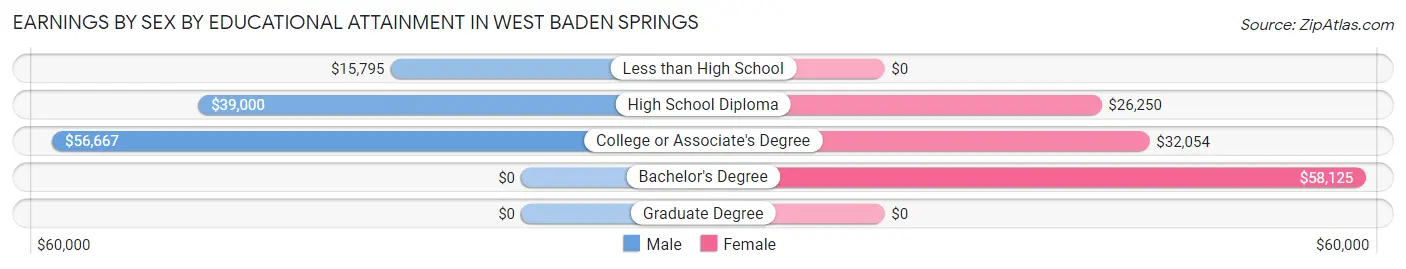
| Educational Attainment | Male Income | Female Income |
| Less than High School | $15,795 | $0 |
| High School Diploma | $39,000 | $26,250 |
| College or Associate's Degree | $56,667 | $32,054 |
| Bachelor's Degree | - | - |
| Graduate Degree | - | - |
| Total | $38,375 | $31,042 |
Family Income in West Baden Springs
Family Income Brackets in West Baden Springs
According to the West Baden Springs family income data, there are 27 families falling into the $75,000 to $99,999 income range, which is the most common income bracket and makes up 22.3% of all families. Conversely, the less than $10,000 income bracket is the least frequent group with only 2 families (1.7%) belonging to this category.
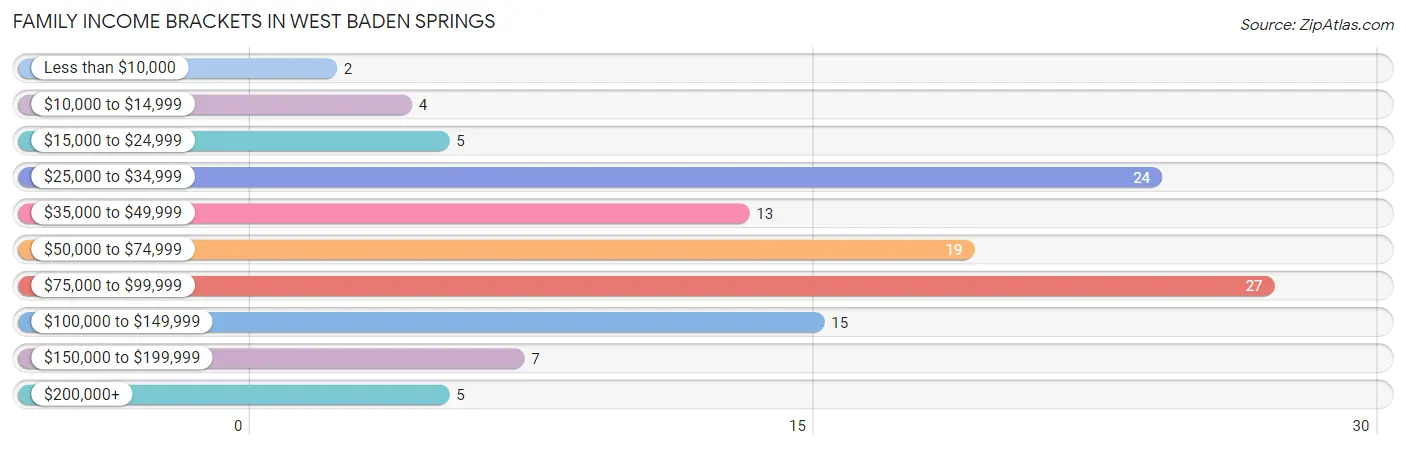
| Income Bracket | # Families | % Families |
| Less than $10,000 | 2 | 1.7% |
| $10,000 to $14,999 | 4 | 3.3% |
| $15,000 to $24,999 | 5 | 4.1% |
| $25,000 to $34,999 | 24 | 19.8% |
| $35,000 to $49,999 | 13 | 10.7% |
| $50,000 to $74,999 | 19 | 15.7% |
| $75,000 to $99,999 | 27 | 22.3% |
| $100,000 to $149,999 | 15 | 12.4% |
| $150,000 to $199,999 | 7 | 5.8% |
| $200,000+ | 5 | 4.1% |
Family Income by Famaliy Size in West Baden Springs
2-person families (68 | 56.2%) account for the highest median family income in West Baden Springs with $56,875 per family, while 2-person families (68 | 56.2%) have the highest median income of $28,438 per family member.
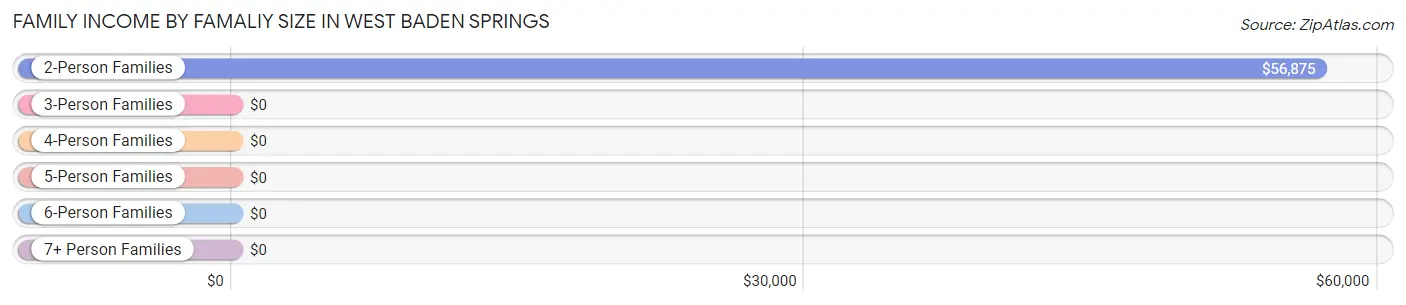
| Income Bracket | # Families | Median Income |
| 2-Person Families | 68 (56.2%) | $56,875 |
| 3-Person Families | 32 (26.5%) | $0 |
| 4-Person Families | 19 (15.7%) | $0 |
| 5-Person Families | 0 (0.0%) | $0 |
| 6-Person Families | 2 (1.7%) | $0 |
| 7+ Person Families | 0 (0.0%) | $0 |
| Total | 121 (100.0%) | $56,719 |
Family Income by Number of Earners in West Baden Springs
The median family income in West Baden Springs is $56,719, with families comprising 3+ earners (4) having the highest median family income of $118,750, while families with 1 earner (54) have the lowest median family income of $35,000, accounting for 3.3% and 44.6% of families, respectively.
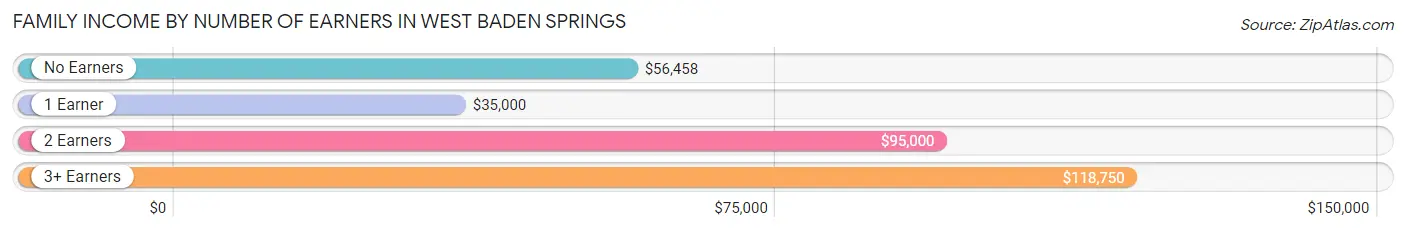
| Number of Earners | # Families | Median Income |
| No Earners | 15 (12.4%) | $56,458 |
| 1 Earner | 54 (44.6%) | $35,000 |
| 2 Earners | 48 (39.7%) | $95,000 |
| 3+ Earners | 4 (3.3%) | $118,750 |
| Total | 121 (100.0%) | $56,719 |
Household Income in West Baden Springs
Household Income Brackets in West Baden Springs
With 46 households falling in the category, the $15,000 to $24,999 income range is the most frequent in West Baden Springs, accounting for 21.2% of all households. In contrast, only 5 households (2.3%) fall into the $200,000+ income bracket, making it the least populous group.
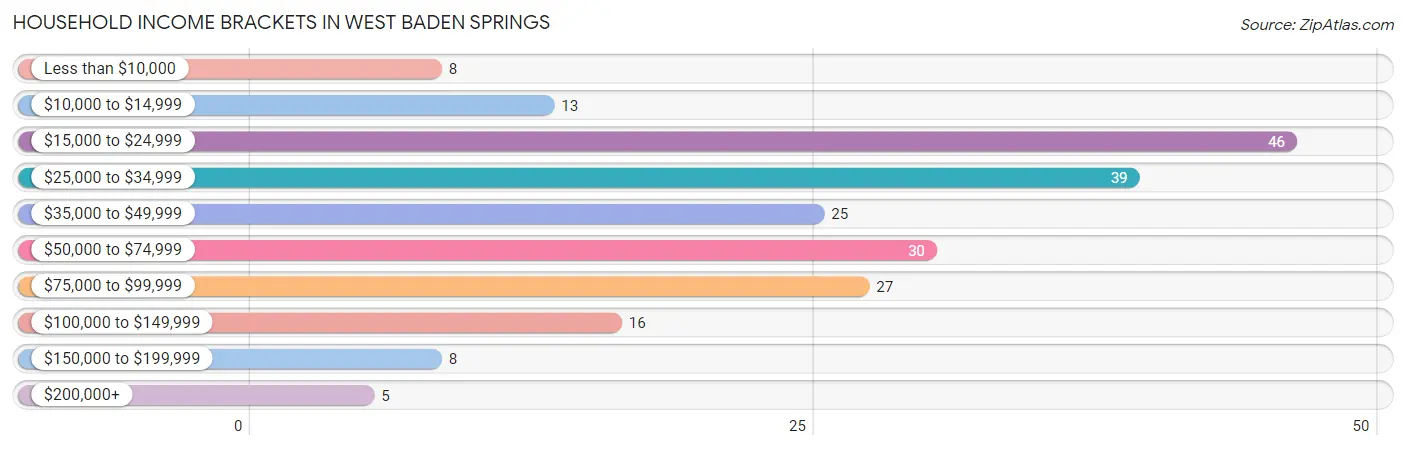
| Income Bracket | # Households | % Households |
| Less than $10,000 | 8 | 3.7% |
| $10,000 to $14,999 | 13 | 6.0% |
| $15,000 to $24,999 | 46 | 21.2% |
| $25,000 to $34,999 | 39 | 18.0% |
| $35,000 to $49,999 | 25 | 11.5% |
| $50,000 to $74,999 | 30 | 13.8% |
| $75,000 to $99,999 | 27 | 12.4% |
| $100,000 to $149,999 | 16 | 7.4% |
| $150,000 to $199,999 | 8 | 3.7% |
| $200,000+ | 5 | 2.3% |
Household Income by Householder Age in West Baden Springs
The median household income in West Baden Springs is $38,542, with the highest median household income of $38,542 found in the 65+ years age bracket for the primary householder. A total of 97 households (44.7%) fall into this category. Meanwhile, the 25 to 44 years age bracket for the primary householder has the lowest median household income of $0, with 66 households (30.4%) in this group.
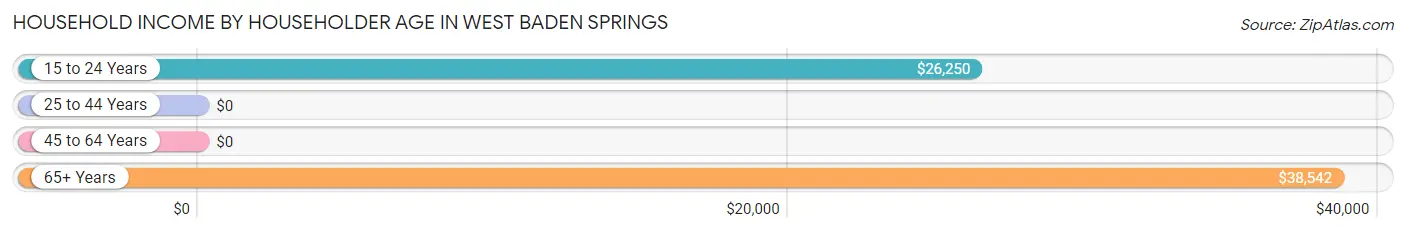
| Income Bracket | # Households | Median Income |
| 15 to 24 Years | 8 (3.7%) | $26,250 |
| 25 to 44 Years | 66 (30.4%) | $0 |
| 45 to 64 Years | 46 (21.2%) | $0 |
| 65+ Years | 97 (44.7%) | $38,542 |
| Total | 217 (100.0%) | $38,542 |
Poverty in West Baden Springs
Income Below Poverty by Sex and Age in West Baden Springs
With 13.3% poverty level for males and 14.0% for females among the residents of West Baden Springs, under 5 year old males and 35 to 44 year old females are the most vulnerable to poverty, with 5 males (55.6%) and 8 females (40.0%) in their respective age groups living below the poverty level.
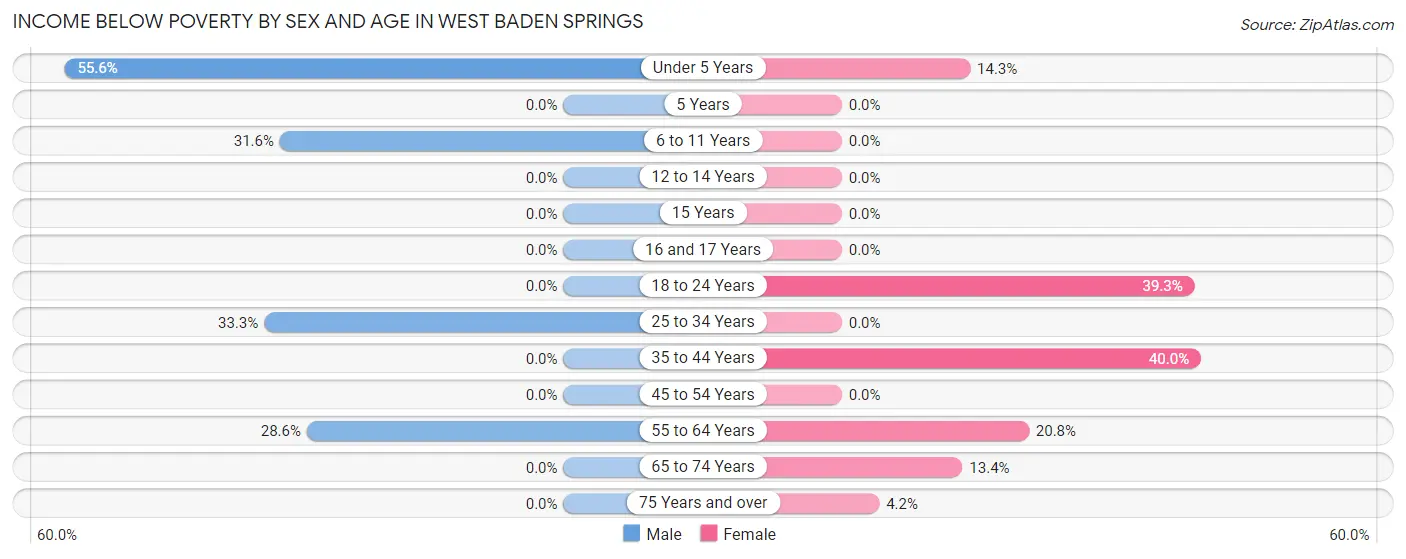
| Age Bracket | Male | Female |
| Under 5 Years | 5 (55.6%) | 2 (14.3%) |
| 5 Years | 0 (0.0%) | 0 (0.0%) |
| 6 to 11 Years | 6 (31.6%) | 0 (0.0%) |
| 12 to 14 Years | 0 (0.0%) | 0 (0.0%) |
| 15 Years | 0 (0.0%) | 0 (0.0%) |
| 16 and 17 Years | 0 (0.0%) | 0 (0.0%) |
| 18 to 24 Years | 0 (0.0%) | 11 (39.3%) |
| 25 to 34 Years | 10 (33.3%) | 0 (0.0%) |
| 35 to 44 Years | 0 (0.0%) | 8 (40.0%) |
| 45 to 54 Years | 0 (0.0%) | 0 (0.0%) |
| 55 to 64 Years | 4 (28.6%) | 5 (20.8%) |
| 65 to 74 Years | 0 (0.0%) | 9 (13.4%) |
| 75 Years and over | 0 (0.0%) | 1 (4.2%) |
| Total | 25 (13.3%) | 36 (14.0%) |
Income Above Poverty by Sex and Age in West Baden Springs
According to the poverty statistics in West Baden Springs, males aged 12 to 14 years and females aged 6 to 11 years are the age groups that are most secure financially, with 100.0% of males and 100.0% of females in these age groups living above the poverty line.
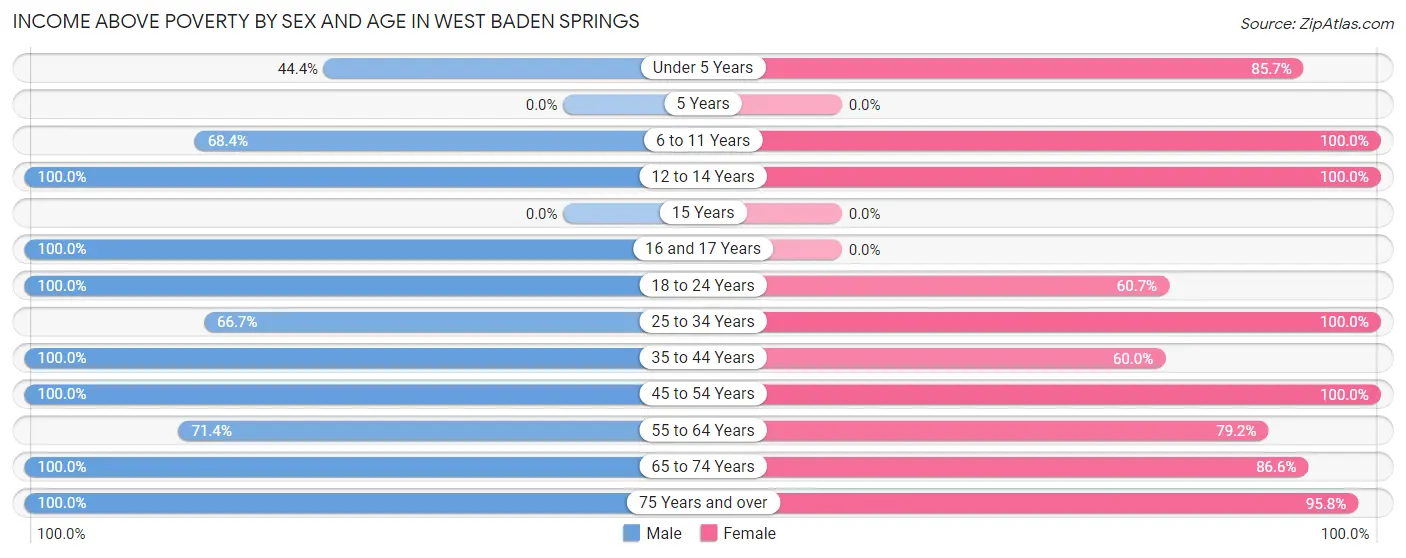
| Age Bracket | Male | Female |
| Under 5 Years | 4 (44.4%) | 12 (85.7%) |
| 5 Years | 0 (0.0%) | 0 (0.0%) |
| 6 to 11 Years | 13 (68.4%) | 12 (100.0%) |
| 12 to 14 Years | 11 (100.0%) | 6 (100.0%) |
| 15 Years | 0 (0.0%) | 0 (0.0%) |
| 16 and 17 Years | 3 (100.0%) | 0 (0.0%) |
| 18 to 24 Years | 18 (100.0%) | 17 (60.7%) |
| 25 to 34 Years | 20 (66.7%) | 47 (100.0%) |
| 35 to 44 Years | 26 (100.0%) | 12 (60.0%) |
| 45 to 54 Years | 12 (100.0%) | 16 (100.0%) |
| 55 to 64 Years | 10 (71.4%) | 19 (79.2%) |
| 65 to 74 Years | 28 (100.0%) | 58 (86.6%) |
| 75 Years and over | 18 (100.0%) | 23 (95.8%) |
| Total | 163 (86.7%) | 222 (86.1%) |
Income Below Poverty Among Married-Couple Families in West Baden Springs
The poverty statistics for married-couple families in West Baden Springs show that 2.7% or 2 of the total 74 families live below the poverty line. Families with 1 or 2 children have the highest poverty rate of 10.5%, comprising of 2 families. On the other hand, families with no children have the lowest poverty rate of 0.0%, which includes 0 families.
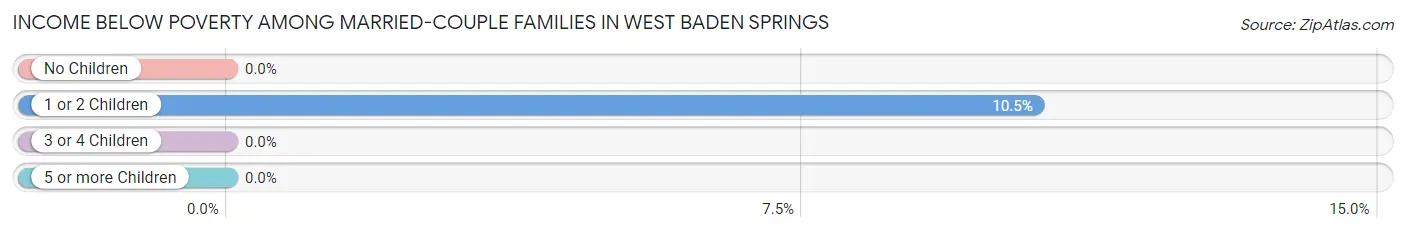
| Children | Above Poverty | Below Poverty |
| No Children | 53 (100.0%) | 0 (0.0%) |
| 1 or 2 Children | 17 (89.5%) | 2 (10.5%) |
| 3 or 4 Children | 2 (100.0%) | 0 (0.0%) |
| 5 or more Children | 0 (0.0%) | 0 (0.0%) |
| Total | 72 (97.3%) | 2 (2.7%) |
Income Below Poverty Among Single-Parent Households in West Baden Springs
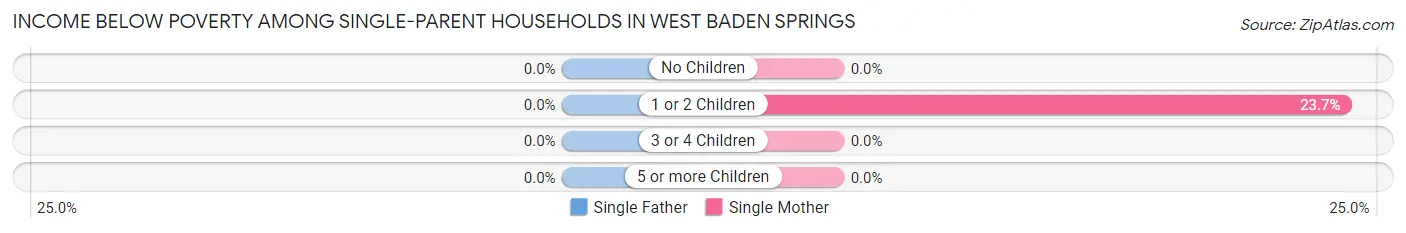
| Children | Single Father | Single Mother |
| No Children | 0 (0.0%) | 0 (0.0%) |
| 1 or 2 Children | 0 (0.0%) | 9 (23.7%) |
| 3 or 4 Children | 0 (0.0%) | 0 (0.0%) |
| 5 or more Children | 0 (0.0%) | 0 (0.0%) |
| Total | 0 (0.0%) | 9 (20.4%) |
Income Below Poverty Among Married-Couple vs Single-Parent Households in West Baden Springs
The poverty data for West Baden Springs shows that 2 of the married-couple family households (2.7%) and 9 of the single-parent households (19.2%) are living below the poverty level. Within the married-couple family households, those with 1 or 2 children have the highest poverty rate, with 2 households (10.5%) falling below the poverty line. Among the single-parent households, those with 1 or 2 children have the highest poverty rate, with 9 household (23.7%) living below poverty.
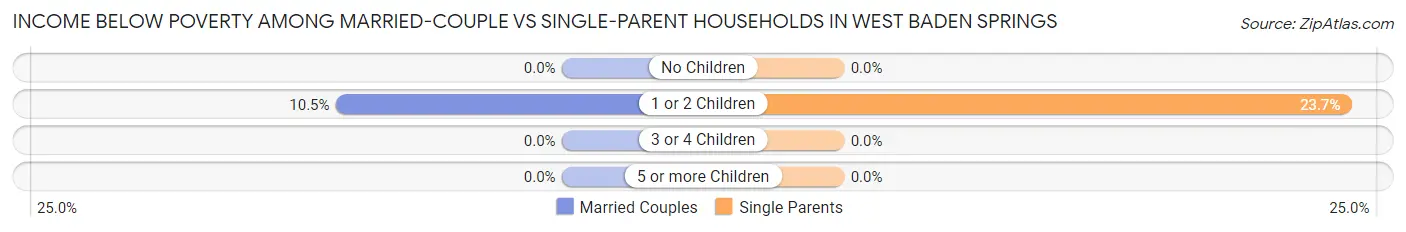
| Children | Married-Couple Families | Single-Parent Households |
| No Children | 0 (0.0%) | 0 (0.0%) |
| 1 or 2 Children | 2 (10.5%) | 9 (23.7%) |
| 3 or 4 Children | 0 (0.0%) | 0 (0.0%) |
| 5 or more Children | 0 (0.0%) | 0 (0.0%) |
| Total | 2 (2.7%) | 9 (19.2%) |
Employment Characteristics in West Baden Springs
Employment by Class of Employer in West Baden Springs
Among the 205 employed individuals in West Baden Springs, private company employees (135 | 65.8%), not-for-profit organizations (26 | 12.7%), and self-employed (not incorporated) (19 | 9.3%) make up the most common classes of employment.
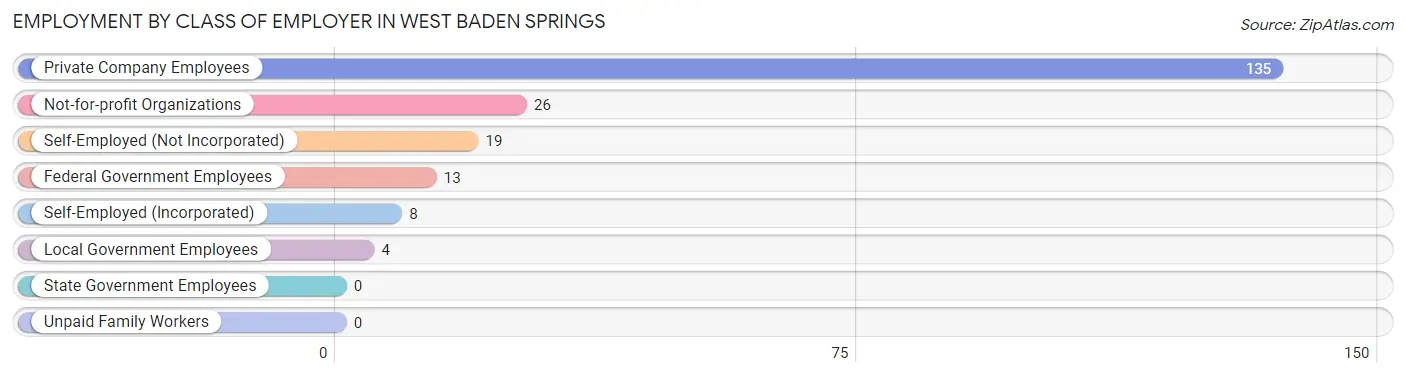
| Employer Class | # Employees | % Employees |
| Private Company Employees | 135 | 65.8% |
| Self-Employed (Incorporated) | 8 | 3.9% |
| Self-Employed (Not Incorporated) | 19 | 9.3% |
| Not-for-profit Organizations | 26 | 12.7% |
| Local Government Employees | 4 | 1.9% |
| State Government Employees | 0 | 0.0% |
| Federal Government Employees | 13 | 6.3% |
| Unpaid Family Workers | 0 | 0.0% |
| Total | 205 | 100.0% |
Employment Status by Age in West Baden Springs
According to the labor force statistics for West Baden Springs, out of the total population over 16 years of age (375), 59.2% or 222 individuals are in the labor force, with 7.7% or 17 of them unemployed. The age group with the highest labor force participation rate is 25 to 29 years, with 100.0% or 52 individuals in the labor force. Within the labor force, the 20 to 24 years age range has the highest percentage of unemployed individuals, with 19.2% or 5 of them being unemployed.
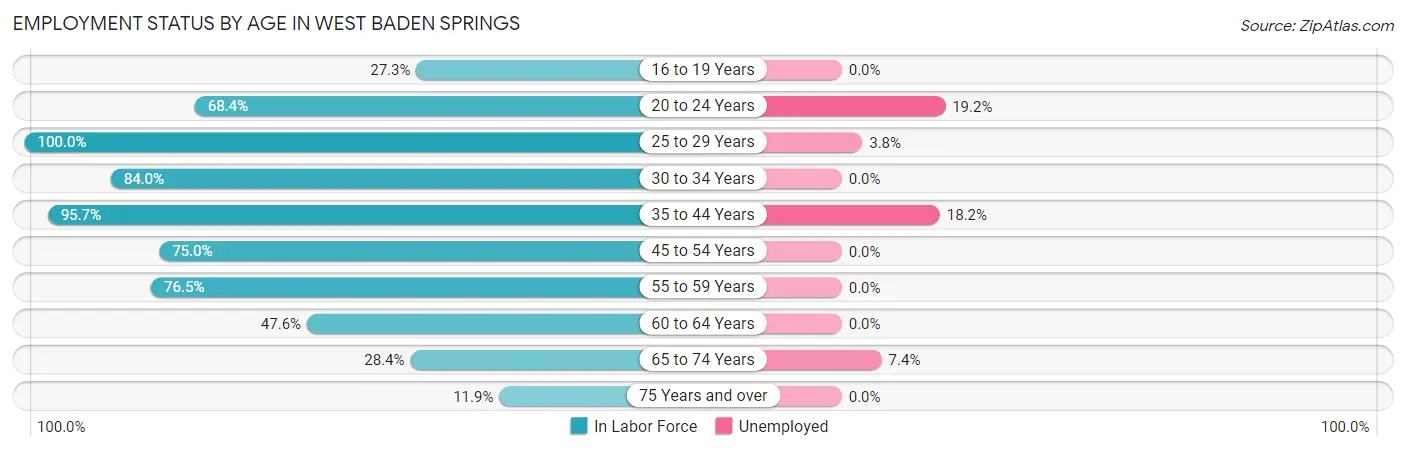
| Age Bracket | In Labor Force | Unemployed |
| 16 to 19 Years | 3 (27.3%) | 0 (0.0%) |
| 20 to 24 Years | 26 (68.4%) | 5 (19.2%) |
| 25 to 29 Years | 52 (100.0%) | 2 (3.8%) |
| 30 to 34 Years | 21 (84.0%) | 0 (0.0%) |
| 35 to 44 Years | 44 (95.7%) | 8 (18.2%) |
| 45 to 54 Years | 21 (75.0%) | 0 (0.0%) |
| 55 to 59 Years | 13 (76.5%) | 0 (0.0%) |
| 60 to 64 Years | 10 (47.6%) | 0 (0.0%) |
| 65 to 74 Years | 27 (28.4%) | 2 (7.4%) |
| 75 Years and over | 5 (11.9%) | 0 (0.0%) |
| Total | 222 (59.2%) | 17 (7.7%) |
Employment Status by Educational Attainment in West Baden Springs
According to labor force statistics for West Baden Springs, 85.2% of individuals (161) out of the total population between 25 and 64 years of age (189) are in the labor force, with 6.2% or 10 of them being unemployed. The group with the highest labor force participation rate are those with the educational attainment of bachelor's degree or higher, with 100.0% or 15 individuals in the labor force. Within the labor force, individuals with college / associate degree education have the highest percentage of unemployment, with 10.7% or 8 of them being unemployed.
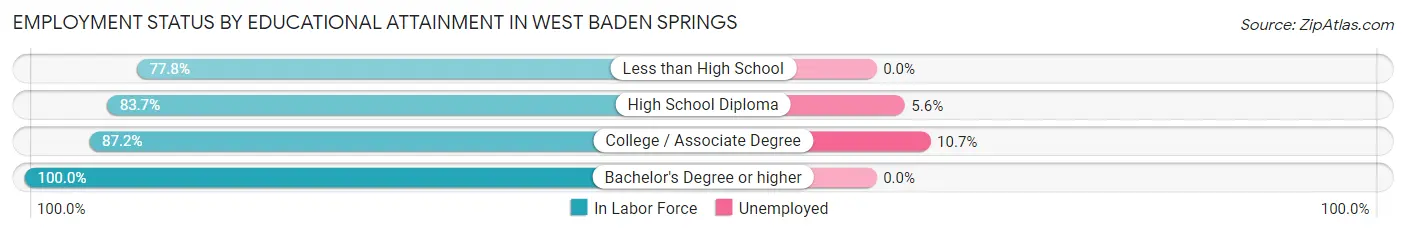
| Educational Attainment | In Labor Force | Unemployed |
| Less than High School | 35 (77.8%) | 0 (0.0%) |
| High School Diploma | 36 (83.7%) | 2 (5.6%) |
| College / Associate Degree | 75 (87.2%) | 9 (10.7%) |
| Bachelor's Degree or higher | 15 (100.0%) | 0 (0.0%) |
| Total | 161 (85.2%) | 12 (6.2%) |
Employment Occupations by Sex in West Baden Springs
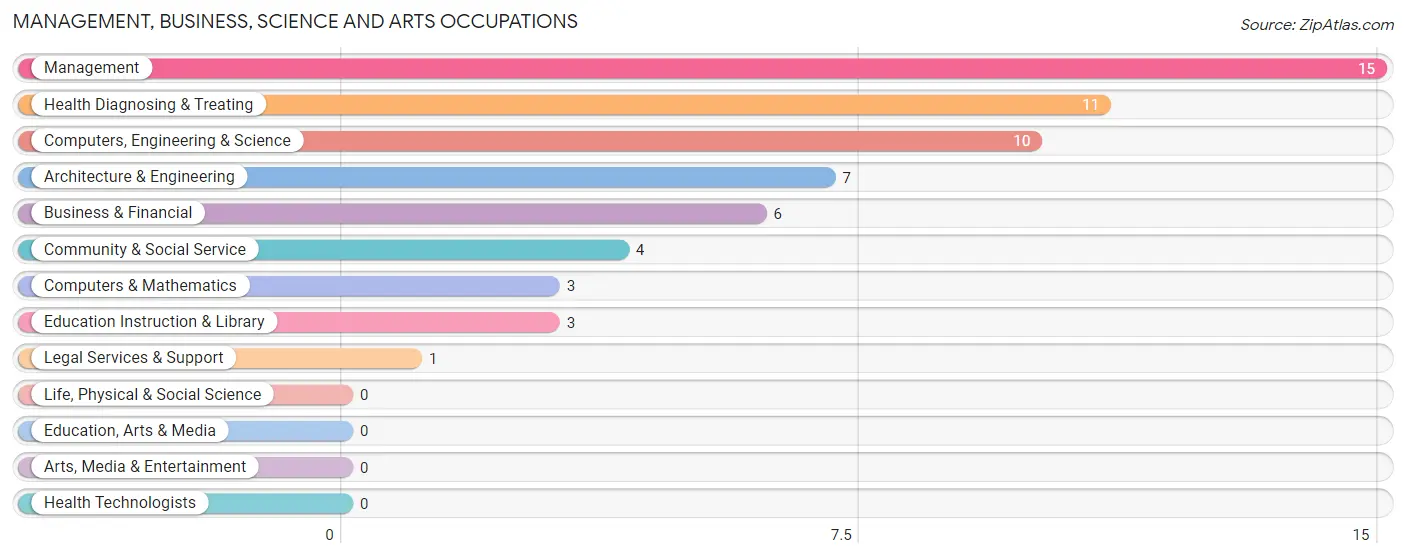
Management, Business, Science and Arts Occupations
The most common Management, Business, Science and Arts occupations in West Baden Springs are Management (15 | 7.3%), Health Diagnosing & Treating (11 | 5.4%), Computers, Engineering & Science (10 | 4.9%), Architecture & Engineering (7 | 3.4%), and Business & Financial (6 | 2.9%).
Management, Business, Science and Arts Occupations by Sex
Within the Management, Business, Science and Arts occupations in West Baden Springs, the most male-oriented occupations are Business & Financial (100.0%), Computers, Engineering & Science (100.0%), and Computers & Mathematics (100.0%), while the most female-oriented occupations are Community & Social Service (100.0%), Legal Services & Support (100.0%), and Education Instruction & Library (100.0%).
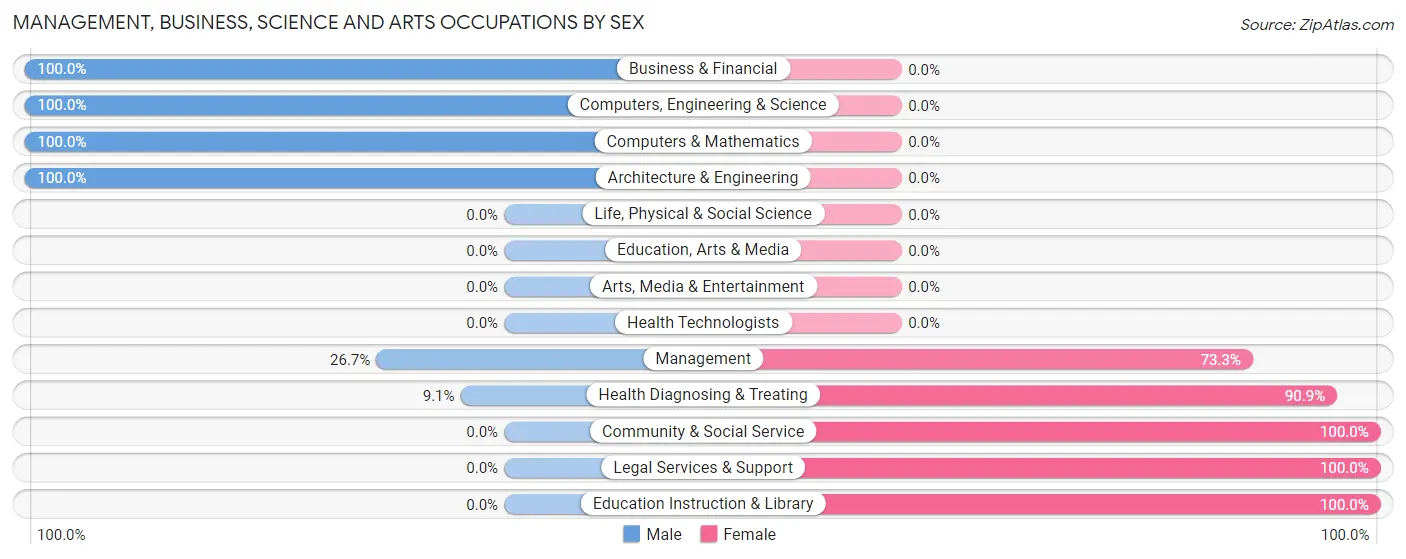
| Occupation | Male | Female |
| Management | 4 (26.7%) | 11 (73.3%) |
| Business & Financial | 6 (100.0%) | 0 (0.0%) |
| Computers, Engineering & Science | 10 (100.0%) | 0 (0.0%) |
| Computers & Mathematics | 3 (100.0%) | 0 (0.0%) |
| Architecture & Engineering | 7 (100.0%) | 0 (0.0%) |
| Life, Physical & Social Science | 0 (0.0%) | 0 (0.0%) |
| Community & Social Service | 0 (0.0%) | 4 (100.0%) |
| Education, Arts & Media | 0 (0.0%) | 0 (0.0%) |
| Legal Services & Support | 0 (0.0%) | 1 (100.0%) |
| Education Instruction & Library | 0 (0.0%) | 3 (100.0%) |
| Arts, Media & Entertainment | 0 (0.0%) | 0 (0.0%) |
| Health Diagnosing & Treating | 1 (9.1%) | 10 (90.9%) |
| Health Technologists | 0 (0.0%) | 0 (0.0%) |
| Total (Category) | 21 (45.7%) | 25 (54.3%) |
| Total (Overall) | 94 (45.9%) | 111 (54.1%) |
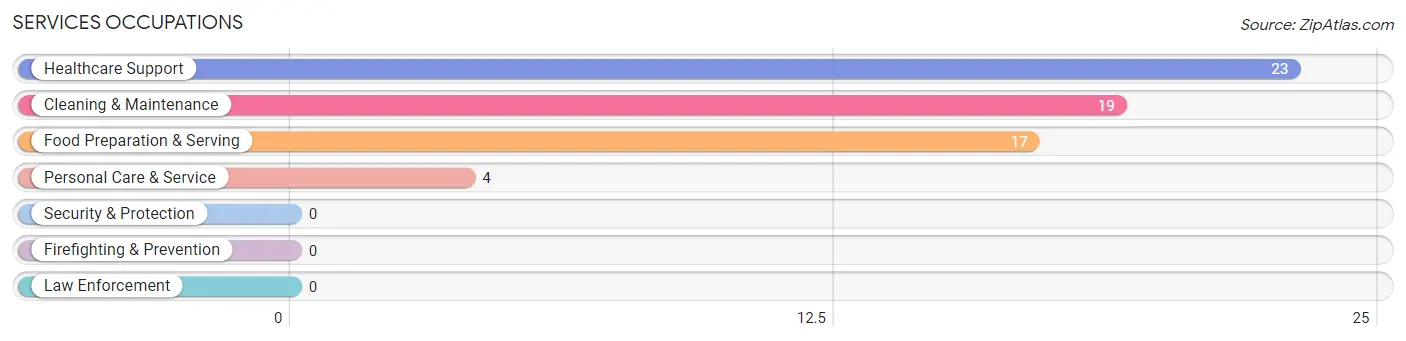
Services Occupations
The most common Services occupations in West Baden Springs are Healthcare Support (23 | 11.2%), Cleaning & Maintenance (19 | 9.3%), Food Preparation & Serving (17 | 8.3%), and Personal Care & Service (4 | 1.9%).
Services Occupations by Sex
Within the Services occupations in West Baden Springs, the most male-oriented occupations are Personal Care & Service (100.0%), Food Preparation & Serving (88.2%), and Cleaning & Maintenance (78.9%), while the most female-oriented occupations are Healthcare Support (100.0%), Cleaning & Maintenance (21.0%), and Food Preparation & Serving (11.8%).
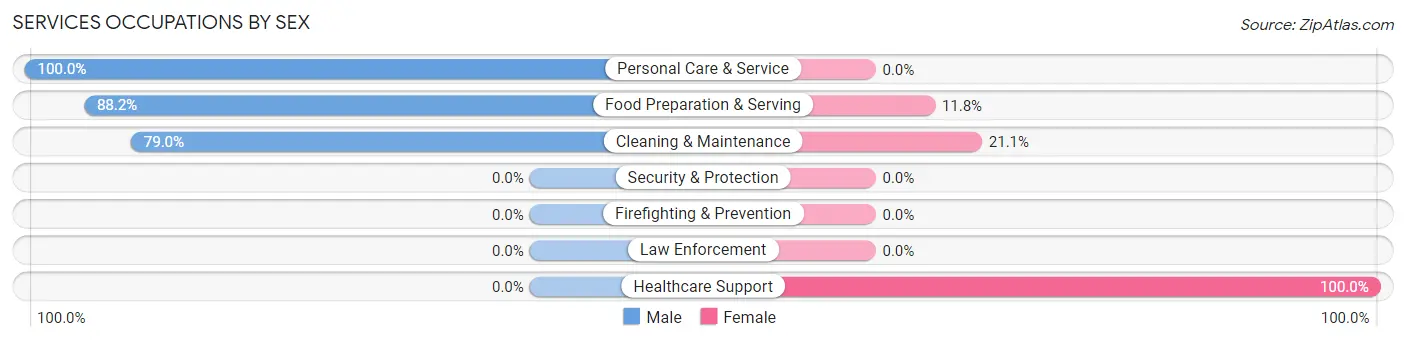
| Occupation | Male | Female |
| Healthcare Support | 0 (0.0%) | 23 (100.0%) |
| Security & Protection | 0 (0.0%) | 0 (0.0%) |
| Firefighting & Prevention | 0 (0.0%) | 0 (0.0%) |
| Law Enforcement | 0 (0.0%) | 0 (0.0%) |
| Food Preparation & Serving | 15 (88.2%) | 2 (11.8%) |
| Cleaning & Maintenance | 15 (78.9%) | 4 (21.0%) |
| Personal Care & Service | 4 (100.0%) | 0 (0.0%) |
| Total (Category) | 34 (54.0%) | 29 (46.0%) |
| Total (Overall) | 94 (45.9%) | 111 (54.1%) |
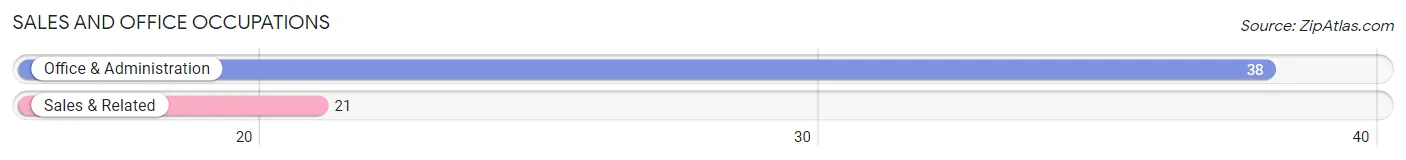
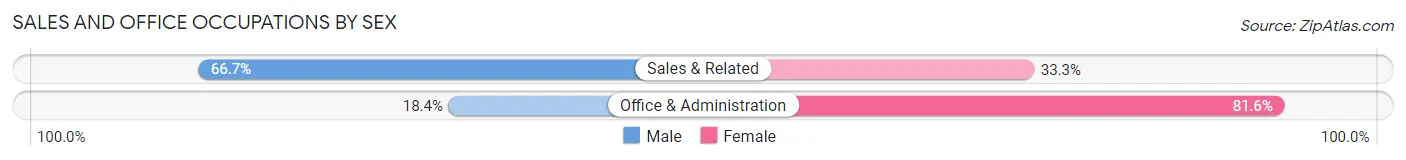
Sales and Office Occupations
The most common Sales and Office occupations in West Baden Springs are Office & Administration (38 | 18.5%), and Sales & Related (21 | 10.2%).
Sales and Office Occupations by Sex
| Occupation | Male | Female |
| Sales & Related | 14 (66.7%) | 7 (33.3%) |
| Office & Administration | 7 (18.4%) | 31 (81.6%) |
| Total (Category) | 21 (35.6%) | 38 (64.4%) |
| Total (Overall) | 94 (45.9%) | 111 (54.1%) |
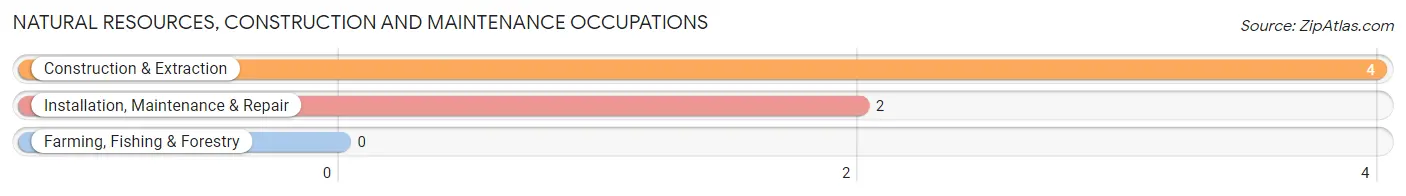
Natural Resources, Construction and Maintenance Occupations
The most common Natural Resources, Construction and Maintenance occupations in West Baden Springs are Construction & Extraction (4 | 1.9%), and Installation, Maintenance & Repair (2 | 1.0%).
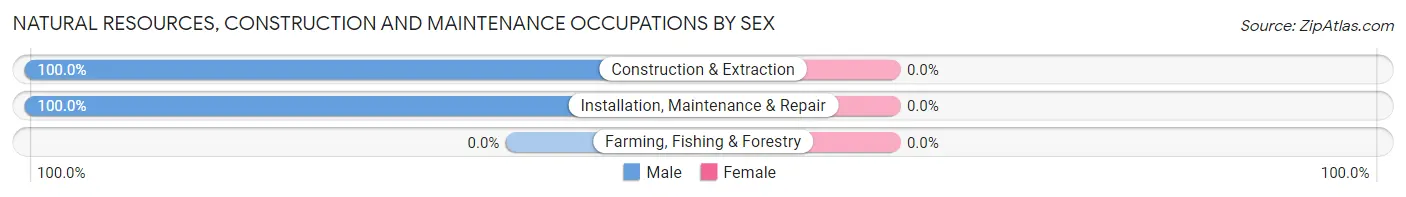
Natural Resources, Construction and Maintenance Occupations by Sex
| Occupation | Male | Female |
| Farming, Fishing & Forestry | 0 (0.0%) | 0 (0.0%) |
| Construction & Extraction | 4 (100.0%) | 0 (0.0%) |
| Installation, Maintenance & Repair | 2 (100.0%) | 0 (0.0%) |
| Total (Category) | 6 (100.0%) | 0 (0.0%) |
| Total (Overall) | 94 (45.9%) | 111 (54.1%) |
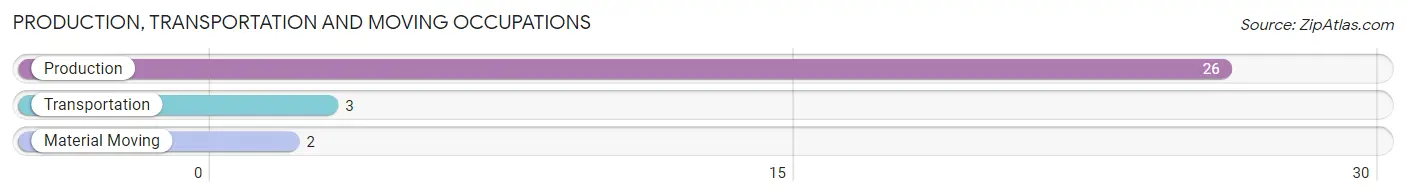
Production, Transportation and Moving Occupations
The most common Production, Transportation and Moving occupations in West Baden Springs are Production (26 | 12.7%), Transportation (3 | 1.5%), and Material Moving (2 | 1.0%).
Production, Transportation and Moving Occupations by Sex
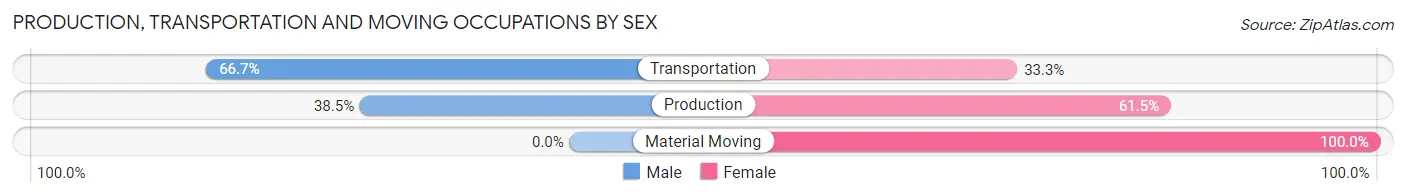
| Occupation | Male | Female |
| Production | 10 (38.5%) | 16 (61.5%) |
| Transportation | 2 (66.7%) | 1 (33.3%) |
| Material Moving | 0 (0.0%) | 2 (100.0%) |
| Total (Category) | 12 (38.7%) | 19 (61.3%) |
| Total (Overall) | 94 (45.9%) | 111 (54.1%) |
Employment Industries by Sex in West Baden Springs
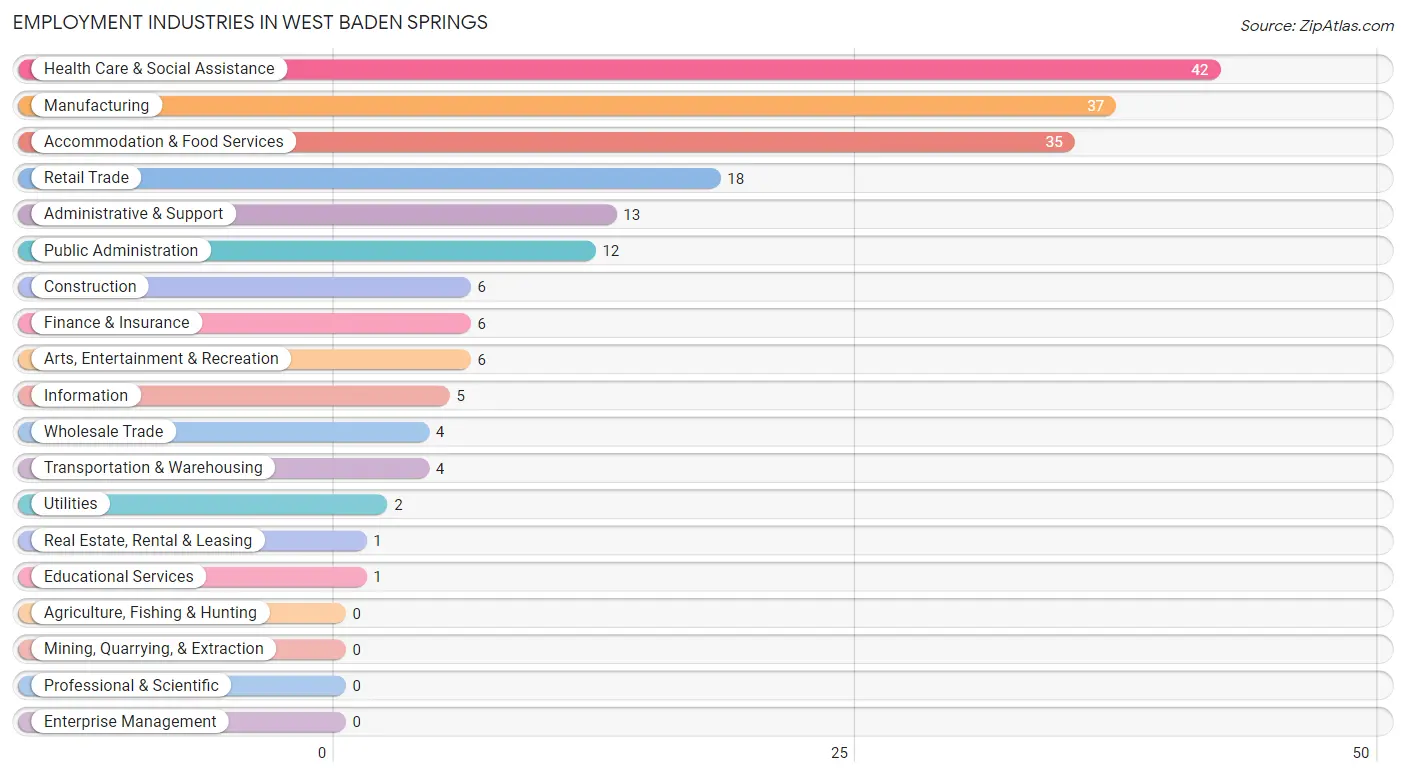
Employment Industries in West Baden Springs
The major employment industries in West Baden Springs include Health Care & Social Assistance (42 | 20.5%), Manufacturing (37 | 18.0%), Accommodation & Food Services (35 | 17.1%), Retail Trade (18 | 8.8%), and Administrative & Support (13 | 6.3%).
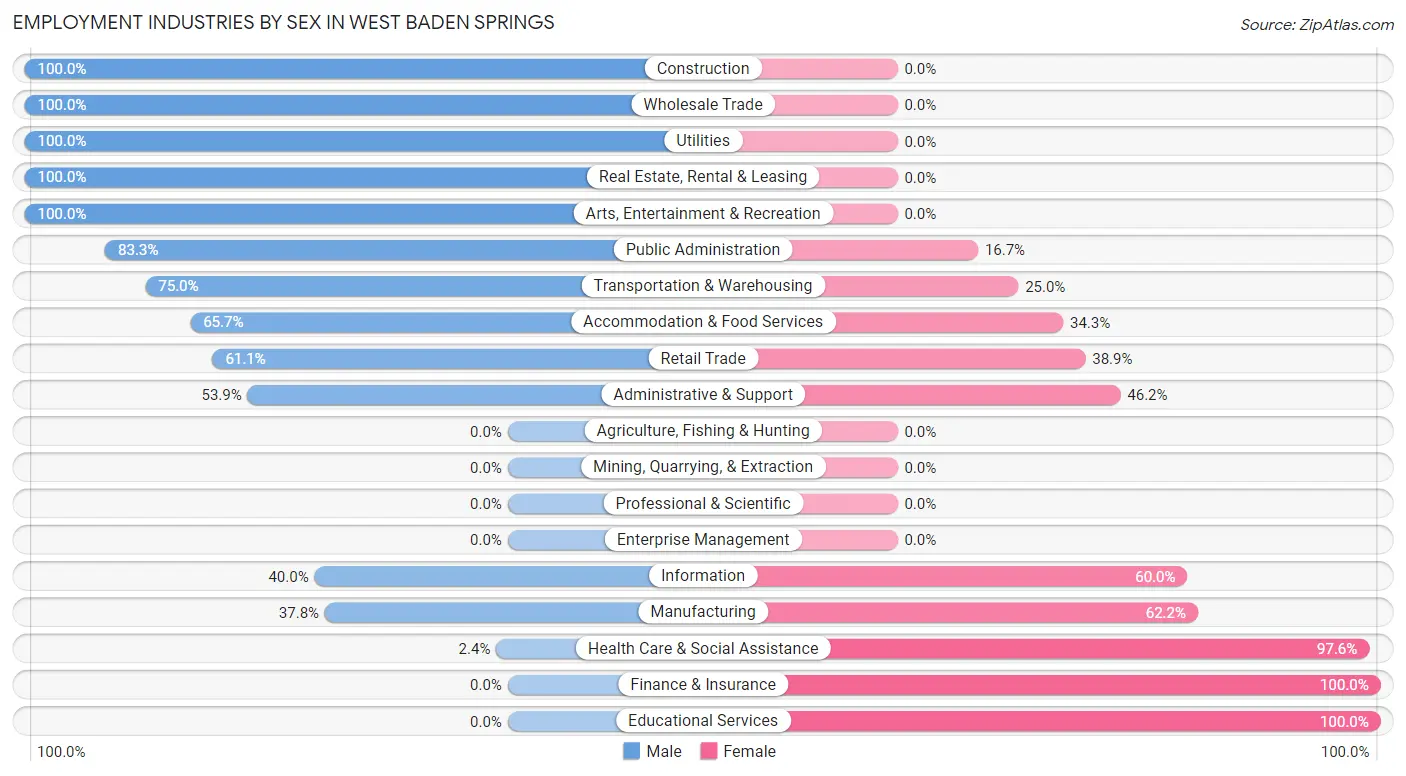
Employment Industries by Sex in West Baden Springs
The West Baden Springs industries that see more men than women are Construction (100.0%), Wholesale Trade (100.0%), and Utilities (100.0%), whereas the industries that tend to have a higher number of women are Finance & Insurance (100.0%), Educational Services (100.0%), and Health Care & Social Assistance (97.6%).
| Industry | Male | Female |
| Agriculture, Fishing & Hunting | 0 (0.0%) | 0 (0.0%) |
| Mining, Quarrying, & Extraction | 0 (0.0%) | 0 (0.0%) |
| Construction | 6 (100.0%) | 0 (0.0%) |
| Manufacturing | 14 (37.8%) | 23 (62.2%) |
| Wholesale Trade | 4 (100.0%) | 0 (0.0%) |
| Retail Trade | 11 (61.1%) | 7 (38.9%) |
| Transportation & Warehousing | 3 (75.0%) | 1 (25.0%) |
| Utilities | 2 (100.0%) | 0 (0.0%) |
| Information | 2 (40.0%) | 3 (60.0%) |
| Finance & Insurance | 0 (0.0%) | 6 (100.0%) |
| Real Estate, Rental & Leasing | 1 (100.0%) | 0 (0.0%) |
| Professional & Scientific | 0 (0.0%) | 0 (0.0%) |
| Enterprise Management | 0 (0.0%) | 0 (0.0%) |
| Administrative & Support | 7 (53.8%) | 6 (46.2%) |
| Educational Services | 0 (0.0%) | 1 (100.0%) |
| Health Care & Social Assistance | 1 (2.4%) | 41 (97.6%) |
| Arts, Entertainment & Recreation | 6 (100.0%) | 0 (0.0%) |
| Accommodation & Food Services | 23 (65.7%) | 12 (34.3%) |
| Public Administration | 10 (83.3%) | 2 (16.7%) |
| Total | 94 (45.9%) | 111 (54.1%) |
Education in West Baden Springs
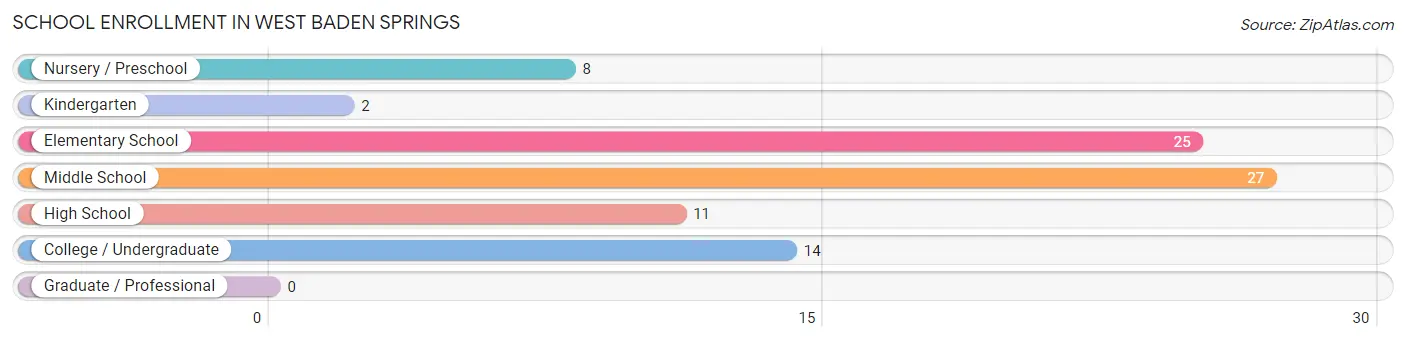
School Enrollment in West Baden Springs
The most common levels of schooling among the 87 students in West Baden Springs are middle school (27 | 31.0%), elementary school (25 | 28.7%), and college / undergraduate (14 | 16.1%).
| School Level | # Students | % Students |
| Nursery / Preschool | 8 | 9.2% |
| Kindergarten | 2 | 2.3% |
| Elementary School | 25 | 28.7% |
| Middle School | 27 | 31.0% |
| High School | 11 | 12.6% |
| College / Undergraduate | 14 | 16.1% |
| Graduate / Professional | 0 | 0.0% |
| Total | 87 | 100.0% |
School Enrollment by Age by Funding Source in West Baden Springs
Out of a total of 87 students who are enrolled in schools in West Baden Springs, 16 (18.4%) attend a private institution, while the remaining 71 (81.6%) are enrolled in public schools. The age group of 3 to 4 year olds has the highest likelihood of being enrolled in private schools, with 8 (100.0% in the age bracket) enrolled. Conversely, the age group of 5 to 9 year old has the lowest likelihood of being enrolled in a private school, with 27 (100.0% in the age bracket) attending a public institution.
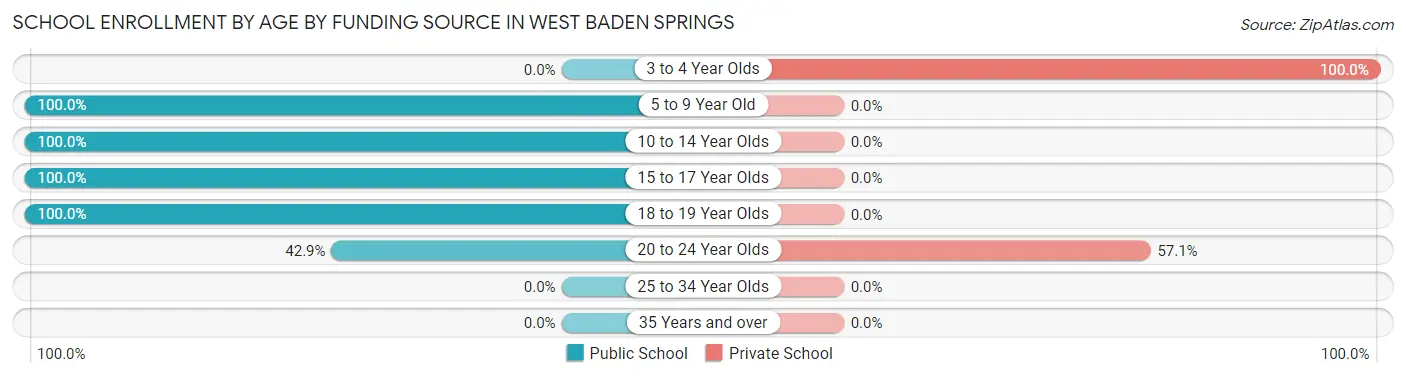
| Age Bracket | Public School | Private School |
| 3 to 4 Year Olds | 0 (0.0%) | 8 (100.0%) |
| 5 to 9 Year Old | 27 (100.0%) | 0 (0.0%) |
| 10 to 14 Year Olds | 27 (100.0%) | 0 (0.0%) |
| 15 to 17 Year Olds | 3 (100.0%) | 0 (0.0%) |
| 18 to 19 Year Olds | 8 (100.0%) | 0 (0.0%) |
| 20 to 24 Year Olds | 6 (42.9%) | 8 (57.1%) |
| 25 to 34 Year Olds | 0 (0.0%) | 0 (0.0%) |
| 35 Years and over | 0 (0.0%) | 0 (0.0%) |
| Total | 71 (81.6%) | 16 (18.4%) |
Educational Attainment by Field of Study in West Baden Springs
Education (10 | 35.7%), science & technology (8 | 28.6%), computers & mathematics (4 | 14.3%), business (2 | 7.1%), and communications (2 | 7.1%) are the most common fields of study among 28 individuals in West Baden Springs who have obtained a bachelor's degree or higher.
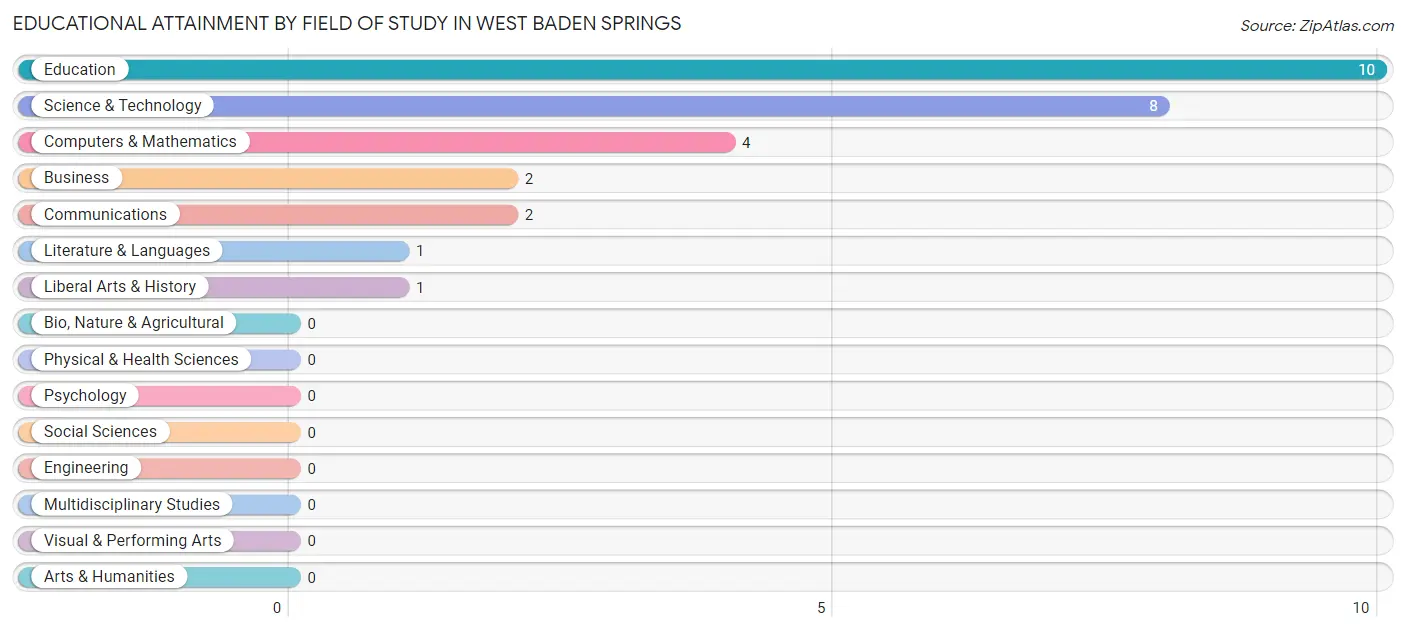
| Field of Study | # Graduates | % Graduates |
| Computers & Mathematics | 4 | 14.3% |
| Bio, Nature & Agricultural | 0 | 0.0% |
| Physical & Health Sciences | 0 | 0.0% |
| Psychology | 0 | 0.0% |
| Social Sciences | 0 | 0.0% |
| Engineering | 0 | 0.0% |
| Multidisciplinary Studies | 0 | 0.0% |
| Science & Technology | 8 | 28.6% |
| Business | 2 | 7.1% |
| Education | 10 | 35.7% |
| Literature & Languages | 1 | 3.6% |
| Liberal Arts & History | 1 | 3.6% |
| Visual & Performing Arts | 0 | 0.0% |
| Communications | 2 | 7.1% |
| Arts & Humanities | 0 | 0.0% |
| Total | 28 | 100.0% |
Transportation & Commute in West Baden Springs
Vehicle Availability by Sex in West Baden Springs
The most prevalent vehicle ownership categories in West Baden Springs are males with 2 vehicles (40, accounting for 42.5%) and females with 2 vehicles (63, making up 36.0%).
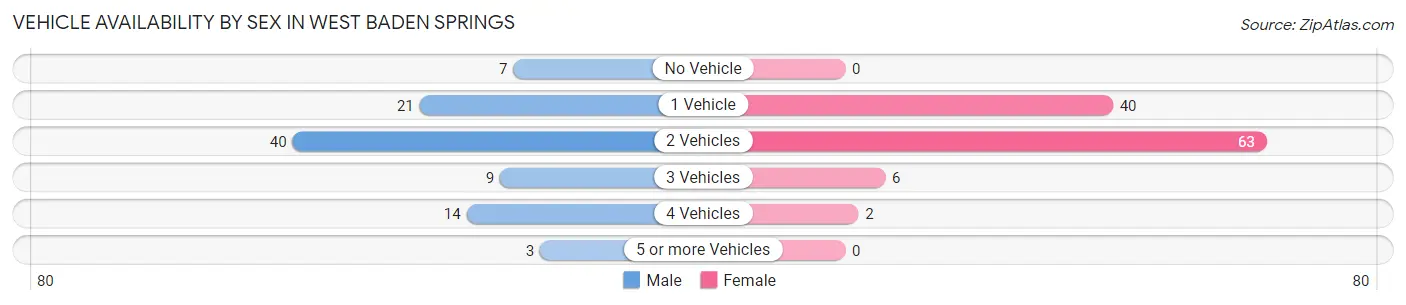
| Vehicles Available | Male | Female |
| No Vehicle | 7 (7.4%) | 0 (0.0%) |
| 1 Vehicle | 21 (22.3%) | 40 (36.0%) |
| 2 Vehicles | 40 (42.5%) | 63 (56.8%) |
| 3 Vehicles | 9 (9.6%) | 6 (5.4%) |
| 4 Vehicles | 14 (14.9%) | 2 (1.8%) |
| 5 or more Vehicles | 3 (3.2%) | 0 (0.0%) |
| Total | 94 (100.0%) | 111 (100.0%) |
Commute Time in West Baden Springs
The most frequently occuring commute durations in West Baden Springs are 5 to 9 minutes (50 commuters, 24.7%), 15 to 19 minutes (39 commuters, 19.3%), and 60 to 89 minutes (25 commuters, 12.4%).
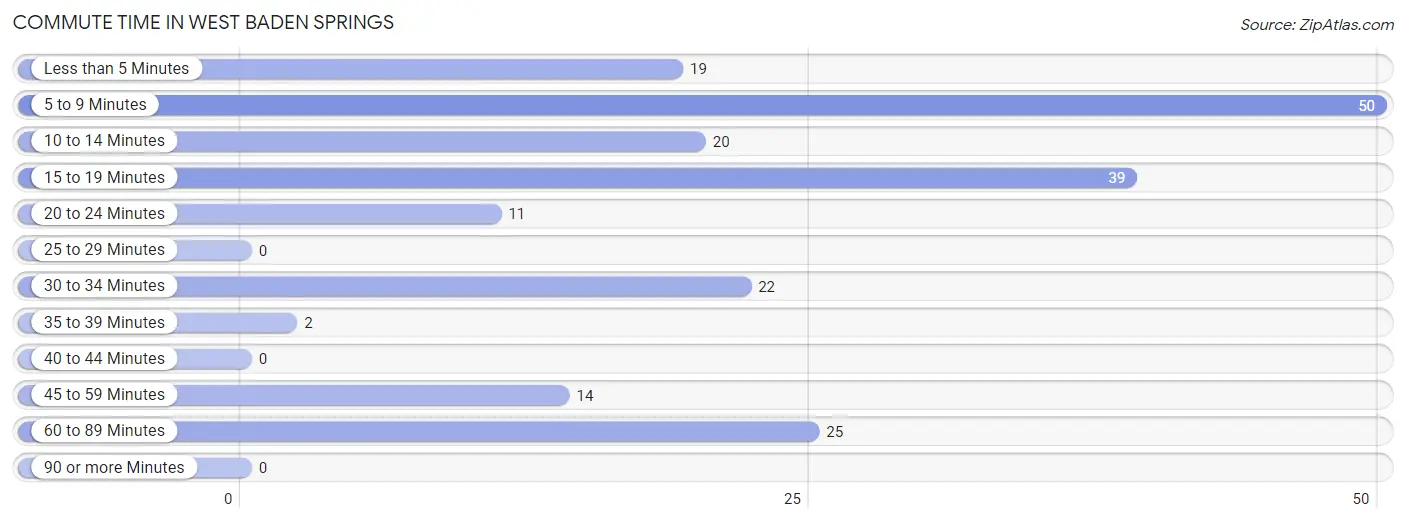
| Commute Time | # Commuters | % Commuters |
| Less than 5 Minutes | 19 | 9.4% |
| 5 to 9 Minutes | 50 | 24.7% |
| 10 to 14 Minutes | 20 | 9.9% |
| 15 to 19 Minutes | 39 | 19.3% |
| 20 to 24 Minutes | 11 | 5.4% |
| 25 to 29 Minutes | 0 | 0.0% |
| 30 to 34 Minutes | 22 | 10.9% |
| 35 to 39 Minutes | 2 | 1.0% |
| 40 to 44 Minutes | 0 | 0.0% |
| 45 to 59 Minutes | 14 | 6.9% |
| 60 to 89 Minutes | 25 | 12.4% |
| 90 or more Minutes | 0 | 0.0% |
Commute Time by Sex in West Baden Springs
The most common commute times in West Baden Springs are 5 to 9 minutes (24 commuters, 25.5%) for males and 15 to 19 minutes (37 commuters, 34.3%) for females.
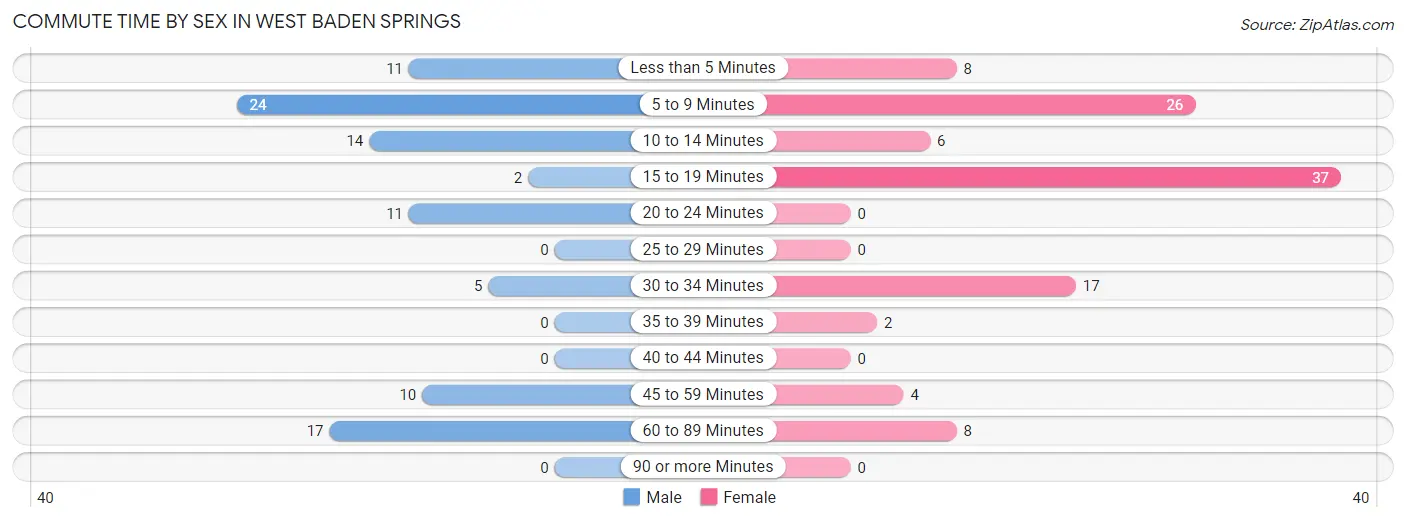
| Commute Time | Male | Female |
| Less than 5 Minutes | 11 (11.7%) | 8 (7.4%) |
| 5 to 9 Minutes | 24 (25.5%) | 26 (24.1%) |
| 10 to 14 Minutes | 14 (14.9%) | 6 (5.6%) |
| 15 to 19 Minutes | 2 (2.1%) | 37 (34.3%) |
| 20 to 24 Minutes | 11 (11.7%) | 0 (0.0%) |
| 25 to 29 Minutes | 0 (0.0%) | 0 (0.0%) |
| 30 to 34 Minutes | 5 (5.3%) | 17 (15.7%) |
| 35 to 39 Minutes | 0 (0.0%) | 2 (1.8%) |
| 40 to 44 Minutes | 0 (0.0%) | 0 (0.0%) |
| 45 to 59 Minutes | 10 (10.6%) | 4 (3.7%) |
| 60 to 89 Minutes | 17 (18.1%) | 8 (7.4%) |
| 90 or more Minutes | 0 (0.0%) | 0 (0.0%) |
Time of Departure to Work by Sex in West Baden Springs
The most frequent times of departure to work in West Baden Springs are 5:30 AM to 5:59 AM (22, 23.4%) for males and 7:30 AM to 7:59 AM (30, 27.8%) for females.
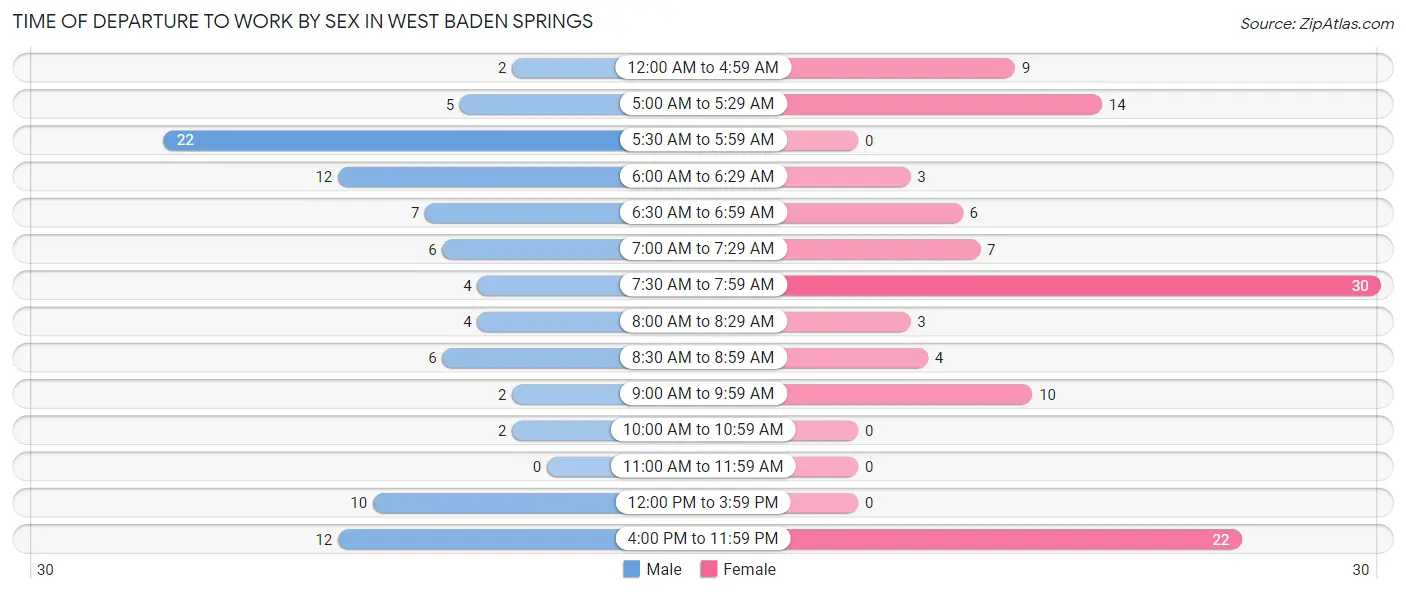
| Time of Departure | Male | Female |
| 12:00 AM to 4:59 AM | 2 (2.1%) | 9 (8.3%) |
| 5:00 AM to 5:29 AM | 5 (5.3%) | 14 (13.0%) |
| 5:30 AM to 5:59 AM | 22 (23.4%) | 0 (0.0%) |
| 6:00 AM to 6:29 AM | 12 (12.8%) | 3 (2.8%) |
| 6:30 AM to 6:59 AM | 7 (7.4%) | 6 (5.6%) |
| 7:00 AM to 7:29 AM | 6 (6.4%) | 7 (6.5%) |
| 7:30 AM to 7:59 AM | 4 (4.3%) | 30 (27.8%) |
| 8:00 AM to 8:29 AM | 4 (4.3%) | 3 (2.8%) |
| 8:30 AM to 8:59 AM | 6 (6.4%) | 4 (3.7%) |
| 9:00 AM to 9:59 AM | 2 (2.1%) | 10 (9.3%) |
| 10:00 AM to 10:59 AM | 2 (2.1%) | 0 (0.0%) |
| 11:00 AM to 11:59 AM | 0 (0.0%) | 0 (0.0%) |
| 12:00 PM to 3:59 PM | 10 (10.6%) | 0 (0.0%) |
| 4:00 PM to 11:59 PM | 12 (12.8%) | 22 (20.4%) |
| Total | 94 (100.0%) | 108 (100.0%) |
Housing Occupancy in West Baden Springs
Occupancy by Ownership in West Baden Springs
Of the total 217 dwellings in West Baden Springs, owner-occupied units account for 143 (65.9%), while renter-occupied units make up 74 (34.1%).
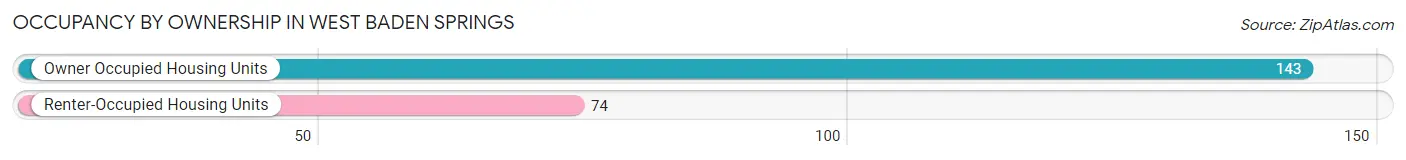
| Occupancy | # Housing Units | % Housing Units |
| Owner Occupied Housing Units | 143 | 65.9% |
| Renter-Occupied Housing Units | 74 | 34.1% |
| Total Occupied Housing Units | 217 | 100.0% |
Occupancy by Household Size in West Baden Springs
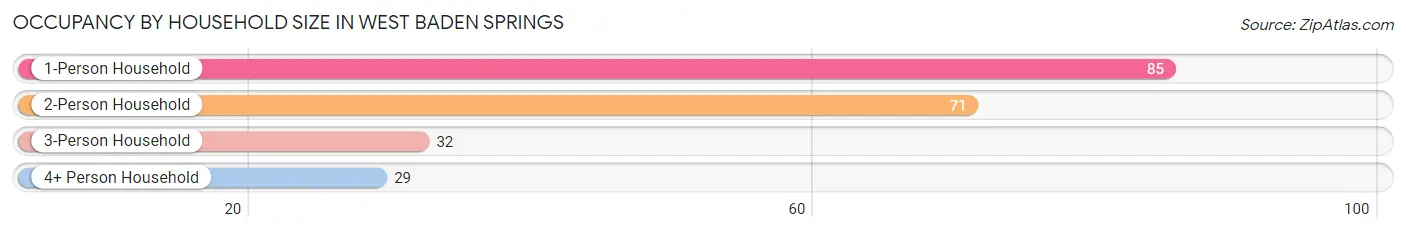
| Household Size | # Housing Units | % Housing Units |
| 1-Person Household | 85 | 39.2% |
| 2-Person Household | 71 | 32.7% |
| 3-Person Household | 32 | 14.7% |
| 4+ Person Household | 29 | 13.4% |
| Total Housing Units | 217 | 100.0% |
Occupancy by Ownership by Household Size in West Baden Springs
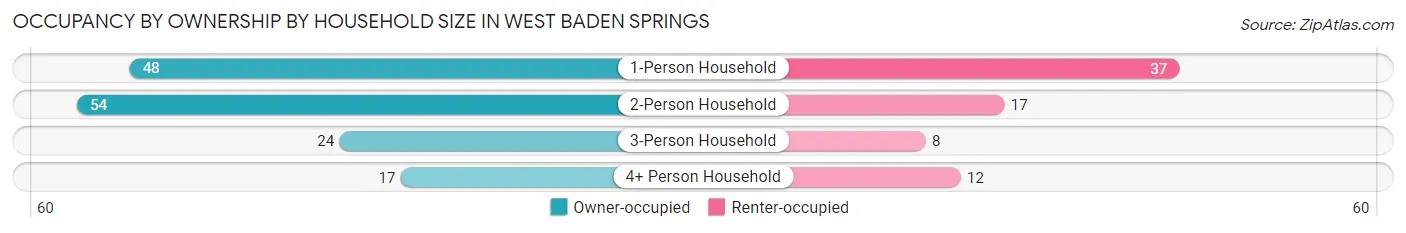
| Household Size | Owner-occupied | Renter-occupied |
| 1-Person Household | 48 (56.5%) | 37 (43.5%) |
| 2-Person Household | 54 (76.1%) | 17 (23.9%) |
| 3-Person Household | 24 (75.0%) | 8 (25.0%) |
| 4+ Person Household | 17 (58.6%) | 12 (41.4%) |
| Total Housing Units | 143 (65.9%) | 74 (34.1%) |
Occupancy by Educational Attainment in West Baden Springs
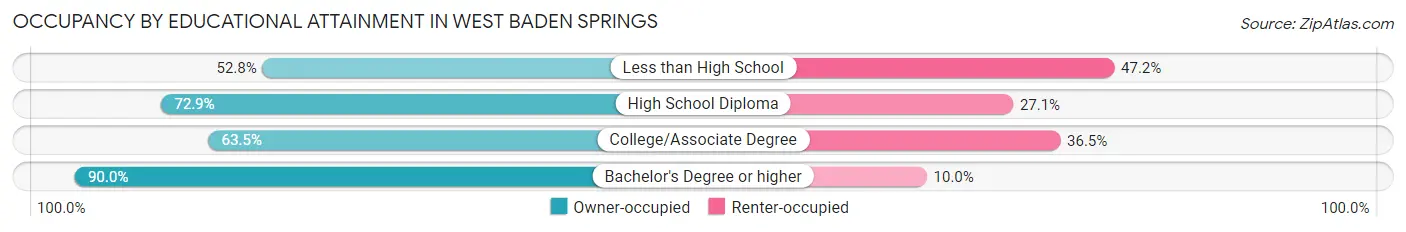
| Household Size | Owner-occupied | Renter-occupied |
| Less than High School | 28 (52.8%) | 25 (47.2%) |
| High School Diploma | 43 (72.9%) | 16 (27.1%) |
| College/Associate Degree | 54 (63.5%) | 31 (36.5%) |
| Bachelor's Degree or higher | 18 (90.0%) | 2 (10.0%) |
Occupancy by Age of Householder in West Baden Springs
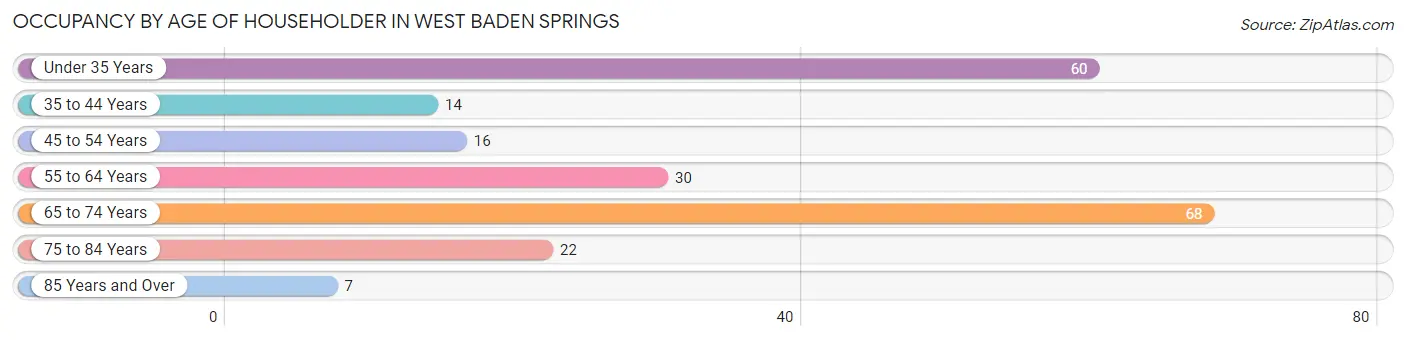
| Age Bracket | # Households | % Households |
| Under 35 Years | 60 | 27.7% |
| 35 to 44 Years | 14 | 6.5% |
| 45 to 54 Years | 16 | 7.4% |
| 55 to 64 Years | 30 | 13.8% |
| 65 to 74 Years | 68 | 31.3% |
| 75 to 84 Years | 22 | 10.1% |
| 85 Years and Over | 7 | 3.2% |
| Total | 217 | 100.0% |
Housing Finances in West Baden Springs
Median Income by Occupancy in West Baden Springs
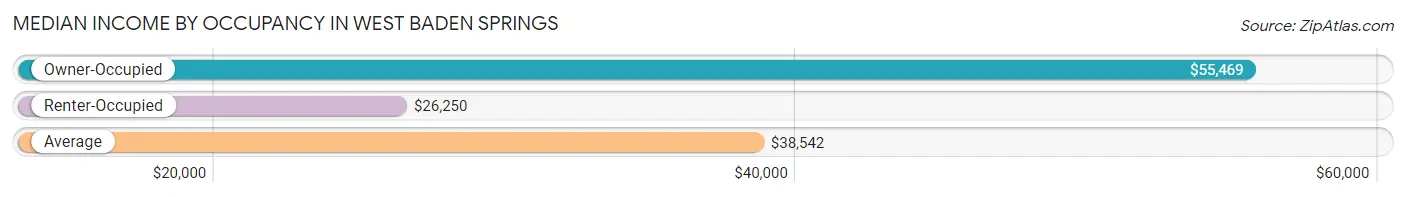
| Occupancy Type | # Households | Median Income |
| Owner-Occupied | 143 (65.9%) | $55,469 |
| Renter-Occupied | 74 (34.1%) | $26,250 |
| Average | 217 (100.0%) | $38,542 |
Occupancy by Householder Income Bracket in West Baden Springs

| Income Bracket | Owner-occupied | Renter-occupied |
| Less than $5,000 | 2 (1.4%) | 6 (8.1%) |
| $5,000 to $9,999 | 0 (0.0%) | 0 (0.0%) |
| $10,000 to $14,999 | 0 (0.0%) | 13 (17.6%) |
| $15,000 to $19,999 | 17 (11.9%) | 14 (18.9%) |
| $20,000 to $24,999 | 13 (9.1%) | 2 (2.7%) |
| $25,000 to $34,999 | 15 (10.5%) | 24 (32.4%) |
| $35,000 to $49,999 | 14 (9.8%) | 11 (14.9%) |
| $50,000 to $74,999 | 26 (18.2%) | 4 (5.4%) |
| $75,000 to $99,999 | 27 (18.9%) | 0 (0.0%) |
| $100,000 to $149,999 | 16 (11.2%) | 0 (0.0%) |
| $150,000 or more | 13 (9.1%) | 0 (0.0%) |
| Total | 143 (100.0%) | 74 (100.0%) |
Monthly Housing Cost Tiers in West Baden Springs
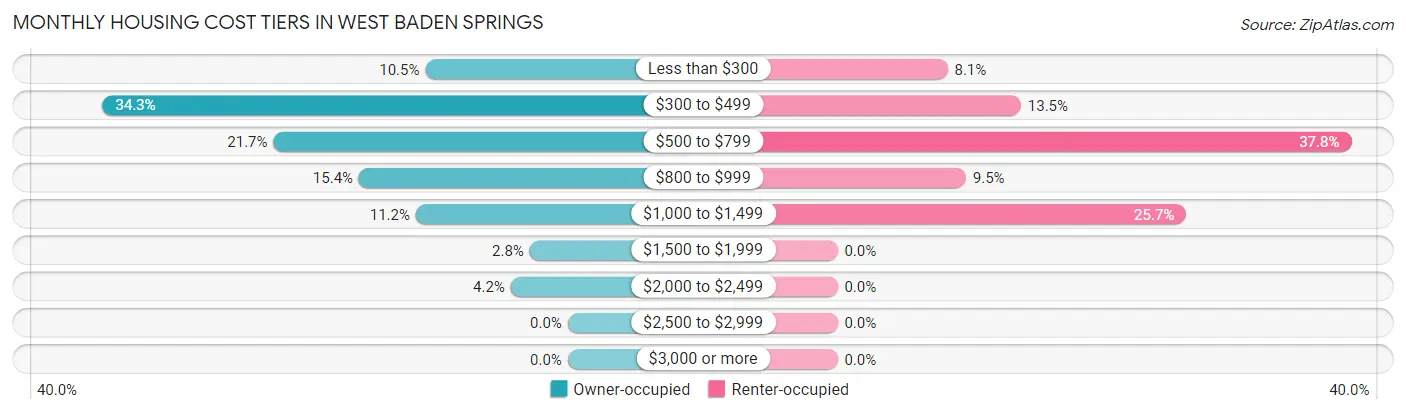
| Monthly Cost | Owner-occupied | Renter-occupied |
| Less than $300 | 15 (10.5%) | 6 (8.1%) |
| $300 to $499 | 49 (34.3%) | 10 (13.5%) |
| $500 to $799 | 31 (21.7%) | 28 (37.8%) |
| $800 to $999 | 22 (15.4%) | 7 (9.5%) |
| $1,000 to $1,499 | 16 (11.2%) | 19 (25.7%) |
| $1,500 to $1,999 | 4 (2.8%) | 0 (0.0%) |
| $2,000 to $2,499 | 6 (4.2%) | 0 (0.0%) |
| $2,500 to $2,999 | 0 (0.0%) | 0 (0.0%) |
| $3,000 or more | 0 (0.0%) | 0 (0.0%) |
| Total | 143 (100.0%) | 74 (100.0%) |
Physical Housing Characteristics in West Baden Springs
Housing Structures in West Baden Springs
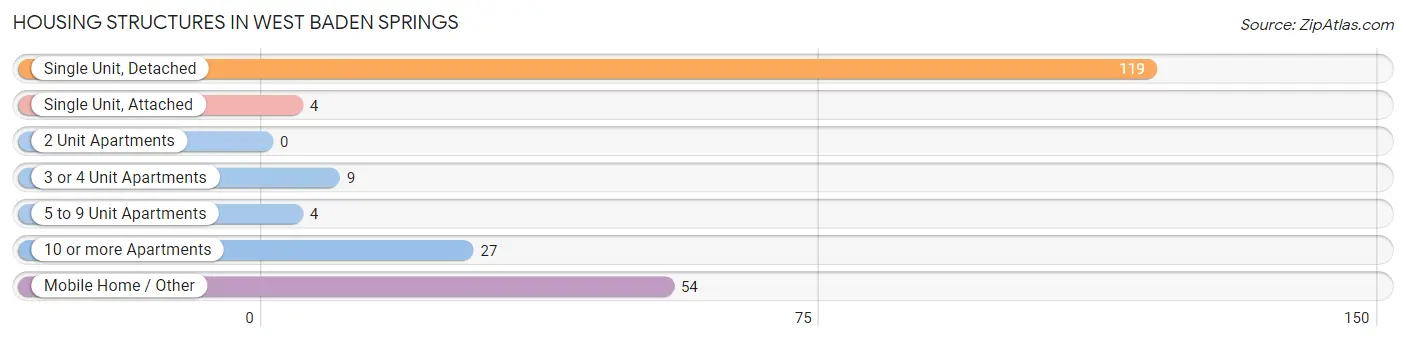
| Structure Type | # Housing Units | % Housing Units |
| Single Unit, Detached | 119 | 54.8% |
| Single Unit, Attached | 4 | 1.8% |
| 2 Unit Apartments | 0 | 0.0% |
| 3 or 4 Unit Apartments | 9 | 4.2% |
| 5 to 9 Unit Apartments | 4 | 1.8% |
| 10 or more Apartments | 27 | 12.4% |
| Mobile Home / Other | 54 | 24.9% |
| Total | 217 | 100.0% |
Housing Structures by Occupancy in West Baden Springs
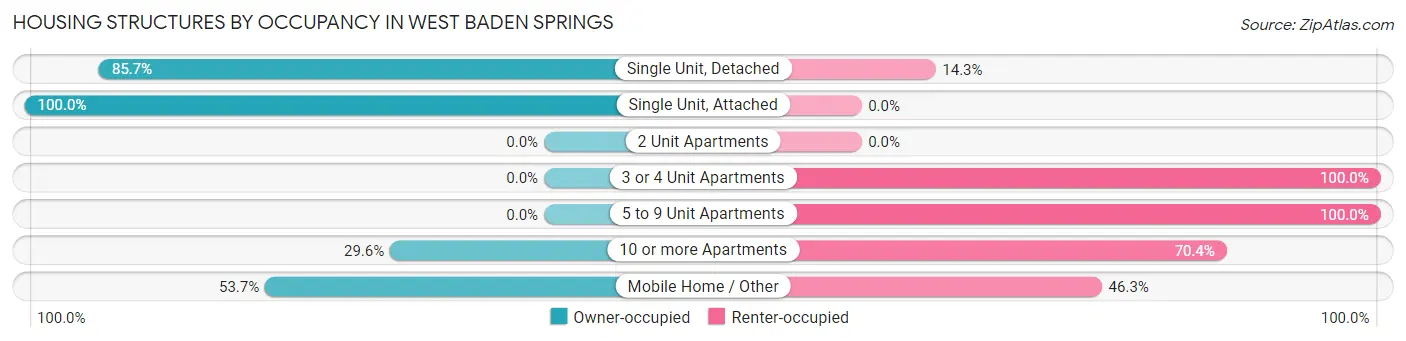
| Structure Type | Owner-occupied | Renter-occupied |
| Single Unit, Detached | 102 (85.7%) | 17 (14.3%) |
| Single Unit, Attached | 4 (100.0%) | 0 (0.0%) |
| 2 Unit Apartments | 0 (0.0%) | 0 (0.0%) |
| 3 or 4 Unit Apartments | 0 (0.0%) | 9 (100.0%) |
| 5 to 9 Unit Apartments | 0 (0.0%) | 4 (100.0%) |
| 10 or more Apartments | 8 (29.6%) | 19 (70.4%) |
| Mobile Home / Other | 29 (53.7%) | 25 (46.3%) |
| Total | 143 (65.9%) | 74 (34.1%) |
Housing Structures by Number of Rooms in West Baden Springs

| Number of Rooms | Owner-occupied | Renter-occupied |
| 1 Room | 0 (0.0%) | 0 (0.0%) |
| 2 or 3 Rooms | 9 (6.3%) | 29 (39.2%) |
| 4 or 5 Rooms | 73 (51.0%) | 37 (50.0%) |
| 6 or 7 Rooms | 30 (21.0%) | 8 (10.8%) |
| 8 or more Rooms | 31 (21.7%) | 0 (0.0%) |
| Total | 143 (100.0%) | 74 (100.0%) |
Housing Structure by Heating Type in West Baden Springs
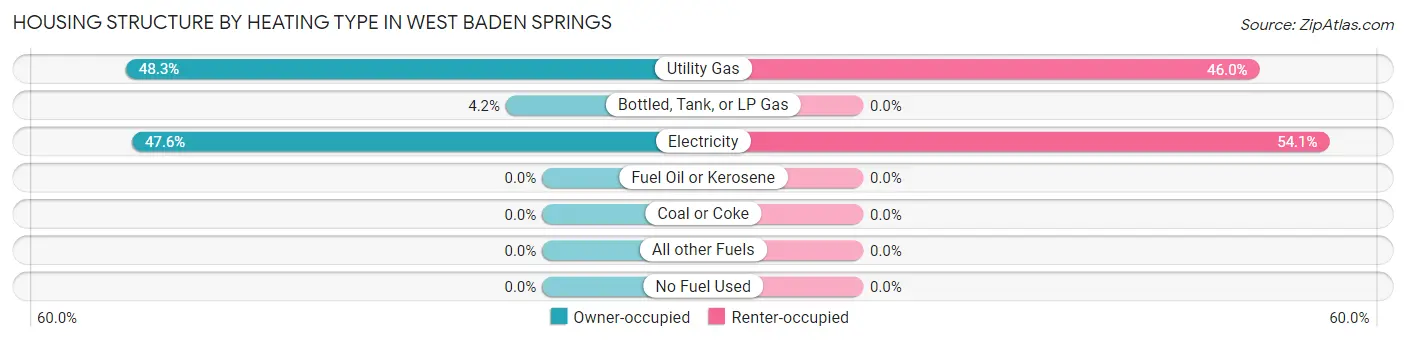
| Heating Type | Owner-occupied | Renter-occupied |
| Utility Gas | 69 (48.2%) | 34 (46.0%) |
| Bottled, Tank, or LP Gas | 6 (4.2%) | 0 (0.0%) |
| Electricity | 68 (47.5%) | 40 (54.0%) |
| Fuel Oil or Kerosene | 0 (0.0%) | 0 (0.0%) |
| Coal or Coke | 0 (0.0%) | 0 (0.0%) |
| All other Fuels | 0 (0.0%) | 0 (0.0%) |
| No Fuel Used | 0 (0.0%) | 0 (0.0%) |
| Total | 143 (100.0%) | 74 (100.0%) |
Household Vehicle Usage in West Baden Springs
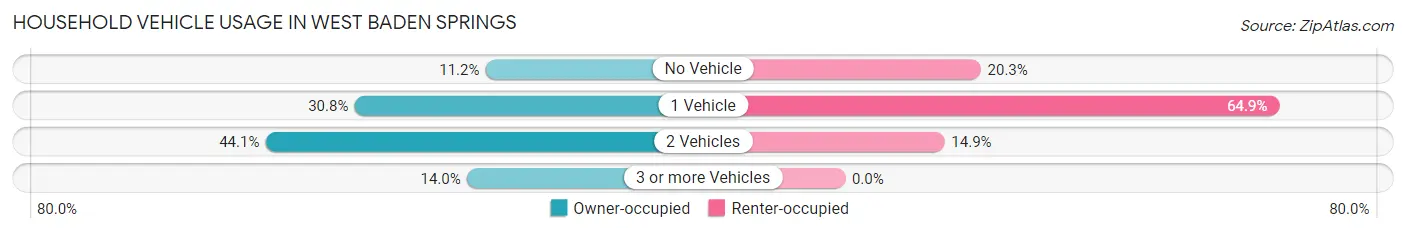
| Vehicles per Household | Owner-occupied | Renter-occupied |
| No Vehicle | 16 (11.2%) | 15 (20.3%) |
| 1 Vehicle | 44 (30.8%) | 48 (64.9%) |
| 2 Vehicles | 63 (44.1%) | 11 (14.9%) |
| 3 or more Vehicles | 20 (14.0%) | 0 (0.0%) |
| Total | 143 (100.0%) | 74 (100.0%) |
Real Estate & Mortgages in West Baden Springs
Real Estate and Mortgage Overview in West Baden Springs
| Characteristic | Without Mortgage | With Mortgage |
| Housing Units | 73 | 70 |
| Median Property Value | $89,100 | $123,800 |
| Median Household Income | $43,125 | $11 |
| Monthly Housing Costs | $385 | $0 |
| Real Estate Taxes | $478 | $0 |
Property Value by Mortgage Status in West Baden Springs
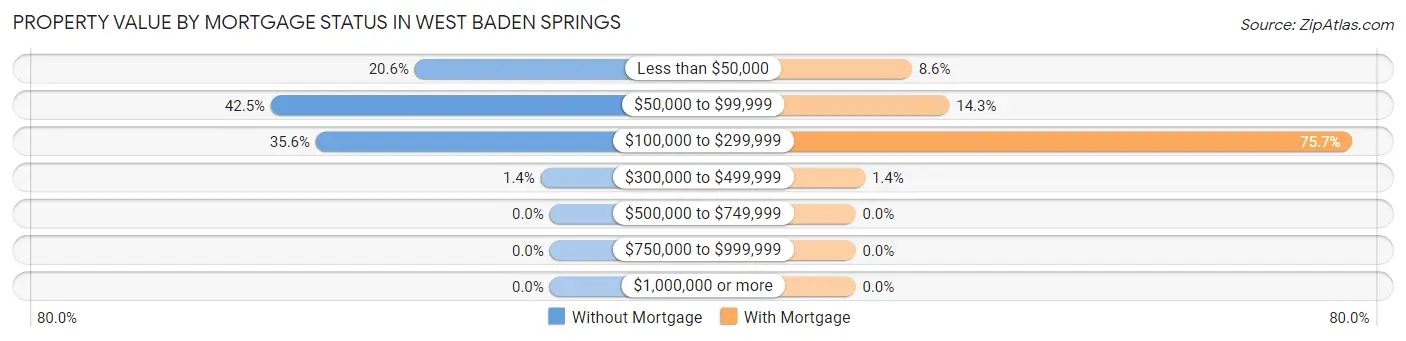
| Property Value | Without Mortgage | With Mortgage |
| Less than $50,000 | 15 (20.5%) | 6 (8.6%) |
| $50,000 to $99,999 | 31 (42.5%) | 10 (14.3%) |
| $100,000 to $299,999 | 26 (35.6%) | 53 (75.7%) |
| $300,000 to $499,999 | 1 (1.4%) | 1 (1.4%) |
| $500,000 to $749,999 | 0 (0.0%) | 0 (0.0%) |
| $750,000 to $999,999 | 0 (0.0%) | 0 (0.0%) |
| $1,000,000 or more | 0 (0.0%) | 0 (0.0%) |
| Total | 73 (100.0%) | 70 (100.0%) |
Household Income by Mortgage Status in West Baden Springs
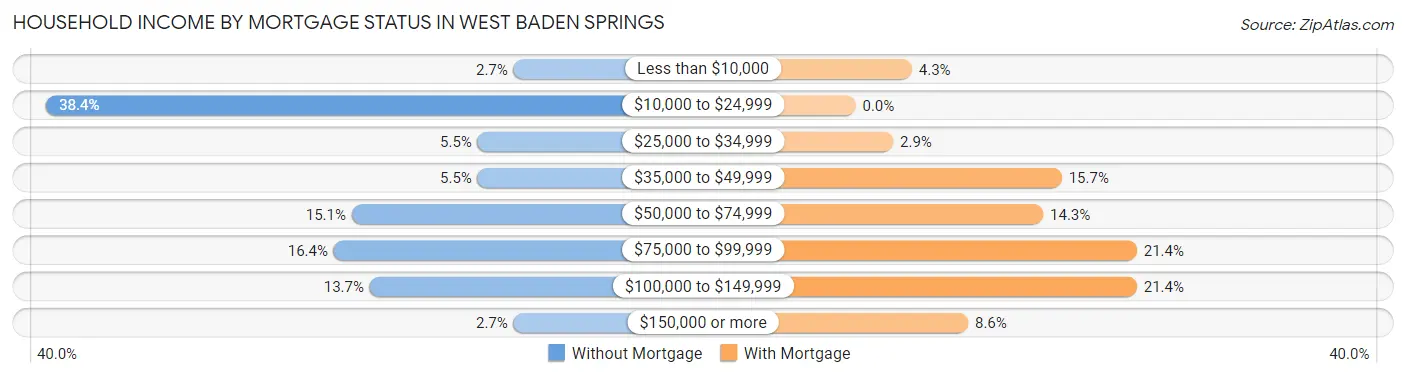
| Household Income | Without Mortgage | With Mortgage |
| Less than $10,000 | 2 (2.7%) | 3 (4.3%) |
| $10,000 to $24,999 | 28 (38.4%) | 0 (0.0%) |
| $25,000 to $34,999 | 4 (5.5%) | 2 (2.9%) |
| $35,000 to $49,999 | 4 (5.5%) | 11 (15.7%) |
| $50,000 to $74,999 | 11 (15.1%) | 10 (14.3%) |
| $75,000 to $99,999 | 12 (16.4%) | 15 (21.4%) |
| $100,000 to $149,999 | 10 (13.7%) | 15 (21.4%) |
| $150,000 or more | 2 (2.7%) | 6 (8.6%) |
| Total | 73 (100.0%) | 70 (100.0%) |
Property Value to Household Income Ratio in West Baden Springs
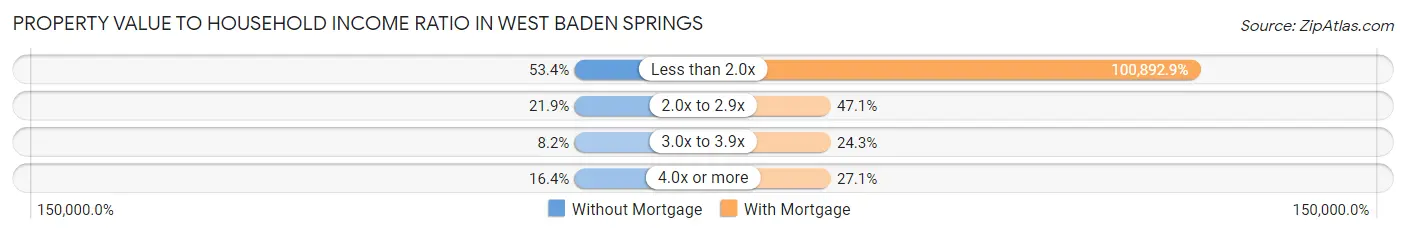
| Value-to-Income Ratio | Without Mortgage | With Mortgage |
| Less than 2.0x | 39 (53.4%) | 70,625 (100,892.9%) |
| 2.0x to 2.9x | 16 (21.9%) | 33 (47.1%) |
| 3.0x to 3.9x | 6 (8.2%) | 17 (24.3%) |
| 4.0x or more | 12 (16.4%) | 19 (27.1%) |
| Total | 73 (100.0%) | 70 (100.0%) |
Real Estate Taxes by Mortgage Status in West Baden Springs
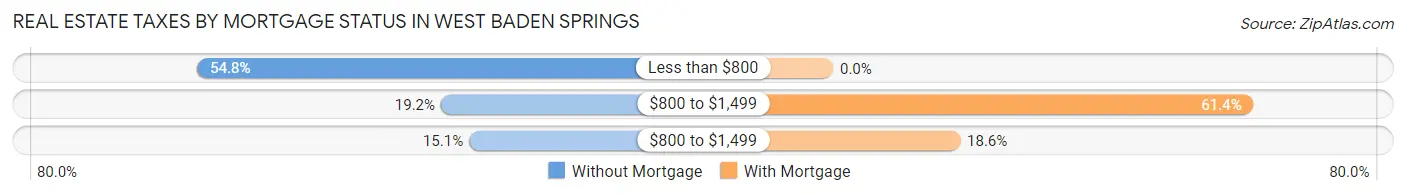
| Property Taxes | Without Mortgage | With Mortgage |
| Less than $800 | 40 (54.8%) | 0 (0.0%) |
| $800 to $1,499 | 14 (19.2%) | 43 (61.4%) |
| $800 to $1,499 | 11 (15.1%) | 13 (18.6%) |
| Total | 73 (100.0%) | 70 (100.0%) |
Health & Disability in West Baden Springs
Health Insurance Coverage by Age in West Baden Springs
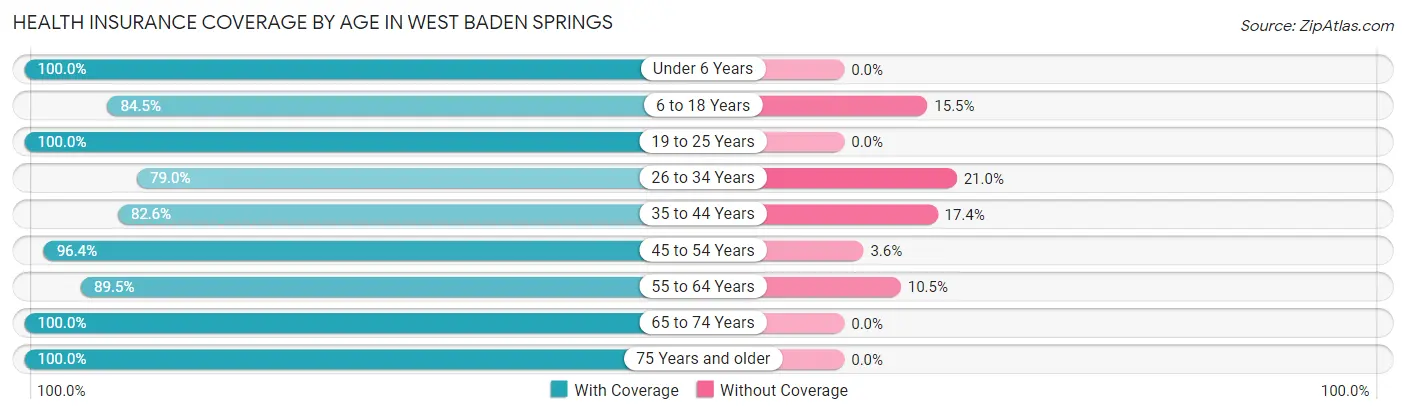
| Age Bracket | With Coverage | Without Coverage |
| Under 6 Years | 44 (100.0%) | 0 (0.0%) |
| 6 to 18 Years | 60 (84.5%) | 11 (15.5%) |
| 19 to 25 Years | 53 (100.0%) | 0 (0.0%) |
| 26 to 34 Years | 49 (79.0%) | 13 (21.0%) |
| 35 to 44 Years | 38 (82.6%) | 8 (17.4%) |
| 45 to 54 Years | 27 (96.4%) | 1 (3.6%) |
| 55 to 64 Years | 34 (89.5%) | 4 (10.5%) |
| 65 to 74 Years | 95 (100.0%) | 0 (0.0%) |
| 75 Years and older | 42 (100.0%) | 0 (0.0%) |
| Total | 442 (92.3%) | 37 (7.7%) |
Health Insurance Coverage by Citizenship Status in West Baden Springs
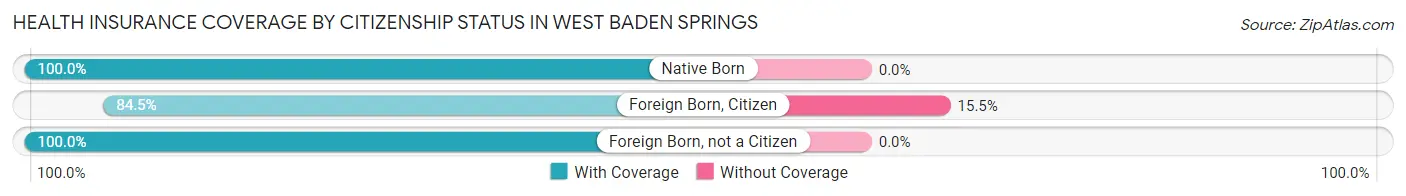
| Citizenship Status | With Coverage | Without Coverage |
| Native Born | 44 (100.0%) | 0 (0.0%) |
| Foreign Born, Citizen | 60 (84.5%) | 11 (15.5%) |
| Foreign Born, not a Citizen | 53 (100.0%) | 0 (0.0%) |
Health Insurance Coverage by Household Income in West Baden Springs
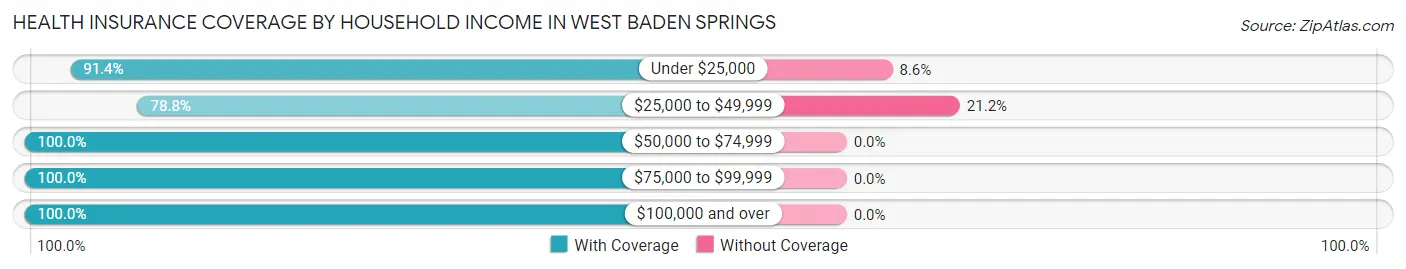
| Household Income | With Coverage | Without Coverage |
| Under $25,000 | 128 (91.4%) | 12 (8.6%) |
| $25,000 to $49,999 | 93 (78.8%) | 25 (21.2%) |
| $50,000 to $74,999 | 57 (100.0%) | 0 (0.0%) |
| $75,000 to $99,999 | 78 (100.0%) | 0 (0.0%) |
| $100,000 and over | 86 (100.0%) | 0 (0.0%) |
Public vs Private Health Insurance Coverage by Age in West Baden Springs

| Age Bracket | Public Insurance | Private Insurance |
| Under 6 | 38 (86.4%) | 6 (13.6%) |
| 6 to 18 Years | 26 (36.6%) | 34 (47.9%) |
| 19 to 25 Years | 25 (47.2%) | 30 (56.6%) |
| 25 to 34 Years | 20 (32.3%) | 29 (46.8%) |
| 35 to 44 Years | 6 (13.0%) | 32 (69.6%) |
| 45 to 54 Years | 7 (25.0%) | 20 (71.4%) |
| 55 to 64 Years | 9 (23.7%) | 27 (71.1%) |
| 65 to 74 Years | 95 (100.0%) | 71 (74.7%) |
| 75 Years and over | 42 (100.0%) | 20 (47.6%) |
| Total | 268 (55.9%) | 269 (56.2%) |
Disability Status by Sex by Age in West Baden Springs
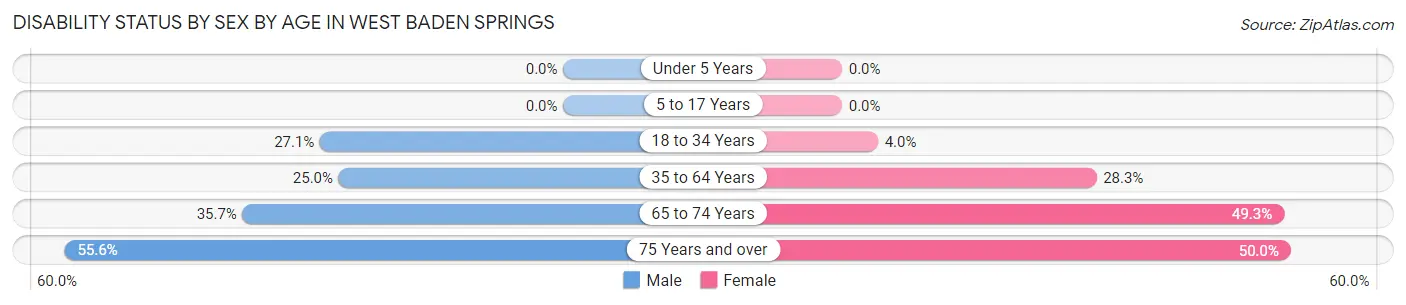
| Age Bracket | Male | Female |
| Under 5 Years | 0 (0.0%) | 0 (0.0%) |
| 5 to 17 Years | 0 (0.0%) | 0 (0.0%) |
| 18 to 34 Years | 13 (27.1%) | 3 (4.0%) |
| 35 to 64 Years | 13 (25.0%) | 17 (28.3%) |
| 65 to 74 Years | 10 (35.7%) | 33 (49.2%) |
| 75 Years and over | 10 (55.6%) | 12 (50.0%) |
Disability Class by Sex by Age in West Baden Springs
Disability Class: Hearing Difficulty
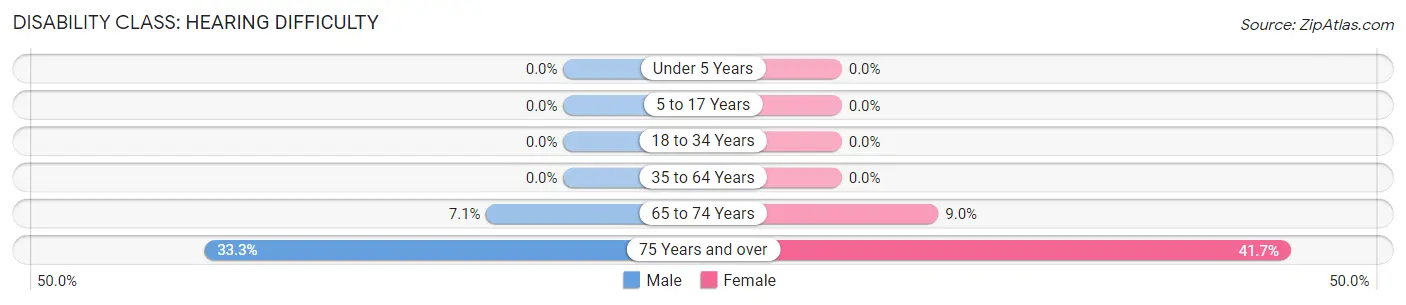
| Age Bracket | Male | Female |
| Under 5 Years | 0 (0.0%) | 0 (0.0%) |
| 5 to 17 Years | 0 (0.0%) | 0 (0.0%) |
| 18 to 34 Years | 0 (0.0%) | 0 (0.0%) |
| 35 to 64 Years | 0 (0.0%) | 0 (0.0%) |
| 65 to 74 Years | 2 (7.1%) | 6 (9.0%) |
| 75 Years and over | 6 (33.3%) | 10 (41.7%) |
Disability Class: Vision Difficulty
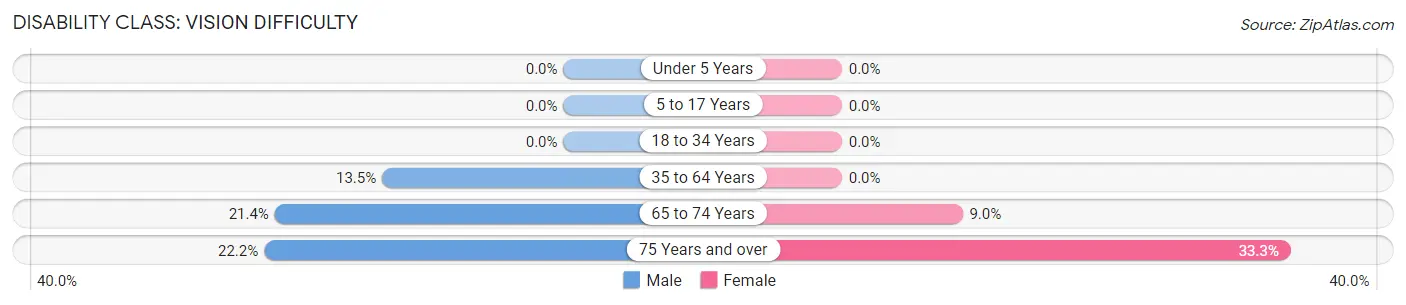
| Age Bracket | Male | Female |
| Under 5 Years | 0 (0.0%) | 0 (0.0%) |
| 5 to 17 Years | 0 (0.0%) | 0 (0.0%) |
| 18 to 34 Years | 0 (0.0%) | 0 (0.0%) |
| 35 to 64 Years | 7 (13.5%) | 0 (0.0%) |
| 65 to 74 Years | 6 (21.4%) | 6 (9.0%) |
| 75 Years and over | 4 (22.2%) | 8 (33.3%) |
Disability Class: Cognitive Difficulty
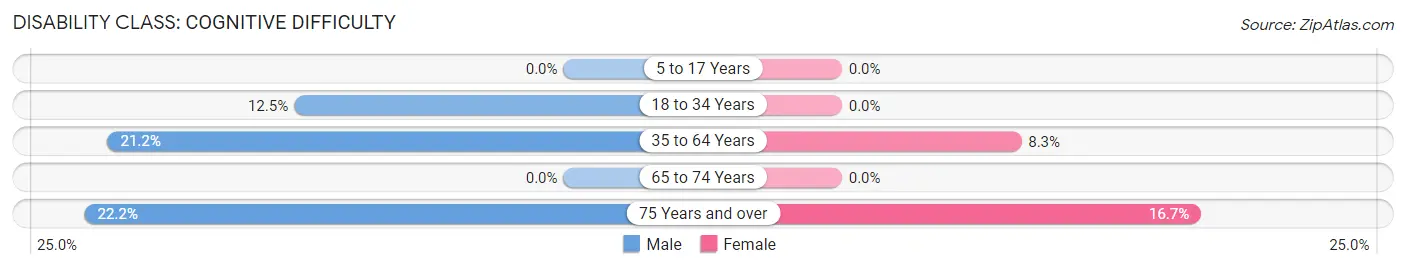
| Age Bracket | Male | Female |
| 5 to 17 Years | 0 (0.0%) | 0 (0.0%) |
| 18 to 34 Years | 6 (12.5%) | 0 (0.0%) |
| 35 to 64 Years | 11 (21.1%) | 5 (8.3%) |
| 65 to 74 Years | 0 (0.0%) | 0 (0.0%) |
| 75 Years and over | 4 (22.2%) | 4 (16.7%) |
Disability Class: Ambulatory Difficulty
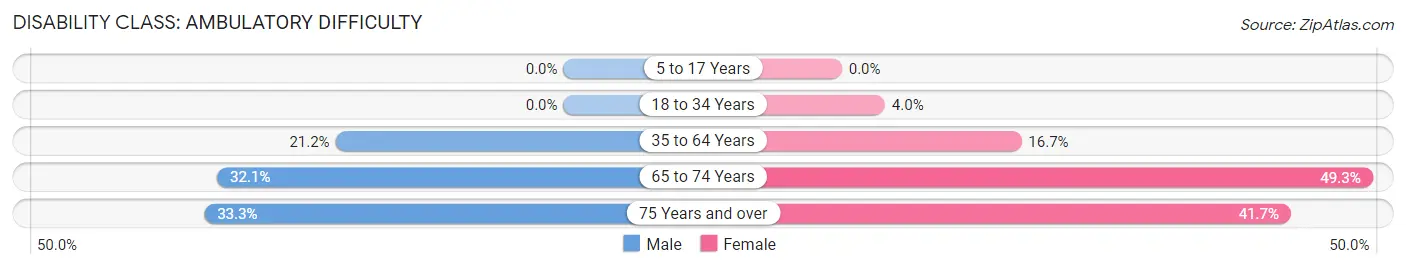
| Age Bracket | Male | Female |
| 5 to 17 Years | 0 (0.0%) | 0 (0.0%) |
| 18 to 34 Years | 0 (0.0%) | 3 (4.0%) |
| 35 to 64 Years | 11 (21.1%) | 10 (16.7%) |
| 65 to 74 Years | 9 (32.1%) | 33 (49.2%) |
| 75 Years and over | 6 (33.3%) | 10 (41.7%) |
Disability Class: Self-Care Difficulty
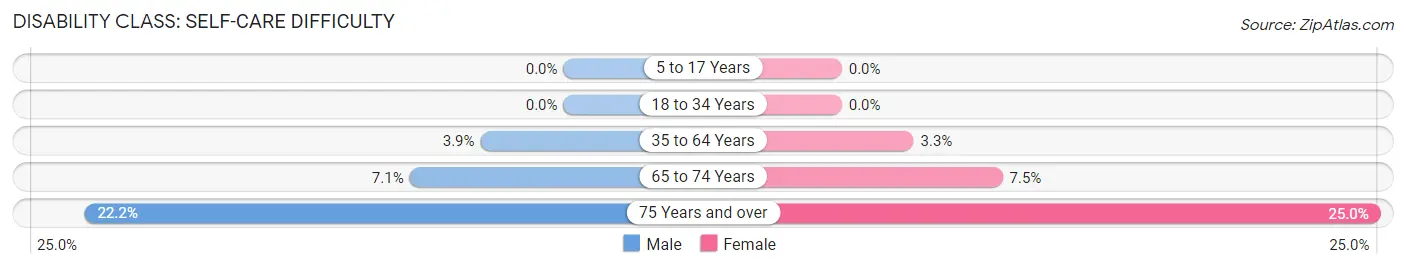
| Age Bracket | Male | Female |
| 5 to 17 Years | 0 (0.0%) | 0 (0.0%) |
| 18 to 34 Years | 0 (0.0%) | 0 (0.0%) |
| 35 to 64 Years | 2 (3.8%) | 2 (3.3%) |
| 65 to 74 Years | 2 (7.1%) | 5 (7.5%) |
| 75 Years and over | 4 (22.2%) | 6 (25.0%) |
Technology Access in West Baden Springs
Computing Device Access in West Baden Springs
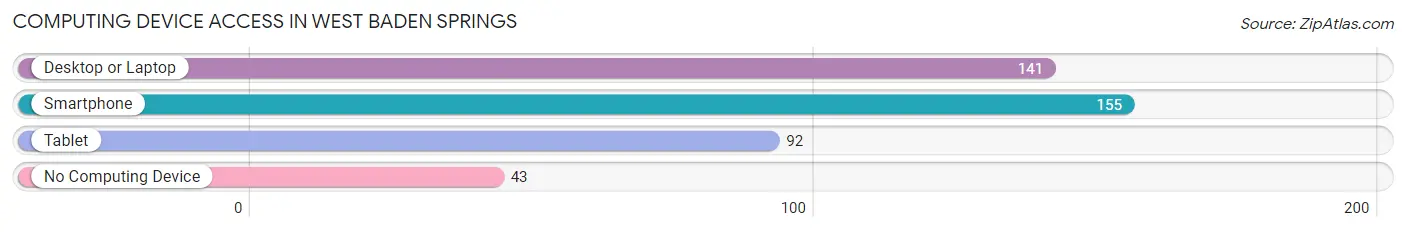
| Device Type | # Households | % Households |
| Desktop or Laptop | 141 | 65.0% |
| Smartphone | 155 | 71.4% |
| Tablet | 92 | 42.4% |
| No Computing Device | 43 | 19.8% |
| Total | 217 | 100.0% |
Internet Access in West Baden Springs
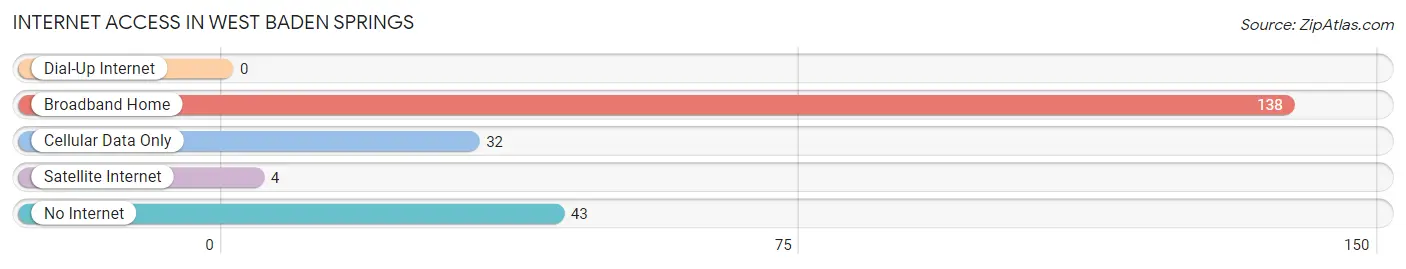
| Internet Type | # Households | % Households |
| Dial-Up Internet | 0 | 0.0% |
| Broadband Home | 138 | 63.6% |
| Cellular Data Only | 32 | 14.7% |
| Satellite Internet | 4 | 1.8% |
| No Internet | 43 | 19.8% |
| Total | 217 | 100.0% |
West Baden Springs Summary
Baden Springs, Indiana is a small town located in the southwestern part of the state. It is situated in the rolling hills of the Wabash Valley, and is home to a population of just over 1,000 people. The town is best known for its historic West Baden Springs Hotel, which was built in 1902 and is listed on the National Register of Historic Places.
History
The area that is now West Baden Springs was first settled in the early 1800s by a group of French-Canadian fur traders. The town was originally known as “Baden”, after the German city of Baden-Baden. In 1851, the town was renamed West Baden Springs, after the nearby mineral springs. The springs were believed to have healing properties, and the town quickly became a popular destination for health seekers.
In 1902, the West Baden Springs Hotel was built to capitalize on the town’s popularity as a health resort. The hotel was designed by renowned architect Harrison Albright, and was one of the largest and most luxurious hotels in the country. The hotel was a popular destination for celebrities and politicians, and hosted many famous guests, including President Theodore Roosevelt.
In the early 1900s, West Baden Springs was a thriving community. The town had a variety of businesses, including a bank, a newspaper, a theater, and a variety of shops. The town also had a thriving agricultural industry, with many farms in the area.
Geography
West Baden Springs is located in the southwestern part of Indiana, in the Wabash Valley. The town is situated on the banks of the Wabash River, and is surrounded by rolling hills and forests. The town is located about 30 miles south of Bloomington, and about 50 miles west of Indianapolis.
The climate in West Baden Springs is humid continental, with hot summers and cold winters. The average annual temperature is around 50 degrees Fahrenheit, and the average annual precipitation is around 40 inches.
Economy
The economy of West Baden Springs is largely based on tourism. The town is home to the historic West Baden Springs Hotel, which is a popular destination for visitors from around the world. The hotel is also home to a variety of restaurants, shops, and other businesses.
In addition to tourism, West Baden Springs also has a thriving agricultural industry. The town is home to many farms, which produce a variety of crops, including corn, soybeans, and wheat.
Demographics
As of the 2010 census, the population of West Baden Springs was 1,039. The town is predominantly white, with about 95% of the population identifying as such. The median household income is around $45,000, and the median home value is around $150,000.
Conclusion
West Baden Springs is a small town located in the southwestern part of Indiana. The town is best known for its historic West Baden Springs Hotel, which was built in 1902 and is listed on the National Register of Historic Places. The town’s economy is largely based on tourism, and it also has a thriving agricultural industry. The population of West Baden Springs is predominantly white, with a median household income of around $45,000 and a median home value of around $150,000.
Common Questions
What is the Total Population of West Baden Springs?
Total Population of West Baden Springs is 479.
What is the Total Male Population of West Baden Springs?
Total Male Population of West Baden Springs is 194.
What is the Total Female Population of West Baden Springs?
Total Female Population of West Baden Springs is 285.
What is the Ratio of Males per 100 Females in West Baden Springs?
There are 68.07 Males per 100 Females in West Baden Springs.
What is the Ratio of Females per 100 Males in West Baden Springs?
There are 146.91 Females per 100 Males in West Baden Springs.
What is the Median Population Age in West Baden Springs?
Median Population Age in West Baden Springs is 35.6 Years.
What is the Average Family Size in West Baden Springs
Average Family Size in West Baden Springs is 2.7 People.
What is the Average Household Size in West Baden Springs
Average Household Size in West Baden Springs is 2.2 People.
What is Per Capita Income in West Baden Springs?
Per Capita income in West Baden Springs is $26,448.
What is the Median Family Income in West Baden Springs?
Median Family Income in West Baden Springs is $56,719.
What is the Median Household income in West Baden Springs?
Median Household Income in West Baden Springs is $38,542.
What is Income or Wage Gap in West Baden Springs?
Income or Wage Gap in West Baden Springs is 23.4%.
Women in West Baden Springs earn 76.6 cents for every dollar earned by a man.
What is Inequality or Gini Index in West Baden Springs?
Inequality or Gini Index in West Baden Springs is 0.46.
How Large is the Labor Force in West Baden Springs?
There are 222 People in the Labor Forcein in West Baden Springs.
What is the Percentage of People in the Labor Force in West Baden Springs?
59.2% of People are in the Labor Force in West Baden Springs.
What is the Unemployment Rate in West Baden Springs?
Unemployment Rate in West Baden Springs is 7.7%.