Kentland, IN
Kentland Map
Kentland Overview
1,810
TOTAL POPULATION
899
MALE POPULATION
911
FEMALE POPULATION
98.68
MALES / 100 FEMALES
101.33
FEMALES / 100 MALES
39.2
MEDIAN AGE
2.7
AVG FAMILY SIZE
2.2
AVG HOUSEHOLD SIZE
$24,452
PER CAPITA INCOME
$72,944
AVG FAMILY INCOME
$55,329
AVG HOUSEHOLD INCOME
34.7%
WAGE / INCOME GAP [ % ]
65.3¢/ $1
WAGE / INCOME GAP [ $ ]
0.34
INEQUALITY / GINI INDEX
902
LABOR FORCE [ PEOPLE ]
63.9%
PERCENT IN LABOR FORCE
20.0%
UNEMPLOYMENT RATE
Kentland Zip Codes
Kentland Area Codes
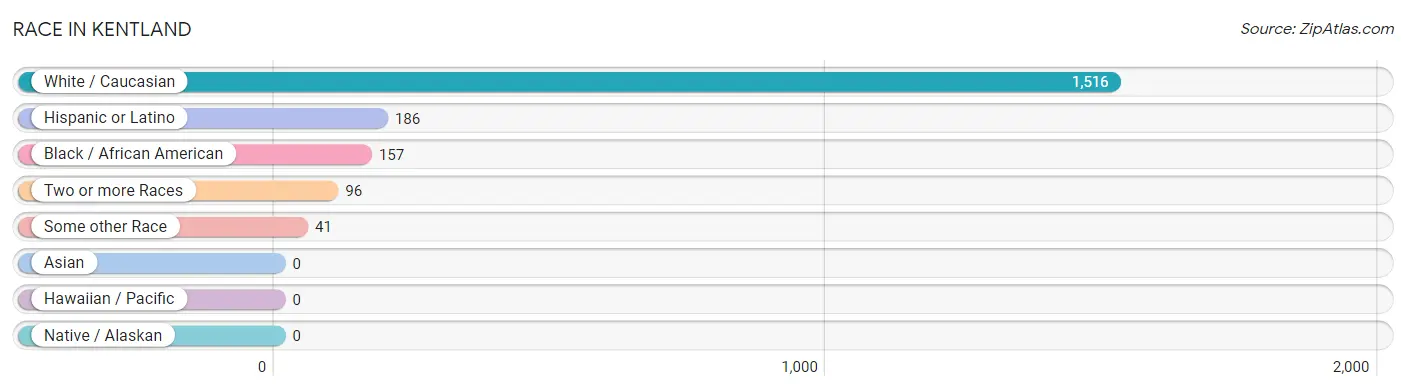
Race in Kentland
The most populous races in Kentland are White / Caucasian (1,516 | 83.8%), Hispanic or Latino (186 | 10.3%), and Black / African American (157 | 8.7%).
| Race | # Population | % Population |
| Asian | 0 | 0.0% |
| Black / African American | 157 | 8.7% |
| Hawaiian / Pacific | 0 | 0.0% |
| Hispanic or Latino | 186 | 10.3% |
| Native / Alaskan | 0 | 0.0% |
| White / Caucasian | 1,516 | 83.8% |
| Two or more Races | 96 | 5.3% |
| Some other Race | 41 | 2.3% |
| Total | 1,810 | 100.0% |
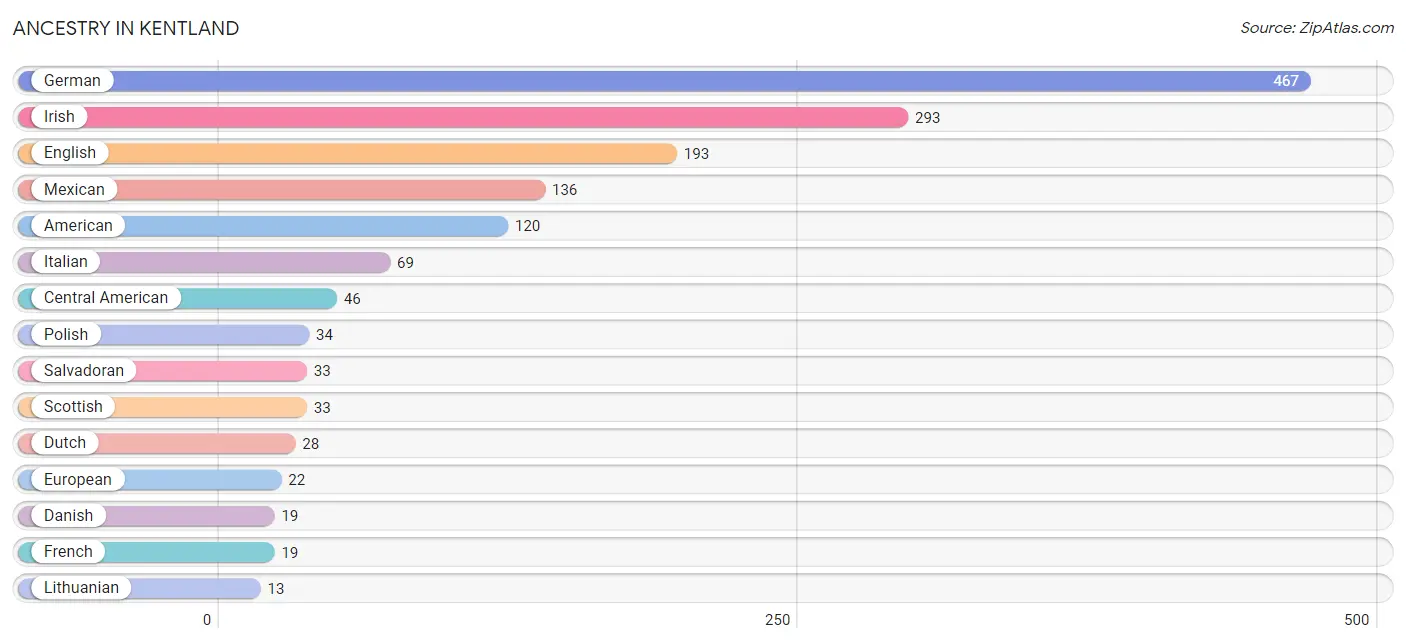
Ancestry in Kentland
The most populous ancestries reported in Kentland are German (467 | 25.8%), Irish (293 | 16.2%), English (193 | 10.7%), Mexican (136 | 7.5%), and American (120 | 6.6%), together accounting for 66.8% of all Kentland residents.
| Ancestry | # Population | % Population |
| American | 120 | 6.6% |
| Austrian | 9 | 0.5% |
| Belgian | 2 | 0.1% |
| Canadian | 5 | 0.3% |
| Central American | 46 | 2.5% |
| Cherokee | 10 | 0.5% |
| Costa Rican | 4 | 0.2% |
| Danish | 19 | 1.1% |
| Dutch | 28 | 1.5% |
| Eastern European | 8 | 0.4% |
| English | 193 | 10.7% |
| European | 22 | 1.2% |
| French | 19 | 1.1% |
| French Canadian | 9 | 0.5% |
| German | 467 | 25.8% |
| Guatemalan | 9 | 0.5% |
| Hungarian | 3 | 0.2% |
| Irish | 293 | 16.2% |
| Italian | 69 | 3.8% |
| Lithuanian | 13 | 0.7% |
| Mexican | 136 | 7.5% |
| Norwegian | 6 | 0.3% |
| Polish | 34 | 1.9% |
| Potawatomi | 3 | 0.2% |
| Puerto Rican | 4 | 0.2% |
| Salvadoran | 33 | 1.8% |
| Scandinavian | 7 | 0.4% |
| Scotch-Irish | 7 | 0.4% |
| Scottish | 33 | 1.8% |
| Slovak | 1 | 0.1% |
| Swedish | 13 | 0.7% |
| Ukrainian | 9 | 0.5% | View All 32 Rows |
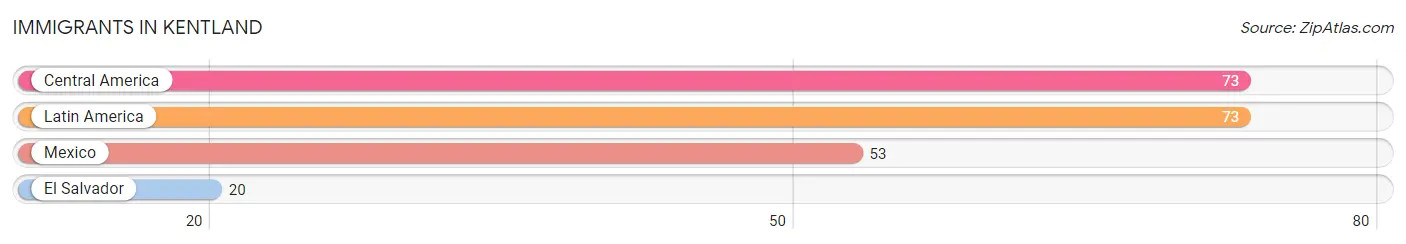
Immigrants in Kentland
The most numerous immigrant groups reported in Kentland came from Central America (73 | 4.0%), Latin America (73 | 4.0%), Mexico (53 | 2.9%), and El Salvador (20 | 1.1%), together accounting for 12.1% of all Kentland residents.
| Immigration Origin | # Population | % Population |
| Central America | 73 | 4.0% |
| El Salvador | 20 | 1.1% |
| Latin America | 73 | 4.0% |
| Mexico | 53 | 2.9% | View All 4 Rows |
Sex and Age in Kentland
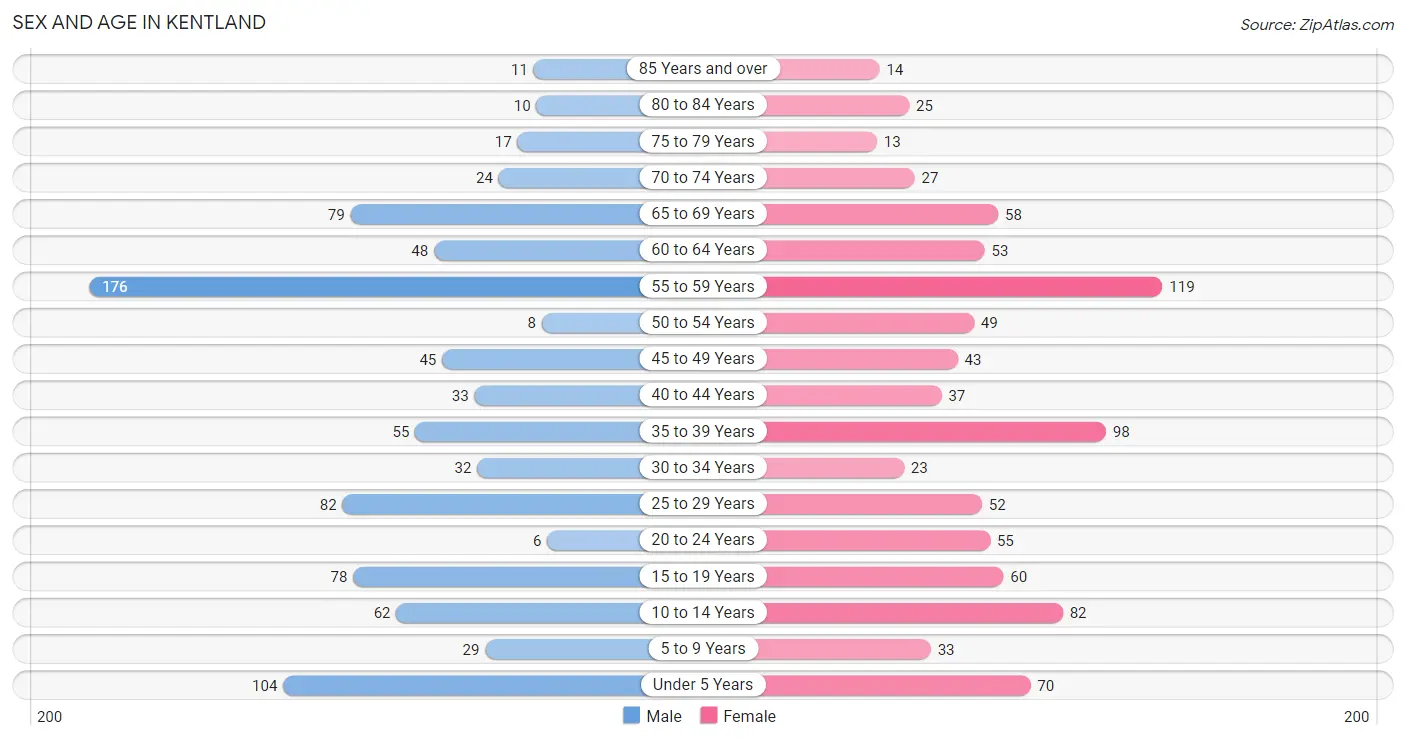
Sex and Age in Kentland
The most populous age groups in Kentland are 55 to 59 Years (176 | 19.6%) for men and 55 to 59 Years (119 | 13.1%) for women.
| Age Bracket | Male | Female |
| Under 5 Years | 104 (11.6%) | 70 (7.7%) |
| 5 to 9 Years | 29 (3.2%) | 33 (3.6%) |
| 10 to 14 Years | 62 (6.9%) | 82 (9.0%) |
| 15 to 19 Years | 78 (8.7%) | 60 (6.6%) |
| 20 to 24 Years | 6 (0.7%) | 55 (6.0%) |
| 25 to 29 Years | 82 (9.1%) | 52 (5.7%) |
| 30 to 34 Years | 32 (3.6%) | 23 (2.5%) |
| 35 to 39 Years | 55 (6.1%) | 98 (10.8%) |
| 40 to 44 Years | 33 (3.7%) | 37 (4.1%) |
| 45 to 49 Years | 45 (5.0%) | 43 (4.7%) |
| 50 to 54 Years | 8 (0.9%) | 49 (5.4%) |
| 55 to 59 Years | 176 (19.6%) | 119 (13.1%) |
| 60 to 64 Years | 48 (5.3%) | 53 (5.8%) |
| 65 to 69 Years | 79 (8.8%) | 58 (6.4%) |
| 70 to 74 Years | 24 (2.7%) | 27 (3.0%) |
| 75 to 79 Years | 17 (1.9%) | 13 (1.4%) |
| 80 to 84 Years | 10 (1.1%) | 25 (2.7%) |
| 85 Years and over | 11 (1.2%) | 14 (1.5%) |
| Total | 899 (100.0%) | 911 (100.0%) |
Families and Households in Kentland
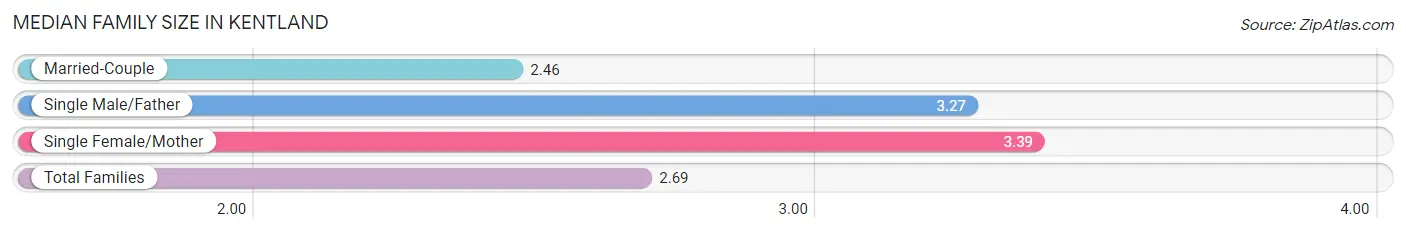
Median Family Size in Kentland
The median family size in Kentland is 2.69 persons per family, with single female/mother families (99 | 19.8%) accounting for the largest median family size of 3.39 persons per family. On the other hand, married-couple families (372 | 74.3%) represent the smallest median family size with 2.46 persons per family.
| Family Type | # Families | Family Size |
| Married-Couple | 372 (74.3%) | 2.46 |
| Single Male/Father | 30 (6.0%) | 3.27 |
| Single Female/Mother | 99 (19.8%) | 3.39 |
| Total Families | 501 (100.0%) | 2.69 |
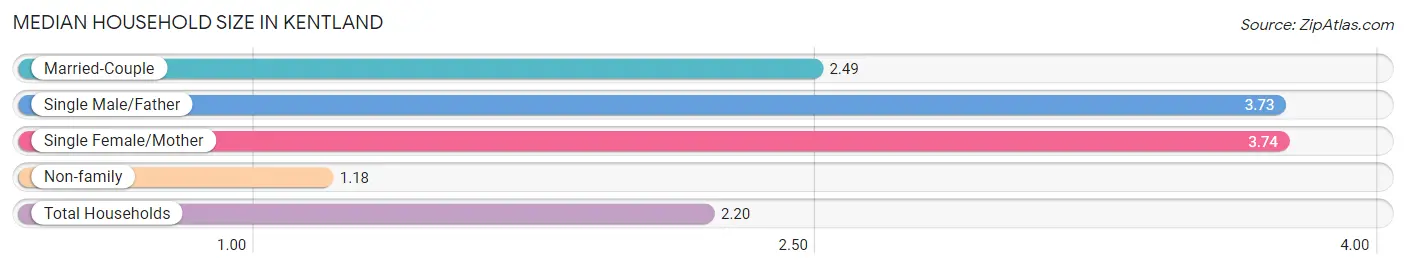
Median Household Size in Kentland
The median household size in Kentland is 2.20 persons per household, with single female/mother households (99 | 12.4%) accounting for the largest median household size of 3.74 persons per household. non-family households (299 | 37.4%) represent the smallest median household size with 1.18 persons per household.
| Household Type | # Households | Household Size |
| Married-Couple | 372 (46.5%) | 2.49 |
| Single Male/Father | 30 (3.7%) | 3.73 |
| Single Female/Mother | 99 (12.4%) | 3.74 |
| Non-family | 299 (37.4%) | 1.18 |
| Total Households | 800 (100.0%) | 2.20 |
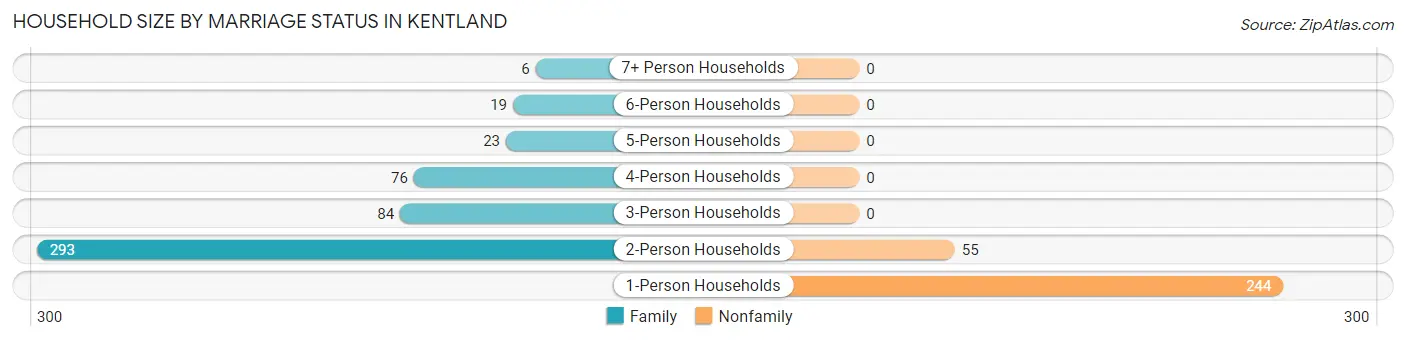
Household Size by Marriage Status in Kentland
Out of a total of 800 households in Kentland, 501 (62.6%) are family households, while 299 (37.4%) are nonfamily households. The most numerous type of family households are 2-person households, comprising 293, and the most common type of nonfamily households are 1-person households, comprising 244.
| Household Size | Family Households | Nonfamily Households |
| 1-Person Households | - | 244 (30.5%) |
| 2-Person Households | 293 (36.6%) | 55 (6.9%) |
| 3-Person Households | 84 (10.5%) | 0 (0.0%) |
| 4-Person Households | 76 (9.5%) | 0 (0.0%) |
| 5-Person Households | 23 (2.9%) | 0 (0.0%) |
| 6-Person Households | 19 (2.4%) | 0 (0.0%) |
| 7+ Person Households | 6 (0.7%) | 0 (0.0%) |
| Total | 501 (62.6%) | 299 (37.4%) |
Female Fertility in Kentland
Fertility by Age in Kentland
Average fertility rate in Kentland is 42.0 births per 1,000 women. Women in the age bracket of 35 to 50 years have the highest fertility rate with 67.0 births per 1,000 women. Women in the age bracket of 35 to 50 years acount for 81.2% of all women with births.
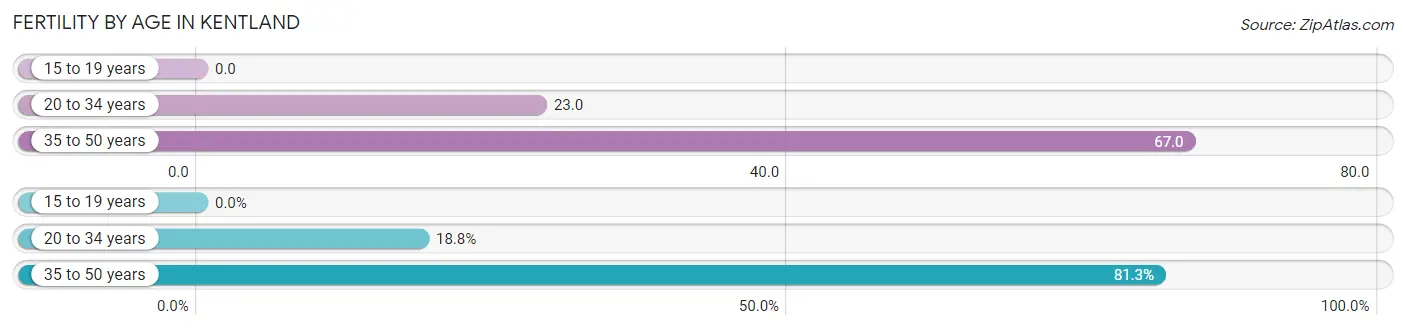
| Age Bracket | Women with Births | Births / 1,000 Women |
| 15 to 19 years | 0 (0.0%) | 0.0 |
| 20 to 34 years | 3 (18.8%) | 23.0 |
| 35 to 50 years | 13 (81.2%) | 67.0 |
| Total | 16 (100.0%) | 42.0 |
Fertility by Age by Marriage Status in Kentland
18.8% of women with births (16) in Kentland are married. The highest percentage of unmarried women with births falls into 35 to 50 years age bracket with 100.0% of them unmarried at the time of birth, while the lowest percentage of unmarried women with births belong to 20 to 34 years age bracket with 0.0% of them unmarried.
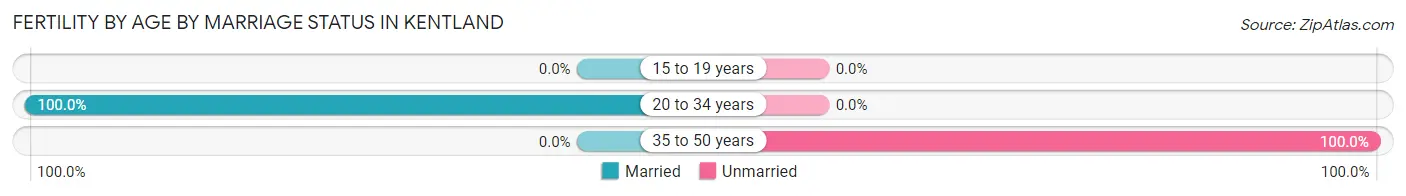
| Age Bracket | Married | Unmarried |
| 15 to 19 years | 0 (0.0%) | 0 (0.0%) |
| 20 to 34 years | 3 (100.0%) | 0 (0.0%) |
| 35 to 50 years | 0 (0.0%) | 13 (100.0%) |
| Total | 3 (18.8%) | 13 (81.2%) |
Fertility by Education in Kentland
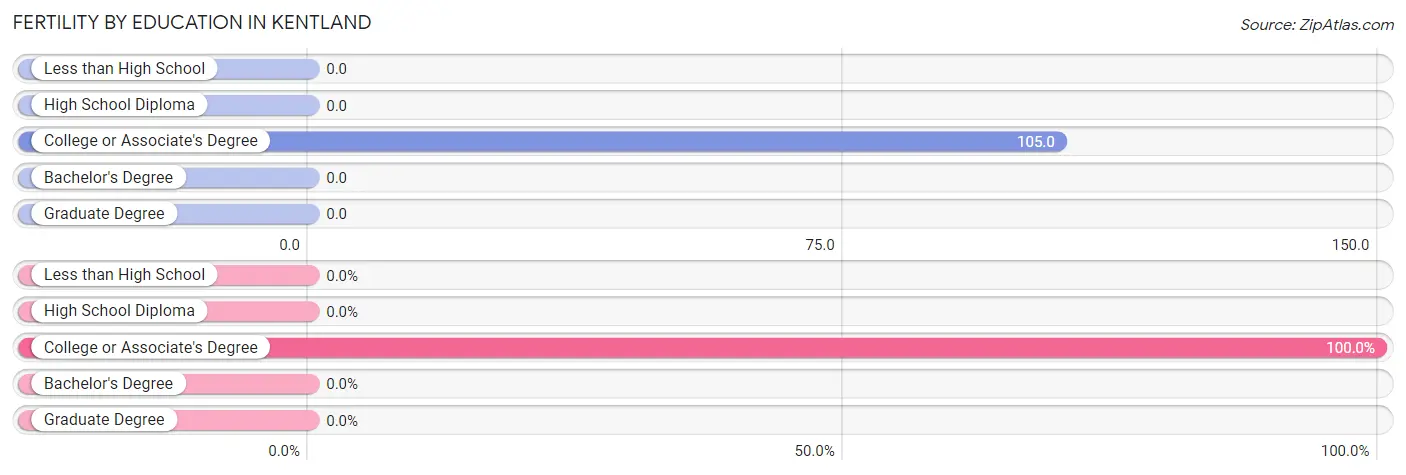
| Educational Attainment | Women with Births | Births / 1,000 Women |
| Less than High School | 0 (0.0%) | 0.0 |
| High School Diploma | 0 (0.0%) | 0.0 |
| College or Associate's Degree | 16 (100.0%) | 105.0 |
| Bachelor's Degree | 0 (0.0%) | 0.0 |
| Graduate Degree | 0 (0.0%) | 0.0 |
| Total | 16 (100.0%) | 42.0 |
Fertility by Education by Marriage Status in Kentland
81.2% of women with births in Kentland are unmarried. Women with the educational attainment of college or associate's degree are most likely to be married with 18.8% of them married at childbirth, while women with the educational attainment of college or associate's degree are least likely to be married with 81.2% of them unmarried at childbirth.
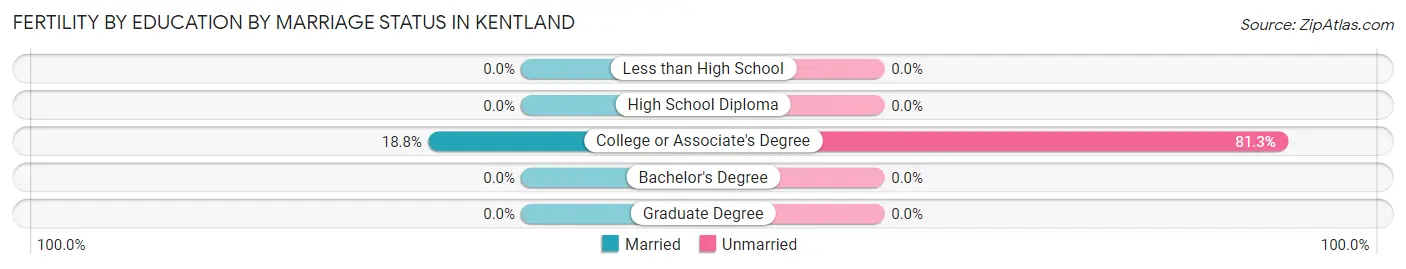
| Educational Attainment | Married | Unmarried |
| Less than High School | 0 (0.0%) | 0 (0.0%) |
| High School Diploma | 0 (0.0%) | 0 (0.0%) |
| College or Associate's Degree | 3 (18.8%) | 13 (81.2%) |
| Bachelor's Degree | 0 (0.0%) | 0 (0.0%) |
| Graduate Degree | 0 (0.0%) | 0 (0.0%) |
| Total | 3 (18.8%) | 13 (81.2%) |
Income in Kentland
Income Overview in Kentland
Per Capita Income in Kentland is $24,452, while median incomes of families and households are $72,944 and $55,329 respectively.
| Characteristic | Number | Measure |
| Per Capita Income | 1,810 | $24,452 |
| Median Family Income | 501 | $72,944 |
| Mean Family Income | 501 | $65,993 |
| Median Household Income | 800 | $55,329 |
| Mean Household Income | 800 | $56,889 |
| Income Deficit | 501 | $0 |
| Wage / Income Gap (%) | 1,810 | 34.72% |
| Wage / Income Gap ($) | 1,810 | 65.28¢ per $1 |
| Gini / Inequality Index | 1,810 | 0.34 |
Earnings by Sex in Kentland
Average Earnings in Kentland are $34,250, $41,086 for men and $26,821 for women, a difference of 34.7%.
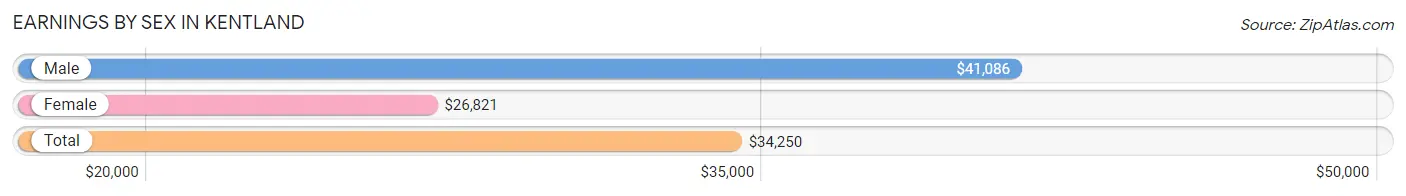
| Sex | Number | Average Earnings |
| Male | 504 (51.2%) | $41,086 |
| Female | 480 (48.8%) | $26,821 |
| Total | 984 (100.0%) | $34,250 |
Earnings by Sex by Income Bracket in Kentland
The most common earnings brackets in Kentland are $40,000 to $44,999 for men (158 | 31.4%) and $25,000 to $29,999 for women (87 | 18.1%).
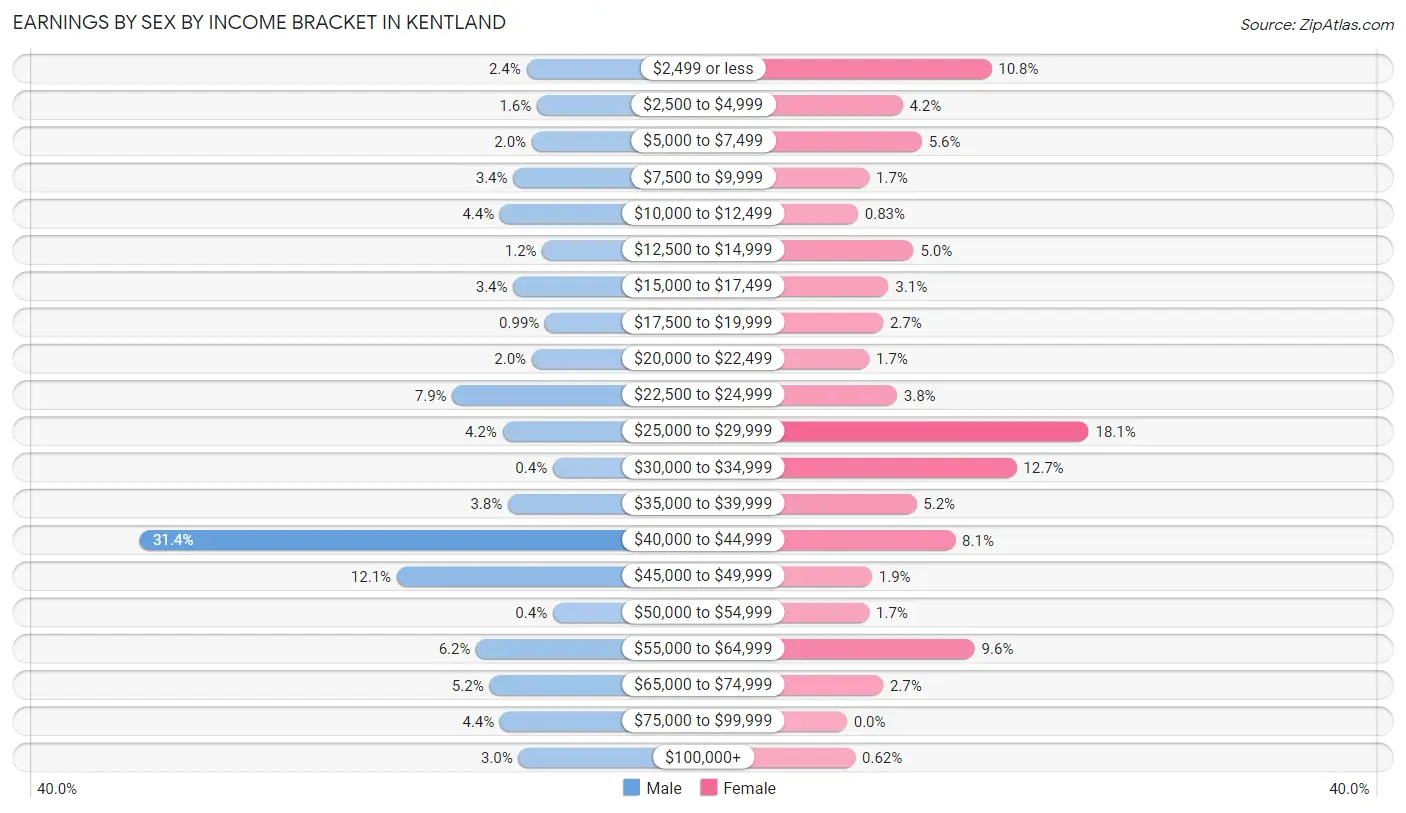
| Income | Male | Female |
| $2,499 or less | 12 (2.4%) | 52 (10.8%) |
| $2,500 to $4,999 | 8 (1.6%) | 20 (4.2%) |
| $5,000 to $7,499 | 10 (2.0%) | 27 (5.6%) |
| $7,500 to $9,999 | 17 (3.4%) | 8 (1.7%) |
| $10,000 to $12,499 | 22 (4.4%) | 4 (0.8%) |
| $12,500 to $14,999 | 6 (1.2%) | 24 (5.0%) |
| $15,000 to $17,499 | 17 (3.4%) | 15 (3.1%) |
| $17,500 to $19,999 | 5 (1.0%) | 13 (2.7%) |
| $20,000 to $22,499 | 10 (2.0%) | 8 (1.7%) |
| $22,500 to $24,999 | 40 (7.9%) | 18 (3.7%) |
| $25,000 to $29,999 | 21 (4.2%) | 87 (18.1%) |
| $30,000 to $34,999 | 2 (0.4%) | 61 (12.7%) |
| $35,000 to $39,999 | 19 (3.8%) | 25 (5.2%) |
| $40,000 to $44,999 | 158 (31.4%) | 39 (8.1%) |
| $45,000 to $49,999 | 61 (12.1%) | 9 (1.9%) |
| $50,000 to $54,999 | 2 (0.4%) | 8 (1.7%) |
| $55,000 to $64,999 | 31 (6.1%) | 46 (9.6%) |
| $65,000 to $74,999 | 26 (5.2%) | 13 (2.7%) |
| $75,000 to $99,999 | 22 (4.4%) | 0 (0.0%) |
| $100,000+ | 15 (3.0%) | 3 (0.6%) |
| Total | 504 (100.0%) | 480 (100.0%) |
Earnings by Sex by Educational Attainment in Kentland
Average earnings in Kentland are $41,422 for men and $30,833 for women, a difference of 25.6%. Men with an educational attainment of college or associate's degree enjoy the highest average annual earnings of $48,313, while those with high school diploma education earn the least with $40,357. Women with an educational attainment of graduate degree earn the most with the average annual earnings of $36,250, while those with high school diploma education have the smallest earnings of $18,571.
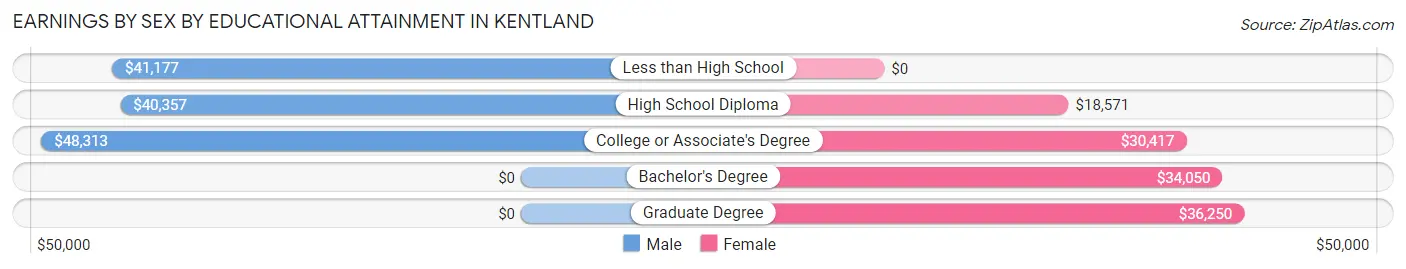
| Educational Attainment | Male Income | Female Income |
| Less than High School | $41,177 | $0 |
| High School Diploma | $40,357 | $18,571 |
| College or Associate's Degree | $48,313 | $30,417 |
| Bachelor's Degree | - | - |
| Graduate Degree | - | - |
| Total | $41,422 | $30,833 |
Family Income in Kentland
Family Income Brackets in Kentland
According to the Kentland family income data, there are 216 families falling into the $50,000 to $74,999 income range, which is the most common income bracket and makes up 43.1% of all families. Conversely, the $200,000+ income bracket is the least frequent group with only 1 families (0.2%) belonging to this category.
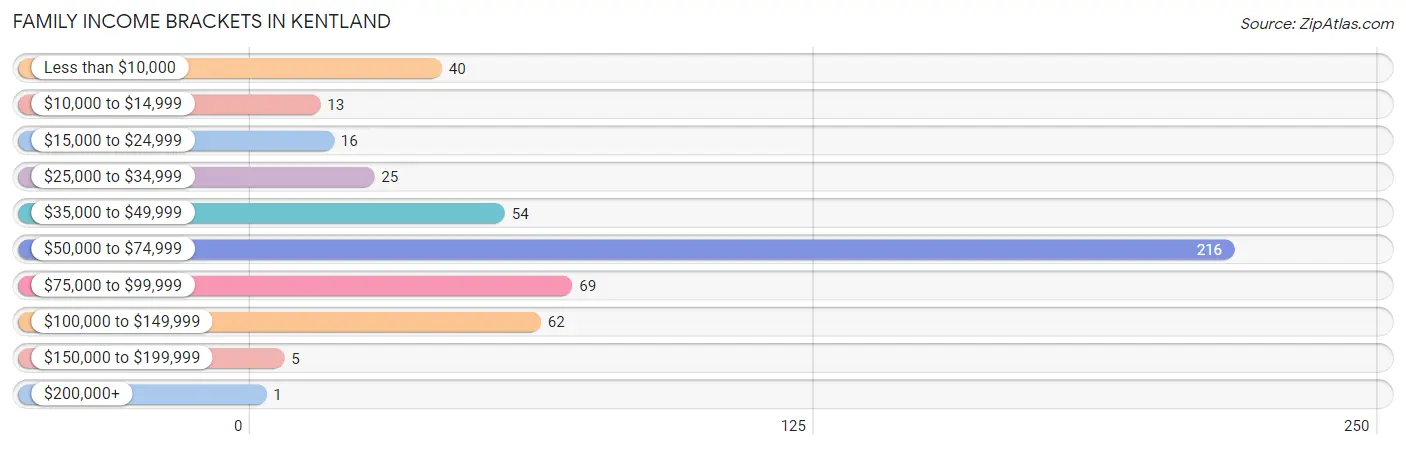
| Income Bracket | # Families | % Families |
| Less than $10,000 | 40 | 8.0% |
| $10,000 to $14,999 | 13 | 2.6% |
| $15,000 to $24,999 | 16 | 3.2% |
| $25,000 to $34,999 | 25 | 5.0% |
| $35,000 to $49,999 | 54 | 10.8% |
| $50,000 to $74,999 | 216 | 43.1% |
| $75,000 to $99,999 | 69 | 13.8% |
| $100,000 to $149,999 | 62 | 12.4% |
| $150,000 to $199,999 | 5 | 1.0% |
| $200,000+ | 1 | 0.2% |
Family Income by Famaliy Size in Kentland
2-person families (319 | 63.7%) account for the highest median family income in Kentland with $73,179 per family, while 2-person families (319 | 63.7%) have the highest median income of $36,590 per family member.
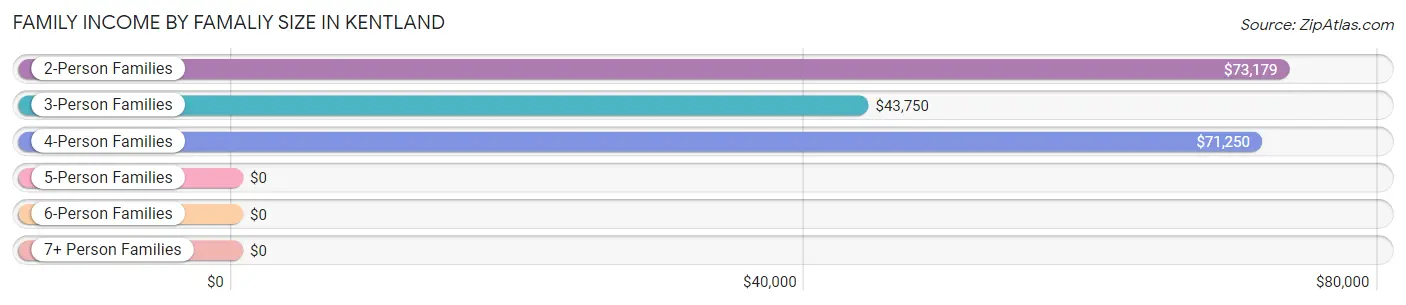
| Income Bracket | # Families | Median Income |
| 2-Person Families | 319 (63.7%) | $73,179 |
| 3-Person Families | 68 (13.6%) | $43,750 |
| 4-Person Families | 78 (15.6%) | $71,250 |
| 5-Person Families | 14 (2.8%) | $0 |
| 6-Person Families | 16 (3.2%) | $0 |
| 7+ Person Families | 6 (1.2%) | $0 |
| Total | 501 (100.0%) | $72,944 |
Family Income by Number of Earners in Kentland
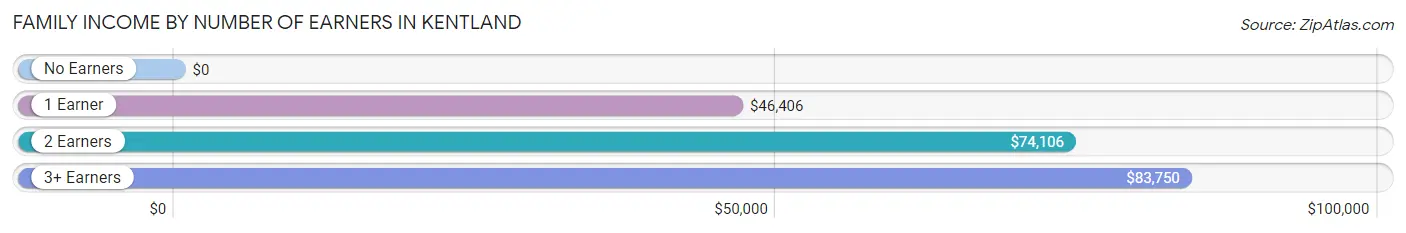
| Number of Earners | # Families | Median Income |
| No Earners | 60 (12.0%) | $0 |
| 1 Earner | 165 (32.9%) | $46,406 |
| 2 Earners | 260 (51.9%) | $74,106 |
| 3+ Earners | 16 (3.2%) | $83,750 |
| Total | 501 (100.0%) | $72,944 |
Household Income in Kentland
Household Income Brackets in Kentland
With 294 households falling in the category, the $50,000 to $74,999 income range is the most frequent in Kentland, accounting for 36.7% of all households. In contrast, only 2 households (0.3%) fall into the $200,000+ income bracket, making it the least populous group.
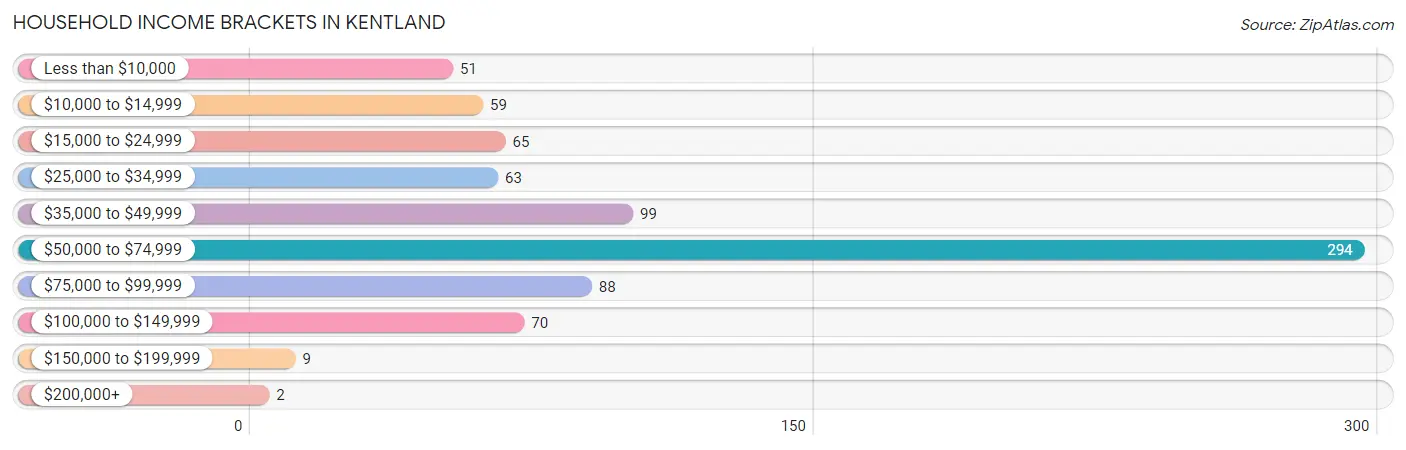
| Income Bracket | # Households | % Households |
| Less than $10,000 | 51 | 6.4% |
| $10,000 to $14,999 | 59 | 7.4% |
| $15,000 to $24,999 | 65 | 8.1% |
| $25,000 to $34,999 | 63 | 7.9% |
| $35,000 to $49,999 | 99 | 12.4% |
| $50,000 to $74,999 | 294 | 36.8% |
| $75,000 to $99,999 | 88 | 11.0% |
| $100,000 to $149,999 | 70 | 8.8% |
| $150,000 to $199,999 | 9 | 1.1% |
| $200,000+ | 2 | 0.3% |
Household Income by Householder Age in Kentland
The median household income in Kentland is $55,329, with the highest median household income of $73,221 found in the 45 to 64 years age bracket for the primary householder. A total of 325 households (40.6%) fall into this category. Meanwhile, the 65+ years age bracket for the primary householder has the lowest median household income of $34,750, with 205 households (25.6%) in this group.
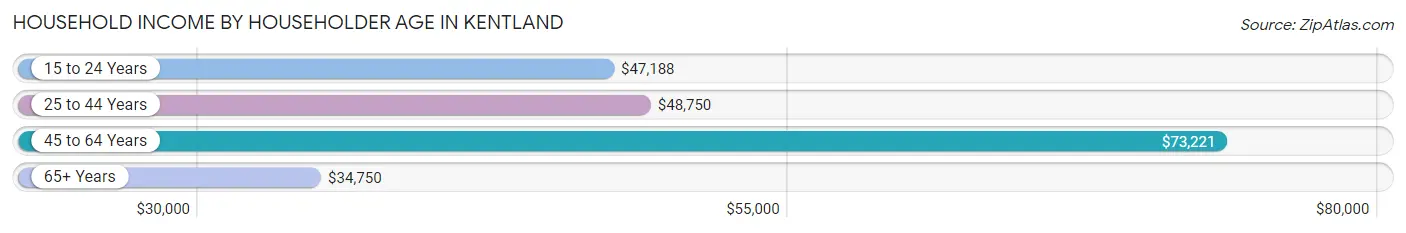
| Income Bracket | # Households | Median Income |
| 15 to 24 Years | 43 (5.4%) | $47,188 |
| 25 to 44 Years | 227 (28.4%) | $48,750 |
| 45 to 64 Years | 325 (40.6%) | $73,221 |
| 65+ Years | 205 (25.6%) | $34,750 |
| Total | 800 (100.0%) | $55,329 |
Poverty in Kentland
Income Below Poverty by Sex and Age in Kentland
With 23.5% poverty level for males and 20.8% for females among the residents of Kentland, 5 year old males and 12 to 14 year old females are the most vulnerable to poverty, with 9 males (75.0%) and 32 females (76.2%) in their respective age groups living below the poverty level.
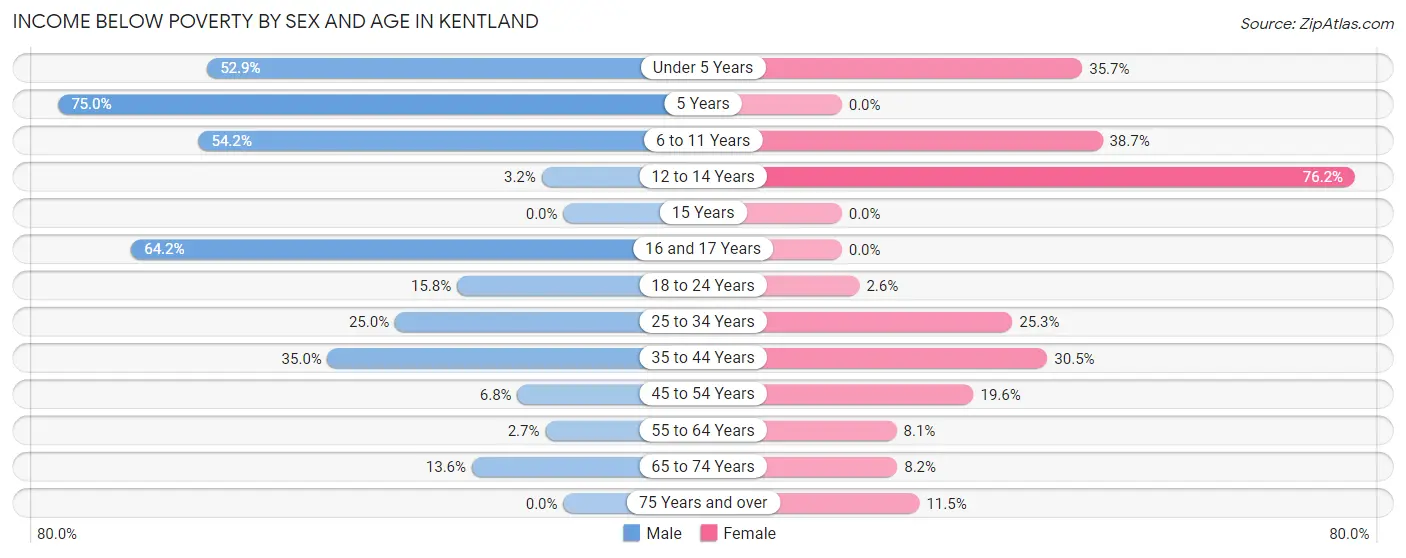
| Age Bracket | Male | Female |
| Under 5 Years | 55 (52.9%) | 25 (35.7%) |
| 5 Years | 9 (75.0%) | 0 (0.0%) |
| 6 to 11 Years | 26 (54.2%) | 24 (38.7%) |
| 12 to 14 Years | 1 (3.2%) | 32 (76.2%) |
| 15 Years | 0 (0.0%) | 0 (0.0%) |
| 16 and 17 Years | 34 (64.1%) | 0 (0.0%) |
| 18 to 24 Years | 3 (15.8%) | 2 (2.6%) |
| 25 to 34 Years | 22 (25.0%) | 19 (25.3%) |
| 35 to 44 Years | 28 (35.0%) | 40 (30.5%) |
| 45 to 54 Years | 3 (6.8%) | 18 (19.6%) |
| 55 to 64 Years | 6 (2.7%) | 14 (8.1%) |
| 65 to 74 Years | 14 (13.6%) | 7 (8.2%) |
| 75 Years and over | 0 (0.0%) | 6 (11.5%) |
| Total | 201 (23.5%) | 187 (20.8%) |
Income Above Poverty by Sex and Age in Kentland
According to the poverty statistics in Kentland, males aged 15 years and females aged 5 years are the age groups that are most secure financially, with 100.0% of males and 100.0% of females in these age groups living above the poverty line.
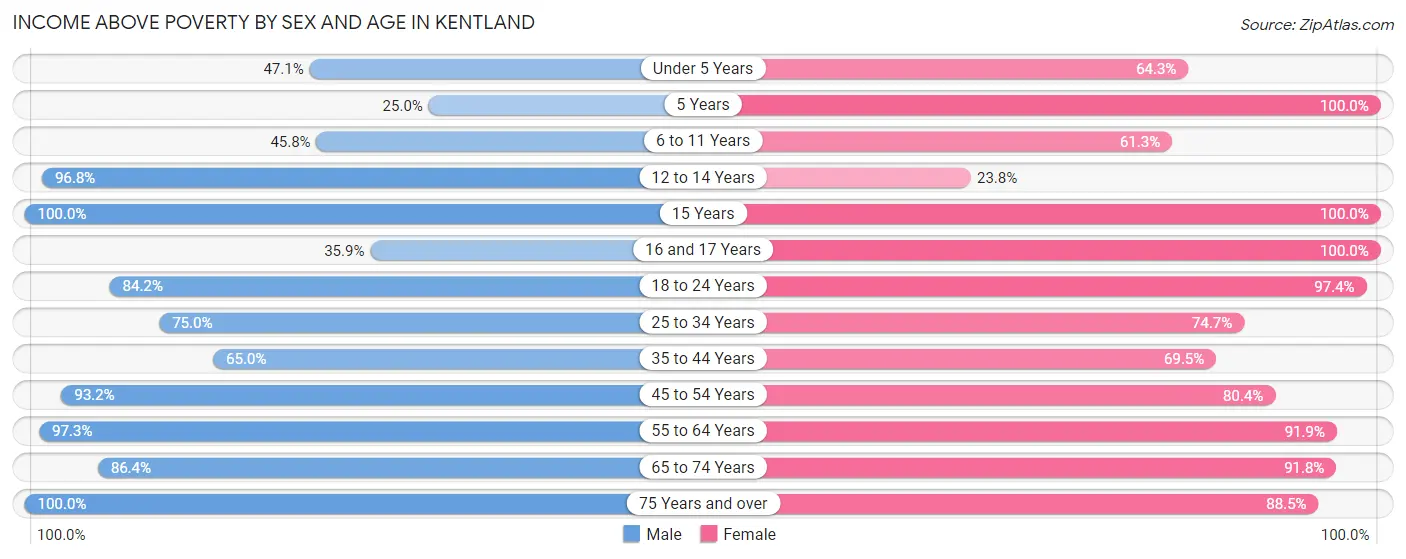
| Age Bracket | Male | Female |
| Under 5 Years | 49 (47.1%) | 45 (64.3%) |
| 5 Years | 3 (25.0%) | 4 (100.0%) |
| 6 to 11 Years | 22 (45.8%) | 38 (61.3%) |
| 12 to 14 Years | 30 (96.8%) | 10 (23.8%) |
| 15 Years | 12 (100.0%) | 6 (100.0%) |
| 16 and 17 Years | 19 (35.8%) | 33 (100.0%) |
| 18 to 24 Years | 16 (84.2%) | 74 (97.4%) |
| 25 to 34 Years | 66 (75.0%) | 56 (74.7%) |
| 35 to 44 Years | 52 (65.0%) | 91 (69.5%) |
| 45 to 54 Years | 41 (93.2%) | 74 (80.4%) |
| 55 to 64 Years | 218 (97.3%) | 158 (91.9%) |
| 65 to 74 Years | 89 (86.4%) | 78 (91.8%) |
| 75 Years and over | 38 (100.0%) | 46 (88.5%) |
| Total | 655 (76.5%) | 713 (79.2%) |
Income Below Poverty Among Married-Couple Families in Kentland
The poverty statistics for married-couple families in Kentland show that 3.2% or 12 of the total 372 families live below the poverty line. Families with 3 or 4 children have the highest poverty rate of 28.6%, comprising of 6 families. On the other hand, families with no children have the lowest poverty rate of 0.0%, which includes 0 families.
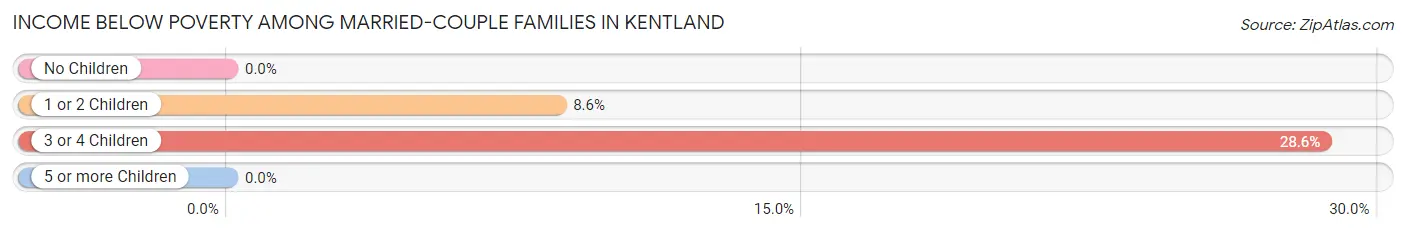
| Children | Above Poverty | Below Poverty |
| No Children | 275 (100.0%) | 0 (0.0%) |
| 1 or 2 Children | 64 (91.4%) | 6 (8.6%) |
| 3 or 4 Children | 15 (71.4%) | 6 (28.6%) |
| 5 or more Children | 6 (100.0%) | 0 (0.0%) |
| Total | 360 (96.8%) | 12 (3.2%) |
Income Below Poverty Among Single-Parent Households in Kentland
According to the poverty data in Kentland, 60.0% or 18 single-father households and 41.4% or 41 single-mother households are living below the poverty line. Among single-father households, those with 1 or 2 children have the highest poverty rate, with 11 households (64.7%) experiencing poverty. Likewise, among single-mother households, those with 3 or 4 children have the highest poverty rate, with 18 households (100.0%) falling below the poverty line.
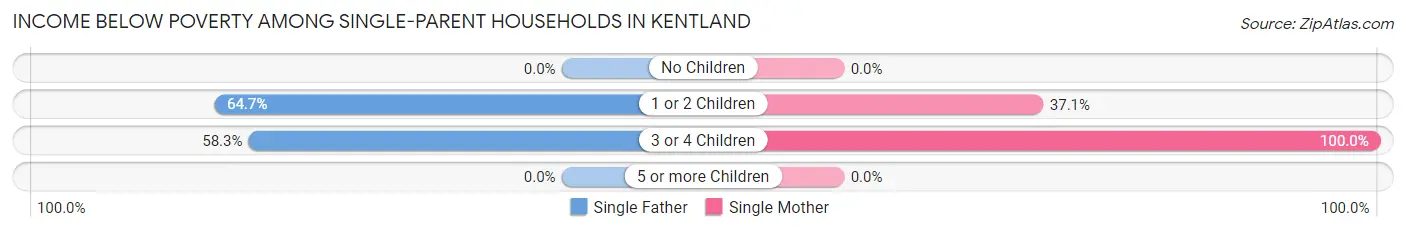
| Children | Single Father | Single Mother |
| No Children | 0 (0.0%) | 0 (0.0%) |
| 1 or 2 Children | 11 (64.7%) | 23 (37.1%) |
| 3 or 4 Children | 7 (58.3%) | 18 (100.0%) |
| 5 or more Children | 0 (0.0%) | 0 (0.0%) |
| Total | 18 (60.0%) | 41 (41.4%) |
Income Below Poverty Among Married-Couple vs Single-Parent Households in Kentland
The poverty data for Kentland shows that 12 of the married-couple family households (3.2%) and 59 of the single-parent households (45.7%) are living below the poverty level. Within the married-couple family households, those with 3 or 4 children have the highest poverty rate, with 6 households (28.6%) falling below the poverty line. Among the single-parent households, those with 3 or 4 children have the highest poverty rate, with 25 household (83.3%) living below poverty.
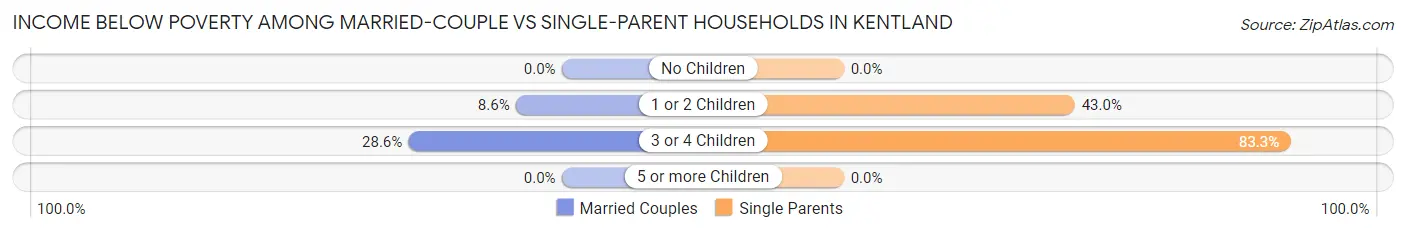
| Children | Married-Couple Families | Single-Parent Households |
| No Children | 0 (0.0%) | 0 (0.0%) |
| 1 or 2 Children | 6 (8.6%) | 34 (43.0%) |
| 3 or 4 Children | 6 (28.6%) | 25 (83.3%) |
| 5 or more Children | 0 (0.0%) | 0 (0.0%) |
| Total | 12 (3.2%) | 59 (45.7%) |
Employment Characteristics in Kentland
Employment by Class of Employer in Kentland
Among the 718 employed individuals in Kentland, private company employees (525 | 73.1%), not-for-profit organizations (61 | 8.5%), and local government employees (47 | 6.6%) make up the most common classes of employment.
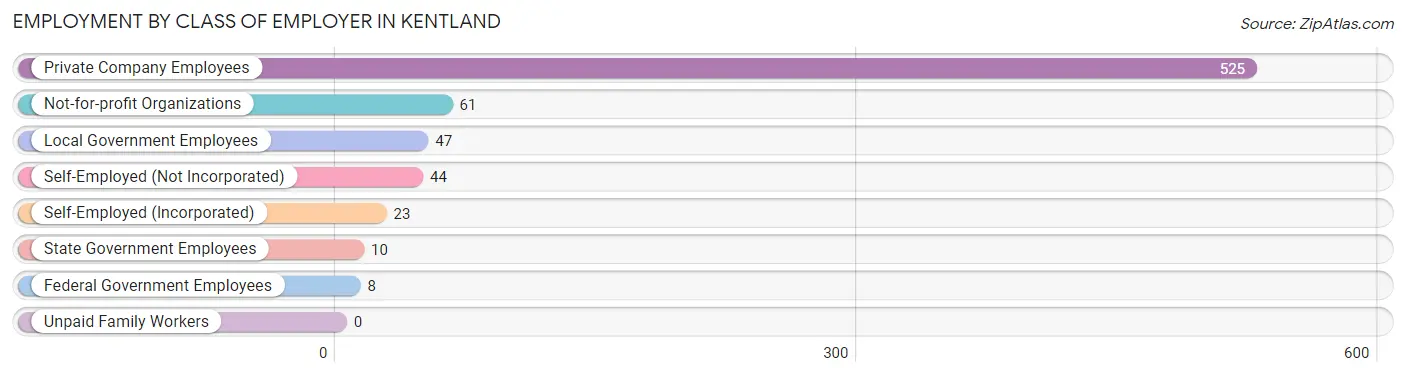
| Employer Class | # Employees | % Employees |
| Private Company Employees | 525 | 73.1% |
| Self-Employed (Incorporated) | 23 | 3.2% |
| Self-Employed (Not Incorporated) | 44 | 6.1% |
| Not-for-profit Organizations | 61 | 8.5% |
| Local Government Employees | 47 | 6.6% |
| State Government Employees | 10 | 1.4% |
| Federal Government Employees | 8 | 1.1% |
| Unpaid Family Workers | 0 | 0.0% |
| Total | 718 | 100.0% |
Employment Status by Age in Kentland
According to the labor force statistics for Kentland, out of the total population over 16 years of age (1,412), 63.9% or 902 individuals are in the labor force, with 20.0% or 180 of them unemployed. The age group with the highest labor force participation rate is 20 to 24 years, with 100.0% or 61 individuals in the labor force. Within the labor force, the 55 to 59 years age range has the highest percentage of unemployed individuals, with 52.0% or 140 of them being unemployed.
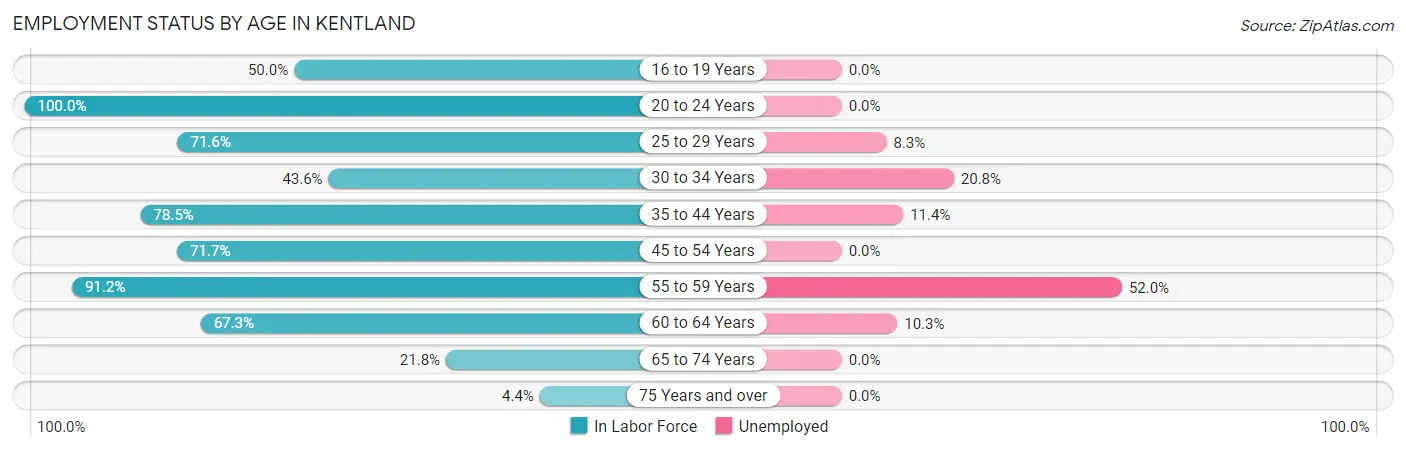
| Age Bracket | In Labor Force | Unemployed |
| 16 to 19 Years | 60 (50.0%) | 0 (0.0%) |
| 20 to 24 Years | 61 (100.0%) | 0 (0.0%) |
| 25 to 29 Years | 96 (71.6%) | 8 (8.3%) |
| 30 to 34 Years | 24 (43.6%) | 5 (20.8%) |
| 35 to 44 Years | 175 (78.5%) | 20 (11.4%) |
| 45 to 54 Years | 104 (71.7%) | 0 (0.0%) |
| 55 to 59 Years | 269 (91.2%) | 140 (52.0%) |
| 60 to 64 Years | 68 (67.3%) | 7 (10.3%) |
| 65 to 74 Years | 41 (21.8%) | 0 (0.0%) |
| 75 Years and over | 4 (4.4%) | 0 (0.0%) |
| Total | 902 (63.9%) | 180 (20.0%) |
Employment Status by Educational Attainment in Kentland
According to labor force statistics for Kentland, 77.2% of individuals (736) out of the total population between 25 and 64 years of age (953) are in the labor force, with 24.5% or 180 of them being unemployed. The group with the highest labor force participation rate are those with the educational attainment of bachelor's degree or higher, with 92.3% or 167 individuals in the labor force. Within the labor force, individuals with less than high school education have the highest percentage of unemployment, with 82.8% or 144 of them being unemployed.
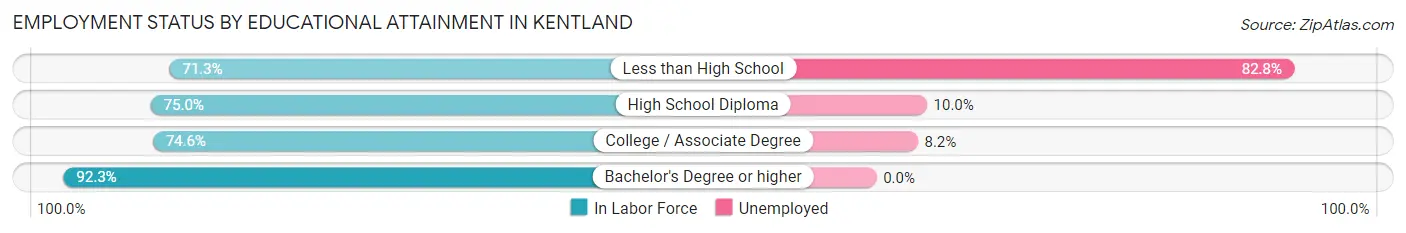
| Educational Attainment | In Labor Force | Unemployed |
| Less than High School | 174 (71.3%) | 202 (82.8%) |
| High School Diploma | 201 (75.0%) | 27 (10.0%) |
| College / Associate Degree | 194 (74.6%) | 21 (8.2%) |
| Bachelor's Degree or higher | 167 (92.3%) | 0 (0.0%) |
| Total | 736 (77.2%) | 233 (24.5%) |
Employment Occupations by Sex in Kentland
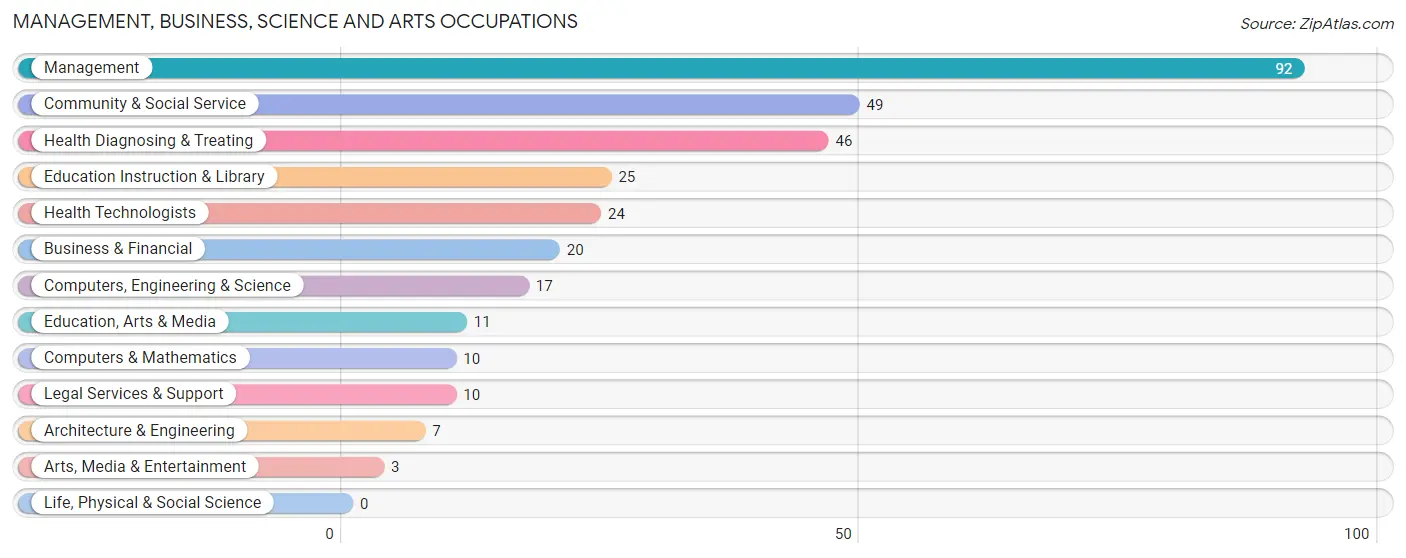
Management, Business, Science and Arts Occupations
The most common Management, Business, Science and Arts occupations in Kentland are Management (92 | 12.7%), Community & Social Service (49 | 6.8%), Health Diagnosing & Treating (46 | 6.4%), Education Instruction & Library (25 | 3.5%), and Health Technologists (24 | 3.3%).
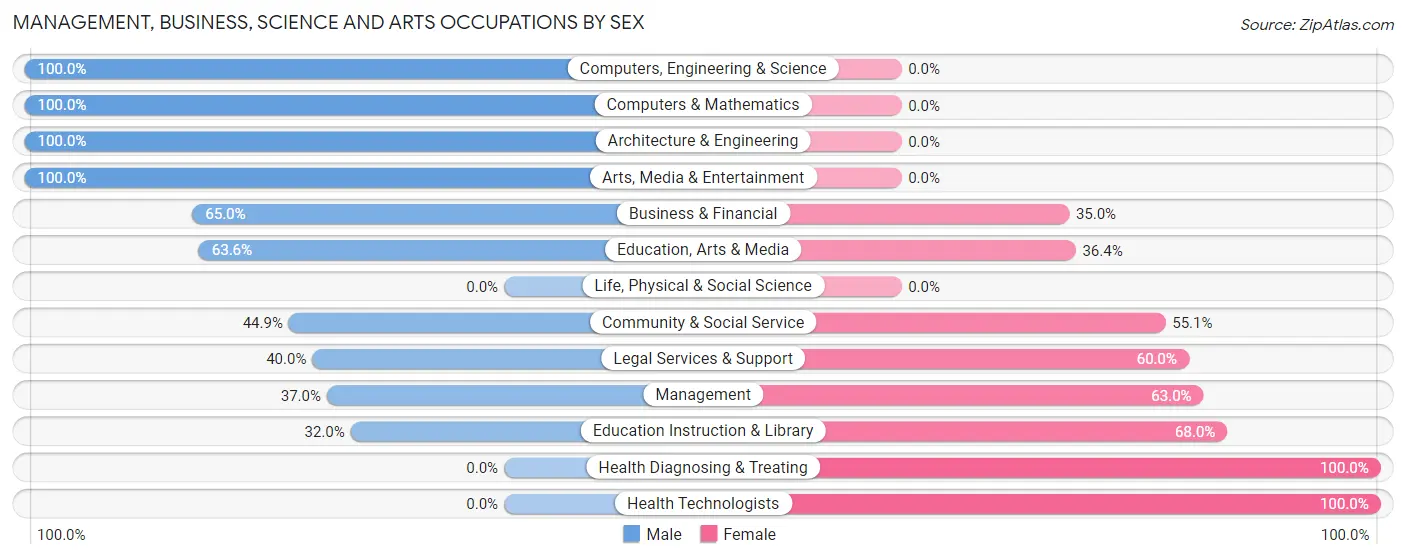
Management, Business, Science and Arts Occupations by Sex
Within the Management, Business, Science and Arts occupations in Kentland, the most male-oriented occupations are Computers, Engineering & Science (100.0%), Computers & Mathematics (100.0%), and Architecture & Engineering (100.0%), while the most female-oriented occupations are Health Diagnosing & Treating (100.0%), Health Technologists (100.0%), and Education Instruction & Library (68.0%).
| Occupation | Male | Female |
| Management | 34 (37.0%) | 58 (63.0%) |
| Business & Financial | 13 (65.0%) | 7 (35.0%) |
| Computers, Engineering & Science | 17 (100.0%) | 0 (0.0%) |
| Computers & Mathematics | 10 (100.0%) | 0 (0.0%) |
| Architecture & Engineering | 7 (100.0%) | 0 (0.0%) |
| Life, Physical & Social Science | 0 (0.0%) | 0 (0.0%) |
| Community & Social Service | 22 (44.9%) | 27 (55.1%) |
| Education, Arts & Media | 7 (63.6%) | 4 (36.4%) |
| Legal Services & Support | 4 (40.0%) | 6 (60.0%) |
| Education Instruction & Library | 8 (32.0%) | 17 (68.0%) |
| Arts, Media & Entertainment | 3 (100.0%) | 0 (0.0%) |
| Health Diagnosing & Treating | 0 (0.0%) | 46 (100.0%) |
| Health Technologists | 0 (0.0%) | 24 (100.0%) |
| Total (Category) | 86 (38.4%) | 138 (61.6%) |
| Total (Overall) | 292 (40.4%) | 430 (59.6%) |
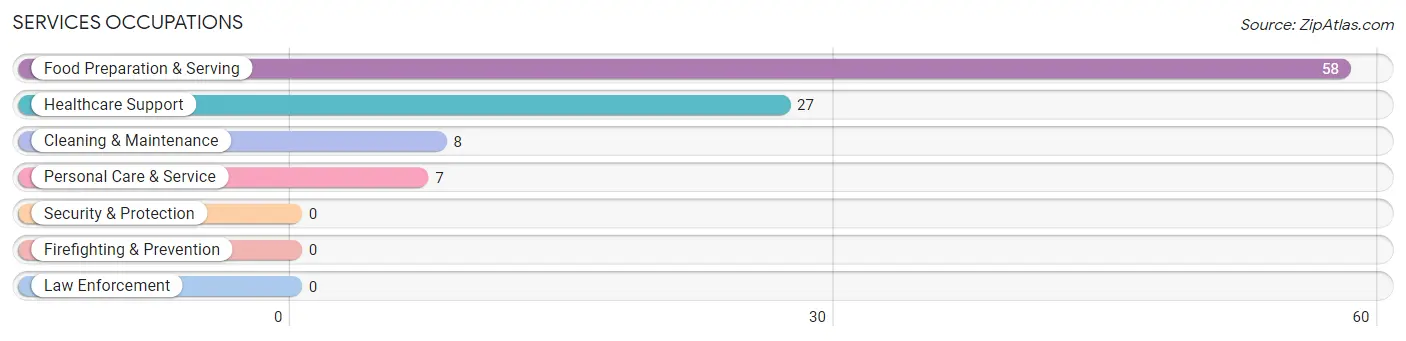
Services Occupations
The most common Services occupations in Kentland are Food Preparation & Serving (58 | 8.0%), Healthcare Support (27 | 3.7%), Cleaning & Maintenance (8 | 1.1%), and Personal Care & Service (7 | 1.0%).
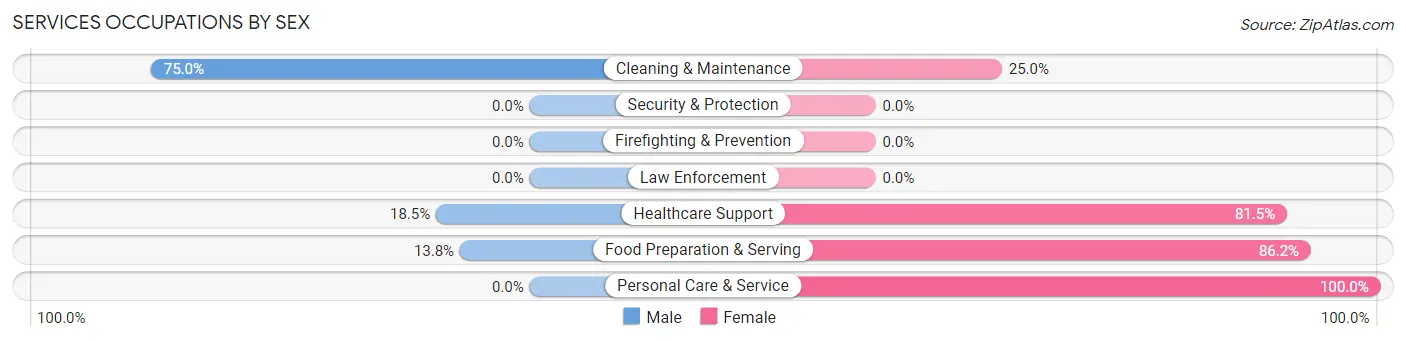
Services Occupations by Sex
Within the Services occupations in Kentland, the most male-oriented occupations are Cleaning & Maintenance (75.0%), Healthcare Support (18.5%), and Food Preparation & Serving (13.8%), while the most female-oriented occupations are Personal Care & Service (100.0%), Food Preparation & Serving (86.2%), and Healthcare Support (81.5%).
| Occupation | Male | Female |
| Healthcare Support | 5 (18.5%) | 22 (81.5%) |
| Security & Protection | 0 (0.0%) | 0 (0.0%) |
| Firefighting & Prevention | 0 (0.0%) | 0 (0.0%) |
| Law Enforcement | 0 (0.0%) | 0 (0.0%) |
| Food Preparation & Serving | 8 (13.8%) | 50 (86.2%) |
| Cleaning & Maintenance | 6 (75.0%) | 2 (25.0%) |
| Personal Care & Service | 0 (0.0%) | 7 (100.0%) |
| Total (Category) | 19 (19.0%) | 81 (81.0%) |
| Total (Overall) | 292 (40.4%) | 430 (59.6%) |
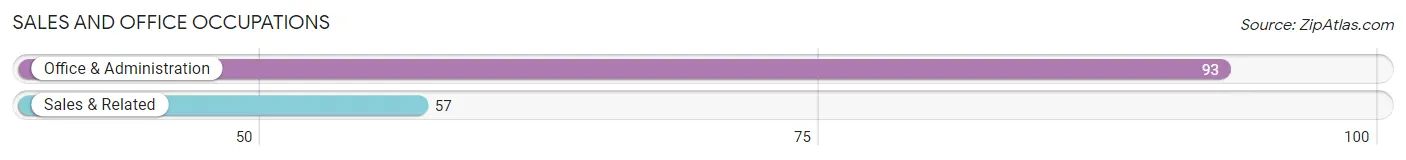
Sales and Office Occupations
The most common Sales and Office occupations in Kentland are Office & Administration (93 | 12.9%), and Sales & Related (57 | 7.9%).
Sales and Office Occupations by Sex
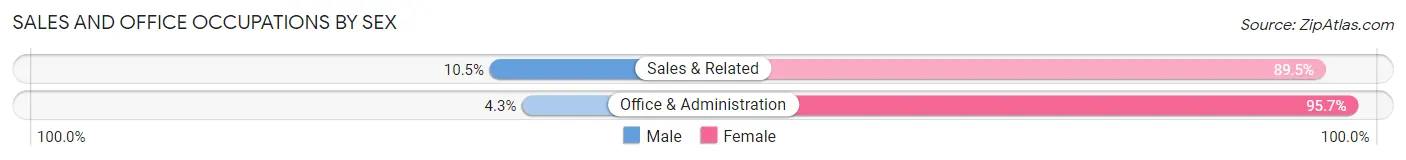
| Occupation | Male | Female |
| Sales & Related | 6 (10.5%) | 51 (89.5%) |
| Office & Administration | 4 (4.3%) | 89 (95.7%) |
| Total (Category) | 10 (6.7%) | 140 (93.3%) |
| Total (Overall) | 292 (40.4%) | 430 (59.6%) |
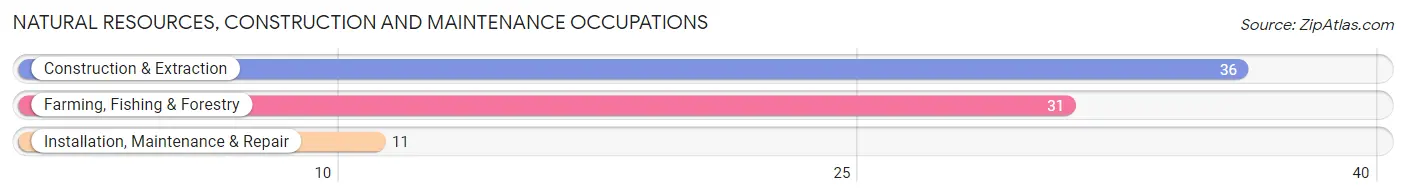
Natural Resources, Construction and Maintenance Occupations
The most common Natural Resources, Construction and Maintenance occupations in Kentland are Construction & Extraction (36 | 5.0%), Farming, Fishing & Forestry (31 | 4.3%), and Installation, Maintenance & Repair (11 | 1.5%).
Natural Resources, Construction and Maintenance Occupations by Sex
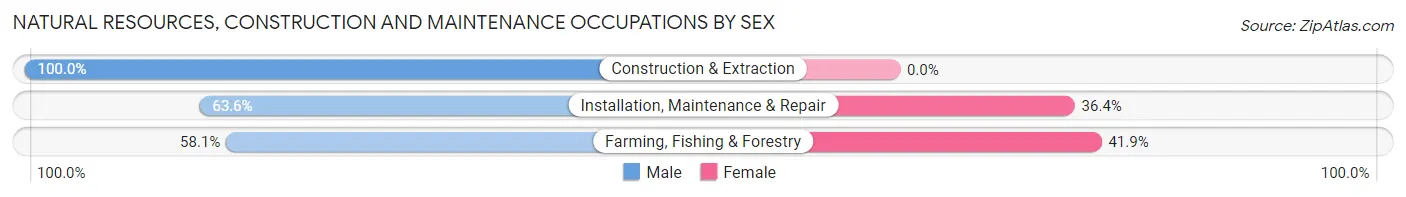
| Occupation | Male | Female |
| Farming, Fishing & Forestry | 18 (58.1%) | 13 (41.9%) |
| Construction & Extraction | 36 (100.0%) | 0 (0.0%) |
| Installation, Maintenance & Repair | 7 (63.6%) | 4 (36.4%) |
| Total (Category) | 61 (78.2%) | 17 (21.8%) |
| Total (Overall) | 292 (40.4%) | 430 (59.6%) |
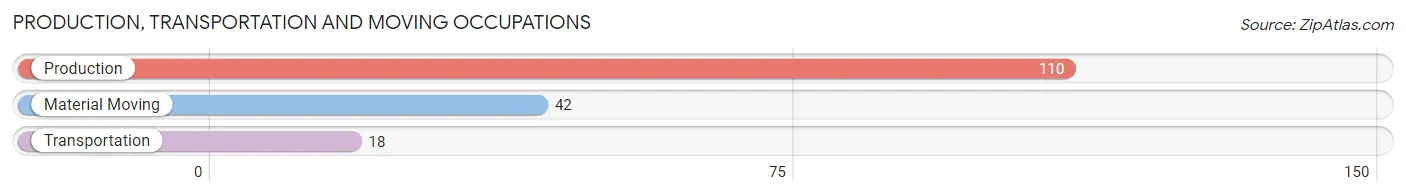
Production, Transportation and Moving Occupations
The most common Production, Transportation and Moving occupations in Kentland are Production (110 | 15.2%), Material Moving (42 | 5.8%), and Transportation (18 | 2.5%).
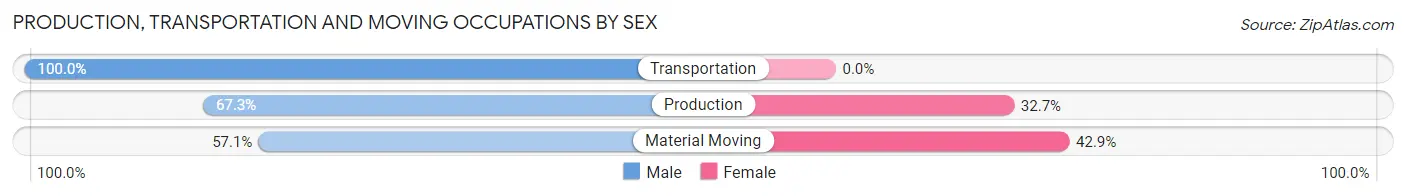
Production, Transportation and Moving Occupations by Sex
| Occupation | Male | Female |
| Production | 74 (67.3%) | 36 (32.7%) |
| Transportation | 18 (100.0%) | 0 (0.0%) |
| Material Moving | 24 (57.1%) | 18 (42.9%) |
| Total (Category) | 116 (68.2%) | 54 (31.8%) |
| Total (Overall) | 292 (40.4%) | 430 (59.6%) |
Employment Industries by Sex in Kentland
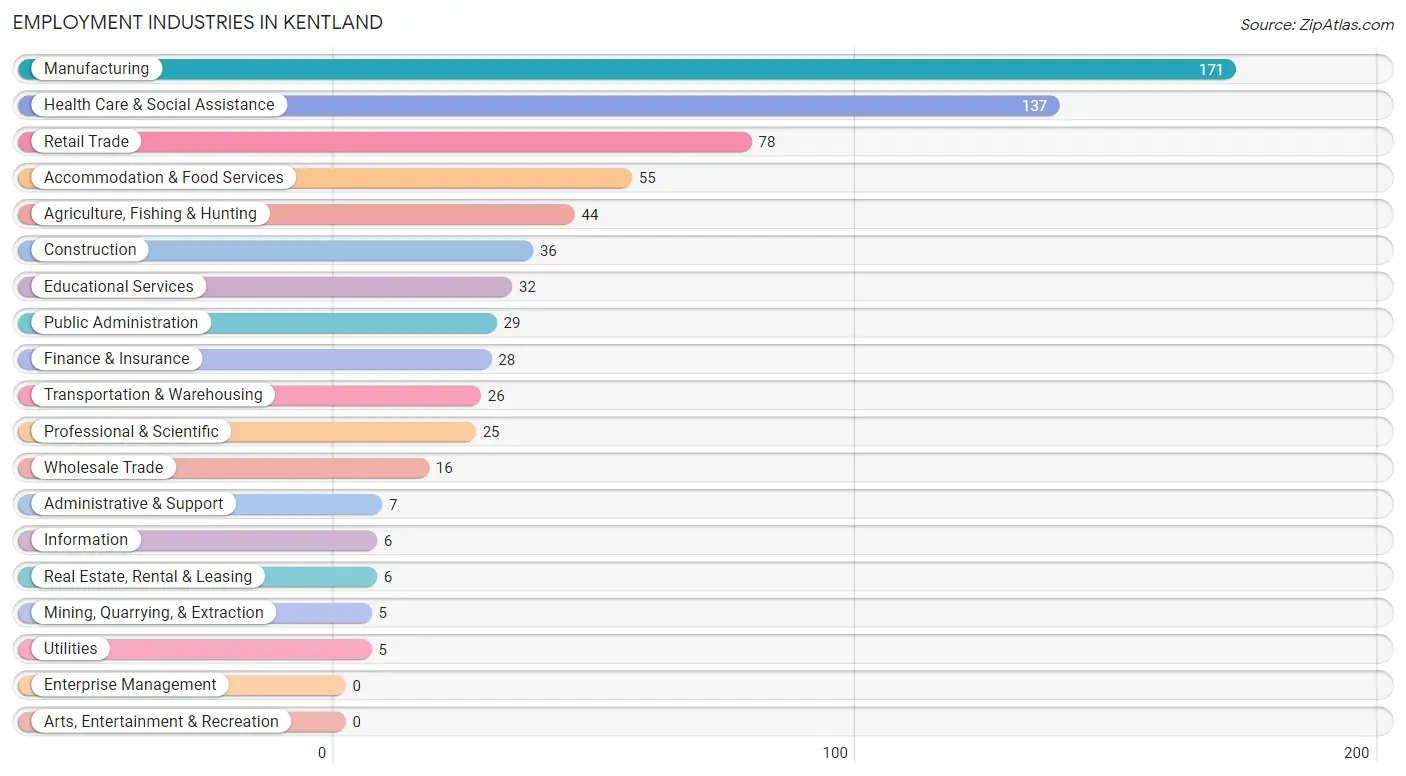
Employment Industries in Kentland
The major employment industries in Kentland include Manufacturing (171 | 23.7%), Health Care & Social Assistance (137 | 19.0%), Retail Trade (78 | 10.8%), Accommodation & Food Services (55 | 7.6%), and Agriculture, Fishing & Hunting (44 | 6.1%).
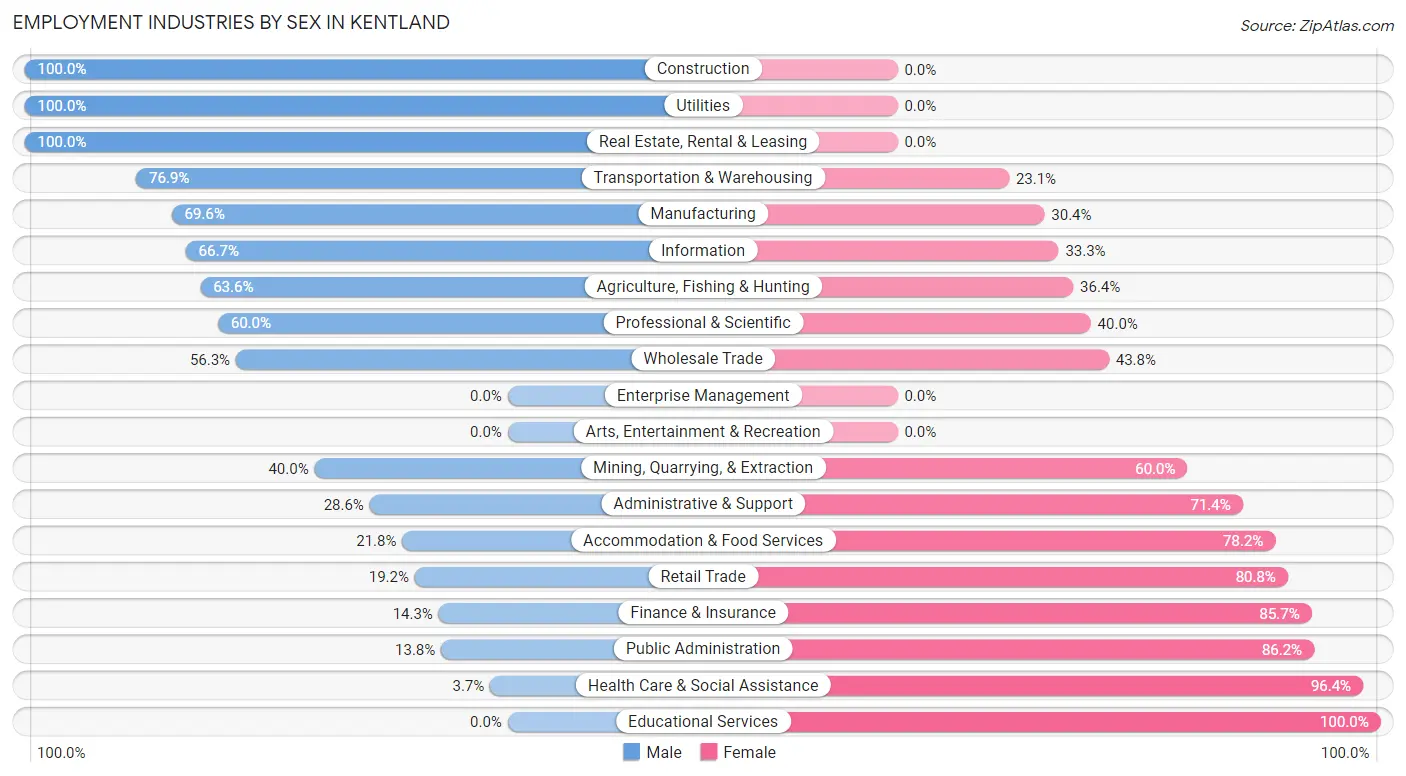
Employment Industries by Sex in Kentland
The Kentland industries that see more men than women are Construction (100.0%), Utilities (100.0%), and Real Estate, Rental & Leasing (100.0%), whereas the industries that tend to have a higher number of women are Educational Services (100.0%), Health Care & Social Assistance (96.4%), and Public Administration (86.2%).
| Industry | Male | Female |
| Agriculture, Fishing & Hunting | 28 (63.6%) | 16 (36.4%) |
| Mining, Quarrying, & Extraction | 2 (40.0%) | 3 (60.0%) |
| Construction | 36 (100.0%) | 0 (0.0%) |
| Manufacturing | 119 (69.6%) | 52 (30.4%) |
| Wholesale Trade | 9 (56.2%) | 7 (43.8%) |
| Retail Trade | 15 (19.2%) | 63 (80.8%) |
| Transportation & Warehousing | 20 (76.9%) | 6 (23.1%) |
| Utilities | 5 (100.0%) | 0 (0.0%) |
| Information | 4 (66.7%) | 2 (33.3%) |
| Finance & Insurance | 4 (14.3%) | 24 (85.7%) |
| Real Estate, Rental & Leasing | 6 (100.0%) | 0 (0.0%) |
| Professional & Scientific | 15 (60.0%) | 10 (40.0%) |
| Enterprise Management | 0 (0.0%) | 0 (0.0%) |
| Administrative & Support | 2 (28.6%) | 5 (71.4%) |
| Educational Services | 0 (0.0%) | 32 (100.0%) |
| Health Care & Social Assistance | 5 (3.6%) | 132 (96.4%) |
| Arts, Entertainment & Recreation | 0 (0.0%) | 0 (0.0%) |
| Accommodation & Food Services | 12 (21.8%) | 43 (78.2%) |
| Public Administration | 4 (13.8%) | 25 (86.2%) |
| Total | 292 (40.4%) | 430 (59.6%) |
Education in Kentland
School Enrollment in Kentland
The most common levels of schooling among the 365 students in Kentland are high school (119 | 32.6%), middle school (106 | 29.0%), and elementary school (60 | 16.4%).
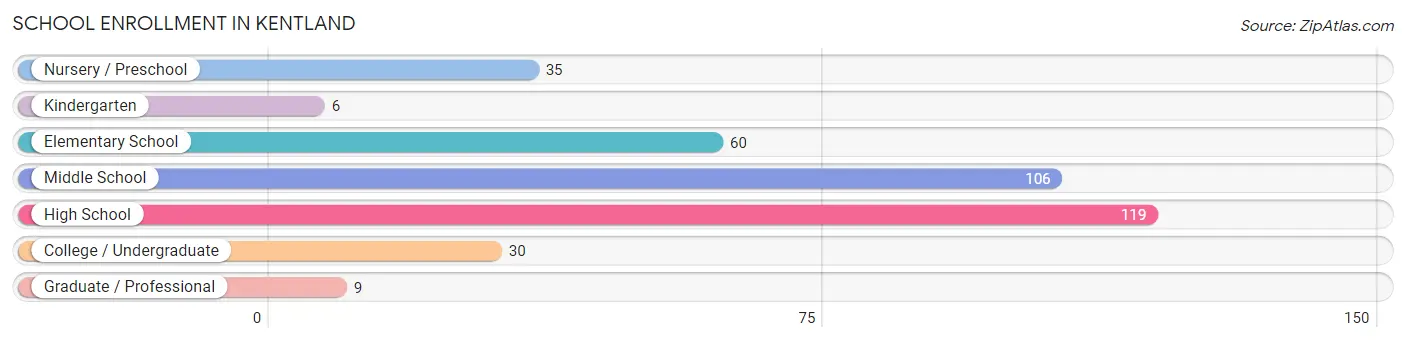
| School Level | # Students | % Students |
| Nursery / Preschool | 35 | 9.6% |
| Kindergarten | 6 | 1.6% |
| Elementary School | 60 | 16.4% |
| Middle School | 106 | 29.0% |
| High School | 119 | 32.6% |
| College / Undergraduate | 30 | 8.2% |
| Graduate / Professional | 9 | 2.5% |
| Total | 365 | 100.0% |
School Enrollment by Age by Funding Source in Kentland
Out of a total of 365 students who are enrolled in schools in Kentland, 54 (14.8%) attend a private institution, while the remaining 311 (85.2%) are enrolled in public schools. The age group of 25 to 34 year olds has the highest likelihood of being enrolled in private schools, with 1 (100.0% in the age bracket) enrolled. Conversely, the age group of 18 to 19 year olds has the lowest likelihood of being enrolled in a private school, with 21 (100.0% in the age bracket) attending a public institution.
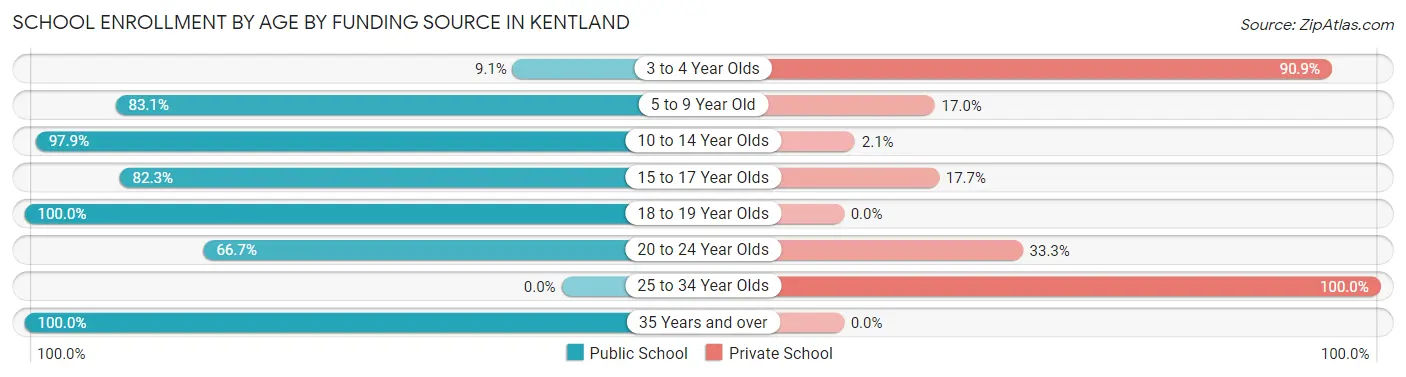
| Age Bracket | Public School | Private School |
| 3 to 4 Year Olds | 2 (9.1%) | 20 (90.9%) |
| 5 to 9 Year Old | 49 (83.1%) | 10 (17.0%) |
| 10 to 14 Year Olds | 141 (97.9%) | 3 (2.1%) |
| 15 to 17 Year Olds | 79 (82.3%) | 17 (17.7%) |
| 18 to 19 Year Olds | 21 (100.0%) | 0 (0.0%) |
| 20 to 24 Year Olds | 6 (66.7%) | 3 (33.3%) |
| 25 to 34 Year Olds | 0 (0.0%) | 1 (100.0%) |
| 35 Years and over | 13 (100.0%) | 0 (0.0%) |
| Total | 311 (85.2%) | 54 (14.8%) |
Educational Attainment by Field of Study in Kentland
Psychology (50 | 20.9%), education (42 | 17.6%), bio, nature & agricultural (39 | 16.3%), science & technology (26 | 10.9%), and liberal arts & history (22 | 9.2%) are the most common fields of study among 239 individuals in Kentland who have obtained a bachelor's degree or higher.
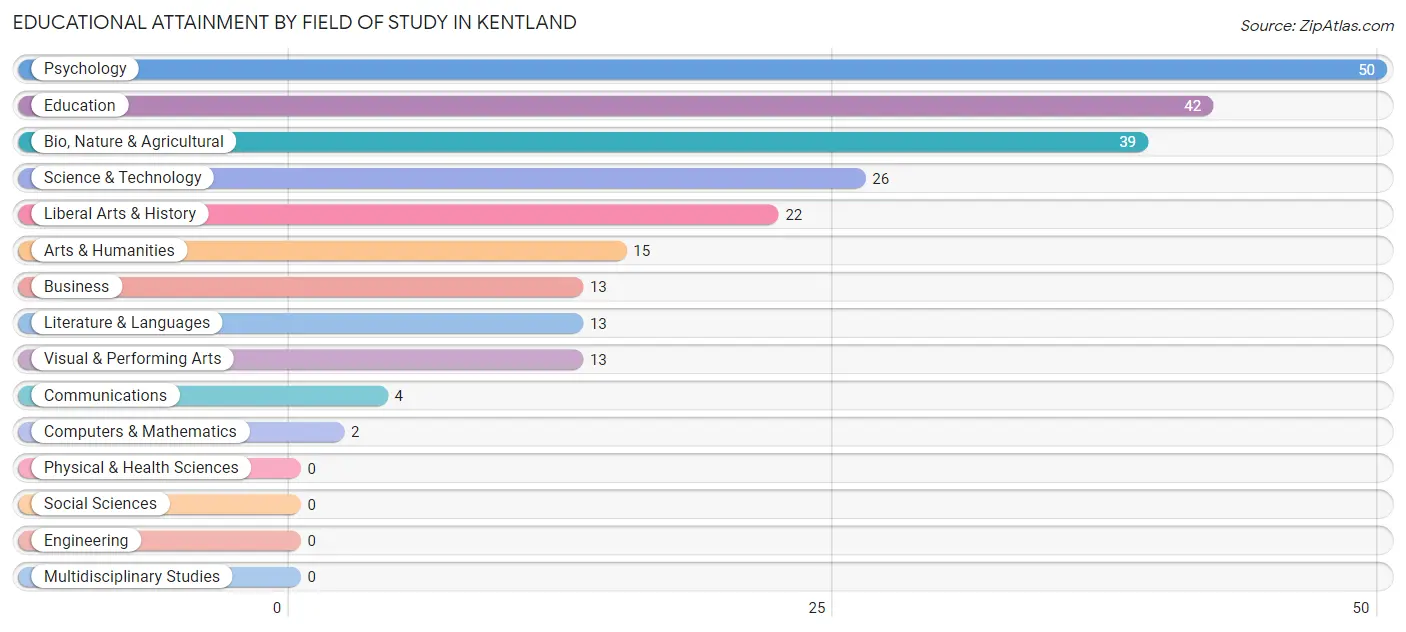
| Field of Study | # Graduates | % Graduates |
| Computers & Mathematics | 2 | 0.8% |
| Bio, Nature & Agricultural | 39 | 16.3% |
| Physical & Health Sciences | 0 | 0.0% |
| Psychology | 50 | 20.9% |
| Social Sciences | 0 | 0.0% |
| Engineering | 0 | 0.0% |
| Multidisciplinary Studies | 0 | 0.0% |
| Science & Technology | 26 | 10.9% |
| Business | 13 | 5.4% |
| Education | 42 | 17.6% |
| Literature & Languages | 13 | 5.4% |
| Liberal Arts & History | 22 | 9.2% |
| Visual & Performing Arts | 13 | 5.4% |
| Communications | 4 | 1.7% |
| Arts & Humanities | 15 | 6.3% |
| Total | 239 | 100.0% |
Transportation & Commute in Kentland
Vehicle Availability by Sex in Kentland
The most prevalent vehicle ownership categories in Kentland are males with 2 vehicles (115, accounting for 39.4%) and females with 2 vehicles (145, making up 27.0%).
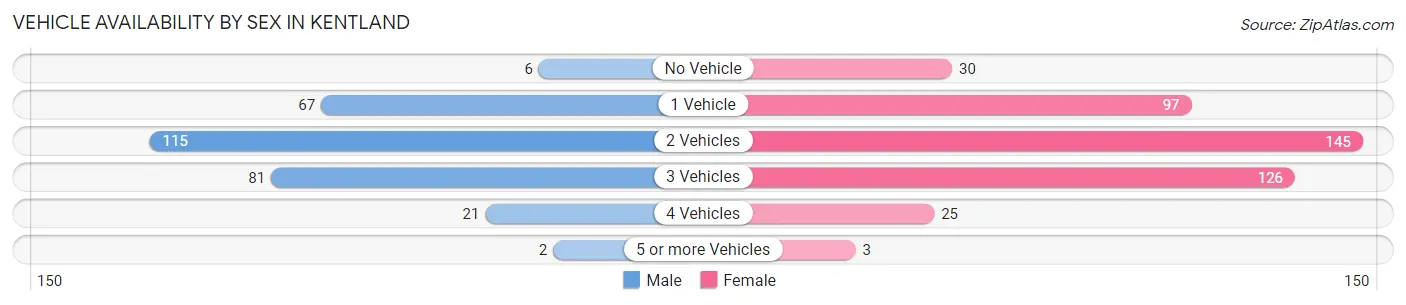
| Vehicles Available | Male | Female |
| No Vehicle | 6 (2.1%) | 30 (7.0%) |
| 1 Vehicle | 67 (23.0%) | 97 (22.8%) |
| 2 Vehicles | 115 (39.4%) | 145 (34.0%) |
| 3 Vehicles | 81 (27.7%) | 126 (29.6%) |
| 4 Vehicles | 21 (7.2%) | 25 (5.9%) |
| 5 or more Vehicles | 2 (0.7%) | 3 (0.7%) |
| Total | 292 (100.0%) | 426 (100.0%) |
Commute Time in Kentland
The most frequently occuring commute durations in Kentland are 5 to 9 minutes (154 commuters, 23.9%), 25 to 29 minutes (85 commuters, 13.2%), and 10 to 14 minutes (68 commuters, 10.6%).
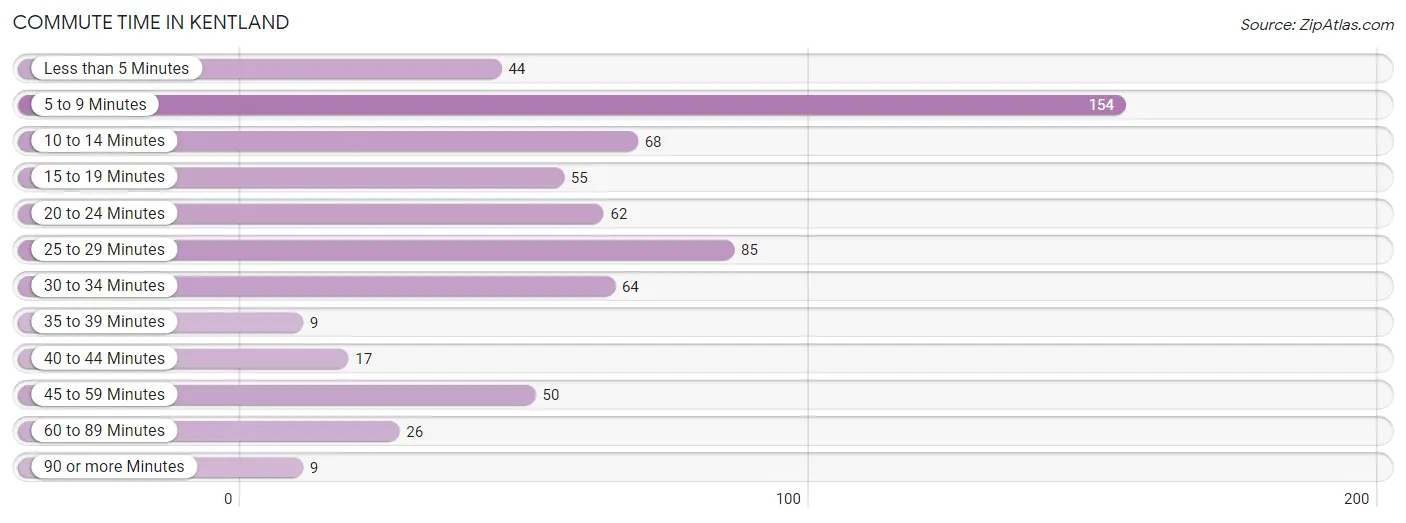
| Commute Time | # Commuters | % Commuters |
| Less than 5 Minutes | 44 | 6.8% |
| 5 to 9 Minutes | 154 | 23.9% |
| 10 to 14 Minutes | 68 | 10.6% |
| 15 to 19 Minutes | 55 | 8.6% |
| 20 to 24 Minutes | 62 | 9.6% |
| 25 to 29 Minutes | 85 | 13.2% |
| 30 to 34 Minutes | 64 | 10.0% |
| 35 to 39 Minutes | 9 | 1.4% |
| 40 to 44 Minutes | 17 | 2.6% |
| 45 to 59 Minutes | 50 | 7.8% |
| 60 to 89 Minutes | 26 | 4.0% |
| 90 or more Minutes | 9 | 1.4% |
Commute Time by Sex in Kentland
The most common commute times in Kentland are 5 to 9 minutes (50 commuters, 18.2%) for males and 5 to 9 minutes (104 commuters, 28.3%) for females.
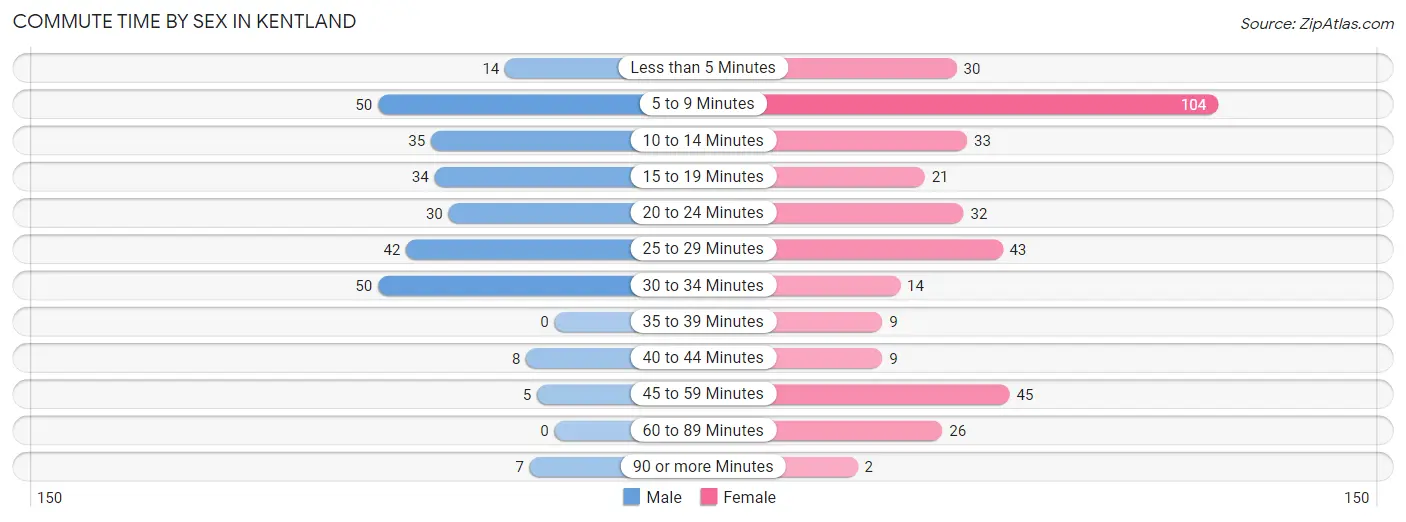
| Commute Time | Male | Female |
| Less than 5 Minutes | 14 (5.1%) | 30 (8.2%) |
| 5 to 9 Minutes | 50 (18.2%) | 104 (28.3%) |
| 10 to 14 Minutes | 35 (12.7%) | 33 (9.0%) |
| 15 to 19 Minutes | 34 (12.4%) | 21 (5.7%) |
| 20 to 24 Minutes | 30 (10.9%) | 32 (8.7%) |
| 25 to 29 Minutes | 42 (15.3%) | 43 (11.7%) |
| 30 to 34 Minutes | 50 (18.2%) | 14 (3.8%) |
| 35 to 39 Minutes | 0 (0.0%) | 9 (2.5%) |
| 40 to 44 Minutes | 8 (2.9%) | 9 (2.5%) |
| 45 to 59 Minutes | 5 (1.8%) | 45 (12.2%) |
| 60 to 89 Minutes | 0 (0.0%) | 26 (7.1%) |
| 90 or more Minutes | 7 (2.5%) | 2 (0.5%) |
Time of Departure to Work by Sex in Kentland
The most frequent times of departure to work in Kentland are 5:30 AM to 5:59 AM (52, 18.9%) for males and 5:30 AM to 5:59 AM (62, 16.9%) for females.
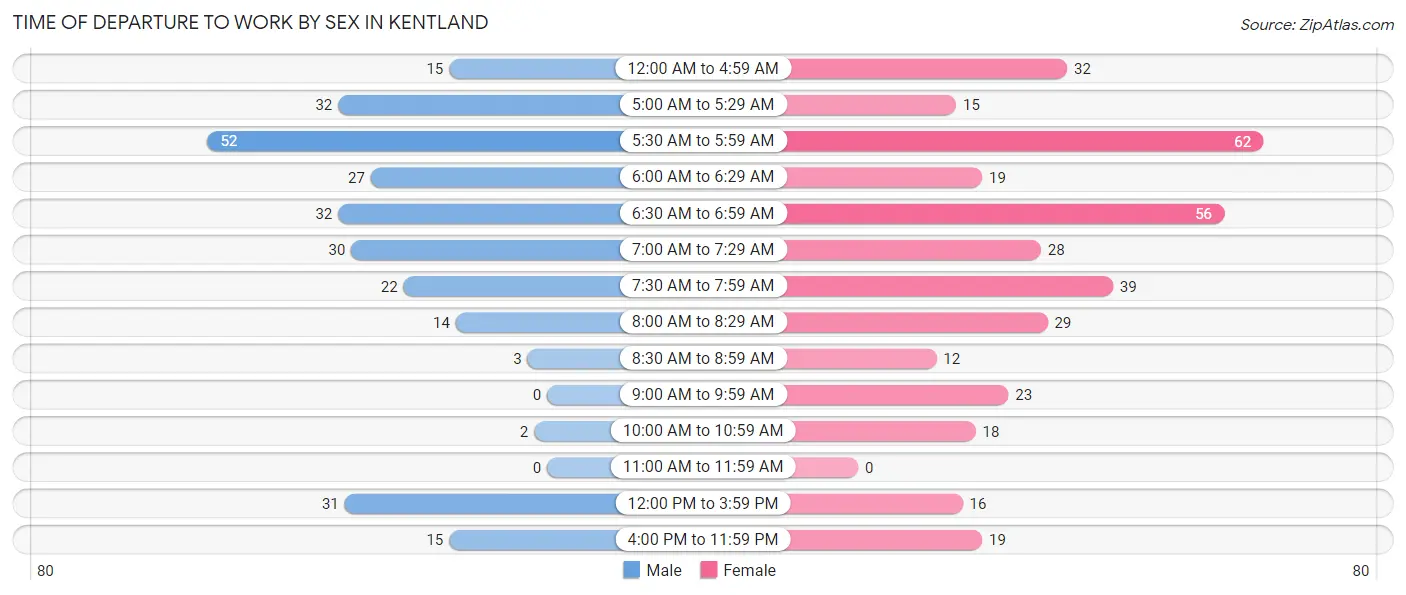
| Time of Departure | Male | Female |
| 12:00 AM to 4:59 AM | 15 (5.4%) | 32 (8.7%) |
| 5:00 AM to 5:29 AM | 32 (11.6%) | 15 (4.1%) |
| 5:30 AM to 5:59 AM | 52 (18.9%) | 62 (16.9%) |
| 6:00 AM to 6:29 AM | 27 (9.8%) | 19 (5.2%) |
| 6:30 AM to 6:59 AM | 32 (11.6%) | 56 (15.2%) |
| 7:00 AM to 7:29 AM | 30 (10.9%) | 28 (7.6%) |
| 7:30 AM to 7:59 AM | 22 (8.0%) | 39 (10.6%) |
| 8:00 AM to 8:29 AM | 14 (5.1%) | 29 (7.9%) |
| 8:30 AM to 8:59 AM | 3 (1.1%) | 12 (3.3%) |
| 9:00 AM to 9:59 AM | 0 (0.0%) | 23 (6.2%) |
| 10:00 AM to 10:59 AM | 2 (0.7%) | 18 (4.9%) |
| 11:00 AM to 11:59 AM | 0 (0.0%) | 0 (0.0%) |
| 12:00 PM to 3:59 PM | 31 (11.3%) | 16 (4.3%) |
| 4:00 PM to 11:59 PM | 15 (5.4%) | 19 (5.2%) |
| Total | 275 (100.0%) | 368 (100.0%) |
Housing Occupancy in Kentland
Occupancy by Ownership in Kentland
Of the total 800 dwellings in Kentland, owner-occupied units account for 577 (72.1%), while renter-occupied units make up 223 (27.9%).
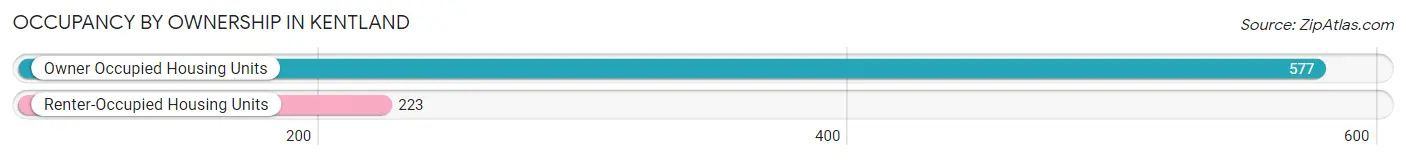
| Occupancy | # Housing Units | % Housing Units |
| Owner Occupied Housing Units | 577 | 72.1% |
| Renter-Occupied Housing Units | 223 | 27.9% |
| Total Occupied Housing Units | 800 | 100.0% |
Occupancy by Household Size in Kentland
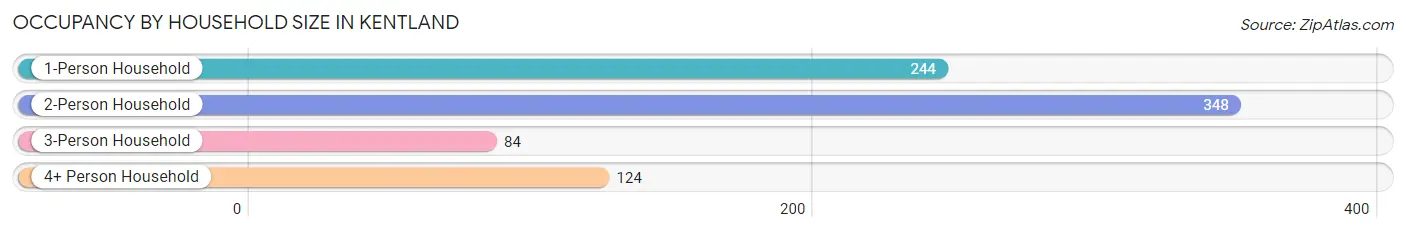
| Household Size | # Housing Units | % Housing Units |
| 1-Person Household | 244 | 30.5% |
| 2-Person Household | 348 | 43.5% |
| 3-Person Household | 84 | 10.5% |
| 4+ Person Household | 124 | 15.5% |
| Total Housing Units | 800 | 100.0% |
Occupancy by Ownership by Household Size in Kentland
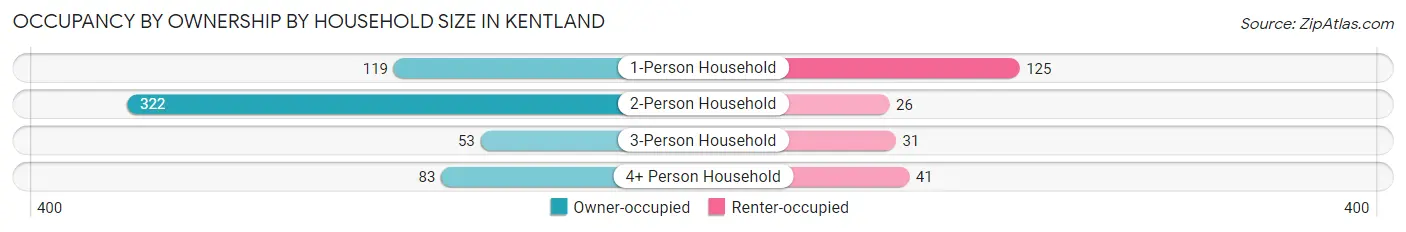
| Household Size | Owner-occupied | Renter-occupied |
| 1-Person Household | 119 (48.8%) | 125 (51.2%) |
| 2-Person Household | 322 (92.5%) | 26 (7.5%) |
| 3-Person Household | 53 (63.1%) | 31 (36.9%) |
| 4+ Person Household | 83 (66.9%) | 41 (33.1%) |
| Total Housing Units | 577 (72.1%) | 223 (27.9%) |
Occupancy by Educational Attainment in Kentland
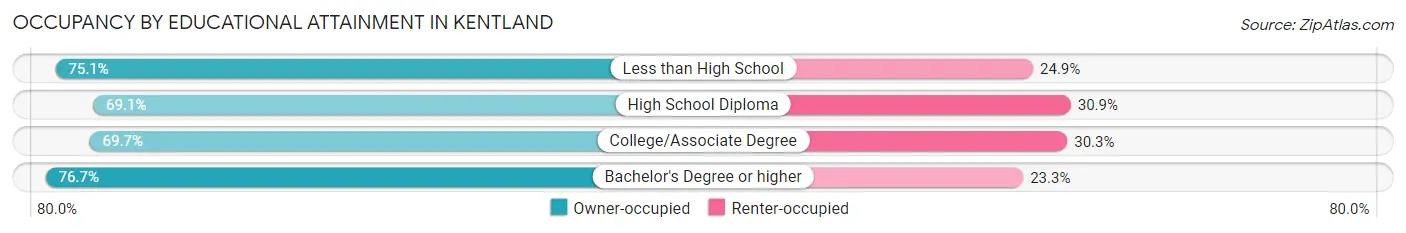
| Household Size | Owner-occupied | Renter-occupied |
| Less than High School | 172 (75.1%) | 57 (24.9%) |
| High School Diploma | 159 (69.1%) | 71 (30.9%) |
| College/Associate Degree | 154 (69.7%) | 67 (30.3%) |
| Bachelor's Degree or higher | 92 (76.7%) | 28 (23.3%) |
Occupancy by Age of Householder in Kentland
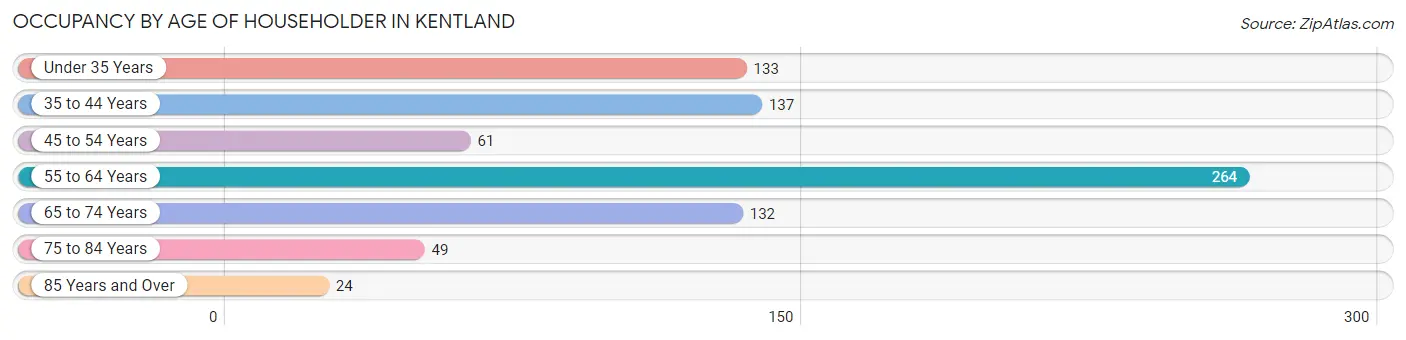
| Age Bracket | # Households | % Households |
| Under 35 Years | 133 | 16.6% |
| 35 to 44 Years | 137 | 17.1% |
| 45 to 54 Years | 61 | 7.6% |
| 55 to 64 Years | 264 | 33.0% |
| 65 to 74 Years | 132 | 16.5% |
| 75 to 84 Years | 49 | 6.1% |
| 85 Years and Over | 24 | 3.0% |
| Total | 800 | 100.0% |
Housing Finances in Kentland
Median Income by Occupancy in Kentland
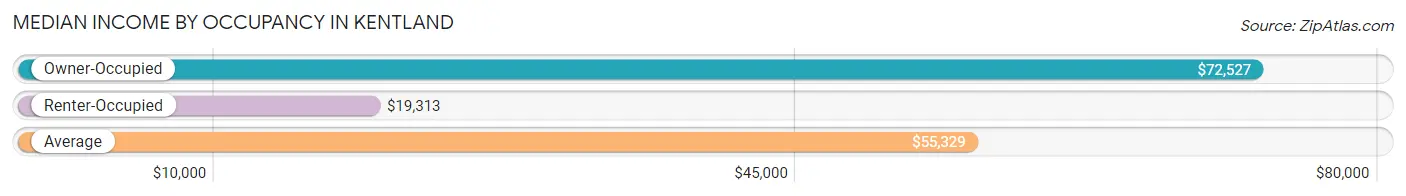
| Occupancy Type | # Households | Median Income |
| Owner-Occupied | 577 (72.1%) | $72,527 |
| Renter-Occupied | 223 (27.9%) | $19,313 |
| Average | 800 (100.0%) | $55,329 |
Occupancy by Householder Income Bracket in Kentland
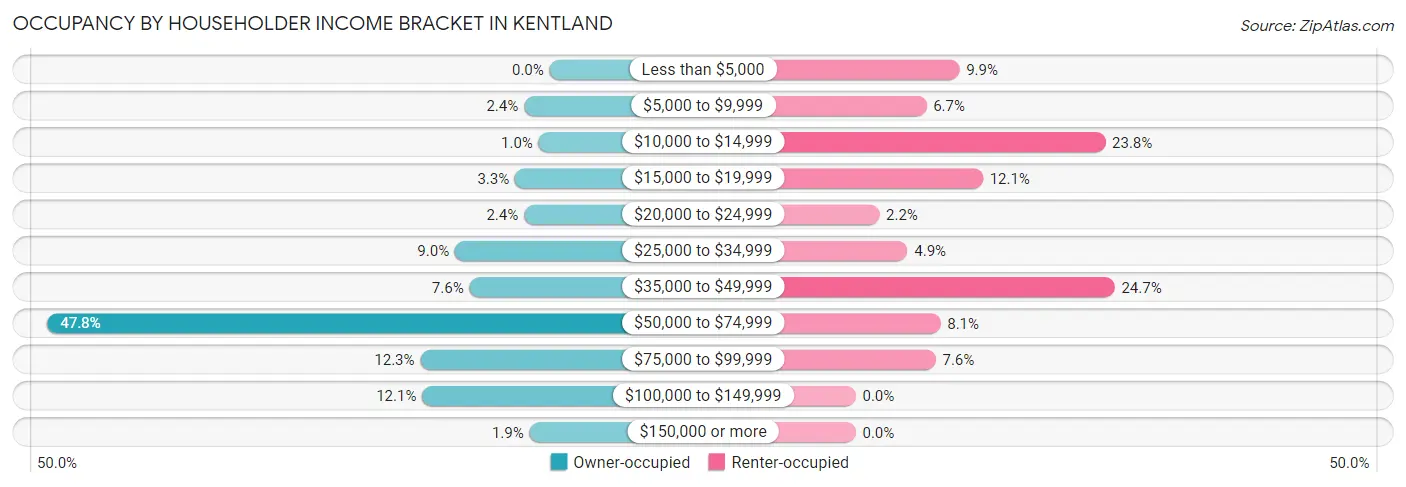
| Income Bracket | Owner-occupied | Renter-occupied |
| Less than $5,000 | 0 (0.0%) | 22 (9.9%) |
| $5,000 to $9,999 | 14 (2.4%) | 15 (6.7%) |
| $10,000 to $14,999 | 6 (1.0%) | 53 (23.8%) |
| $15,000 to $19,999 | 19 (3.3%) | 27 (12.1%) |
| $20,000 to $24,999 | 14 (2.4%) | 5 (2.2%) |
| $25,000 to $34,999 | 52 (9.0%) | 11 (4.9%) |
| $35,000 to $49,999 | 44 (7.6%) | 55 (24.7%) |
| $50,000 to $74,999 | 276 (47.8%) | 18 (8.1%) |
| $75,000 to $99,999 | 71 (12.3%) | 17 (7.6%) |
| $100,000 to $149,999 | 70 (12.1%) | 0 (0.0%) |
| $150,000 or more | 11 (1.9%) | 0 (0.0%) |
| Total | 577 (100.0%) | 223 (100.0%) |
Monthly Housing Cost Tiers in Kentland
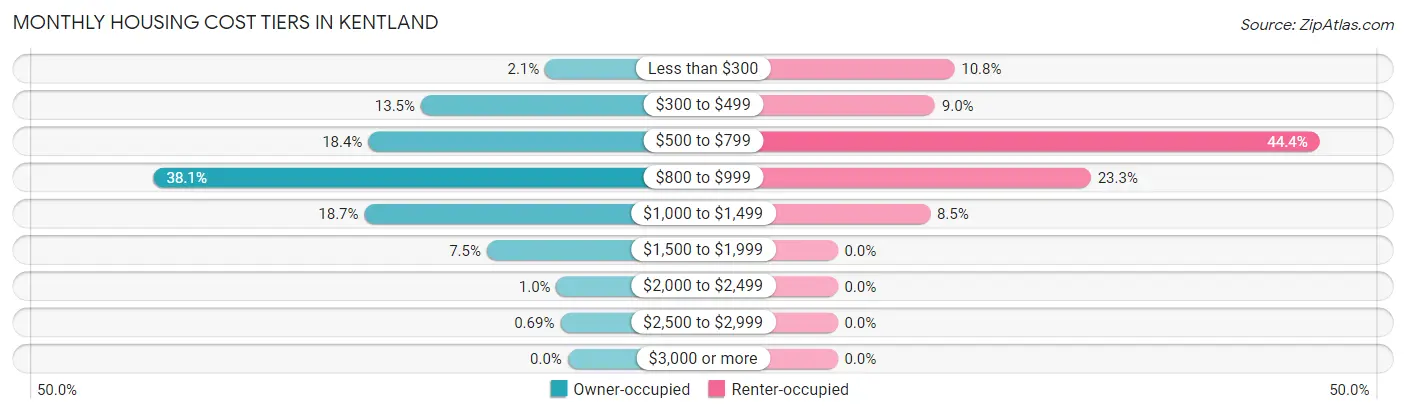
| Monthly Cost | Owner-occupied | Renter-occupied |
| Less than $300 | 12 (2.1%) | 24 (10.8%) |
| $300 to $499 | 78 (13.5%) | 20 (9.0%) |
| $500 to $799 | 106 (18.4%) | 99 (44.4%) |
| $800 to $999 | 220 (38.1%) | 52 (23.3%) |
| $1,000 to $1,499 | 108 (18.7%) | 19 (8.5%) |
| $1,500 to $1,999 | 43 (7.4%) | 0 (0.0%) |
| $2,000 to $2,499 | 6 (1.0%) | 0 (0.0%) |
| $2,500 to $2,999 | 4 (0.7%) | 0 (0.0%) |
| $3,000 or more | 0 (0.0%) | 0 (0.0%) |
| Total | 577 (100.0%) | 223 (100.0%) |
Physical Housing Characteristics in Kentland
Housing Structures in Kentland
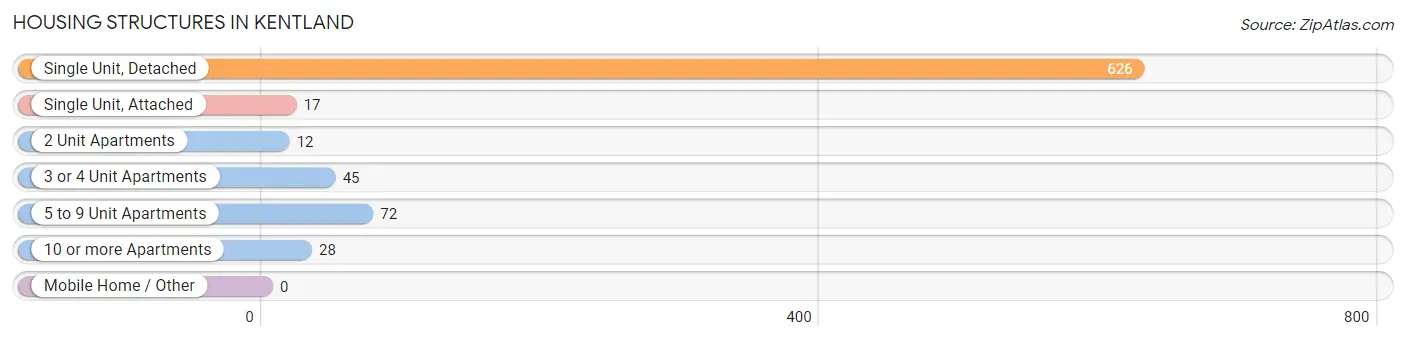
| Structure Type | # Housing Units | % Housing Units |
| Single Unit, Detached | 626 | 78.2% |
| Single Unit, Attached | 17 | 2.1% |
| 2 Unit Apartments | 12 | 1.5% |
| 3 or 4 Unit Apartments | 45 | 5.6% |
| 5 to 9 Unit Apartments | 72 | 9.0% |
| 10 or more Apartments | 28 | 3.5% |
| Mobile Home / Other | 0 | 0.0% |
| Total | 800 | 100.0% |
Housing Structures by Occupancy in Kentland
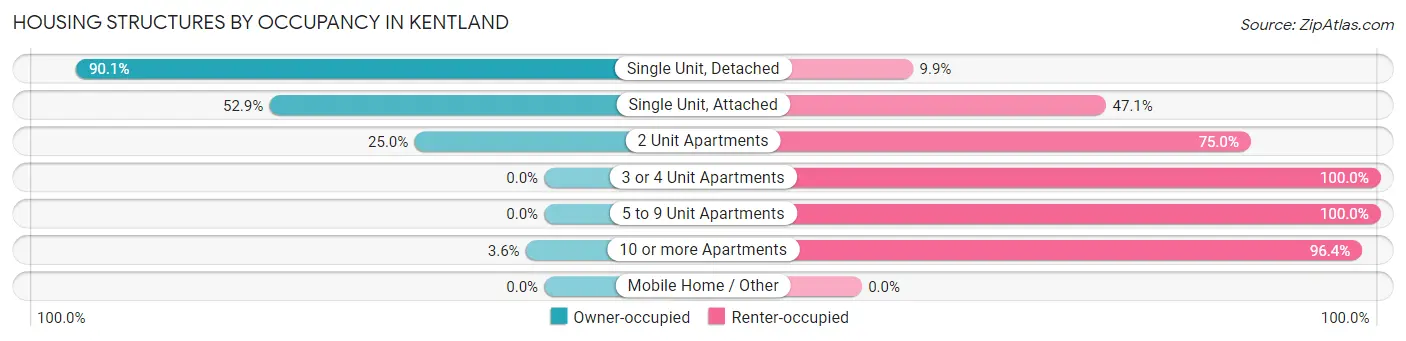
| Structure Type | Owner-occupied | Renter-occupied |
| Single Unit, Detached | 564 (90.1%) | 62 (9.9%) |
| Single Unit, Attached | 9 (52.9%) | 8 (47.1%) |
| 2 Unit Apartments | 3 (25.0%) | 9 (75.0%) |
| 3 or 4 Unit Apartments | 0 (0.0%) | 45 (100.0%) |
| 5 to 9 Unit Apartments | 0 (0.0%) | 72 (100.0%) |
| 10 or more Apartments | 1 (3.6%) | 27 (96.4%) |
| Mobile Home / Other | 0 (0.0%) | 0 (0.0%) |
| Total | 577 (72.1%) | 223 (27.9%) |
Housing Structures by Number of Rooms in Kentland
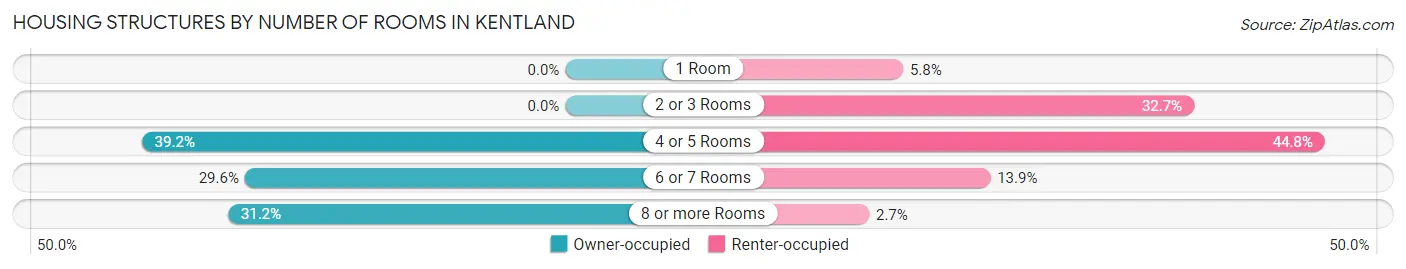
| Number of Rooms | Owner-occupied | Renter-occupied |
| 1 Room | 0 (0.0%) | 13 (5.8%) |
| 2 or 3 Rooms | 0 (0.0%) | 73 (32.7%) |
| 4 or 5 Rooms | 226 (39.2%) | 100 (44.8%) |
| 6 or 7 Rooms | 171 (29.6%) | 31 (13.9%) |
| 8 or more Rooms | 180 (31.2%) | 6 (2.7%) |
| Total | 577 (100.0%) | 223 (100.0%) |
Housing Structure by Heating Type in Kentland
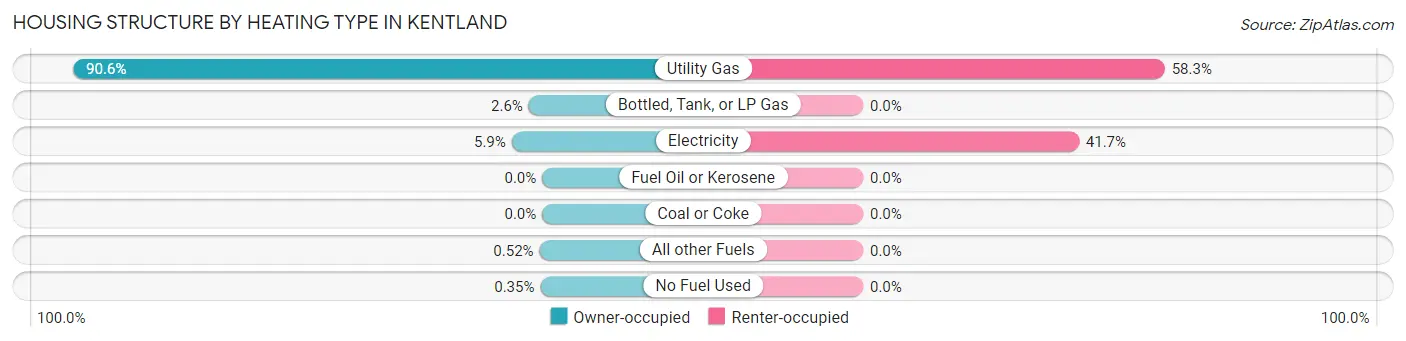
| Heating Type | Owner-occupied | Renter-occupied |
| Utility Gas | 523 (90.6%) | 130 (58.3%) |
| Bottled, Tank, or LP Gas | 15 (2.6%) | 0 (0.0%) |
| Electricity | 34 (5.9%) | 93 (41.7%) |
| Fuel Oil or Kerosene | 0 (0.0%) | 0 (0.0%) |
| Coal or Coke | 0 (0.0%) | 0 (0.0%) |
| All other Fuels | 3 (0.5%) | 0 (0.0%) |
| No Fuel Used | 2 (0.4%) | 0 (0.0%) |
| Total | 577 (100.0%) | 223 (100.0%) |
Household Vehicle Usage in Kentland
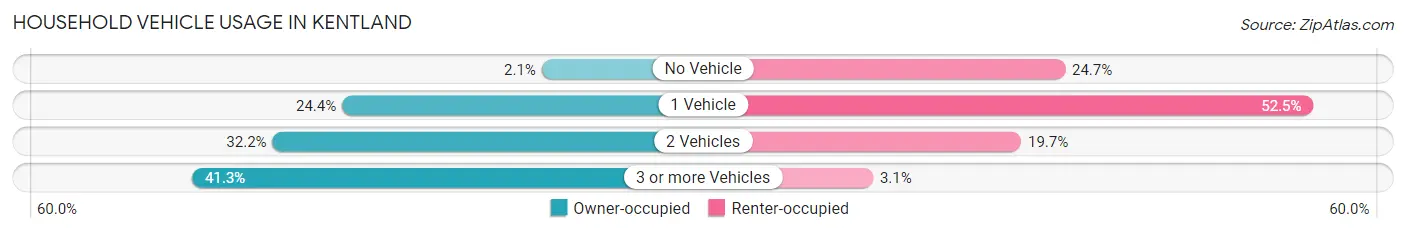
| Vehicles per Household | Owner-occupied | Renter-occupied |
| No Vehicle | 12 (2.1%) | 55 (24.7%) |
| 1 Vehicle | 141 (24.4%) | 117 (52.5%) |
| 2 Vehicles | 186 (32.2%) | 44 (19.7%) |
| 3 or more Vehicles | 238 (41.2%) | 7 (3.1%) |
| Total | 577 (100.0%) | 223 (100.0%) |
Real Estate & Mortgages in Kentland
Real Estate and Mortgage Overview in Kentland
| Characteristic | Without Mortgage | With Mortgage |
| Housing Units | 161 | 416 |
| Median Property Value | $101,300 | $91,300 |
| Median Household Income | $51,938 | $6 |
| Monthly Housing Costs | $465 | $0 |
| Real Estate Taxes | $811 | $13 |
Property Value by Mortgage Status in Kentland
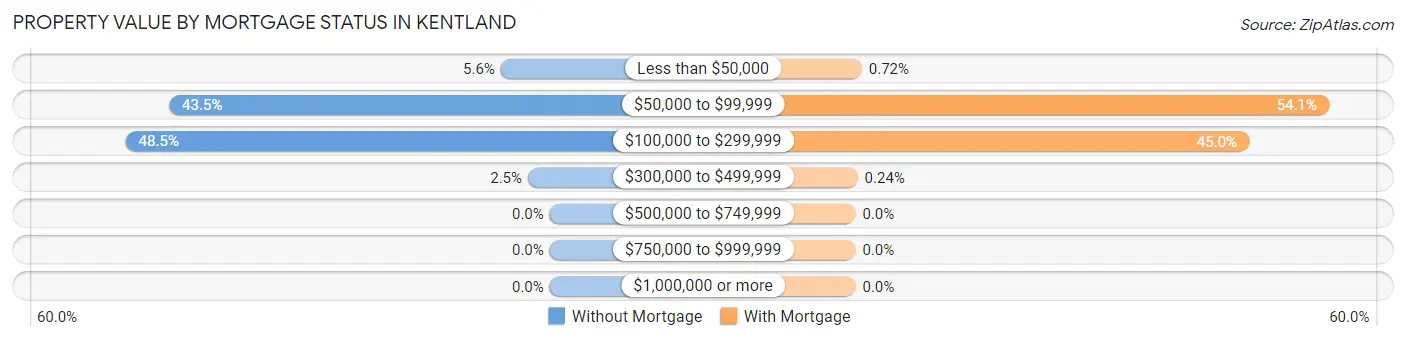
| Property Value | Without Mortgage | With Mortgage |
| Less than $50,000 | 9 (5.6%) | 3 (0.7%) |
| $50,000 to $99,999 | 70 (43.5%) | 225 (54.1%) |
| $100,000 to $299,999 | 78 (48.4%) | 187 (45.0%) |
| $300,000 to $499,999 | 4 (2.5%) | 1 (0.2%) |
| $500,000 to $749,999 | 0 (0.0%) | 0 (0.0%) |
| $750,000 to $999,999 | 0 (0.0%) | 0 (0.0%) |
| $1,000,000 or more | 0 (0.0%) | 0 (0.0%) |
| Total | 161 (100.0%) | 416 (100.0%) |
Household Income by Mortgage Status in Kentland
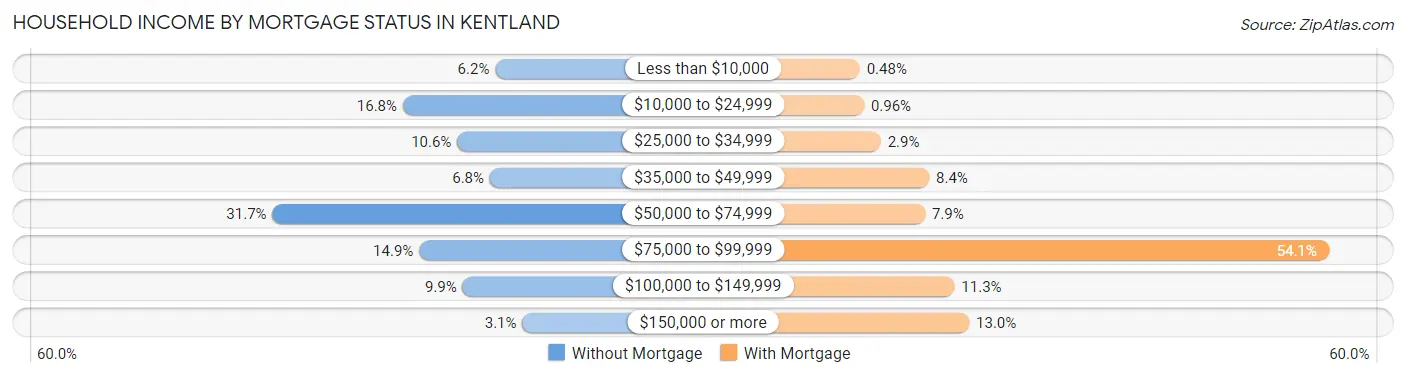
| Household Income | Without Mortgage | With Mortgage |
| Less than $10,000 | 10 (6.2%) | 2 (0.5%) |
| $10,000 to $24,999 | 27 (16.8%) | 4 (1.0%) |
| $25,000 to $34,999 | 17 (10.6%) | 12 (2.9%) |
| $35,000 to $49,999 | 11 (6.8%) | 35 (8.4%) |
| $50,000 to $74,999 | 51 (31.7%) | 33 (7.9%) |
| $75,000 to $99,999 | 24 (14.9%) | 225 (54.1%) |
| $100,000 to $149,999 | 16 (9.9%) | 47 (11.3%) |
| $150,000 or more | 5 (3.1%) | 54 (13.0%) |
| Total | 161 (100.0%) | 416 (100.0%) |
Property Value to Household Income Ratio in Kentland
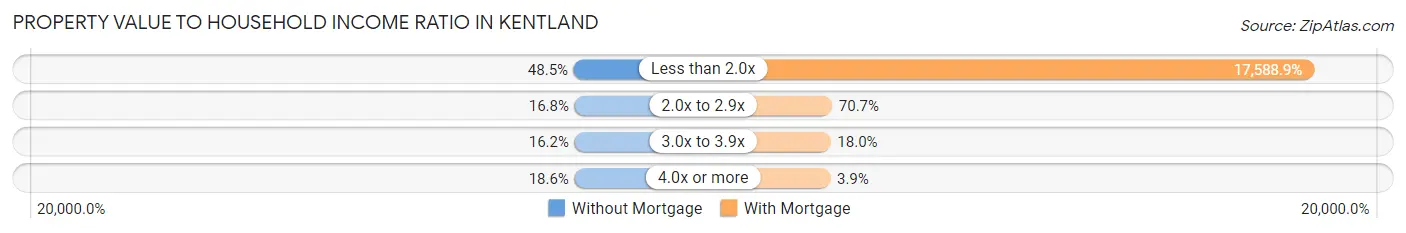
| Value-to-Income Ratio | Without Mortgage | With Mortgage |
| Less than 2.0x | 78 (48.4%) | 73,170 (17,588.9%) |
| 2.0x to 2.9x | 27 (16.8%) | 294 (70.7%) |
| 3.0x to 3.9x | 26 (16.2%) | 75 (18.0%) |
| 4.0x or more | 30 (18.6%) | 16 (3.8%) |
| Total | 161 (100.0%) | 416 (100.0%) |
Real Estate Taxes by Mortgage Status in Kentland
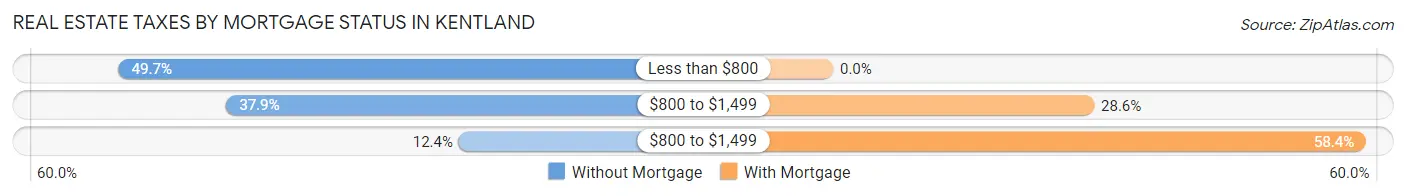
| Property Taxes | Without Mortgage | With Mortgage |
| Less than $800 | 80 (49.7%) | 0 (0.0%) |
| $800 to $1,499 | 61 (37.9%) | 119 (28.6%) |
| $800 to $1,499 | 20 (12.4%) | 243 (58.4%) |
| Total | 161 (100.0%) | 416 (100.0%) |
Health & Disability in Kentland
Health Insurance Coverage by Age in Kentland
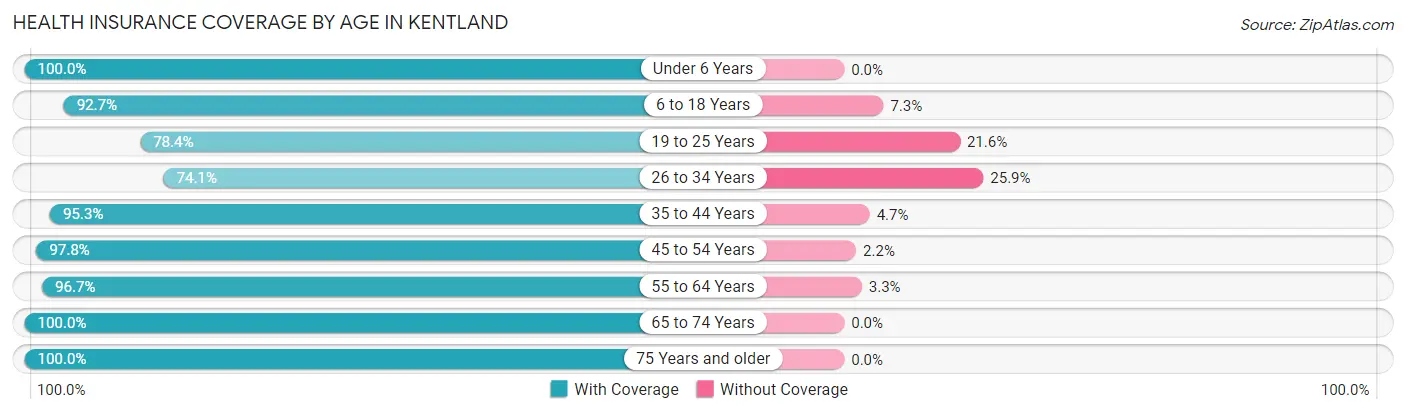
| Age Bracket | With Coverage | Without Coverage |
| Under 6 Years | 190 (100.0%) | 0 (0.0%) |
| 6 to 18 Years | 292 (92.7%) | 23 (7.3%) |
| 19 to 25 Years | 80 (78.4%) | 22 (21.6%) |
| 26 to 34 Years | 100 (74.1%) | 35 (25.9%) |
| 35 to 44 Years | 201 (95.3%) | 10 (4.7%) |
| 45 to 54 Years | 133 (97.8%) | 3 (2.2%) |
| 55 to 64 Years | 383 (96.7%) | 13 (3.3%) |
| 65 to 74 Years | 188 (100.0%) | 0 (0.0%) |
| 75 Years and older | 90 (100.0%) | 0 (0.0%) |
| Total | 1,657 (94.0%) | 106 (6.0%) |
Health Insurance Coverage by Citizenship Status in Kentland
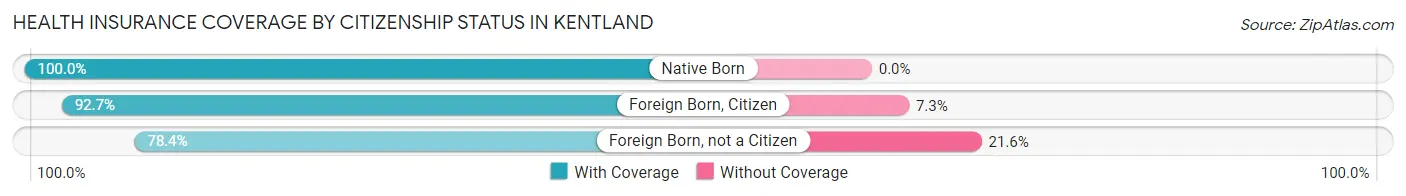
| Citizenship Status | With Coverage | Without Coverage |
| Native Born | 190 (100.0%) | 0 (0.0%) |
| Foreign Born, Citizen | 292 (92.7%) | 23 (7.3%) |
| Foreign Born, not a Citizen | 80 (78.4%) | 22 (21.6%) |
Health Insurance Coverage by Household Income in Kentland
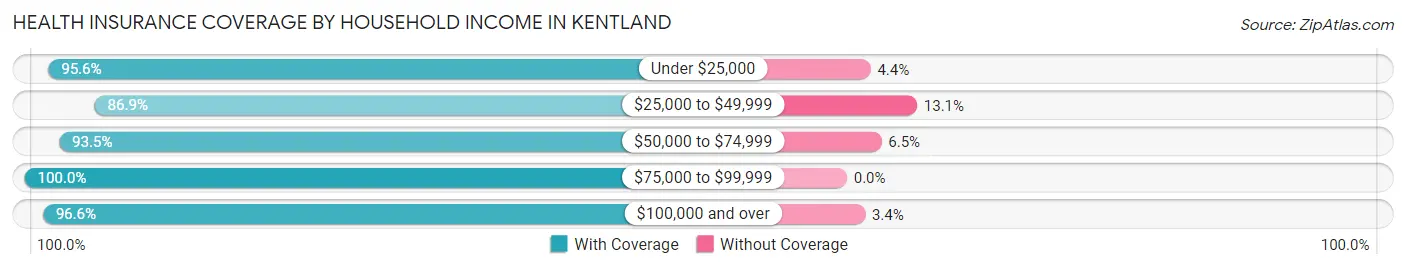
| Household Income | With Coverage | Without Coverage |
| Under $25,000 | 344 (95.6%) | 16 (4.4%) |
| $25,000 to $49,999 | 311 (86.9%) | 47 (13.1%) |
| $50,000 to $74,999 | 477 (93.5%) | 33 (6.5%) |
| $75,000 to $99,999 | 241 (100.0%) | 0 (0.0%) |
| $100,000 and over | 284 (96.6%) | 10 (3.4%) |
Public vs Private Health Insurance Coverage by Age in Kentland
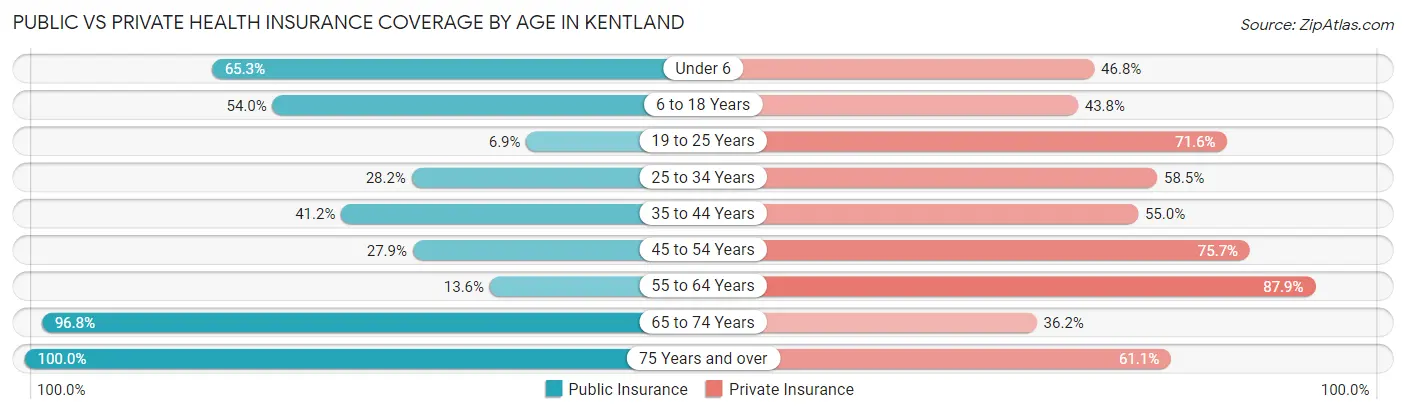
| Age Bracket | Public Insurance | Private Insurance |
| Under 6 | 124 (65.3%) | 89 (46.8%) |
| 6 to 18 Years | 170 (54.0%) | 138 (43.8%) |
| 19 to 25 Years | 7 (6.9%) | 73 (71.6%) |
| 25 to 34 Years | 38 (28.1%) | 79 (58.5%) |
| 35 to 44 Years | 87 (41.2%) | 116 (55.0%) |
| 45 to 54 Years | 38 (27.9%) | 103 (75.7%) |
| 55 to 64 Years | 54 (13.6%) | 348 (87.9%) |
| 65 to 74 Years | 182 (96.8%) | 68 (36.2%) |
| 75 Years and over | 90 (100.0%) | 55 (61.1%) |
| Total | 790 (44.8%) | 1,069 (60.6%) |
Disability Status by Sex by Age in Kentland
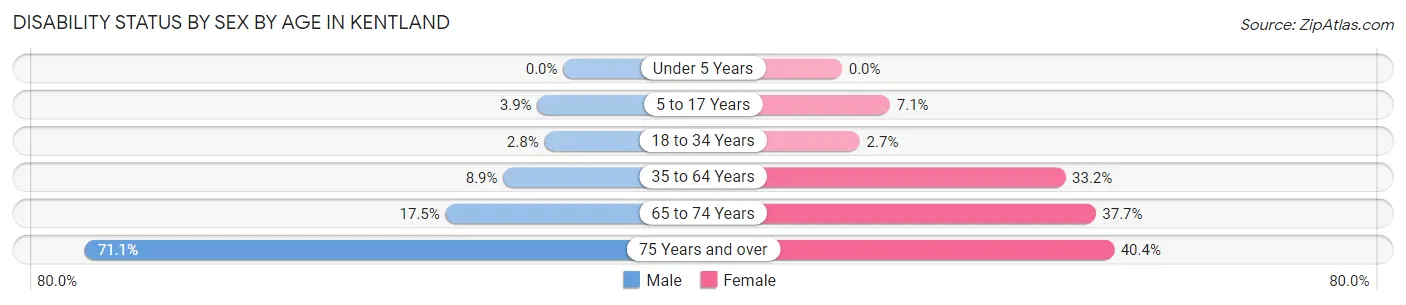
| Age Bracket | Male | Female |
| Under 5 Years | 0 (0.0%) | 0 (0.0%) |
| 5 to 17 Years | 6 (3.8%) | 11 (7.1%) |
| 18 to 34 Years | 3 (2.8%) | 4 (2.6%) |
| 35 to 64 Years | 31 (8.9%) | 131 (33.2%) |
| 65 to 74 Years | 18 (17.5%) | 32 (37.7%) |
| 75 Years and over | 27 (71.1%) | 21 (40.4%) |
Disability Class by Sex by Age in Kentland
Disability Class: Hearing Difficulty
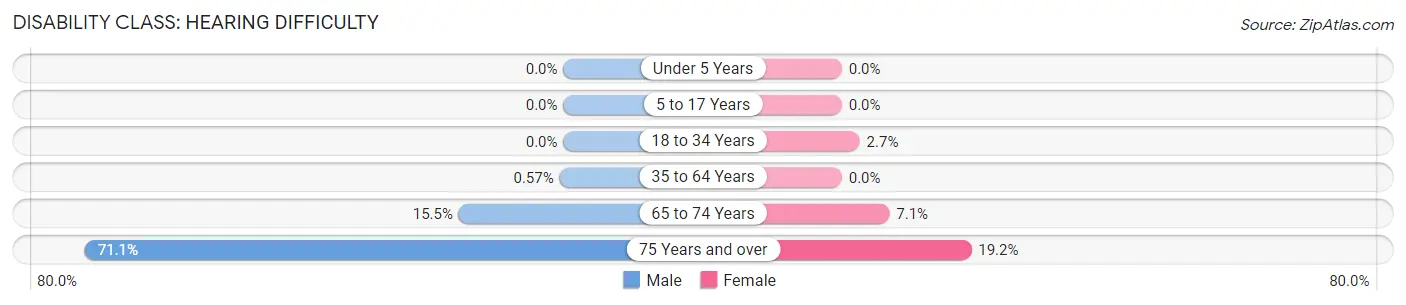
| Age Bracket | Male | Female |
| Under 5 Years | 0 (0.0%) | 0 (0.0%) |
| 5 to 17 Years | 0 (0.0%) | 0 (0.0%) |
| 18 to 34 Years | 0 (0.0%) | 4 (2.6%) |
| 35 to 64 Years | 2 (0.6%) | 0 (0.0%) |
| 65 to 74 Years | 16 (15.5%) | 6 (7.1%) |
| 75 Years and over | 27 (71.1%) | 10 (19.2%) |
Disability Class: Vision Difficulty
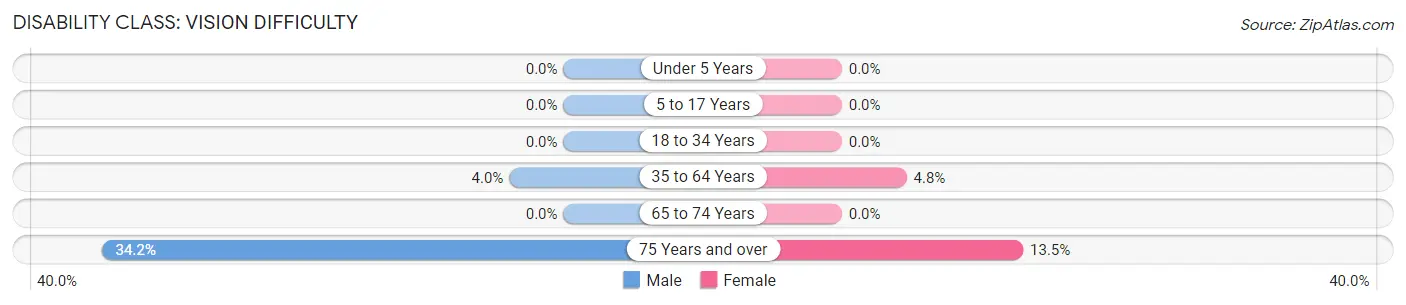
| Age Bracket | Male | Female |
| Under 5 Years | 0 (0.0%) | 0 (0.0%) |
| 5 to 17 Years | 0 (0.0%) | 0 (0.0%) |
| 18 to 34 Years | 0 (0.0%) | 0 (0.0%) |
| 35 to 64 Years | 14 (4.0%) | 19 (4.8%) |
| 65 to 74 Years | 0 (0.0%) | 0 (0.0%) |
| 75 Years and over | 13 (34.2%) | 7 (13.5%) |
Disability Class: Cognitive Difficulty
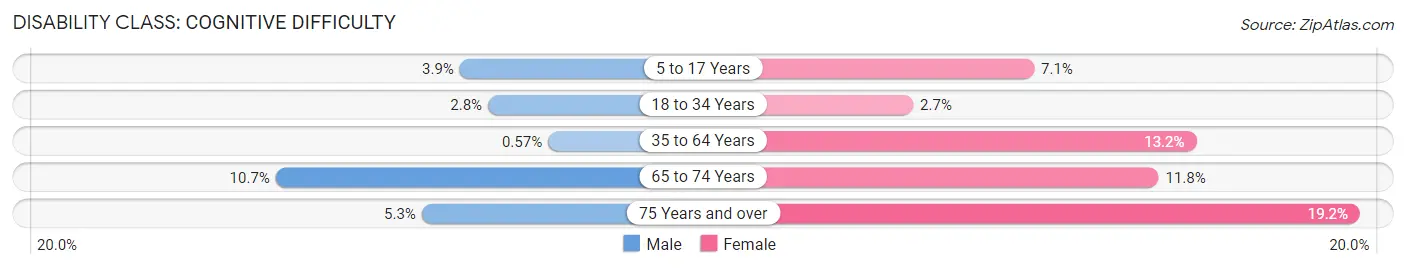
| Age Bracket | Male | Female |
| 5 to 17 Years | 6 (3.8%) | 11 (7.1%) |
| 18 to 34 Years | 3 (2.8%) | 4 (2.6%) |
| 35 to 64 Years | 2 (0.6%) | 52 (13.2%) |
| 65 to 74 Years | 11 (10.7%) | 10 (11.8%) |
| 75 Years and over | 2 (5.3%) | 10 (19.2%) |
Disability Class: Ambulatory Difficulty
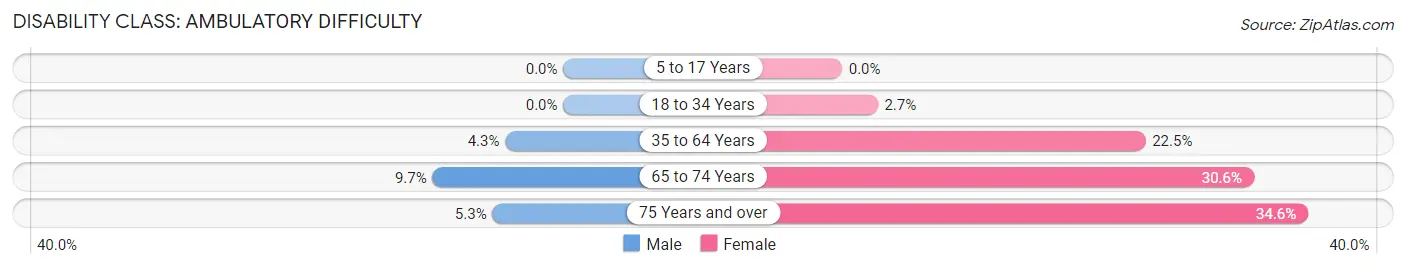
| Age Bracket | Male | Female |
| 5 to 17 Years | 0 (0.0%) | 0 (0.0%) |
| 18 to 34 Years | 0 (0.0%) | 4 (2.6%) |
| 35 to 64 Years | 15 (4.3%) | 89 (22.5%) |
| 65 to 74 Years | 10 (9.7%) | 26 (30.6%) |
| 75 Years and over | 2 (5.3%) | 18 (34.6%) |
Disability Class: Self-Care Difficulty
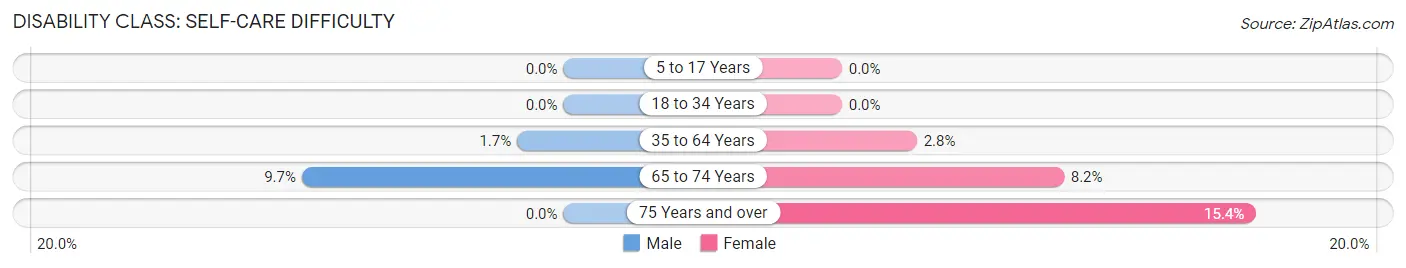
| Age Bracket | Male | Female |
| 5 to 17 Years | 0 (0.0%) | 0 (0.0%) |
| 18 to 34 Years | 0 (0.0%) | 0 (0.0%) |
| 35 to 64 Years | 6 (1.7%) | 11 (2.8%) |
| 65 to 74 Years | 10 (9.7%) | 7 (8.2%) |
| 75 Years and over | 0 (0.0%) | 8 (15.4%) |
Technology Access in Kentland
Computing Device Access in Kentland
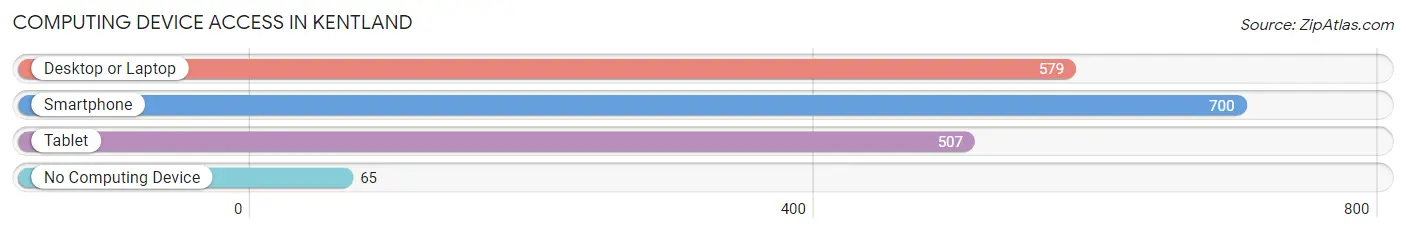
| Device Type | # Households | % Households |
| Desktop or Laptop | 579 | 72.4% |
| Smartphone | 700 | 87.5% |
| Tablet | 507 | 63.4% |
| No Computing Device | 65 | 8.1% |
| Total | 800 | 100.0% |
Internet Access in Kentland
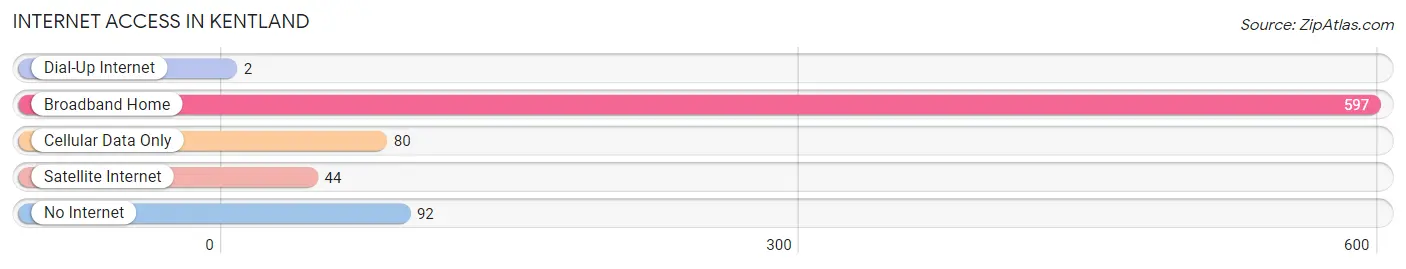
| Internet Type | # Households | % Households |
| Dial-Up Internet | 2 | 0.3% |
| Broadband Home | 597 | 74.6% |
| Cellular Data Only | 80 | 10.0% |
| Satellite Internet | 44 | 5.5% |
| No Internet | 92 | 11.5% |
| Total | 800 | 100.0% |
Kentland Summary
Kentland is a small town located in Newton County, Indiana, United States. The population was 1,845 at the 2010 census. It is part of the Lafayette, Indiana Metropolitan Statistical Area.
Geography
Kentland is located at 40 59 25 North 87 25 17 West 40 990278 87 421389
According to the 2010 census Kentland has a total area of 1 2 square miles 3 1 km2 all land
History
Kentland was founded in 1871 by William Kent, a local farmer. The town was named after him. The first post office was established in 1872.
In 1876 the first school was built in Kentland The town was incorporated in 1883
In the early 1900s, Kentland was a thriving agricultural community. The town had a bank, a hotel, a newspaper, a lumber yard, a grain elevator, and several other businesses.
Economy
The economy of Kentland is largely based on agriculture. The town is home to several farms, including a large dairy farm.
The town also has several small businesses, including a grocery store, a hardware store, a restaurant, and a gas station.
Demographics
As of the census of 2010, there were 1,845 people, 717 households, and 486 families residing in the town. The population density was 1,527.5 people per square mile (589.3/km2). There were 771 housing units at an average density of 637.5 per square mile (246.2/km2). The racial makeup of the town was 97.2% White, 0.3% African American, 0.2% Native American, 0.2% Asian, 0.2% from other races, and 1.9% from two or more races. Hispanic or Latino of any race were 1.2% of the population.
There were 717 households, out of which 32.2% had children under the age of 18 living with them, 51.2% were married couples living together, 11.2% had a female householder with no husband present, and 33.2% were non-families. 28.7% of all households were made up of individuals, and 14.2% had someone living alone who was 65 years of age or older. The average household size was 2.54 and the average family size was 3.13.
In the town, the population was spread out, with 27.2% under the age of 18, 8.2% from 18 to 24, 27.2% from 25 to 44, 22.2% from 45 to 64, and 15.2% who were 65 years of age or older. The median age was 36 years. For every 100 females, there were 92.2 males. For every 100 females age 18 and over, there were 88.2 males.
The median income for a household in the town was $37,500, and the median income for a family was $45,000. Males had a median income of $31,250 versus $21,250 for females. The per capita income for the town was $17,845. About 8.2% of families and 10.2% of the population were below the poverty line, including 14.2% of those under age 18 and 8.2% of those age 65 or over.
Common Questions
What is the Total Population of Kentland?
Total Population of Kentland is 1,810.
What is the Total Male Population of Kentland?
Total Male Population of Kentland is 899.
What is the Total Female Population of Kentland?
Total Female Population of Kentland is 911.
What is the Ratio of Males per 100 Females in Kentland?
There are 98.68 Males per 100 Females in Kentland.
What is the Ratio of Females per 100 Males in Kentland?
There are 101.33 Females per 100 Males in Kentland.
What is the Median Population Age in Kentland?
Median Population Age in Kentland is 39.2 Years.
What is the Average Family Size in Kentland
Average Family Size in Kentland is 2.7 People.
What is the Average Household Size in Kentland
Average Household Size in Kentland is 2.2 People.
What is Per Capita Income in Kentland?
Per Capita income in Kentland is $24,452.
What is the Median Family Income in Kentland?
Median Family Income in Kentland is $72,944.
What is the Median Household income in Kentland?
Median Household Income in Kentland is $55,329.
What is Income or Wage Gap in Kentland?
Income or Wage Gap in Kentland is 34.7%.
Women in Kentland earn 65.3 cents for every dollar earned by a man.
What is Inequality or Gini Index in Kentland?
Inequality or Gini Index in Kentland is 0.34.
How Large is the Labor Force in Kentland?
There are 902 People in the Labor Forcein in Kentland.
What is the Percentage of People in the Labor Force in Kentland?
63.9% of People are in the Labor Force in Kentland.
What is the Unemployment Rate in Kentland?
Unemployment Rate in Kentland is 20.0%.