Taylorsville, IN
Taylorsville Map
Taylorsville Overview
667
TOTAL POPULATION
384
MALE POPULATION
283
FEMALE POPULATION
135.69
MALES / 100 FEMALES
73.70
FEMALES / 100 MALES
48.7
MEDIAN AGE
2.8
AVG FAMILY SIZE
2.3
AVG HOUSEHOLD SIZE
$37,792
PER CAPITA INCOME
$82,969
AVG FAMILY INCOME
$59,306
AVG HOUSEHOLD INCOME
0.44
INEQUALITY / GINI INDEX
341
LABOR FORCE [ PEOPLE ]
57.8%
PERCENT IN LABOR FORCE
6.7%
UNEMPLOYMENT RATE
Taylorsville Zip Codes
Taylorsville Area Codes
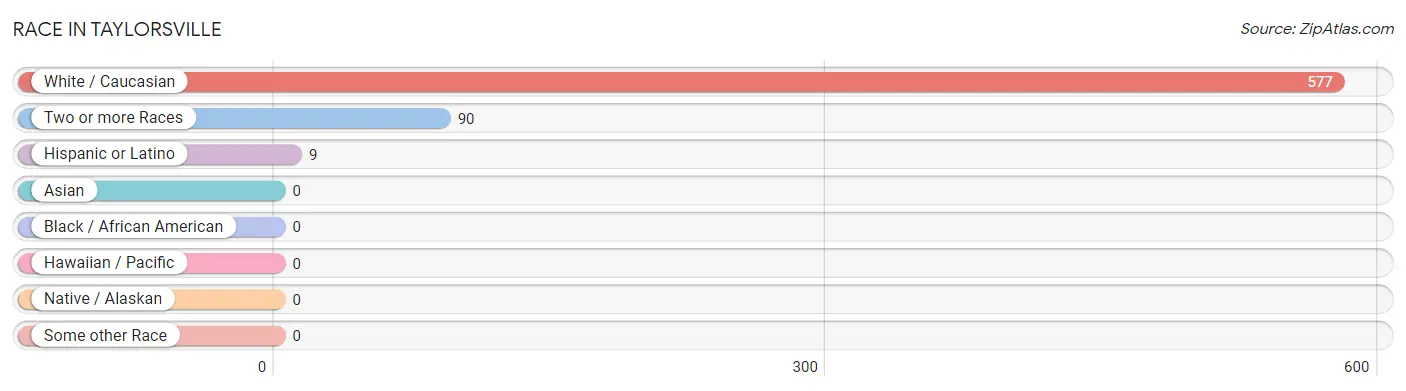
Race in Taylorsville
The most populous races in Taylorsville are White / Caucasian (577 | 86.5%), Two or more Races (90 | 13.5%), and Hispanic or Latino (9 | 1.3%).
| Race | # Population | % Population |
| Asian | 0 | 0.0% |
| Black / African American | 0 | 0.0% |
| Hawaiian / Pacific | 0 | 0.0% |
| Hispanic or Latino | 9 | 1.3% |
| Native / Alaskan | 0 | 0.0% |
| White / Caucasian | 577 | 86.5% |
| Two or more Races | 90 | 13.5% |
| Some other Race | 0 | 0.0% |
| Total | 667 | 100.0% |
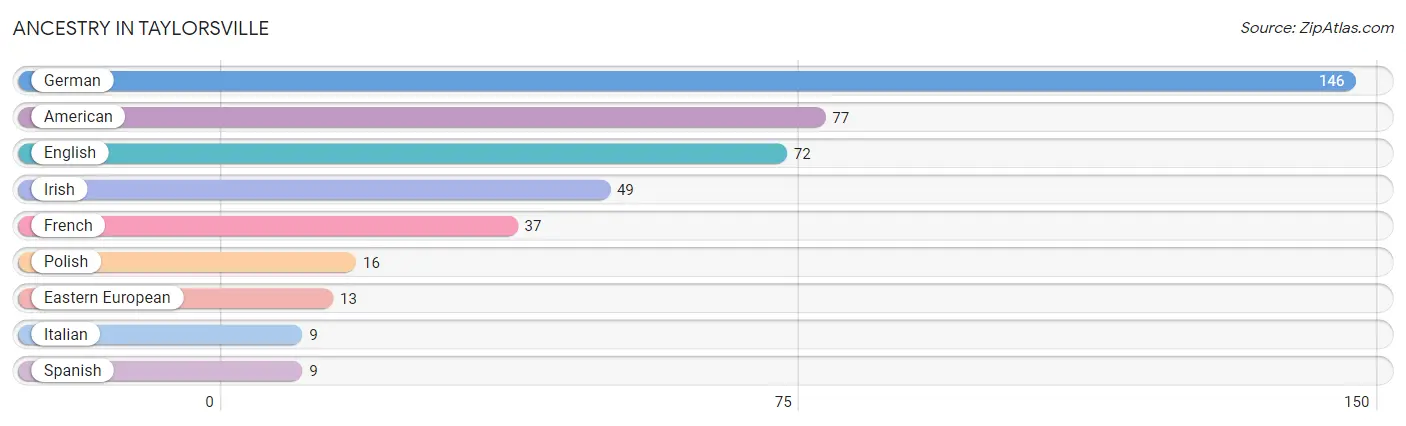
Ancestry in Taylorsville
The most populous ancestries reported in Taylorsville are German (146 | 21.9%), American (77 | 11.5%), English (72 | 10.8%), Irish (49 | 7.3%), and French (37 | 5.6%), together accounting for 57.1% of all Taylorsville residents.
| Ancestry | # Population | % Population |
| American | 77 | 11.5% |
| Eastern European | 13 | 1.9% |
| English | 72 | 10.8% |
| French | 37 | 5.6% |
| German | 146 | 21.9% |
| Irish | 49 | 7.3% |
| Italian | 9 | 1.3% |
| Polish | 16 | 2.4% |
| Spanish | 9 | 1.3% | View All 9 Rows |
Immigrants in Taylorsville

| Immigration Origin | # Population | % Population | View All 0 Rows |
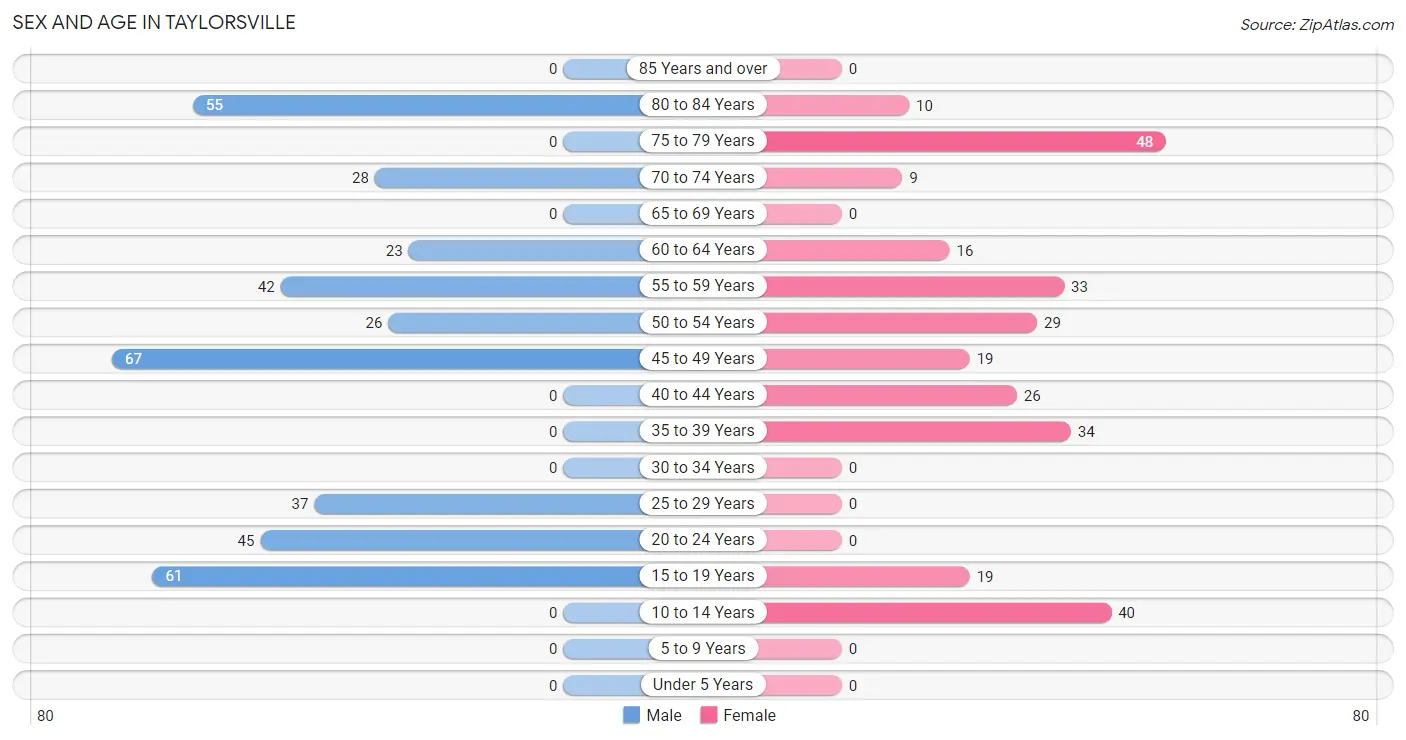
Sex and Age in Taylorsville
Sex and Age in Taylorsville
The most populous age groups in Taylorsville are 45 to 49 Years (67 | 17.4%) for men and 75 to 79 Years (48 | 17.0%) for women.
| Age Bracket | Male | Female |
| Under 5 Years | 0 (0.0%) | 0 (0.0%) |
| 5 to 9 Years | 0 (0.0%) | 0 (0.0%) |
| 10 to 14 Years | 0 (0.0%) | 40 (14.1%) |
| 15 to 19 Years | 61 (15.9%) | 19 (6.7%) |
| 20 to 24 Years | 45 (11.7%) | 0 (0.0%) |
| 25 to 29 Years | 37 (9.6%) | 0 (0.0%) |
| 30 to 34 Years | 0 (0.0%) | 0 (0.0%) |
| 35 to 39 Years | 0 (0.0%) | 34 (12.0%) |
| 40 to 44 Years | 0 (0.0%) | 26 (9.2%) |
| 45 to 49 Years | 67 (17.4%) | 19 (6.7%) |
| 50 to 54 Years | 26 (6.8%) | 29 (10.2%) |
| 55 to 59 Years | 42 (10.9%) | 33 (11.7%) |
| 60 to 64 Years | 23 (6.0%) | 16 (5.7%) |
| 65 to 69 Years | 0 (0.0%) | 0 (0.0%) |
| 70 to 74 Years | 28 (7.3%) | 9 (3.2%) |
| 75 to 79 Years | 0 (0.0%) | 48 (17.0%) |
| 80 to 84 Years | 55 (14.3%) | 10 (3.5%) |
| 85 Years and over | 0 (0.0%) | 0 (0.0%) |
| Total | 384 (100.0%) | 283 (100.0%) |
Families and Households in Taylorsville
Median Family Size in Taylorsville
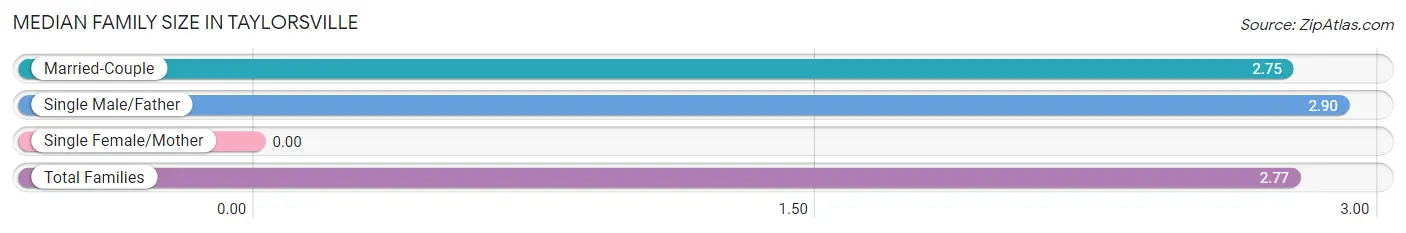
| Family Type | # Families | Family Size |
| Married-Couple | 173 (81.2%) | 2.75 |
| Single Male/Father | 40 (18.8%) | 2.90 |
| Single Female/Mother | 0 (0.0%) | - |
| Total Families | 213 (100.0%) | 2.77 |
Median Household Size in Taylorsville
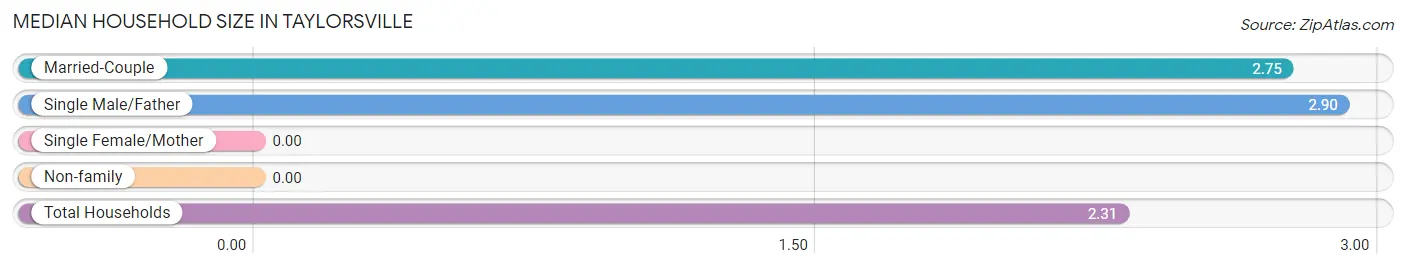
| Household Type | # Households | Household Size |
| Married-Couple | 173 (59.9%) | 2.75 |
| Single Male/Father | 40 (13.8%) | 2.90 |
| Single Female/Mother | 0 (0.0%) | - |
| Non-family | 76 (26.3%) | - |
| Total Households | 289 (100.0%) | 2.31 |
Household Size by Marriage Status in Taylorsville
Out of a total of 289 households in Taylorsville, 213 (73.7%) are family households, while 76 (26.3%) are nonfamily households. The most numerous type of family households are 2-person households, comprising 111, and the most common type of nonfamily households are 1-person households, comprising 76.
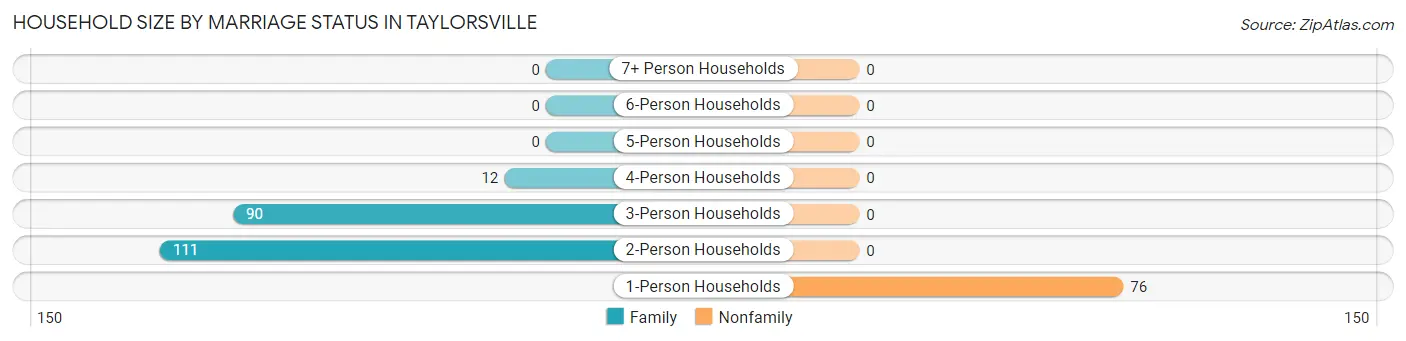
| Household Size | Family Households | Nonfamily Households |
| 1-Person Households | - | 76 (26.3%) |
| 2-Person Households | 111 (38.4%) | 0 (0.0%) |
| 3-Person Households | 90 (31.1%) | 0 (0.0%) |
| 4-Person Households | 12 (4.2%) | 0 (0.0%) |
| 5-Person Households | 0 (0.0%) | 0 (0.0%) |
| 6-Person Households | 0 (0.0%) | 0 (0.0%) |
| 7+ Person Households | 0 (0.0%) | 0 (0.0%) |
| Total | 213 (73.7%) | 76 (26.3%) |
Female Fertility in Taylorsville
Fertility by Age in Taylorsville
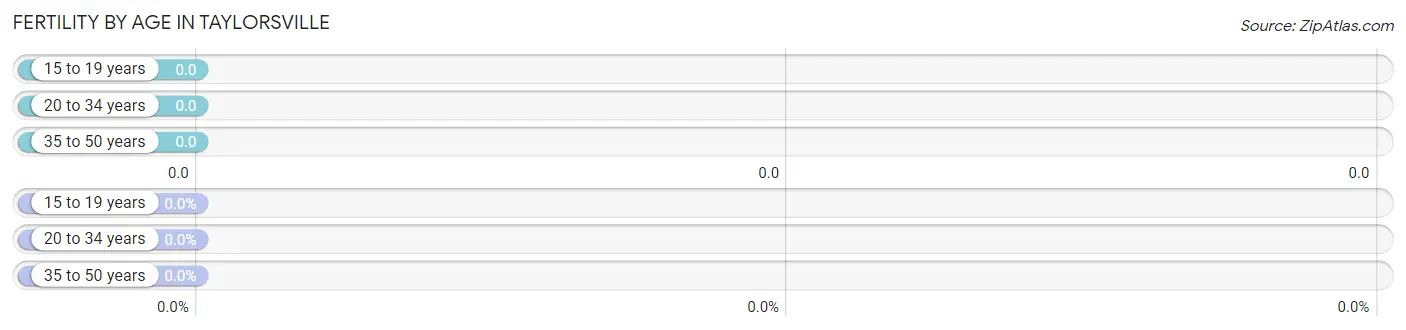
| Age Bracket | Women with Births | Births / 1,000 Women |
| 15 to 19 years | 0 (0.0%) | 0.0 |
| 20 to 34 years | 0 (0.0%) | 0.0 |
| 35 to 50 years | 0 (0.0%) | 0.0 |
| Total | 0 (0.0%) | 0.0 |
Fertility by Age by Marriage Status in Taylorsville
| Age Bracket | Married | Unmarried |
| 15 to 19 years | 0 (0.0%) | 0 (0.0%) |
| 20 to 34 years | 0 (0.0%) | 0 (0.0%) |
| 35 to 50 years | 0 (0.0%) | 0 (0.0%) |
| Total | 0 (0.0%) | 0 (0.0%) |
Fertility by Education in Taylorsville
| Educational Attainment | Women with Births | Births / 1,000 Women |
| Less than High School | 0 (0.0%) | 0.0 |
| High School Diploma | 0 (0.0%) | 0.0 |
| College or Associate's Degree | 0 (0.0%) | 0.0 |
| Bachelor's Degree | 0 (0.0%) | 0.0 |
| Graduate Degree | 0 (0.0%) | 0.0 |
| Total | 0 (0.0%) | 0.0 |
Fertility by Education by Marriage Status in Taylorsville
| Educational Attainment | Married | Unmarried |
| Less than High School | 0 (0.0%) | 0 (0.0%) |
| High School Diploma | 0 (0.0%) | 0 (0.0%) |
| College or Associate's Degree | 0 (0.0%) | 0 (0.0%) |
| Bachelor's Degree | 0 (0.0%) | 0 (0.0%) |
| Graduate Degree | 0 (0.0%) | 0 (0.0%) |
| Total | 0 (0.0%) | 0 (0.0%) |
Income in Taylorsville
Income Overview in Taylorsville
Per Capita Income in Taylorsville is $37,792, while median incomes of families and households are $82,969 and $59,306 respectively.
| Characteristic | Number | Measure |
| Per Capita Income | 667 | $37,792 |
| Median Family Income | 213 | $82,969 |
| Mean Family Income | 213 | $103,181 |
| Median Household Income | 289 | $59,306 |
| Mean Household Income | 289 | $84,917 |
| Income Deficit | 213 | $0 |
| Wage / Income Gap (%) | 667 | 0.00% |
| Wage / Income Gap ($) | 667 | 100.00¢ per $1 |
| Gini / Inequality Index | 667 | 0.44 |
Earnings by Sex in Taylorsville
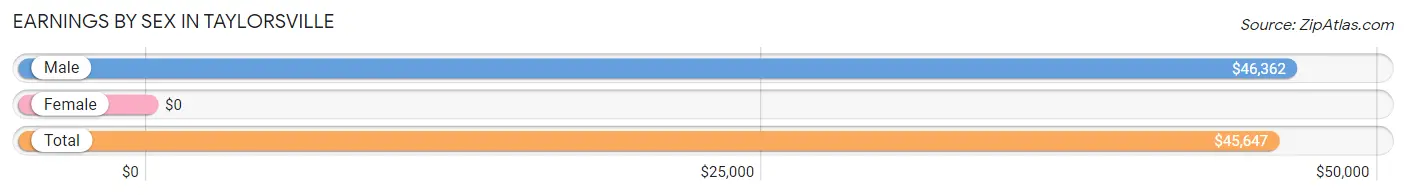
| Sex | Number | Average Earnings |
| Male | 241 (66.4%) | $46,362 |
| Female | 122 (33.6%) | $0 |
| Total | 363 (100.0%) | $45,647 |
Earnings by Sex by Income Bracket in Taylorsville
The most common earnings brackets in Taylorsville are $45,000 to $49,999 for men (56 | 23.2%) and $17,500 to $19,999 for women (34 | 27.9%).
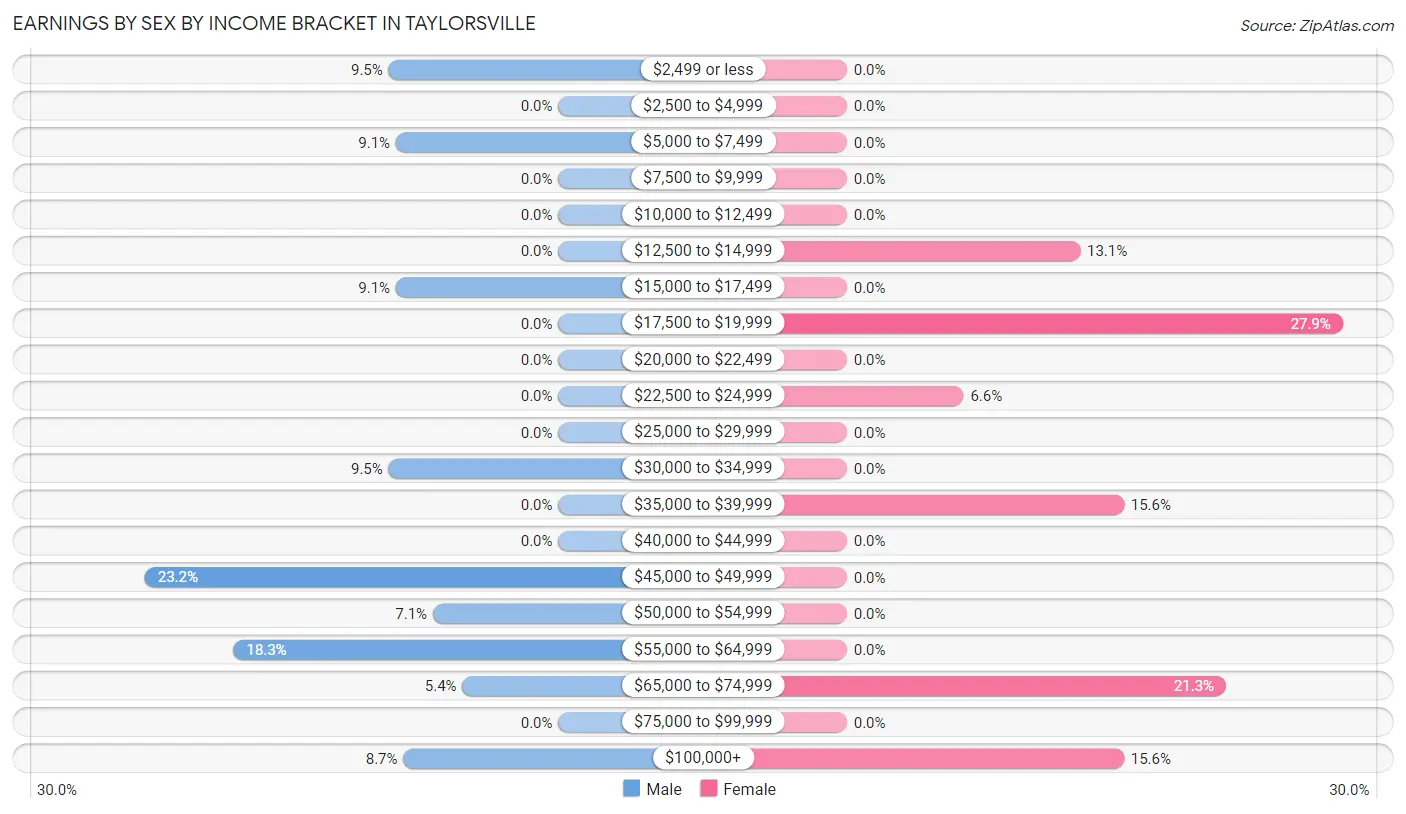
| Income | Male | Female |
| $2,499 or less | 23 (9.5%) | 0 (0.0%) |
| $2,500 to $4,999 | 0 (0.0%) | 0 (0.0%) |
| $5,000 to $7,499 | 22 (9.1%) | 0 (0.0%) |
| $7,500 to $9,999 | 0 (0.0%) | 0 (0.0%) |
| $10,000 to $12,499 | 0 (0.0%) | 0 (0.0%) |
| $12,500 to $14,999 | 0 (0.0%) | 16 (13.1%) |
| $15,000 to $17,499 | 22 (9.1%) | 0 (0.0%) |
| $17,500 to $19,999 | 0 (0.0%) | 34 (27.9%) |
| $20,000 to $22,499 | 0 (0.0%) | 0 (0.0%) |
| $22,500 to $24,999 | 0 (0.0%) | 8 (6.6%) |
| $25,000 to $29,999 | 0 (0.0%) | 0 (0.0%) |
| $30,000 to $34,999 | 23 (9.5%) | 0 (0.0%) |
| $35,000 to $39,999 | 0 (0.0%) | 19 (15.6%) |
| $40,000 to $44,999 | 0 (0.0%) | 0 (0.0%) |
| $45,000 to $49,999 | 56 (23.2%) | 0 (0.0%) |
| $50,000 to $54,999 | 17 (7.0%) | 0 (0.0%) |
| $55,000 to $64,999 | 44 (18.3%) | 0 (0.0%) |
| $65,000 to $74,999 | 13 (5.4%) | 26 (21.3%) |
| $75,000 to $99,999 | 0 (0.0%) | 0 (0.0%) |
| $100,000+ | 21 (8.7%) | 19 (15.6%) |
| Total | 241 (100.0%) | 122 (100.0%) |
Earnings by Sex by Educational Attainment in Taylorsville
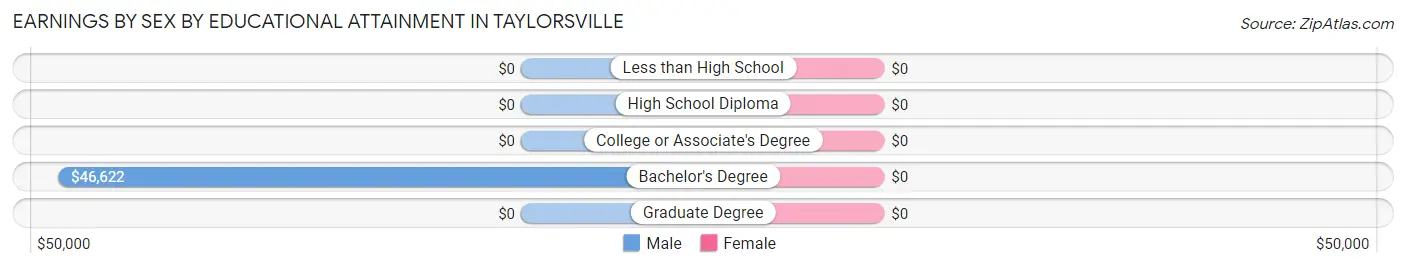
| Educational Attainment | Male Income | Female Income |
| Less than High School | - | - |
| High School Diploma | - | - |
| College or Associate's Degree | - | - |
| Bachelor's Degree | $46,622 | $0 |
| Graduate Degree | - | - |
| Total | $46,339 | $0 |
Family Income in Taylorsville
Family Income Brackets in Taylorsville
According to the Taylorsville family income data, there are 87 families falling into the $75,000 to $99,999 income range, which is the most common income bracket and makes up 40.8% of all families.
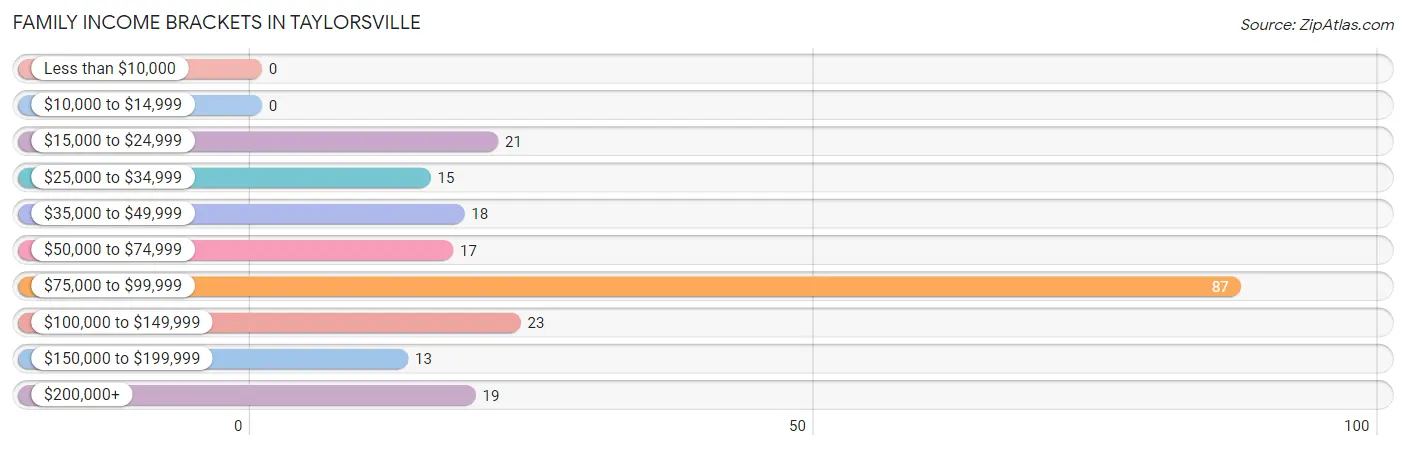
| Income Bracket | # Families | % Families |
| Less than $10,000 | 0 | 0.0% |
| $10,000 to $14,999 | 0 | 0.0% |
| $15,000 to $24,999 | 21 | 9.9% |
| $25,000 to $34,999 | 15 | 7.0% |
| $35,000 to $49,999 | 18 | 8.5% |
| $50,000 to $74,999 | 17 | 8.0% |
| $75,000 to $99,999 | 87 | 40.8% |
| $100,000 to $149,999 | 23 | 10.8% |
| $150,000 to $199,999 | 13 | 6.1% |
| $200,000+ | 19 | 8.9% |
Family Income by Famaliy Size in Taylorsville
2-person families (111 | 52.1%) account for the highest median family income in Taylorsville with $80,625 per family, while 2-person families (111 | 52.1%) have the highest median income of $40,312 per family member.
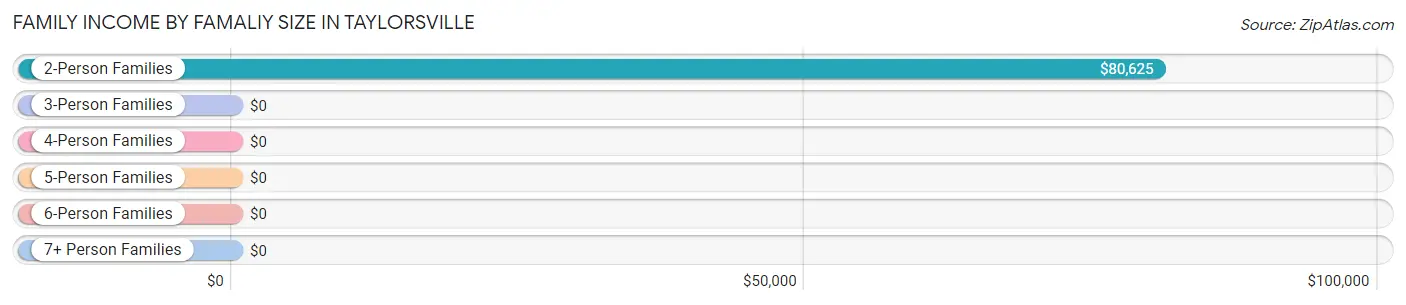
| Income Bracket | # Families | Median Income |
| 2-Person Families | 111 (52.1%) | $80,625 |
| 3-Person Families | 90 (42.2%) | $0 |
| 4-Person Families | 12 (5.6%) | $0 |
| 5-Person Families | 0 (0.0%) | $0 |
| 6-Person Families | 0 (0.0%) | $0 |
| 7+ Person Families | 0 (0.0%) | $0 |
| Total | 213 (100.0%) | $82,969 |
Family Income by Number of Earners in Taylorsville
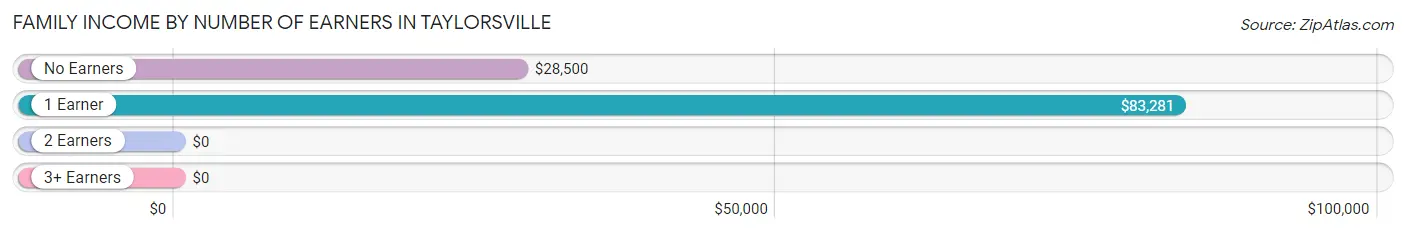
| Number of Earners | # Families | Median Income |
| No Earners | 54 (25.4%) | $28,500 |
| 1 Earner | 83 (39.0%) | $83,281 |
| 2 Earners | 38 (17.8%) | $0 |
| 3+ Earners | 38 (17.8%) | $0 |
| Total | 213 (100.0%) | $82,969 |
Household Income in Taylorsville
Household Income Brackets in Taylorsville
With 87 households falling in the category, the $75,000 to $99,999 income range is the most frequent in Taylorsville, accounting for 30.1% of all households. In contrast, only 13 households (4.5%) fall into the $150,000 to $199,999 income bracket, making it the least populous group.
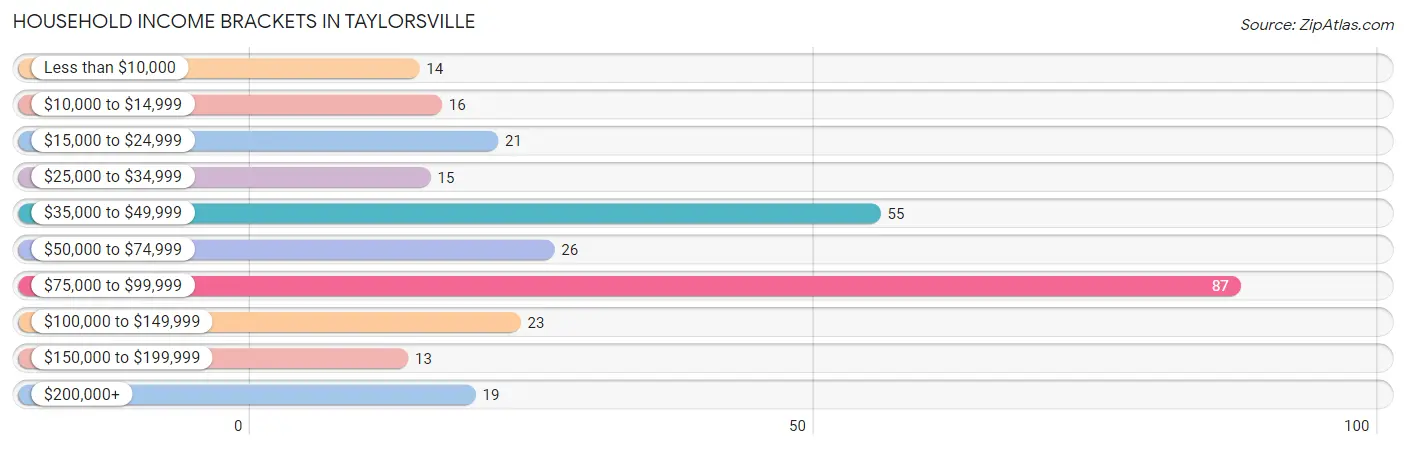
| Income Bracket | # Households | % Households |
| Less than $10,000 | 14 | 4.8% |
| $10,000 to $14,999 | 16 | 5.5% |
| $15,000 to $24,999 | 21 | 7.3% |
| $25,000 to $34,999 | 15 | 5.2% |
| $35,000 to $49,999 | 55 | 19.0% |
| $50,000 to $74,999 | 26 | 9.0% |
| $75,000 to $99,999 | 87 | 30.1% |
| $100,000 to $149,999 | 23 | 8.0% |
| $150,000 to $199,999 | 13 | 4.5% |
| $200,000+ | 19 | 6.6% |
Household Income by Householder Age in Taylorsville
The median household income in Taylorsville is $59,306, with the highest median household income of $80,417 found in the 45 to 64 years age bracket for the primary householder. A total of 158 households (54.7%) fall into this category.
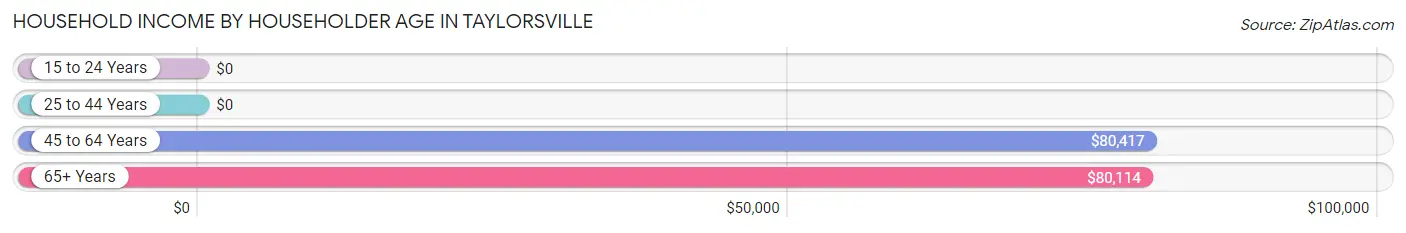
| Income Bracket | # Households | Median Income |
| 15 to 24 Years | 0 (0.0%) | $0 |
| 25 to 44 Years | 63 (21.8%) | $0 |
| 45 to 64 Years | 158 (54.7%) | $80,417 |
| 65+ Years | 68 (23.5%) | $80,114 |
| Total | 289 (100.0%) | $59,306 |
Poverty in Taylorsville
Income Below Poverty by Sex and Age in Taylorsville
With 13.0% poverty level for males and 18.0% for females among the residents of Taylorsville, 16 and 17 year old males and 55 to 64 year old females are the most vulnerable to poverty, with 24 males (100.0%) and 30 females (61.2%) in their respective age groups living below the poverty level.
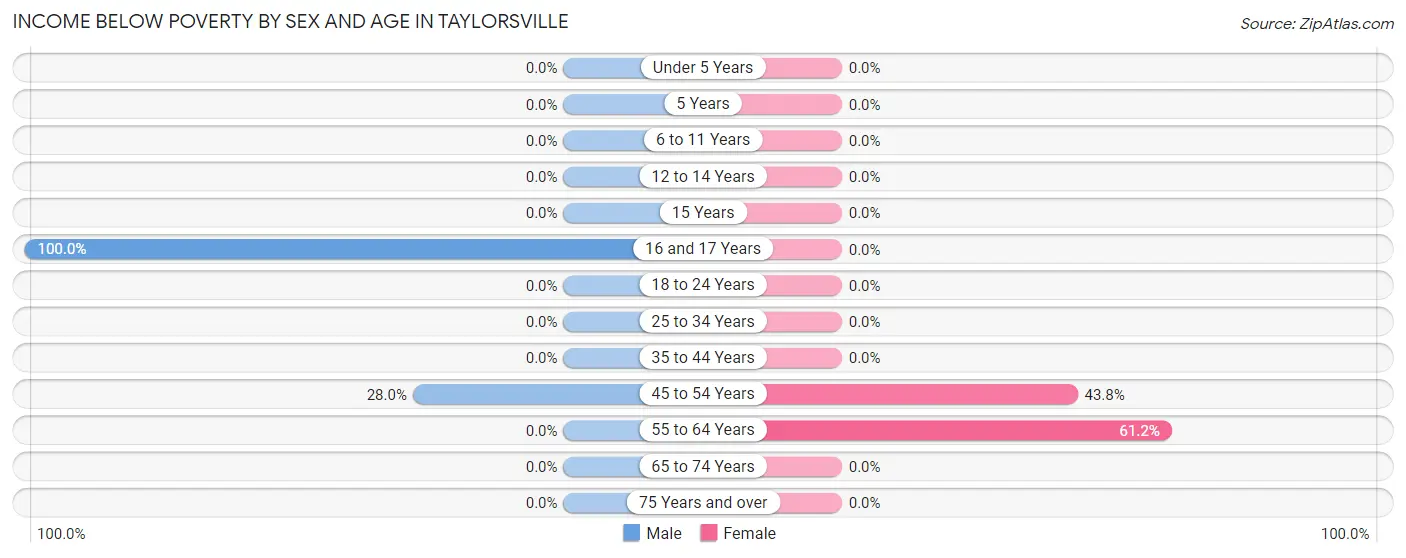
| Age Bracket | Male | Female |
| Under 5 Years | 0 (0.0%) | 0 (0.0%) |
| 5 Years | 0 (0.0%) | 0 (0.0%) |
| 6 to 11 Years | 0 (0.0%) | 0 (0.0%) |
| 12 to 14 Years | 0 (0.0%) | 0 (0.0%) |
| 15 Years | 0 (0.0%) | 0 (0.0%) |
| 16 and 17 Years | 24 (100.0%) | 0 (0.0%) |
| 18 to 24 Years | 0 (0.0%) | 0 (0.0%) |
| 25 to 34 Years | 0 (0.0%) | 0 (0.0%) |
| 35 to 44 Years | 0 (0.0%) | 0 (0.0%) |
| 45 to 54 Years | 26 (28.0%) | 21 (43.8%) |
| 55 to 64 Years | 0 (0.0%) | 30 (61.2%) |
| 65 to 74 Years | 0 (0.0%) | 0 (0.0%) |
| 75 Years and over | 0 (0.0%) | 0 (0.0%) |
| Total | 50 (13.0%) | 51 (18.0%) |
Income Above Poverty by Sex and Age in Taylorsville
According to the poverty statistics in Taylorsville, males aged 15 years and females aged 12 to 14 years are the age groups that are most secure financially, with 100.0% of males and 100.0% of females in these age groups living above the poverty line.
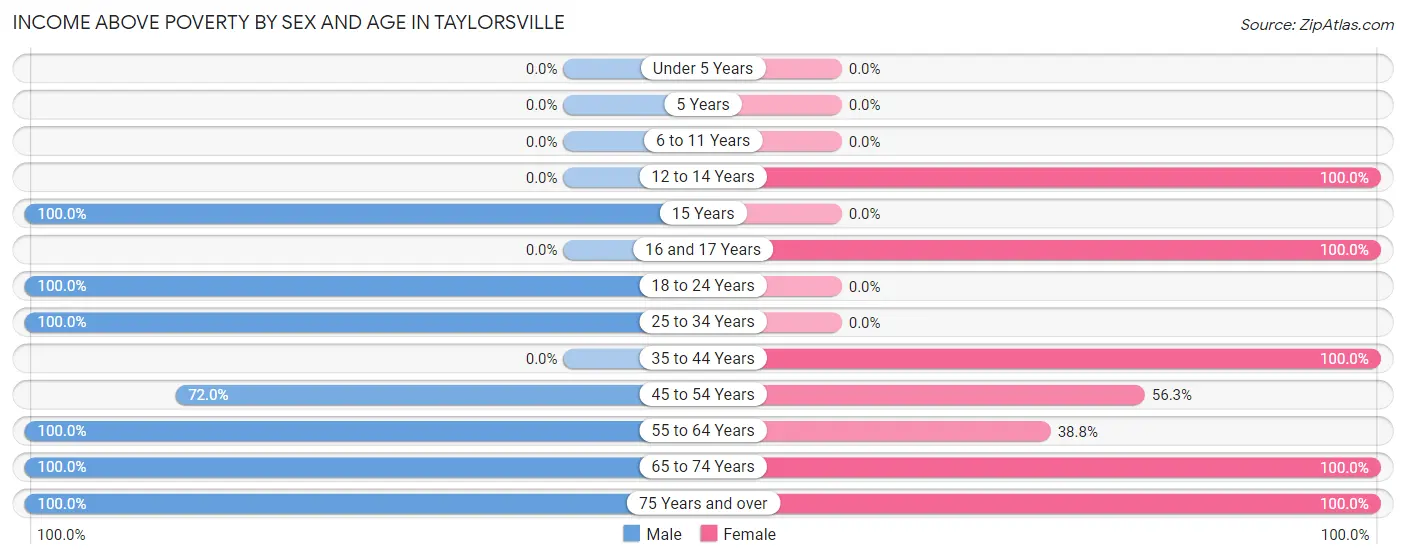
| Age Bracket | Male | Female |
| Under 5 Years | 0 (0.0%) | 0 (0.0%) |
| 5 Years | 0 (0.0%) | 0 (0.0%) |
| 6 to 11 Years | 0 (0.0%) | 0 (0.0%) |
| 12 to 14 Years | 0 (0.0%) | 40 (100.0%) |
| 15 Years | 37 (100.0%) | 0 (0.0%) |
| 16 and 17 Years | 0 (0.0%) | 19 (100.0%) |
| 18 to 24 Years | 45 (100.0%) | 0 (0.0%) |
| 25 to 34 Years | 37 (100.0%) | 0 (0.0%) |
| 35 to 44 Years | 0 (0.0%) | 60 (100.0%) |
| 45 to 54 Years | 67 (72.0%) | 27 (56.2%) |
| 55 to 64 Years | 65 (100.0%) | 19 (38.8%) |
| 65 to 74 Years | 28 (100.0%) | 9 (100.0%) |
| 75 Years and over | 55 (100.0%) | 58 (100.0%) |
| Total | 334 (87.0%) | 232 (82.0%) |
Income Below Poverty Among Married-Couple Families in Taylorsville
The poverty statistics for married-couple families in Taylorsville show that 12.1% or 21 of the total 173 families live below the poverty line. Families with 1 or 2 children have the highest poverty rate of 63.6%, comprising of 21 families. On the other hand, families with no children have the lowest poverty rate of 0.0%, which includes 0 families.
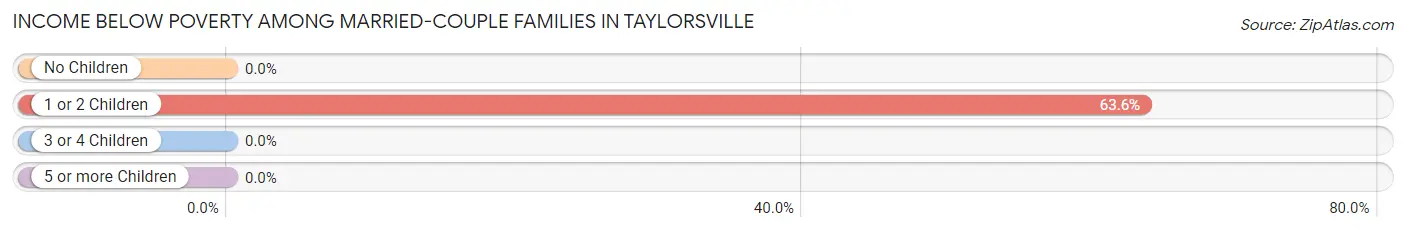
| Children | Above Poverty | Below Poverty |
| No Children | 140 (100.0%) | 0 (0.0%) |
| 1 or 2 Children | 12 (36.4%) | 21 (63.6%) |
| 3 or 4 Children | 0 (0.0%) | 0 (0.0%) |
| 5 or more Children | 0 (0.0%) | 0 (0.0%) |
| Total | 152 (87.9%) | 21 (12.1%) |
Income Below Poverty Among Single-Parent Households in Taylorsville
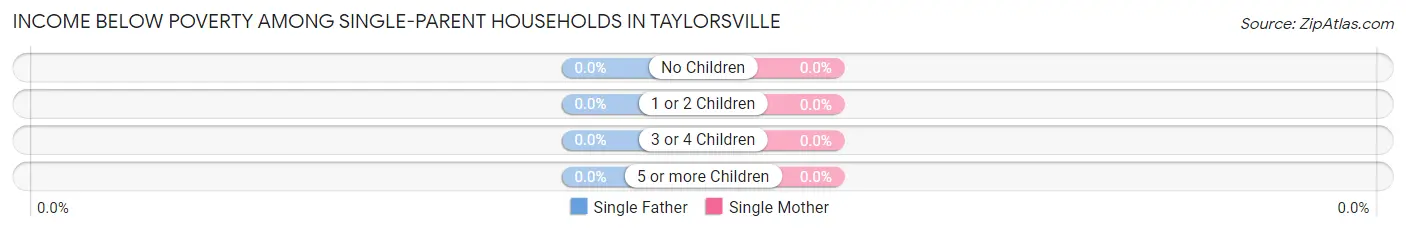
| Children | Single Father | Single Mother |
| No Children | 0 (0.0%) | 0 (0.0%) |
| 1 or 2 Children | 0 (0.0%) | 0 (0.0%) |
| 3 or 4 Children | 0 (0.0%) | 0 (0.0%) |
| 5 or more Children | 0 (0.0%) | 0 (0.0%) |
| Total | 0 (0.0%) | 0 (0.0%) |
Income Below Poverty Among Married-Couple vs Single-Parent Households in Taylorsville
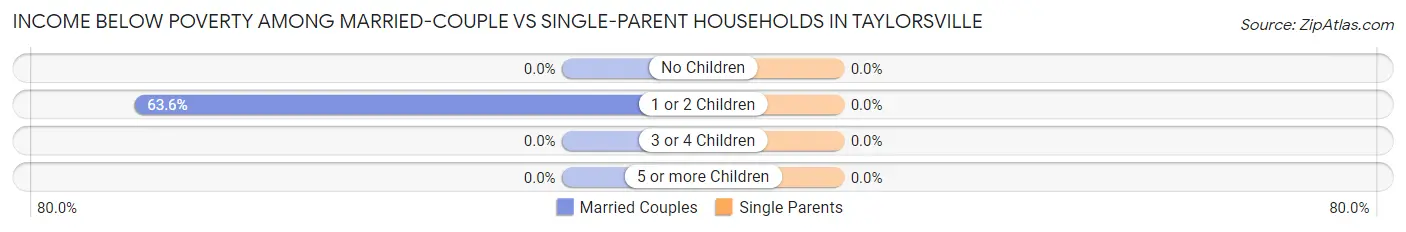
| Children | Married-Couple Families | Single-Parent Households |
| No Children | 0 (0.0%) | 0 (0.0%) |
| 1 or 2 Children | 21 (63.6%) | 0 (0.0%) |
| 3 or 4 Children | 0 (0.0%) | 0 (0.0%) |
| 5 or more Children | 0 (0.0%) | 0 (0.0%) |
| Total | 21 (12.1%) | 0 (0.0%) |
Employment Characteristics in Taylorsville
Employment by Class of Employer in Taylorsville
Among the 318 employed individuals in Taylorsville, private company employees (189 | 59.4%), not-for-profit organizations (46 | 14.5%), and self-employed (not incorporated) (39 | 12.3%) make up the most common classes of employment.
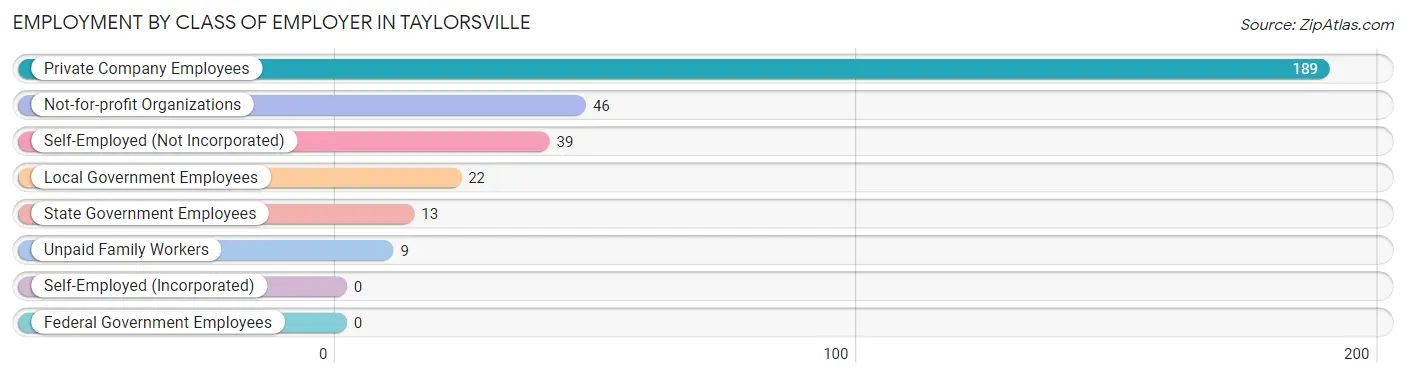
| Employer Class | # Employees | % Employees |
| Private Company Employees | 189 | 59.4% |
| Self-Employed (Incorporated) | 0 | 0.0% |
| Self-Employed (Not Incorporated) | 39 | 12.3% |
| Not-for-profit Organizations | 46 | 14.5% |
| Local Government Employees | 22 | 6.9% |
| State Government Employees | 13 | 4.1% |
| Federal Government Employees | 0 | 0.0% |
| Unpaid Family Workers | 9 | 2.8% |
| Total | 318 | 100.0% |
Employment Status by Age in Taylorsville
According to the labor force statistics for Taylorsville, out of the total population over 16 years of age (590), 57.8% or 341 individuals are in the labor force, with 6.7% or 23 of them unemployed. The age group with the highest labor force participation rate is 25 to 29 years, with 100.0% or 37 individuals in the labor force. Within the labor force, the 45 to 54 years age range has the highest percentage of unemployed individuals, with 26.7% or 23 of them being unemployed.
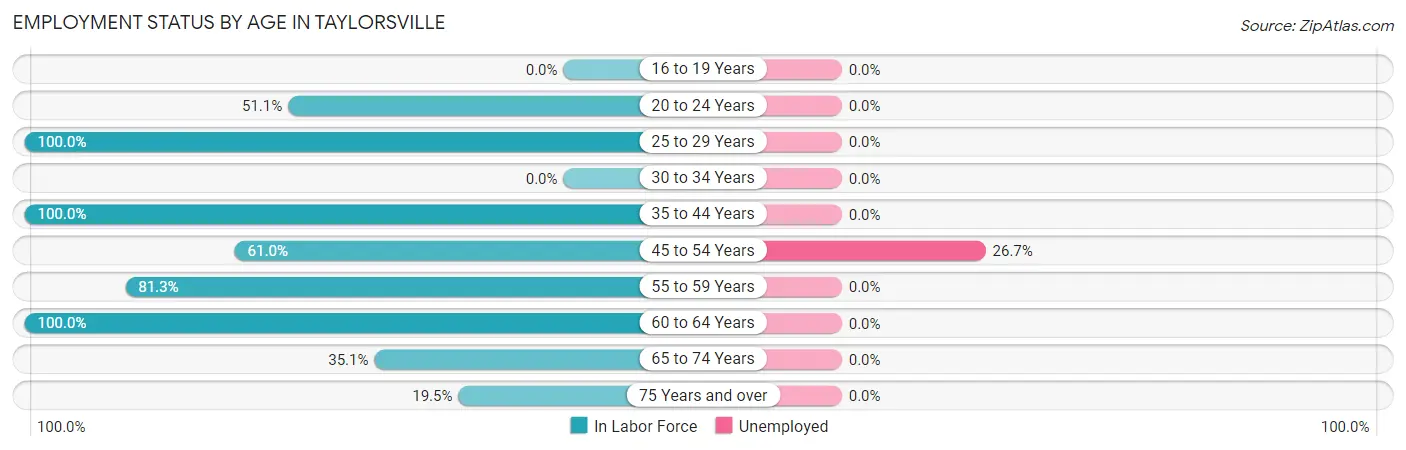
| Age Bracket | In Labor Force | Unemployed |
| 16 to 19 Years | 0 (0.0%) | 0 (0.0%) |
| 20 to 24 Years | 23 (51.1%) | 0 (0.0%) |
| 25 to 29 Years | 37 (100.0%) | 0 (0.0%) |
| 30 to 34 Years | 0 (0.0%) | 0 (0.0%) |
| 35 to 44 Years | 60 (100.0%) | 0 (0.0%) |
| 45 to 54 Years | 86 (61.0%) | 23 (26.7%) |
| 55 to 59 Years | 61 (81.3%) | 0 (0.0%) |
| 60 to 64 Years | 39 (100.0%) | 0 (0.0%) |
| 65 to 74 Years | 13 (35.1%) | 0 (0.0%) |
| 75 Years and over | 22 (19.5%) | 0 (0.0%) |
| Total | 341 (57.8%) | 23 (6.7%) |
Employment Status by Educational Attainment in Taylorsville
According to labor force statistics for Taylorsville, 80.4% of individuals (283) out of the total population between 25 and 64 years of age (352) are in the labor force, with 8.1% or 23 of them being unemployed. The group with the highest labor force participation rate are those with the educational attainment of college / associate degree, with 91.6% or 87 individuals in the labor force. Within the labor force, individuals with bachelor's degree or higher education have the highest percentage of unemployment, with 28.4% or 23 of them being unemployed.
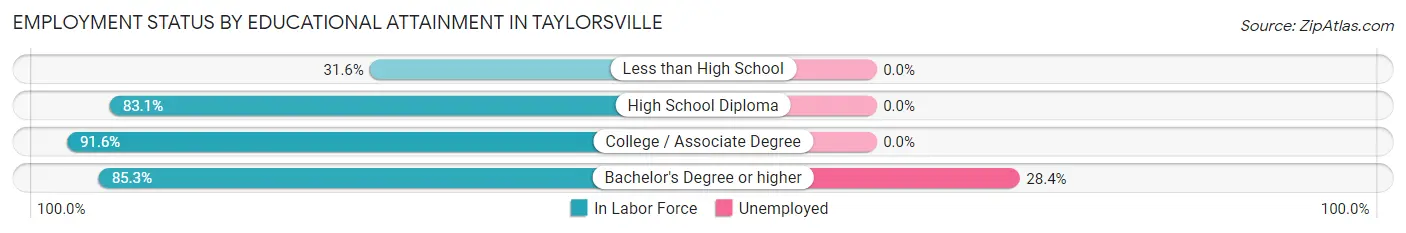
| Educational Attainment | In Labor Force | Unemployed |
| Less than High School | 12 (31.6%) | 0 (0.0%) |
| High School Diploma | 103 (83.1%) | 0 (0.0%) |
| College / Associate Degree | 87 (91.6%) | 0 (0.0%) |
| Bachelor's Degree or higher | 81 (85.3%) | 27 (28.4%) |
| Total | 283 (80.4%) | 29 (8.1%) |
Employment Occupations by Sex in Taylorsville
Management, Business, Science and Arts Occupations
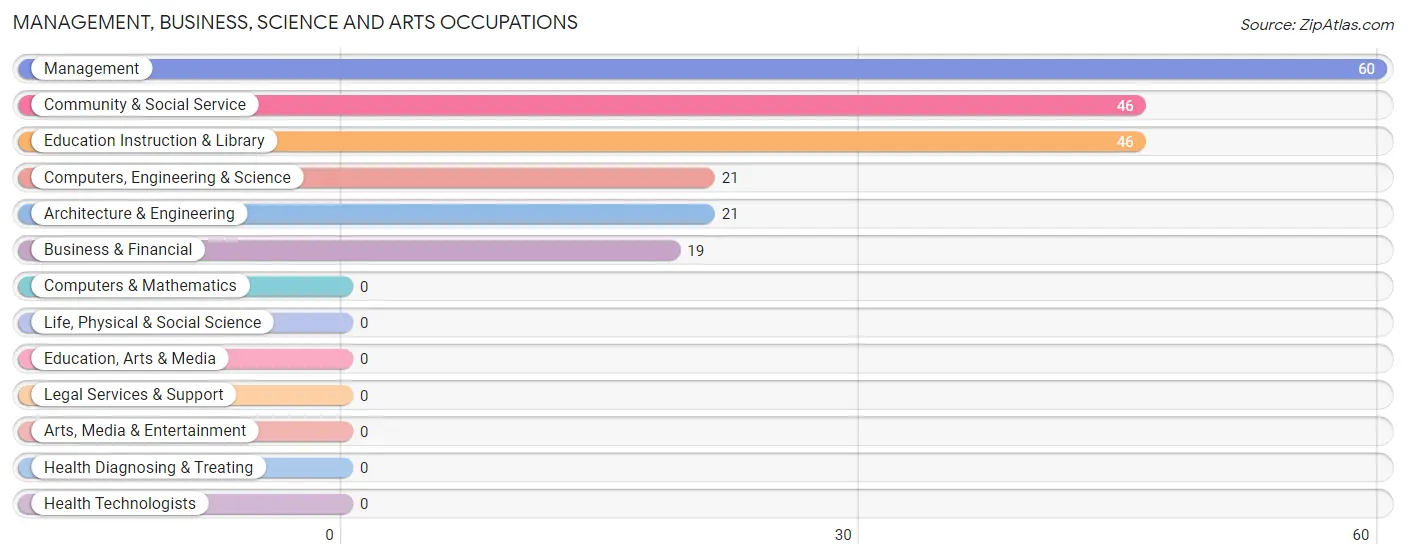
The most common Management, Business, Science and Arts occupations in Taylorsville are Management (60 | 18.9%), Community & Social Service (46 | 14.5%), Education Instruction & Library (46 | 14.5%), Computers, Engineering & Science (21 | 6.6%), and Architecture & Engineering (21 | 6.6%).
Management, Business, Science and Arts Occupations by Sex
Within the Management, Business, Science and Arts occupations in Taylorsville, the most male-oriented occupations are Management (100.0%), Computers, Engineering & Science (100.0%), and Architecture & Engineering (100.0%), while the most female-oriented occupations are Business & Financial (100.0%), Community & Social Service (73.9%), and Education Instruction & Library (73.9%).
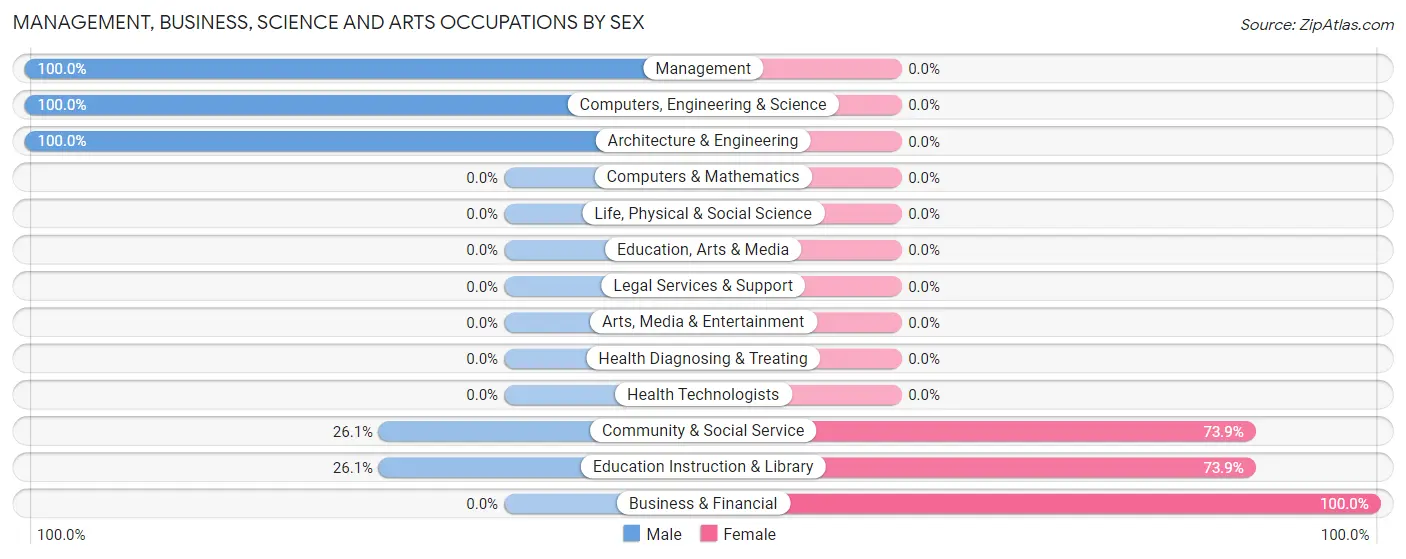
| Occupation | Male | Female |
| Management | 60 (100.0%) | 0 (0.0%) |
| Business & Financial | 0 (0.0%) | 19 (100.0%) |
| Computers, Engineering & Science | 21 (100.0%) | 0 (0.0%) |
| Computers & Mathematics | 0 (0.0%) | 0 (0.0%) |
| Architecture & Engineering | 21 (100.0%) | 0 (0.0%) |
| Life, Physical & Social Science | 0 (0.0%) | 0 (0.0%) |
| Community & Social Service | 12 (26.1%) | 34 (73.9%) |
| Education, Arts & Media | 0 (0.0%) | 0 (0.0%) |
| Legal Services & Support | 0 (0.0%) | 0 (0.0%) |
| Education Instruction & Library | 12 (26.1%) | 34 (73.9%) |
| Arts, Media & Entertainment | 0 (0.0%) | 0 (0.0%) |
| Health Diagnosing & Treating | 0 (0.0%) | 0 (0.0%) |
| Health Technologists | 0 (0.0%) | 0 (0.0%) |
| Total (Category) | 93 (63.7%) | 53 (36.3%) |
| Total (Overall) | 196 (61.6%) | 122 (38.4%) |
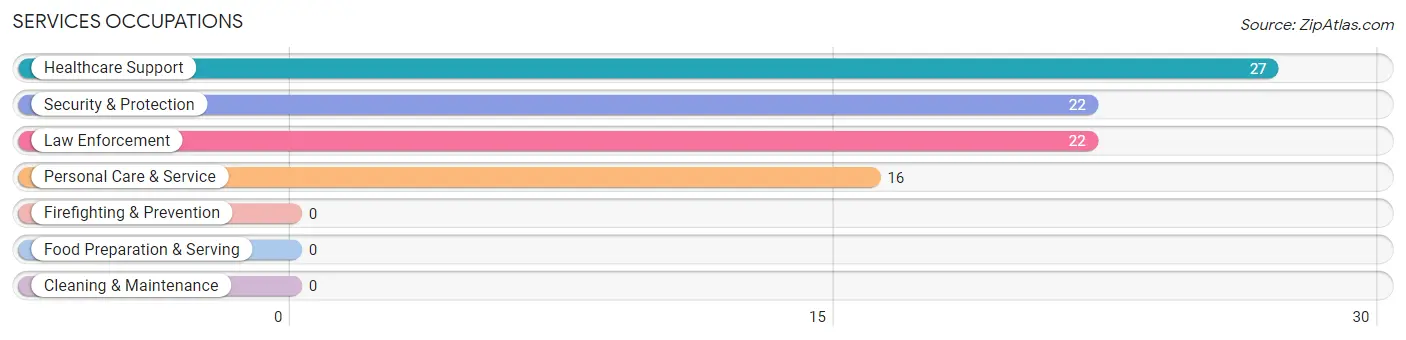
Services Occupations
The most common Services occupations in Taylorsville are Healthcare Support (27 | 8.5%), Security & Protection (22 | 6.9%), Law Enforcement (22 | 6.9%), and Personal Care & Service (16 | 5.0%).
Services Occupations by Sex
Within the Services occupations in Taylorsville, the most male-oriented occupations are Security & Protection (100.0%), and Law Enforcement (100.0%), while the most female-oriented occupations are Healthcare Support (100.0%), and Personal Care & Service (100.0%).
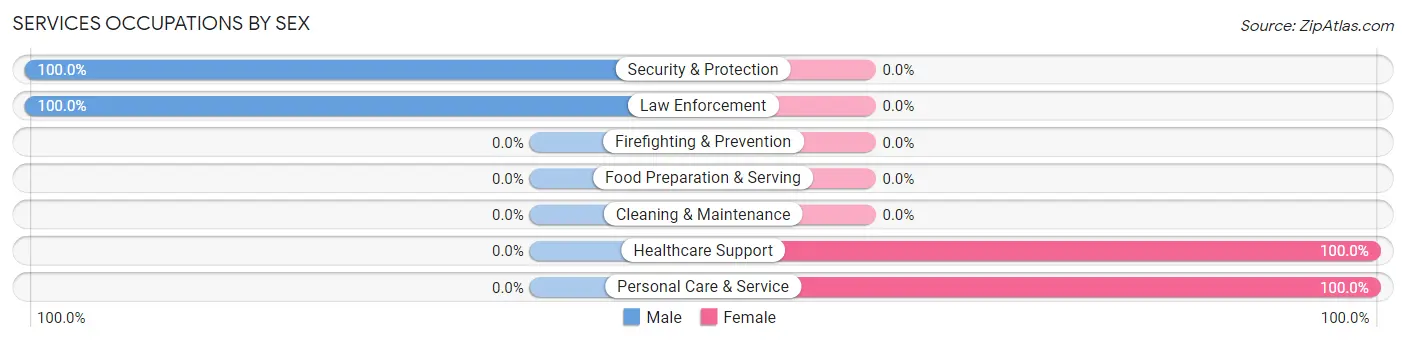
| Occupation | Male | Female |
| Healthcare Support | 0 (0.0%) | 27 (100.0%) |
| Security & Protection | 22 (100.0%) | 0 (0.0%) |
| Firefighting & Prevention | 0 (0.0%) | 0 (0.0%) |
| Law Enforcement | 22 (100.0%) | 0 (0.0%) |
| Food Preparation & Serving | 0 (0.0%) | 0 (0.0%) |
| Cleaning & Maintenance | 0 (0.0%) | 0 (0.0%) |
| Personal Care & Service | 0 (0.0%) | 16 (100.0%) |
| Total (Category) | 22 (33.9%) | 43 (66.1%) |
| Total (Overall) | 196 (61.6%) | 122 (38.4%) |
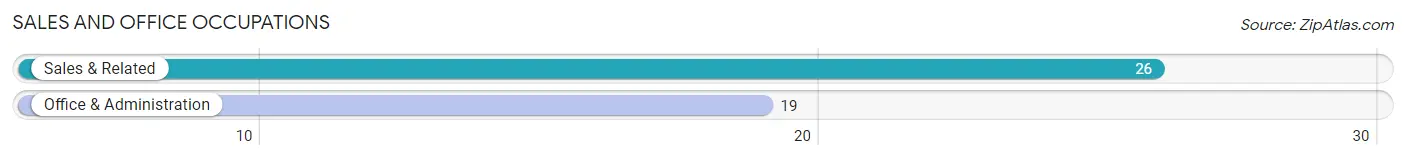
Sales and Office Occupations
The most common Sales and Office occupations in Taylorsville are Sales & Related (26 | 8.2%), and Office & Administration (19 | 6.0%).
Sales and Office Occupations by Sex

| Occupation | Male | Female |
| Sales & Related | 0 (0.0%) | 26 (100.0%) |
| Office & Administration | 19 (100.0%) | 0 (0.0%) |
| Total (Category) | 19 (42.2%) | 26 (57.8%) |
| Total (Overall) | 196 (61.6%) | 122 (38.4%) |
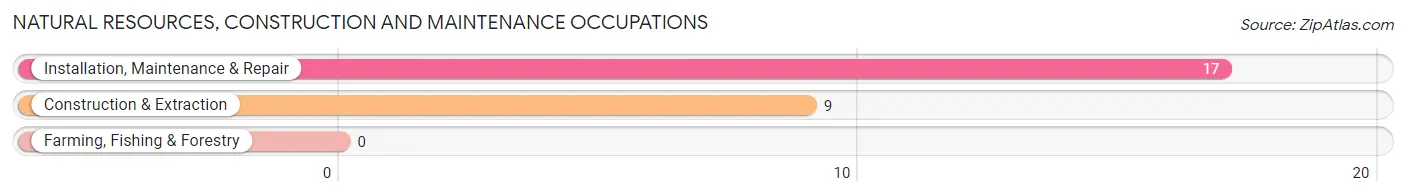
Natural Resources, Construction and Maintenance Occupations
The most common Natural Resources, Construction and Maintenance occupations in Taylorsville are Installation, Maintenance & Repair (17 | 5.3%), and Construction & Extraction (9 | 2.8%).
Natural Resources, Construction and Maintenance Occupations by Sex
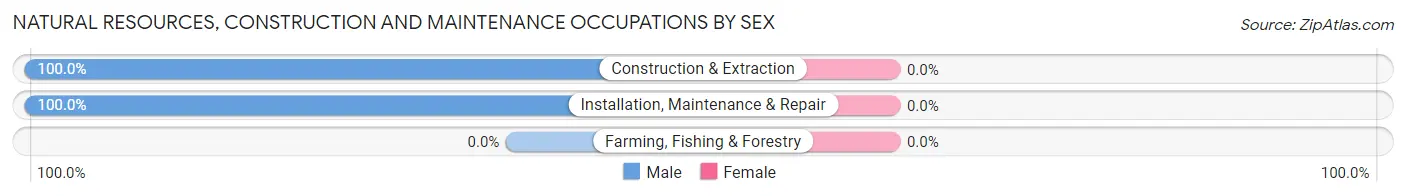
| Occupation | Male | Female |
| Farming, Fishing & Forestry | 0 (0.0%) | 0 (0.0%) |
| Construction & Extraction | 9 (100.0%) | 0 (0.0%) |
| Installation, Maintenance & Repair | 17 (100.0%) | 0 (0.0%) |
| Total (Category) | 26 (100.0%) | 0 (0.0%) |
| Total (Overall) | 196 (61.6%) | 122 (38.4%) |
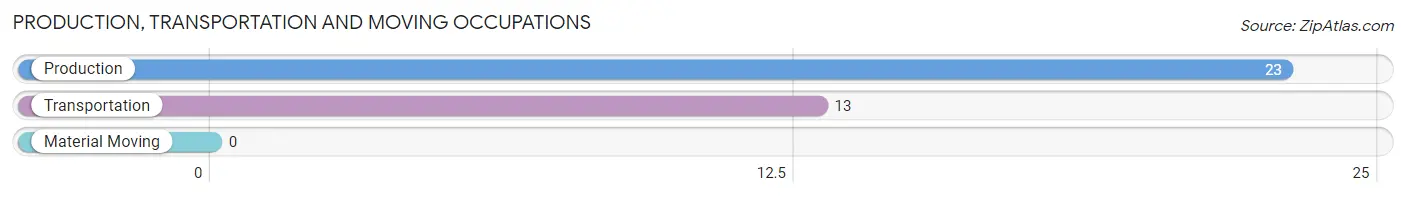
Production, Transportation and Moving Occupations
The most common Production, Transportation and Moving occupations in Taylorsville are Production (23 | 7.2%), and Transportation (13 | 4.1%).
Production, Transportation and Moving Occupations by Sex
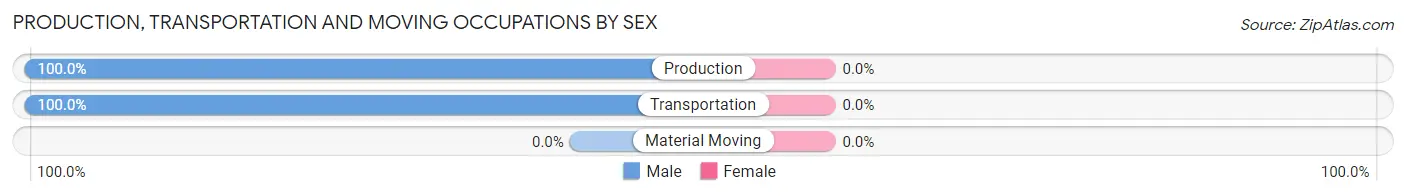
| Occupation | Male | Female |
| Production | 23 (100.0%) | 0 (0.0%) |
| Transportation | 13 (100.0%) | 0 (0.0%) |
| Material Moving | 0 (0.0%) | 0 (0.0%) |
| Total (Category) | 36 (100.0%) | 0 (0.0%) |
| Total (Overall) | 196 (61.6%) | 122 (38.4%) |
Employment Industries by Sex in Taylorsville
Employment Industries in Taylorsville
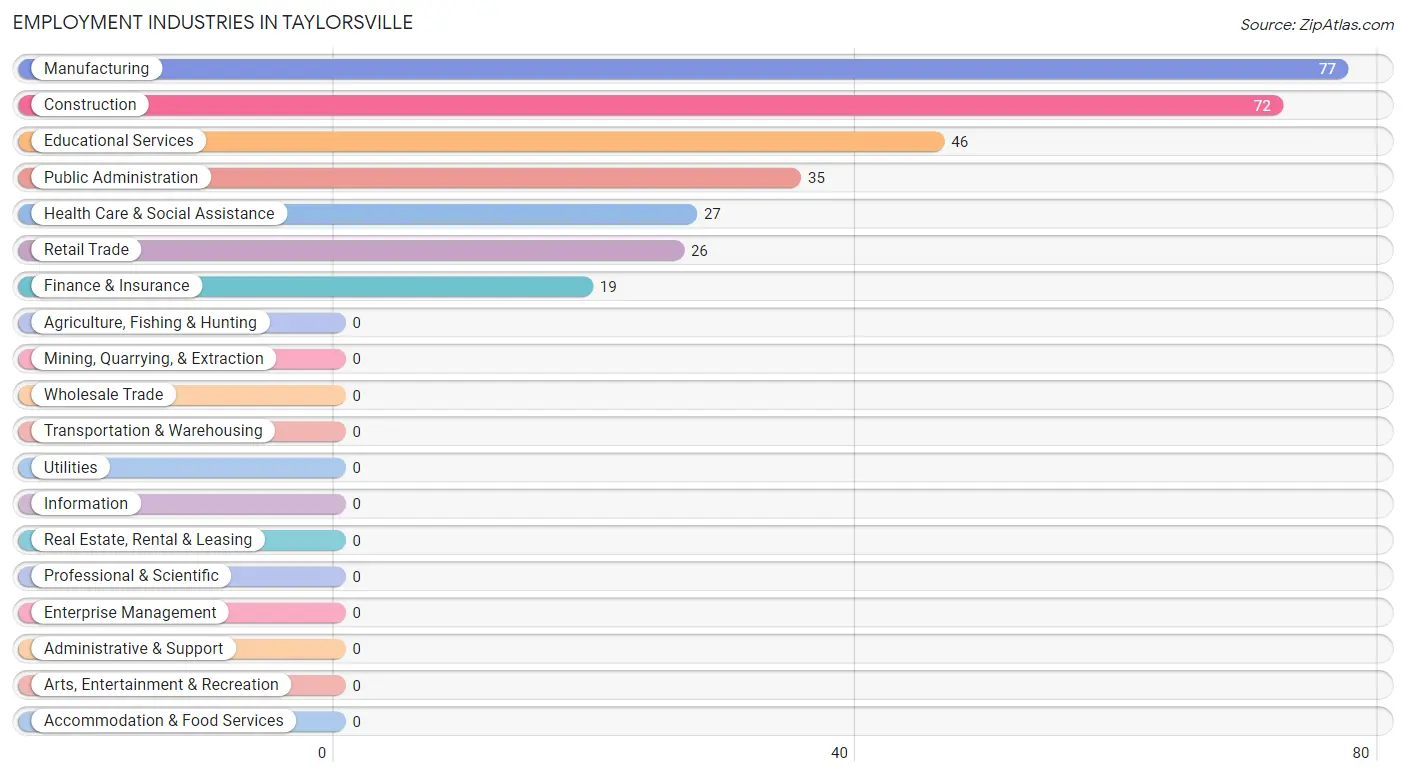
The major employment industries in Taylorsville include Manufacturing (77 | 24.2%), Construction (72 | 22.6%), Educational Services (46 | 14.5%), Public Administration (35 | 11.0%), and Health Care & Social Assistance (27 | 8.5%).
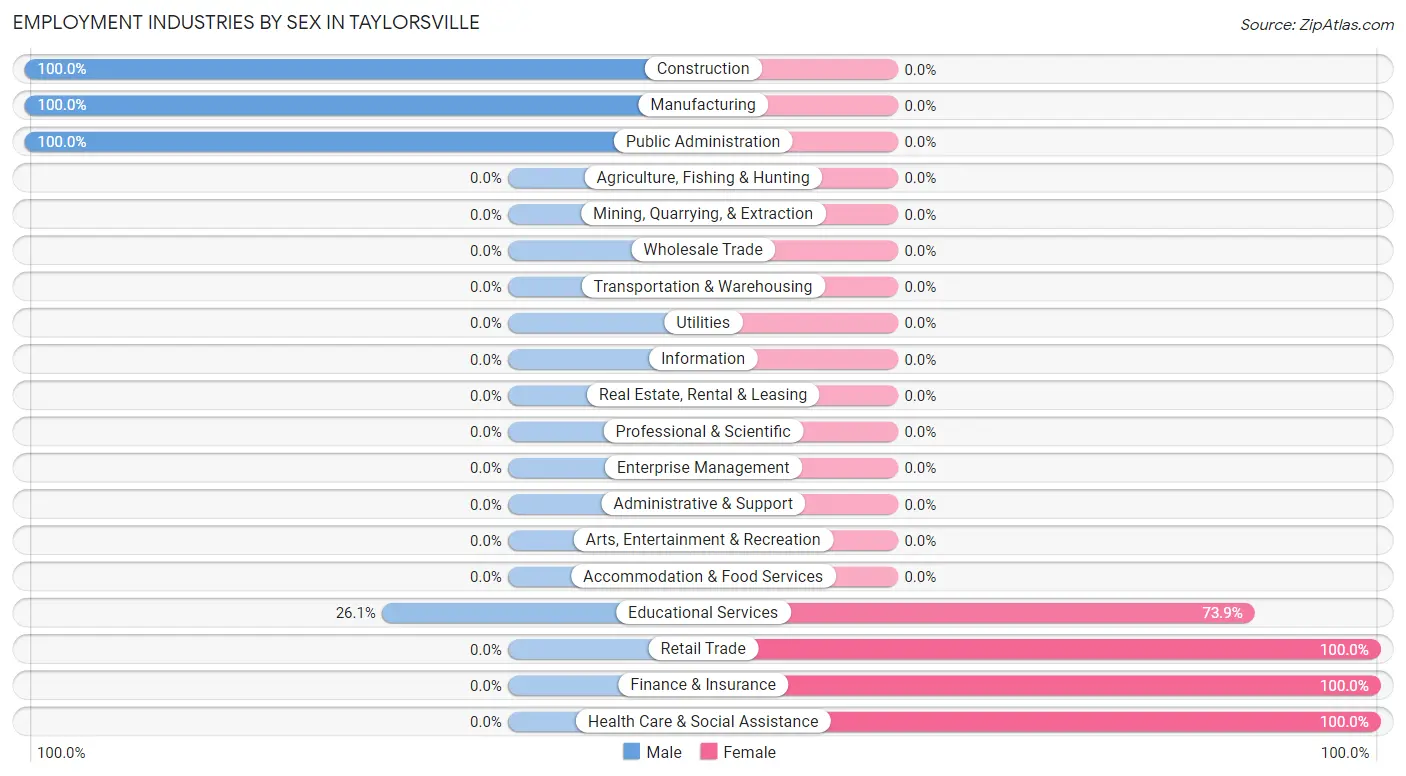
Employment Industries by Sex in Taylorsville
The Taylorsville industries that see more men than women are Construction (100.0%), Manufacturing (100.0%), and Public Administration (100.0%), whereas the industries that tend to have a higher number of women are Retail Trade (100.0%), Finance & Insurance (100.0%), and Health Care & Social Assistance (100.0%).
| Industry | Male | Female |
| Agriculture, Fishing & Hunting | 0 (0.0%) | 0 (0.0%) |
| Mining, Quarrying, & Extraction | 0 (0.0%) | 0 (0.0%) |
| Construction | 72 (100.0%) | 0 (0.0%) |
| Manufacturing | 77 (100.0%) | 0 (0.0%) |
| Wholesale Trade | 0 (0.0%) | 0 (0.0%) |
| Retail Trade | 0 (0.0%) | 26 (100.0%) |
| Transportation & Warehousing | 0 (0.0%) | 0 (0.0%) |
| Utilities | 0 (0.0%) | 0 (0.0%) |
| Information | 0 (0.0%) | 0 (0.0%) |
| Finance & Insurance | 0 (0.0%) | 19 (100.0%) |
| Real Estate, Rental & Leasing | 0 (0.0%) | 0 (0.0%) |
| Professional & Scientific | 0 (0.0%) | 0 (0.0%) |
| Enterprise Management | 0 (0.0%) | 0 (0.0%) |
| Administrative & Support | 0 (0.0%) | 0 (0.0%) |
| Educational Services | 12 (26.1%) | 34 (73.9%) |
| Health Care & Social Assistance | 0 (0.0%) | 27 (100.0%) |
| Arts, Entertainment & Recreation | 0 (0.0%) | 0 (0.0%) |
| Accommodation & Food Services | 0 (0.0%) | 0 (0.0%) |
| Public Administration | 35 (100.0%) | 0 (0.0%) |
| Total | 196 (61.6%) | 122 (38.4%) |
Education in Taylorsville
School Enrollment in Taylorsville
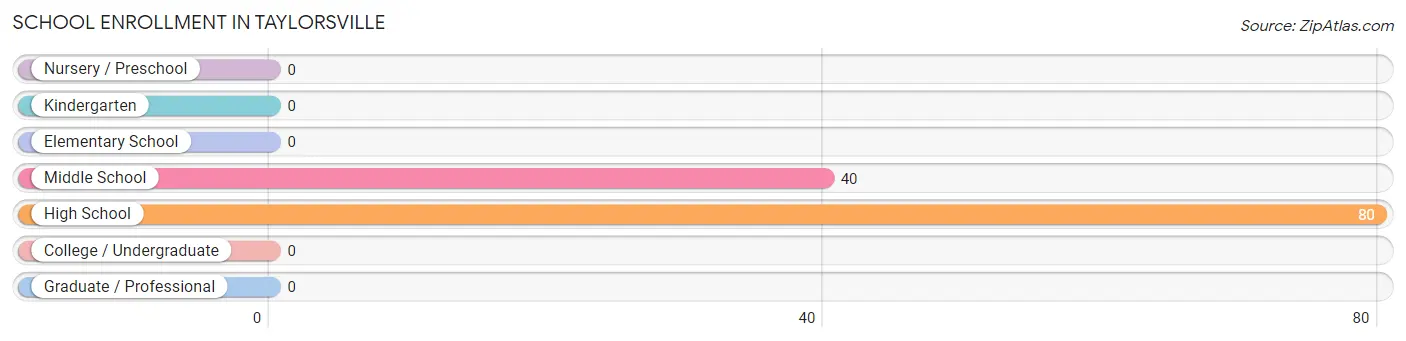
The most common levels of schooling among the 120 students in Taylorsville are high school (80 | 66.7%), and middle school (40 | 33.3%).
| School Level | # Students | % Students |
| Nursery / Preschool | 0 | 0.0% |
| Kindergarten | 0 | 0.0% |
| Elementary School | 0 | 0.0% |
| Middle School | 40 | 33.3% |
| High School | 80 | 66.7% |
| College / Undergraduate | 0 | 0.0% |
| Graduate / Professional | 0 | 0.0% |
| Total | 120 | 100.0% |
School Enrollment by Age by Funding Source in Taylorsville
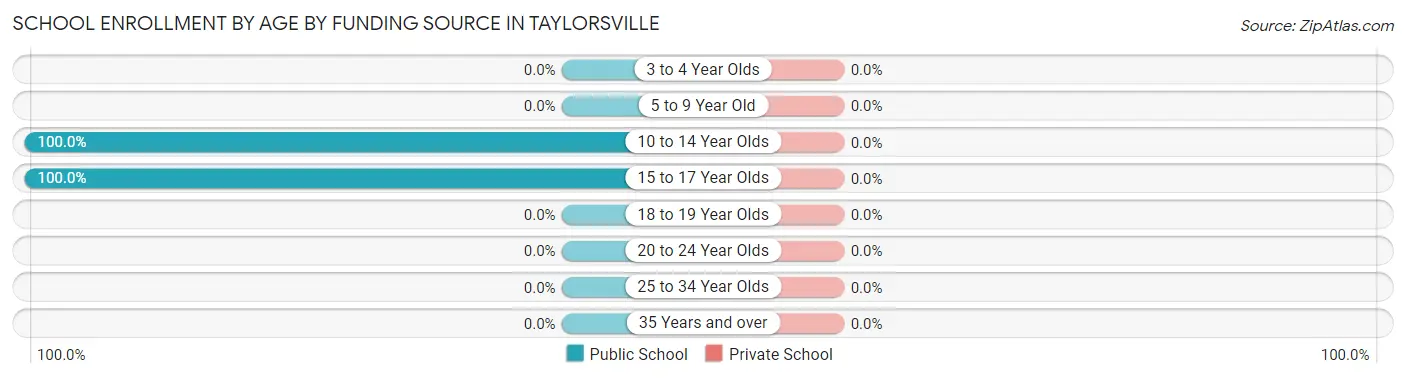
| Age Bracket | Public School | Private School |
| 3 to 4 Year Olds | 0 (0.0%) | 0 (0.0%) |
| 5 to 9 Year Old | 0 (0.0%) | 0 (0.0%) |
| 10 to 14 Year Olds | 40 (100.0%) | 0 (0.0%) |
| 15 to 17 Year Olds | 80 (100.0%) | 0 (0.0%) |
| 18 to 19 Year Olds | 0 (0.0%) | 0 (0.0%) |
| 20 to 24 Year Olds | 0 (0.0%) | 0 (0.0%) |
| 25 to 34 Year Olds | 0 (0.0%) | 0 (0.0%) |
| 35 Years and over | 0 (0.0%) | 0 (0.0%) |
| Total | 120 (100.0%) | 0 (0.0%) |
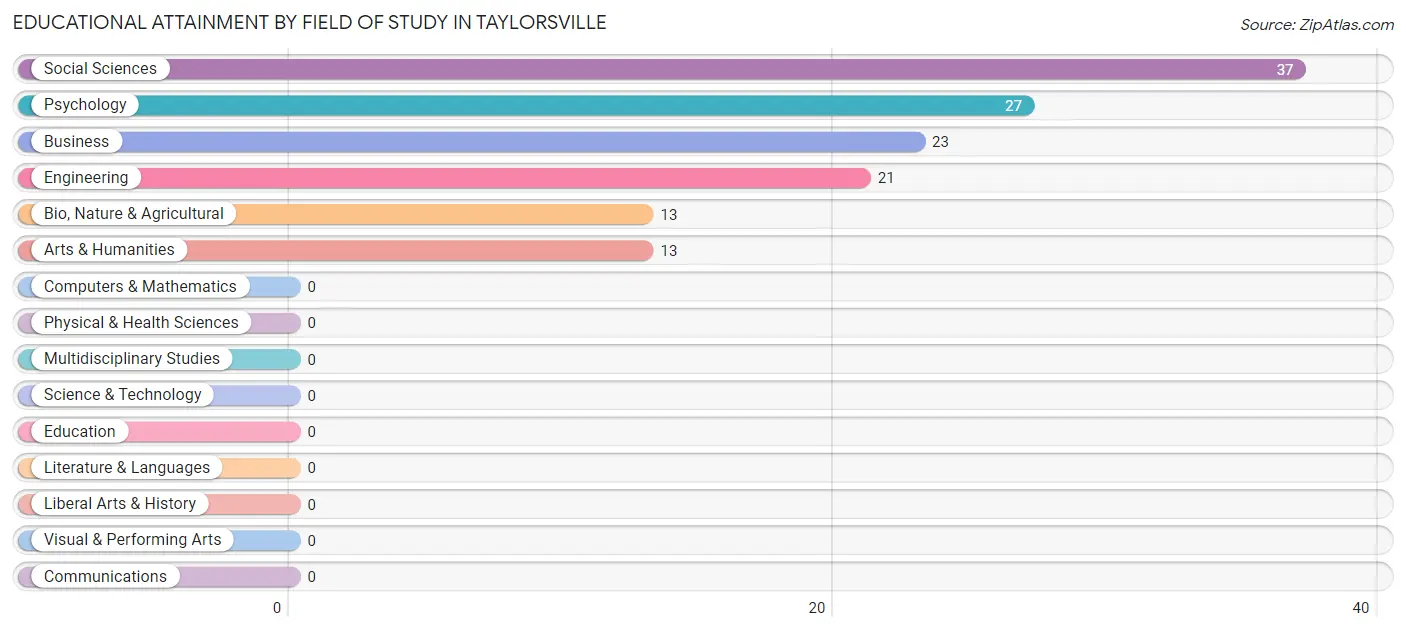
Educational Attainment by Field of Study in Taylorsville
Social sciences (37 | 27.6%), psychology (27 | 20.2%), business (23 | 17.2%), engineering (21 | 15.7%), and bio, nature & agricultural (13 | 9.7%) are the most common fields of study among 134 individuals in Taylorsville who have obtained a bachelor's degree or higher.
| Field of Study | # Graduates | % Graduates |
| Computers & Mathematics | 0 | 0.0% |
| Bio, Nature & Agricultural | 13 | 9.7% |
| Physical & Health Sciences | 0 | 0.0% |
| Psychology | 27 | 20.2% |
| Social Sciences | 37 | 27.6% |
| Engineering | 21 | 15.7% |
| Multidisciplinary Studies | 0 | 0.0% |
| Science & Technology | 0 | 0.0% |
| Business | 23 | 17.2% |
| Education | 0 | 0.0% |
| Literature & Languages | 0 | 0.0% |
| Liberal Arts & History | 0 | 0.0% |
| Visual & Performing Arts | 0 | 0.0% |
| Communications | 0 | 0.0% |
| Arts & Humanities | 13 | 9.7% |
| Total | 134 | 100.0% |
Transportation & Commute in Taylorsville
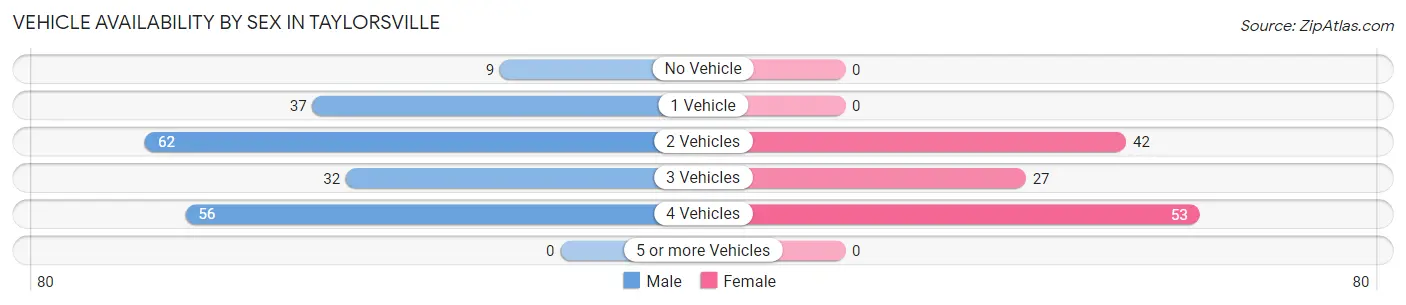
Vehicle Availability by Sex in Taylorsville
The most prevalent vehicle ownership categories in Taylorsville are males with 2 vehicles (62, accounting for 31.6%) and females with 2 vehicles (42, making up 50.8%).
| Vehicles Available | Male | Female |
| No Vehicle | 9 (4.6%) | 0 (0.0%) |
| 1 Vehicle | 37 (18.9%) | 0 (0.0%) |
| 2 Vehicles | 62 (31.6%) | 42 (34.4%) |
| 3 Vehicles | 32 (16.3%) | 27 (22.1%) |
| 4 Vehicles | 56 (28.6%) | 53 (43.4%) |
| 5 or more Vehicles | 0 (0.0%) | 0 (0.0%) |
| Total | 196 (100.0%) | 122 (100.0%) |
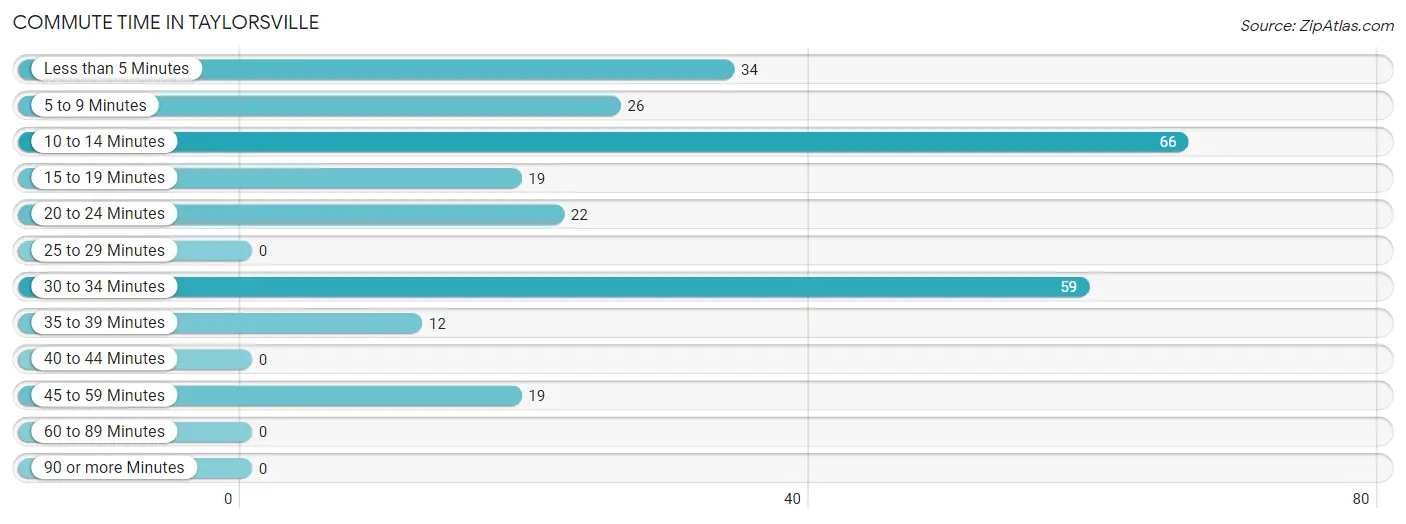
Commute Time in Taylorsville
The most frequently occuring commute durations in Taylorsville are 10 to 14 minutes (66 commuters, 25.7%), 30 to 34 minutes (59 commuters, 23.0%), and less than 5 minutes (34 commuters, 13.2%).
| Commute Time | # Commuters | % Commuters |
| Less than 5 Minutes | 34 | 13.2% |
| 5 to 9 Minutes | 26 | 10.1% |
| 10 to 14 Minutes | 66 | 25.7% |
| 15 to 19 Minutes | 19 | 7.4% |
| 20 to 24 Minutes | 22 | 8.6% |
| 25 to 29 Minutes | 0 | 0.0% |
| 30 to 34 Minutes | 59 | 23.0% |
| 35 to 39 Minutes | 12 | 4.7% |
| 40 to 44 Minutes | 0 | 0.0% |
| 45 to 59 Minutes | 19 | 7.4% |
| 60 to 89 Minutes | 0 | 0.0% |
| 90 or more Minutes | 0 | 0.0% |
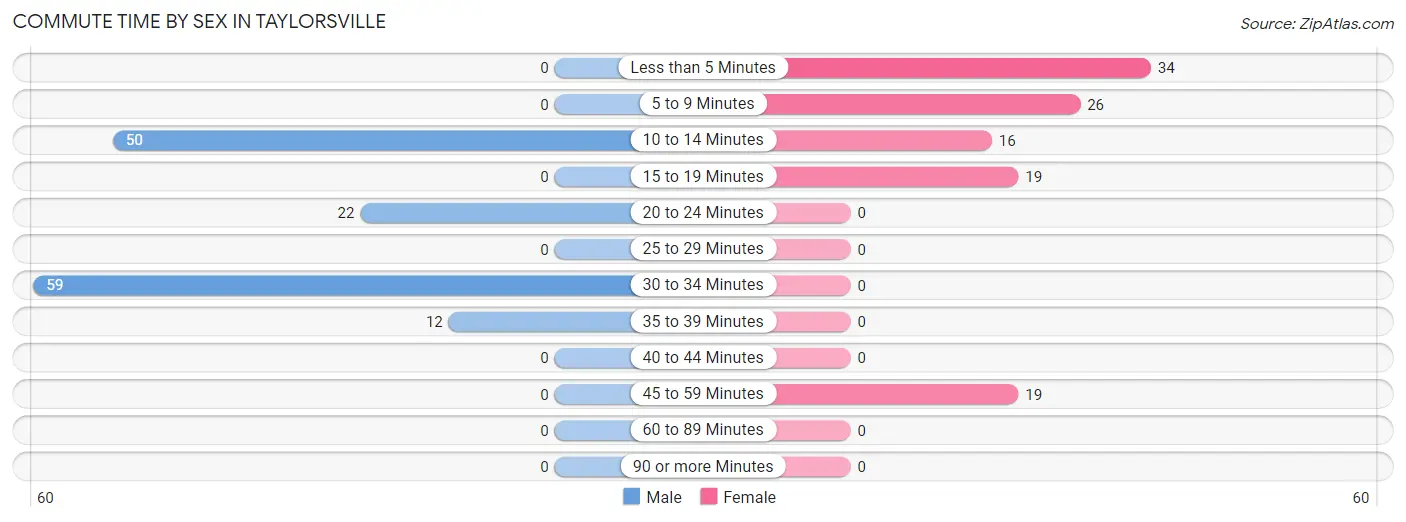
Commute Time by Sex in Taylorsville
The most common commute times in Taylorsville are 30 to 34 minutes (59 commuters, 41.3%) for males and less than 5 minutes (34 commuters, 29.8%) for females.
| Commute Time | Male | Female |
| Less than 5 Minutes | 0 (0.0%) | 34 (29.8%) |
| 5 to 9 Minutes | 0 (0.0%) | 26 (22.8%) |
| 10 to 14 Minutes | 50 (35.0%) | 16 (14.0%) |
| 15 to 19 Minutes | 0 (0.0%) | 19 (16.7%) |
| 20 to 24 Minutes | 22 (15.4%) | 0 (0.0%) |
| 25 to 29 Minutes | 0 (0.0%) | 0 (0.0%) |
| 30 to 34 Minutes | 59 (41.3%) | 0 (0.0%) |
| 35 to 39 Minutes | 12 (8.4%) | 0 (0.0%) |
| 40 to 44 Minutes | 0 (0.0%) | 0 (0.0%) |
| 45 to 59 Minutes | 0 (0.0%) | 19 (16.7%) |
| 60 to 89 Minutes | 0 (0.0%) | 0 (0.0%) |
| 90 or more Minutes | 0 (0.0%) | 0 (0.0%) |
Time of Departure to Work by Sex in Taylorsville
The most frequent times of departure to work in Taylorsville are 4:00 PM to 11:59 PM (37, 25.9%) for males and 7:30 AM to 7:59 AM (34, 29.8%) for females.
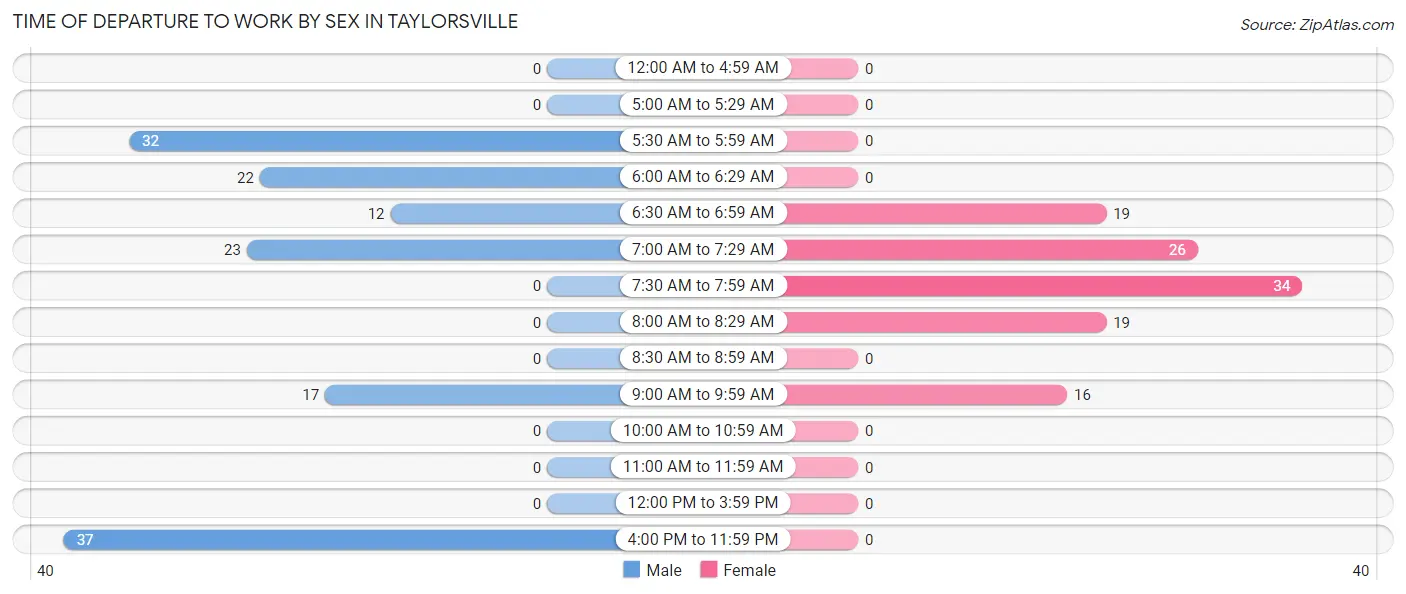
| Time of Departure | Male | Female |
| 12:00 AM to 4:59 AM | 0 (0.0%) | 0 (0.0%) |
| 5:00 AM to 5:29 AM | 0 (0.0%) | 0 (0.0%) |
| 5:30 AM to 5:59 AM | 32 (22.4%) | 0 (0.0%) |
| 6:00 AM to 6:29 AM | 22 (15.4%) | 0 (0.0%) |
| 6:30 AM to 6:59 AM | 12 (8.4%) | 19 (16.7%) |
| 7:00 AM to 7:29 AM | 23 (16.1%) | 26 (22.8%) |
| 7:30 AM to 7:59 AM | 0 (0.0%) | 34 (29.8%) |
| 8:00 AM to 8:29 AM | 0 (0.0%) | 19 (16.7%) |
| 8:30 AM to 8:59 AM | 0 (0.0%) | 0 (0.0%) |
| 9:00 AM to 9:59 AM | 17 (11.9%) | 16 (14.0%) |
| 10:00 AM to 10:59 AM | 0 (0.0%) | 0 (0.0%) |
| 11:00 AM to 11:59 AM | 0 (0.0%) | 0 (0.0%) |
| 12:00 PM to 3:59 PM | 0 (0.0%) | 0 (0.0%) |
| 4:00 PM to 11:59 PM | 37 (25.9%) | 0 (0.0%) |
| Total | 143 (100.0%) | 114 (100.0%) |
Housing Occupancy in Taylorsville
Occupancy by Ownership in Taylorsville
Of the total 289 dwellings in Taylorsville, owner-occupied units account for 235 (81.3%), while renter-occupied units make up 54 (18.7%).
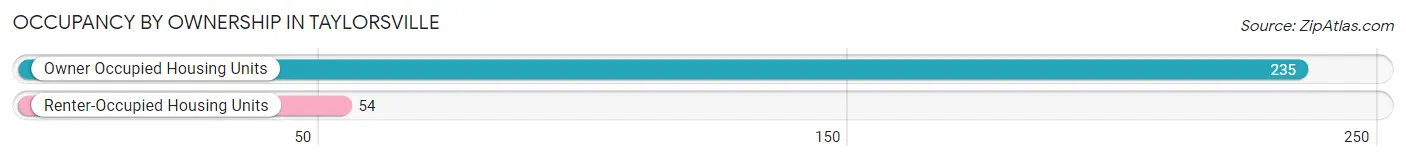
| Occupancy | # Housing Units | % Housing Units |
| Owner Occupied Housing Units | 235 | 81.3% |
| Renter-Occupied Housing Units | 54 | 18.7% |
| Total Occupied Housing Units | 289 | 100.0% |
Occupancy by Household Size in Taylorsville
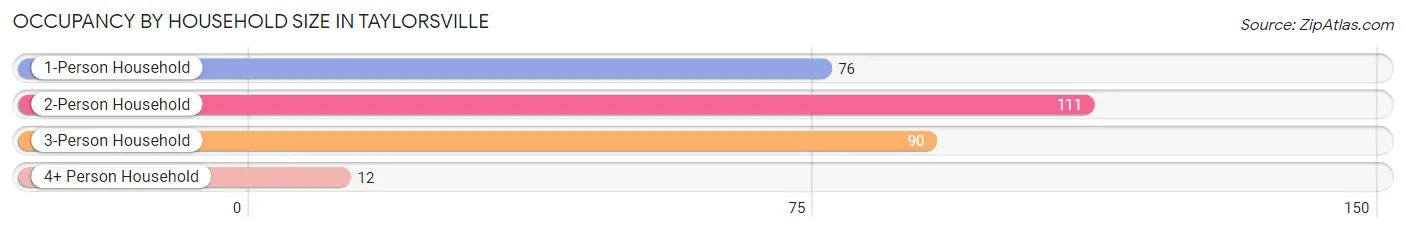
| Household Size | # Housing Units | % Housing Units |
| 1-Person Household | 76 | 26.3% |
| 2-Person Household | 111 | 38.4% |
| 3-Person Household | 90 | 31.1% |
| 4+ Person Household | 12 | 4.2% |
| Total Housing Units | 289 | 100.0% |
Occupancy by Ownership by Household Size in Taylorsville
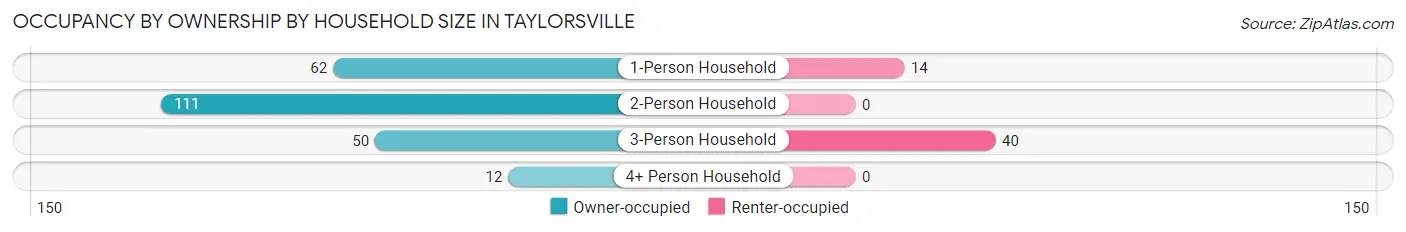
| Household Size | Owner-occupied | Renter-occupied |
| 1-Person Household | 62 (81.6%) | 14 (18.4%) |
| 2-Person Household | 111 (100.0%) | 0 (0.0%) |
| 3-Person Household | 50 (55.6%) | 40 (44.4%) |
| 4+ Person Household | 12 (100.0%) | 0 (0.0%) |
| Total Housing Units | 235 (81.3%) | 54 (18.7%) |
Occupancy by Educational Attainment in Taylorsville
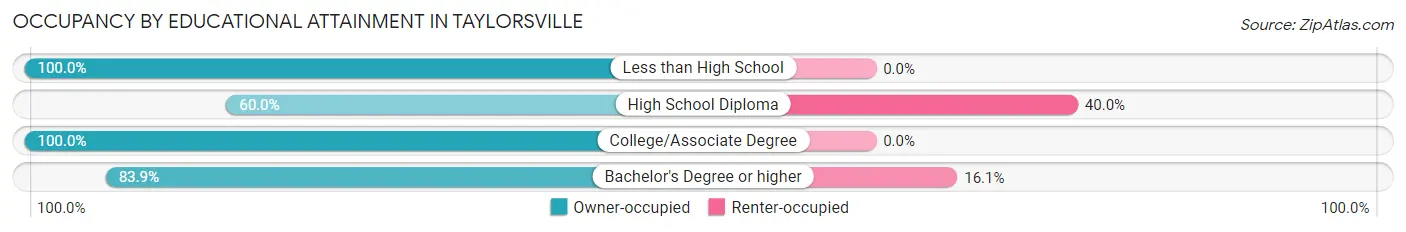
| Household Size | Owner-occupied | Renter-occupied |
| Less than High School | 27 (100.0%) | 0 (0.0%) |
| High School Diploma | 60 (60.0%) | 40 (40.0%) |
| College/Associate Degree | 75 (100.0%) | 0 (0.0%) |
| Bachelor's Degree or higher | 73 (83.9%) | 14 (16.1%) |
Occupancy by Age of Householder in Taylorsville
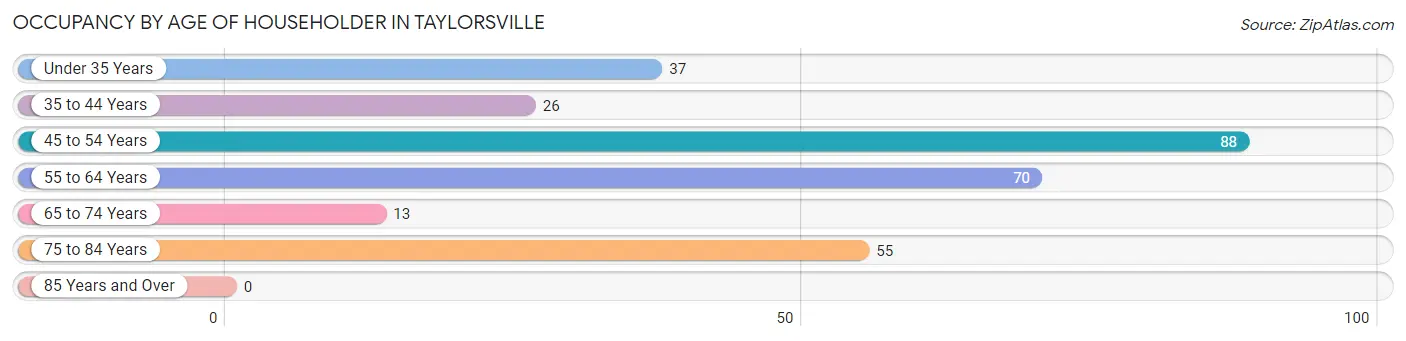
| Age Bracket | # Households | % Households |
| Under 35 Years | 37 | 12.8% |
| 35 to 44 Years | 26 | 9.0% |
| 45 to 54 Years | 88 | 30.4% |
| 55 to 64 Years | 70 | 24.2% |
| 65 to 74 Years | 13 | 4.5% |
| 75 to 84 Years | 55 | 19.0% |
| 85 Years and Over | 0 | 0.0% |
| Total | 289 | 100.0% |
Housing Finances in Taylorsville
Median Income by Occupancy in Taylorsville
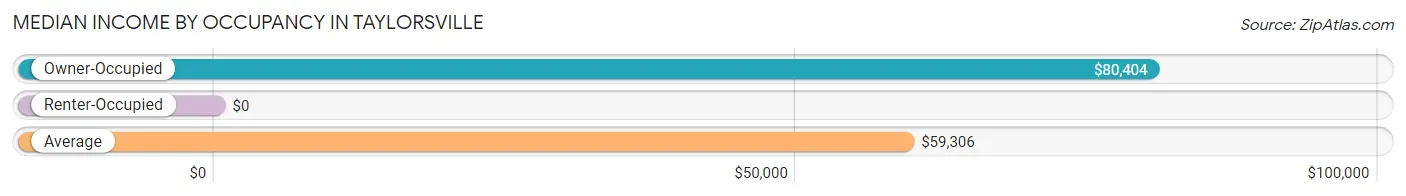
| Occupancy Type | # Households | Median Income |
| Owner-Occupied | 235 (81.3%) | $80,404 |
| Renter-Occupied | 54 (18.7%) | $0 |
| Average | 289 (100.0%) | $59,306 |
Occupancy by Householder Income Bracket in Taylorsville
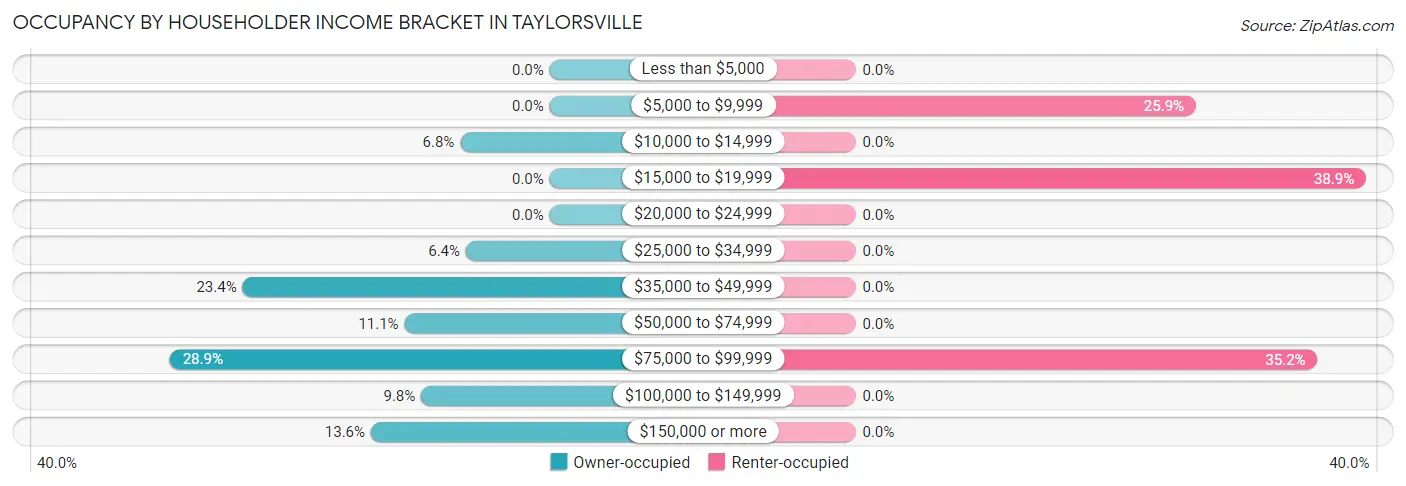
| Income Bracket | Owner-occupied | Renter-occupied |
| Less than $5,000 | 0 (0.0%) | 0 (0.0%) |
| $5,000 to $9,999 | 0 (0.0%) | 14 (25.9%) |
| $10,000 to $14,999 | 16 (6.8%) | 0 (0.0%) |
| $15,000 to $19,999 | 0 (0.0%) | 21 (38.9%) |
| $20,000 to $24,999 | 0 (0.0%) | 0 (0.0%) |
| $25,000 to $34,999 | 15 (6.4%) | 0 (0.0%) |
| $35,000 to $49,999 | 55 (23.4%) | 0 (0.0%) |
| $50,000 to $74,999 | 26 (11.1%) | 0 (0.0%) |
| $75,000 to $99,999 | 68 (28.9%) | 19 (35.2%) |
| $100,000 to $149,999 | 23 (9.8%) | 0 (0.0%) |
| $150,000 or more | 32 (13.6%) | 0 (0.0%) |
| Total | 235 (100.0%) | 54 (100.0%) |
Monthly Housing Cost Tiers in Taylorsville
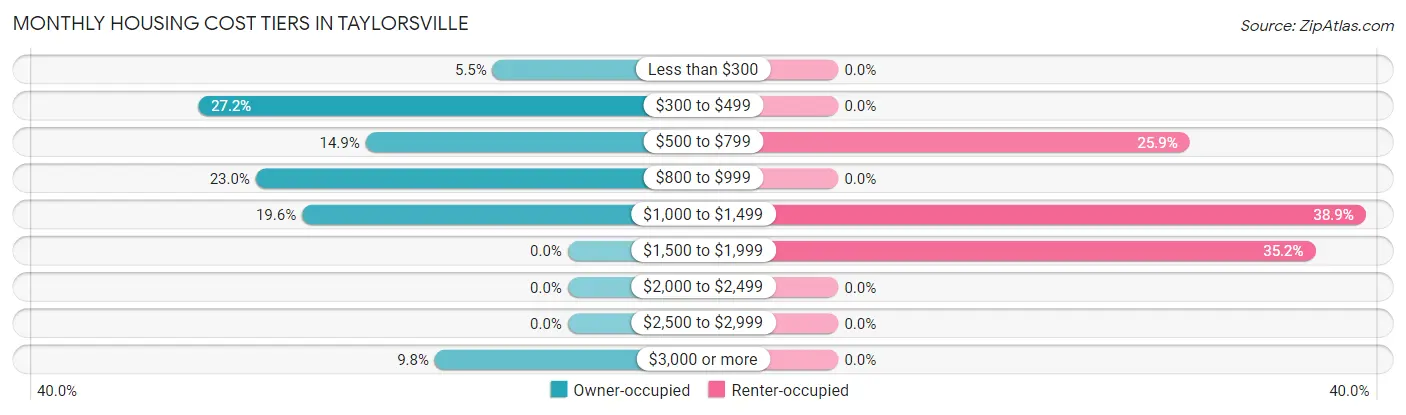
| Monthly Cost | Owner-occupied | Renter-occupied |
| Less than $300 | 13 (5.5%) | 0 (0.0%) |
| $300 to $499 | 64 (27.2%) | 0 (0.0%) |
| $500 to $799 | 35 (14.9%) | 14 (25.9%) |
| $800 to $999 | 54 (23.0%) | 0 (0.0%) |
| $1,000 to $1,499 | 46 (19.6%) | 21 (38.9%) |
| $1,500 to $1,999 | 0 (0.0%) | 19 (35.2%) |
| $2,000 to $2,499 | 0 (0.0%) | 0 (0.0%) |
| $2,500 to $2,999 | 0 (0.0%) | 0 (0.0%) |
| $3,000 or more | 23 (9.8%) | 0 (0.0%) |
| Total | 235 (100.0%) | 54 (100.0%) |
Physical Housing Characteristics in Taylorsville
Housing Structures in Taylorsville
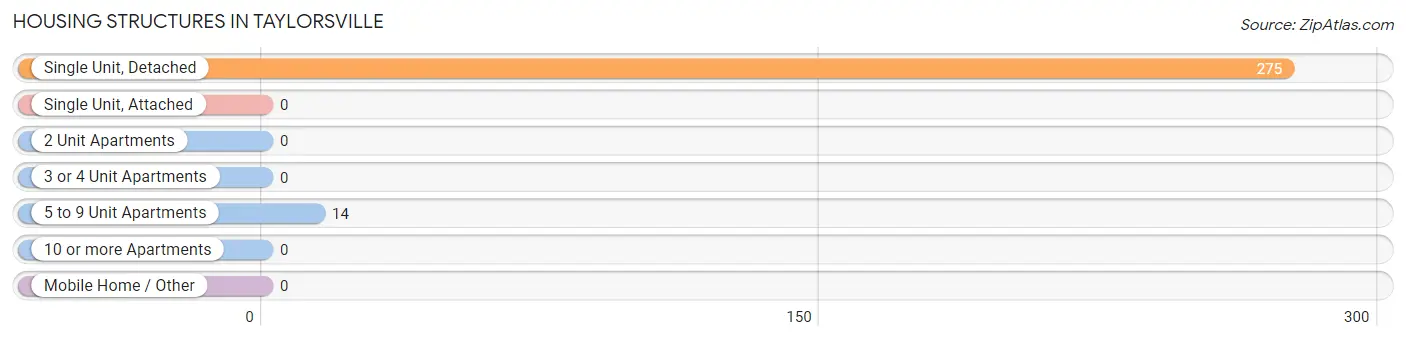
| Structure Type | # Housing Units | % Housing Units |
| Single Unit, Detached | 275 | 95.2% |
| Single Unit, Attached | 0 | 0.0% |
| 2 Unit Apartments | 0 | 0.0% |
| 3 or 4 Unit Apartments | 0 | 0.0% |
| 5 to 9 Unit Apartments | 14 | 4.8% |
| 10 or more Apartments | 0 | 0.0% |
| Mobile Home / Other | 0 | 0.0% |
| Total | 289 | 100.0% |
Housing Structures by Occupancy in Taylorsville
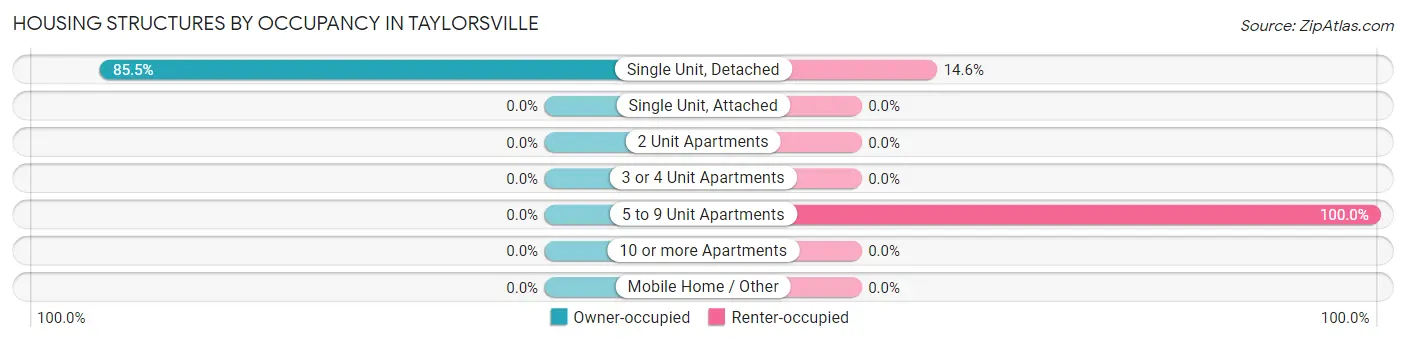
| Structure Type | Owner-occupied | Renter-occupied |
| Single Unit, Detached | 235 (85.5%) | 40 (14.5%) |
| Single Unit, Attached | 0 (0.0%) | 0 (0.0%) |
| 2 Unit Apartments | 0 (0.0%) | 0 (0.0%) |
| 3 or 4 Unit Apartments | 0 (0.0%) | 0 (0.0%) |
| 5 to 9 Unit Apartments | 0 (0.0%) | 14 (100.0%) |
| 10 or more Apartments | 0 (0.0%) | 0 (0.0%) |
| Mobile Home / Other | 0 (0.0%) | 0 (0.0%) |
| Total | 235 (81.3%) | 54 (18.7%) |
Housing Structures by Number of Rooms in Taylorsville
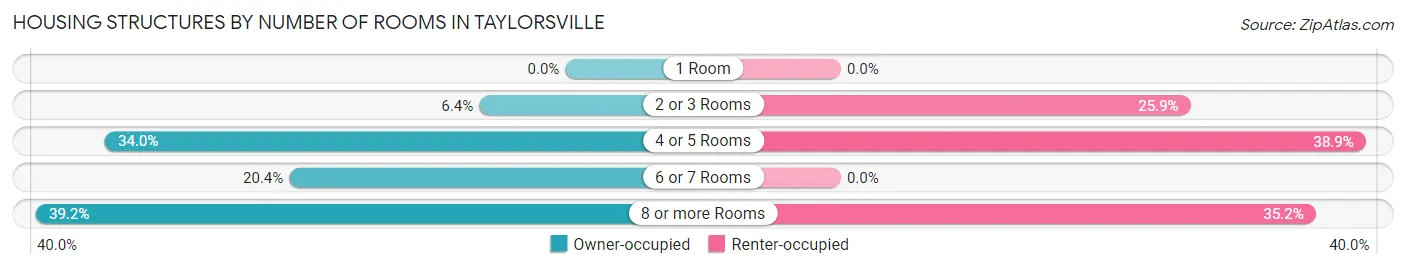
| Number of Rooms | Owner-occupied | Renter-occupied |
| 1 Room | 0 (0.0%) | 0 (0.0%) |
| 2 or 3 Rooms | 15 (6.4%) | 14 (25.9%) |
| 4 or 5 Rooms | 80 (34.0%) | 21 (38.9%) |
| 6 or 7 Rooms | 48 (20.4%) | 0 (0.0%) |
| 8 or more Rooms | 92 (39.2%) | 19 (35.2%) |
| Total | 235 (100.0%) | 54 (100.0%) |
Housing Structure by Heating Type in Taylorsville
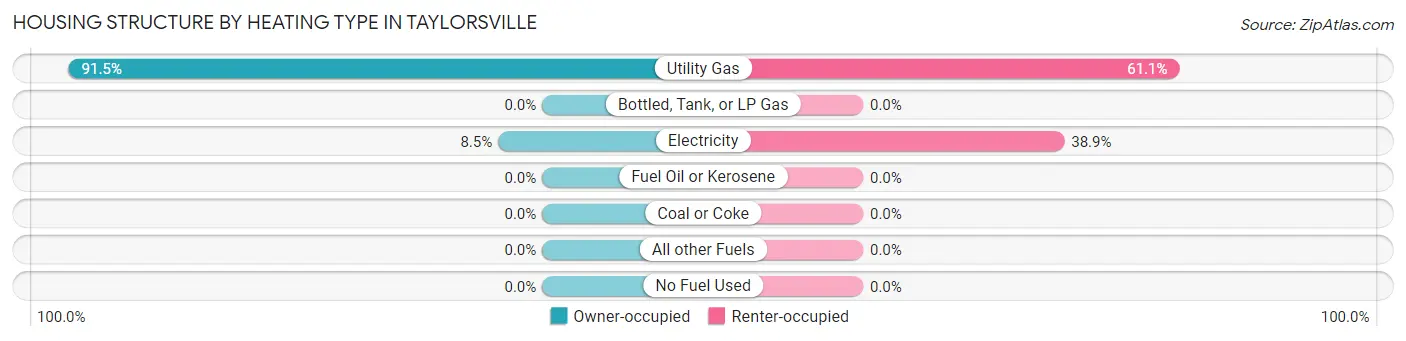
| Heating Type | Owner-occupied | Renter-occupied |
| Utility Gas | 215 (91.5%) | 33 (61.1%) |
| Bottled, Tank, or LP Gas | 0 (0.0%) | 0 (0.0%) |
| Electricity | 20 (8.5%) | 21 (38.9%) |
| Fuel Oil or Kerosene | 0 (0.0%) | 0 (0.0%) |
| Coal or Coke | 0 (0.0%) | 0 (0.0%) |
| All other Fuels | 0 (0.0%) | 0 (0.0%) |
| No Fuel Used | 0 (0.0%) | 0 (0.0%) |
| Total | 235 (100.0%) | 54 (100.0%) |
Household Vehicle Usage in Taylorsville
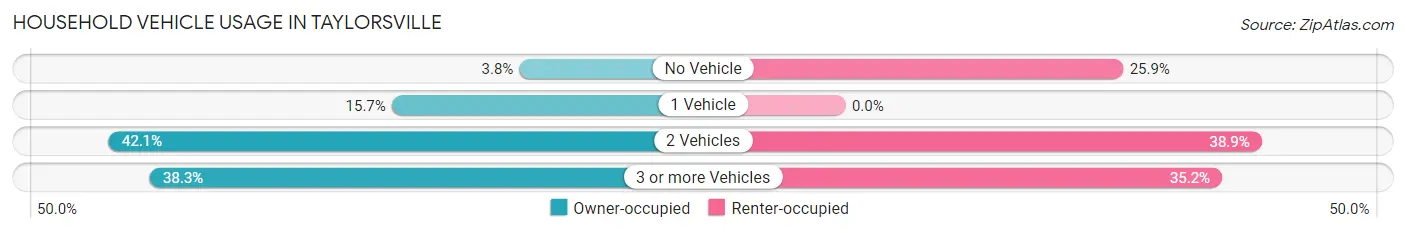
| Vehicles per Household | Owner-occupied | Renter-occupied |
| No Vehicle | 9 (3.8%) | 14 (25.9%) |
| 1 Vehicle | 37 (15.7%) | 0 (0.0%) |
| 2 Vehicles | 99 (42.1%) | 21 (38.9%) |
| 3 or more Vehicles | 90 (38.3%) | 19 (35.2%) |
| Total | 235 (100.0%) | 54 (100.0%) |
Real Estate & Mortgages in Taylorsville
Real Estate and Mortgage Overview in Taylorsville
| Characteristic | Without Mortgage | With Mortgage |
| Housing Units | 87 | 148 |
| Median Property Value | $181,400 | $177,200 |
| Median Household Income | - | - |
| Monthly Housing Costs | $367 | $23 |
| Real Estate Taxes | $739 | $8 |
Property Value by Mortgage Status in Taylorsville
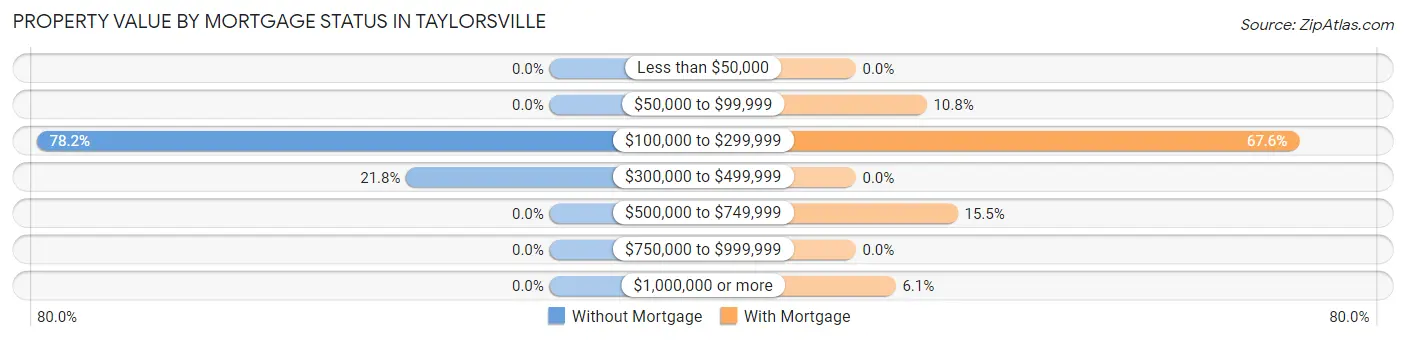
| Property Value | Without Mortgage | With Mortgage |
| Less than $50,000 | 0 (0.0%) | 0 (0.0%) |
| $50,000 to $99,999 | 0 (0.0%) | 16 (10.8%) |
| $100,000 to $299,999 | 68 (78.2%) | 100 (67.6%) |
| $300,000 to $499,999 | 19 (21.8%) | 0 (0.0%) |
| $500,000 to $749,999 | 0 (0.0%) | 23 (15.5%) |
| $750,000 to $999,999 | 0 (0.0%) | 0 (0.0%) |
| $1,000,000 or more | 0 (0.0%) | 9 (6.1%) |
| Total | 87 (100.0%) | 148 (100.0%) |
Household Income by Mortgage Status in Taylorsville
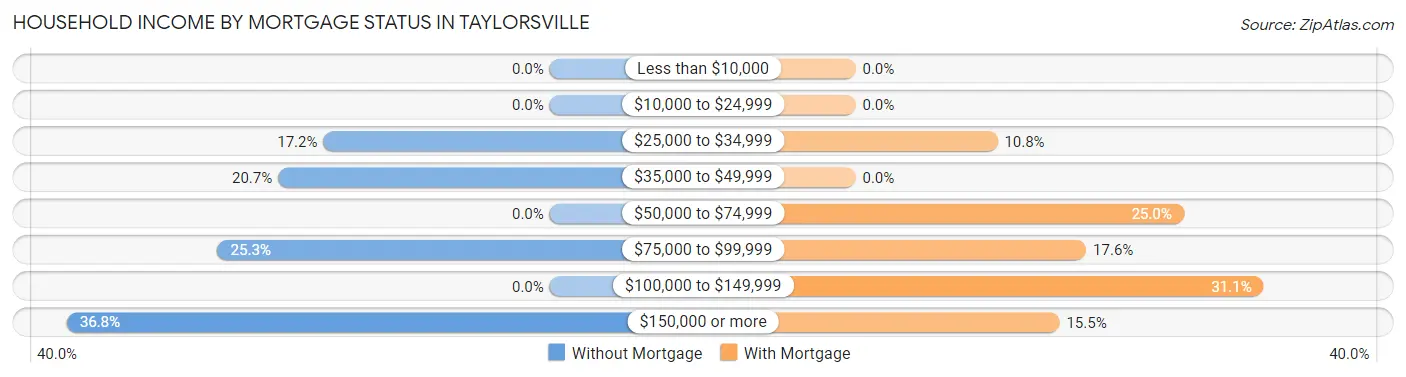
| Household Income | Without Mortgage | With Mortgage |
| Less than $10,000 | 0 (0.0%) | 0 (0.0%) |
| $10,000 to $24,999 | 0 (0.0%) | 0 (0.0%) |
| $25,000 to $34,999 | 15 (17.2%) | 16 (10.8%) |
| $35,000 to $49,999 | 18 (20.7%) | 0 (0.0%) |
| $50,000 to $74,999 | 0 (0.0%) | 37 (25.0%) |
| $75,000 to $99,999 | 22 (25.3%) | 26 (17.6%) |
| $100,000 to $149,999 | 0 (0.0%) | 46 (31.1%) |
| $150,000 or more | 32 (36.8%) | 23 (15.5%) |
| Total | 87 (100.0%) | 148 (100.0%) |
Property Value to Household Income Ratio in Taylorsville
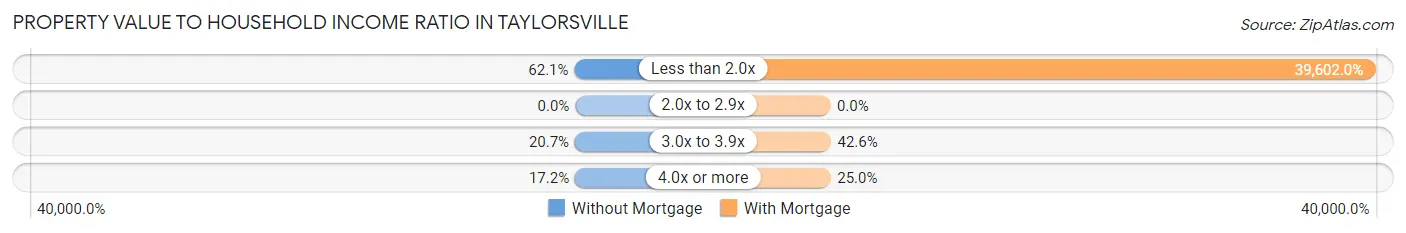
| Value-to-Income Ratio | Without Mortgage | With Mortgage |
| Less than 2.0x | 54 (62.1%) | 58,611 (39,602.0%) |
| 2.0x to 2.9x | 0 (0.0%) | 0 (0.0%) |
| 3.0x to 3.9x | 18 (20.7%) | 63 (42.6%) |
| 4.0x or more | 15 (17.2%) | 37 (25.0%) |
| Total | 87 (100.0%) | 148 (100.0%) |
Real Estate Taxes by Mortgage Status in Taylorsville
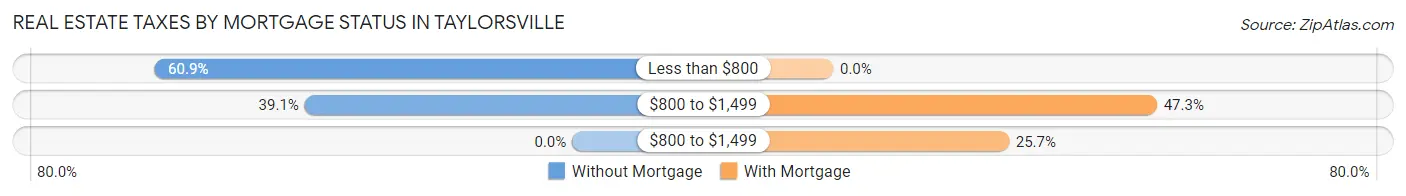
| Property Taxes | Without Mortgage | With Mortgage |
| Less than $800 | 53 (60.9%) | 0 (0.0%) |
| $800 to $1,499 | 34 (39.1%) | 70 (47.3%) |
| $800 to $1,499 | 0 (0.0%) | 38 (25.7%) |
| Total | 87 (100.0%) | 148 (100.0%) |
Health & Disability in Taylorsville
Health Insurance Coverage by Age in Taylorsville
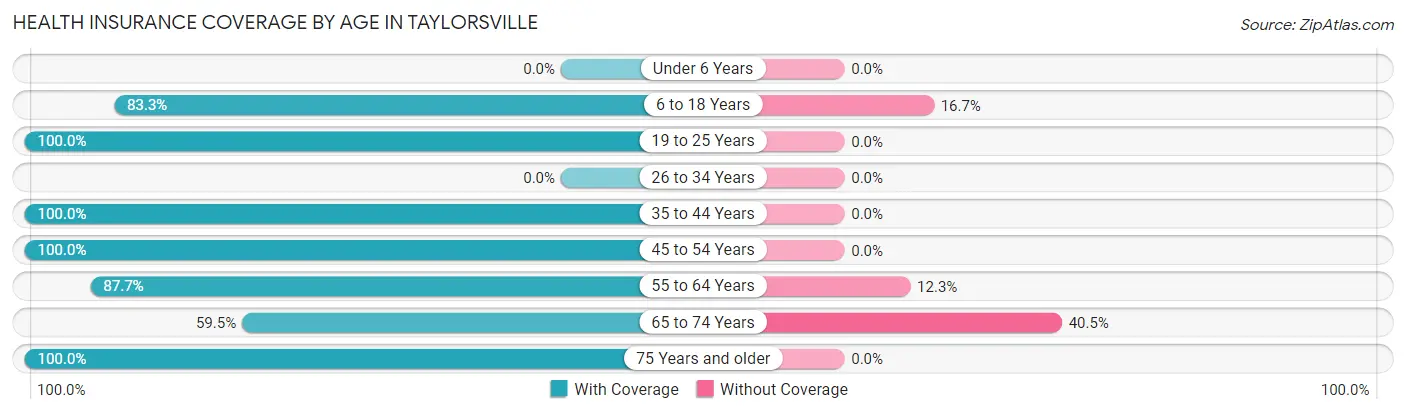
| Age Bracket | With Coverage | Without Coverage |
| Under 6 Years | 0 (0.0%) | 0 (0.0%) |
| 6 to 18 Years | 100 (83.3%) | 20 (16.7%) |
| 19 to 25 Years | 82 (100.0%) | 0 (0.0%) |
| 26 to 34 Years | 0 (0.0%) | 0 (0.0%) |
| 35 to 44 Years | 60 (100.0%) | 0 (0.0%) |
| 45 to 54 Years | 141 (100.0%) | 0 (0.0%) |
| 55 to 64 Years | 100 (87.7%) | 14 (12.3%) |
| 65 to 74 Years | 22 (59.5%) | 15 (40.5%) |
| 75 Years and older | 113 (100.0%) | 0 (0.0%) |
| Total | 618 (92.6%) | 49 (7.3%) |
Health Insurance Coverage by Citizenship Status in Taylorsville
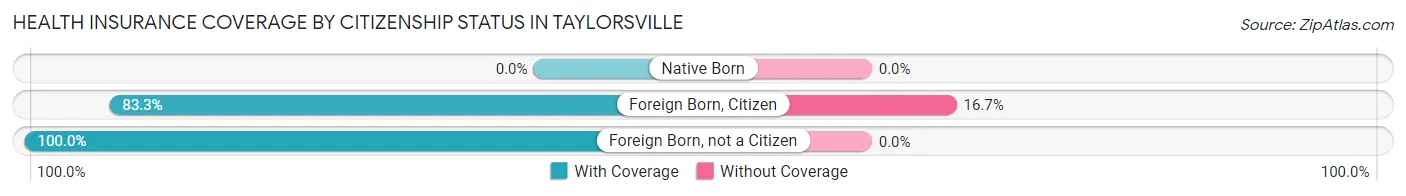
| Citizenship Status | With Coverage | Without Coverage |
| Native Born | 0 (0.0%) | 0 (0.0%) |
| Foreign Born, Citizen | 100 (83.3%) | 20 (16.7%) |
| Foreign Born, not a Citizen | 82 (100.0%) | 0 (0.0%) |
Health Insurance Coverage by Household Income in Taylorsville
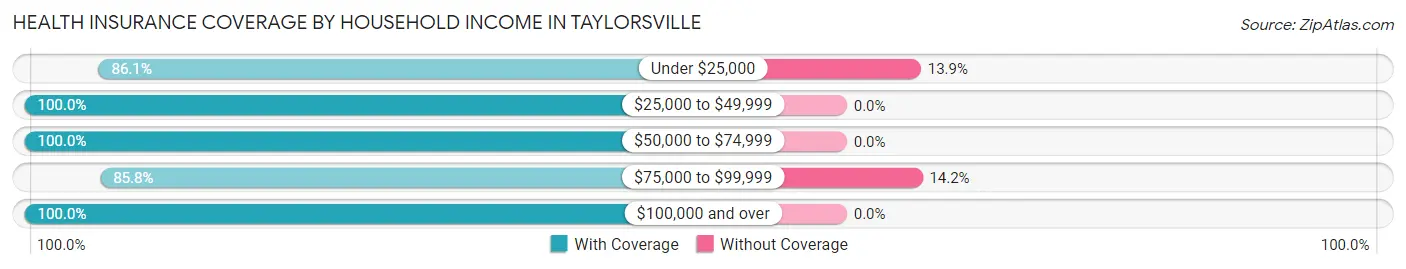
| Household Income | With Coverage | Without Coverage |
| Under $25,000 | 87 (86.1%) | 14 (13.9%) |
| $25,000 to $49,999 | 105 (100.0%) | 0 (0.0%) |
| $50,000 to $74,999 | 46 (100.0%) | 0 (0.0%) |
| $75,000 to $99,999 | 212 (85.8%) | 35 (14.2%) |
| $100,000 and over | 168 (100.0%) | 0 (0.0%) |
Public vs Private Health Insurance Coverage by Age in Taylorsville
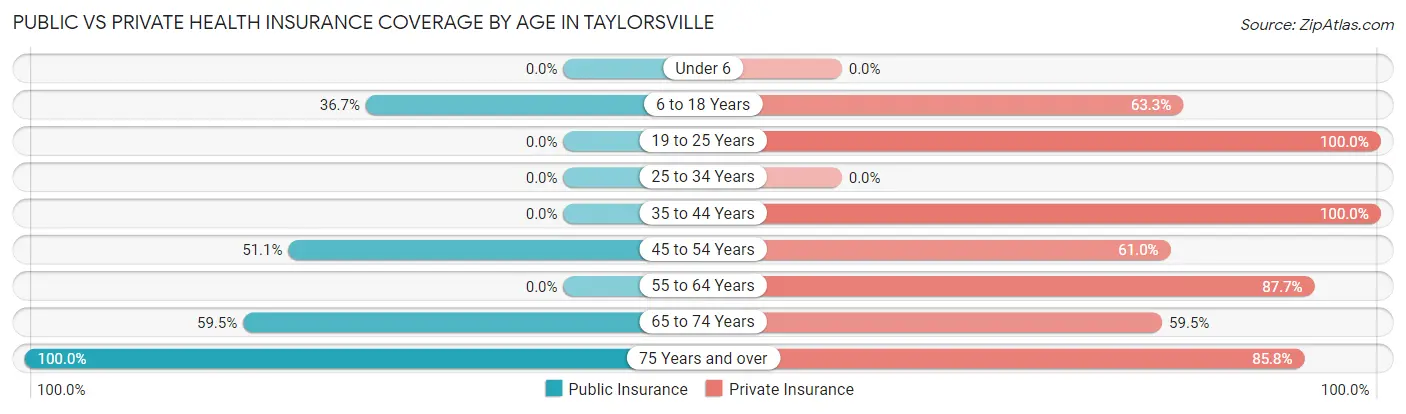
| Age Bracket | Public Insurance | Private Insurance |
| Under 6 | 0 (0.0%) | 0 (0.0%) |
| 6 to 18 Years | 44 (36.7%) | 76 (63.3%) |
| 19 to 25 Years | 0 (0.0%) | 82 (100.0%) |
| 25 to 34 Years | 0 (0.0%) | 0 (0.0%) |
| 35 to 44 Years | 0 (0.0%) | 60 (100.0%) |
| 45 to 54 Years | 72 (51.1%) | 86 (61.0%) |
| 55 to 64 Years | 0 (0.0%) | 100 (87.7%) |
| 65 to 74 Years | 22 (59.5%) | 22 (59.5%) |
| 75 Years and over | 113 (100.0%) | 97 (85.8%) |
| Total | 251 (37.6%) | 523 (78.4%) |
Disability Status by Sex by Age in Taylorsville
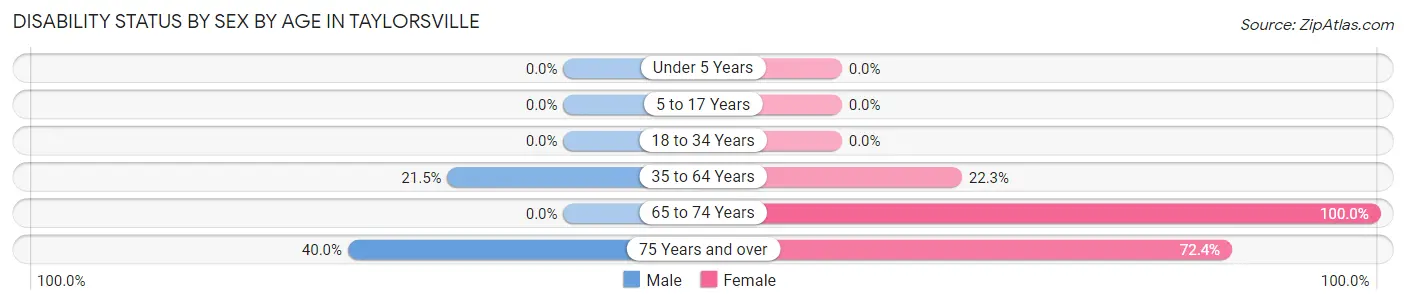
| Age Bracket | Male | Female |
| Under 5 Years | 0 (0.0%) | 0 (0.0%) |
| 5 to 17 Years | 0 (0.0%) | 0 (0.0%) |
| 18 to 34 Years | 0 (0.0%) | 0 (0.0%) |
| 35 to 64 Years | 34 (21.5%) | 35 (22.3%) |
| 65 to 74 Years | 0 (0.0%) | 9 (100.0%) |
| 75 Years and over | 22 (40.0%) | 42 (72.4%) |
Disability Class by Sex by Age in Taylorsville
Disability Class: Hearing Difficulty
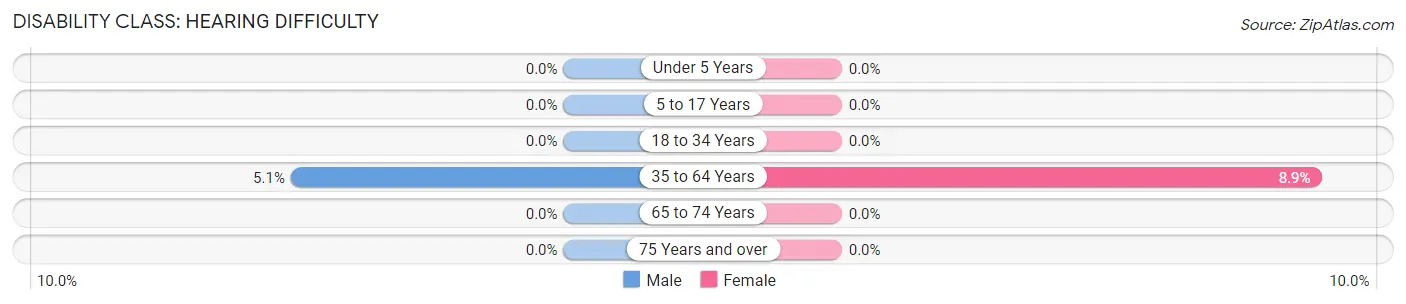
| Age Bracket | Male | Female |
| Under 5 Years | 0 (0.0%) | 0 (0.0%) |
| 5 to 17 Years | 0 (0.0%) | 0 (0.0%) |
| 18 to 34 Years | 0 (0.0%) | 0 (0.0%) |
| 35 to 64 Years | 8 (5.1%) | 14 (8.9%) |
| 65 to 74 Years | 0 (0.0%) | 0 (0.0%) |
| 75 Years and over | 0 (0.0%) | 0 (0.0%) |
Disability Class: Vision Difficulty
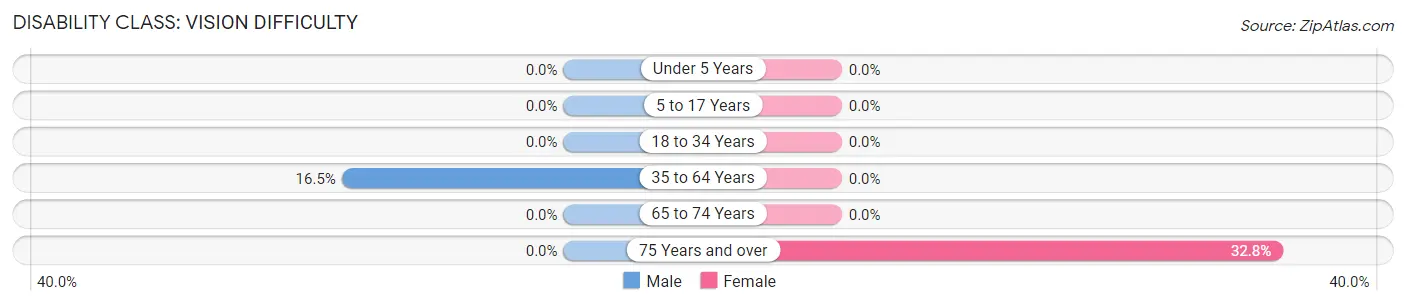
| Age Bracket | Male | Female |
| Under 5 Years | 0 (0.0%) | 0 (0.0%) |
| 5 to 17 Years | 0 (0.0%) | 0 (0.0%) |
| 18 to 34 Years | 0 (0.0%) | 0 (0.0%) |
| 35 to 64 Years | 26 (16.5%) | 0 (0.0%) |
| 65 to 74 Years | 0 (0.0%) | 0 (0.0%) |
| 75 Years and over | 0 (0.0%) | 19 (32.8%) |
Disability Class: Cognitive Difficulty
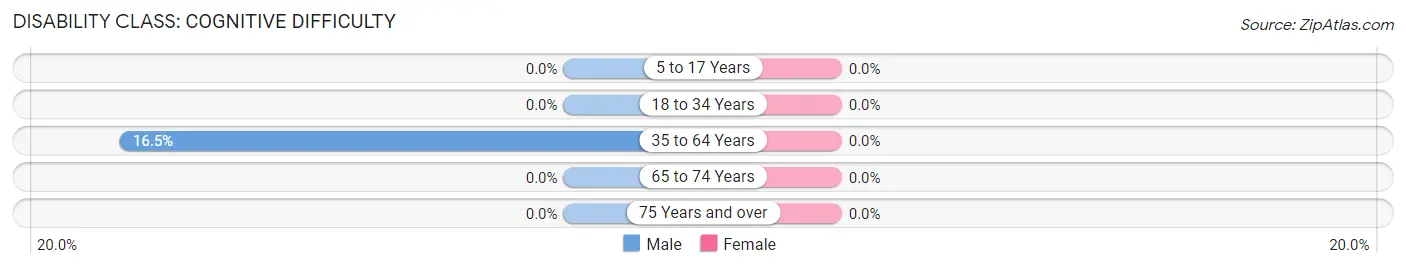
| Age Bracket | Male | Female |
| 5 to 17 Years | 0 (0.0%) | 0 (0.0%) |
| 18 to 34 Years | 0 (0.0%) | 0 (0.0%) |
| 35 to 64 Years | 26 (16.5%) | 0 (0.0%) |
| 65 to 74 Years | 0 (0.0%) | 0 (0.0%) |
| 75 Years and over | 0 (0.0%) | 0 (0.0%) |
Disability Class: Ambulatory Difficulty
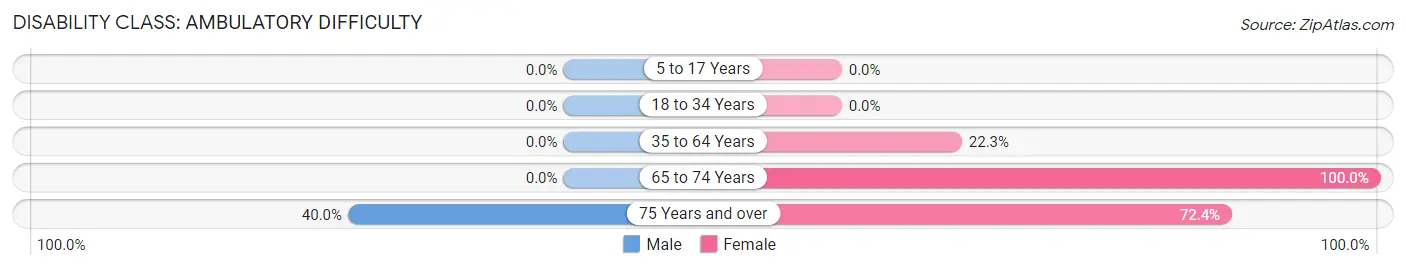
| Age Bracket | Male | Female |
| 5 to 17 Years | 0 (0.0%) | 0 (0.0%) |
| 18 to 34 Years | 0 (0.0%) | 0 (0.0%) |
| 35 to 64 Years | 0 (0.0%) | 35 (22.3%) |
| 65 to 74 Years | 0 (0.0%) | 9 (100.0%) |
| 75 Years and over | 22 (40.0%) | 42 (72.4%) |
Disability Class: Self-Care Difficulty
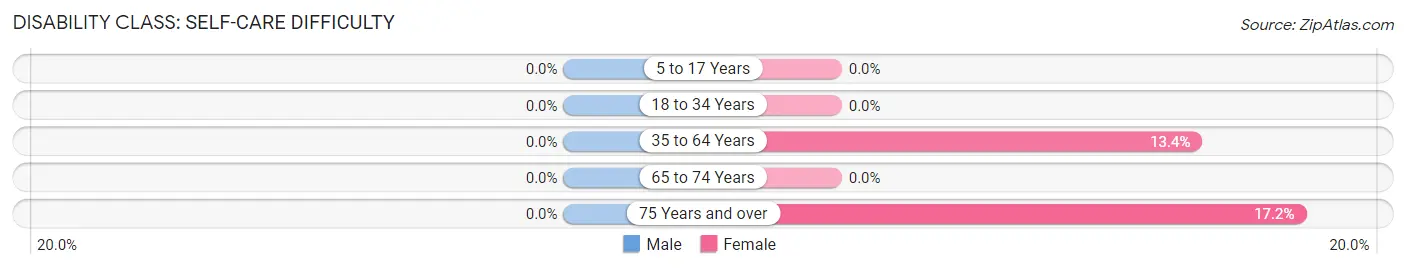
| Age Bracket | Male | Female |
| 5 to 17 Years | 0 (0.0%) | 0 (0.0%) |
| 18 to 34 Years | 0 (0.0%) | 0 (0.0%) |
| 35 to 64 Years | 0 (0.0%) | 21 (13.4%) |
| 65 to 74 Years | 0 (0.0%) | 0 (0.0%) |
| 75 Years and over | 0 (0.0%) | 10 (17.2%) |
Technology Access in Taylorsville
Computing Device Access in Taylorsville
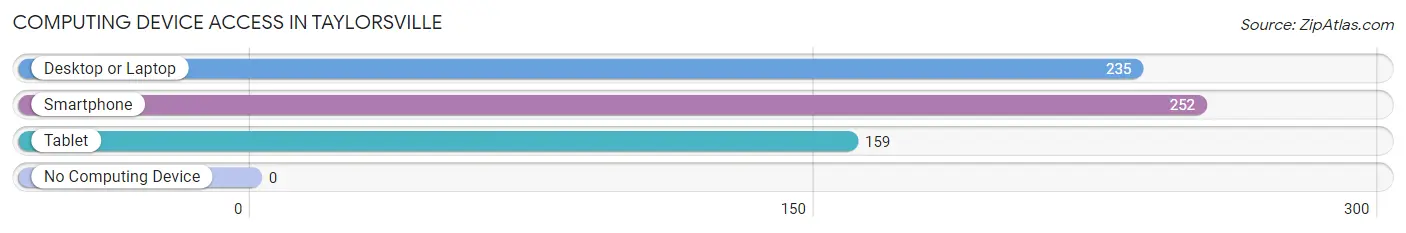
| Device Type | # Households | % Households |
| Desktop or Laptop | 235 | 81.3% |
| Smartphone | 252 | 87.2% |
| Tablet | 159 | 55.0% |
| No Computing Device | 0 | 0.0% |
| Total | 289 | 100.0% |
Internet Access in Taylorsville
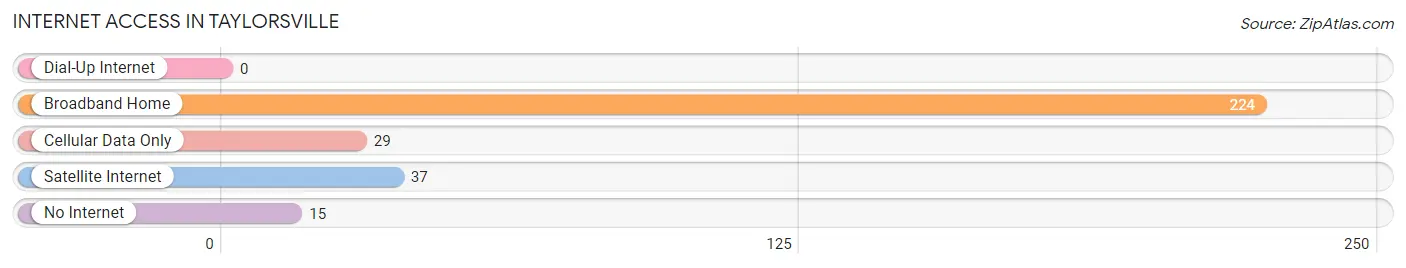
| Internet Type | # Households | % Households |
| Dial-Up Internet | 0 | 0.0% |
| Broadband Home | 224 | 77.5% |
| Cellular Data Only | 29 | 10.0% |
| Satellite Internet | 37 | 12.8% |
| No Internet | 15 | 5.2% |
| Total | 289 | 100.0% |
Taylorsville Summary
Taylorsville is a small town located in Bartholomew County, Indiana, United States. It is situated on the banks of the Flatrock River, approximately 20 miles south of Columbus. The town was founded in 1837 and named after General Zachary Taylor, who was the 12th President of the United States. The population of Taylorsville was 1,845 at the 2010 census.
History
Taylorsville was founded in 1837 by a group of settlers from Kentucky and Tennessee. The town was named after General Zachary Taylor, who was the 12th President of the United States. The town was originally known as Taylorville, but the name was changed to Taylorsville in 1845.
The town was an important stop on the Underground Railroad, with many slaves escaping to freedom in Canada. The town was also a major stop on the Ohio and Mississippi Railroad, which was completed in 1851.
The town was incorporated in 1867 and the first mayor was elected in 1868. The town was a major agricultural center in the late 19th and early 20th centuries, with many farms in the area.
Geography
Taylorsville is located at 39°14'N 85°51'W (39.2333, -85.85). The town is situated on the banks of the Flatrock River, approximately 20 miles south of Columbus. The town has a total area of 1.2 square miles, all of which is land.
The town is located in the Central Till Plains region of Indiana, which is characterized by flat terrain and fertile soils. The town is located in the Eastern Corn Belt region, which is known for its agricultural production.
Economy
Taylorsville is a small town with a population of 1,845 at the 2010 census. The town is primarily a bedroom community, with many of its residents commuting to nearby cities for work. The town is also home to several small businesses, including a grocery store, a hardware store, and a few restaurants.
The town is also home to several manufacturing companies, including a plastics manufacturer, a metal fabricator, and a machine shop. The town is also home to a few small farms, which produce corn, soybeans, and hay.
Demographics
Taylorsville is a small town with a population of 1,845 at the 2010 census. The town has a median age of 38.7 years, with 48.3% of the population being male and 51.7% being female. The town has a median household income of $45,945 and a median family income of $54,813.
The town is predominantly white, with 92.2% of the population being white and 7.8% being of other races. The town is also home to a small Hispanic population, with 4.2% of the population being Hispanic or Latino.
Conclusion
Taylorsville is a small town located in Bartholomew County, Indiana, United States. It is situated on the banks of the Flatrock River, approximately 20 miles south of Columbus. The town was founded in 1837 and named after General Zachary Taylor, who was the 12th President of the United States. The population of Taylorsville was 1,845 at the 2010 census. The town is primarily a bedroom community, with many of its residents commuting to nearby cities for work. The town is also home to several small businesses, including a grocery store, a hardware store, and a few restaurants. The town is predominantly white, with 92.2% of the population being white and 7.8% being of other races. The town is also home to a small Hispanic population, with 4.2% of the population being Hispanic or Latino.
Common Questions
What is the Total Population of Taylorsville?
Total Population of Taylorsville is 667.
What is the Total Male Population of Taylorsville?
Total Male Population of Taylorsville is 384.
What is the Total Female Population of Taylorsville?
Total Female Population of Taylorsville is 283.
What is the Ratio of Males per 100 Females in Taylorsville?
There are 135.69 Males per 100 Females in Taylorsville.
What is the Ratio of Females per 100 Males in Taylorsville?
There are 73.70 Females per 100 Males in Taylorsville.
What is the Median Population Age in Taylorsville?
Median Population Age in Taylorsville is 48.7 Years.
What is the Average Family Size in Taylorsville
Average Family Size in Taylorsville is 2.8 People.
What is the Average Household Size in Taylorsville
Average Household Size in Taylorsville is 2.3 People.
What is Per Capita Income in Taylorsville?
Per Capita income in Taylorsville is $37,792.
What is the Median Family Income in Taylorsville?
Median Family Income in Taylorsville is $82,969.
What is the Median Household income in Taylorsville?
Median Household Income in Taylorsville is $59,306.
What is Inequality or Gini Index in Taylorsville?
Inequality or Gini Index in Taylorsville is 0.44.
How Large is the Labor Force in Taylorsville?
There are 341 People in the Labor Forcein in Taylorsville.
What is the Percentage of People in the Labor Force in Taylorsville?
57.8% of People are in the Labor Force in Taylorsville.
What is the Unemployment Rate in Taylorsville?
Unemployment Rate in Taylorsville is 6.7%.