Lake Holiday, IN
Lake Holiday Map
Lake Holiday Overview
1,290
TOTAL POPULATION
616
MALE POPULATION
674
FEMALE POPULATION
91.39
MALES / 100 FEMALES
109.42
FEMALES / 100 MALES
44.9
MEDIAN AGE
3.0
AVG FAMILY SIZE
2.7
AVG HOUSEHOLD SIZE
$47,514
PER CAPITA INCOME
$120,903
AVG FAMILY INCOME
$106,131
AVG HOUSEHOLD INCOME
43.4%
WAGE / INCOME GAP [ % ]
56.6¢/ $1
WAGE / INCOME GAP [ $ ]
0.33
INEQUALITY / GINI INDEX
798
LABOR FORCE [ PEOPLE ]
77.1%
PERCENT IN LABOR FORCE
4.8%
UNEMPLOYMENT RATE
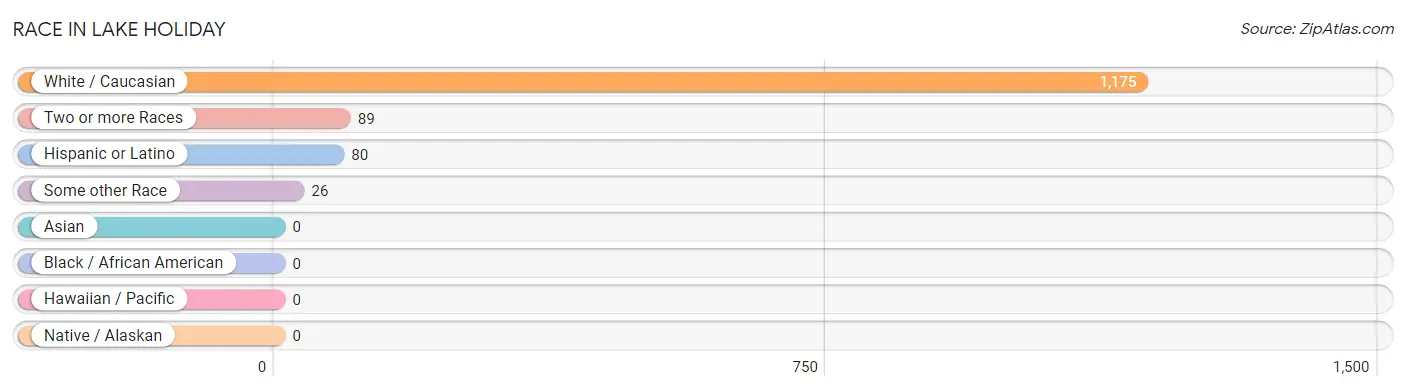
Race in Lake Holiday
The most populous races in Lake Holiday are White / Caucasian (1,175 | 91.1%), Two or more Races (89 | 6.9%), and Hispanic or Latino (80 | 6.2%).
| Race | # Population | % Population |
| Asian | 0 | 0.0% |
| Black / African American | 0 | 0.0% |
| Hawaiian / Pacific | 0 | 0.0% |
| Hispanic or Latino | 80 | 6.2% |
| Native / Alaskan | 0 | 0.0% |
| White / Caucasian | 1,175 | 91.1% |
| Two or more Races | 89 | 6.9% |
| Some other Race | 26 | 2.0% |
| Total | 1,290 | 100.0% |
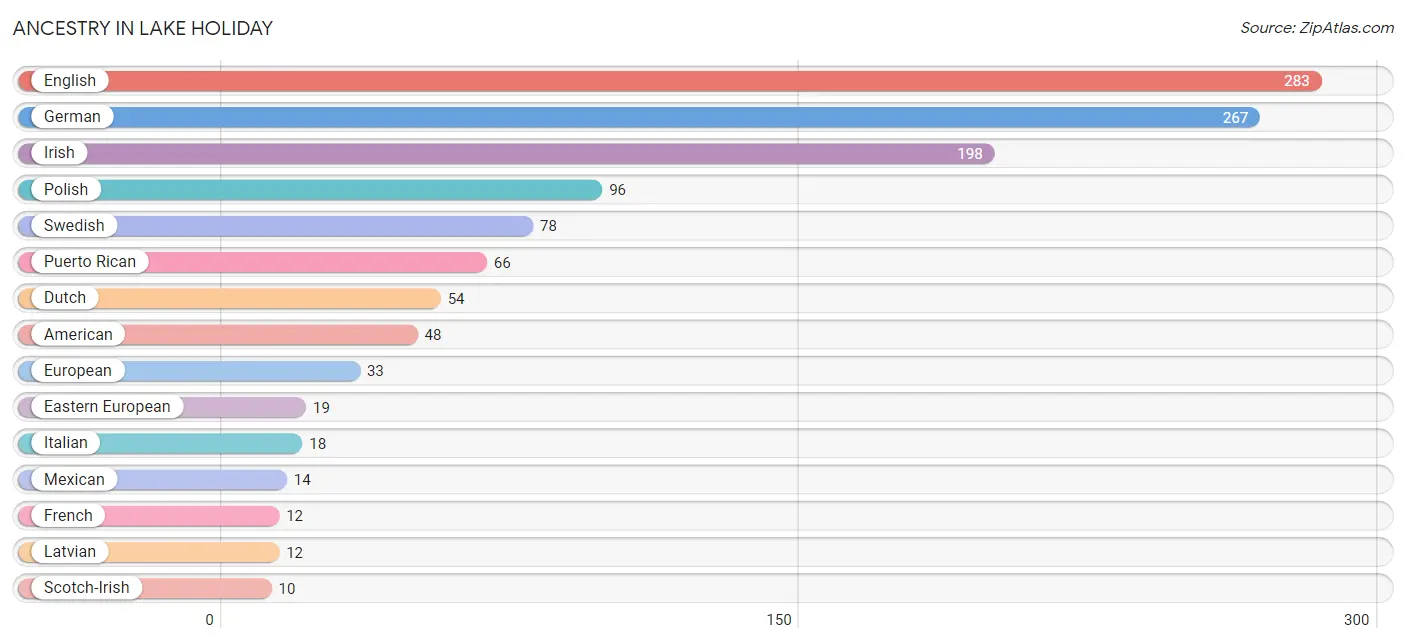
Ancestry in Lake Holiday
The most populous ancestries reported in Lake Holiday are English (283 | 21.9%), German (267 | 20.7%), Irish (198 | 15.3%), Polish (96 | 7.4%), and Swedish (78 | 6.0%), together accounting for 71.5% of all Lake Holiday residents.
| Ancestry | # Population | % Population |
| American | 48 | 3.7% |
| Dutch | 54 | 4.2% |
| Eastern European | 19 | 1.5% |
| English | 283 | 21.9% |
| European | 33 | 2.6% |
| French | 12 | 0.9% |
| French Canadian | 8 | 0.6% |
| German | 267 | 20.7% |
| Irish | 198 | 15.3% |
| Italian | 18 | 1.4% |
| Latvian | 12 | 0.9% |
| Mexican | 14 | 1.1% |
| Norwegian | 9 | 0.7% |
| Polish | 96 | 7.4% |
| Puerto Rican | 66 | 5.1% |
| Scotch-Irish | 10 | 0.8% |
| Swedish | 78 | 6.0% |
| Welsh | 9 | 0.7% | View All 18 Rows |
Immigrants in Lake Holiday

| Immigration Origin | # Population | % Population | View All 0 Rows |
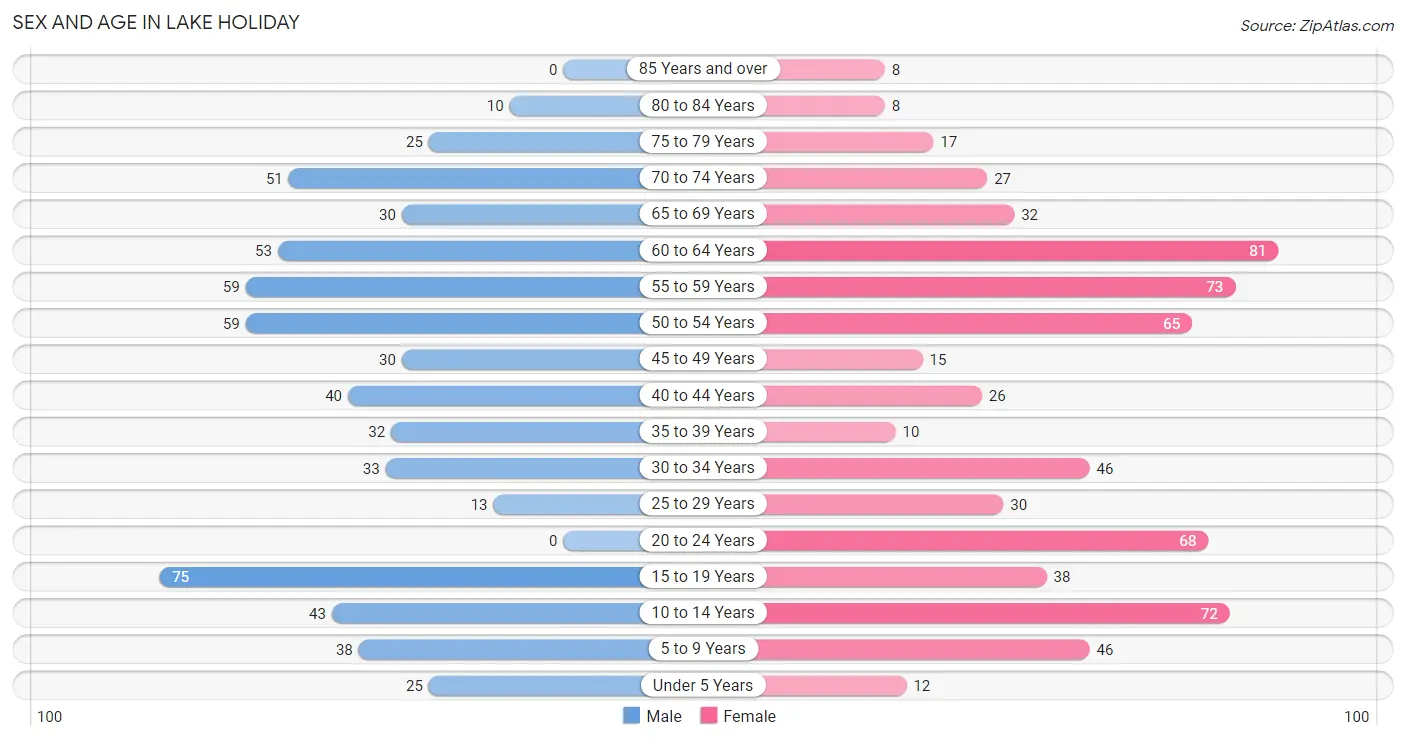
Sex and Age in Lake Holiday
Sex and Age in Lake Holiday
The most populous age groups in Lake Holiday are 15 to 19 Years (75 | 12.2%) for men and 60 to 64 Years (81 | 12.0%) for women.
| Age Bracket | Male | Female |
| Under 5 Years | 25 (4.1%) | 12 (1.8%) |
| 5 to 9 Years | 38 (6.2%) | 46 (6.8%) |
| 10 to 14 Years | 43 (7.0%) | 72 (10.7%) |
| 15 to 19 Years | 75 (12.2%) | 38 (5.6%) |
| 20 to 24 Years | 0 (0.0%) | 68 (10.1%) |
| 25 to 29 Years | 13 (2.1%) | 30 (4.4%) |
| 30 to 34 Years | 33 (5.4%) | 46 (6.8%) |
| 35 to 39 Years | 32 (5.2%) | 10 (1.5%) |
| 40 to 44 Years | 40 (6.5%) | 26 (3.9%) |
| 45 to 49 Years | 30 (4.9%) | 15 (2.2%) |
| 50 to 54 Years | 59 (9.6%) | 65 (9.6%) |
| 55 to 59 Years | 59 (9.6%) | 73 (10.8%) |
| 60 to 64 Years | 53 (8.6%) | 81 (12.0%) |
| 65 to 69 Years | 30 (4.9%) | 32 (4.8%) |
| 70 to 74 Years | 51 (8.3%) | 27 (4.0%) |
| 75 to 79 Years | 25 (4.1%) | 17 (2.5%) |
| 80 to 84 Years | 10 (1.6%) | 8 (1.2%) |
| 85 Years and over | 0 (0.0%) | 8 (1.2%) |
| Total | 616 (100.0%) | 674 (100.0%) |
Families and Households in Lake Holiday
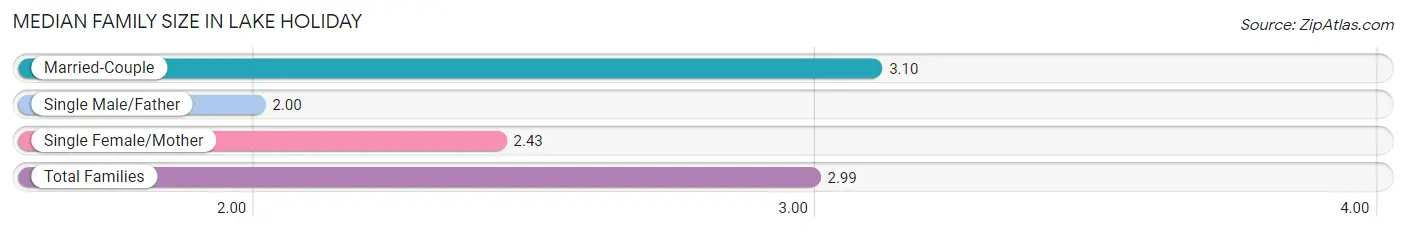
Median Family Size in Lake Holiday
The median family size in Lake Holiday is 2.99 persons per family, with married-couple families (359 | 87.4%) accounting for the largest median family size of 3.1 persons per family. On the other hand, single male/father families (22 | 5.3%) represent the smallest median family size with 2.00 persons per family.
| Family Type | # Families | Family Size |
| Married-Couple | 359 (87.4%) | 3.10 |
| Single Male/Father | 22 (5.3%) | 2.00 |
| Single Female/Mother | 30 (7.3%) | 2.43 |
| Total Families | 411 (100.0%) | 2.99 |
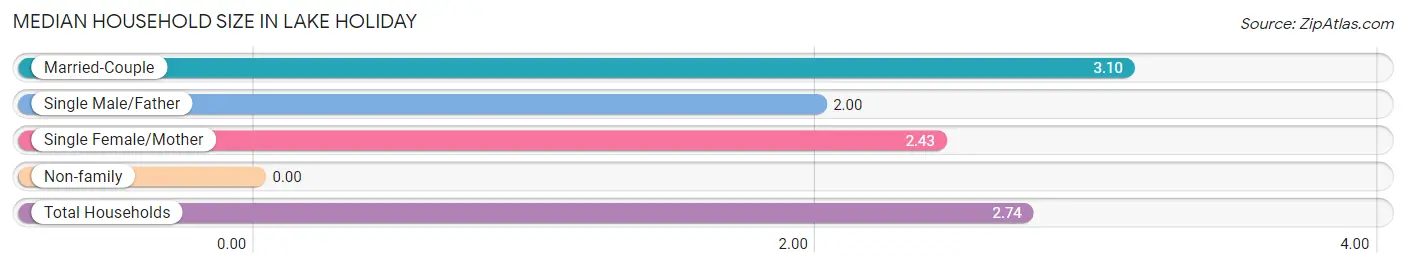
Median Household Size in Lake Holiday
| Household Type | # Households | Household Size |
| Married-Couple | 359 (76.2%) | 3.10 |
| Single Male/Father | 22 (4.7%) | 2.00 |
| Single Female/Mother | 30 (6.4%) | 2.43 |
| Non-family | 60 (12.7%) | - |
| Total Households | 471 (100.0%) | 2.74 |
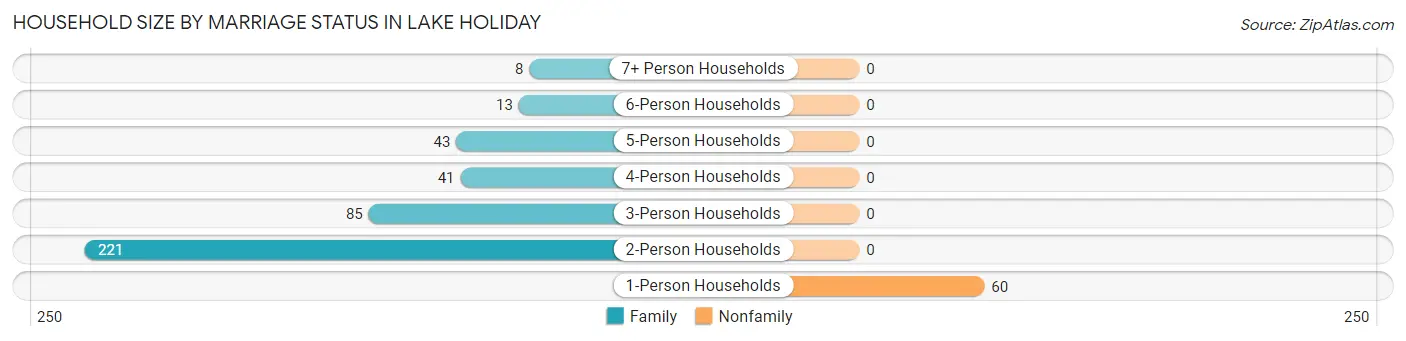
Household Size by Marriage Status in Lake Holiday
Out of a total of 471 households in Lake Holiday, 411 (87.3%) are family households, while 60 (12.7%) are nonfamily households. The most numerous type of family households are 2-person households, comprising 221, and the most common type of nonfamily households are 1-person households, comprising 60.
| Household Size | Family Households | Nonfamily Households |
| 1-Person Households | - | 60 (12.7%) |
| 2-Person Households | 221 (46.9%) | 0 (0.0%) |
| 3-Person Households | 85 (18.0%) | 0 (0.0%) |
| 4-Person Households | 41 (8.7%) | 0 (0.0%) |
| 5-Person Households | 43 (9.1%) | 0 (0.0%) |
| 6-Person Households | 13 (2.8%) | 0 (0.0%) |
| 7+ Person Households | 8 (1.7%) | 0 (0.0%) |
| Total | 411 (87.3%) | 60 (12.7%) |
Female Fertility in Lake Holiday
Fertility by Age in Lake Holiday
| Age Bracket | Women with Births | Births / 1,000 Women |
| 15 to 19 years | 0 (0.0%) | 0.0 |
| 20 to 34 years | 0 (0.0%) | 0.0 |
| 35 to 50 years | 0 (0.0%) | 0.0 |
| Total | 0 (0.0%) | 0.0 |
Fertility by Age by Marriage Status in Lake Holiday
| Age Bracket | Married | Unmarried |
| 15 to 19 years | 0 (0.0%) | 0 (0.0%) |
| 20 to 34 years | 0 (0.0%) | 0 (0.0%) |
| 35 to 50 years | 0 (0.0%) | 0 (0.0%) |
| Total | 0 (0.0%) | 0 (0.0%) |
Fertility by Education in Lake Holiday
| Educational Attainment | Women with Births | Births / 1,000 Women |
| Less than High School | 0 (0.0%) | 0.0 |
| High School Diploma | 0 (0.0%) | 0.0 |
| College or Associate's Degree | 0 (0.0%) | 0.0 |
| Bachelor's Degree | 0 (0.0%) | 0.0 |
| Graduate Degree | 0 (0.0%) | 0.0 |
| Total | 0 (0.0%) | 0.0 |
Fertility by Education by Marriage Status in Lake Holiday
| Educational Attainment | Married | Unmarried |
| Less than High School | 0 (0.0%) | 0 (0.0%) |
| High School Diploma | 0 (0.0%) | 0 (0.0%) |
| College or Associate's Degree | 0 (0.0%) | 0 (0.0%) |
| Bachelor's Degree | 0 (0.0%) | 0 (0.0%) |
| Graduate Degree | 0 (0.0%) | 0 (0.0%) |
| Total | 0 (0.0%) | 0 (0.0%) |
Income in Lake Holiday
Income Overview in Lake Holiday
Per Capita Income in Lake Holiday is $47,514, while median incomes of families and households are $120,903 and $106,131 respectively.
| Characteristic | Number | Measure |
| Per Capita Income | 1,290 | $47,514 |
| Median Family Income | 411 | $120,903 |
| Mean Family Income | 411 | $132,497 |
| Median Household Income | 471 | $106,131 |
| Mean Household Income | 471 | $126,486 |
| Income Deficit | 411 | $0 |
| Wage / Income Gap (%) | 1,290 | 43.45% |
| Wage / Income Gap ($) | 1,290 | 56.55¢ per $1 |
| Gini / Inequality Index | 1,290 | 0.33 |
Earnings by Sex in Lake Holiday
Average Earnings in Lake Holiday are $59,365, $68,523 for men and $38,750 for women, a difference of 43.4%.
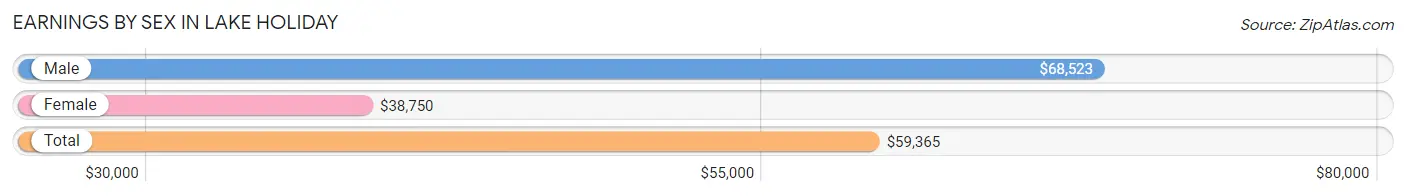
| Sex | Number | Average Earnings |
| Male | 390 (48.3%) | $68,523 |
| Female | 418 (51.7%) | $38,750 |
| Total | 808 (100.0%) | $59,365 |
Earnings by Sex by Income Bracket in Lake Holiday
The most common earnings brackets in Lake Holiday are $100,000+ for men (140 | 35.9%) and $75,000 to $99,999 for women (90 | 21.5%).
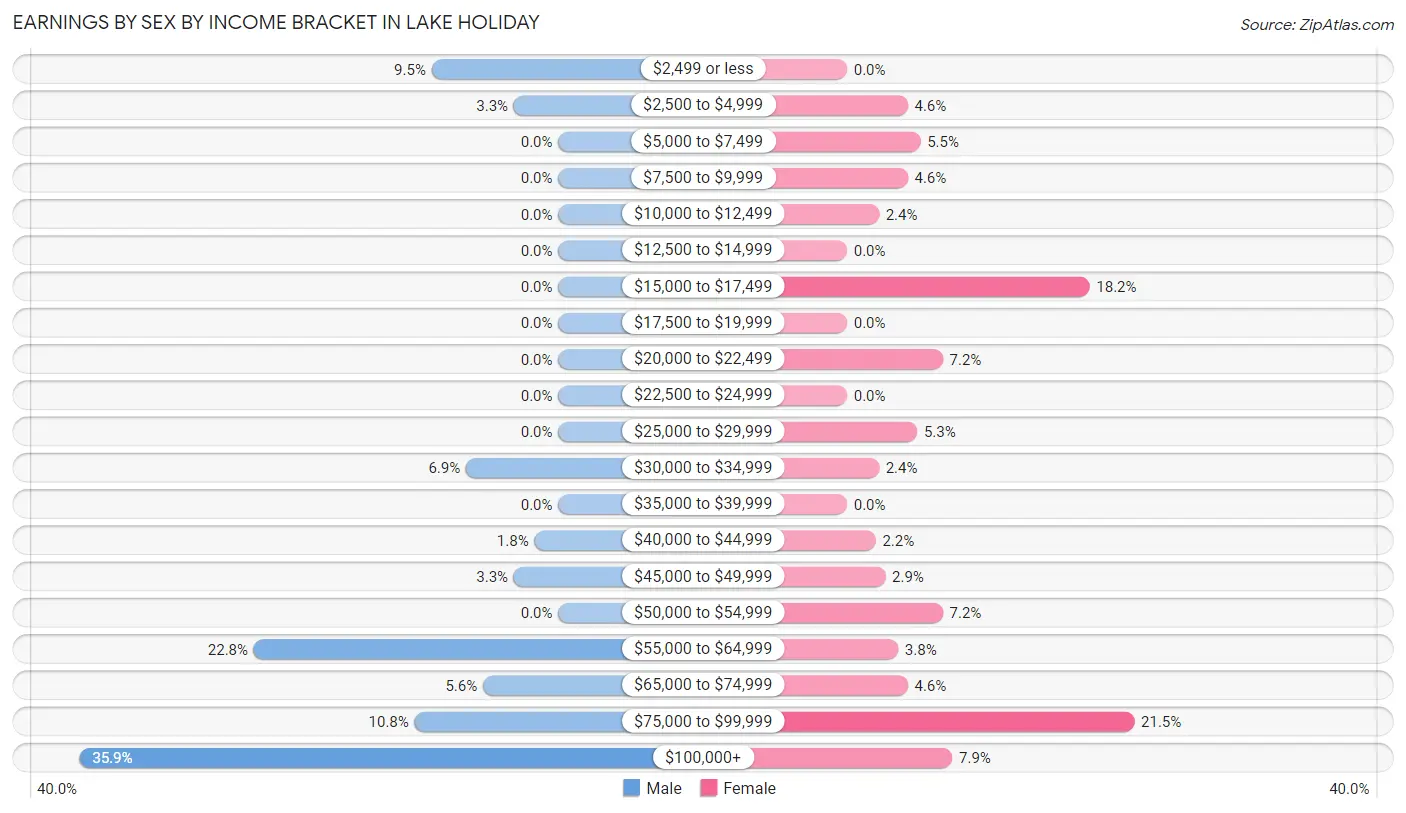
| Income | Male | Female |
| $2,499 or less | 37 (9.5%) | 0 (0.0%) |
| $2,500 to $4,999 | 13 (3.3%) | 19 (4.5%) |
| $5,000 to $7,499 | 0 (0.0%) | 23 (5.5%) |
| $7,500 to $9,999 | 0 (0.0%) | 19 (4.5%) |
| $10,000 to $12,499 | 0 (0.0%) | 10 (2.4%) |
| $12,500 to $14,999 | 0 (0.0%) | 0 (0.0%) |
| $15,000 to $17,499 | 0 (0.0%) | 76 (18.2%) |
| $17,500 to $19,999 | 0 (0.0%) | 0 (0.0%) |
| $20,000 to $22,499 | 0 (0.0%) | 30 (7.2%) |
| $22,500 to $24,999 | 0 (0.0%) | 0 (0.0%) |
| $25,000 to $29,999 | 0 (0.0%) | 22 (5.3%) |
| $30,000 to $34,999 | 27 (6.9%) | 10 (2.4%) |
| $35,000 to $39,999 | 0 (0.0%) | 0 (0.0%) |
| $40,000 to $44,999 | 7 (1.8%) | 9 (2.1%) |
| $45,000 to $49,999 | 13 (3.3%) | 12 (2.9%) |
| $50,000 to $54,999 | 0 (0.0%) | 30 (7.2%) |
| $55,000 to $64,999 | 89 (22.8%) | 16 (3.8%) |
| $65,000 to $74,999 | 22 (5.6%) | 19 (4.5%) |
| $75,000 to $99,999 | 42 (10.8%) | 90 (21.5%) |
| $100,000+ | 140 (35.9%) | 33 (7.9%) |
| Total | 390 (100.0%) | 418 (100.0%) |
Earnings by Sex by Educational Attainment in Lake Holiday
Average earnings in Lake Holiday are $75,909 for men and $53,828 for women, a difference of 29.1%. Men with an educational attainment of graduate degree enjoy the highest average annual earnings of $138,750, while those with high school diploma education earn the least with $59,583. Women with an educational attainment of bachelor's degree earn the most with the average annual earnings of $67,303, while those with bachelor's degree education have the smallest earnings of $67,303.
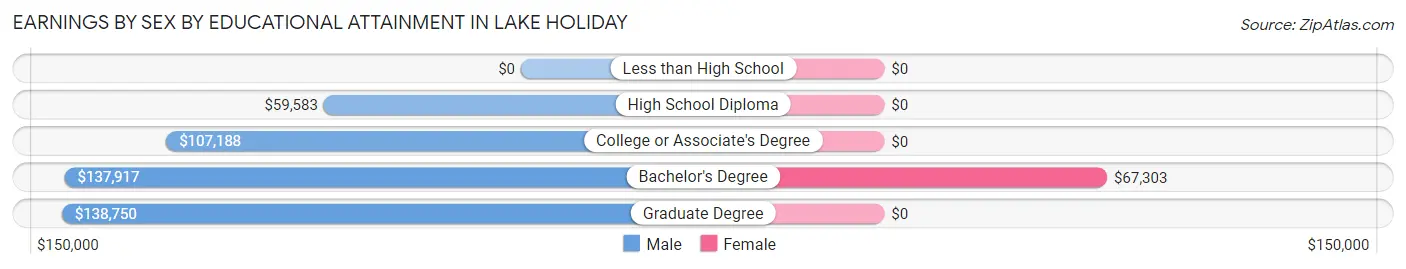
| Educational Attainment | Male Income | Female Income |
| Less than High School | - | - |
| High School Diploma | $59,583 | $0 |
| College or Associate's Degree | $107,188 | $0 |
| Bachelor's Degree | $137,917 | $67,303 |
| Graduate Degree | $138,750 | $0 |
| Total | $75,909 | $53,828 |
Family Income in Lake Holiday
Family Income Brackets in Lake Holiday
According to the Lake Holiday family income data, there are 106 families falling into the $50,000 to $74,999 income range, which is the most common income bracket and makes up 25.8% of all families.
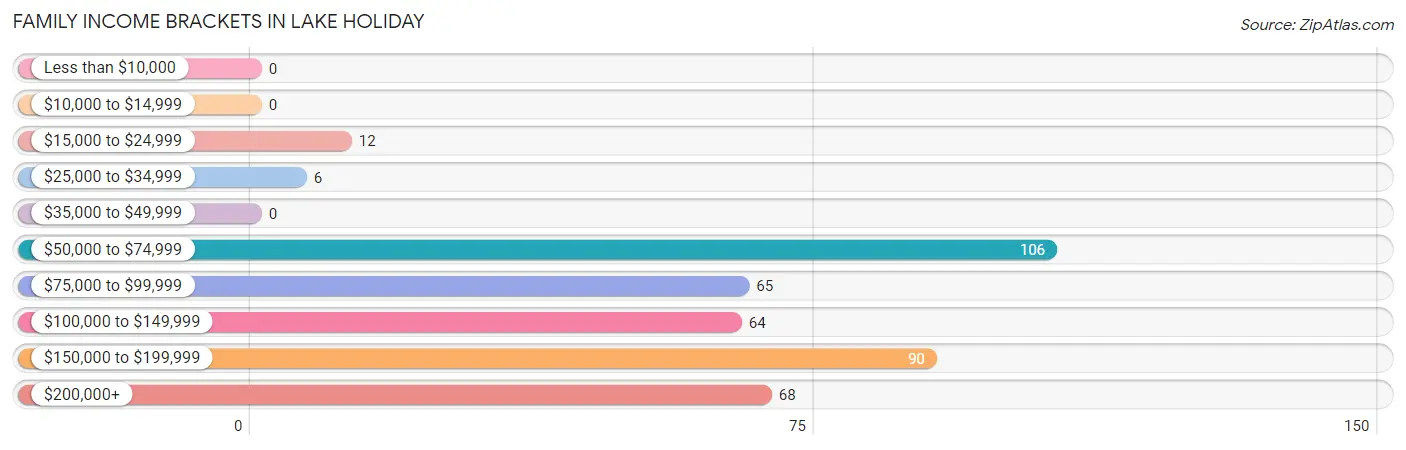
| Income Bracket | # Families | % Families |
| Less than $10,000 | 0 | 0.0% |
| $10,000 to $14,999 | 0 | 0.0% |
| $15,000 to $24,999 | 12 | 2.9% |
| $25,000 to $34,999 | 6 | 1.5% |
| $35,000 to $49,999 | 0 | 0.0% |
| $50,000 to $74,999 | 106 | 25.8% |
| $75,000 to $99,999 | 65 | 15.8% |
| $100,000 to $149,999 | 64 | 15.6% |
| $150,000 to $199,999 | 90 | 21.9% |
| $200,000+ | 68 | 16.5% |
Family Income by Famaliy Size in Lake Holiday
3-person families (85 | 20.7%) account for the highest median family income in Lake Holiday with $156,042 per family, while 3-person families (85 | 20.7%) have the highest median income of $52,014 per family member.
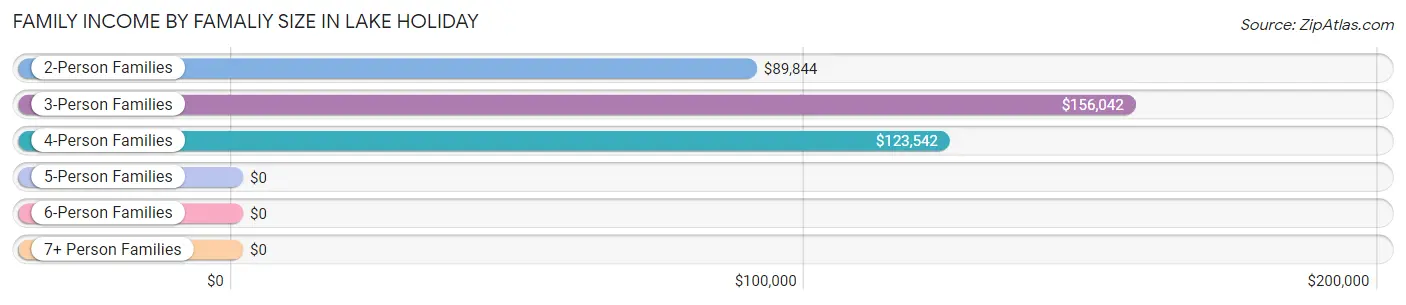
| Income Bracket | # Families | Median Income |
| 2-Person Families | 221 (53.8%) | $89,844 |
| 3-Person Families | 85 (20.7%) | $156,042 |
| 4-Person Families | 41 (10.0%) | $123,542 |
| 5-Person Families | 43 (10.5%) | $0 |
| 6-Person Families | 13 (3.2%) | $0 |
| 7+ Person Families | 8 (1.9%) | $0 |
| Total | 411 (100.0%) | $120,903 |
Family Income by Number of Earners in Lake Holiday
The median family income in Lake Holiday is $120,903, with families comprising 3+ earners (95) having the highest median family income of $155,625, while families with no earners (49) have the lowest median family income of $56,250, accounting for 23.1% and 11.9% of families, respectively.
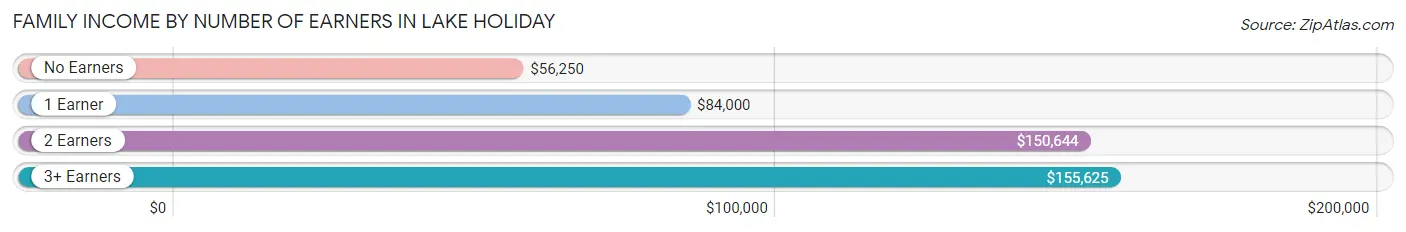
| Number of Earners | # Families | Median Income |
| No Earners | 49 (11.9%) | $56,250 |
| 1 Earner | 94 (22.9%) | $84,000 |
| 2 Earners | 173 (42.1%) | $150,644 |
| 3+ Earners | 95 (23.1%) | $155,625 |
| Total | 411 (100.0%) | $120,903 |
Household Income in Lake Holiday
Household Income Brackets in Lake Holiday
With 135 households falling in the category, the $50,000 to $74,999 income range is the most frequent in Lake Holiday, accounting for 28.7% of all households.
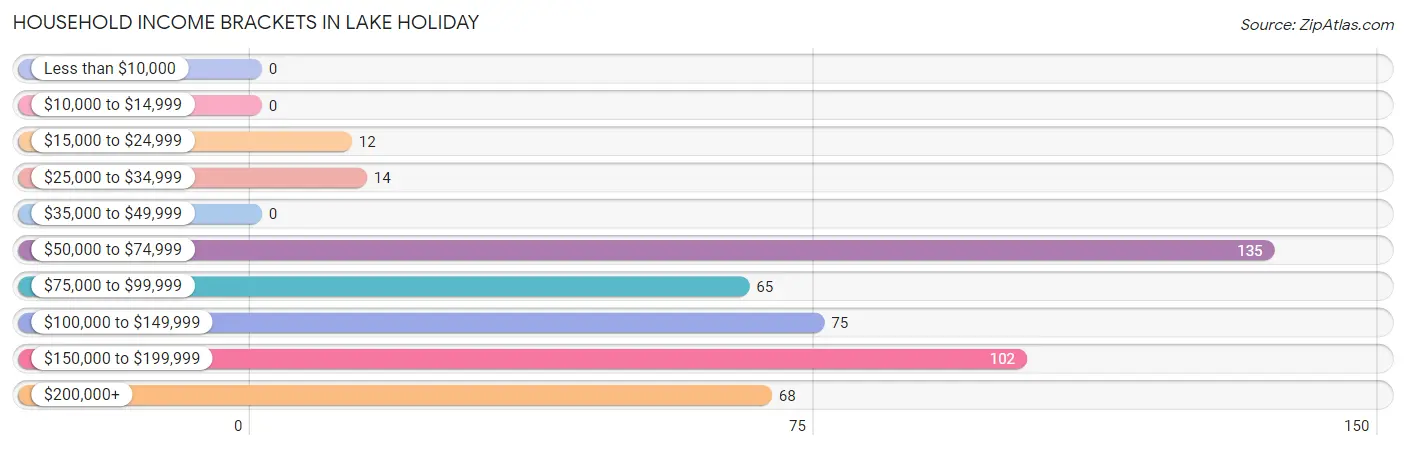
| Income Bracket | # Households | % Households |
| Less than $10,000 | 0 | 0.0% |
| $10,000 to $14,999 | 0 | 0.0% |
| $15,000 to $24,999 | 12 | 2.5% |
| $25,000 to $34,999 | 14 | 3.0% |
| $35,000 to $49,999 | 0 | 0.0% |
| $50,000 to $74,999 | 135 | 28.7% |
| $75,000 to $99,999 | 65 | 13.8% |
| $100,000 to $149,999 | 75 | 15.9% |
| $150,000 to $199,999 | 102 | 21.7% |
| $200,000+ | 68 | 14.4% |
Household Income by Householder Age in Lake Holiday
The median household income in Lake Holiday is $106,131, with the highest median household income of $126,667 found in the 45 to 64 years age bracket for the primary householder. A total of 234 households (49.7%) fall into this category.
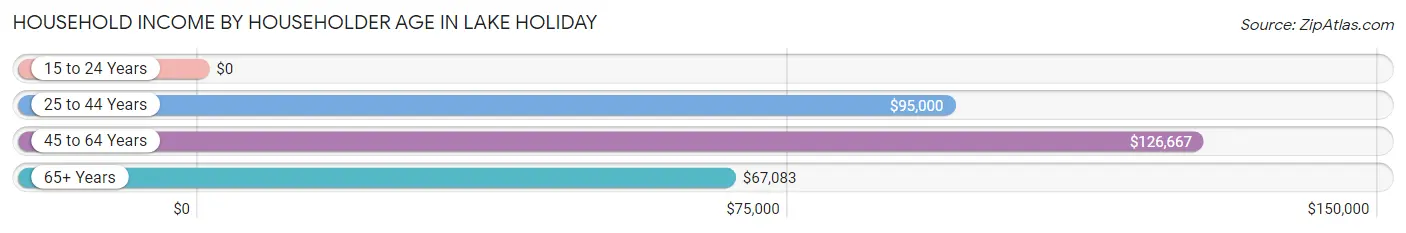
| Income Bracket | # Households | Median Income |
| 15 to 24 Years | 0 (0.0%) | $0 |
| 25 to 44 Years | 106 (22.5%) | $95,000 |
| 45 to 64 Years | 234 (49.7%) | $126,667 |
| 65+ Years | 131 (27.8%) | $67,083 |
| Total | 471 (100.0%) | $106,131 |
Poverty in Lake Holiday
Income Below Poverty by Sex and Age in Lake Holiday
| Age Bracket | Male | Female |
| Under 5 Years | 0 (0.0%) | 0 (0.0%) |
| 5 Years | 0 (0.0%) | 0 (0.0%) |
| 6 to 11 Years | 0 (0.0%) | 0 (0.0%) |
| 12 to 14 Years | 0 (0.0%) | 0 (0.0%) |
| 15 Years | 0 (0.0%) | 0 (0.0%) |
| 16 and 17 Years | 0 (0.0%) | 0 (0.0%) |
| 18 to 24 Years | 0 (0.0%) | 0 (0.0%) |
| 25 to 34 Years | 0 (0.0%) | 0 (0.0%) |
| 35 to 44 Years | 0 (0.0%) | 0 (0.0%) |
| 45 to 54 Years | 0 (0.0%) | 0 (0.0%) |
| 55 to 64 Years | 0 (0.0%) | 0 (0.0%) |
| 65 to 74 Years | 0 (0.0%) | 0 (0.0%) |
| 75 Years and over | 0 (0.0%) | 0 (0.0%) |
| Total | 0 (0.0%) | 0 (0.0%) |
Income Above Poverty by Sex and Age in Lake Holiday
According to the poverty statistics in Lake Holiday, males aged under 5 years and females aged under 5 years are the age groups that are most secure financially, with 100.0% of males and 100.0% of females in these age groups living above the poverty line.
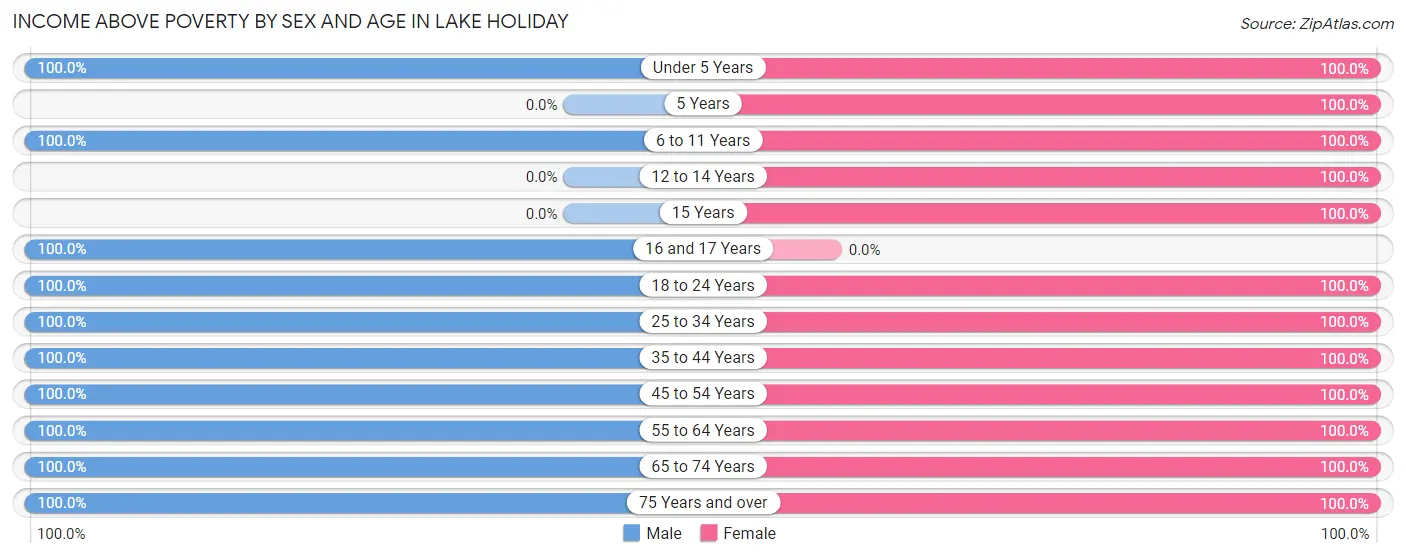
| Age Bracket | Male | Female |
| Under 5 Years | 25 (100.0%) | 12 (100.0%) |
| 5 Years | 0 (0.0%) | 25 (100.0%) |
| 6 to 11 Years | 81 (100.0%) | 27 (100.0%) |
| 12 to 14 Years | 0 (0.0%) | 66 (100.0%) |
| 15 Years | 0 (0.0%) | 19 (100.0%) |
| 16 and 17 Years | 62 (100.0%) | 0 (0.0%) |
| 18 to 24 Years | 13 (100.0%) | 87 (100.0%) |
| 25 to 34 Years | 46 (100.0%) | 76 (100.0%) |
| 35 to 44 Years | 72 (100.0%) | 36 (100.0%) |
| 45 to 54 Years | 89 (100.0%) | 80 (100.0%) |
| 55 to 64 Years | 112 (100.0%) | 154 (100.0%) |
| 65 to 74 Years | 81 (100.0%) | 59 (100.0%) |
| 75 Years and over | 35 (100.0%) | 33 (100.0%) |
| Total | 616 (100.0%) | 674 (100.0%) |
Income Below Poverty Among Married-Couple Families in Lake Holiday
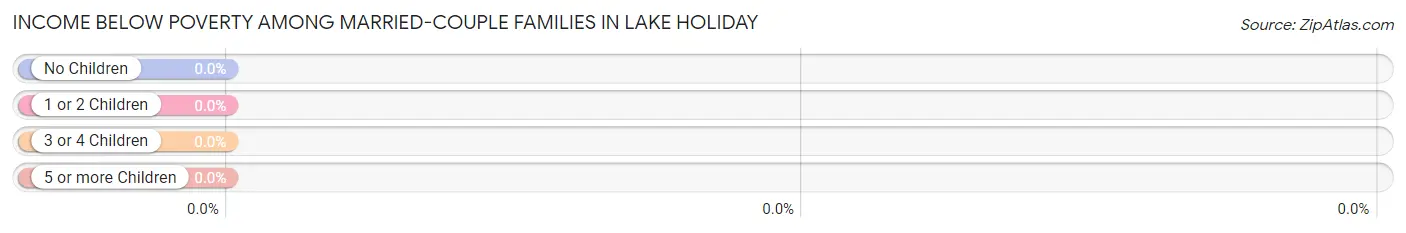
| Children | Above Poverty | Below Poverty |
| No Children | 246 (100.0%) | 0 (0.0%) |
| 1 or 2 Children | 49 (100.0%) | 0 (0.0%) |
| 3 or 4 Children | 56 (100.0%) | 0 (0.0%) |
| 5 or more Children | 8 (100.0%) | 0 (0.0%) |
| Total | 359 (100.0%) | 0 (0.0%) |
Income Below Poverty Among Single-Parent Households in Lake Holiday
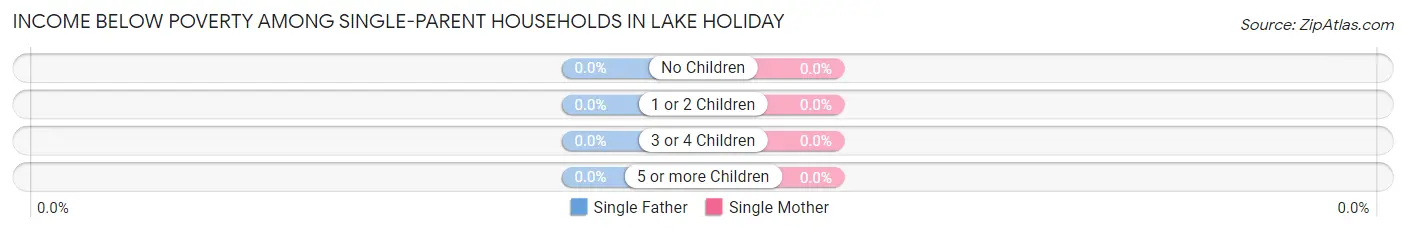
| Children | Single Father | Single Mother |
| No Children | 0 (0.0%) | 0 (0.0%) |
| 1 or 2 Children | 0 (0.0%) | 0 (0.0%) |
| 3 or 4 Children | 0 (0.0%) | 0 (0.0%) |
| 5 or more Children | 0 (0.0%) | 0 (0.0%) |
| Total | 0 (0.0%) | 0 (0.0%) |
Income Below Poverty Among Married-Couple vs Single-Parent Households in Lake Holiday
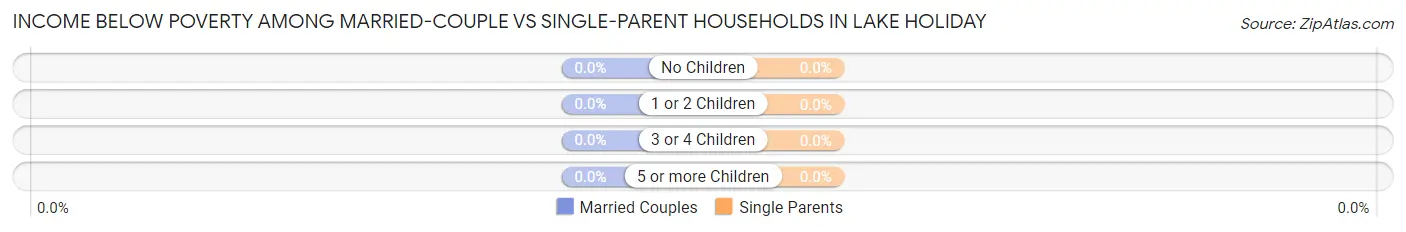
| Children | Married-Couple Families | Single-Parent Households |
| No Children | 0 (0.0%) | 0 (0.0%) |
| 1 or 2 Children | 0 (0.0%) | 0 (0.0%) |
| 3 or 4 Children | 0 (0.0%) | 0 (0.0%) |
| 5 or more Children | 0 (0.0%) | 0 (0.0%) |
| Total | 0 (0.0%) | 0 (0.0%) |
Employment Characteristics in Lake Holiday
Employment by Class of Employer in Lake Holiday
Among the 741 employed individuals in Lake Holiday, private company employees (495 | 66.8%), local government employees (98 | 13.2%), and not-for-profit organizations (87 | 11.7%) make up the most common classes of employment.
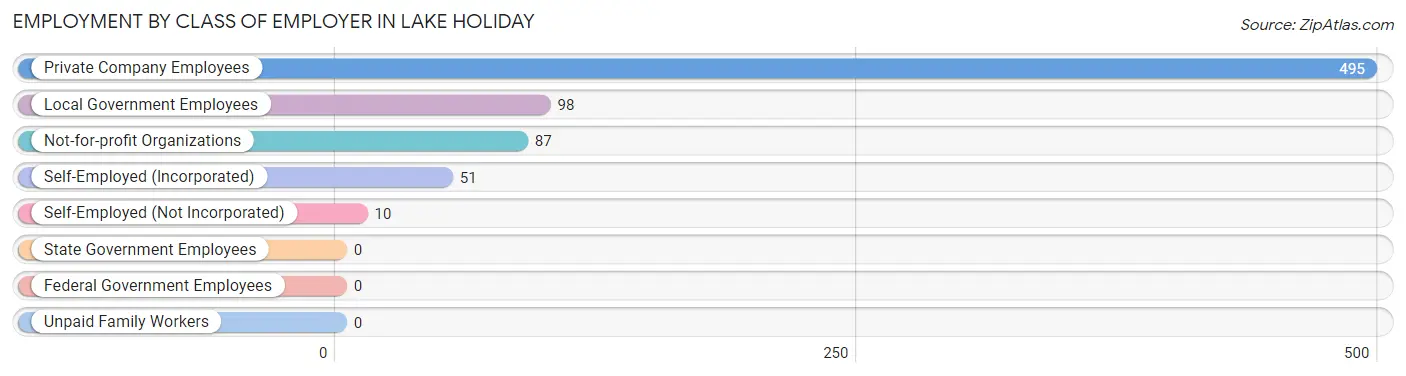
| Employer Class | # Employees | % Employees |
| Private Company Employees | 495 | 66.8% |
| Self-Employed (Incorporated) | 51 | 6.9% |
| Self-Employed (Not Incorporated) | 10 | 1.3% |
| Not-for-profit Organizations | 87 | 11.7% |
| Local Government Employees | 98 | 13.2% |
| State Government Employees | 0 | 0.0% |
| Federal Government Employees | 0 | 0.0% |
| Unpaid Family Workers | 0 | 0.0% |
| Total | 741 | 100.0% |
Employment Status by Age in Lake Holiday
According to the labor force statistics for Lake Holiday, out of the total population over 16 years of age (1,035), 77.1% or 798 individuals are in the labor force, with 4.8% or 38 of them unemployed. The age group with the highest labor force participation rate is 20 to 24 years, with 100.0% or 68 individuals in the labor force. Within the labor force, the 25 to 29 years age range has the highest percentage of unemployed individuals, with 44.2% or 19 of them being unemployed.
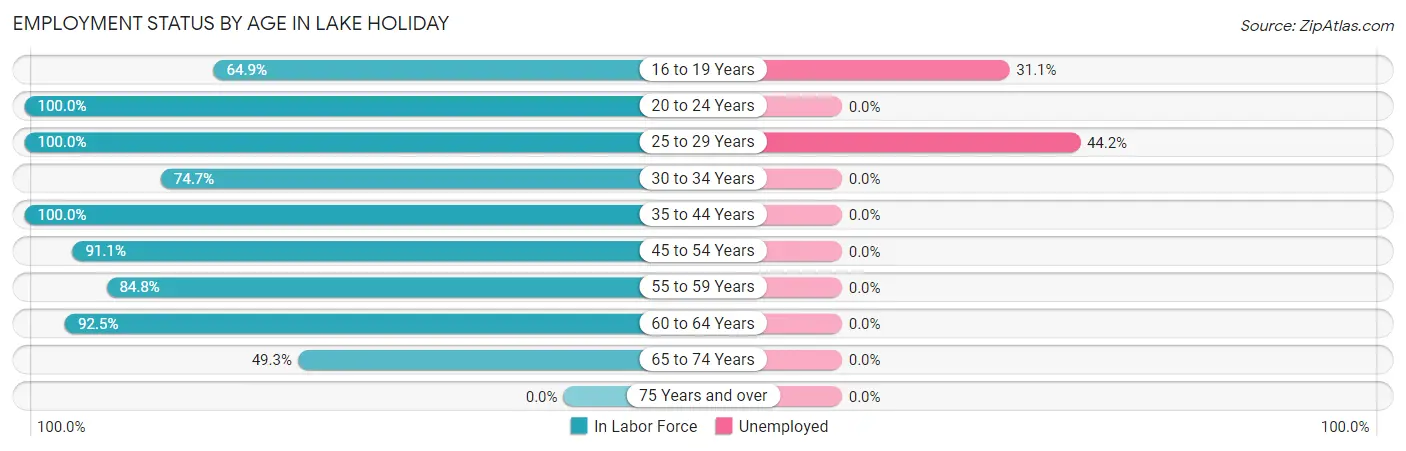
| Age Bracket | In Labor Force | Unemployed |
| 16 to 19 Years | 61 (64.9%) | 19 (31.1%) |
| 20 to 24 Years | 68 (100.0%) | 0 (0.0%) |
| 25 to 29 Years | 43 (100.0%) | 19 (44.2%) |
| 30 to 34 Years | 59 (74.7%) | 0 (0.0%) |
| 35 to 44 Years | 108 (100.0%) | 0 (0.0%) |
| 45 to 54 Years | 154 (91.1%) | 0 (0.0%) |
| 55 to 59 Years | 112 (84.8%) | 0 (0.0%) |
| 60 to 64 Years | 124 (92.5%) | 0 (0.0%) |
| 65 to 74 Years | 69 (49.3%) | 0 (0.0%) |
| 75 Years and over | 0 (0.0%) | 0 (0.0%) |
| Total | 798 (77.1%) | 38 (4.8%) |
Employment Status by Educational Attainment in Lake Holiday
According to labor force statistics for Lake Holiday, 90.2% of individuals (600) out of the total population between 25 and 64 years of age (665) are in the labor force, with 3.2% or 19 of them being unemployed. The group with the highest labor force participation rate are those with the educational attainment of bachelor's degree or higher, with 96.4% or 269 individuals in the labor force. Within the labor force, individuals with bachelor's degree or higher education have the highest percentage of unemployment, with 7.1% or 19 of them being unemployed.
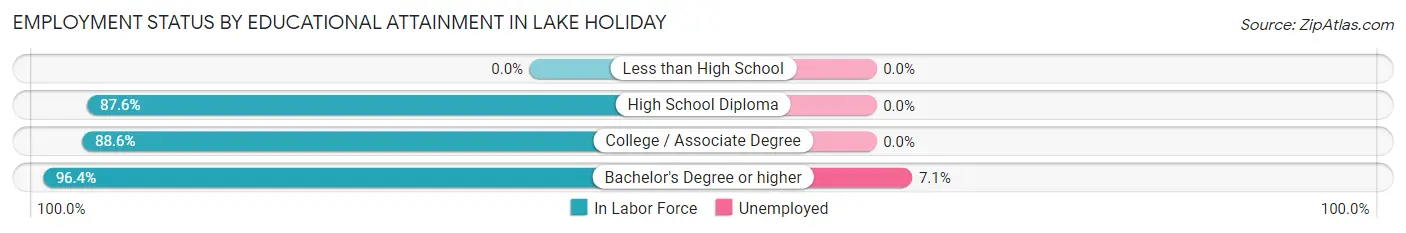
| Educational Attainment | In Labor Force | Unemployed |
| Less than High School | 0 (0.0%) | 0 (0.0%) |
| High School Diploma | 176 (87.6%) | 0 (0.0%) |
| College / Associate Degree | 155 (88.6%) | 0 (0.0%) |
| Bachelor's Degree or higher | 269 (96.4%) | 20 (7.1%) |
| Total | 600 (90.2%) | 21 (3.2%) |
Employment Occupations by Sex in Lake Holiday
Management, Business, Science and Arts Occupations
The most common Management, Business, Science and Arts occupations in Lake Holiday are Health Diagnosing & Treating (109 | 14.3%), Community & Social Service (97 | 12.8%), Health Technologists (75 | 9.9%), Business & Financial (73 | 9.6%), and Education Instruction & Library (68 | 8.9%).
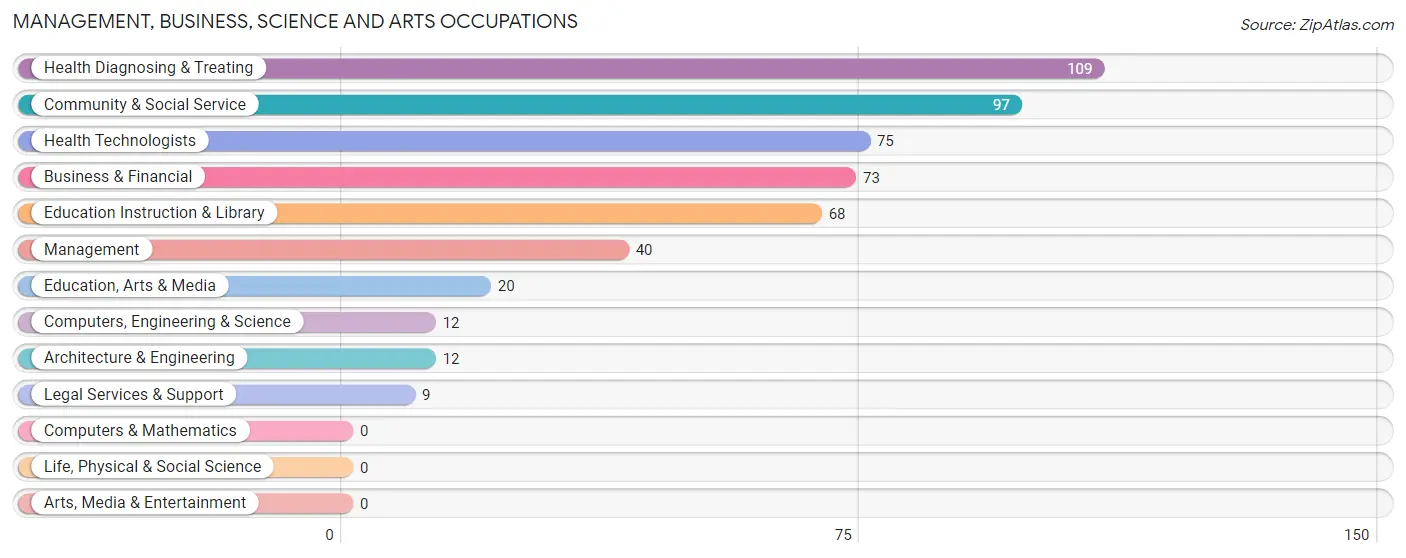
Management, Business, Science and Arts Occupations by Sex
Within the Management, Business, Science and Arts occupations in Lake Holiday, the most male-oriented occupations are Management (100.0%), Computers, Engineering & Science (100.0%), and Architecture & Engineering (100.0%), while the most female-oriented occupations are Business & Financial (100.0%), Legal Services & Support (100.0%), and Health Technologists (84.0%).

| Occupation | Male | Female |
| Management | 40 (100.0%) | 0 (0.0%) |
| Business & Financial | 0 (0.0%) | 73 (100.0%) |
| Computers, Engineering & Science | 12 (100.0%) | 0 (0.0%) |
| Computers & Mathematics | 0 (0.0%) | 0 (0.0%) |
| Architecture & Engineering | 12 (100.0%) | 0 (0.0%) |
| Life, Physical & Social Science | 0 (0.0%) | 0 (0.0%) |
| Community & Social Service | 33 (34.0%) | 64 (66.0%) |
| Education, Arts & Media | 20 (100.0%) | 0 (0.0%) |
| Legal Services & Support | 0 (0.0%) | 9 (100.0%) |
| Education Instruction & Library | 13 (19.1%) | 55 (80.9%) |
| Arts, Media & Entertainment | 0 (0.0%) | 0 (0.0%) |
| Health Diagnosing & Treating | 30 (27.5%) | 79 (72.5%) |
| Health Technologists | 12 (16.0%) | 63 (84.0%) |
| Total (Category) | 115 (34.7%) | 216 (65.3%) |
| Total (Overall) | 371 (48.8%) | 389 (51.2%) |
Services Occupations
Services Occupations by Sex
| Occupation | Male | Female |
| Healthcare Support | 0 (0.0%) | 0 (0.0%) |
| Security & Protection | 0 (0.0%) | 0 (0.0%) |
| Firefighting & Prevention | 0 (0.0%) | 0 (0.0%) |
| Law Enforcement | 0 (0.0%) | 0 (0.0%) |
| Food Preparation & Serving | 0 (0.0%) | 0 (0.0%) |
| Cleaning & Maintenance | 0 (0.0%) | 0 (0.0%) |
| Personal Care & Service | 0 (0.0%) | 0 (0.0%) |
| Total (Category) | 0 (0.0%) | 0 (0.0%) |
| Total (Overall) | 371 (48.8%) | 389 (51.2%) |
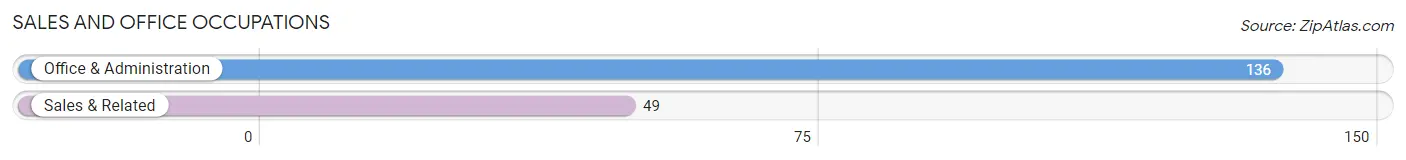
Sales and Office Occupations
The most common Sales and Office occupations in Lake Holiday are Office & Administration (136 | 17.9%), and Sales & Related (49 | 6.5%).
Sales and Office Occupations by Sex
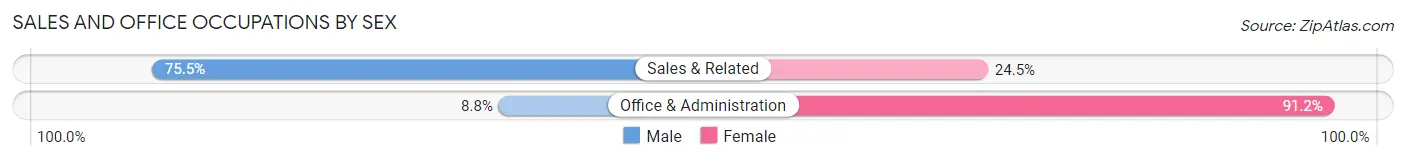
| Occupation | Male | Female |
| Sales & Related | 37 (75.5%) | 12 (24.5%) |
| Office & Administration | 12 (8.8%) | 124 (91.2%) |
| Total (Category) | 49 (26.5%) | 136 (73.5%) |
| Total (Overall) | 371 (48.8%) | 389 (51.2%) |
Natural Resources, Construction and Maintenance Occupations
The most common Natural Resources, Construction and Maintenance occupations in Lake Holiday are Installation, Maintenance & Repair (70 | 9.2%), and Construction & Extraction (14 | 1.8%).
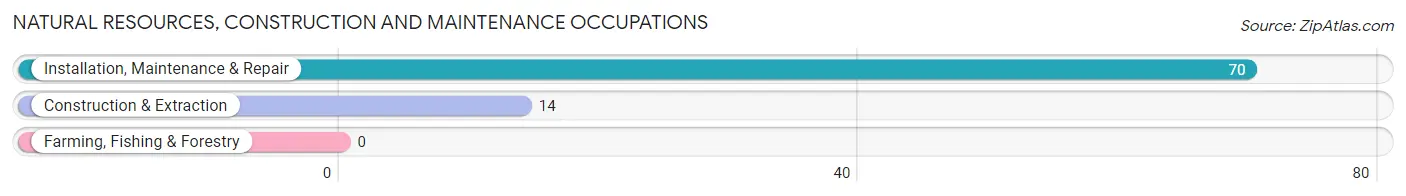
Natural Resources, Construction and Maintenance Occupations by Sex
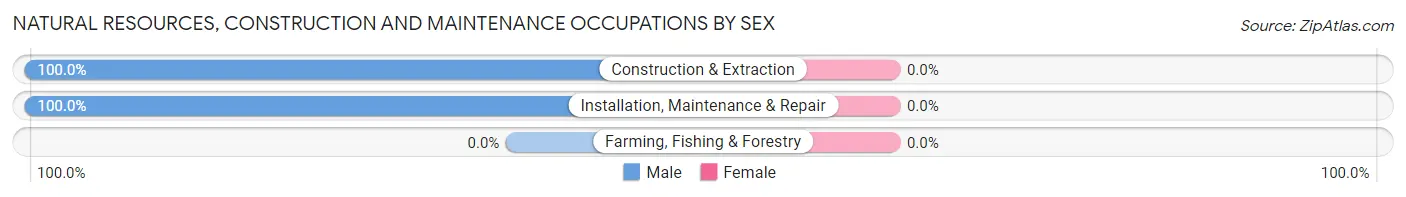
| Occupation | Male | Female |
| Farming, Fishing & Forestry | 0 (0.0%) | 0 (0.0%) |
| Construction & Extraction | 14 (100.0%) | 0 (0.0%) |
| Installation, Maintenance & Repair | 70 (100.0%) | 0 (0.0%) |
| Total (Category) | 84 (100.0%) | 0 (0.0%) |
| Total (Overall) | 371 (48.8%) | 389 (51.2%) |
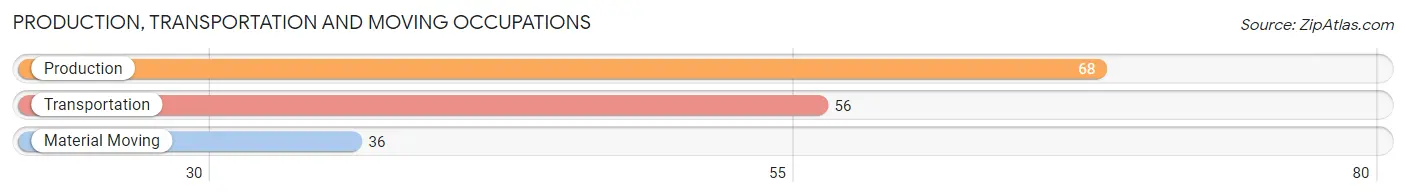
Production, Transportation and Moving Occupations
The most common Production, Transportation and Moving occupations in Lake Holiday are Production (68 | 8.9%), Transportation (56 | 7.4%), and Material Moving (36 | 4.7%).
Production, Transportation and Moving Occupations by Sex
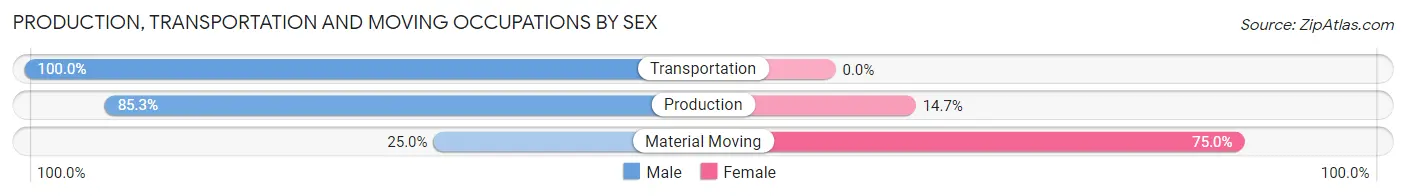
| Occupation | Male | Female |
| Production | 58 (85.3%) | 10 (14.7%) |
| Transportation | 56 (100.0%) | 0 (0.0%) |
| Material Moving | 9 (25.0%) | 27 (75.0%) |
| Total (Category) | 123 (76.9%) | 37 (23.1%) |
| Total (Overall) | 371 (48.8%) | 389 (51.2%) |
Employment Industries by Sex in Lake Holiday
Employment Industries in Lake Holiday
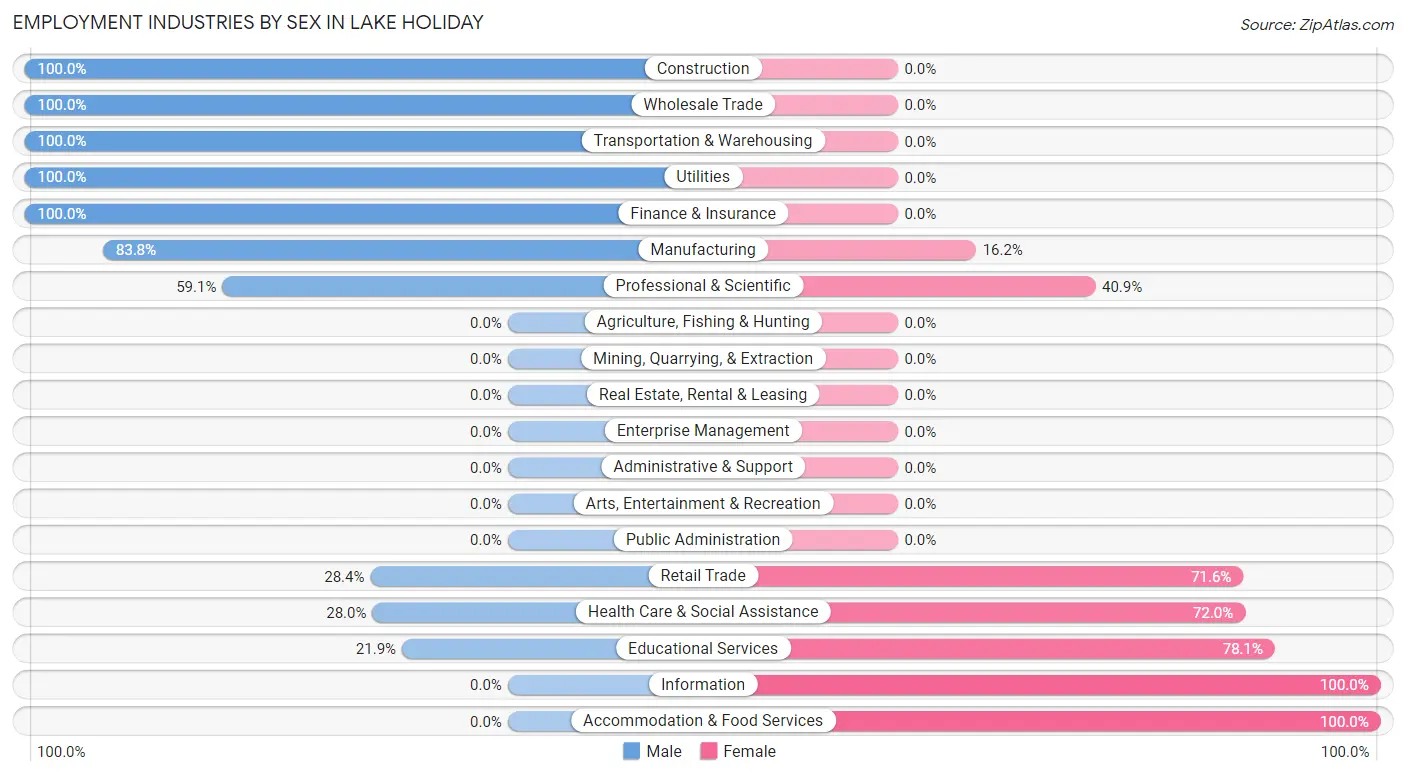
The major employment industries in Lake Holiday include Manufacturing (179 | 23.5%), Retail Trade (109 | 14.3%), Health Care & Social Assistance (107 | 14.1%), Educational Services (105 | 13.8%), and Construction (39 | 5.1%).

Employment Industries by Sex in Lake Holiday
The Lake Holiday industries that see more men than women are Construction (100.0%), Wholesale Trade (100.0%), and Transportation & Warehousing (100.0%), whereas the industries that tend to have a higher number of women are Information (100.0%), Accommodation & Food Services (100.0%), and Educational Services (78.1%).
| Industry | Male | Female |
| Agriculture, Fishing & Hunting | 0 (0.0%) | 0 (0.0%) |
| Mining, Quarrying, & Extraction | 0 (0.0%) | 0 (0.0%) |
| Construction | 39 (100.0%) | 0 (0.0%) |
| Manufacturing | 150 (83.8%) | 29 (16.2%) |
| Wholesale Trade | 12 (100.0%) | 0 (0.0%) |
| Retail Trade | 31 (28.4%) | 78 (71.6%) |
| Transportation & Warehousing | 38 (100.0%) | 0 (0.0%) |
| Utilities | 9 (100.0%) | 0 (0.0%) |
| Information | 0 (0.0%) | 20 (100.0%) |
| Finance & Insurance | 6 (100.0%) | 0 (0.0%) |
| Real Estate, Rental & Leasing | 0 (0.0%) | 0 (0.0%) |
| Professional & Scientific | 13 (59.1%) | 9 (40.9%) |
| Enterprise Management | 0 (0.0%) | 0 (0.0%) |
| Administrative & Support | 0 (0.0%) | 0 (0.0%) |
| Educational Services | 23 (21.9%) | 82 (78.1%) |
| Health Care & Social Assistance | 30 (28.0%) | 77 (72.0%) |
| Arts, Entertainment & Recreation | 0 (0.0%) | 0 (0.0%) |
| Accommodation & Food Services | 0 (0.0%) | 33 (100.0%) |
| Public Administration | 0 (0.0%) | 0 (0.0%) |
| Total | 371 (48.8%) | 389 (51.2%) |
Education in Lake Holiday
School Enrollment in Lake Holiday
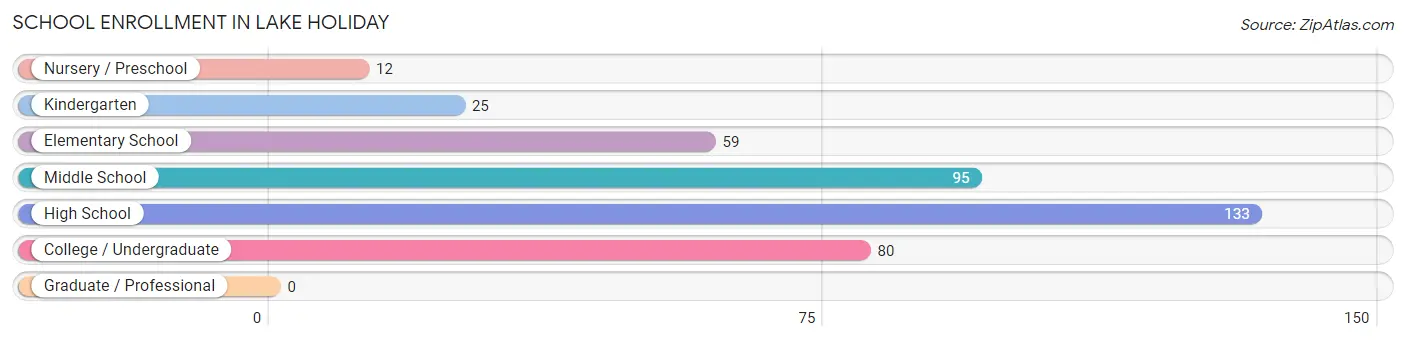
The most common levels of schooling among the 404 students in Lake Holiday are high school (133 | 32.9%), middle school (95 | 23.5%), and college / undergraduate (80 | 19.8%).
| School Level | # Students | % Students |
| Nursery / Preschool | 12 | 3.0% |
| Kindergarten | 25 | 6.2% |
| Elementary School | 59 | 14.6% |
| Middle School | 95 | 23.5% |
| High School | 133 | 32.9% |
| College / Undergraduate | 80 | 19.8% |
| Graduate / Professional | 0 | 0.0% |
| Total | 404 | 100.0% |
School Enrollment by Age by Funding Source in Lake Holiday
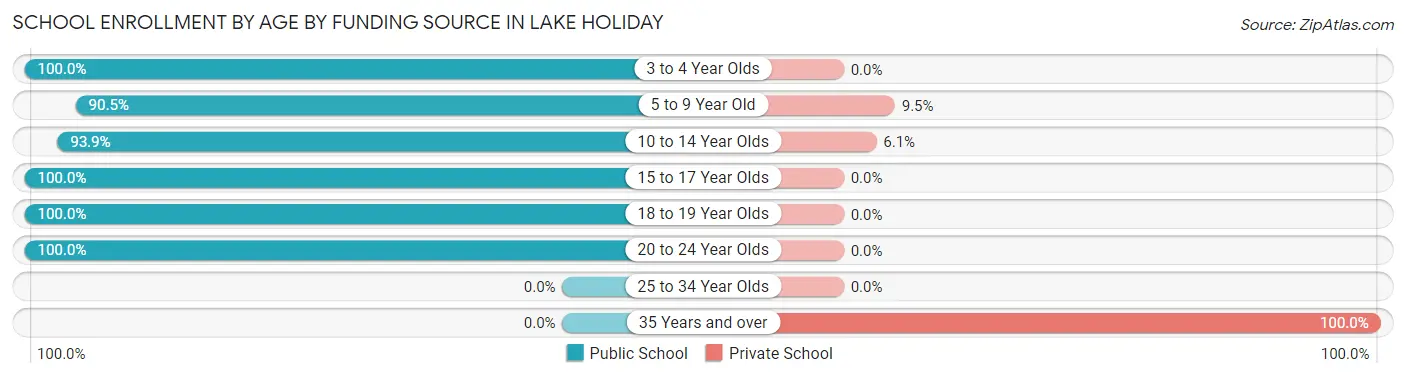
Out of a total of 404 students who are enrolled in schools in Lake Holiday, 27 (6.7%) attend a private institution, while the remaining 377 (93.3%) are enrolled in public schools. The age group of 35 years and over has the highest likelihood of being enrolled in private schools, with 12 (100.0% in the age bracket) enrolled. Conversely, the age group of 3 to 4 year olds has the lowest likelihood of being enrolled in a private school, with 12 (100.0% in the age bracket) attending a public institution.
| Age Bracket | Public School | Private School |
| 3 to 4 Year Olds | 12 (100.0%) | 0 (0.0%) |
| 5 to 9 Year Old | 76 (90.5%) | 8 (9.5%) |
| 10 to 14 Year Olds | 108 (93.9%) | 7 (6.1%) |
| 15 to 17 Year Olds | 81 (100.0%) | 0 (0.0%) |
| 18 to 19 Year Olds | 32 (100.0%) | 0 (0.0%) |
| 20 to 24 Year Olds | 68 (100.0%) | 0 (0.0%) |
| 25 to 34 Year Olds | 0 (0.0%) | 0 (0.0%) |
| 35 Years and over | 0 (0.0%) | 12 (100.0%) |
| Total | 377 (93.3%) | 27 (6.7%) |
Educational Attainment by Field of Study in Lake Holiday
Business (108 | 30.3%), education (82 | 23.0%), engineering (35 | 9.8%), psychology (33 | 9.3%), and bio, nature & agricultural (24 | 6.7%) are the most common fields of study among 356 individuals in Lake Holiday who have obtained a bachelor's degree or higher.

| Field of Study | # Graduates | % Graduates |
| Computers & Mathematics | 13 | 3.6% |
| Bio, Nature & Agricultural | 24 | 6.7% |
| Physical & Health Sciences | 0 | 0.0% |
| Psychology | 33 | 9.3% |
| Social Sciences | 10 | 2.8% |
| Engineering | 35 | 9.8% |
| Multidisciplinary Studies | 0 | 0.0% |
| Science & Technology | 19 | 5.3% |
| Business | 108 | 30.3% |
| Education | 82 | 23.0% |
| Literature & Languages | 6 | 1.7% |
| Liberal Arts & History | 13 | 3.6% |
| Visual & Performing Arts | 0 | 0.0% |
| Communications | 13 | 3.6% |
| Arts & Humanities | 0 | 0.0% |
| Total | 356 | 100.0% |
Transportation & Commute in Lake Holiday
Vehicle Availability by Sex in Lake Holiday
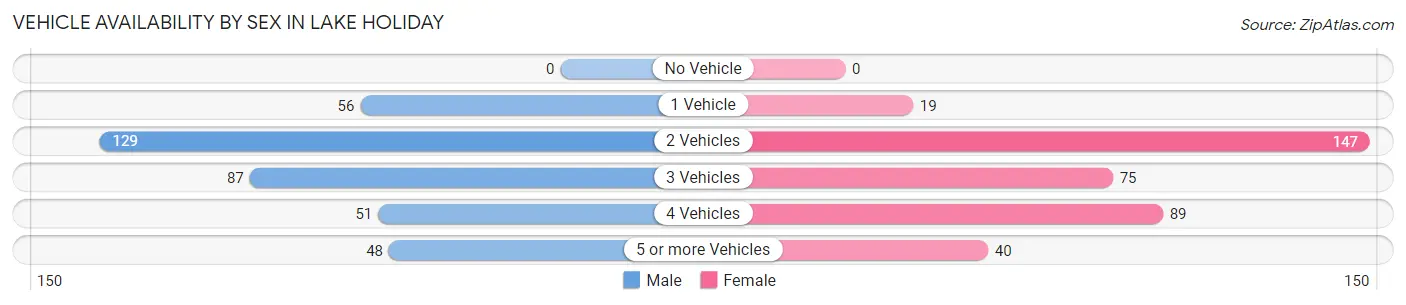
The most prevalent vehicle ownership categories in Lake Holiday are males with 2 vehicles (129, accounting for 34.8%) and females with 2 vehicles (147, making up 34.9%).
| Vehicles Available | Male | Female |
| No Vehicle | 0 (0.0%) | 0 (0.0%) |
| 1 Vehicle | 56 (15.1%) | 19 (5.1%) |
| 2 Vehicles | 129 (34.8%) | 147 (39.7%) |
| 3 Vehicles | 87 (23.4%) | 75 (20.3%) |
| 4 Vehicles | 51 (13.8%) | 89 (24.0%) |
| 5 or more Vehicles | 48 (12.9%) | 40 (10.8%) |
| Total | 371 (100.0%) | 370 (100.0%) |
Commute Time in Lake Holiday
The most frequently occuring commute durations in Lake Holiday are 10 to 14 minutes (164 commuters, 22.4%), 15 to 19 minutes (145 commuters, 19.8%), and 20 to 24 minutes (132 commuters, 18.0%).
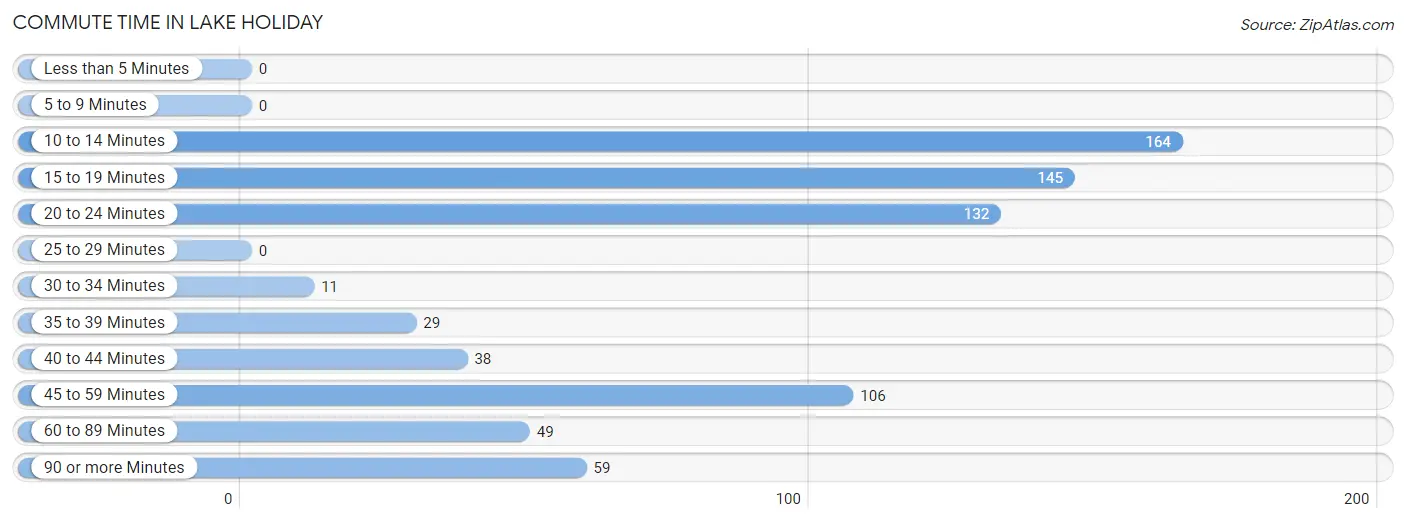
| Commute Time | # Commuters | % Commuters |
| Less than 5 Minutes | 0 | 0.0% |
| 5 to 9 Minutes | 0 | 0.0% |
| 10 to 14 Minutes | 164 | 22.4% |
| 15 to 19 Minutes | 145 | 19.8% |
| 20 to 24 Minutes | 132 | 18.0% |
| 25 to 29 Minutes | 0 | 0.0% |
| 30 to 34 Minutes | 11 | 1.5% |
| 35 to 39 Minutes | 29 | 4.0% |
| 40 to 44 Minutes | 38 | 5.2% |
| 45 to 59 Minutes | 106 | 14.5% |
| 60 to 89 Minutes | 49 | 6.7% |
| 90 or more Minutes | 59 | 8.1% |
Commute Time by Sex in Lake Holiday
The most common commute times in Lake Holiday are 20 to 24 minutes (82 commuters, 22.6%) for males and 10 to 14 minutes (131 commuters, 35.4%) for females.
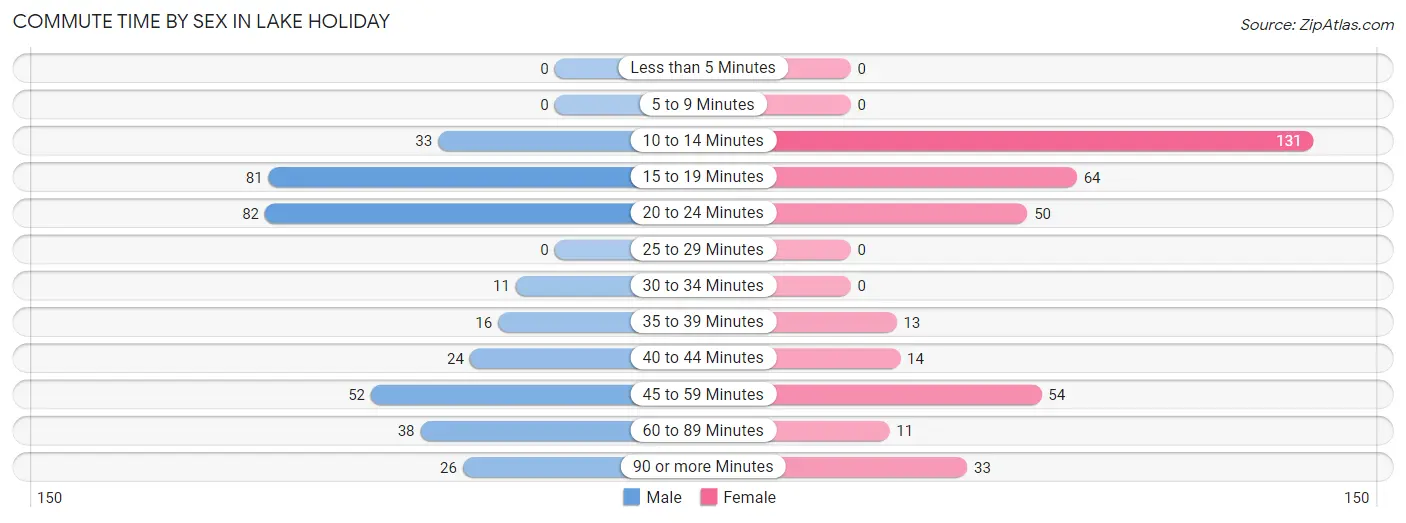
| Commute Time | Male | Female |
| Less than 5 Minutes | 0 (0.0%) | 0 (0.0%) |
| 5 to 9 Minutes | 0 (0.0%) | 0 (0.0%) |
| 10 to 14 Minutes | 33 (9.1%) | 131 (35.4%) |
| 15 to 19 Minutes | 81 (22.3%) | 64 (17.3%) |
| 20 to 24 Minutes | 82 (22.6%) | 50 (13.5%) |
| 25 to 29 Minutes | 0 (0.0%) | 0 (0.0%) |
| 30 to 34 Minutes | 11 (3.0%) | 0 (0.0%) |
| 35 to 39 Minutes | 16 (4.4%) | 13 (3.5%) |
| 40 to 44 Minutes | 24 (6.6%) | 14 (3.8%) |
| 45 to 59 Minutes | 52 (14.3%) | 54 (14.6%) |
| 60 to 89 Minutes | 38 (10.5%) | 11 (3.0%) |
| 90 or more Minutes | 26 (7.2%) | 33 (8.9%) |
Time of Departure to Work by Sex in Lake Holiday
The most frequent times of departure to work in Lake Holiday are 7:00 AM to 7:29 AM (57, 15.7%) for males and 7:30 AM to 7:59 AM (71, 19.2%) for females.
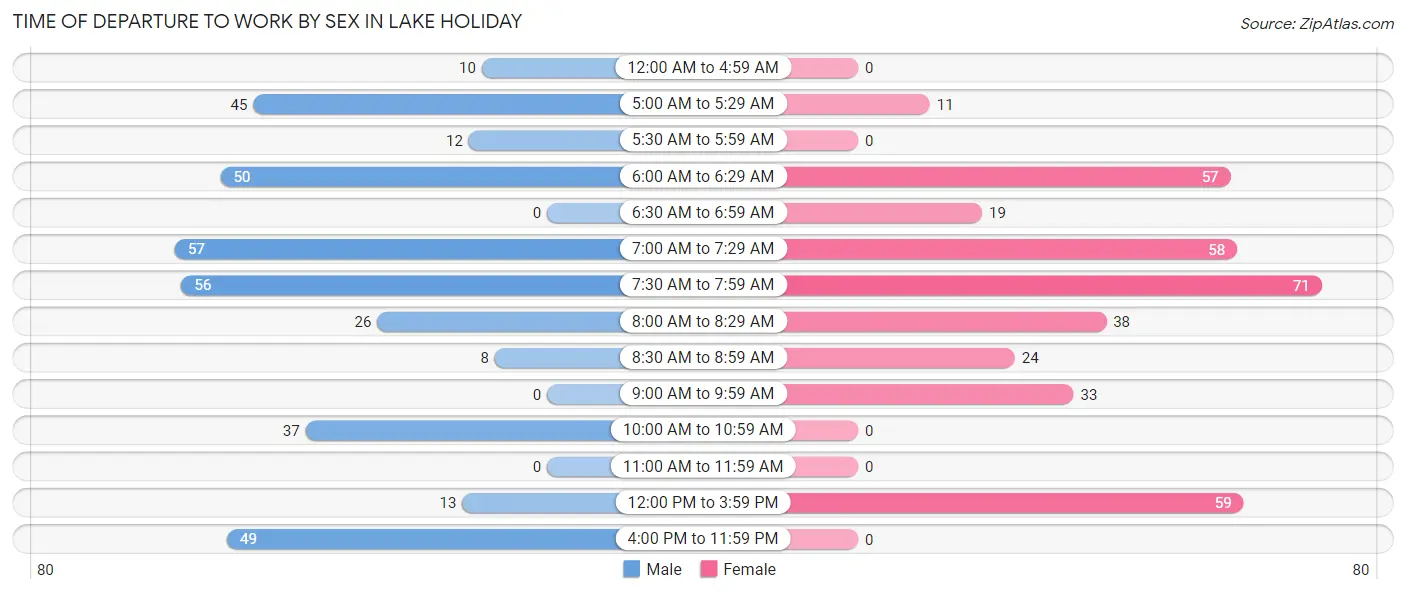
| Time of Departure | Male | Female |
| 12:00 AM to 4:59 AM | 10 (2.8%) | 0 (0.0%) |
| 5:00 AM to 5:29 AM | 45 (12.4%) | 11 (3.0%) |
| 5:30 AM to 5:59 AM | 12 (3.3%) | 0 (0.0%) |
| 6:00 AM to 6:29 AM | 50 (13.8%) | 57 (15.4%) |
| 6:30 AM to 6:59 AM | 0 (0.0%) | 19 (5.1%) |
| 7:00 AM to 7:29 AM | 57 (15.7%) | 58 (15.7%) |
| 7:30 AM to 7:59 AM | 56 (15.4%) | 71 (19.2%) |
| 8:00 AM to 8:29 AM | 26 (7.2%) | 38 (10.3%) |
| 8:30 AM to 8:59 AM | 8 (2.2%) | 24 (6.5%) |
| 9:00 AM to 9:59 AM | 0 (0.0%) | 33 (8.9%) |
| 10:00 AM to 10:59 AM | 37 (10.2%) | 0 (0.0%) |
| 11:00 AM to 11:59 AM | 0 (0.0%) | 0 (0.0%) |
| 12:00 PM to 3:59 PM | 13 (3.6%) | 59 (16.0%) |
| 4:00 PM to 11:59 PM | 49 (13.5%) | 0 (0.0%) |
| Total | 363 (100.0%) | 370 (100.0%) |
Housing Occupancy in Lake Holiday
Occupancy by Ownership in Lake Holiday
Of the total 471 dwellings in Lake Holiday, owner-occupied units account for 418 (88.7%), while renter-occupied units make up 53 (11.3%).
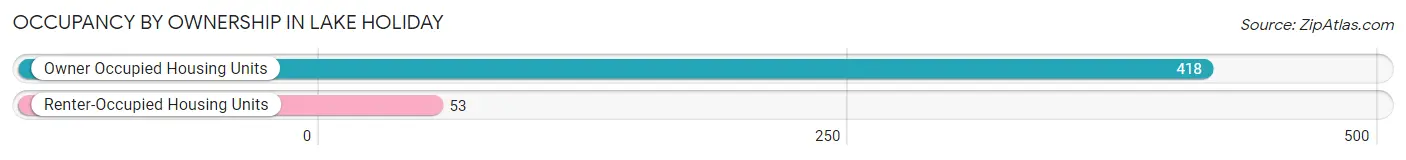
| Occupancy | # Housing Units | % Housing Units |
| Owner Occupied Housing Units | 418 | 88.7% |
| Renter-Occupied Housing Units | 53 | 11.3% |
| Total Occupied Housing Units | 471 | 100.0% |
Occupancy by Household Size in Lake Holiday
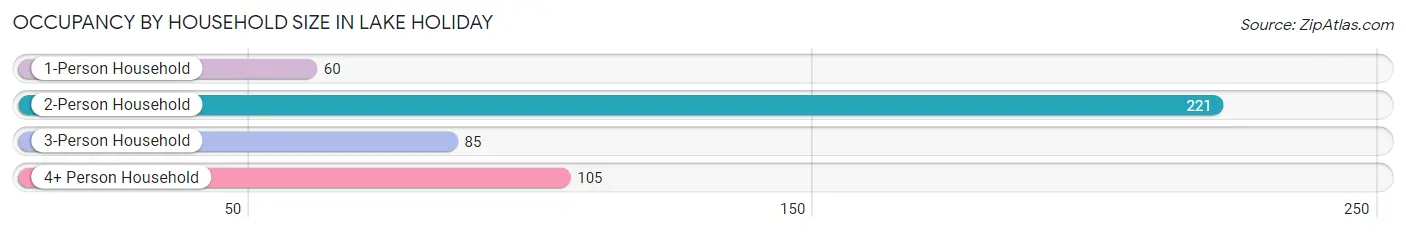
| Household Size | # Housing Units | % Housing Units |
| 1-Person Household | 60 | 12.7% |
| 2-Person Household | 221 | 46.9% |
| 3-Person Household | 85 | 18.0% |
| 4+ Person Household | 105 | 22.3% |
| Total Housing Units | 471 | 100.0% |
Occupancy by Ownership by Household Size in Lake Holiday
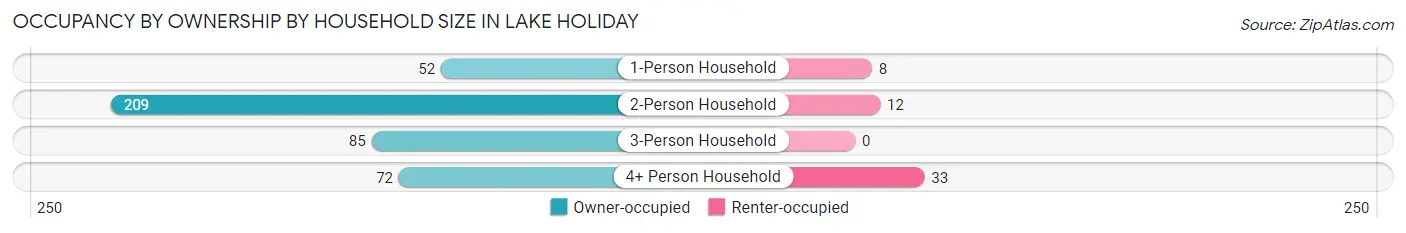
| Household Size | Owner-occupied | Renter-occupied |
| 1-Person Household | 52 (86.7%) | 8 (13.3%) |
| 2-Person Household | 209 (94.6%) | 12 (5.4%) |
| 3-Person Household | 85 (100.0%) | 0 (0.0%) |
| 4+ Person Household | 72 (68.6%) | 33 (31.4%) |
| Total Housing Units | 418 (88.7%) | 53 (11.3%) |
Occupancy by Educational Attainment in Lake Holiday
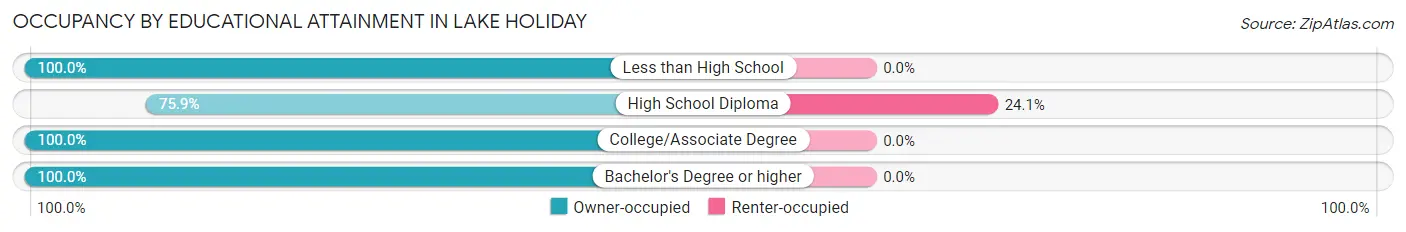
| Household Size | Owner-occupied | Renter-occupied |
| Less than High School | 18 (100.0%) | 0 (0.0%) |
| High School Diploma | 167 (75.9%) | 53 (24.1%) |
| College/Associate Degree | 67 (100.0%) | 0 (0.0%) |
| Bachelor's Degree or higher | 166 (100.0%) | 0 (0.0%) |
Occupancy by Age of Householder in Lake Holiday

| Age Bracket | # Households | % Households |
| Under 35 Years | 43 | 9.1% |
| 35 to 44 Years | 63 | 13.4% |
| 45 to 54 Years | 99 | 21.0% |
| 55 to 64 Years | 135 | 28.7% |
| 65 to 74 Years | 80 | 17.0% |
| 75 to 84 Years | 43 | 9.1% |
| 85 Years and Over | 8 | 1.7% |
| Total | 471 | 100.0% |
Housing Finances in Lake Holiday
Median Income by Occupancy in Lake Holiday
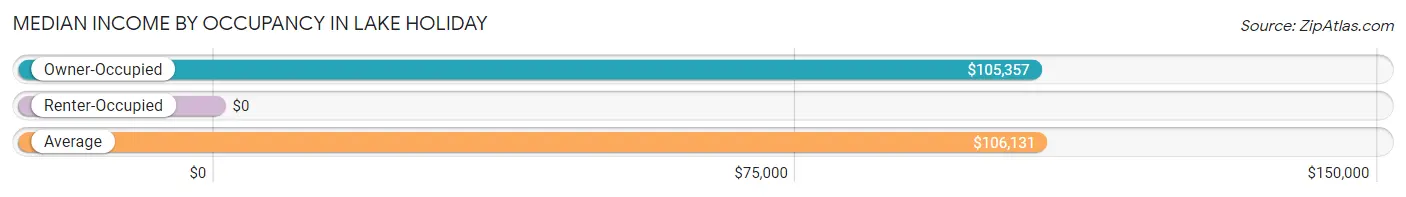
| Occupancy Type | # Households | Median Income |
| Owner-Occupied | 418 (88.7%) | $105,357 |
| Renter-Occupied | 53 (11.3%) | $0 |
| Average | 471 (100.0%) | $106,131 |
Occupancy by Householder Income Bracket in Lake Holiday
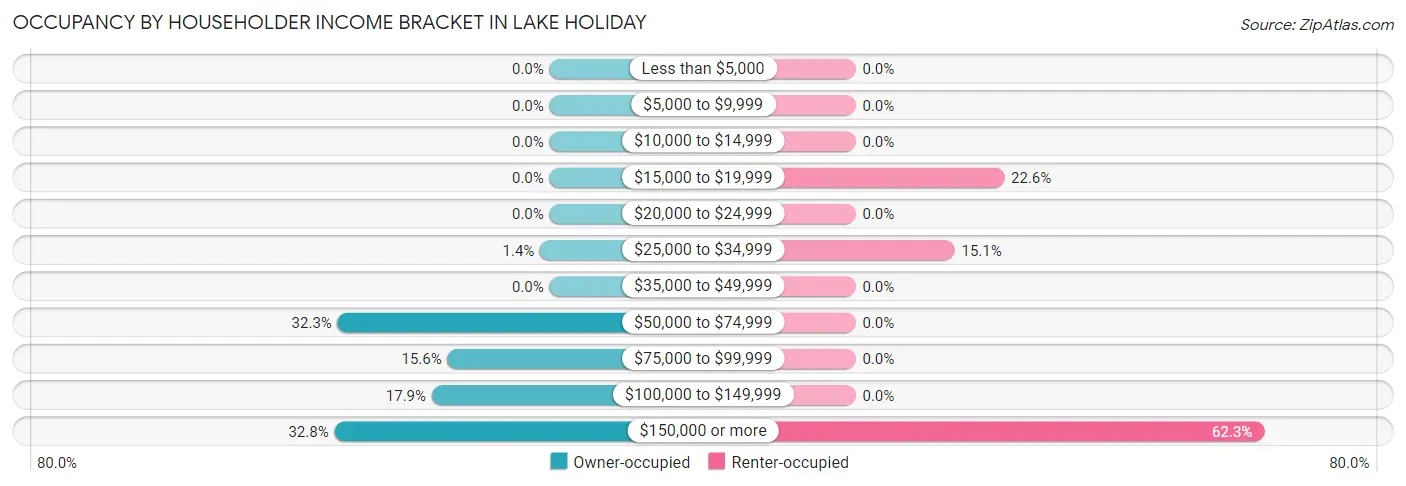
| Income Bracket | Owner-occupied | Renter-occupied |
| Less than $5,000 | 0 (0.0%) | 0 (0.0%) |
| $5,000 to $9,999 | 0 (0.0%) | 0 (0.0%) |
| $10,000 to $14,999 | 0 (0.0%) | 0 (0.0%) |
| $15,000 to $19,999 | 0 (0.0%) | 12 (22.6%) |
| $20,000 to $24,999 | 0 (0.0%) | 0 (0.0%) |
| $25,000 to $34,999 | 6 (1.4%) | 8 (15.1%) |
| $35,000 to $49,999 | 0 (0.0%) | 0 (0.0%) |
| $50,000 to $74,999 | 135 (32.3%) | 0 (0.0%) |
| $75,000 to $99,999 | 65 (15.5%) | 0 (0.0%) |
| $100,000 to $149,999 | 75 (17.9%) | 0 (0.0%) |
| $150,000 or more | 137 (32.8%) | 33 (62.3%) |
| Total | 418 (100.0%) | 53 (100.0%) |
Monthly Housing Cost Tiers in Lake Holiday
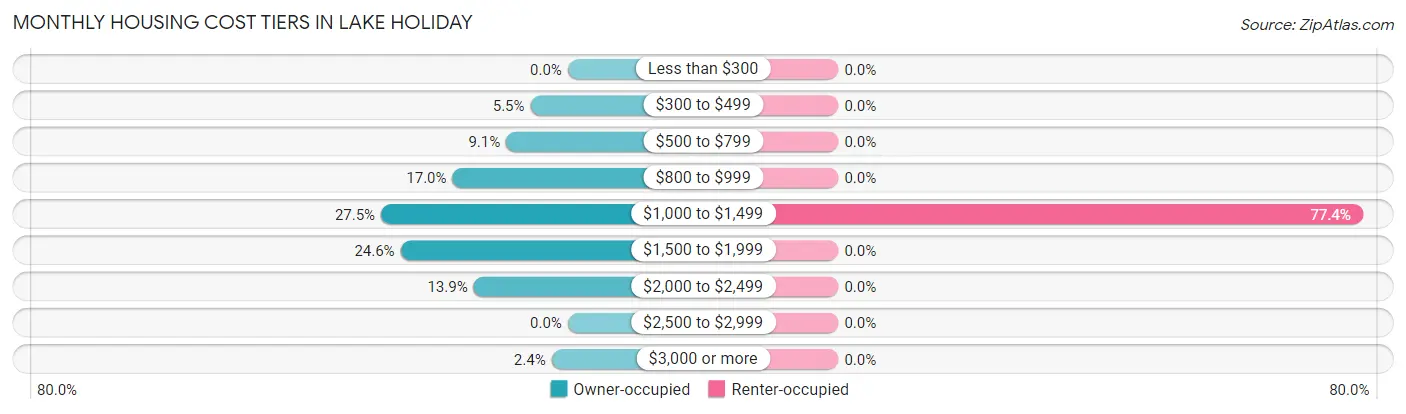
| Monthly Cost | Owner-occupied | Renter-occupied |
| Less than $300 | 0 (0.0%) | 0 (0.0%) |
| $300 to $499 | 23 (5.5%) | 0 (0.0%) |
| $500 to $799 | 38 (9.1%) | 0 (0.0%) |
| $800 to $999 | 71 (17.0%) | 0 (0.0%) |
| $1,000 to $1,499 | 115 (27.5%) | 41 (77.4%) |
| $1,500 to $1,999 | 103 (24.6%) | 0 (0.0%) |
| $2,000 to $2,499 | 58 (13.9%) | 0 (0.0%) |
| $2,500 to $2,999 | 0 (0.0%) | 0 (0.0%) |
| $3,000 or more | 10 (2.4%) | 0 (0.0%) |
| Total | 418 (100.0%) | 53 (100.0%) |
Physical Housing Characteristics in Lake Holiday
Housing Structures in Lake Holiday
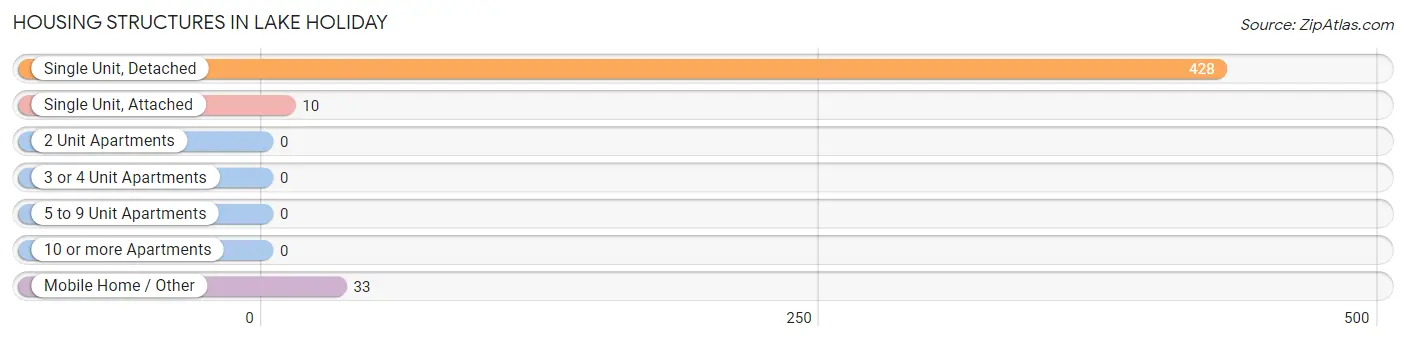
| Structure Type | # Housing Units | % Housing Units |
| Single Unit, Detached | 428 | 90.9% |
| Single Unit, Attached | 10 | 2.1% |
| 2 Unit Apartments | 0 | 0.0% |
| 3 or 4 Unit Apartments | 0 | 0.0% |
| 5 to 9 Unit Apartments | 0 | 0.0% |
| 10 or more Apartments | 0 | 0.0% |
| Mobile Home / Other | 33 | 7.0% |
| Total | 471 | 100.0% |
Housing Structures by Occupancy in Lake Holiday
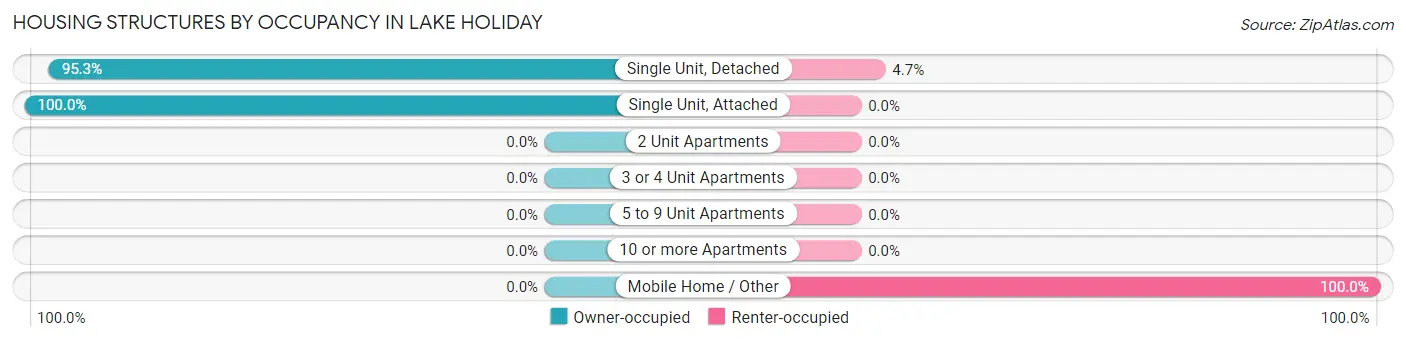
| Structure Type | Owner-occupied | Renter-occupied |
| Single Unit, Detached | 408 (95.3%) | 20 (4.7%) |
| Single Unit, Attached | 10 (100.0%) | 0 (0.0%) |
| 2 Unit Apartments | 0 (0.0%) | 0 (0.0%) |
| 3 or 4 Unit Apartments | 0 (0.0%) | 0 (0.0%) |
| 5 to 9 Unit Apartments | 0 (0.0%) | 0 (0.0%) |
| 10 or more Apartments | 0 (0.0%) | 0 (0.0%) |
| Mobile Home / Other | 0 (0.0%) | 33 (100.0%) |
| Total | 418 (88.7%) | 53 (11.3%) |
Housing Structures by Number of Rooms in Lake Holiday
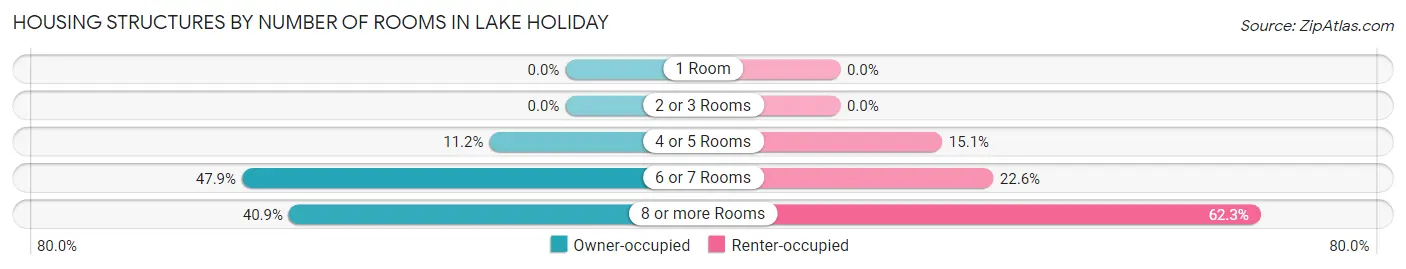
| Number of Rooms | Owner-occupied | Renter-occupied |
| 1 Room | 0 (0.0%) | 0 (0.0%) |
| 2 or 3 Rooms | 0 (0.0%) | 0 (0.0%) |
| 4 or 5 Rooms | 47 (11.2%) | 8 (15.1%) |
| 6 or 7 Rooms | 200 (47.8%) | 12 (22.6%) |
| 8 or more Rooms | 171 (40.9%) | 33 (62.3%) |
| Total | 418 (100.0%) | 53 (100.0%) |
Housing Structure by Heating Type in Lake Holiday
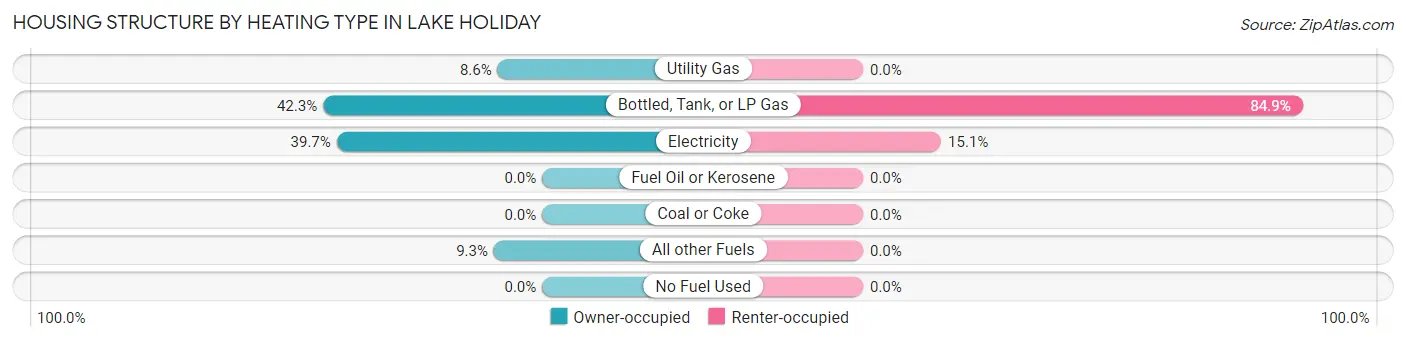
| Heating Type | Owner-occupied | Renter-occupied |
| Utility Gas | 36 (8.6%) | 0 (0.0%) |
| Bottled, Tank, or LP Gas | 177 (42.3%) | 45 (84.9%) |
| Electricity | 166 (39.7%) | 8 (15.1%) |
| Fuel Oil or Kerosene | 0 (0.0%) | 0 (0.0%) |
| Coal or Coke | 0 (0.0%) | 0 (0.0%) |
| All other Fuels | 39 (9.3%) | 0 (0.0%) |
| No Fuel Used | 0 (0.0%) | 0 (0.0%) |
| Total | 418 (100.0%) | 53 (100.0%) |
Household Vehicle Usage in Lake Holiday
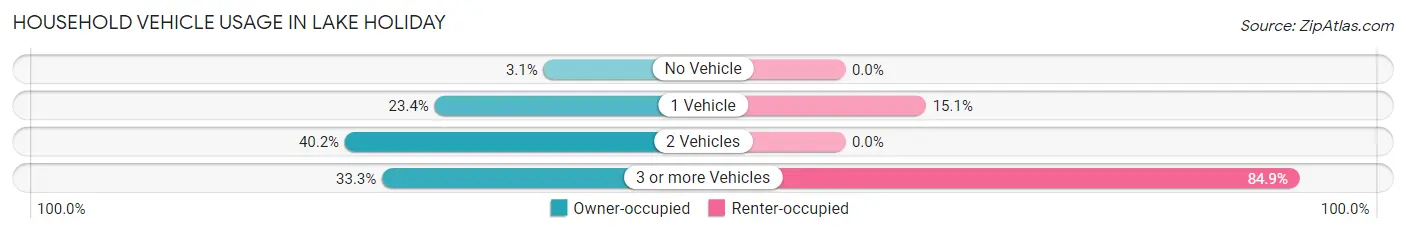
| Vehicles per Household | Owner-occupied | Renter-occupied |
| No Vehicle | 13 (3.1%) | 0 (0.0%) |
| 1 Vehicle | 98 (23.4%) | 8 (15.1%) |
| 2 Vehicles | 168 (40.2%) | 0 (0.0%) |
| 3 or more Vehicles | 139 (33.3%) | 45 (84.9%) |
| Total | 418 (100.0%) | 53 (100.0%) |
Real Estate & Mortgages in Lake Holiday
Real Estate and Mortgage Overview in Lake Holiday
| Characteristic | Without Mortgage | With Mortgage |
| Housing Units | 75 | 343 |
| Median Property Value | $234,700 | $239,400 |
| Median Household Income | $70,156 | $125 |
| Monthly Housing Costs | $545 | $10 |
| Real Estate Taxes | $2,106 | $0 |
Property Value by Mortgage Status in Lake Holiday

| Property Value | Without Mortgage | With Mortgage |
| Less than $50,000 | 0 (0.0%) | 0 (0.0%) |
| $50,000 to $99,999 | 0 (0.0%) | 10 (2.9%) |
| $100,000 to $299,999 | 75 (100.0%) | 233 (67.9%) |
| $300,000 to $499,999 | 0 (0.0%) | 82 (23.9%) |
| $500,000 to $749,999 | 0 (0.0%) | 18 (5.2%) |
| $750,000 to $999,999 | 0 (0.0%) | 0 (0.0%) |
| $1,000,000 or more | 0 (0.0%) | 0 (0.0%) |
| Total | 75 (100.0%) | 343 (100.0%) |
Household Income by Mortgage Status in Lake Holiday
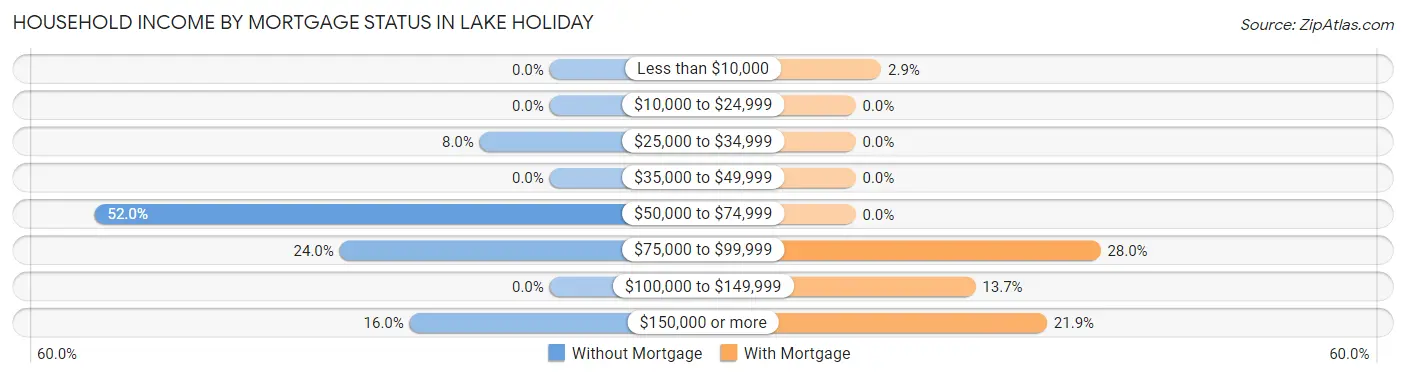
| Household Income | Without Mortgage | With Mortgage |
| Less than $10,000 | 0 (0.0%) | 10 (2.9%) |
| $10,000 to $24,999 | 0 (0.0%) | 0 (0.0%) |
| $25,000 to $34,999 | 6 (8.0%) | 0 (0.0%) |
| $35,000 to $49,999 | 0 (0.0%) | 0 (0.0%) |
| $50,000 to $74,999 | 39 (52.0%) | 0 (0.0%) |
| $75,000 to $99,999 | 18 (24.0%) | 96 (28.0%) |
| $100,000 to $149,999 | 0 (0.0%) | 47 (13.7%) |
| $150,000 or more | 12 (16.0%) | 75 (21.9%) |
| Total | 75 (100.0%) | 343 (100.0%) |
Property Value to Household Income Ratio in Lake Holiday
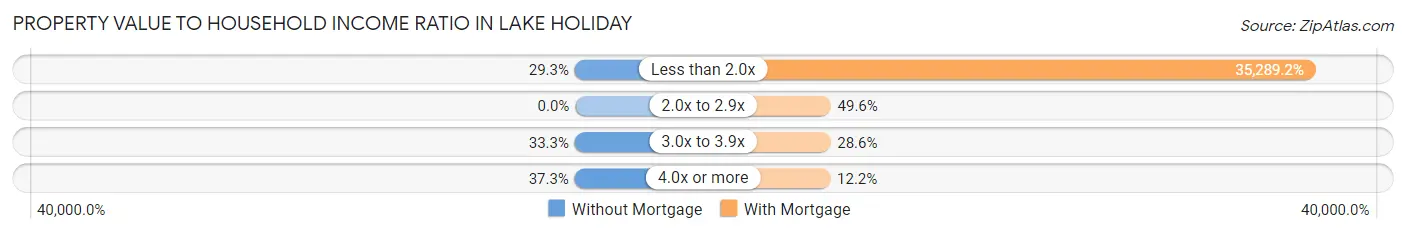
| Value-to-Income Ratio | Without Mortgage | With Mortgage |
| Less than 2.0x | 22 (29.3%) | 121,042 (35,289.2%) |
| 2.0x to 2.9x | 0 (0.0%) | 170 (49.6%) |
| 3.0x to 3.9x | 25 (33.3%) | 98 (28.6%) |
| 4.0x or more | 28 (37.3%) | 42 (12.2%) |
| Total | 75 (100.0%) | 343 (100.0%) |
Real Estate Taxes by Mortgage Status in Lake Holiday
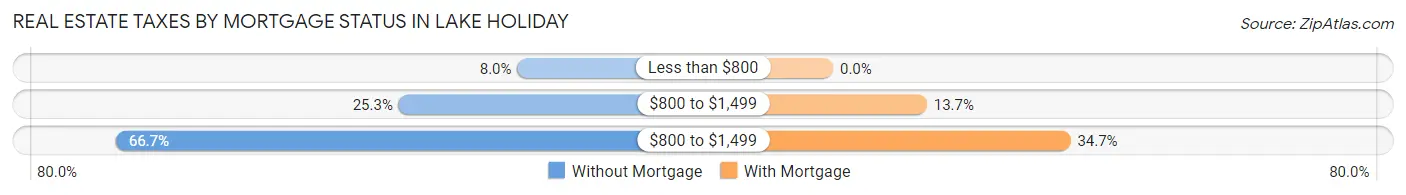
| Property Taxes | Without Mortgage | With Mortgage |
| Less than $800 | 6 (8.0%) | 0 (0.0%) |
| $800 to $1,499 | 19 (25.3%) | 47 (13.7%) |
| $800 to $1,499 | 50 (66.7%) | 119 (34.7%) |
| Total | 75 (100.0%) | 343 (100.0%) |
Health & Disability in Lake Holiday
Health Insurance Coverage by Age in Lake Holiday
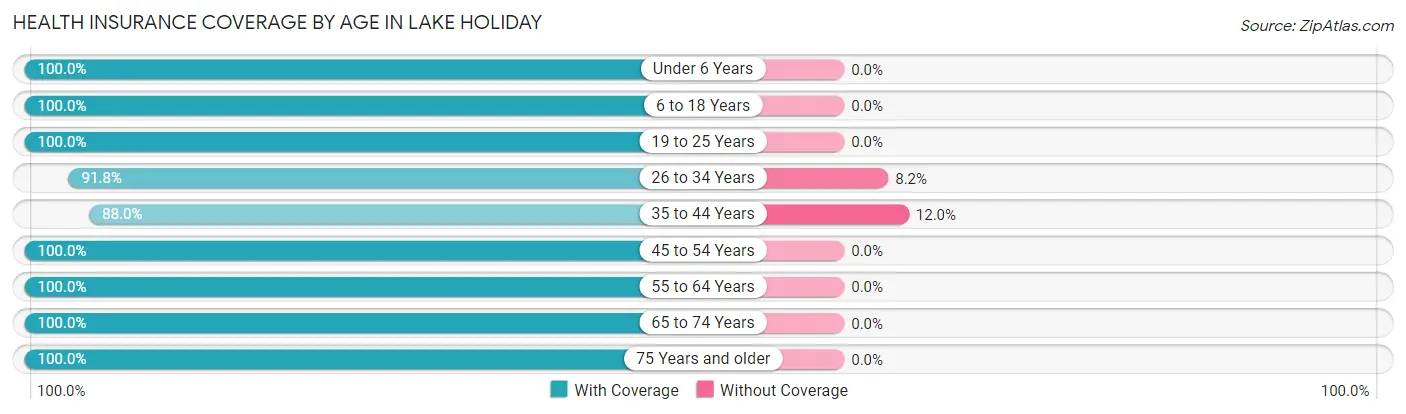
| Age Bracket | With Coverage | Without Coverage |
| Under 6 Years | 62 (100.0%) | 0 (0.0%) |
| 6 to 18 Years | 287 (100.0%) | 0 (0.0%) |
| 19 to 25 Years | 68 (100.0%) | 0 (0.0%) |
| 26 to 34 Years | 112 (91.8%) | 10 (8.2%) |
| 35 to 44 Years | 95 (88.0%) | 13 (12.0%) |
| 45 to 54 Years | 169 (100.0%) | 0 (0.0%) |
| 55 to 64 Years | 266 (100.0%) | 0 (0.0%) |
| 65 to 74 Years | 140 (100.0%) | 0 (0.0%) |
| 75 Years and older | 68 (100.0%) | 0 (0.0%) |
| Total | 1,267 (98.2%) | 23 (1.8%) |
Health Insurance Coverage by Citizenship Status in Lake Holiday
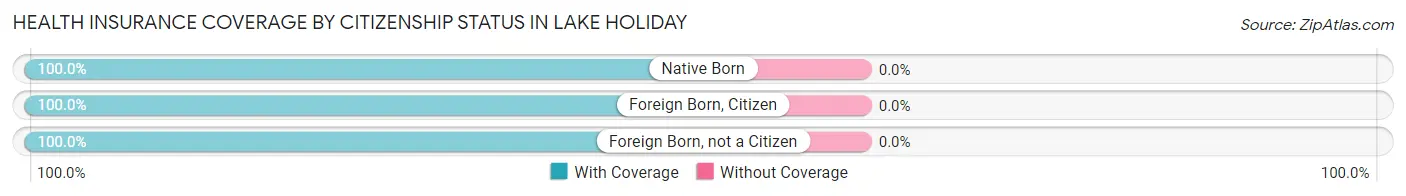
| Citizenship Status | With Coverage | Without Coverage |
| Native Born | 62 (100.0%) | 0 (0.0%) |
| Foreign Born, Citizen | 287 (100.0%) | 0 (0.0%) |
| Foreign Born, not a Citizen | 68 (100.0%) | 0 (0.0%) |
Health Insurance Coverage by Household Income in Lake Holiday
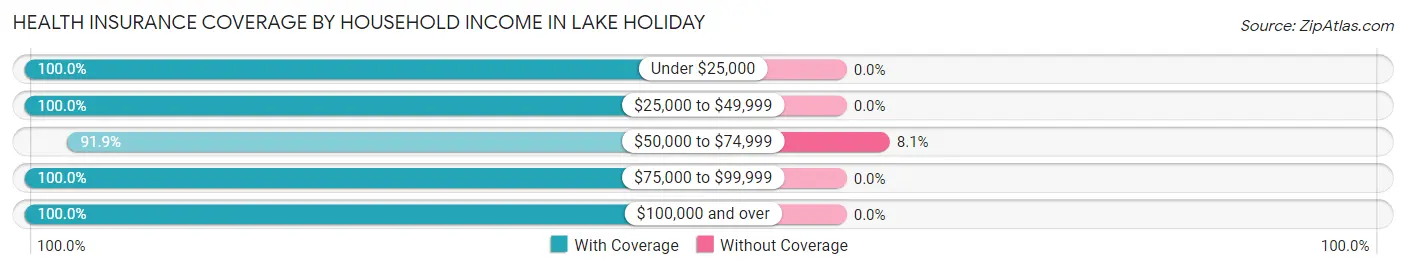
| Household Income | With Coverage | Without Coverage |
| Under $25,000 | 22 (100.0%) | 0 (0.0%) |
| $25,000 to $49,999 | 19 (100.0%) | 0 (0.0%) |
| $50,000 to $74,999 | 262 (91.9%) | 23 (8.1%) |
| $75,000 to $99,999 | 240 (100.0%) | 0 (0.0%) |
| $100,000 and over | 724 (100.0%) | 0 (0.0%) |
Public vs Private Health Insurance Coverage by Age in Lake Holiday
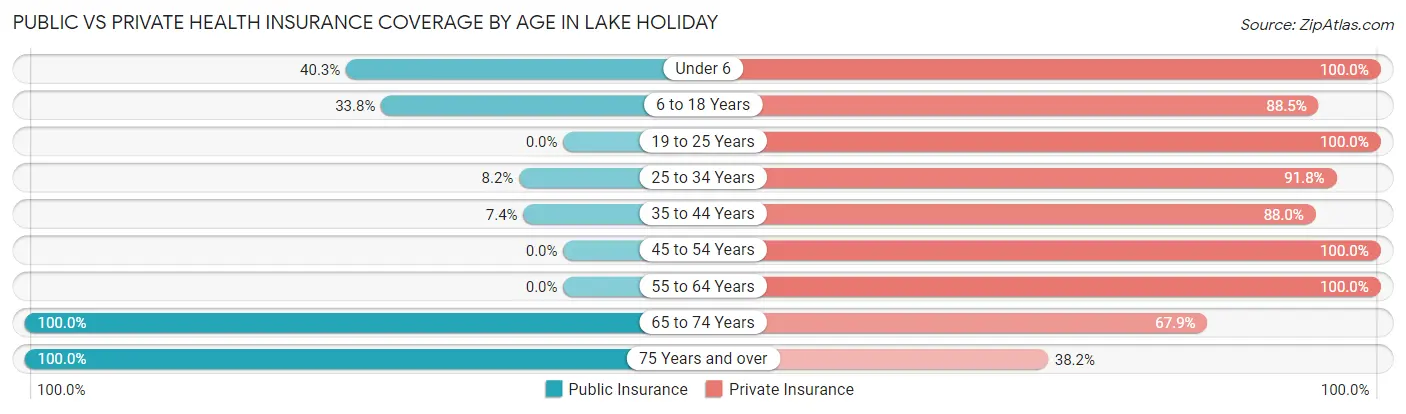
| Age Bracket | Public Insurance | Private Insurance |
| Under 6 | 25 (40.3%) | 62 (100.0%) |
| 6 to 18 Years | 97 (33.8%) | 254 (88.5%) |
| 19 to 25 Years | 0 (0.0%) | 68 (100.0%) |
| 25 to 34 Years | 10 (8.2%) | 112 (91.8%) |
| 35 to 44 Years | 8 (7.4%) | 95 (88.0%) |
| 45 to 54 Years | 0 (0.0%) | 169 (100.0%) |
| 55 to 64 Years | 0 (0.0%) | 266 (100.0%) |
| 65 to 74 Years | 140 (100.0%) | 95 (67.9%) |
| 75 Years and over | 68 (100.0%) | 26 (38.2%) |
| Total | 348 (27.0%) | 1,147 (88.9%) |
Disability Status by Sex by Age in Lake Holiday
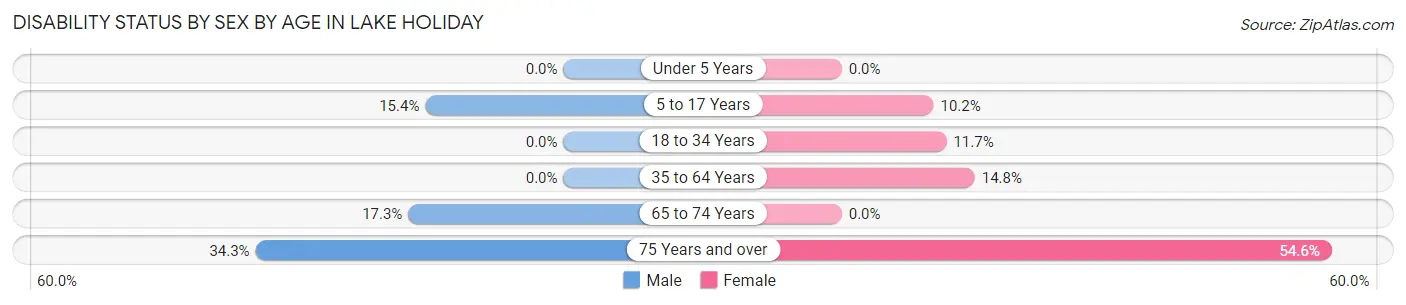
| Age Bracket | Male | Female |
| Under 5 Years | 0 (0.0%) | 0 (0.0%) |
| 5 to 17 Years | 22 (15.4%) | 14 (10.2%) |
| 18 to 34 Years | 0 (0.0%) | 19 (11.7%) |
| 35 to 64 Years | 0 (0.0%) | 40 (14.8%) |
| 65 to 74 Years | 14 (17.3%) | 0 (0.0%) |
| 75 Years and over | 12 (34.3%) | 18 (54.5%) |
Disability Class by Sex by Age in Lake Holiday
Disability Class: Hearing Difficulty
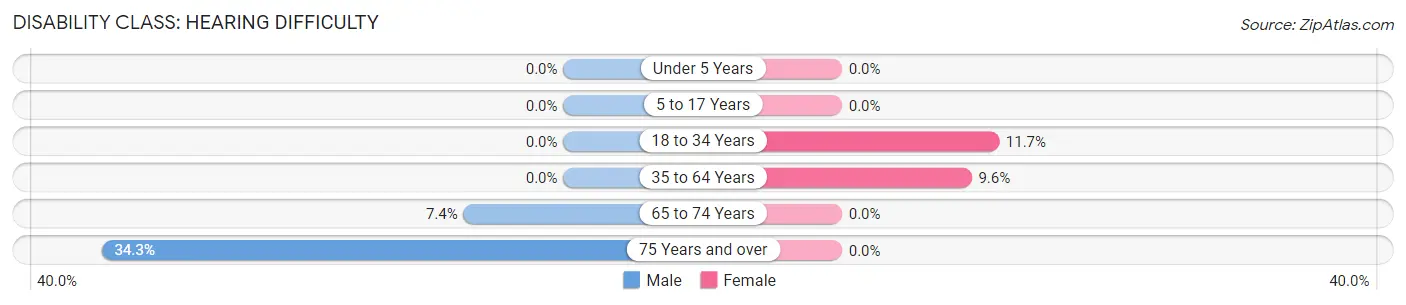
| Age Bracket | Male | Female |
| Under 5 Years | 0 (0.0%) | 0 (0.0%) |
| 5 to 17 Years | 0 (0.0%) | 0 (0.0%) |
| 18 to 34 Years | 0 (0.0%) | 19 (11.7%) |
| 35 to 64 Years | 0 (0.0%) | 26 (9.6%) |
| 65 to 74 Years | 6 (7.4%) | 0 (0.0%) |
| 75 Years and over | 12 (34.3%) | 0 (0.0%) |
Disability Class: Vision Difficulty
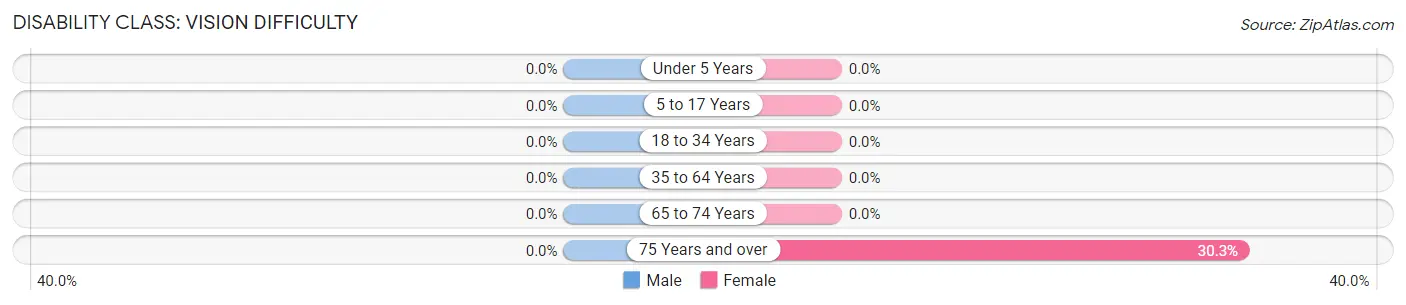
| Age Bracket | Male | Female |
| Under 5 Years | 0 (0.0%) | 0 (0.0%) |
| 5 to 17 Years | 0 (0.0%) | 0 (0.0%) |
| 18 to 34 Years | 0 (0.0%) | 0 (0.0%) |
| 35 to 64 Years | 0 (0.0%) | 0 (0.0%) |
| 65 to 74 Years | 0 (0.0%) | 0 (0.0%) |
| 75 Years and over | 0 (0.0%) | 10 (30.3%) |
Disability Class: Cognitive Difficulty
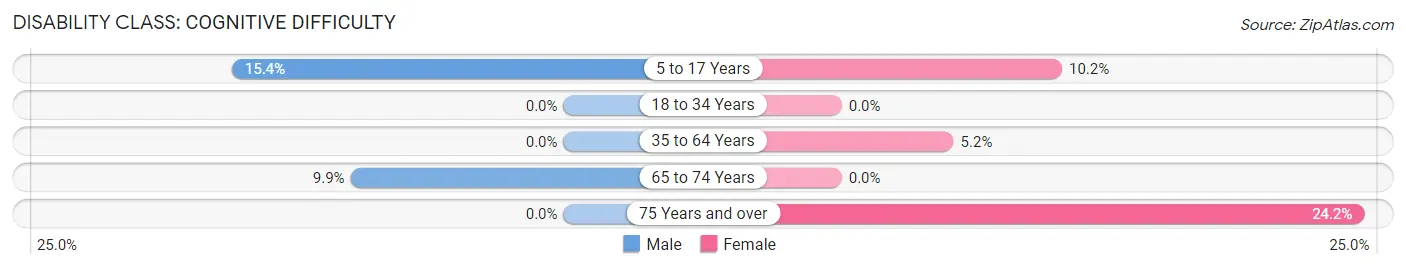
| Age Bracket | Male | Female |
| 5 to 17 Years | 22 (15.4%) | 14 (10.2%) |
| 18 to 34 Years | 0 (0.0%) | 0 (0.0%) |
| 35 to 64 Years | 0 (0.0%) | 14 (5.2%) |
| 65 to 74 Years | 8 (9.9%) | 0 (0.0%) |
| 75 Years and over | 0 (0.0%) | 8 (24.2%) |
Disability Class: Ambulatory Difficulty
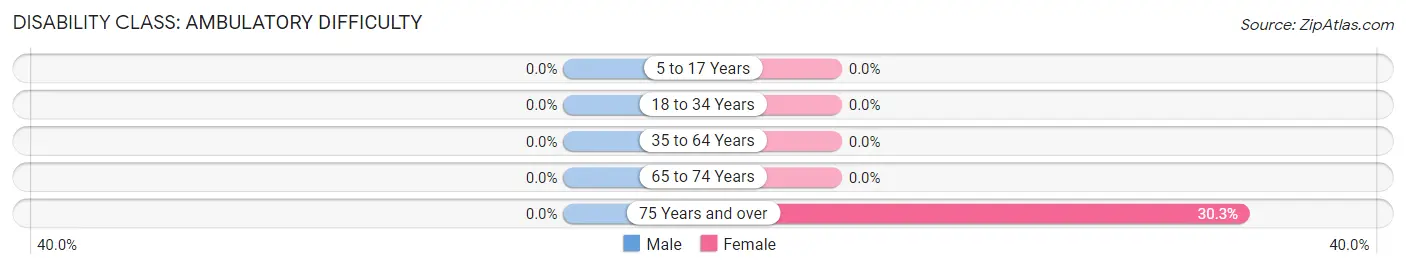
| Age Bracket | Male | Female |
| 5 to 17 Years | 0 (0.0%) | 0 (0.0%) |
| 18 to 34 Years | 0 (0.0%) | 0 (0.0%) |
| 35 to 64 Years | 0 (0.0%) | 0 (0.0%) |
| 65 to 74 Years | 0 (0.0%) | 0 (0.0%) |
| 75 Years and over | 0 (0.0%) | 10 (30.3%) |
Disability Class: Self-Care Difficulty
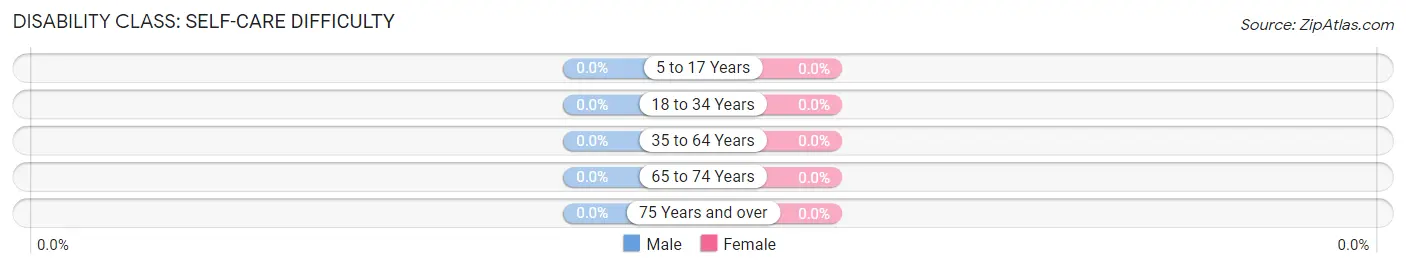
| Age Bracket | Male | Female |
| 5 to 17 Years | 0 (0.0%) | 0 (0.0%) |
| 18 to 34 Years | 0 (0.0%) | 0 (0.0%) |
| 35 to 64 Years | 0 (0.0%) | 0 (0.0%) |
| 65 to 74 Years | 0 (0.0%) | 0 (0.0%) |
| 75 Years and over | 0 (0.0%) | 0 (0.0%) |
Technology Access in Lake Holiday
Computing Device Access in Lake Holiday
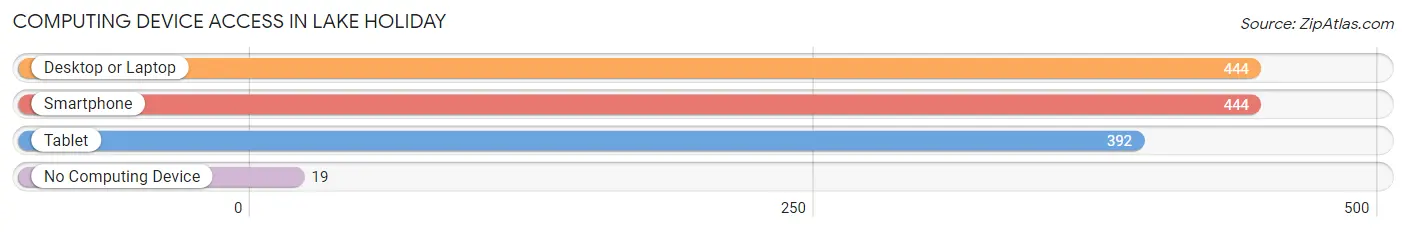
| Device Type | # Households | % Households |
| Desktop or Laptop | 444 | 94.3% |
| Smartphone | 444 | 94.3% |
| Tablet | 392 | 83.2% |
| No Computing Device | 19 | 4.0% |
| Total | 471 | 100.0% |
Internet Access in Lake Holiday
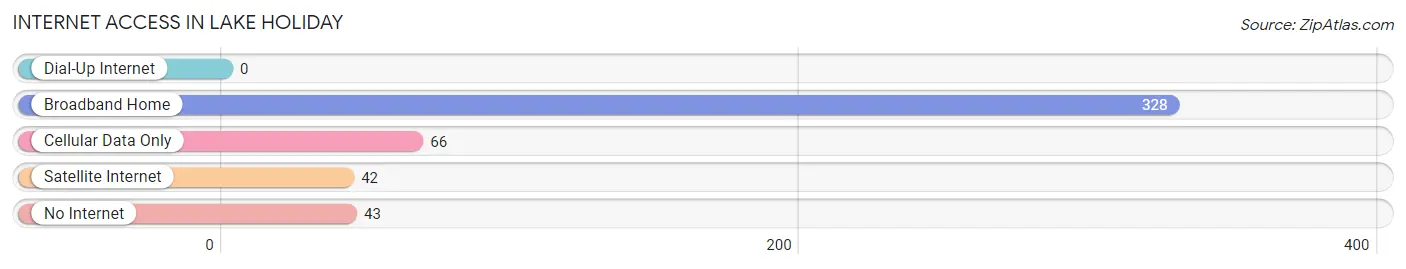
| Internet Type | # Households | % Households |
| Dial-Up Internet | 0 | 0.0% |
| Broadband Home | 328 | 69.6% |
| Cellular Data Only | 66 | 14.0% |
| Satellite Internet | 42 | 8.9% |
| No Internet | 43 | 9.1% |
| Total | 471 | 100.0% |
Lake Holiday Summary
Holiday Lake is a small unincorporated community located in the state of Indiana, United States. It is situated in the southwestern part of the state, in the county of Porter. The community is located on the shores of Lake Holiday, a man-made lake created in the 1950s. The lake is a popular destination for fishing, boating, and other recreational activities.
History
The area around Lake Holiday was first settled in the early 1800s by settlers from the eastern United States. The first settlers were mostly farmers, who cleared the land and built small farms. The area was sparsely populated until the 1950s, when the lake was created. The lake was created by the U.S. Army Corps of Engineers as part of a flood control project. The lake was named after the nearby Holiday family, who had been living in the area since the early 1800s.
The creation of the lake brought an influx of people to the area, and the community of Lake Holiday was established. The community was incorporated in 1959, and the first mayor was elected in 1960. The town quickly grew, and by the 1970s it had become a popular destination for vacationers and retirees.
Geography
Lake Holiday is located in the southwestern part of Indiana, in the county of Porter. The community is situated on the shores of Lake Holiday, a man-made lake created in the 1950s. The lake is approximately 1,000 acres in size and is a popular destination for fishing, boating, and other recreational activities. The lake is surrounded by wooded hills and is a popular spot for camping and hiking.
The community of Lake Holiday is located approximately 25 miles from the city of Valparaiso, the county seat of Porter County. The nearest major city is Chicago, which is located approximately 90 miles to the northeast.
Economy
The economy of Lake Holiday is largely based on tourism and recreation. The lake is a popular destination for fishing, boating, and other recreational activities. There are several marinas and boat rental businesses located on the lake, as well as several restaurants and lodging establishments. The area is also home to several small businesses, including a grocery store, a hardware store, and a gas station.
Demographics
As of the 2010 census, the population of Lake Holiday was 1,845. The population is predominantly white (94.3%), with small percentages of African American (2.2%), Hispanic (1.7%), and Asian (1.1%) residents. The median household income is $50,000, and the median home value is $150,000. The unemployment rate is 4.2%.
Conclusion
Lake Holiday is a small unincorporated community located in the southwestern part of Indiana. The community is situated on the shores of Lake Holiday, a man-made lake created in the 1950s. The economy of the community is largely based on tourism and recreation, and the population is predominantly white. The area is a popular destination for fishing, boating, and other recreational activities, and is home to several small businesses.
Common Questions
What is the Total Population of Lake Holiday?
Total Population of Lake Holiday is 1,290.
What is the Total Male Population of Lake Holiday?
Total Male Population of Lake Holiday is 616.
What is the Total Female Population of Lake Holiday?
Total Female Population of Lake Holiday is 674.
What is the Ratio of Males per 100 Females in Lake Holiday?
There are 91.39 Males per 100 Females in Lake Holiday.
What is the Ratio of Females per 100 Males in Lake Holiday?
There are 109.42 Females per 100 Males in Lake Holiday.
What is the Median Population Age in Lake Holiday?
Median Population Age in Lake Holiday is 44.9 Years.
What is the Average Family Size in Lake Holiday
Average Family Size in Lake Holiday is 3.0 People.
What is the Average Household Size in Lake Holiday
Average Household Size in Lake Holiday is 2.7 People.
What is Per Capita Income in Lake Holiday?
Per Capita income in Lake Holiday is $47,514.
What is the Median Family Income in Lake Holiday?
Median Family Income in Lake Holiday is $120,903.
What is the Median Household income in Lake Holiday?
Median Household Income in Lake Holiday is $106,131.
What is Income or Wage Gap in Lake Holiday?
Income or Wage Gap in Lake Holiday is 43.4%.
Women in Lake Holiday earn 56.6 cents for every dollar earned by a man.
What is Inequality or Gini Index in Lake Holiday?
Inequality or Gini Index in Lake Holiday is 0.33.
How Large is the Labor Force in Lake Holiday?
There are 798 People in the Labor Forcein in Lake Holiday.
What is the Percentage of People in the Labor Force in Lake Holiday?
77.1% of People are in the Labor Force in Lake Holiday.
What is the Unemployment Rate in Lake Holiday?
Unemployment Rate in Lake Holiday is 4.8%.